Attached files
| file | filename |
|---|---|
| EX-10.1 - EX-10.1 - PDC ENERGY, INC. | a16-17360_1ex10d1.htm |
| EX-2.2 - EX-2.2 - PDC ENERGY, INC. | a16-17360_1ex2d2.htm |
| EX-2.1 - EX-2.1 - PDC ENERGY, INC. | a16-17360_1ex2d1.htm |
| 8-K - 8-K - PDC ENERGY, INC. | a16-17360_18k.htm |
Exhibit 99.1
Transformative Core Delaware basin acquisition 8/24/2016
Forward Looking Statements This presentation contains forward-looking statements within the meaning of Section 27A of the Securities Act of 1933 ("Securities Act") and Section 21E of the Securities Exchange Act of 1934 ("Exchange Act") regarding our business, financial condition, results of operations and prospects. All statements other than statements of historical facts included in and incorporated by reference into this report are "forward-looking statements" within the meaning of the safe harbor provisions of the United States ("U.S.") Private Securities Litigation Reform Act of 1995. Words such as expects, anticipates, intends, plans, believes, seeks, estimates and similar expressions or variations of such words are intended to identify forward-looking statements herein. These statements relate to, among other things: the closing of the transaction described herein, the anticipated benefits to us of the acquisition, including in terms of drilling location, rates of return, production and reserves, estimated future production (including the components of such production), sales, expenses, cash flows, liquidity and balance sheet attributes; estimated crude oil, natural gas and natural gas liquids (“NGLs”) reserves; anticipated capital projects, expenditures and opportunities; expected capital budget allocations; acreage or percentage of acreage that is held by production (“HBP”); future exploration, drilling and development activities, the number of drilling rigs we expect to run, number of locations and lateral lengths; and our future strategies, plans and objectives. The above statements are not the exclusive means of identifying forward-looking statements herein. Although forward-looking statements made in this presentation reflect PDC’s good faith judgment, such statements can only be based on facts and factors currently known to PDC. The acquisition may not close in the timeframe we expect or at all and, if completed, may not have the benefits to us that we currently expect. The Company uses the term “outlook”, “pro forma” or similar terms or expressions, to indicate its current thoughts on possible outcomes relating to its business or the industry in periods beyond the current fiscal year. Forward-looking statements, including those regarding the company’s outlook for future years, are subject to greater levels of risk and uncertainty as they address matters further into the future. PDC urges you to carefully review and consider the cautionary statements and disclosures, specifically those under Item 1A, Risk Factors, made in the Company’s Annual Report on Form 10-K for the year ended December 31, 2015 and PDC’s other filings with the U.S. Securities and Exchange Commission (”SEC”), which are incorporated by this reference as though fully set forth herein, for further information on risks and uncertainties that could affect the Company's business, financial condition, results of operations and cash flows. The Company cautions you not to place undue reliance on forward-looking statements, which speak only as of the date hereof. PDC undertakes no obligation to update any forward-looking statements in order to reflect any event or circumstance occurring after the date of this presentation or currently unknown facts or conditions or the occurrence of unanticipated events. All forward looking statements are qualified in their entirety by this cautionary statement. Rate of return estimates do not reflect lease acquisition costs or corporate general and administrative expenses. 2P and other non-proved estimates of potentially recoverable hydrocarbons and EURs may not correspond to estimates of reserves as defined under SEC rules. Resource estimates and estimates of non-proved reserves include potentially recoverable quantities that are subject to substantially greater risk than proved reserves. 2 8/24/2016 © 2016 PDC Energy, Inc. All Rights Reserved.
3 Acquisition overview
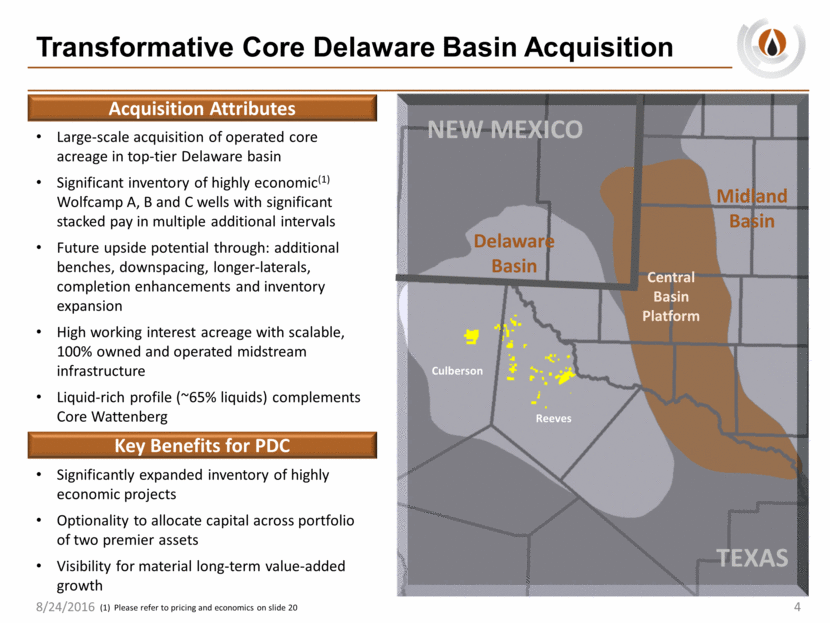
Transformative Core Delaware Basin Acquisition Large-scale acquisition of operated core acreage in top-tier Delaware basin Significant inventory of highly economic(1) Wolfcamp A, B and C wells with significant stacked pay in multiple additional intervals Future upside potential through: additional benches, downspacing, longer-laterals, completion enhancements and inventory expansion High working interest acreage with scalable, 100% owned and operated midstream infrastructure Liquid-rich profile (~65% liquids) complements Core Wattenberg Significantly expanded inventory of highly economic projects Optionality to allocate capital across portfolio of two premier assets Visibility for material long-term value-added growth 4 8/24/2016 Acquisition Attributes Key Benefits for PDC Delaware Basin Central Basin Platform Midland Basin NEW MEXICO TEXAS Reeves Culberson (1) Please refer to pricing and economics on slide 20
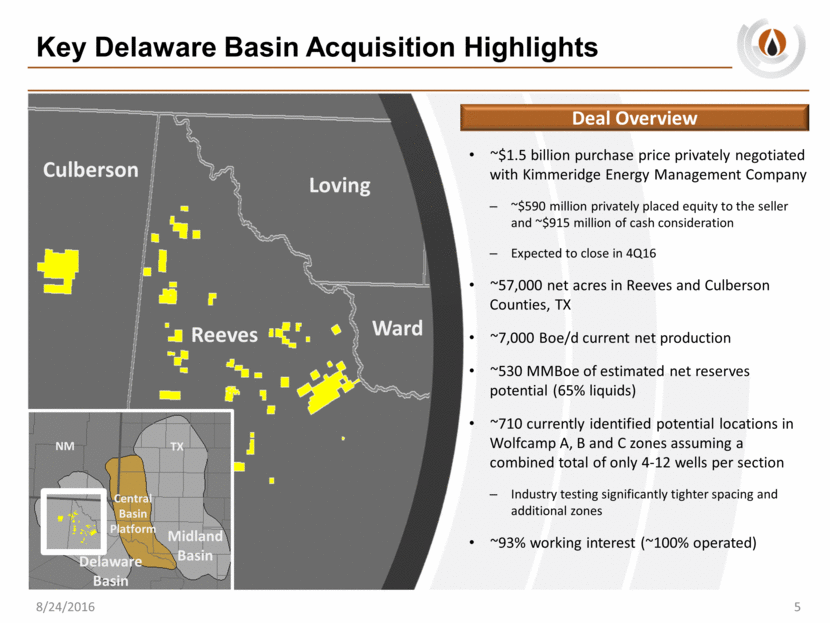
Key Delaware Basin Acquisition Highlights ~$1.5 billion purchase price privately negotiated with Kimmeridge Energy Management Company ~$590 million privately placed equity to the seller and ~$915 million of cash consideration Expected to close in 4Q16 ~57,000 net acres in Reeves and Culberson Counties, TX ~7,000 Boe/d current net production ~530 MMBoe of estimated net reserves potential (65% liquids) ~710 currently identified potential locations in Wolfcamp A, B and C zones assuming a combined total of only 4-12 wells per section Industry testing significantly tighter spacing and additional zones ~93% working interest (~100% operated) 5 8/24/2016 Reeves Culberson Loving Ward Midland Basin Delaware Basin Central Basin Platform NM TX Deal Overview
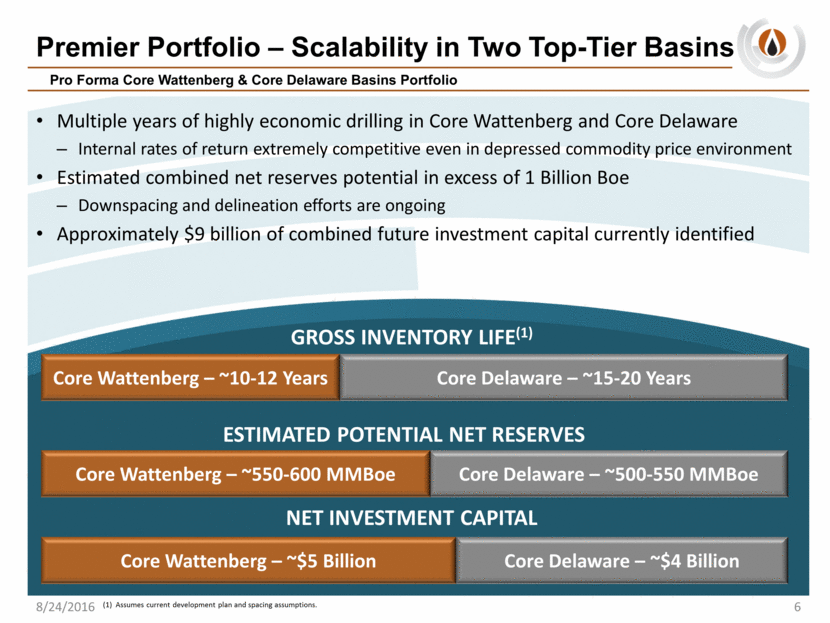
Premier Portfolio – Scalability in Two Top-Tier Basins Multiple years of highly economic drilling in Core Wattenberg and Core Delaware Internal rates of return extremely competitive even in depressed commodity price environment Estimated combined net reserves potential in excess of 1 Billion Boe Downspacing and delineation efforts are ongoing Approximately $9 billion of combined future investment capital currently identified 6 Pro Forma Core Wattenberg & Core Delaware Basins Portfolio 8/24/2016 GROSS INVENTORY LIFE(1) ESTIMATED POTENTIAL NET RESERVES NET INVESTMENT CAPITAL Core Wattenberg – ~10-12 Years Core Delaware – ~500-550 MMBoe Core Wattenberg – ~550-600 MMBoe Core Wattenberg – ~$5 Billion Core Delaware – ~$4 Billion Core Delaware – ~15-20 Years (1) Assumes current development plan and spacing assumptions.
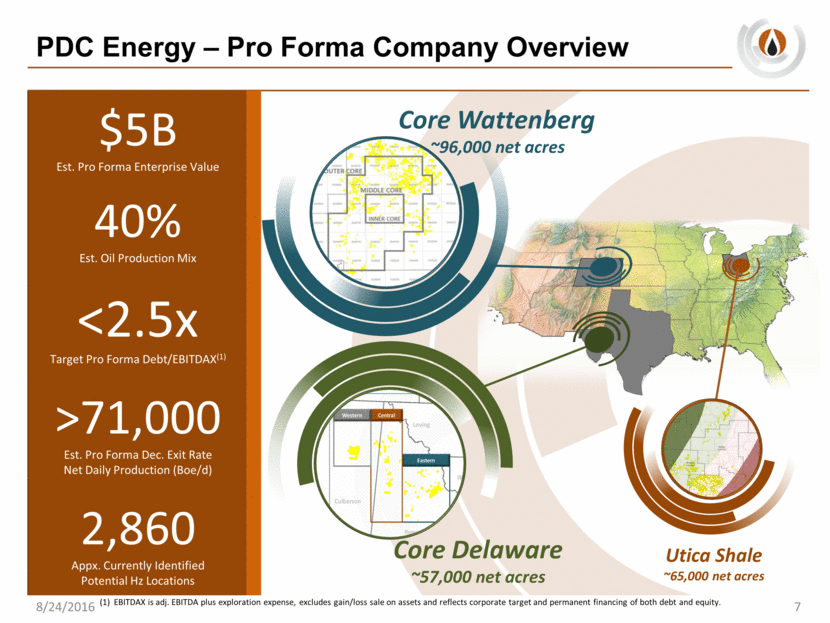
PDC Energy – Pro Forma Company Overview 8/24/2016 7 $5B Est. Pro Forma Enterprise Value 40% Est. Oil Production Mix <2.5x Target Pro Forma Debt/EBITDAX(1) >71,000 Est. Pro Forma Dec. Exit Rate Net Daily Production (Boe/d) 2,860 Appx. Currently Identified Potential Hz Locations Core Wattenberg ~96,000 net acres Utica Shale ~65,000 net acres Core Delaware ~57,000 net acres (1) EBITDAX is adj. EBITDA plus exploration expense, excludes gain/loss sale on assets and reflects corporate target and permanent financing of both debt and equity.
8 Acquisition details

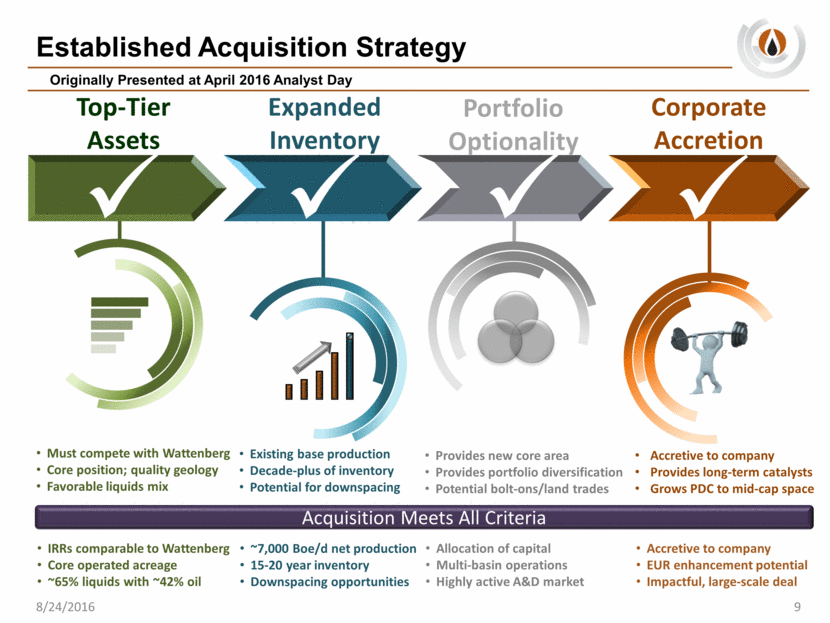
IRRs comparable to Wattenberg Core operated acreage ~65% liquids with ~42% oil Accretive to company Provides long-term catalysts Grows PDC to mid-cap space Existing base production Decade-plus of inventory Potential for downspacing Established Acquisition Strategy Originally Presented at April 2016 Analyst Day Must compete with Wattenberg Core position; quality geology Favorable liquids mix Top-Tier Assets Expanded Inventory Portfolio Optionality Corporate Accretion 8/24/2016 9 Provides new core area Provides portfolio diversification Potential bolt-ons/land trades ~7,000 Boe/d net production 15-20 year inventory Downspacing opportunities Allocation of capital Multi-basin operations Highly active A&D market Accretive to company EUR enhancement potential Impactful, large-scale deal Acquisition Meets All Criteria
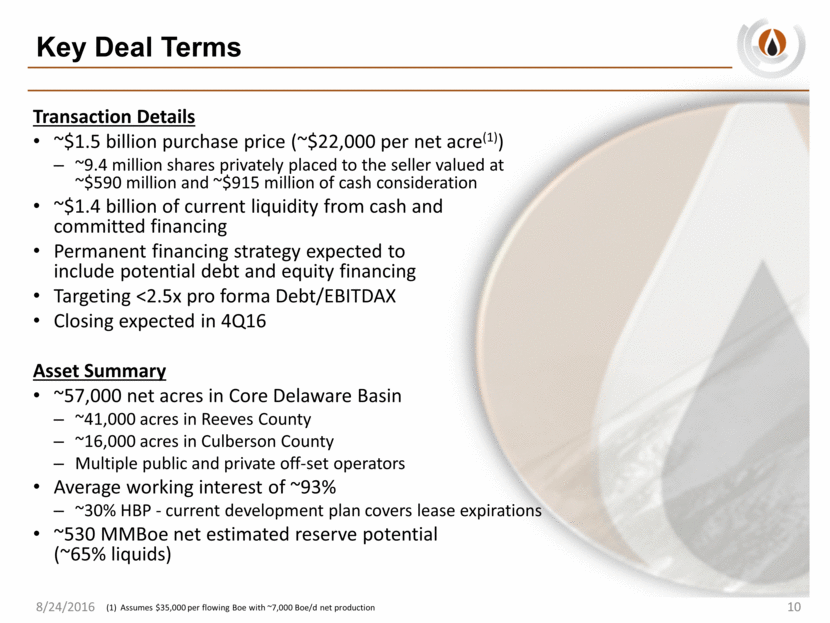
Key Deal Terms Transaction Details ~$1.5 billion purchase price (~$22,000 per net acre(1)) ~9.4 million shares privately placed to the seller valued at ~$590 million and ~$915 million of cash consideration ~$1.4 billion of current liquidity from cash and committed financing Permanent financing strategy expected to include potential debt and equity financing Targeting <2.5x pro forma Debt/EBITDAX Closing expected in 4Q16 Asset Summary ~57,000 net acres in Core Delaware Basin ~41,000 acres in Reeves County ~16,000 acres in Culberson County Multiple public and private off-set operators Average working interest of ~93% ~30% HBP - current development plan covers lease expirations ~530 MMBoe net estimated reserve potential (~65% liquids) 10 8/24/2016 (1) Assumes $35,000 per flowing Boe with ~7,000 Boe/d net production
Core Delaware Basin Acreage Overview 8/24/2016 11 93% Average WI 100% Approximate Operated Position 710 Currently Identified Locations (Based on only 4-12 total wells per section targeting Wolfcamp A/B/C) 15-20 Years of Drilling Inventory 1,000+ Average MBoe EURs/Well Loving Culberson Reeves Ward Loving PDC Acreage Off-set operator positions estimated Eastern Central Western Midland Basin Delaware Basin Central Basin Platform NM TX FEET 0 36,769 PETRA 8/15/2016 11:18:30 AM

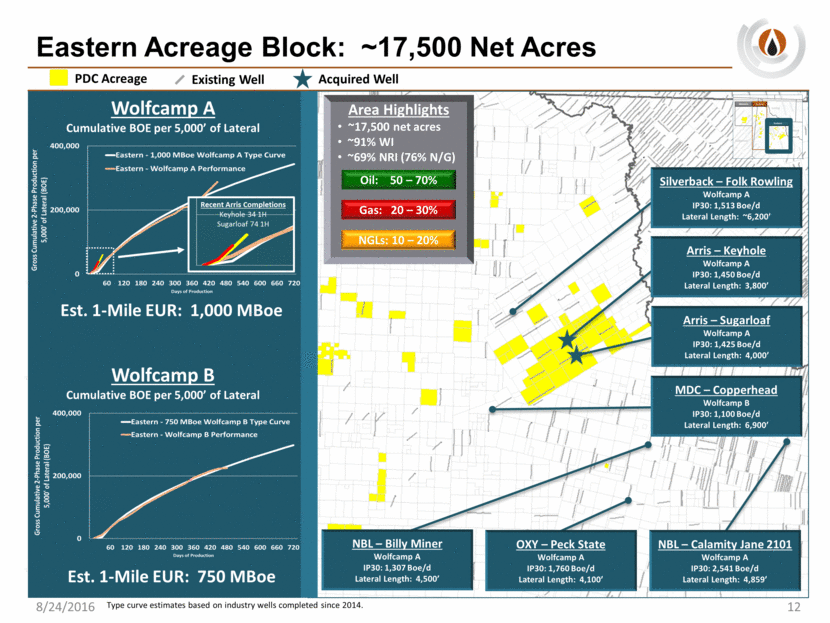
Eastern Acreage Block: ~17,500 Net Acres 8/24/2016 12 NBL – Calamity Jane 2101 Wolfcamp A IP30: 2,541 Boe/d Lateral Length: 4,859’ Wolfcamp A Cumulative BOE per 5,000’ of Lateral Wolfcamp B Cumulative BOE per 5,000’ of Lateral Est. 1-Mile EUR: 1,000 MBoe Est. 1-Mile EUR: 750 MBoe NBL – Billy Miner Wolfcamp A IP30: 1,307 Boe/d Lateral Length: 4,500’ OXY – Peck State Wolfcamp A IP30: 1,760 Boe/d Lateral Length: 4,100’ Area Highlights ~17,500 net acres ~91% WI ~69% NRI (76% N/G) Oil: 50 – 70% Gas: 20 – 30% NGLs: 10 – 20% PDC Acreage Existing Well Arris – Keyhole Wolfcamp A IP30: 1,450 Boe/d Lateral Length: 3,800’ Silverback – Folk Rowling Wolfcamp A IP30: 1,513 Boe/d Lateral Length: ~6,200’ MDC – Copperhead Wolfcamp B IP30: 1,100 Boe/d Lateral Length: 6,900’ Arris – Sugarloaf Wolfcamp A IP30: 1,425 Boe/d Lateral Length: 4,000’ Type curve estimates based on industry wells completed since 2014. Acquired Well Recent Arris Completions Keyhole 34 1H Sugarloaf 74 1H
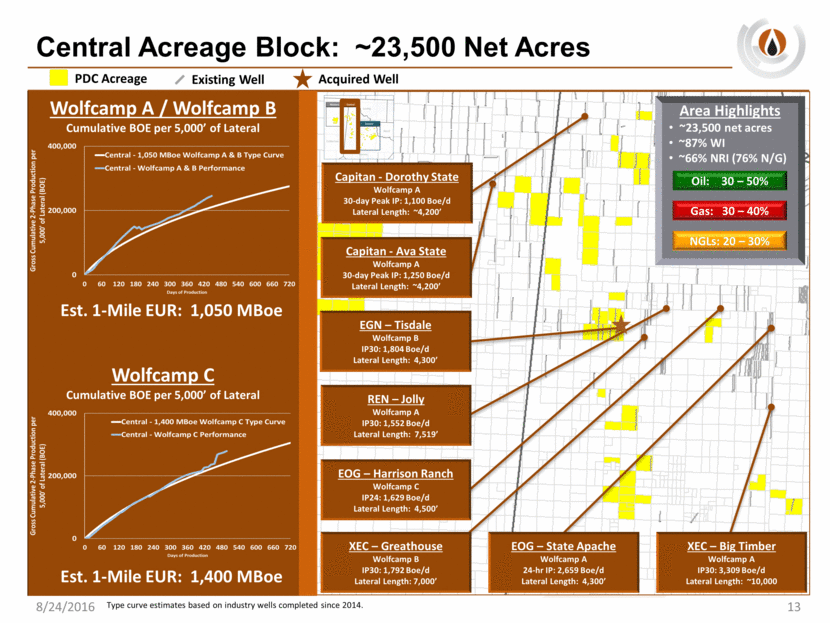
Central Acreage Block: ~23,500 Net Acres 8/24/2016 13 EGN – Tisdale Wolfcamp B IP30: 1,804 Boe/d Lateral Length: 4,300’ EOG – Harrison Ranch Wolfcamp C IP24: 1,629 Boe/d Lateral Length: 4,500’ XEC – Greathouse Wolfcamp B IP30: 1,792 Boe/d Lateral Length: 7,000’ EOG – State Apache Wolfcamp A 24-hr IP: 2,659 Boe/d Lateral Length: 4,300’ Capitan - Ava State Wolfcamp A 30-day Peak IP: 1,250 Boe/d Lateral Length: ~4,200’ Capitan - Dorothy State Wolfcamp A 30-day Peak IP: 1,100 Boe/d Lateral Length: ~4,200’ REN – Jolly Wolfcamp A IP30: 1,552 Boe/d Lateral Length: 7,519’ Area Highlights ~23,500 net acres ~87% WI ~66% NRI (76% N/G) Oil: 30 – 50% Gas: 30 – 40% NGLs: 20 – 30% PDC Acreage Existing Well Wolfcamp A / Wolfcamp B Cumulative BOE per 5,000’ of Lateral Wolfcamp C Cumulative BOE per 5,000’ of Lateral Est. 1-Mile EUR: 1,050 MBoe Est. 1-Mile EUR: 1,400 MBoe XEC – Big Timber Wolfcamp A IP30: 3,309 Boe/d Lateral Length: ~10,000 Type curve estimates based on industry wells completed since 2014. Acquired Well
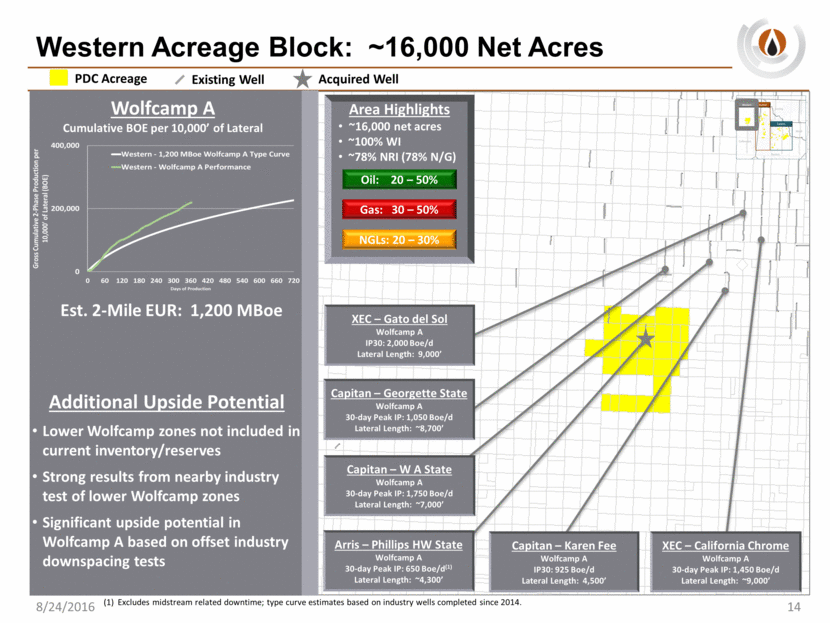
Western Acreage Block: ~16,000 Net Acres 8/24/2016 14 Capitan – Karen Fee Wolfcamp A IP30: 925 Boe/d Lateral Length: 4,500’ XEC – Gato del Sol Wolfcamp A IP30: 2,000 Boe/d Lateral Length: 9,000’ Capitan – Georgette State Wolfcamp A 30-day Peak IP: 1,050 Boe/d Lateral Length: ~8,700’ XEC – California Chrome Wolfcamp A 30-day Peak IP: 1,450 Boe/d Lateral Length: ~9,000’ Capitan – W A State Wolfcamp A 30-day Peak IP: 1,750 Boe/d Lateral Length: ~7,000’ Arris – Phillips HW State Wolfcamp A 30-day Peak IP: 650 Boe/d(1) Lateral Length: ~4,300’ Area Highlights ~16,000 net acres ~100% WI ~78% NRI (78% N/G) Oil: 20 – 50% Gas: 30 – 50% NGLs: 20 – 30% PDC Acreage Existing Well (1) Excludes midstream related downtime; type curve estimates based on industry wells completed since 2014. Wolfcamp A Cumulative BOE per 10,000’ of Lateral Est. 2-Mile EUR: 1,200 MBoe Additional Upside Potential Lower Wolfcamp zones not included in current inventory/reserves Strong results from nearby industry test of lower Wolfcamp zones Significant upside potential in Wolfcamp A based on offset industry downspacing tests Acquired Well
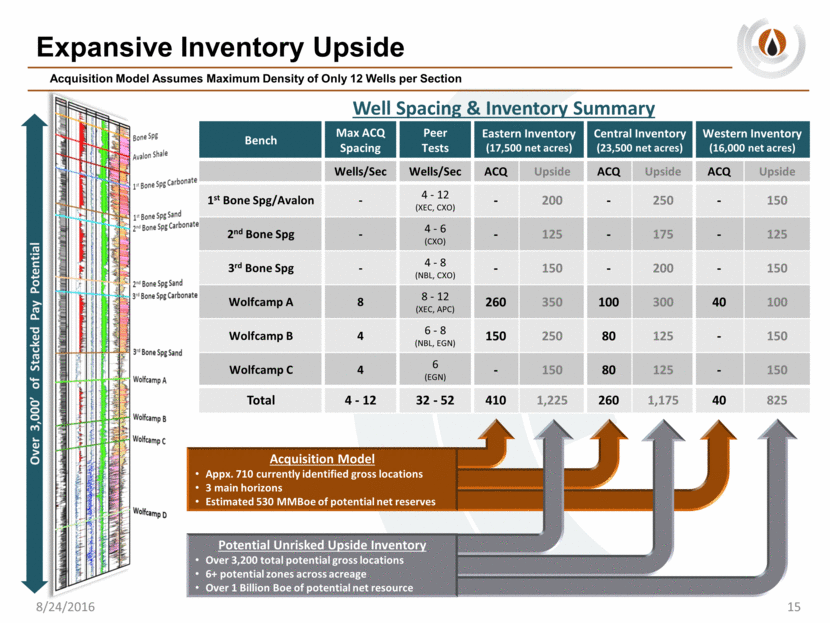
Expansive Inventory Upside 15 Acquisition Model Assumes Maximum Density of Only 12 Wells per Section 8/24/2016 Bench Max ACQ Spacing Peer Tests Eastern Inventory (17,500 net acres) Central Inventory (23,500 net acres) Western Inventory (16,000 net acres) Wells/Sec Wells/Sec ACQ Upside ACQ Upside ACQ Upside 1st Bone Spg/Avalon - 4 - 12 (XEC, CXO) - 200 - 250 - 150 2nd Bone Spg - 4 - 6 (CXO) - 125 - 175 - 125 3rd Bone Spg - 4 - 8 (NBL, CXO) - 150 - 200 - 150 Wolfcamp A 8 8 - 12 (XEC, APC) 260 350 100 300 40 100 Wolfcamp B 4 6 - 8 (NBL, EGN) 150 250 80 125 - 150 Wolfcamp C 4 6 (EGN) - 150 80 125 - 150 Total 4 - 12 32 - 52 410 1,225 260 1,175 40 825 Well Spacing & Inventory Summary Over 3,000’ of Stacked Pay Potential Acquisition Model Appx. 710 currently identified gross locations 3 main horizons Estimated 530 MMBoe of potential net reserves Potential Unrisked Upside Inventory Over 3,200 total potential gross locations 6+ potential zones across acreage Over 1 Billion Boe of potential net resource
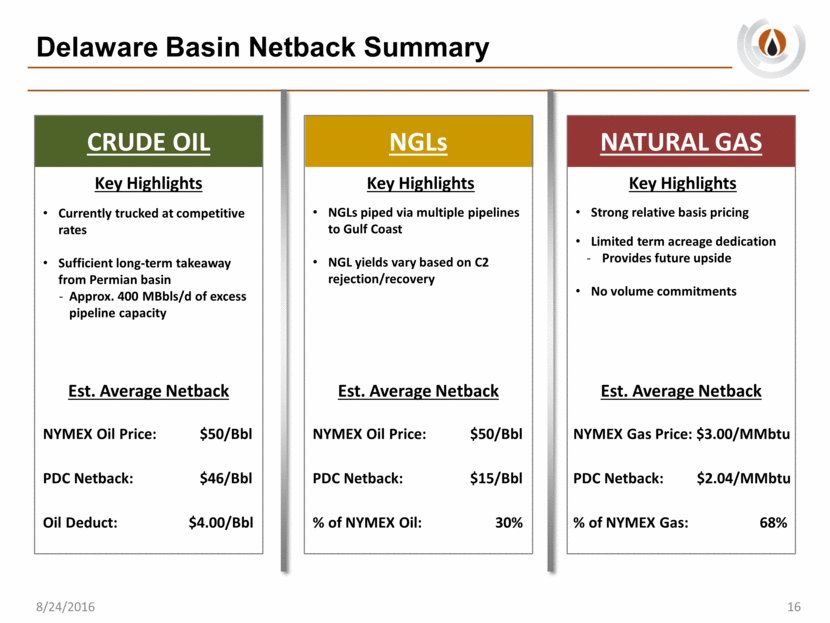
Delaware Basin Netback Summary 16 8/24/2016 CRUDE OIL NGLs NATURAL GAS Key Highlights Est. Average Netback Est. Average Netback Currently trucked at competitive rates Sufficient long-term takeaway from Permian basin Approx. 400 MBbls/d of excess pipeline capacity NYMEX Oil Price: $50/Bbl PDC Netback: $46/Bbl Oil Deduct: $4.00/Bbl NGLs piped via multiple pipelines to Gulf Coast NGL yields vary based on C2 rejection/recovery Strong relative basis pricing Limited term acreage dedication Provides future upside No volume commitments Key Highlights Est. Average Netback Key Highlights NYMEX Oil Price: $50/Bbl PDC Netback: $15/Bbl % of NYMEX Oil: 30% NYMEX Gas Price: $3.00/MMbtu PDC Netback: $2.04/MMbtu % of NYMEX Gas: 68%
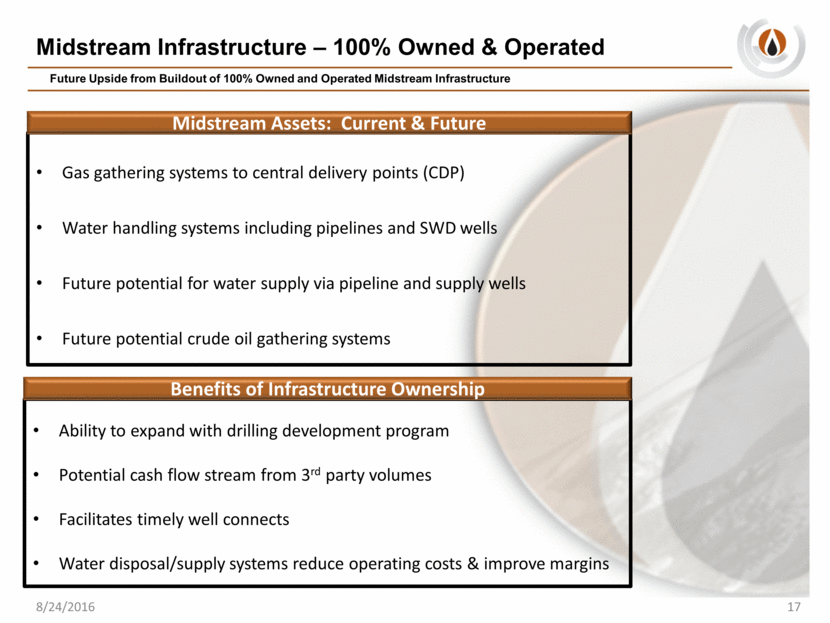
Midstream Infrastructure – 100% Owned & Operated 17 Future Upside from Buildout of 100% Owned and Operated Midstream Infrastructure 8/24/2016 Gas gathering systems to central delivery points (CDP) Water handling systems including pipelines and SWD wells Future potential for water supply via pipeline and supply wells Future potential crude oil gathering systems Ability to expand with drilling development program Potential cash flow stream from 3rd party volumes Facilitates timely well connects Water disposal/supply systems reduce operating costs & improve margins Benefits of Infrastructure Ownership Midstream Assets: Current & Future
18 Implementation strategy
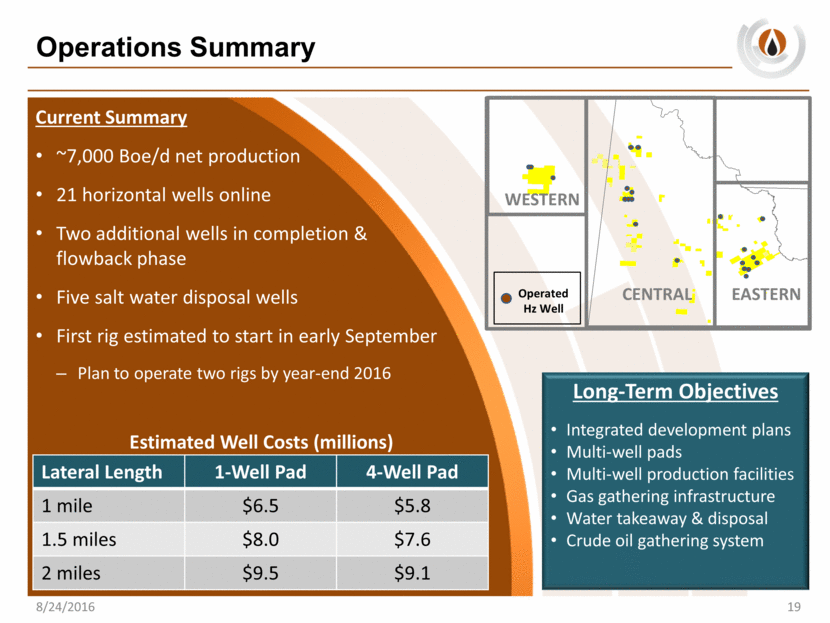
Operations Summary 19 8/24/2016 Current Summary ~7,000 Boe/d net production 21 horizontal wells online Two additional wells in completion & flowback phase Five salt water disposal wells First rig estimated to start in early September Plan to operate two rigs by year-end 2016 Lateral Length 1-Well Pad 4-Well Pad 1 mile $6.5 $5.8 1.5 miles $8.0 $7.6 2 miles $9.5 $9.1 Estimated Well Costs (millions) Long-Term Objectives Integrated development plans Multi-well pads Multi-well production facilities Gas gathering infrastructure Water takeaway & disposal Crude oil gathering system WESTERN CENTRAL EASTERN Operated Hz Well
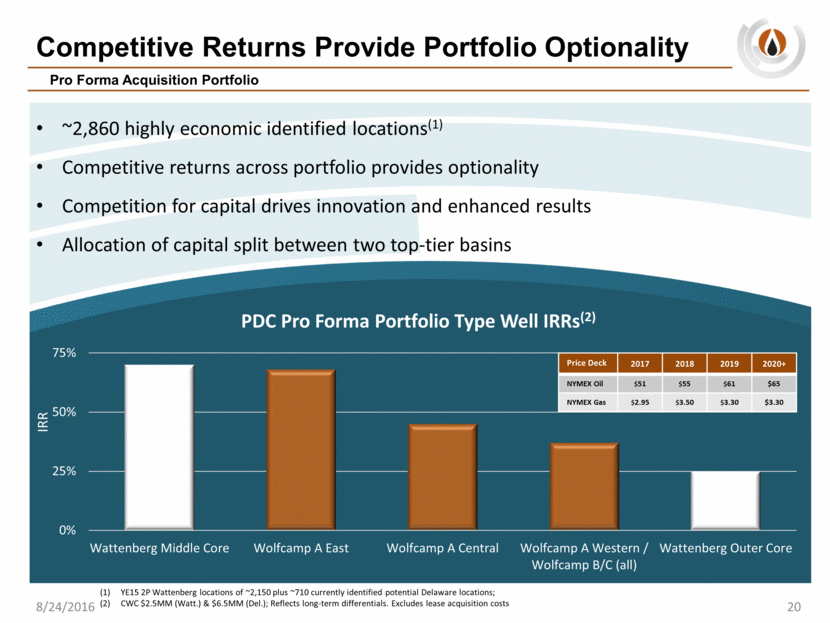
Competitive Returns Provide Portfolio Optionality 20 Pro Forma Acquisition Portfolio 8/24/2016 PDC Pro Forma Portfolio Type Well IRRs(2) ~2,860 highly economic identified locations(1) Competitive returns across portfolio provides optionality Competition for capital drives innovation and enhanced results Allocation of capital split between two top-tier basins YE15 2P Wattenberg locations of ~2,150 plus ~710 currently identified potential Delaware locations; CWC $2.5MM (Watt.) & $6.5MM (Del.); Reflects long-term differentials. Excludes lease acquisition costs Price Deck 2017 2018 2019 2020+ NYMEX Oil $51 $55 $61 $65 NYMEX Gas $2.95 $3.50 $3.30 $3.30
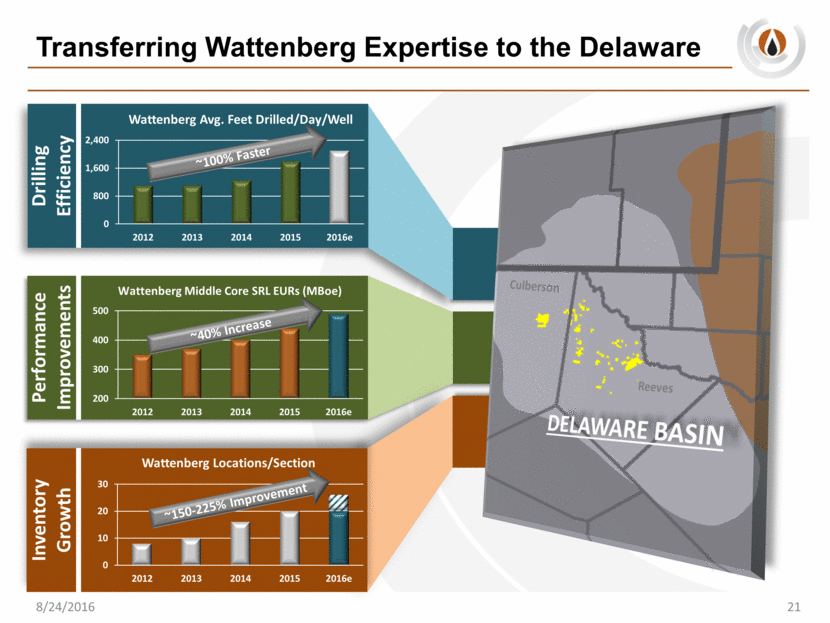
Transferring Wattenberg Expertise to the Delaware 21 8/24/2016 Drilling Efficiency ~100% Faster Inventory Growth Performance Improvements ~40% Increase ~150-225% Improvement DELAWARE BASIN Reeves Culberson 0 800 1,600 2,400 2012 2013 2014 2015 2016e Wattenberg Avg. Feet Drilled/Day/Well 200 300 400 500 2012 2013 2014 2015 2016e Wattenberg Middle Core SRL EURs (MBoe) 0 10 20 30 2012 2013 2014 2015 2016e Wattenberg Locations/Section
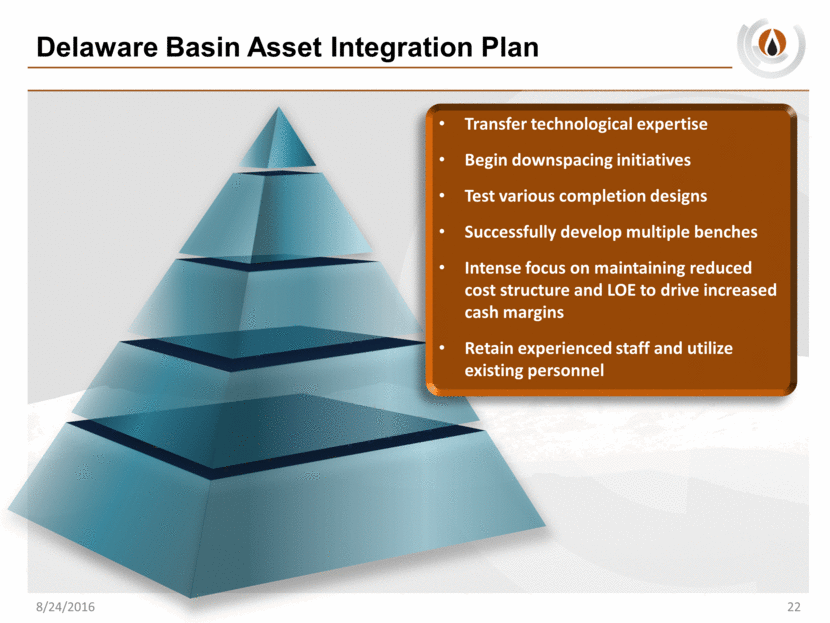
Delaware Basin Asset Integration Plan 8/24/2016 22 Transfer technological expertise Begin downspacing initiatives Test various completion designs Successfully develop multiple benches Intense focus on maintaining reduced cost structure and LOE to drive increased cash margins Retain experienced staff and utilize existing personnel
23 Pro forma corporate outlook
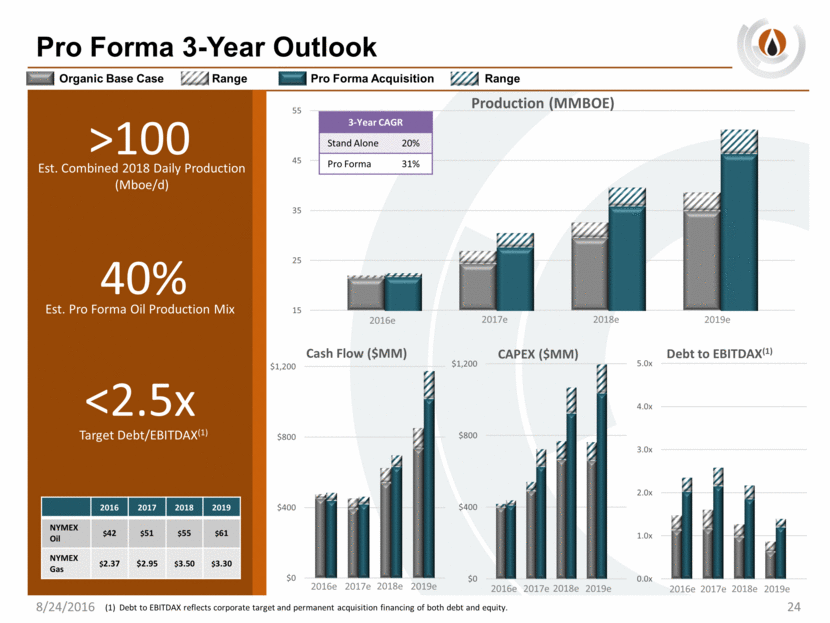
Pro Forma 3-Year Outlook >100 Est. Combined 2018 Daily Production (Mboe/d) 40% Est. Pro Forma Oil Production Mix <2.5x Target Debt/EBITDAX(1) Organic Base Case Range Pro Forma Acquisition Range 8/24/2016 24 2016e 2017e 2018e 2019e 3-Year CAGR Stand Alone 20% Pro Forma 31% 2016 2017 2018 2019 NYMEX Oil $42 $51 $55 $61 NYMEX Gas $2.37 $2.95 $3.50 $3.30 2016e 2017e 2018e 2019e 2016e 2017e 2018e 2019e 2016e 2017e 2018e 2019e (1) Debt to EBITDAX reflects corporate target and permanent acquisition financing of both debt and equity. 15 25 35 45 55 Production (MMBOE) $0 $400 $800 $1,200 Cash Flow ($MM) $0 $400 $800 $1,200 CAPEX ($MM) 0.0x 1.0x 2.0x 3.0x 4.0x 5.0x Debt to EBITDAX (1)
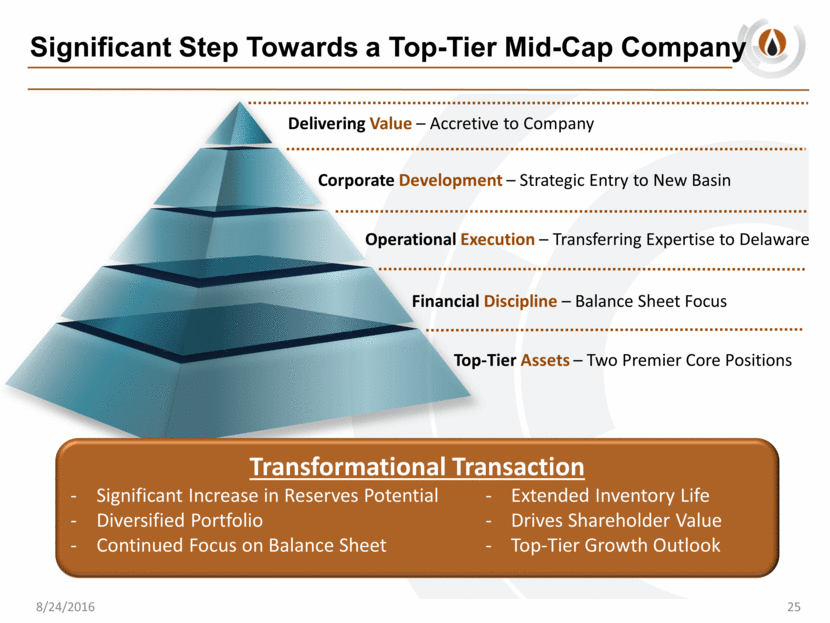
Significant Step Towards a Top-Tier Mid-Cap Company 25 Operational Execution – Transferring Expertise to Delaware Financial Discipline – Balance Sheet Focus Delivering Value – Accretive to Company Corporate Development – Strategic Entry to New Basin Top-Tier Assets – Two Premier Core Positions Transformational Transaction Significant Increase in Reserves Potential - Extended Inventory Life Diversified Portfolio - Drives Shareholder Value Continued Focus on Balance Sheet - Top-Tier Growth Outlook 8/24/2016
8/24/2016 Questions & Answers 26