Attached files
| file | filename |
|---|---|
| EX-23.1 - EX-23.1 - Multi Packaging Solutions International Ltd | mpsx-20160630ex231374ed7.htm |
| EX-32 - EX-32 - Multi Packaging Solutions International Ltd | mpsx-20160630xex32.htm |
| EX-31.2 - EX-31.2 - Multi Packaging Solutions International Ltd | mpsx-20160630ex312045a94.htm |
| EX-31.1 - EX-31.1 - Multi Packaging Solutions International Ltd | mpsx-20160630ex3116d813a.htm |
| EX-21.1 - EX-21.1 - Multi Packaging Solutions International Ltd | mpsx-20160630ex2115e15fe.htm |
UNITED STATES
SECURITIES AND EXCHANGE COMMISSION
WASHINGTON, D.C. 20549
FORM 10-K
ANNUAL REPORT PURSUANT TO SECTION 13 OR 15(d) OF THE SECURITIES EXCHANGE ACT OF 1934
For the fiscal year ended June 30, 2016
TRANSITION REPORT PURSUANT TO SECTION 13 OR 15(d) OF THE SECURITIES EXCHANGE ACT OF 1934
For the transition period from to
Commission File Number: 001-37598

Multi Packaging Solutions International Limited
(Exact Name of Registrant as Specified in its Charter)
|
Bermuda |
|
98-1249740 |
|
(State or Other Jurisdiction of |
|
(I.R.S. Employer |
|
Clarendon House, 2 Church Street |
|
HM 11 |
|
(Address of Principal Executive Offices) |
|
(Zip Code) |
(441) 295-5950
(Registrant’s Telephone Number, Including Area Code)
Securities registered pursuant to section 12(b) of the Act:
|
Title of Each Class |
|
Name of exchange on which registered: |
|
Common Shares, par value $1.00 per share |
|
New York Stock Exchange |
Securities registered pursuant to section 12(g) of the Act: None
Indicate by check mark whether the registrant is a well-known seasoned issuer, as defined in Rule 405 of the Securities Act.
Yes ☐ No ☒
Indicate by check mark if the registrant is not required to file reports pursuant to Section 13 or Section 15(d) of the Act.
Yes ☐ No ☒
Indicate by check mark whether the registrant (1) has filed all reports required to be filed by Section 13 or 15(d) of the Exchange Act of 1934 during the preceding 12 months (or for such shorter period that the registrant was required to file such reports), and (2) has been subject to such filing requirement for the past 90 days.
Yes ☒ No ☐
Indicate by check mark whether the registrant has submitted electronically and posted on its corporate Website, if any, every Interactive Data File required to be submitted and posted pursuant to Rule 405 of Regulation S-T (§232.405 of this chapter) during the preceding 12 months (or for such shorter period that the registrant was required to submit and post such files).
Yes ☒ No ☐
Indicate by check mark if disclosure of delinquent filers pursuant to Item 405 of Regulation S-K (§229.405 of this chapter) is not contained herein, and will not be contained, to the best of registrant’s knowledge, in definitive proxy or information statements incorporated by reference in Part III of this Form 10-K or any amendment to Form 10-K.
☒
Indicate by check mark whether the registrant is a large accelerated filer, an accelerated filer, a non-accelerated filer or a smaller reporting company. See the definitions of “large accelerated filer,” “accelerated filer,” and “smaller reporting company” in Rule 12b-2 of the Exchange Act.
|
Large accelerated filer |
☐ |
Accelerated filer |
☐ |
|
Non-accelerated filer |
☒ (Do not check if a smaller reporting company) |
Smaller reporting company |
☐ |
Indicate by check mark whether the registrant is a shell company (as defined in Rule 12b-2 of the Exchange Act).
Yes ☐ No ☒
The aggregate market value of voting stock held by non-affiliates of the registrant as of the last business day of the registrant’s most recently completed second fiscal quarter was $363,359,000.
As of August 15, 2016, there were 77,452,946 common shares, $1.00 par value per share, outstanding.
DOCUMENTS INCORPORATED BY REFERENCE
Portions of the definitive proxy statement for the registrant’s Annual Meeting of Shareholders are incorporated by reference into Part III of this Annual Report on Form 10-K.
Multi Packaging Solutions International Limited and subsidiaries
Unless the context otherwise requires, all references to “MPS Limited,” the “Company,” “we,” “us” and “our” refer to Multi Packaging Solutions International Limited, a Bermuda exempted company incorporated under the laws of Bermuda on June 19, 2015, together with the entities that became its consolidated subsidiaries on October 7, 2015. The entities that became the consolidated subsidiaries of MPS Limited consist of Multi Packaging Solutions Global Holdings Limited, which we refer to as “MPS Holdings,” and its subsidiaries. On October 7, 2015, MPS Limited became the direct parent company of MPS Holdings through a series of internal reorganizational transactions. We collectively refer to these reorganizational transactions as the “Reorg Transactions.” Unless otherwise indicated, references in this Annual Report to 2016 and 2015 or “fiscal” 2016, 2015 or other years refer to our fiscal year ended June 30 of that year and references to 2017 or “fiscal” 2017 refer to our fiscal year ending June 30, 2017.
On August 15, 2013, Multi Packaging Solutions, Inc. and its primary shareholder, IPC/Packaging LLC, entered into an Agreement and Plan of Merger to be purchased by Mustang Parent Corp. (“Mustang”), an entity controlled by funds advised by Madison Dearborn. The acquisition of Multi Packaging Solutions, Inc. by Madison Dearborn is referred to as the “Madison Dearborn Transaction.” On November 18, 2013, an investment fund controlled by Madison Dearborn and an investment fund controlled by The Carlyle Group (“Carlyle”) entered into a Combination Agreement, whereby Madison Dearborn contributed 100% of the outstanding equity of Mustang to Chesapeake Finance 2 Limited (“Chesapeake”), in exchange for a 50% equity interest in Chesapeake. The combination transaction between Chesapeake and Mustang was consummated on February 14, 2014 and was accounted for as a reverse acquisition with Chesapeake as the legal acquiror and new parent entity, and Mustang as the legal subsidiary but the accounting acquiror. Subsequently, Chesapeake changed its name to Multi Packaging Solutions Global Holdings Limited.
The financial information prior to the February 14, 2014 completion of the combination reflects that of Mustang and its predecessor.
We are a leading, global provider of value-added specialty packaging solutions, based on sales, focused on high complexity products for the consumer, healthcare and multi-media markets. For fiscal 2016, approximately 47%, 47% and 6% of our net sales came from our North American, European and Asian operating segments, respectively, and approximately 89% of our net sales were derived from our consumer and healthcare end markets. We believe that our core addressable consumer and healthcare end markets encompass attractive, resilient and growing packaging categories, and we believe we are a leader in these end markets across North America and Europe based on sales. Additionally, we believe we have a market-leading position in the multi-media specialty packaging sector based on sales, which accounts for 11% of our net sales in fiscal 2016. We provide our customers with an extensive array of print-based specialty packaging solutions, including premium folding cartons, inserts, labels and rigid packaging across a variety of substrates and finishes, which are complemented by value-added services, including creative design, new product development and customized supply chain solutions. Based on management estimates, we believe the market opportunity across our primary addressable markets is currently in excess of $17 billion of annual sales.
We have long-term customer relationships driven by our global presence, breadth of products, value-added service offering, reputation for operational excellence, innovative packaging solutions and highly experienced management team. We serve a blue chip customer base, including some of the world’s largest companies and the leaders in our target end markets. Our global platform allows us to serve our customers, which include AstraZeneca, Coty, Diageo, Estée Lauder, GlaxoSmithKline, L’Oréal, Mondelēz International, Nestlé, Pernod Ricard, Pfizer and Sony, on both a local and global basis. Our relationships with our top 20 customers exceeds 34 years on average with many of our customers operating under multi-year contracts. No one customer accounted for more than 10% of our net sales for fiscal 2016, fiscal 2015 and the period from August 15, 2013 through June 30, 2014. One customer accounted for approximately 11% of net sales for the period from July 1, 2013 through August 14, 2013. Servicing our customers requires us to meet stringent quality specifications, significant customer service standards and meaningful investment requirements. Our healthcare customers, for example, require exacting standards of manufacturing in order to meet their regulatory requirements, which include strict process controls, site certification, chain of custody product information and strict adherence to print requirements and print quality due to the nature of the use of the product by our customers’ end users. For our consumer customers, we are at the front end of their branding and marketing strategy, enhancing the visual impact at the shelf while also ensuring
1
product integrity and regulatory compliance. We believe our advanced printing and finish effects and designs often help our customers position their products at the premium end of their addressable markets. In addition we provide value-added supply chain services such as vendor managed inventory (“VMI”), specific carton-by-carton scan ability and data which enable the customer to track a product from manufacturer to end user.
We believe we are one of a few companies in the end markets we serve offering a full range of products across multiple geographies, allowing us to provide specialty packaging solutions for customers locally and globally, a capability our customers find valuable in presenting a consistent image of the underlying product. Our global manufacturing footprint consists of 59 manufacturing sites and eight sales offices across North America, Europe and Asia. Our strategically located facilities have enabled us to grow our business by leveraging our customer relationships across multiple geographies and products, and drive incremental growth through our ability to integrate and improve our customers’ supply chains. These solutions highlight our competitive difference and allow us to win new customers and strengthen our existing client relationships through cross-selling opportunities across our unique global platform, with further benefits to be realized from recent acquisitions. Additionally, our global manufacturing footprint is supported by our sales and design teams, which consist of a dedicated research and development group, approximately 100 structural and graphic designers and approximately 200 sales personnel.
Our History
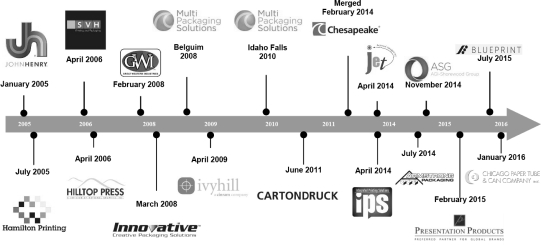
Since 2005, we have evolved from our initial U.S. platform of five facilities into a global specialty packaging leader, based on sales, in the consumer, healthcare and multi-media end markets. We have completed a total of 16 transactions within our addressable products and markets, with early acquisitions targeted at obtaining and building the necessary technology footprint to serve consumer and pharmaceutical companies. Later acquisitions focused on expanding that platform into complementary products and creating a global footprint capable of meeting all of our customers’ value-added packaging requirements. In 2014, we entered into a transformational merger with Chesapeake (February 2014), acquired ASG (November 2014) and in addition completed six further acquisitions since the Merger, which expanded our global reach and diversified our product and end market profile. We have a successful track record of acquiring strategically relevant companies, establishing and realizing savings and synergy programs and integrating acquired operations and customers into our global platform. Through successful execution and integration of acquired businesses, we have expanded our geographic reach and product and service offering, which has enabled us to better serve our large multinational customers, as well as penetrate new regional and local customers in our key end markets. We have expanded the operating margins of companies we have acquired, achieving our synergy targets and leveraging our platform as evidenced by our accreting EBITDA margins subsequent to each acquisition. Specifically, we estimate that we realized a total of approximately $40 million of synergies from the Chesapeake and ASG transactions.
2
The MPS and Chesapeake platforms are highly complementary. At the time of the merger between the two companies, MPS was predominantly focused on the personal care and generic pharmaceutical end markets within North America. Conversely, Chesapeake was focused on the branded pharmaceutical, confectionary and Scotch whisky end markets in Europe. The combination provides for significant cross-selling opportunities across our global platform.
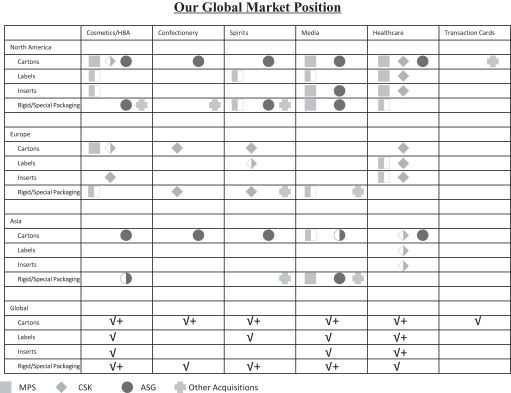
Note: Partially shaded symbols represent limited presence and fully shaded symbols represent significant presence.
Our Segments
We operate our business along three operating segments, which are grouped on the basis of geography: North America, Europe and Asia. We believe this method of segment reporting reflects both the way its business segments are managed and the way the performance of each segment is evaluated. The three segments consist of similar operating activities as each segment produces similar products. The Company evaluates performance based on several factors, of which the primary financial measure is Adjusted EBITDA. Adjusted EBITDA is defined as segment net income (loss) before income taxes, interest, depreciation, amortization, restructuring, transaction, stock-based compensation and certain other costs that do not related to the segment’s ongoing operations. See Note 19, Segments, in the Notes to Consolidated Financial Statements for additional information about our segments.
3
Net sales for our segments were as follows:
|
|
|
Successor |
|
|
Predecessor |
|
||||||||
|
|
|
Fiscal Year Ended |
|
Period from August |
|
|
Period from July 1 |
|
||||||
|
|
|
June 30, |
|
15, 2013 through |
|
|
2013 through |
|
||||||
|
(amounts in thousands) |
|
2016 |
|
2015 |
|
June 30, 2014 |
|
|
August 14, 2013 |
|
||||
|
Net Sales |
|
|
|
|
|
|
|
|
|
|
|
|
|
|
|
North America * |
|
$ |
784,453 |
|
$ |
737,888 |
|
$ |
452,031 |
|
|
$ |
58,728 |
|
|
Europe |
|
|
785,997 |
|
|
820,391 |
|
|
354,396 |
|
|
|
15,353 |
|
|
Asia |
|
|
90,978 |
|
|
59,361 |
|
|
7,786 |
|
|
|
— |
|
|
Total Net Sales |
|
$ |
1,661,428 |
|
$ |
1,617,640 |
|
$ |
814,213 |
|
|
$ |
74,081 |
|
* Includes net sales in the United States of $695.3 million and $688.2 million for the fiscal years ended June 30, 2016 and 2015, respectively. Substantially all North America sales for the period from August 15, 2013 through June 30, 2014 and the period from July 1, 2013 through August 14, 2013 were generated in the United States.
Our Products
We provide our customers a comprehensive suite of innovative specialty products and services, including premium folding cartons, inserts, labels and rigid packaging. Our packaging solutions utilize a wide variety of substrates (e.g., paper and paperboard, pressure sensitive labels, plastic, foil) and finishes (e.g., UV coatings, film lamination, stamping, embossing). We also employ an array of value-add decorative technologies to create iridescent, holographic, textured and dimensional effects to provide differentiated specialty packaging products to our customers. Our comprehensive solutions, which often include combination or bundled products, and a technologically advanced asset base allow us to win new customers and strengthen our existing client relationships through cross-selling opportunities across our unique global platform.
Premium Folding Cartons
Premium folding cartons are widely used, versatile forms of secondary packaging that our customers utilize to attract consumer attention at the point-of-sale and provide critical product information to end users. Our folding carton offering is targeted at the premium end of the market, utilizes high quality inputs such as solid bleached sulfate, and is manufactured with various features and finishes, including lamination, embossing, foil stamping and windowing. Rigid packaging serves a functional purpose by providing protection to the product throughout the shipping, distribution and merchandising processes. Premium folding cartons accounted for approximately 61%, 61%, 59% and 66% of our consolidated net sales in fiscal 2016, fiscal 2015, the period from August 15, 2013 through June 30, 2014 and the period from July 1, 2013 through August 14, 2013, respectively.
Our premium folding cartons offering plays an important role in our customers’ branding and marketing strategies through influencing purchase decisions at the point-of-sale by conveying an exceptional appearance, shelf presence and impact through the use of specialty graphics, a variety of printed finishes and other creative designs. Additionally, our premium folding cartons offering must adhere to stringent regulatory requirements by playing a key role in our customers’ product safety as well as ensuring product authenticity, accurate product information and product compliance to the end customer. Our premium folding carton customers oftentimes purchase associated labels and inserts. Leveraging cross-selling opportunities is a key strategic initiative of recent acquisitions that we have completed.
Inserts
We provide inserts for all the end markets we serve, with the majority of our net sales in this category being to the healthcare end market. Inserts are of particular importance in the healthcare end market given stringent regulations to ensure the accuracy of product information, although they are also used in non-healthcare markets in which product literature is required to be presented to the end user. Inserts are included either inside a secondary package (e.g., folding carton) or affixed to the outside of a primary package (e.g., bottle). Numerous regulatory bodies, such as the U.S. Food and Drug Administration, the U.S. Department of Agriculture and various trade associations, require an increasing level of product information, including nutritional, performance and other related product disclosures. Providing this increasing
4
amount of information requires larger and, in many instances, more complex inserts. Specific technical equipment is necessary to produce the folded leaflet, which requires significant upfront investment. Evolving regulations require that insert manufacturers stay abreast of new developments and maintain manufacturing equipment and process capabilities necessary to meet strict inspection and quality control standards. Product disclosure requirements change, oftentimes on short notice, due to regulatory oversight. This results in the need for quick reaction and turnaround of production. Oftentimes our ability to be an integral part of our customers’ information management systems allows us to monitor customer demand and limit their exposure to inventory obsolescence when product disclosure changes. Inserts accounted for approximately 13%, 16%, 16% and 12% of our consolidated net sales in fiscal 2016, fiscal 2015, the period from August 15, 2013 through June 30, 2014 and the period from July 1, 2013 through August 14, 2013, respectively.
Labels
Labels are one of the most visible and recognizable packaging components and are used in a wide variety of applications serving as the primary means of identifying products to consumers, while creating shelf appeal and brand recognition for products. Labels also function as a conduit for fulfilling regulatory requirements, communicating product-related information to consumers and contributing to product integrity and security. We supply a broad range of pressure sensitive labels, including single-panel, multi-panel, multi-ply and extended content labels, as well as cut and stack labels. Labels accounted for approximately 8%, 7%, 9% and 10% of our consolidated net sales in fiscal 2016, fiscal 2015, the period from August 15, 2013 through June 30, 2014 and the period from July 1, 2013 through August 14, 2013, respectively.
The majority of our net sales in this category are pressure sensitive labels sold primarily into the healthcare market which, like our inserts, are subject to stringent regulations to ensure the accuracy of product information. Additionally, we supply both pressure sensitive and cut and stack labels to the consumer products markets where decorative labels are utilized to differentiate products at the retail point-of-sale. We employ multiple print technologies with respect to labels, utilizing digital, flexographic and offset printing press technologies to serve our customers globally.
Rigid Packaging
Rigid boxes are commonly used to present ultra-premium products and vary from rigid top load boxes for the high-end spirits market to specialized boxes for perfumes and other luxury products. We historically provided rigid box offerings, oftentimes described as top load box or set up boxes, via strategic outsource suppliers. Consistent with our acquisition strategy to acquire appropriate technologies, we completed two recent strategic acquisitions which added our own internal manufacturing capability for a premium rigid packaging product offering with the addition of customized/high-end rigid boxes. We have a growing presence in rigid packaging and believe this is a meaningful area for growth in the future. Rigid Packaging accounted for approximately 6%, 4%, 1% and 0% of our consolidated net sales in fiscal 2016, fiscal 2015, the period from August 15, 2013 through June 30, 2014 and the period from July 1, 2013 through August 14, 2013, respectively.
Other Consumer Products Packaging
We offer a number of additional printed packaging products, including transaction cards, point-of-purchase displays, brochures, product literature, marketing materials and grower tags and plant stakes for the horticultural market. These products are supplied to various niche markets that require print-based specialty packaging. Our transaction cards and card services offerings are of a particular focus. We provide our customers a comprehensive end-to-end solution for credit, debit, general prepaid reloadable, gift, loyalty, hospitality, insurance and other card-based programs. Our integrated supply chain for cards, carriers, multi-packs and point-of-purchase displays greatly simplifies the development and execution of card programs and drives competitive differentiation. Other consumer products packaging accounted for approximately 12%, 12%, 15% and 12% of our consolidated net sales in fiscal 2016, fiscal 2015, the period from August 15, 2013 through June 30, 2014 and the period from July 1, 2013 through August 14, 2013, respectively.
5
Value-Added Services
We provide a range of value-added services to our customers ranging from collaboration on the initial packaging concept to total management of the supply chain. We work closely with our customers to understand their specific requirements and thereby implement streamlined workflows starting from pre-press through to fulfillment. These valuable service capabilities complement our broad product offering and, when matched with our manufacturing operations, enable us to consistently deliver high quality products and superior service to our customers. Examples of such value-added services include creative design and new product development, for which we have a team of more than 105 structural designers and graphic designers across a number of key locations. We also provide our customers with customized supply chain solutions, including VMI programs. VMI solutions help customers manage production based on actual demand to reduce lead times, minimize inventory, eliminate waste and enhance supply chain security. Our ability to provide on-demand services for our customers via digital print technology has allowed us to reduce our lead times. Shorter lead times provide a distinct advantage in consumer and healthcare-facing industries where companies must move quickly to introduce new products and ramp-up supply in response to market trends and consumer demand. Shorter lead times also limit our customers’ exposure to inventory obsolescence. Our value-added services build entrenched partnerships with customers and allow us to become a more critical part of the supply chain by helping to improve workflow efficiencies and reduce our customers’ total cost of ownership for packaging materials.
|
· |
Digital Workflow: Ability to manage all of a customer’s digital assets for simplified management on a regional or global scale. These digital assets range from artwork and front-end solutions to tracking codes that account for individual items throughout the supply chain and activation codes that scan at retail. |
|
· |
Creative Services: Award-winning creative team with a reputation for innovation and quality, comprised of 25 structural designers and nine graphic designers who provide packaging engineering, 3-D renderings, product animation, prototyping and testing. |
|
· |
Pre-Press Services: Fully staffed, around-the-clock team to provide same day or next day service including full proofing capabilities, artwork enhancement and file correction. |
|
· |
Vendor Managed Inventory: Ability to manage production based on a customer’s actual demand provides numerous benefits, including shorter lead times, reduced physical inventory, waste reduction and increased supply chain security. |
|
· |
Late Stage Customization: Ability to leverage our flexible manufacturing capabilities by printing common graphics on long-run equipment and customizing products on-demand with printed labels or inserts using short-run digital equipment. A proprietary finishing system prints and applies labels and delivers finished cartons on an as needed basis. |
|
· |
Co-Located Facilities: Onsite facilities management provides equipment and staffing for printing and packaging production physically located within a customer’s facility. On-demand packaging capabilities provide numerous customer benefits, including lower inventory levels, reduced obsolescence and cycle time reductions. |
|
· |
Brand Protection / E-Pedigree: We provide brand security through the application of various technologies, including magnetic inks, invisible bar codes and holographic cold foil, to help ensure the traceability and authenticity of our customers’ products. |
|
· |
Environmental Solutions: We have made substantial investments in sustainability and environmentally-friendly products, technologies and manufacturing processes to meet the environmental objectives of our customers. |
6
Our End Markets
Consumer
We produce a full line of specialty print-based packaging products for a wide range of customers in the personal care, spirits, cosmetics and confectionary markets. We focus on the premium end of the market where high-impact graphics, and innovative designs and finishes attract attention and help brands drive “top-of-mind” positioning with consumers at the point-of-purchase. Our scale and financial resources have enabled us to build out a leading global design division which has been at the forefront of our product innovation capabilities. Multinational customers have also increasingly centralized their procurement functions seeking fewer, more strategic partners capable of meeting their consumer packaging needs and consistent marketing image across a range of products, services and geographies. We are well-positioned to benefit from this trend in vendor rationalization by leveraging our ability to deliver a broad range of local solutions while simultaneously providing global coverage to our multinational customers. Consumer end market products accounted for approximately 50%, 50%, 45% and 35% of our consolidated net sales in fiscal 2016, fiscal 2015, the period from August 15, 2013 through June 30, 2014 and the period from July 1, 2013 through August 14, 2013, respectively.
This market is driven by:
|
· |
Shortened product life cycle—Focus on new product introductions with unique packaging designs that promote brand identity and on-shelf differentiation in order to drive growth. In order to achieve the first-mover advantage, personal care companies rely on suppliers able to rapidly design and commercialize these new, high quality packages. |
|
· |
Enhanced product design and brand promotion—Personal care companies have increasing demand for packaging suppliers who are able to offer new technologies and services to promote brand identity, premium positioning and shelf appeal. This trend increasingly favors suppliers with differentiated capabilities, such as finishing technologies for iridescent, holographic, textured and dimensional effects. |
|
· |
Positive demographic trends and increasing health and wellness awareness—The growing and aging population sensitive about preserving a youthful image is driving a positive shift in the consumption patterns of personal care products, including products used to reverse signs of aging, such as anti-wrinkle skin creams, lotions, serums and hair colorants. People are generally tending to take better care of themselves and are willing to pay more for products with perceived benefits. |
|
· |
Increasing disposable premiumization—Individuals have greater capability to purchase higher end consumer products, particularly in developing regions such as Asia and Latin America. Sophisticated packaging solutions allow for better shelf visibility and brand positioning. The propensity to use secondary packaging, such as premium rigid boxes and labeling, is higher in premium type spirits and confections, as it represents one of the principal ways to command higher price points and differentiate products. |
|
· |
Demand for sustainable and intelligent packaging—Increasing consumer focus on environmental issues and recyclability of materials represents an opportunity for advanced high value-add producers to further strengthen market positions. Consumers are increasingly purchasing products that are sustainable and offer recyclable packaging and many companies have embraced this trend, moving towards eco-friendly products. |
Healthcare
Healthcare packaging is used in a wide variety of applications including over-the-counter and prescription pharmaceuticals, medical devices, nutritional and dietary supplements, vitamins and minerals. We offer a full line of print-based packaging products serving the healthcare market, including folding cartons, inserts, labels, outserts and booklets. The healthcare packaging market is characterized by significant technical requirements, recession-resilient demand characteristics and numerous growth opportunities. Healthcare packaging has stringent quality specifications, prerequisite manufacturing standards and evolving regulatory requirements. Product innovation plays a key role in the industry as pharmaceutical manufacturers increasingly incorporate authentication features into packaging to assist in the prevention of counterfeiting. We have developed strong relationships with leading healthcare companies as a result of our high-quality products, expertise in print technologies including digital print technology, excellent customer service and customized
7
supply solutions, and quick response and turnaround times. Through this approach, we believe we have established ourselves as an important supplier to the industry and see significant opportunity for future growth with new and existing customers. Healthcare end market products accounted for approximately 39%, 40%, 41% and 28% of our consolidated net sales in fiscal 2016, fiscal 2015, the period from August 15, 2013 through June 30, 2014 and the period from July 1, 2013 through August 14, 2013, respectively.
This market is driven by:
|
· |
Population demographics—Population growth, an increased focus on chronic diseases and the aging population have increased the market for pharmaceuticals as consumers require a growing number and diversity of prescription and over-the-counter medicines and nutritional supplements, including those that target age-related conditions and illnesses. |
|
· |
Globalization and vendor rationalization—Regulatory pressures and increased product quality requirements have encouraged large multinational pharmaceutical and supplement manufacturers to focus their packaging spend on fewer suppliers that can provide consistent service and product quality on a global basis. We believe this trend favors scale players with the capability to support product launches across multiple products and geographies. We expect vendor rationalization to continue as customers seek to contain costs without sacrificing logistical flexibility and product quality. |
|
· |
Increasing consumer awareness regarding health and wellness—Manufacturers and marketers of nutritional and dietary supplements are continuously introducing and marketing new product offerings in order to appeal to growing consumer awareness regarding health and wellness and preventative medicine. |
|
· |
Growth in drug treatments and availability—The volume of pharmaceutical products available in the market has been expanding for both branded and generic drugs. The demand for generic drugs may accelerate as some branded pharmaceutical products become available in generic formulations after the expiration of patents. While our branded business is set to grow with the overall market, we also expect to benefit from the growth of generic pharmaceuticals. |
|
· |
Evolving regulatory standards and regulations—Regulatory standards to improve security and prevent drug counterfeiting as well as provide greater, more accessible disclosure to patients and healthcare providers create a dynamic regulatory environment that requires creative, value-added packaging solutions. For example, the blister packaging market is expected to benefit from the implementation of U.S. Food and Drug Administration regulations requiring all prescribed pharmaceuticals dispensed in hospitals and nursing homes to be packaged in unit dose formats with barcodes in order to reduce dispensing errors. Overall drug spend is also forecast to grow, given recent government legislation and regulation around the Patient Protection and Affordable Care Act. |
Multi-Media
Our multi-media end market net sales is focused on high quality specialty packaging, which often requires quick response, including commemorative and special editions for home videos, recorded music, video games and software. We produce a full line of printed packaging products for leading multi-media companies including folding cartons, booklets, folders, inserts, cover sheets and slipcases, as well as highly customized, graphical and value-added packaging components. We are one of the largest producers of these products in the North American multi-media end market based on sales. Multi-media end market products accounted for approximately 11%, 10%, 14% and 37% of our consolidated net sales in fiscal 2016, fiscal 2015, the period from August 15, 2013 through June 30, 2014 and the period from July 1, 2013 through August 14, 2013, respectively.
8
This market is characterized by:
|
· |
Digital substitution—We believe the combination of our talented sales executives with longstanding customer relationships and our product and operational excellence has allowed us to generate attractive margins and cash flow despite the decline in multi-media packaging demand. The increasing popularity of digital distribution will continue to erode the shipments of physical music and video game and home video units. See “Risk Factors—Risks Related to Our Business—The impact of electronic media and similar technological changes, including the substitution of physical products for digital content, may continue to adversely affect sales in the multi-media end market.” We believe that through our market-leading positions in the multi-media specialty packaging sector we will be able to continue to execute on profitable and opportunistic multi-media packaging business. Moreover, highly anticipated video game launches, such as Grand Theft Auto, and blockbuster movie releases drive increased demand for gaming and home video, respectively, including higher value-add commemorative editions and box sets, and can generate above average growth and profitability. |
Our Sales and Marketing
We believe we maintain a world class sales and marketing organization with an ability to grow sales with new and existing customers, as well as cross-sell our comprehensive product offerings. The ability to identify and successfully recruit talented sales and marketing executives has contributed to our ability to achieve accelerated growth rates. Each vertical is led by dedicated sales executives who, in collaboration with our executive team, are responsible for maintaining existing relationships and identifying and pursuing a target account list of potential new customers.
We have a proven ability to provide customized solutions that reduce our customers’ total cost for packaging materials. By seeking out customers who would benefit from value-added solutions, we have been able to consistently expand our customer base and maintain longstanding relationships without competing solely on the basis of price.
Our Customers
We have a broad and diversified customer base. We benefit from longstanding relationships with well-recognized customers in each of our core markets. Our relationships with our top 20 customers exceed 34 years on average. No one customer accounted for more than 10% of our net sales for fiscal 2016, fiscal 2015 and the period from August 15, 2013 through June 30, 2014. One customer accounted for approximately 11% of net sales for the period from July 1, 2013 through August 14, 2013.
Our management is highly focused on creating and maintaining strategic partnerships beyond standard transactional customer relationships. Our customer relationships are reinforced by our innovation, consistent high quality products, integrated service offerings, reliable on-time delivery and outstanding customer service.
Our customer relationships are further entrenched by customer audit specifications and regulatory approvals required for packaging suppliers as well as the inherent risk of switching suppliers. Products are typically complex and involve short-run production lengths, while contracts include multiple SKUs with color and design variability. While secondary packaging is a low proportion of end-product cost or price (in healthcare, for example, it is often less than 1% of end-product cost/price), the potential cost of disruption to a packaging line as a result of poor quality products or unstable supply can be significant. Consequentially, end customers are focused on quality and stability of supply.
We maintain multi-year contracts with the majority of our customers with terms of three to four years on average. Consistent with industry practice, we do not typically receive volume commitments from customers, but often have a contractual right to a minimum percentage of a customer’s spend on identified products. We manage the majority of our raw material costs through a combination of market-based pricing and contracted escalators and de-escalators.
9
Our Facilities
We own or lease 59 manufacturing facilities and several dedicated sales and design offices in North America, Europe and Asia. Our facility network is strategically located in close proximity to key customers.
We employ a largely integrated, enterprise-wide approach to management of our facilities and fundamental equipment, which enables us to redeploy plant assets and production processes to match customer and profitability objectives. At the same time, facility level specialization of our manufacturing footprint based on customer needs, substrate capabilities and technological offerings allows us to take advantage of enhanced profitability from efficiencies associated with running larger volumes of consistent products at specific locations. Acquired operations also benefit from this approach as business is optimized across the broader facility network incorporating a process of asset redeployment, facility rationalization and targeted capital investment.
Further, we have invested to ensure our facilities provide the scale, geographic coverage, operational flexibility and security of redundant capabilities that sophisticated customers require. Since our inception in 2005, we have pursued a capital investment program, which we believe has provided us with leading technological and operational capabilities and capacity for continued growth. We completed a capital investment program from fiscal year 2012 through fiscal year 2013 that expanded existing co-located facilities, expanded our Poland facility and consolidated two redundant facilities. As a result, our manufacturing platform is well positioned to support the anticipated ramp-up of production related to our new business pipeline and organic growth. We are able to deliver high quality products and services to our customers by way of the following:
|
· |
Security of Supply—The scale of our multi-site network allows customers to confidently source a large portion of their packaging requirements from us. |
|
· |
Fully-Accredited Sites—All our facilities are registered to ISO9000 standards or are cGMP compliant. Many sites conform to relevant market sector standards such as the Pharmaceutical Code of Practice (PS9000), BRC / IoP, HAACP, ISO14001 and 18001. |
|
· |
Sites Meet Stringent Customer Requirements—Customer audits are undertaken for supplier approval and quality certifications. These demanding audits are accompanied by continually evolving and increasingly stringent regulatory standards and requirements. |
Our Manufacturing
Our manufacturing footprint and dedicated sales force are strategically located in close proximity to our clients, which further enables our ability to manage customers in the region. Through continued capital investment and strategic acquisitions, we have become a leading print-based specialty packaging supplier offering a comprehensive range of technological capabilities to our customers. We have invested in state-of-the-art equipment and are a leader in the three principal specialty printing technologies:
|
· |
Offset lithographic printing—In “offset” printing, rollers apply ink and water to plates which are then transferred to a rubber cylinder that transfers the image onto the paper. The lithographic printing process delivers superior quality graphics and can accommodate a variety of specialty finishes, including foil stamping and embossing. Benefits to offset printing include consistent high image quality and usability on a wide range of printing surfaces. In this process, paper is cut down to sheets (either internally or by outside vendors) and then fed through the printing press. |
|
· |
Flexographic printing—In “flexo” printing, inked rubber or plastic plates with a slightly raised image are rotated on a cylinder which transfers the image directly to the substrate. A versatile printing technology, flexography offers a unique blend of high quality graphics on a wide variety of substrates and supports flexible production requirements. In this process, the presses are web-fed or roll-fed, whereby a large roll of paper or paperboard is fed through the press. |
10
|
· |
Digital printing—Digital printing is ideal for short production runs and on-demand printing. Product concepts and design alternatives can be produced quickly on virtually any substrate. This value-added solution helps customers reduce inventory levels and practically eliminate inventory obsolescence. |
We have also invested in finishing capabilities that utilize a variety of new technologies and equipment, including cutters, folders, gluers and other specialized equipment that we use to create the final product. Our footprint provides redundant and flexible capabilities that enable us to optimize facility loading to most effectively and efficiently service our customers’ needs.
We believe we also have significant available capacity for continued growth by means of our considerable investments in plant infrastructure and information technology systems. Moreover, our core information technology systems are being progressively updated to provide increased functionality and control.
Further contributing to our success is our creative design and product development expertise. Our products are manufactured with various features and finishes, including lamination, stamping, embossing and foil stamping. In addition, we are able to use our extensive decorative technology capabilities to create iridescent, holographic, textured and dimensional effects to provide differentiated packaging to our customers.
While we have undergone a lot of changes, particularly around the perimeter of our business, we are only part of the way through our operational efficiency journey. Going forward, our key areas of operational focus include:
|
· |
Operational performance improvement—Significant savings could be realized if all sites can be brought up to the average group standard efficiency for key processes. Example areas of focus include machine performance improvements, material yield improvements and improved capacity utilization. For instance, we have yet to realize the full benefits of recent capital expenditures in new presses, which have reduced the number of presses required for the same output and led to lower raw material wastage and direct costs. |
|
· |
Additional plant optimization—Addressing underperforming plants with scope for further rationalization. Additionally, benefits from recently completed plant consolidations are still being realized. |
|
· |
Attractive capital projects—Achieving efficiencies from a number of recent capital expenditure projects. Additionally, there are numerous identified capital projects not yet implemented with attractive payback periods. |
|
· |
Procurement—The procurement function has evolved to a more centralized model globally but has largely focused on key, direct spend items and has yet to tackle its broader indirect purchase envelope which has historically been decentralized with a high number of suppliers to drive further savings. |
|
· |
Selling, general and administrative expenses improvement—There has been ongoing focus on reducing selling, general and administrative expenses, for example through further clustering of manufacturing sites, whereby facilities are integrated with common facility management teams as well as shared back office services, to drive cost efficiencies. |
Lean manufacturing
We established lean manufacturing principles and have subsequently implemented lean manufacturing across the entire Company, with eight full-time employees dedicated to the implementation of best practices across the Company through the use of lean manufacturing tools. This discipline includes utilizing value stream mapping to identify opportunities for process improvement. We have realized significant benefits from lean manufacturing initiatives including shorter make-ready times, improved production workflow, faster cycle times, expanded capacity and reduced waste. Lean manufacturing benefits are essential components of our ability to compete and deal with the impacts of employee salary increases and raw material price increases. We maintain one of the key principles of lean manufacturing, continuous operational improvement, at the center of our corporate philosophy. As a reflection of this, we have implemented lean manufacturing at all acquired companies and conduct weekly and monthly calls to share best practices across facilities. We rigorously evaluate our manufacturing footprint on an ongoing basis by measuring several key performance indicators, including
11
downtime, make-ready time and run speed, to identify underperforming facilities and ensure that measures are taken to bring them up to our company-wide manufacturing efficiency standards.
Our Suppliers and Raw Materials
Our largest raw material expenses are related to our major product substrates, including paperboard, paper, sheeted plastic and label stock. We also purchase inks, varnishes, coatings, adhesives and corrugated boxes that are used in the manufacturing process. We have a centralized purchasing function that allows us to leverage our growing scale to achieve competitive material pricing. Further, we have consistently used our scale to lower input costs at acquired businesses.
We utilize a diversified and global sourcing model with the ability to procure each key substrate from a variety of sources. We price non-contractual business based on prevailing raw material costs, which we believe mitigates the impact of rising input prices. All primary materials are available from multiple suppliers and we have not experienced any material disruptions in our ability to procure key inputs. We have been able to effectively manage raw material costs since our founding, including during periods of rapidly escalating commodity prices, either through contractual pass-through mechanisms or transactional business.
Seasonality
Net sales in our end markets are somewhat seasonal, with consumer and multi-media market net sales higher in the first and second quarter of the fiscal year due to the need to satisfy holiday-related packaging needs of our customers. Cash flow in our business is also seasonal, typically with investments in working capital in the first half of the fiscal year which then reverses and provides cash inflows in the second half of the fiscal year.
Research and Development
We employ 13 professionals in Europe and the United States to work on new technological developments and customer-focused solutions. The trademarked technologies employed by MPS were developed internally by MPS, and continue to be refined to provide more value-add to our customers. We also focus on the creation of compliance packaging for the healthcare industry, and we have successfully launched a number of products that are extensively used by our healthcare customers.
Intellectual Property and Licenses
Although our business is not dependent to any significant extent upon any single or related group of intellectual property, we have registered intellectual property in the United States and in a number of foreign jurisdictions. In addition, we have a book of copyrights. Further, we do not believe our licenses to third-party intellectual property are significant to our business other than licenses to commercially available third-party software.
Trademarks
We own or otherwise have rights to the trademarks, service marks, copyrights and trade names used in conjunction with the marketing and sale of our products and services. Our trademarks are protected under applicable intellectual property laws and are our property and the property of our subsidiaries. This Annual Report also contains trademarks, service marks, copyrights and trade names of other companies, which are the property of their respective owners. We do not intend our use or display of other companies’ trademarks, service marks, copyrights or trade names to imply a relationship with, or endorsement or sponsorship of us by, any other companies. Solely for convenience, our trademarks, service marks, trade names and copyrights referred to may appear without the ®,™ or © symbols, but such references are not intended to indicate, in any way, that we will not assert, to the fullest extent under applicable law, our rights or the right of the applicable licensor to these trademarks, service marks, trade names and copyrights.
12
Our Employees
As of June 30, 2016, we employed approximately 8,700 people, of which approximately 3,200 are located in North America, 4,500 are located in Europe and 1,000 are located in Asia. The majority of our workforce is non-union; however, we participate in multiple collective bargaining agreements with various unions, which provide specified benefits to certain union employees. Approximately 8% of our employees in North America and approximately 75% of our employees in Europe are members of a union or works council or otherwise covered by labor agreements. The collective bargaining contract agreements with our North American unions are set to expire in 2017, at which time we expect to negotiate a renewal of the agreements.
Health, Safety and Environmental Matters and Governmental Regulation
Our business and facilities are subject to a wide range of federal, state, local and foreign general and industry-specific environmental, health and safety laws and regulations, including those relating to air emissions, wastewater discharges, management and disposal of regulated materials and site remediation. Certain of our operations require environmental permits or other approvals from governmental authorities, and certain of these permits and approvals are subject to expiration, denial, revocation or modification under various circumstances. We are also subject to frequent inspections and monitoring by government enforcement authorities. Compliance with these laws, regulations, permits and approvals is a significant factor in our business. We incur, from time to time, and may incur in the future, significant capital and operating expenditures to achieve and maintain compliance with applicable environmental laws, regulations, permits and approvals. Our failure to comply with applicable environmental laws and regulations or permit or approval requirements could result in substantial civil or criminal fines or penalties or enforcement actions, including regulatory or judicial orders enjoining or curtailing operations or requiring remedial or corrective measures, installation of pollution control equipment or other actions or costs, which could have a material adverse effect on our business, financial condition and operating results.
In addition, as an owner and operator of real estate, we may be responsible under environmental laws and regulations for the investigation, remediation and monitoring, as well as associated costs, expenses and third-party damages, including tort liability and natural resource damages, relating to past or present releases or threats of releases of regulated materials at, on, under or from our properties. Liability under these laws may be imposed without regard to whether we knew of or were responsible for, the presence of those materials on our property, may be joint and several, meaning that the entire liability may be imposed on each party without regard to contribution, and retroactive and may not be limited to the value of the property. In addition, we or others may discover new material environmental liabilities, including liabilities related to third-party owned properties that we or our predecessors formerly owned or operated, or at which we or our predecessors have disposed of, or arranged for the disposal of, certain materials.
We may be involved in administrative or judicial proceedings and inquiries in the future relating to such environmental matters, which could have a material adverse effect on our business, financial condition and operating results.
New environmental laws or regulations (or changes in existing laws or regulations or their enforcement) may be enacted that require significant expenditures by us. If the resulting expenses significantly exceed our expectations, our business, financial condition and operating results could be materially and adversely affected.
We are also subject to various federal, state, local, and foreign requirements concerning safety and health conditions at our manufacturing facilities. We may also be subject to material financial penalties or liabilities for non-compliance with those safety and health requirements, as well as potential business disruption, if any of our facilities or a portion of any facility is required to be temporarily closed as a result of any significant injury or any non-compliance with applicable requirements. Such financial penalties or liabilities or business disruptions could have a material adverse effect on our business, financial condition and operating results.
Our manufacturing facilities are run in compliance with the rules and requirements set forth by the U.S. Food and Drug Administration and the U.S. Occupational Safety and Health Administration. We believe that our manufacturing facilities are in compliance, in all material respects, with these laws and regulations.
We are committed to ensuring that safe operating practices are established, implemented and maintained throughout our organization. In addition, we have instituted active health and safety programs throughout our company.
13
Available Information
The following information can be found, free of charge, on our corporate website at http://www.multipkg.com:
|
· |
our annual report on Form 10-K, quarterly reports on Form 10-Q, current reports on Form 8-K, and all amendments to those reports as soon as reasonably practicable after such material is electronically filed with or furnished to the Securities and Exchange Commission (“SEC”); |
|
· |
our policies related to corporate governance, including our Code of Conduct and Business Ethics (“Code of Ethics”) applying to our directors, officers and employees (including our principal executive officer and principal financial and accounting officer) that we have adopted to meet applicable rules and regulations; |
|
· |
the charters of the Audit, Compensation and Nominating and Corporate Governance Committees of our Board of Directors. |
In addition, copies of the Company’s annual report will be made available, free of charge, upon written request.
We intend to satisfy the applicable disclosure requirements regarding amendments to, or waivers from, provisions of our Code of Ethics by posting such information on our website. The information contained on our website or accessible through our website is not incorporated by reference into this Annual Report on Form 10-K and should not be considered part of this report.
Our business, operations and financial condition are subject to various risks and uncertainties. The most significant of these risks include those described below; however, there may be additional risks and uncertainties not presently known to us or that we currently consider immaterial. If any of the following risks and uncertainties develop into actual events, our business, financial condition or results of operations could be materially adversely affected. In such case, the trading price of our common shares could decline, and you may lose all or part of your investment. These risk factors should be read in conjunction with the other information in this Annual Report on Form 10-K and in the other documents that we file from time-to-time with the SEC.
We face competition in our markets, which may harm our financial performance and growth prospects.
We operate in a competitive market in which we face competition in each of our product lines from numerous competitors. We compete on the basis of product quality and reliability, breadth of product offering, manufacturing capability and flexibility, delivery times and range, technical capability, product innovation, customer service, price and completeness of order fulfillment. Certain of our competitors may have lower operating costs, greater operational flexibility, greater productive capacity, more financial flexibility and other resources that are greater than ours. We also face competition to a certain extent from companies that produce alternative products including plastic, board, paper, foil-based and other products that we do not currently offer. In addition, changes within the packaging industries, including the consolidation of our competitors, and consolidation of our customers, have occurred and may continue to occur. As a result of the foregoing factors, we may lose customers or be forced to reduce prices, which could have a material adverse effect on our business, financial condition and operating results. In addition, because of the level of fixed costs in our specialty print-based packaging business, our profitability is sensitive to changes in the balance between supply and demand in the specialty print-based packaging market. Competitors with lower operating costs than ours will have a competitive advantage over us with respect to products that are particularly price-sensitive. Increased production capacity within the industry could cause an oversupply resulting in lower prices, which could have a material adverse effect on our business, financial condition and operating results.
14
Our business performance may be impacted by general economic conditions, including downturns in the geographies and target markets that we serve.
The growth of our business and demand for our products is affected by changes in the health of the overall global economy and regional economies. Demand for our products is principally driven by consumer consumption of the products sold in the packages or with the inserts and labels we produce, which is affected by general economic conditions and changes in consumer preferences. Our primary end markets are consumer products, such as personal care, spirits, cosmetics and confectionary products, healthcare products, such as pharmaceuticals, medical devices, nutritional supplements and vitamins, and multi-media products, such as home videos, video games and software. Downturns or periods of economic weakness in these markets could result in decreased demand for our products. In general, our business may be adversely affected by decreases in the overall level of global economic activity, such as decreases in business and consumer spending. In particular, our business could be adversely affected by any economic downturn that results in difficulties for any of our major customers.
We may encounter difficulties in restructuring operations, closing facilities and disposing of assets and facilities.
We have closed facilities, sold assets and otherwise restructured operations in an effort to improve our cost competitiveness and profitability. Some of these activities are ongoing, and there is no guarantee that any such activities will not divert the attention of management or disrupt our operations or achieve the intended cost and operations improvements. These activities, and any future activities we may undertake, could have a material adverse effect on our business, financial condition and operating results.
If we are unable to successfully integrate our acquisitions and identify and integrate future acquisitions, our results of operations could be adversely affected.
We have completed a number of acquisitions, including the transformative combination with Chesapeake. We continue to integrate acquisitions into our business, but may not be able to do so successfully. Furthermore, we may seek to identify and complete additional acquisitions that meet our strategic and financial return criteria. However, there can be no assurance that we will be able to locate suitable targets or acquire them on acceptable terms or, because of limitations imposed by the agreements governing our indebtedness, that we will be able to finance future acquisitions. Acquisitions involve a number of risks, including risks related to:
|
· |
the diversion of management’s attention and resources to the assimilation of the acquired companies and their employees and to the management of expanding operations; |
|
· |
increased costs of integration activities; |
|
· |
disruption of our existing business operations; |
|
· |
the incorporation of acquired products into our current offerings; |
|
· |
problems associated with maintaining relationships with employees and customers of acquired businesses as a result of changes in ownership and management; |
|
· |
the increasing demands on our operational systems resulting from integration of the systems of acquired businesses; |
|
· |
the ability to integrate and implement effective disclosure controls and procedures and internal controls over financial reporting within the allowable timeframe; |
|
· |
possible adverse effects on our reported operating results, particularly during the first several reporting periods after such acquisitions are completed; and |
|
· |
the difficulty of converting acquired companies to our corporate culture and brands. |
We may become responsible for unanticipated liabilities and contingencies that we failed or were unable to discover in the course of performing due diligence in connection with historical acquisitions or any future acquisitions. We have typically required sellers to indemnify us against certain undisclosed liabilities. However, we cannot assure you that indemnification rights we have obtained, or will in the future obtain, will be enforceable, collectible or sufficient in amount, scope or duration to fully offset the possible liabilities associated with the business or property acquired. Any of these liabilities, individually or in the aggregate, could have a material adverse effect on our business, financial condition and results of operations.
15
In addition, we may not be able to successfully integrate future acquisitions without substantial costs, delays or other problems. The costs of such integration could have a material adverse effect on our operating results and financial condition. Although we conduct what we believe to be a prudent level of investigation regarding the businesses we purchase, in light of the circumstances of each transaction, an unavoidable level of risk remains regarding the actual condition of these businesses. Until we actually assume operating control of such businesses and their assets and operations, we may not be able to ascertain the actual value or understand the potential liabilities of the acquired entities and their operations.
We may not realize the growth opportunities and cost savings and synergies that are anticipated from our acquisitions and the other initiatives that we undertake.
The benefits that we expect to achieve as a result of our acquisitions will depend in part on our ability to realize anticipated growth opportunities and cost savings and synergies. Our success in realizing these opportunities and synergies and the timing of this realization depend on the successful integration of the acquired businesses and operations with our business and operations and the adoption of best practices. Even if we are able to integrate these businesses and operations successfully, this integration may not result in the realization of the full benefits of the growth opportunities and synergies we currently expect from this integration within the anticipated timeframe or at all. Accordingly, the benefits from these acquisitions may be offset by unanticipated costs or delays in integrating the companies.
Furthermore, we may not realize all of the cost savings and synergies we expect to achieve from our current strategic initiatives due to a variety of risks, including, but not limited to, difficulties in integrating shared services within our business, higher than expected employee severance or retention costs, higher than expected overhead expenses, delays in the anticipated timing of activities related to our cost savings plans and other unexpected costs associated with operating our business. If we are unable to achieve the cost savings or synergies that we expect to achieve from our strategic initiatives, or if the implementation of these initiatives adversely affect our operations or cost more or take longer to effectuate than we expect, it could adversely affect our business, financial condition and results of operations.
If we cannot effectively anticipate technology trends and develop and market new products to respond to changing customer preferences and regulatory environment, our revenue, earnings and cash flow could be adversely affected.
We are a specialty packaging company serving the consumer, healthcare and multi-media markets. Our success in these markets depends on our ability to offer differentiated solutions to capture market share and grow scale. To enable this, we must continually develop and introduce new products and services in a timely manner to keep pace with technological and regulatory developments and achieve customer acceptance. In addition, the services and products that we provide to customers may not meet the needs of our customers as the business models of our customers evolve. Our customers may decide to decrease their product packaging or forego the packaging of certain products entirely. Regulatory developments can also significantly alter the market for our solutions. For example, a move to electronic distribution of disclaimers and other paperless regimes could negatively impact our healthcare inserts and labels businesses. In addition, it is difficult to successfully predict the products and services our customers will demand. The success of our business depends in part on our ability to identify and respond promptly to changes in customer preferences, expectations and needs. If we do not timely assess and respond to changing customer expectations, preferences and needs, our financial condition, results of operations or cash flows could be adversely affected.
The impact of electronic media and similar technological changes, including the substitution of physical products for digital content, may continue to adversely affect sales in the multi-media end market.
The multi-media landscape is experiencing rapid change due to the impact of electronic media and digital content delivery on the demand for physical products. Improvements in the accessibility and quality of digital media through the online distribution and hosting of media content, pay-per-view and on-demand entertainment services and mobile technologies has resulted, and will likely continue to result, in increased digital substitution by consumers. Ongoing consumer acceptance of such digital media will result in a decrease in demand for physical music, video game and home video units. This will likely in turn decrease the demand for certain of our multi-media packaging solutions and consequently result in reduced pricing for our products, which could adversely affect our business, financial condition and results of operations. For example, our multi-media sales in North America would have declined in each of the two most recent fiscal years if not for the increased sales that resulted from the ASG acquisition.
16
We are affected by seasonality.
Historically, our business experiences some seasonal fluctuations, with a greater portion of our consumer and multi-media sales occurring in the first and second fiscal quarters, reflecting increased demand for our customers’ products during the holiday selling seasons. As a result of this seasonality, any factors negatively affecting us during these periods of any year, including unfavorable economic conditions, could have a material adverse effect on our financial condition and results of operations for the entire year.
Our operations could expose us to significant regulations and compliance expenditures as a result of environmental, health and safety laws.
Our business and facilities are subject to a wide range of federal, state, local and foreign general and industry-specific environmental, health and safety laws and regulations, including those relating to air emissions, wastewater discharges, management and disposal of regulated materials and site remediation. Certain of our operations require environmental permits or other approvals from governmental authorities, and certain of these permits and approvals are subject to expiration, denial, revocation or modification under various circumstances. We are also subject to frequent inspections and monitoring by government enforcement authorities. Compliance with these laws, regulations, permits and approvals is a significant factor in our business. From time to time we incur, and may in the future incur, significant capital and operating expenditures to achieve and maintain compliance with applicable environmental laws, regulations, permits and approvals. Our failure to comply with applicable environmental laws and regulations or permit or approval requirements could result in substantial civil or criminal fines or penalties or enforcement actions, including regulatory or judicial orders enjoining or curtailing operations or requiring remedial or corrective measures, installation of pollution control equipment or other actions or costs, which could have a material adverse effect on our business, financial condition and operating results.
In addition, as an owner and operator of real estate, we may be responsible under environmental laws and regulations for the investigation, remediation and monitoring, as well as associated costs, expenses and third-party damages, including tort liability and natural resource damages, relating to past or present releases or threats of releases of regulated materials at, on, under or from our properties. Liability under these laws may be imposed without regard to whether we knew of or were responsible for the presence of those materials on our property; may be joint and several, meaning that the entire liability may be imposed on each party without regard to contribution; and may be retroactive and may not be limited to the value of the property. In addition, we or others may discover new material environmental liabilities, including liabilities related to third-party owned properties that we or our predecessors formerly owned or operated, or at which we or our predecessors have disposed of, or arranged for the disposal of, certain regulated materials. We may be involved in administrative or judicial proceedings and inquiries in the future relating to such environmental matters, which could have a material adverse effect on our business, financial condition and operating results.
New environmental laws or regulations (or changes in existing laws or regulations or their enforcement) may be enacted that require significant expenditures by us. If the resulting expenses significantly exceed our expectations, our business, financial condition and operating results could be materially and adversely affected.
We are also subject to various federal, state, local and foreign requirements concerning safety and health conditions at our manufacturing facilities. The operation of manufacturing facilities involves many risks, including the failure or substandard performance of equipment, suspension of operations and new governmental statutes, regulations, guidelines and policies. Our and our customers’ operations are also subject to various hazards incidental to the production, use, handling, processing, storage and transportation of certain hazardous materials. These hazards can cause personal injury, severe damage to and destruction of property and equipment and environmental damage. Furthermore, we may become subject to claims with respect to workplace exposure, workers’ compensation and other matters. We may be subject to material financial penalties or liabilities for noncompliance with safety and health requirements, as well as potential business disruption, if any of our facilities or a portion of any facility is required to be temporarily closed as a result of any significant injury or any noncompliance with applicable requirements.
The occurrence of material operational problems, including, but not limited to, the above events, could have a material adverse effect on our business, financial condition and results of operations.
17
A significant part of our business is conducted outside of the United States, exposing us to additional risks that may not exist in the United States, which in turn could cause our business and operating results to suffer.
We have material operations outside of the United States. For fiscal 2016, approximately 58% of our total net sales were generated from sales outside of the United States. Our international operations are subject to risks, including risks related to:
|
· |
foreign currency exchange rate fluctuations, including devaluations; |
|
· |
local political or economic instability, including local inflationary pressures; |
|
· |
restrictive government regulation, including changes in governmental regulation; |
|
· |
changes in import/export duties; |
|
· |
changes in laws and policies, including the laws and policies of the United States, affecting trade and foreign investment; |
|
· |
lack of experience in certain foreign markets; |
|
· |
difficulties and costs of staffing and managing operations in certain foreign countries; |
|
· |
work stoppages or other changes in labor conditions in foreign jurisdictions, which tend to have more expansive legal rights for labor unions and works councils; |
|
· |
difficulties in enforcing agreements and collecting accounts receivables on a timely basis or at all; and |
|
· |
adverse tax consequences or overlapping tax structures. |
We plan to continue to market and sell our products internationally to respond to customer requirements and market opportunities. Establishing operations in any foreign country or region presents risks such as those described above, as well as risks specific to the particular country or region. In addition, until a payment history is established over time with customers in a new geographic area or region, the likelihood of collecting receivables generated by such operations could be less than our expectations. As a result, there is a greater risk that the reserves set with respect to the collection of such receivables may be inadequate. If our operations in any foreign country are unsuccessful, we could incur significant losses and we may not be profitable.
In addition, changes in policies or laws of the United States or foreign governments resulting in, among other things, changes in regulations and the approval process, higher taxation, currency conversion limitations, restrictions on fund transfers or the expropriation of private enterprises, could reduce the anticipated benefits of our international expansion. For example, this includes the uncertainty surrounding the implementation and effect of “Brexit,” including changes to the legal and regulatory framework that apply to the United Kingdom and its relationship with the European Union. See “—The results of the United Kingdom’s referendum on withdrawal from the European Union may have a negative effect on global economic conditions, financial markets and our business, which could reduce the price of our common shares.” If we fail to realize the anticipated revenue growth of our future international operations, our business and operating results could suffer.
Currency risk may adversely affect our financial condition and cash flows.
A substantial portion of our revenues are derived from outside the United States. We anticipate that revenues from international customers will continue to represent a substantial portion of our revenues for the foreseeable future. Because we generate revenues in foreign currencies, we are subject to the effects of exchange rate fluctuations. For the preparation of our consolidated financial statements, the financial results of our foreign subsidiaries are translated into U.S. dollars using average exchange rates during the applicable period. If the U.S. dollar appreciates against the foreign currencies, as has occurred in recent months, the revenues we recognize from sales by certain of our subsidiaries and the value of balance sheet items denominated in foreign currencies will be adversely impacted.
Furthermore, many of our foreign operations import or buy raw materials in a currency other than their functional currency, which can impact the operating results for these operations if we are unable to mitigate the impact of the currency exchange fluctuations. We may not be successful in achieving natural balances in currencies throughout our international operations. In addition, if the effective price of our products were to increase as a result of fluctuations in foreign currency exchange rates, demand for our products could decline and adversely affect our results of operations and financial condition. We cannot accurately predict the effects of exchange rate fluctuations upon our future operating results because of the number
18
of currencies involved, the variability of currency exposures and the potential volatility of currency exchange rates. Additionally, there has been, and may continue to be, volatility in currency exchange rates as a result of the United Kingdom’s June 23, 2016 referendum in which voters approved the United Kingdom’s exit from the European Union, commonly referred to as “Brexit.” See “—The results of the United Kingdom’s referendum on withdrawal from the European Union may have a negative effect on global economic conditions, financial markets and our business, which could reduce the price of our common shares.” Accordingly, fluctuations in foreign exchange rates may have an adverse effect on our financial condition and cash flows.
The results of the United Kingdom’s referendum on withdrawal from the European Union may have a negative effect on global economic conditions, financial markets and our business, which could reduce the price of our common shares.
We are a multinational company with worldwide operations, including material business operations in Europe. In June 2016, a majority of voters in the United Kingdom elected to withdraw from the European Union in a national referendum. The referendum was advisory, and the terms of any withdrawal are subject to a negotiation period that could last at least two years after the government of the United Kingdom formally initiates a withdrawal process. Nevertheless, the referendum has created significant uncertainty about the future relationship between the United Kingdom and the European Union, and has given rise to calls for the governments of other European Union member states to consider withdrawal.
These developments, or the perception that any of them could occur, have had and may continue to have a material adverse effect on global economic conditions and the stability of global financial markets, and could significantly reduce global market liquidity and restrict the ability of key market participants to operate in certain financial markets. Asset valuations, currency exchange rates and credit ratings may be especially subject to increased market volatility. Lack of clarity about future United Kingdom laws and regulations as the United Kingdom determines which European Union laws to replace or replicate in the event of a withdrawal, such as financial laws and regulations, tax and free trade agreements, intellectual property rights, supply chain logistics, environmental, health and safety laws and regulations, immigration laws and employment laws, could decrease foreign direct investment in the United Kingdom, increase costs, depress economic activity and restrict our access to capital. If the United Kingdom and the European Union are unable to negotiate acceptable withdrawal terms or if other European Union member states pursue withdrawal, barrier-free access between the United Kingdom and other European Union member states or among the European economic area overall could be diminished or eliminated. Any of these factors could have a material adverse effect on our business, financial condition and results of operations and reduce the price of our common shares.
Our largest customers together have historically accounted for a significant portion of our net sales volume. Accordingly, our business may be adversely affected by the loss of, or reduced purchases by, one or more of our large customers.
For fiscal 2016, our largest single customer accounted for 4% of our net sales and our top ten customers accounted for approximately 25% of our net sales. On occasion, a customer may relocate where certain of its products are manufactured to a location which we are not able to serve, resulting in the loss of business. If, for this or any other reason, one of our key customers were to purchase significantly less of our products in the future or were to terminate its purchases from us, and we are not able to sell our products to new customers at comparable or greater levels, it could have a material adverse effect on our business, prospects, financial condition and results of operations.
Our business may suffer if we are unable to attract and retain key personnel.
We depend on the members of our management team and other key personnel. These employees have industry experience and relationships that we rely on to successfully implement our business plan. The loss of the services of our management team and/or other key personnel or the lack of success in attracting or retaining new and/or replacement personnel could have a material adverse effect on our business, financial position and results of operations.
19
Increased information technology security threats and more sophisticated and targeted cybercrime could pose a risk to our systems, networks, products, solutions and services.
Increased global security threats and more sophisticated and targeted cybercrime pose a risk to the security of our systems and networks and the confidentiality, availability and integrity of our data. While we attempt to mitigate these risks by employing a number of measures, including employee training, comprehensive monitoring of our networks and systems and maintenance of backup and protective systems, our systems, networks, products, solutions and services remain potentially vulnerable to advanced persistent threats. Depending on their nature and scope, such threats could potentially lead to the compromise of confidential information, improper use of our systems and networks, manipulation and destruction of data, defective products, production downtimes and operational disruptions, which in turn could adversely affect our reputation, competitiveness and results of operations.
Our business and financial performance may be harmed by future increases in raw material costs.
Our business requires various raw materials which are purchased from third-party suppliers. These materials include paperboard, foils, inks, adhesives, coatings, resins, films, waxes, other chemicals and packaging supplies. The costs of these materials are subject to market fluctuations that are beyond our control. Future market conditions and/or the terms of our contracts with customers may prevent us from passing on raw material cost increases to our customers through selling price increases. In addition, we may not be able to achieve manufacturing productivity gains or other cost reductions to offset the impact of rising raw material cost. As a result, higher raw material costs may have a material adverse effect on our business, financial condition and operating results.
Unforeseen or recurring operational problems at any of our facilities may cause significant lost production.
Our manufacturing process could be affected by operational problems that could impair our production capability. Each of our facilities contains complex and sophisticated machines that are used in our manufacturing process. Disruptions or shutdowns at any of our facilities could be caused by:
|
· |
outages to conduct maintenance activities that cannot be performed safely during operations; |
|
· |
prolonged power failures or reductions, including the effect of lightning strikes on our electrical supply; |
|
· |
breakdown, failure or substandard performance of any of our presses, diecutters and print and packaging-related machinery or other equipment; |
|
· |
noncompliance with material environmental requirements or permits; |
|
· |
disruptions in the transportation infrastructure, including railroad tracks, bridges, tunnels or roads; |
|
· |
fires, floods, earthquakes, tornadoes, hurricanes, significant winter storms or other catastrophic disasters; or |
|
· |
other operational problems. |
If our facilities are shut down, they may experience delays due to startup periods, regardless of the reason for the shutdown. Those startup periods could range from several days to several weeks or longer, depending on the reason for the shutdown and other factors. Any prolonged disruption in operations at any of our facilities could cause significant lost production, which would have a material adverse effect on our business, financial condition and operating results. To avoid such disruptions, we may also be required to incur substantial costs in keeping our facilities in good operating condition.
Labor disputes or increased labor costs could materially adversely affect our operating results.
As of June 30, 2016, we employed approximately 8,700 people, of which approximately 3,200 are located in North America, 4,500 are located in Europe and 1,000 are located in Asia. The majority of our workforce is non-union; however, we do participate in some collective bargaining agreements with various unions, which provide specified benefits to certain union employees, and certain of our employees in foreign jurisdictions are represented by works councils. Approximately 8% of our employees in North America are unionized and approximately 75% of our employees in Europe are members of a union or works council or otherwise covered by labor agreements. The labor agreements with our North American unions are set to expire in 2017, at which time we expect to negotiate a renewal of such agreements. To date, we have not experienced a stoppage in work or poor labor relations at any of our facilities. Management believes that our relations with our employees are good; however, as these labor contracts expire, there can be no assurances that there will be no strikes, work stoppages or other labor disputes as we negotiate new or renewed contracts. Any significant work stoppages or any
20
significant increase in labor costs could have a material adverse effect on our business, financial condition and operating results.
Failure of quality control measures and systems resulting in faulty or contaminated product could have a material adverse effect on our business.
We have quality control measures and systems in place to ensure the maximum safety and quality of our products. The consequences of a product not meeting these standards due to, among other things, accidental or malicious raw materials contamination or supply chain contamination caused by human error or equipment fault, could be severe. Such consequences might include adverse effects on consumer health, litigation exposure, loss of market share, financial costs and loss of revenues.
In addition, if our products fail to meet our usual standards, we may be required to incur substantial costs in taking appropriate corrective action (up to and including recalling products from end consumers) and to reimburse customers and/or end consumers for losses that they suffer as a result of this failure. Customers and end consumers may seek to recover these losses through litigation and, under applicable legal rules, may succeed in any such claim despite there being no negligence or other fault on our part. Placing an unsafe product on the market, failing to notify the regulatory authorities of a safety issue, failing to take appropriate corrective action and failing to meet other regulatory requirements relating to product safety could lead to regulatory investigation, enforcement action and/or prosecution. Any product quality or safety issue may also result in adverse publicity, which may damage our reputation. This could in turn have a material adverse effect on our business, financial condition and results of operations. Although we have not had material claims for damages for defective products in the past and have not conducted any substantial product recalls or other material corrective action in recent years, these events may occur in the future.
In certain contracts, we provide guarantees that our products are produced in accordance with customer specifications regarding the proper functioning of our products and the conformity of a product to the specific use defined by the customer. In addition, if the product contained in packaging manufactured by us is faulty or contaminated, it is possible that the manufacturer of the product in question may allege that the packaging we provided is the cause of the fault or contamination, even if the packaging complies with contractual specifications. If packaging produced by us fails to open properly or to preserve the integrity of its contents, we could face liability to our customers and to third parties for bodily injury or other tangible or intangible damages suffered as a result. Such liability, if it were to be established in relation to a sufficient volume of claims or to claims for sufficiently large amounts, could have a material adverse effect on our business, financial condition and results of operations.
The occurrence or threat of extraordinary events, including natural disasters and domestic and international terrorist attacks, may disrupt our operations and decrease demand for our products.
Natural disasters and other weather-related disruptions and domestic and international terrorist attacks could affect our ability to sell to our customers by impacting many of our customers and our suppliers of certain raw materials, which would have an adverse impact on volume and cost for some of our products. If natural disasters or terrorist attacks occur in the future, they could negatively affect the results of operations in the affected regions, as well as have adverse impacts on the global economy.
Our energy or transportation costs may be higher than we anticipated, which could have a material adverse effect on our business, financial condition and operating results.
Energy, including energy sourced from coal, diesel fuel, electricity and natural gas, represents a significant portion of our manufacturing costs. Energy costs have fluctuated significantly and such fluctuations have primarily impacted us in the logistics processes, with a more minor impact on manufacturing costs. In addition, we distribute our products primarily by truck and rail. Reduced availability of trucks or rail cars could negatively impact our ability to ship our products in a timely manner. There can be no assurance that we will be able to recoup any increases in transportation rates or fuel surcharges through price increases for our products. If energy or transportation costs are greater than anticipated, our business, financial condition and operating results may be materially adversely affected.
If we are unable to develop product innovations and improve our production technology and expertise, we could lose customers or market share.
21
Our success may depend on our ability to adapt to technological changes in the specialty print-based packaging industry. If we are unable to develop and introduce new products on a timely basis, or enhance existing products, in response to changing market conditions or customer requirements or demands, our business, financial condition and operating results could be materially adversely affected.
We are subject to litigation in the ordinary course of business, and uninsured judgments or a rise in insurance premiums may adversely impact our results of operations.
In the ordinary course of business, we are subject to various claims and litigation, including actions brought against us by our employees. Any such claims, regardless of merit, could be time-consuming and expensive to defend and could divert management’s attention and resources. For instance, in our healthcare end market, we print information on our labels, inserts and packages that, if incorrect, could give rise to product liability claims.
In accordance with customary practice, we maintain insurance against some, but not all, of these potential claims. We may elect not to obtain insurance if we believe that the cost of available insurance is excessive relative to the risks presented. The levels of insurance we maintain may not be adequate to fully cover any and all losses or liabilities. Further, we may not be able to maintain insurance at commercially acceptable premium levels or at all.
If any significant accident, judgment, claim (or a series of claims) or other event is not fully insured or indemnified against, it could have a material adverse impact on our business, financial condition and results of operations. There can be no assurance as to the actual amount of these liabilities or the timing thereof. We cannot be certain that the outcome of current or future litigation will not have a material adverse impact on our business and results of operations.
Our total assets include substantial amounts of goodwill and intangible assets and an impairment of our goodwill or intangible assets could adversely affect our results of operations.
Goodwill and intangible assets represented approximately 47% of our total assets as of June 30, 2016. We evaluate our goodwill for impairment on an annual basis and at other times during the year if events or circumstances indicate that it is more likely than not that the fair value is below the carrying value. We evaluate intangible assets for impairment when facts or circumstances suggest that the carrying value of these assets may not be recoverable. Our evaluation of impairment requires us to make certain estimates and assumptions, including projections of future results. Such estimates and assumptions may not prove to be accurate in the future. After performing our evaluation for impairment, including an analysis to determine the recoverability of intangible assets, we will record a noncash impairment loss when the carrying value of the underlying asset, asset group or reporting unit exceeds its fair value. If these impairment losses are significant, our results of operations could be adversely affected.
Our business operations are subject to a number of U.S. federal laws and regulations, including trade sanctions administered by the Office of Foreign Assets Control of the U.S. Department of Treasury and the U.S. Department of Commerce, as well as restrictions imposed by the Foreign Corrupt Practices Act, which could adversely affect our operations if violated.
We must comply with all applicable export control laws and regulations of the United States and other countries. We cannot provide products or services to certain countries or individuals subject to U.S. trade sanctions administered by the Office of Foreign Assets Control of the U.S. Department of the Treasury or the U.S. Department of Commerce. In addition, we are subject to the Foreign Corrupt Practices Act and the anti-corruption laws of other countries, which generally prohibit bribes of anything of value, including unreasonable gifts, to government officials. While we have implemented safeguards and policies designed to promote compliance with applicable laws, these safeguards and policies may prove to be less than effective, and our employees or agents may engage in conduct for which we might be held responsible. Violations of these laws or regulations could result in significant sanctions including fines, onerous compliance requirements, the denial of export privileges, reputational damage and loss of authorizations needed to conduct aspects of our international business, which could adversely affect our business, financial condition and results of operations.
Existing and proposed regulations to address climate change by limiting greenhouse gas emissions may cause us to incur significant additional operating and capital expenses.
22
Certain of our operations result in emissions of greenhouse gases (“GHG”), such as carbon dioxide and methane. Growing concern about the sources and impacts of global climate change has led to a number of national and supranational legislative and administrative measures, both proposed and enacted, to monitor, regulate and limit carbon dioxide and other GHG emissions, including in the United States, the European Union and China. Such measures, for example, could adversely affect our energy supply, or the costs (and types) of raw materials we use for fuel, or impose costs on us associated with GHG emissions resulting from our operations. Although we believe it is likely that GHG emissions will continue to be regulated in the United States, the European Union, China and elsewhere in the future, we cannot yet predict the form such regulation will take (such as a cap-and-trade program, technology mandate, emissions tax or other regulatory mechanism) or, consequently, estimate the direct or indirect financial impact to our business.
We are exposed to risks in connection with the funding of our pension commitments.
We operate various defined benefit pension plans (collectively, the “DB Plans”) in the United Kingdom: the Field Group Pension Plan (“FGPP”), the Chesapeake Pension Plan (“CPP”) and the GCM Retirement Benefits Scheme (“GCM”). Additionally, certain other smaller defined benefit plans are operated at the Company’s subsidiaries in continental Europe. As of June 30, 2016, the total overfunded status of our pension plans on a U.S. GAAP basis was $16.8 million.
An actuarial valuation of the FGPP as of October 31, 2014 calculated that the FGPP’s scheme-specific funding deficit for local statutory purposes was £12.9 million. Currently, monthly deficit contribution payments of £0.5 million per month are being made to the FGPP to address this deficit. It has been agreed with the trustees of the FGPP that following the August 2016 payment of £0.5 million, no further deficit reduction contribution payments will be made to the FGPP until the FGPP’s next actuarial valuation. As discussed further below, employer contributions to help fund the ongoing accrual of benefits in the FGPP will continue to be made.
Contributions to the DB Plans are payable in accordance with the schedule of contributions and the recovery plans which are separately in place in respect of all three arrangements (except that the FGPP’s current recovery plan will fall away from September 2016, as discussed above). Although closed to new entrants, all of the DB Plans are currently open to future benefit accrual and the contribution rates payable by the company to the DB Plans reflect this in order to help fund those future accrual benefits. The contribution rates also take account of the deficits, where applicable, in each of the DB Plans to seek to make good those funding shortfalls within the timeframes specified in the recovery plans.
Should a wind-up trigger or insolvency event occur in relation to the DB Plans, the buy-out deficit will become due and payable by the employers. The actuarial valuation of the FGPP as of October 31, 2014 discussed above calculated that the buy-out deficit of the FGPP was £150.1 million ($201.1 million at current period-end exchange rates). The buy-out deficit was £21.5 million ($28.8 million) as of April 5, 2013 for the CPP and was £3.6 million ($4.8 million) as of February 1, 2013 for the GCM. Unless any future security is granted to the trustees of any of the three plans, those debts would rank as unsecured if the participating employers in any of the three plans became insolvent in the future.
Although the trustees of the DB Plans currently have no guarantees or other security in relation to the funding obligations owed to each of the DB Plans, if our leverage ratio reaches a particular level in the future, the trustees have an entitlement to be given a parent company guarantee to cover contributions due under the current recovery plans to fund the DB Plans up to the scheme-specific funding level basis.
Our defined benefit pension plan obligations are financed predominantly through externally invested pension plan assets via externally managed funds and insurance companies. The values attributable to the externally invested pension plan assets are subject to fluctuations in the capital markets that are beyond our influence. Unfavorable developments in the capital markets could result in a substantial coverage shortfall for these pension obligations, resulting in a significant increase in our net pension obligations. In addition, deterioration in our financial condition could lead to an increased funding commitment to the trustees, which could further exacerbate any financial difficulties we could face at such time. Any such increases in our net pension obligations could adversely affect our financial condition due to increased additional outflow of funds to finance the pension obligations. Also, we are exposed to risks associated with longevity and interest rate and inflation rate changes in connection with our pension commitments, as an interest rate increase or decrease in longevity could have an adverse effect on our liabilities under these pension plans. Furthermore, a strengthening of the regulatory funding regime could increase requirements for cash funding, demanding more financial resources to meet governmentally mandated pension requirements. The realization of any of these risks could require us to make significant
23
additional payments to meet our pension commitments, which could have a material adverse effect on our business, financial condition and results of operations.
The Pensions Regulator in the United Kingdom has the statutory power in certain circumstances to issue contribution notices or financial support directions which, if issued, could result in significant liabilities arising for us.
Under the Pensions Act 2004, the Pensions Regulator in the United Kingdom may issue a contribution notice to any employer in the DB Plans or any person who is connected with or is an associate of any employer in any of those plans where the Pensions Regulator is of the opinion that the relevant person has been a party to an act, or a deliberate failure to act, which had as its main purpose (or one of its main purposes) the avoidance of pension liabilities. Under the Pensions Act 2008, the Pensions Regulator has been granted the power to issue a contribution notice if it is of the opinion that the relevant person has been a party to an act, or a deliberate failure to act, which has a materially detrimental effect on a pension plan without sufficient mitigation having been provided. The Pensions Regulator can only issue a contribution notice where it believes it is reasonable to do so and can generally only do so in respect of any act or failure to act which has taken place in the previous six years.
The terms “associate” and “connected person,” which are taken from the Insolvency Act 1986, are widely defined and could cover our significant shareholders and others deemed to be shadow directors.
If the Pensions Regulator considers that any of the employers participating in the DB Plans are “insufficiently resourced” or a “service company,” it may impose a financial support direction requiring us or any member of the Group, or any person associated or connected with that employer, to put in place financial support in relation to the relevant plan. The Pensions Regulator can only issue a financial support direction where it believes it is reasonable to do so and can generally only do so in respect of circumstances which have occurred in the previous two years.
Liabilities imposed under a contribution notice or financial support direction may be up to the amount of the buy-out deficit in the relevant DB Plan.
Regulations related to conflict minerals could adversely impact our business.
The Dodd-Frank Wall Street Reform and Consumer Protection Act contains provisions to improve transparency and accountability concerning the supply of certain minerals, known as conflict minerals, originating from the Democratic Republic of Congo (the “DRC”) and adjoining countries. As a result, in August 2012 the SEC adopted annual disclosure and reporting requirements for those companies who use conflict minerals mined from the DRC and adjoining countries in their products. Because certain of our products include tin, these new requirements will require due diligence efforts this year, with initial disclosure requirements beginning in 2018. There will be costs associated with complying with these disclosure requirements, including for diligence of our suppliers to determine the sources of conflict minerals used in our products and, if applicable, a third-party audit of our diligence process, and other potential changes to products, processes or sources of supply as a consequence of such verification activities. The implementation of these rules could adversely affect the sourcing, supply and pricing of materials used in our products. As there may be only a limited number of suppliers offering “conflict free” conflict minerals, we cannot be sure that we will be able to obtain necessary conflict minerals from such suppliers in sufficient quantities or at competitive prices. Conversely, we will be required to make similar certifications to our suppliers. If we are unable or fail to make the requisite certifications, our suppliers may terminate their relationship with us. Also, we may face adverse effects to our reputation if we determine that certain of our products contain minerals not determined to be “conflict free” or if we are unable to sufficiently verify the origins for all conflict minerals used in our products through the procedures we may implement.
24
We may not be successful in acquiring and protecting our intellectual property rights or in avoiding claims that we infringed on the intellectual property rights of others.
Our ability to develop, acquire, and retain necessary intellectual property rights is important to our continued success and competitive position. If we were unable to protect our existing intellectual property rights, develop new rights, or if others developed similar or improved technologies there can be no assurance that such events would not be material to our results of operations, financial condition or cash flows. Some of our business depends in part on our ability to obtain, or license from third parties, patents, trademarks, trade secrets and similar proprietary rights without infringing on the proprietary rights of third parties. Although we believe our intellectual property rights are sufficient to allow us to conduct our business without incurring liability to third parties, our products may infringe on the intellectual property rights of such persons. Furthermore, no assurance can be given that we will not be subject to claims asserting the infringement of the intellectual property rights of third parties seeking damages, the payment of royalties or licensing fees and/or injunctions against the sale of our products. Any such litigation, regardless of merit, could be protracted and costly and could have a material adverse effect on our business, financial condition and results of operations.
We may be subject to increased income taxes, and other restrictions and limitations, if we were to decide to repatriate any of our income, capital or cash to the United States or other jurisdictions.
Government regulations and restrictions in some countries may limit the amount of income, capital or cash that may be distributed or otherwise transferred to other jurisdictions. For example, the transfer of income, capital or cash from one country to another is often subject to restrictions such as the need for certain governmental consents. Even where there is no outright restriction, the mechanics of repatriation or, in certain countries, the lack of the availability of foreign currency (such as U.S. dollars) to non-governmental entities, may affect certain aspects of our operations. In the event we need to repatriate our non-U.S. income, capital or cash from a particular country to fund operations in another part of the world, we may need to repatriate some of our non-U.S. cash balances out of the country where they are located to another jurisdiction and we may be subject to additional income taxes in the jurisdiction receiving the cash. Any of these scenarios may subject us to costs, restrictions and/or limitations that result in us being unable to use our cash in the manner we desire, which may have a material adverse effect on our results of operations and financial condition.
Our status as a foreign corporation for U.S. federal tax purposes could be affected by IRS action or a change in U.S. tax law.
On February 14, 2014, Chesapeake, a corporation organized under the laws of England and Wales, completed the acquisition of Mustang, a Delaware corporation, in exchange for a 50% equity interest in Chesapeake. Chesapeake subsequently changed its name to Multi Packaging Solutions Global Holdings Limited and on October 7, 2015 became a wholly owned subsidiary of MPS Limited. A corporation is generally considered a tax resident in the jurisdiction of its organization or incorporation for U.S. federal income tax purposes. Because MPS Limited is a Bermuda incorporated entity, it would generally be classified as a foreign corporation under these rules. Section 7874 of the U.S. Internal Revenue Code of 1986, as amended (the “Code”), provides an exception to this general rule, however, under which a foreign incorporated entity may, in certain circumstances, be treated as a U.S. corporation for U.S. federal tax purposes. The Company believes that it (and, prior to the Reorg Transactions, MPS Holdings) has satisfied the requirements under Section 7874 of the Code to be treated as a foreign corporation, taking into account any impact of both the Mustang acquisition and the Reorg Transactions in the analysis. There is limited guidance, however, regarding the application of Section 7874 of the Code. As a consequence, there can be no assurance that the IRS will agree with the position that the Company has satisfied the requirements under Section 7874 of the Code to be treated as a foreign corporation or that the IRS will not otherwise challenge the Company’s status as a foreign corporation. If such a challenge by the IRS were successful, significant adverse tax consequences would result for the Company. Further, recent legislative and administrative proposals have addressed Section 7874 of the Code, some of which, if enacted, could have prospective or retroactive application to the Company, its shareholders and affiliates. Consequently, there can be no assurance that there will not exist in the future a change in law that might cause the Company to be treated as a domestic corporation for U.S. federal income tax purposes, including with retroactive effect. If such a change in law were implemented, significant adverse tax consequences would result for the Company.
25
We have substantial debt, which could adversely affect our financial health and our ability to obtain financing in the future, react to changes in our business and meet our obligations with respect to our indebtedness.
As of June 30, 2016, we had approximately $907.8 million of indebtedness, net of discount and issuance costs, on a consolidated basis, including $196.7 million of 8.500% senior unsecured notes due 2021 (the “Notes”) and $708.2 million of the Term Loans (as defined below). In addition, we had $48.8 million in borrowing capacity under our U.S. dollar revolving credit facility and £50.0 million ($67.0 million at period-end exchange rates) in borrowing capacity available under our Pounds Sterling revolving credit facility. As of June 30, 2016, we had $1.2 million of outstanding letters of credit under our U.S. dollar revolving credit facility.
Our substantial debt could have important consequences to you. Because of our substantial debt:
|
· |
it may be more difficult for us to satisfy our obligations to our lenders and creditors, resulting in possible defaults on and acceleration of such debt; |
|
· |
our ability to make loans and investments or engage in acquisitions without issuing additional equity or obtaining additional debt financing may be impaired in the future; |
|
· |
our ability to obtain additional financing with reasonable terms and conditions for working capital, capital expenditures, acquisitions, debt service requirements or general corporate purposes may be impaired in the future; |
|
· |
a substantial portion of our cash flow from operations must be dedicated to the payment of principal and interest on our debt, thereby reducing the funds available to us for other purposes; |
|
· |
we are exposed to the risk of increased interest rates as, over the term of our debt, the interest cost on a significant portion of our indebtedness is subject to changes in interest rates; |
|
· |
we may be more vulnerable to general adverse economic and industry conditions; |
|
· |
we may be at a competitive disadvantage compared to our competitors who have less debt or comparable debt at more favorable interest rates and who, as a result, may be better positioned to withstand economic downturns or to finance capital expenditures or acquisitions; |
|
· |
our costs of borrowing may increase; |
|
· |
we may be unable to refinance our debt on terms as favorable as our existing debt or at all; and |
|
· |
our flexibility to adjust to changing market conditions and our ability to withstand competitive pressures could be limited, or we may be prevented from carrying out capital spending that is necessary or important to our growth strategy and efforts to improve the operating margins of our businesses. |
Despite our current indebtedness level, we and our subsidiaries may be able to incur substantially more debt, which could further exacerbate the risks associated with our substantial indebtedness.
We and our subsidiaries may be able to incur substantial additional indebtedness in the future. Subject to certain limitations, the credit agreement governing our senior secured credit facilities and the indenture governing our Notes do not prohibit us or our subsidiaries from incurring additional indebtedness. In addition, the credit agreement governing our senior secured credit facilities and the indenture governing our Notes also permit us, our subsidiaries or our parents to accrue interest, accrue accreted value, accrue amortization of original issue discount and pay interest or dividends in the form of additional indebtedness. The restrictions on the incurrence of additional indebtedness are subject to a number of thresholds, qualifications and exceptions, and the additional indebtedness incurred in compliance with these restrictions could be substantial. Additionally, these restrictions also will not prevent us from incurring obligations that, although preferential to our common shares in terms of payment, do not constitute indebtedness. In addition, as of June 30, 2016 we had $48.8 million of borrowing capacity available under our U.S. dollar revolving credit facility and £50.0 million ($67.0 million at period-end exchange rates) of borrowing capacity available under our Pounds Sterling revolving credit facility. As of June 30, 2016 we had $1.2 million of outstanding letters of credit under our U.S. dollar revolving credit facility.
If new debt is added to our or our subsidiaries’ current debt levels, the related risks that we now face would increase, and we may not be able to meet all our debt obligations. See “Management’s Discussion and Analysis of Financial Condition and Results of Operations—Liquidity and Capital Resources.”
The agreements and instruments governing our debt contain restrictions and limitations that could significantly impact our management’s flexibility or our financial and operational flexibility to operate our business and could adversely affect you.
26
The credit agreement governing our senior secured credit facilities and/or the indenture governing our Notes contain, and certain of our current or future rollover foreign debt facilities may contain, covenants that, among other things, restrict our ability to:
|
· |
dispose of assets, including capital stock of our subsidiaries; |
|
· |
incur additional indebtedness (including guarantees of additional indebtedness); |
|
· |
prepay other indebtedness or amend other debt instruments; |
|
· |
pay dividends or redeem, repurchase or retire our capital stock or our other indebtedness and make certain payments; |
|
· |
create restrictions on the payment of dividends or other amounts to us from our restricted subsidiaries that are not guarantors; |
|
· |
create liens on assets; |
|
· |
enter into sale and leaseback transactions; |
|
· |
engage in certain asset sales, mergers, acquisitions, consolidations or sales of all or substantially all of our assets; |
|
· |
engage in certain transactions with affiliates; |
|
· |
permit restrictions on our subsidiaries’ ability to pay dividends; |
|
· |
change our business; |
|
· |
consolidate, merge, sell or otherwise dispose of all or substantially all of our assets; |
|
· |
enter into transactions with our affiliates; |
|
· |
designate our subsidiaries as unrestricted subsidiaries; and |
|
· |
make loans and investments (including joint ventures). |
The restrictions in the credit agreement governing our senior secured credit facilities, the indenture governing the Notes and rollover foreign debt facilities may prevent us from taking actions that we believe would be in the best interests of our business and may make it difficult for us to execute our business strategy successfully or effectively compete with companies that are not similarly restricted. We may also incur future debt obligations that might subject us to additional restrictive covenants that could affect our financial and operational flexibility.
Our ability to comply with the covenants and restrictions contained in the credit agreement governing our senior secured credit facilities, the indenture governing the Notes and our rollover foreign debt facilities may be affected by economic, financial and industry conditions beyond our control. The breach of any of these covenants or restrictions could result in a default under the credit agreement governing our senior secured credit facilities, the indenture governing the Notes and our rollover foreign debt facilities that would permit the applicable lenders or noteholders, as the case may be, to declare all amounts outstanding thereunder to be due and payable, together with accrued and unpaid interest. In addition, such a default or acceleration may result in the acceleration of any other debt to which a cross-acceleration or cross-default provision applies. If we are unable to repay debt, lenders having secured obligations, such as the lenders under our senior secured credit facilities and our rollover foreign debt facilities, could proceed against the collateral securing the debt. In any such case, we may be unable to borrow under our senior secured credit facilities and our rollover foreign debt facilities and may not be able to repay the amounts due under our senior secured credit facilities, our rollover foreign debt facilities or the Notes. This could have serious consequences to our financial condition and results of operations and could cause us to become bankrupt or insolvent.
We are dependent upon our lenders for financing to execute our business strategy and meet our liquidity needs. If our lenders are unable or unwilling to fund borrowings under their credit commitments or we are unable to borrow, it could negatively impact our business.
During periods of volatile credit markets, there is risk that any lenders, even those with strong balance sheets and sound lending practices, could fail or refuse to honor their legal commitments and obligations under existing credit commitments, including but not limited to extending credit up to the maximum permitted by a credit facility. If our lenders are unable or unwilling to fund borrowings under their revolving credit commitments or we are unable to borrow, it could be difficult in such environments to obtain sufficient liquidity to meet our operational needs.
Our ability to obtain additional capital on commercially reasonable terms may be limited.
27
Although we believe our cash and cash equivalents, together with cash we expect to generate from operations and availability under our revolving credit facility, provide adequate resources to fund ongoing operating requirements, we may need to seek additional financing to compete effectively.
If we are unable to obtain capital on commercially reasonable terms, or at all, it could:
|
· |
reduce funds available to us for purposes such as working capital, capital expenditures, research and development, strategic acquisitions and other general corporate purposes; |
|
· |
restrict our ability to introduce new products or exploit business opportunities; and |
|
· |
increase our vulnerability to economic downturns and competitive pressures in the markets in which we operate, |
any and all of which could place us at a competitive disadvantage.
Certain of our indebtedness bears interest at variable rates and/or is denominated in a foreign currency, which subjects us to interest rate risk and foreign exchange risk, each of which could cause our debt service obligations to increase significantly.
Borrowings outstanding for our term loans under our senior secured credit facilities as of June 30, 2016 totaled $708.2 million, which is net of discount and issuance costs, and subject us to exposure to variable rates of interest and foreign exchange rate fluctuations. If interest rates increase, our debt service obligations on the variable rate indebtedness will increase even if the amount borrowed remains the same, and our net income and cash flows, including cash available for servicing our indebtedness, will correspondingly decrease. The term loans under our senior secured credit facilities includes a floor (which is 1.0%) on the applicable benchmark London Interbank Offered Rate (“LIBOR”), Euro Interbank Offered Rate (“EURIBOR”) or prime rate, which is currently in excess of the specified LIBOR, EURIBOR or prime rate that would otherwise apply. Based on these outstanding balances as of June 30, 2016 including the impact from our related outstanding interest rate swaps, and should the applicable rate exceed the 1.0% floor, each 0.125% change in interest rates would result in an approximate $0.6 million change in annual interest expense. We have entered, and in the future may enter, into interest rate swaps that involve the exchange of floating for fixed rate interest payments in order to reduce interest rate volatility. However, we may not maintain interest rate swaps with respect to all of our variable rate indebtedness, and any swaps we have entered into or may enter into in the future may not fully mitigate our interest rate risk, which may prove disadvantageous or may create additional risks.
In addition, certain of our borrowings under our senior secured credit facilities are denominated in Euros and British Pounds Sterling, which do not necessarily correspond to the cash flow we generate in these currencies. Sharp changes in the exchange rates between the currencies in which we borrow and the currencies in which we generate cash flow could adversely affect us. In particular, for example, the exchange rate between the U.S. Dollar and the Euro has experienced significant volatility and may continue to fluctuate materially in the future. Certain of the Term Loans were borrowed in Euros and Pounds Sterling, while our functional currency is the U.S. Dollar and we maintain our accounting records in U.S. Dollars. As a result, unrealized foreign exchange gains and losses will occur upon the translation of the Euro-denominated and Pounds Sterling-denominated debt into U.S. Dollars. These unrealized foreign exchange gains or losses are currently recognized as a component of other comprehensive income as such instruments were designated as hedges of our net investment in foreign subsidiaries. If these hedging arrangements are unsuccessful, we may experience a material adverse effect on our business and results of operations.
Because our operations are conducted through our subsidiaries, we are largely dependent on our receipt of distributions and dividends or other payments from our subsidiaries for cash to fund all of our operations and expenses, including making future dividend payments, if any.
Our principal assets are the equity interests we own in our operating subsidiaries, either directly or indirectly. As a result, we are dependent upon cash dividends, distributions or other transfers we receive from our subsidiaries in order to repay any debt we may incur, to make interest payments with respect to such debt and to meet our other obligations. As a result, our ability to service our debt or to make future dividend payments, if any, is largely dependent on the earnings of our subsidiaries and the payment of those earnings to us in the form of dividends, loans or advances and through repayment of loans or advances from us.
28
The ability of our subsidiaries to pay dividends and make payments to us will depend on their operating results and may be restricted by, among other things, applicable corporate, tax and other laws and regulations and agreements of those subsidiaries, as well as by the terms of the credit agreement governing our senior secured credit facilities and the indenture governing the Notes. Any right that we have to receive any assets of or distributions from any subsidiary upon its bankruptcy, dissolution, liquidation or reorganization, or to realize proceeds from the sale of the assets of any subsidiary, may be junior to the claims of that subsidiary’s creditors, including trade creditors. In addition, there may be significant tax and other legal restrictions on the ability of foreign subsidiaries to remit money to us.
If we fail to maintain proper and effective internal control over financial reporting, our ability to produce accurate and timely financial statements could be impaired and investors’ views of us could be harmed.
The Sarbanes-Oxley Act requires, among other things, that we maintain effective internal control over financial reporting and report any material weaknesses in such internal controls. Beginning with our annual report on Form 10-K for the fiscal year ended June 30, 2017, we will be required to furnish a report by management on the effectiveness of our internal control over financial reporting and our independent registered public accounting firm will be required to express an opinion as to the effectiveness of our internal control over financial reporting, pursuant to Section 404 of the Sarbanes-Oxley Act. Our independent registered public accounting firm may issue a report that is adverse in the event it is not satisfied with the level at which our controls are documented, designed or operating. The process of designing, implementing and testing the internal control over financial reporting required to comply with this obligation is time-consuming, costly and complicated. If we are not able to comply with the requirements of Section 404 in a timely manner, or if we or our independent registered public accounting firm identify deficiencies in our internal control over financial reporting that are deemed to be material weaknesses, the market price of common shares could decline and we could be subject to sanctions or investigations by the NYSE, the SEC or other regulatory authorities, which would require additional financial and management resources.
Our ability to successfully implement our business plan and comply with Section 404 requires us to be able to prepare timely and accurate financial statements. Any delay in the implementation of, or disruption in the transition to, new or enhanced systems, procedures or controls, may cause our operations to suffer and we may be unable to conclude that our internal control over financial reporting is effective and, when required, to obtain an unqualified report on internal controls from our auditors. Moreover, we cannot be certain that these measures would ensure that we implement and maintain adequate controls over our financial processes and reporting in the future. Even if we were to conclude, and our auditors were to concur, that our internal control over financial reporting provided reasonable assurance regarding the reliability of financial reporting and the preparation of financial statements for external purposes in accordance with U.S. GAAP, because of its inherent limitations, internal control over financial reporting may not prevent or detect fraud or misstatements. This, in turn, could have an adverse impact on trading prices for our common shares, and could adversely affect our ability to access the capital markets.
We have incurred and will continue to incur increased costs as a result of operating as a publicly traded company, and our management will be required to devote substantial time to new compliance initiatives.
As a publicly traded company, we have incurred and will continue to incur additional legal, accounting and other expenses that we did not previously incur, which we expect will be between $2.0 million and $3.0 million per year. In addition, the Sarbanes-Oxley Act, the Dodd-Frank Wall Street Reform and Consumer Protection Act and the rules of the SEC and the NYSE impose various requirements on public companies. Our management and other personnel devote a substantial amount of time to these compliance initiatives as well as investor relations. Moreover, these rules and regulations have increased our legal and financial compliance costs and have made some activities more time-consuming and costly. For example, these rules and regulations make it more difficult and more expensive for us to obtain director and officer liability insurance, and we have incurred additional costs to maintain such coverage.
Furthermore, if we are not able to comply with the requirements of Section 404 of the Sarbanes-Oxley Act in a timely manner, the market price of our common shares could decline and we could be subject to potential delisting by the NYSE and review by the NYSE, the SEC or other regulatory authorities, which would require the expenditure by us of additional financial and management resources. As a result, our shareholders could lose confidence in our financial reporting, which would harm our business and the market price of our common shares.
29
We are controlled by Carlyle and Madison Dearborn, whose interests in our business may be different than other shareholders.
As of June 30, 2016, entities controlled by affiliates of Carlyle and Madison Dearborn owned approximately 27.3% and 30.3% of our common shares, respectively, and are able to control our affairs in all cases. Certain members of management hold interests in the entity controlled by Madison Dearborn. Pursuant to the shareholders’ agreement, a majority of our Board of Directors has been designated by affiliates of Carlyle and Madison Dearborn. As a result, affiliates of Carlyle and Madison Dearborn or their respective designees to our Board of Directors have the ability to control the appointment of our management, the entering into of mergers, sales of substantially all or all of our assets and other extraordinary transactions and influence amendments to our memorandum of association and bye-laws. So long as affiliates of Carlyle and Madison Dearborn collectively continue to own and/or control a majority of our common shares, they will have the ability to control the vote in any election of directors and will have the ability to prevent any transaction that requires shareholder approval regardless of whether other shareholders believe the transaction is in our best interests. In any of these matters, the interests of Carlyle and Madison Dearborn may differ from or conflict with other shareholders. Moreover, this concentration of share ownership may also adversely affect the trading price for our common shares to the extent investors perceive disadvantages in owning shares of a company with controlling shareholders. In addition, Carlyle and Madison Dearborn are in the business of making investments in companies and may, from time to time, acquire interests in businesses that directly or indirectly compete with our business, as well as businesses that are significant existing or potential suppliers or customers. Carlyle or Madison Dearborn may acquire or seek to acquire assets that we seek to acquire and, as a result, those acquisition opportunities may not be available to us or may be more expensive for us to pursue.
We are a “controlled company” within the meaning of the rules of the NYSE and, as a result, qualify for, and rely on, exemptions from certain corporate governance requirements. Our shareholders do not have the same protections afforded to shareholders of companies that are subject to such requirements.
Affiliates of Carlyle and Madison Dearborn collectively own a majority in voting power of the outstanding common shares. As a result, we are a “controlled company” within the meaning of the corporate governance standards of the NYSE. Under these rules, a company of which more than 50% of the voting power is held by an individual, group or another company is a “controlled company” and may elect not to comply with certain corporate governance requirements, including:
|
· |
the requirement that a majority of such company’s Board of Directors consist of independent directors; |
|
· |
the requirement that such company have a nominating and corporate governance committee that is composed entirely of independent directors with a written charter addressing the committee’s purpose and responsibilities; |
|
· |
the requirement that such company have a compensation committee that is composed entirely of independent directors with a written charter addressing the committee’s purpose and responsibilities; and |
|
· |
the requirement for an annual performance evaluation of such company’s nominating and corporate governance committee and compensation committee. |
We currently utilize these exemptions and intend to continue to utilize these exemptions for so long as we continue to qualify as a “controlled company.” For so long as we utilize these exemptions, we will not have a majority of independent directors and our nominating and corporate governance and compensation committees will not consist entirely of independent directors and such committees will not be subject to annual performance evaluations. Accordingly, our shareholders do not have the same protections afforded to shareholders of companies that are subject to all of the corporate governance requirements of the NYSE.
Upon the future sale of a sufficient number of shares by Carlyle and Madison Dearborn, we will no longer be a controlled company, and we may have difficulties complying with NYSE rules relating to the composition of our Board of Directors listed above. We intend to comply with these NYSE rules if we cease to be a controlled company. However, there can be no assurance that we will be able to attract and retain the number of independent directors needed to comply with NYSE rules during the phase-in period for compliance.
30
If Carlyle and Madison Dearborn sell a controlling interest in us to a third party in a private transaction, you may not realize any change-of-control premium on our common shares and we may become subject to the control of a presently unknown third party.
Carlyle and Madison Dearborn beneficially own a substantial majority of our common shares. Carlyle and Madison Dearborn will have the ability, should they choose to do so, to sell some or all of our common shares in a privately negotiated transaction, which, if sufficient in size, could result in our change of control. The ability of Carlyle and Madison Dearborn to privately sell such shares may not be subject to any requirement for a concurrent offer to be made to acquire all of our common shares that are publicly traded, which could prevent you from realizing any change-of-control premium on your common shares that may otherwise accrue to Carlyle and Madison Dearborn upon their private sale of our common shares. Additionally, if Carlyle and Madison Dearborn privately sell a significant equity interest in us, we may become subject to the control of a presently unknown third party. Such third party may have interests that conflict with the interests of our other shareholders.
We are a Bermuda company and it may be difficult for you to enforce judgments against us or our directors and executive officers.
We are a Bermuda exempted company. As a result, the rights of our shareholders are governed by Bermuda law and our memorandum of association and bye-laws. The rights of shareholders under Bermuda law may differ from the rights of shareholders of companies incorporated in another jurisdiction, and a substantial portion of our assets are located outside the United States. As a result, it may be difficult for investors to effect service of process on those persons in the United States or to enforce in the United States judgments obtained in U.S. courts against us or those persons based on the civil liability provisions of the U.S. securities laws. It is doubtful whether courts in Bermuda will enforce judgments obtained in other jurisdictions, including the United States, against us or our directors or officers under the securities laws of those jurisdictions or entertain actions in Bermuda against us or our directors or officers under the securities laws of other jurisdictions.
Bermuda law differs from the laws in effect in the United States and may afford less protection to our shareholders.
We are organized under the laws of Bermuda. As a result, our corporate affairs are governed by the Companies Act, 1981 (the “Companies Act”), which differs in some material respects from laws typically applicable to U.S. corporations and shareholders, including the provisions relating to interested directors, amalgamations, mergers and acquisitions, takeovers, shareholder lawsuits and indemnification of directors. Generally, the duties of directors and officers of a Bermuda company are owed to the company only. Shareholders of Bermuda companies typically do not have rights to take action against directors or officers of the company and may only do so in limited circumstances. Shareholder class actions are not available under Bermuda law. The circumstances in which shareholder derivative actions may be available under Bermuda law are substantially more proscribed and less clear than they would be to shareholders of U.S. corporations. The Bermuda courts, however, would ordinarily be expected to permit a shareholder to commence an action in the name of a company to remedy a wrong to the company where the act complained of is alleged to be beyond the corporate power of the company or illegal, or would result in the violation of the company’s memorandum of association or bye-laws. Furthermore, consideration would be given by a Bermuda court to acts that are alleged to constitute a fraud against the minority shareholders or, for instance, where an act requires the approval of a greater percentage of the company’s shareholders than those who actually approved it.
When the affairs of a company are being conducted in a manner that is oppressive or prejudicial to the interests of some shareholders, one or more shareholders may apply to the Supreme Court of Bermuda, which may make such order as it sees fit, including an order regulating the conduct of the company’s affairs in the future or ordering the purchase of the shares of any shareholders by other shareholders or by the company, in circumstances where the facts would otherwise justify the winding up of the company on just and equitable grounds but to do so would unfairly prejudice the shareholders applying for the assistance of the court. Additionally, under our bye-laws and as permitted by Bermuda law, each shareholder has waived any claim or right of action against our directors or officers for any action taken by directors or officers in the performance of their duties, except for actions involving fraud or dishonesty. In addition, the rights of our shareholders and the fiduciary responsibilities of our directors under Bermuda law are not as clearly established as under statutes or judicial precedent in existence in jurisdictions in the United States, particularly the State of Delaware. Therefore, our shareholders may have more difficulty protecting their interests than would shareholders of a corporation incorporated in a jurisdiction within the United States.
31
We may be treated as a “foreign financial institution” under the U.S. Foreign Account Tax Compliance Act, which could impose withholding requirements on certain payments made with respect to the common shares after December 31, 2018.
Certain provisions of the Code and applicable U.S. Treasury regulations (commonly collectively referred to as “FATCA”) generally impose a 30% withholding tax regime with respect to certain “foreign passthru payments” made by a “foreign financial institution” (an “FFI”). Under current guidance, it is not clear whether we would be treated as an FFI for purposes of FATCA. If we were to be treated as an FFI, such withholding may be imposed on such payments to any other FFI (including an intermediary through which an investor may hold the common shares) that is not a “participating FFI” (as defined under FATCA) or any other investor who does not provide information sufficient to establish that the investor is not subject to withholding under FATCA, unless such other FFI or investor is otherwise exempt from FATCA. Under current guidance, the term “foreign passthru payment” is not defined, and it is therefore not clear whether or to what extent payments on the common shares would be considered foreign passthru payments. Withholding on foreign passthru payments would not be required with respect to payments made before the later of January 1, 2019 and the date of publication in the Federal Register of final regulations defining the term “foreign passthru payment.” The United States has entered into various intergovernmental agreements, including intergovernmental agreements between the United States and Bermuda and between the United States and the United Kingdom, which potentially modify the rules described above.
Item 1B.Unresolved Staff Comments
None.
32
We own or lease 59 manufacturing facilities and several dedicated sales and design offices in the United States, Europe and Asia. Our facility network is strategically located in close proximity to key customers.
|
Location |
|
Activities |
|
Approximate Square Feet |
|
Owned or Leased |
|
North America |
|
|
|
|
|
|
|
Toronto, Canada |
|
Manufacturing plant |
|
145,000 |
|
Owned |
|
Aguascalientes, Mexico |
|
Manufacturing plant |
|
167,000 |
|
Owned |
|
Albuquerque, New Mexico, United States |
|
Manufacturing plant |
|
2,500 |
|
In Customer Facility |
|
Allegan, MI, United States |
|
Manufacturing plant |
|
38,000 |
|
Leased |
|
Carlstadt, NJ, United States |
|
Design center/Sales office |
|
44,000 |
|
Leased |
|
Chicago, IL, United States (3 facilities) |
|
Manufacturing plant |
|
214,000 |
|
Leased |
|
Dallas, TX, United States |
|
Manufacturing plant |
|
96,660 |
|
Leased |
|
Denver, CO, United States |
|
Manufacturing plant |
|
42,000 |
|
Leased |
|
Glendale, CA, United States |
|
Design center/Sales office |
|
18,800 |
|
Leased |
|
Greensboro, NC, United States |
|
Manufacturing plant |
|
57,000 |
|
Owned |
|
Hendersonville, NC, United States |
|
Manufacturing plant |
|
180,000 |
|
Owned |
|
Hicksville, NY, United States |
|
Manufacturing plant |
|
76,800 |
|
Leased |
|
Holland, MI, United States |
|
Manufacturing plant |
|
9,000 |
|
Leased |
|
Holland, MI, United States |
|
Manufacturing plant |
|
66,000 |
|
Owned |
|
Idaho Falls, ID, United States |
|
Manufacturing plant |
|
11,200 |
|
In Customer Facility |
|
Indianapolis, IN, United States |
|
Manufacturing plant |
|
140,500 |
|
Owned |
|
Lansing, MI, United States |
|
Manufacturing plant |
|
350,500 |
|
Owned |
|
Lexington, NC, United States |
|
Manufacturing plant |
|
100,000 |
|
Owned |
|
Los Angeles, CA, United States |
|
Design center/Sales office |
|
15,000 |
|
Leased |
|
Louisville, KY, United States |
|
Manufacturing plant |
|
60,000 |
|
Owned |
|
Louisville, KY, United States |
|
Manufacturing plant |
|
111,000 |
|
Leased |
|
New York, NY, United States |
|
Executive office |
|
9,772 |
|
Leased |
|
Raleigh, NC, United States |
|
Manufacturing plant |
|
75,000 |
|
Leased |
|
San Angelo, TX, United States |
|
Manufacturing plant |
|
4,850 |
|
In Customer Facility |
|
South Plainfield, NJ, United States |
|
Manufacturing plant |
|
100,000 |
|
Leased |
33
|
Location |
|
Activities |
|
Approximate Square Feet |
|
Owned or Leased |
|
Europe |
|
|
|
|
|
|
|
Courcelles, Belgium |
|
Manufacturing plant |
|
2,700 |
|
In Customer Facility |
|
Bornem, Belgium |
|
Manufacturing plant |
|
99,000 |
|
Owned |
|
Ghent, Belgium |
|
Manufacturing plant |
|
86,000 |
|
Owned |
|
Angouleme, France |
|
Manufacturing plant |
|
88,000 |
|
Owned |
|
Montargis, France |
|
Manufacturing plant |
|
48,000 |
|
Leased |
|
St. Pierre, France |
|
Manufacturing plant |
|
92,000 |
|
Owned |
|
Ussel, France |
|
Manufacturing plant |
|
43,000 |
|
Owned |
|
Duren, Germany |
|
Manufacturing plant |
|
115,000 |
|
Owned |
|
Obersulm, Germany |
|
Manufacturing plant |
|
214,000 |
|
Owned |
|
Melle, Germany |
|
Manufacturing plant |
|
129,000 |
|
Owned |
|
Stuttgart, Germany |
|
Manufacturing plant |
|
112,000 |
|
Owned |
|
Dublin, Ireland |
|
Manufacturing plant |
|
27,000 |
|
Leased |
|
Limerick, Ireland |
|
Manufacturing plant |
|
31,000 |
|
Owned |
|
Westport, Ireland |
|
Manufacturing plant/Sales office |
|
80,000 |
|
Owned |
|
Bialystok, Poland |
|
Manufacturing plant/Design center |
|
127,000 |
|
Owned |
|
Tczew, Poland |
|
Manufacturing plant |
|
79,000 |
|
Owned |
|
Oss, The Netherlands |
|
Manufacturing plant |
|
35,000 |
|
Leased |
|
Arbroath, United Kingdom |
|
Manufacturing plant |
|
105,000 |
|
Leased |
|
Arbroath, United Kingdom |
|
Manufacturing plant |
|
23,000 |
|
Owned |
|
Belfast, United Kingdom |
|
Manufacturing plant |
|
125,000 |
|
Owned |
|
Bourne, United Kingdom |
|
Manufacturing plant |
|
23,700 |
|
Owned |
|
Bradford, United Kingdom |
|
Manufacturing plant |
|
83,000 |
|
Owned |
|
Bristol, United Kingdom |
|
Manufacturing plant |
|
17,750 |
|
Leased |
|
East Kilbride, United Kingdom |
|
Manufacturing plant/Design center |
|
223,000 |
|
Owned |
|
Greenford, United Kingdom |
|
Manufacturing plant |
|
27,000 |
|
Leased |
|
Hamilton, United Kingdom |
|
Manufacturing plant |
|
60,000 |
|
Leased |
|
Hillington, United Kingdom |
|
Manufacturing plant |
|
22,000 |
|
Leased |
|
Leicester, United Kingdom |
|
Manufacturing plant |
|
156,798 |
|
Owned |
|
Newcastle, United Kingdom |
|
Manufacturing plant/Design center |
|
183,000 |
|
Owned |
|
Nottingham, United Kingdom |
|
Manufacturing plant |
|
107,639 |
|
Owned |
|
Portsmouth, United Kingdom |
|
Manufacturing plant |
|
155,000 |
|
Owned |
|
Swadlincote, United Kingdom |
|
Logistics center |
|
93,730 |
|
Owned |
|
Tewkesbury, United Kingdom |
|
Manufacturing plant |
|
66,000 |
|
Leased |
|
Wrexham, United Kingdom |
|
Manufacturing plant/Sales office |
|
45,907 |
|
Leased |
|
Asia |
|
|
|
|
|
|
|
Guangzhou, China |
|
Manufacturing plant/Design center |
|
174,000 |
|
Owned |
|
Hong Kong, China |
|
Design center/Sales office |
|
2,586 |
|
Leased |
|
Kunshan, China (2 facilities) |
|
Manufacturing plant/Sales office |
|
270,000 |
|
Leased |
34
We are from time to time party to legal proceedings that arise in the ordinary course of business. We are not involved in any litigation other than that which has arisen in the ordinary course of business. While the results of litigation and claims cannot be predicted with certainty, the Company believes the reasonably possible losses of such matters, individually and in the aggregate, are not material. Additionally, the Company believes the probable final outcome of such matters will not have a material adverse effect on the Company’s consolidated results of operations, financial position, cash flows or liquidity.
Item 4.Mine Safety Disclosures
Not applicable.
35
Item 5.Market for Registrant’s Common Equity, Related Stockholder Matters and Issuer Purchases of Equity Securities
Our common shares have been listed on the NYSE under the symbol “MPSX” since October 22, 2015. Prior to that time, there was no public market for our common shares. The following table sets forth for the periods indicated the high and low sale prices of our common shares on the NYSE for each fiscal quarter from October 22, 2015 through June 30, 2016.
|
|
High |
Low |
|
Fiscal 2016 |
|
|
|
Second Quarter (beginning October 22, 2015) |
$18.81 |
$12.90 |
|
Third Quarter |
$17.84 |
$13.20 |
|
Fourth Quarter |
$17.29 |
$12.50 |
American Stock Transfer & Trust Company, LLC is the transfer agent and registrar for our common shares. On August 15, 2016, we had approximately 54 holders of record of our common shares. The actual number of holders of common shares is greater than this number of record holders and includes shareholders who are beneficial owners, but whose shares are held in street name by brokers and nominees. The number of holders of record also does not include shareholders whose shares may be held in trust by other entities.
We have not paid any dividends on our common shares to date. We intend to retain all future earnings for use in the development of our business and do not anticipate declaring or paying any dividends in the foreseeable future. The payment of all dividends will be at the discretion of our Board of Directors and will depend on, among other things, future earnings, operations, capital requirements, contractual restrictions, including restrictions under our borrowing arrangements, our general financial condition and general business conditions.
36
Performance Graph
The following graph compares the performance of our common shares to the S&P 500 Index and to the Morningstar Packaging & Containers Index (in which we are included) for the period from October 22, 2015 through June 30, 2016. The comparison assumes $100 invested on October 22, 2015.
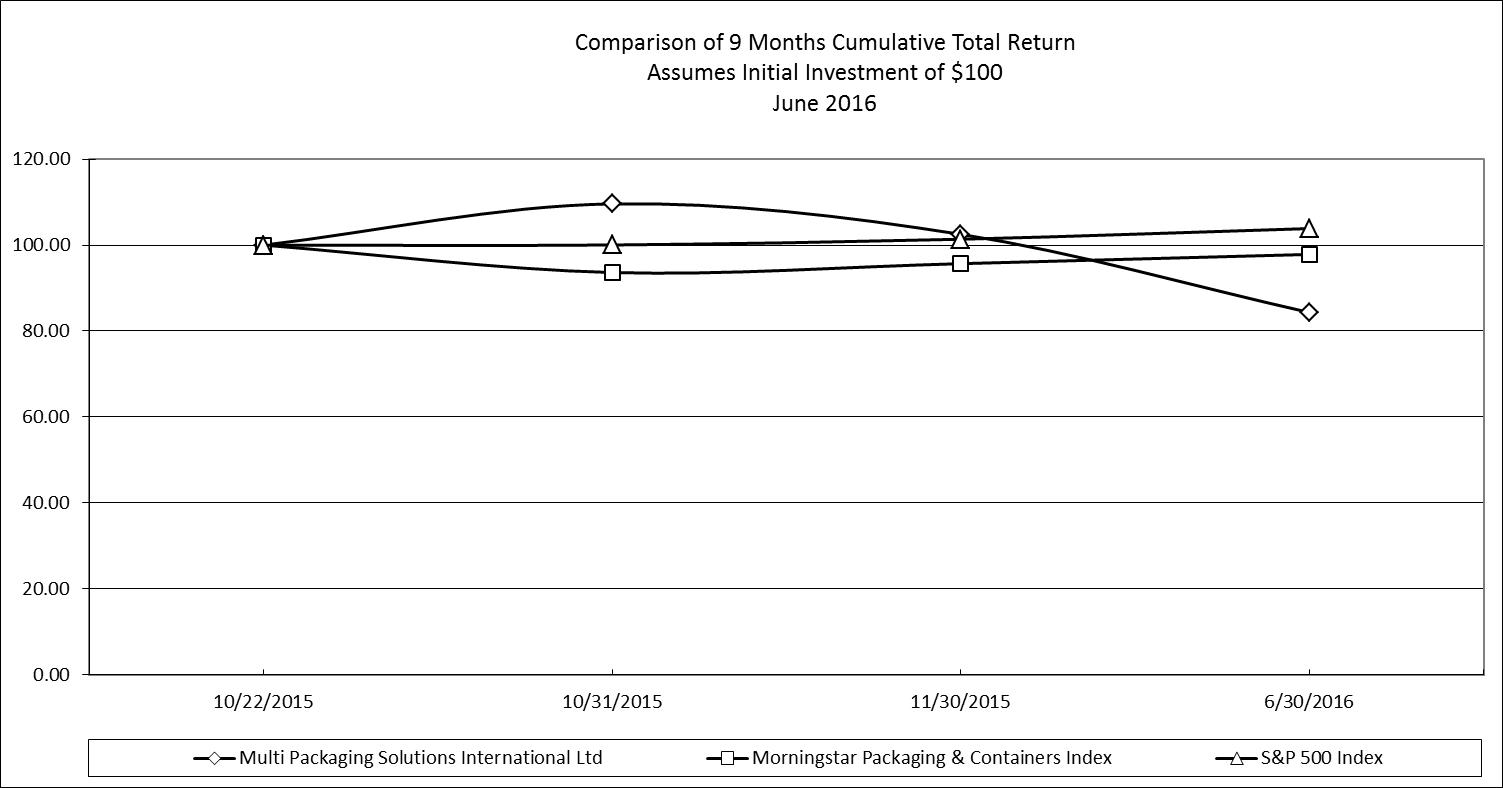
37
Item 6.Selected Financial Data
The following information has been summarized from our financial statements. The information set forth below is not necessarily indicative of results of future operations, and should be read in conjunction with Item 7, “Management’s Discussion and Analysis of Financial Condition and Results of Operations,” and the consolidated financial statements and related notes thereto included in Item 8 of this Form 10-K to fully understand factors that may affect the comparability of the information presented below. Amounts are in thousands except for per share amounts. We have not paid any dividends on our common shares to date.
Refer to Note 1, Nature of Business, and Note 4, Acquisitions, in the Notes to Consolidated Financial Statements for additional information regarding the presentation of Successor and Predecessor periods and additional information regarding our recent business combinations. Additionally, the working capital, total assets and long-term debt balances presented below reflect the retrospective reclassification of deferred financing fees and deferred taxes upon adoption of ASU No. 2015-17 and ASU 2015-03, as discussed in Note 2, Summary of Significant Accounting Policies, to the consolidated financial statements.
|
|
|
Successor |
|
|
Predecessor |
|
||||||||||||||
|
|
|
|
|
|
|
|
|
Period from |
|
|
Period from |
|
|
|
|
|
|
|
||
|
|
|
|
|
|
|
|
|
August 15, |
|
|
July 1, |
|
|
|
|
|
|
|
||
|
|
|
Fiscal Year Ended June 30, |
|
2013 through |
|
|
2013 through |
|
Fiscal Year Ended June 30, |
|
||||||||||
|
|
|
2016 |
|
2015 |
|
June 30, 2014 |
|
|
August 14, 2013 |
|
2013 |
|
2012 |
|
||||||
|
Net sales |
|
$ |
1,661,428 |
|
$ |
1,617,640 |
|
$ |
814,213 |
|
|
$ |
74,081 |
|
$ |
579,401 |
|
$ |
596,414 |
|
|
Consolidated |
|
$ |
1,327 |
|
$ |
7,026 |
|
$ |
(51,648) |
|
|
$ |
(23,685) |
|
$ |
9,333 |
|
$ |
4,136 |
|
|
Net income (loss) |
|
$ |
2,132 |
|
$ |
6,499 |
|
$ |
(51,864) |
|
|
$ |
(23,710) |
|
$ |
58 |
|
$ |
(14,560) |
|
|
Net income (loss) per share - |
|
$ |
0.03 |
|
$ |
0.10 |
|
$ |
(1.17) |
|
|
$ |
(203.74) |
|
$ |
0.49 |
|
$ |
(125.81) |
|
|
|
|
Successor |
|
|
Predecessor |
|
|||||||||||
|
|
|
June 30, |
|
|
June 30, |
|
|||||||||||
|
|
|
2016 |
|
2015 |
|
2014 |
|
|
2013 |
|
2012 |
|
|||||
|
Working capital |
|
$ |
216,707 |
|
$ |
199,905 |
|
$ |
104,840 |
|
|
$ |
61,135 |
|
$ |
36,676 |
|
|
Total assets |
|
$ |
1,707,590 |
|
$ |
1,871,243 |
|
$ |
1,844,155 |
|
|
$ |
347,505 |
|
$ |
349,201 |
|
|
Long-term debt |
|
$ |
900,516 |
|
$ |
1,169,626 |
|
$ |
1,107,857 |
|
|
$ |
363,504 |
|
$ |
184,157 |
|
|
Shareholders' equity (deficiency) |
|
$ |
442,894 |
|
$ |
288,690 |
|
$ |
302,532 |
|
|
$ |
(133,179) |
|
$ |
39,105 |
|
38
Item 7.Management’s Discussion and Analysis of Financial Condition and Results of Operations
The following discussion should be read in conjunction with the June 30, 2016 consolidated financial statements and related notes included elsewhere in this report. The statements in the discussion and analysis regarding industry outlook, our expectations regarding the performance of our business and other forward-looking statements are subject to numerous known and unknown risks and uncertainties, including, but not limited to, the risks and uncertainties described in “Forward-Looking Statements” below and “Risk Factors” included in Item 1A of this report. Our actual results may differ materially from those contained in or implied by any forward-looking statements. For purposes of this section, all references to “we,” “us,” “our,” “MPS” or the “Company” refer to Multi Packaging Solutions International Limited and subsidiaries.
Forward-Looking Statements
Any statements made in this quarterly report that are not statements of historical fact, including statements about our beliefs and expectations, are forward-looking statements and should be evaluated as such. Forward-looking statements include information concerning possible or assumed future results of operations, including descriptions of our business plan and strategies. These statements often include words such as “anticipate,” “expect,” “suggests,” “plan,” “believe,” “intend,” “estimates,” “targets,” “projects,” “should,” “could,” “would,” “may,” “will,” “forecast,” and other similar expressions. We base these forward-looking statements or projections on our current expectations, plans and assumptions that we have made in light of our experience in the industry, as well as our perceptions of historical trends, current conditions, expected future developments and other factors we believe are appropriate under the circumstances and at such time. As you read and consider this quarterly report, you should understand that these statements are not guarantees of performance or results. The forward-looking statements and projections are subject to and involve risks, uncertainties and assumptions and you should not place undue reliance on these forward-looking statements or projections. Although we believe that these forward-looking statements and projections are based on reasonable assumptions at the time they are made, you should be aware that many factors could affect our actual financial results or results of operations and could cause actual results to differ materially from those expressed in the forward-looking statements and projections. Factors that may materially affect such forward-looking statements and projections include:
|
· |
our ability to compete against competitors with greater resources or lower operating costs; |
|
· |
adverse developments in economic conditions, including downturns in the geographies and target markets that we serve; |
|
· |
difficulties in restructuring operations, closing facilities or disposing of assets; |
|
· |
our ability to successfully integrate our acquisitions and identify and integrate future acquisitions; |
|
· |
our ability to realize the growth opportunities and cost savings and synergies we anticipate from the initiatives that we undertake; |
|
· |
changes in technology trends and our ability to develop and market new products to respond to changing customer preferences and regulatory environment; |
|
· |
the impact of electronic media and similar technological changes, including the substitution of physical products for digital content; |
|
· |
seasonal fluctuations; |
|
· |
the impact of significant regulations and compliance expenditures as a result of environmental, health and safety laws; |
|
· |
risks associated with our non-U.S. operations; |
|
· |
exposure to foreign currency exchange rate volatility; |
|
· |
the loss of, or reduced purchases by, one or more of our large customers; |
|
· |
failure to attract and retain key personnel; |
|
· |
increased information technology security threats and targeted cybercrime; |
|
· |
changes in the cost and availability of raw materials; |
|
· |
operational problems at our facilities; |
|
· |
the impact of any labor disputes or increased labor costs; |
|
· |
the failure of quality control measures and systems resulting in faulty or contaminated products; |
|
· |
the occurrence or threat of extraordinary events, including natural disasters and domestic and international terrorist attacks; |
39
|
· |
increased energy or transportation costs; |
|
· |
our ability to develop product innovations and improve production technology and expertise; |
|
· |
the impact of litigation, uninsured judgments or increased insurance premiums; |
|
· |
an impairment of our goodwill or intangible assets; |
|
· |
our ability to comply with all applicable export control laws and regulations of the United States and other countries and restrictions imposed by the Foreign Corrupt Practices Act; |
|
· |
the impact of regulations to address climate change; |
|
· |
risks associated with the funding of our pension plans, including actions by governmental authorities; |
|
· |
the impact of regulations related to conflict minerals; |
|
· |
our ability to acquire and protect our intellectual property rights and avoid claims of intellectual property infringement; |
|
· |
risks related to our substantial indebtedness; |
|
· |
failure of internal controls over financial reporting; |
|
· |
the ability of The Carlyle Group and Madison Dearborn Partners to control us; |
|
· |
other factors disclosed in this quarterly report; and |
|
· |
other factors beyond our control. |
These cautionary statements should not be construed by you to be exhaustive and are made only as of the date of this quarterly report. We undertake no obligation to update or revise any forward-looking statements, whether as a result of new information, future events or otherwise.
Overview
We print and manufacture high quality paperboard, paper and plastic packaging in the North American, European and Asian segments. Within each of these geographic segments, we sell products into the healthcare, consumer and multi-media end markets.
The healthcare market includes pharmaceutical, nutraceutical and healthcare related products. The consumer market includes cosmetics, personal care and toiletries, food, spirits, sporting goods, transaction and gift cards, confectionary, liquor and general consumer products. The multi-media market includes home video, software, music, video games and media related special packaging products.
Products are manufactured in 59 facilities located in the United States, Europe, Canada, Mexico and China. We also have strategic alliances with companies in Europe and China who outsource certain products and production activities. In some cases, we procure non-paperboard, paper or plastic products to include in special packaging project deliverables for our customers. Products are generally cartons, labels, inserts or other paper or paperboard packaging products.
Cartons are generally paperboard based folding cartons. Labels are generally paper and pressure sensitive label stock printed products that are delivered in reel form or in a cut and stack form and can include basic labels for bottles and boxes, and extended content labels designed to deliver more information to the ultimate purchaser of our customer’s products. Inserts include fine paper folded inserts used in the delivery of detailed warnings, instructions and other information to the ultimate purchaser of our customer’s products. Other products include all remaining products. Often the project deliverables to a customer include all or a combination of these products.
Our strategic objectives are (i) continuing to enhance our position as a leading provider of packaging products to the segments we serve and can serve in North America, Europe and Asia; (ii) the expansion further into international markets to meet the global sourcing needs of our customers; and (iii) the identification of other areas in the packaging industry that can most benefit from our ability to deliver quality packaging products according to our customers’ needs, including the leveraging of our recent transactions via cross-selling both products and geographies. To achieve these objectives, we intend to continue expanding our printing, packaging and graphic arts capabilities, including the development and application of advanced manufacturing technologies and the establishment of manufacturing facilities in strategic international markets.
40
Key Transactions
Certain key transactions have had a significant impact on the comparability of the information presented in this section. The timeline below shows our most recent transactions that impact comparability.
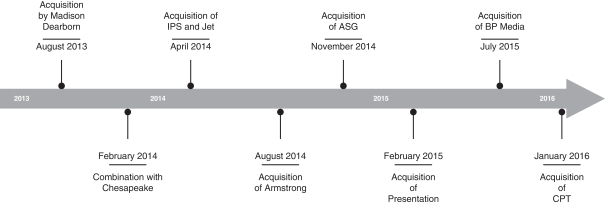
Acquisition of Chicago Paper Tube and Can
On January 26, 2016, we completed the acquisition of Chicago Paper Tube and Can (“CPT”). CPT provides the Company with high end round rigid packaging capability in North America. CPT had annual sales of approximately $5 million for the twelve months immediately prior to the date of acquisition.
Acquisition of BP Media
On July 1, 2015, we completed the acquisition of BP Media, Ltd. (“BluePrint”). The acquisition of BluePrint provides us with pre-press and digital services in the European market, facilitating the processes surrounding translation and interchangeability of print content for foreign locations. In addition, BluePrint provides us with an established sales presence in the media markets in Europe, which will enable us to serve the European needs of global media releases. BluePrint had annual sales of approximately $23 million for the twelve months immediately prior to the date of acquisition.
Acquisition of Presentation Products
On February 28, 2015, we completed the acquisition of Presentation Products (“Presentation”). The acquisition of Presentation complements the Company’s previously acquired rigid packaging operations. Presentation is a rigid specialty box manufacturer located in the United Kingdom and has import and China sourcing offices located in Hong Kong, China. Presentation specializes in high end consumer packaging with an emphasis in the spirits market. Presentation had annual sales of approximately $42 million for the twelve months ending immediately prior to the date of the acquisition.
Acquisition of ASG North American, Mexican and China Print and Packaging Operations
On November 21, 2014, we completed the acquisition of the North American and Asian print businesses of AGI Global Holdings Coöperatief U.A. and AGI Shorewood Group, US Holdings, LLC (collectively, “ASG”). The acquisition of ASG, a manufacturer of print and packaging in the United States, Canada, Mexico and China, expands our global network and customer base. ASG had annual sales of approximately $350 million for the twelve months ending immediately prior to the date of the acquisition.
41
Acquisitions of Armstrong Packaging Limited
On July 8, 2014, we completed the acquisitions of Armstrong Packaging Limited (“Armstrong”). Armstrong expanded the Company’s global platform for luxury packaging, gift sets, travel retail, and commemorative editions. Armstrong’s product development and rigid box manufacturing complements the Company’s existing manufacturing, creative design, project management, and global sourcing capabilities. Armstrong had annual sales of approximately $15 million for the twelve months ending immediately prior to the date of the acquisition.
Acquisition of Integrated Print Solutions and Jet Lithocolor
On April 4, 2014, we completed the acquisitions of 70% of Integrated Printing Solutions (“IPS”) and all of Jet Lithocolor (“Jet”) to create a comprehensive end-to-end solution for the credit, debit, gift, loyalty and insurance card markets. The acquisitions solidify our market position by adding a full complement of card production capabilities to our existing creative services, decorative technologies and sustainable solutions. These capabilities include laminated card production, imaging, affixing, direct mail and fulfillment. Furthermore, the acquisitions provide us with a fully integrated supply chain for cards, carriers, multi-packs and point-of-purchase displays in a range of materials, with turnkey resources for design, production and distribution for open and closed-loop card programs. IPS and Jet had annual sales of approximately $34 million and $61 million, respectively, for the twelve months ending immediately prior to the date of the acquisition.
Combination with Chesapeake
On February 14, 2014, we completed the closing of the combination with Chesapeake. Chesapeake emerged as the new parent entity, and subsequently changed its name to Multi Packaging Solutions Global Holdings Limited. Prior to our IPO, we were 50% owned by the former shareholders of MPS (Madison Dearborn) and 50% by the former shareholders of Chesapeake (Carlyle). The combination was accounted for as a reverse acquisition with Chesapeake as the legal acquiror and Mustang as the legal subsidiary but the accounting acquiror. Chesapeake had annual sales of approximately $852 million for the twelve months ending immediately prior to the date of the combination. Results for the Chesapeake business are included in our results for the fiscal year ended June 30, 2014 since February 14, 2014, the date of the acquisition.
Acquisition of the Company by Madison Dearborn Partners, LLC
On August 15, 2013, IPC/Packaging LLC completed the sale of Multi Packaging Solutions, Inc. for approximately $647 million to Madison Dearborn. In connection with the transaction, all previously outstanding securities and debt were redeemed or repaid, and new credit facilities were established and the Notes were issued. The operations prior to August 15, 2013 are referred to as the “Predecessor” operations, and operations subsequent to August 15, 2013 are referred to as the “Successor” operations.
Acquisition Accounting
All of the transactions described above were accounted for using the acquisition method of accounting. Accordingly, in all cases the assets and liabilities of the acquired or merged entities were recorded at fair value as of the respective closing dates and the results of operations of the entities are included in our results of operations from the date of closing.
Trends
General Information
Our largest customers are generally large multinational entities, many of which are consolidating global packaging requirements under a smaller number of suppliers. We believe we are favorably situated for this transition due to our many facilities, global footprint, standardized equipment from plant to plant and our relative size to other packaging suppliers. The packaging marketplace is very fragmented, with no one vendor providing a significant portion of the packaging needs.
42
Net Sales Trends
Net sales are impacted by the macroeconomic performance of our geographic segments and the markets within these geographic segments. Packaging net sales tend to be strongest just before the underlying customer’s busy season, which for high-end branded products is generally strongest in our first and second fiscal quarters.
Healthcare net sales in each of our geographic segments are influenced by the severity of a particular region’s cold and flu seasons, as well as the development and acceptance of certain new products, and the stage of product, from the prescription-only stage to the private label or generic stage.
European consumer net sales of confectionary products are generally stronger in our second quarter due to the holiday season. North American and European consumer net sales of spirits are also generally stronger in our second quarter due to the holiday season. Asia consumer net sales of spirits are generally stronger in their holiday season, generally in our third fiscal quarter.
The net sales to the North American multi-media end market are influenced by the success of a particular year’s movie releases, which can generate special packaging needs for these customers. Net sales of packaging in the North American video game market are generally influenced by the age of existing, and introduction of new, gaming platforms. Product launches, which cannot be predicted far in advance, have an impact on net sales, particularly with respect to special packaging needed for the holiday season. Overall, we expect our multi-media net sales to continue to decline as a percentage of our total net sales.
Impact of Inflation and Pricing
We have not historically been and do not expect to be significantly impacted by inflation. Increases in payroll costs and any increases in raw material costs that we have encountered are generally able to be offset through lean manufacturing activities. We have consistently made annual investments in capital that deliver efficiencies and cost savings. The benefits of these efforts generally offset the margin impact of competitive pricing conditions in all of the markets we serve.
We remain sensitive to price competitiveness in the markets that we serve and in the areas that are targeted for growth, and believe that the installation of state-of-the-art printing and manufacturing equipment as well as utilization of lean manufacturing (and related labor and production efficiencies) will enable us to compete effectively.
Operational Restructurings
We have successfully integrated our acquisitions, have achieved our original synergy targets, and will continue to optimize our operations over the next several quarters. We regularly evaluate our operating facilities in our geographic segments in order to share best practices, ensure logistics that serve customers are appropriate and maximize our operating efficiencies. In connection with these evaluations, we have closed certain facilities in recent periods. The Company previously announced the closure of the former ASG facility located in Melrose Park, Illinois on September 1, 2015, and the closure was completed in February 2016. In May 2016, we announced the intention to relocate our Stuttgart, Germany business and are currently finalizing discussions with the European Works Councils to this end. We are currently in process of consolidating this facility into other existing facilities in Germany in order to better serve our customers and gain operational efficiencies. Our plans also include evaluating several other opportunities over the next few quarters in order to maximize the efficiency of our global manufacturing footprint.
43
Results of Operations
Fiscal Year Ended June 30, 2016 Compared to Fiscal Year Ended June 30, 2015
The table below presents our results of operations for the respective fiscal years.
|
|
|
Fiscal Year Ended |
|
||||
|
|
|
June 30, |
|
||||
|
(amounts in thousands) |
|
2016 |
|
2015 |
|
||
|
Net sales |
|
$ |
1,661,428 |
|
$ |
1,617,640 |
|
|
|
|
|
|
|
|
|
|
|
Cost of goods sold |
|
|
1,307,020 |
|
|
1,285,673 |
|
|
Gross profit |
|
|
354,408 |
|
|
331,967 |
|
|
|
|
|
|
|
|
|
|
|
Selling, general and administrative expenses |
|
|
|
|
|
|
|
|
Selling, general and administrative expenses |
|
|
239,706 |
|
|
241,638 |
|
|
Stock based and deferred compensation expense |
|
|
26,769 |
|
|
5,722 |
|
|
Transaction related expenses |
|
|
3,838 |
|
|
13,630 |
|
|
Total selling, general and administrative expenses |
|
|
270,313 |
|
|
260,990 |
|
|
|
|
|
|
|
|
|
|
|
Operating income |
|
|
84,095 |
|
|
70,977 |
|
|
|
|
|
|
|
|
|
|
|
Other (expense) income, net |
|
|
(6,403) |
|
|
10,625 |
|
|
Debt extinguishment charges |
|
|
(3,967) |
|
|
(1,019) |
|
|
Interest expense |
|
|
(64,543) |
|
|
(75,437) |
|
|
Total other expense, net |
|
|
(74,913) |
|
|
(65,831) |
|
|
|
|
|
|
|
|
|
|
|
Income before income taxes |
|
|
9,182 |
|
|
5,146 |
|
|
|
|
|
|
|
|
|
|
|
Income tax expense |
|
|
(7,855) |
|
|
1,880 |
|
|
|
|
|
|
|
|
|
|
|
Consolidated net income |
|
|
1,327 |
|
|
7,026 |
|
|
|
|
|
|
|
|
|
|
|
Net (income) loss attributable to noncontrolling interest |
|
|
805 |
|
|
(527) |
|
|
|
|
|
|
|
|
|
|
|
Net income attributable to shareholders of |
|
$ |
2,132 |
|
$ |
6,499 |
|
Net Sales
The increase in net sales for the fiscal year ended June 30, 2016 was $43.8 million, or 2.7%, when compared to the fiscal year ended June 30, 2015. The increase is due to the inclusion of sales from the acquired operations of CPT, BluePrint, Presentation and ASG, which were acquired in January 2016, July 2015, February 2015 and November 2014, respectively. Net sales were unfavorably impacted by foreign currency changes, principally from translation differences, which resulted in reduced net sales of $77.2 million as compared to the prior year period.
Net sales adjusted for the acquisitions referenced above had they been included since the beginning of the prior year period, were $1.66 billion for fiscal 2016 as compared to $1.83 billion for fiscal 2015. This decrease in net sales of $171.2 million is primarily attributable to the foreign exchange impact noted previously, as well as a reduction in general multi-media sales of $56.7 million, a decline in sales from two consumer products companies of approximately $35.2 million, lower sales related to a toy project of approximately $10.8 million, a decline in sales for two customers impacted by recent tobacco legislation in the United Kingdom of approximately $14.2 million, and to a lesser extent the elimination of certain non-core businesses from the acquired operations of ASG. These decreases were partially offset by general net sales increases throughout the remaining customer portfolio.
44
We operate our business in the following operating segments, which are grouped based on geographic region: North America, Europe, and Asia. Net sales by geographic segment, as further broken down by end market, are summarized as follows:
Net Sales by Geographic Segment
|
|
|
For the Fiscal Year Ended |
|
||||
|
|
|
June 30, |
|
||||
|
(amounts in thousands) |
|
2016 |
|
2015 |
|
||
|
North America |
|
|
|
|
|
|
|
|
Consumer |
|
$ |
330,060 |
|
$ |
306,758 |
|
|
Healthcare |
|
|
294,977 |
|
|
277,832 |
|
|
Multi-Media |
|
|
159,416 |
|
|
153,298 |
|
|
|
|
$ |
784,453 |
|
$ |
737,888 |
|
|
|
|
|
|
|
|
|
|
|
Europe |
|
|
|
|
|
|
|
|
Consumer |
|
$ |
441,891 |
|
$ |
469,136 |
|
|
Healthcare |
|
|
323,055 |
|
|
346,777 |
|
|
Multi-Media |
|
|
21,051 |
|
|
4,478 |
|
|
|
|
$ |
785,997 |
|
$ |
820,391 |
|
|
|
|
|
|
|
|
|
|
|
Asia |
|
|
|
|
|
|
|
|
Consumer |
|
$ |
68,662 |
|
$ |
39,988 |
|
|
Healthcare |
|
|
22,316 |
|
|
19,373 |
|
|
|
|
$ |
90,978 |
|
$ |
59,361 |
|
|
|
|
|
|
|
|
|
|
|
Total |
|
$ |
1,661,428 |
|
$ |
1,617,640 |
|
Sales in local currency for the fiscal year ended June 30, 2016 were higher than the prior year due to the acquisition of ASG, and to a lesser extent the acquisitions of BluePrint and Presentation. The acquisition of ASG in November 2014 increased consumer, healthcare and multi-media sales due to that acquisition serving those end markets. However, overall sales trends in multi-media are expected to continue to decline and absent the acquisition activity, would have declined. Multi-media sales are declining due to the change in delivery systems towards digital delivery via downloads or online and pay-per-view systems. Our sales are reflective of the overall trend in the multi–media end market. Sales related to acquired businesses are evaluated as to profitability and optimization of manufacturing facility and if they are core to the Company’s ongoing business strategy. As a result, the Company may exit a business that was not profitable or not core to its overall business, and can move manufacturing to facilities that optimize the manufacturing efficiency.
North America
The increase in North America net sales for the fiscal year ended June 30, 2016 was $46.6 million, or 6.3%, when compared to the fiscal year ended June 30, 2015. The increase in North America consumer net sales for fiscal 2016 was $23.3 million, or 7.6%, when compared to fiscal 2015. The increase in North America healthcare sales for fiscal 2016 was $17.1 million, or 6.2%, when compared to fiscal 2015. The increase in North America multi-media sales for the fiscal year was $6.1 million, or 4.0%, when compared to the prior fiscal year. All of these increases are primarily a result of the ASG acquisition completed in November 2014. ASG had a majority of its business operations in North America.
Adjusted for the aforementioned acquisitions that impacted the North America segment, North America pro forma net sales were $782.2 million in fiscal 2016 compared to $863.5 million for fiscal 2015. The decrease is principally due to the previously mentioned decline in net sales for two consumer product companies, foreign exchange of approximately $12.9 million related to our Canada and Mexico subsidiaries, and the toy project discussed above
45
Although North America multi-media sales increased by $6.1 million for fiscal 2016 as compared to fiscal 2015, this increase was principally due to the inclusion of the sales from the acquired ASG operations for the full fiscal year in the as compared to only approximately seven months in the prior fiscal year. The acquired ASG operations were integrated immediately upon acquisition and, as a result, it is not possible to isolate the portion of revenues attributable to the ASG operations. However, had the ASG acquisition not occurred, multi-media sales would have declined during fiscal 2016.
Europe
The decrease in Europe net sales for fiscal 2016 was $34.4 million, or 4.2%, when compared to fiscal 2015, principally due to the unfavorable impact of foreign exchange of $61.6 million partially offset by the sales from the acquired businesses, BluePrint and Presentation, acquired in July 2015 and February 2015, respectively.
The decrease in Europe consumer net sales for the fiscal year was $27.2 million, or 5.8%, when compared to the prior fiscal year. Net sales associated with tobacco customers impacted by the UK legislation decreased approximately $14.2 million. The Company does not have nor expect to have significant future sales to tobacco customers that have been impacted by the UK legislation. Such sales to these customers were approximately $9.1 million in fiscal 2016. The decrease in Europe healthcare net sales for the fiscal year was $23.7 million, or 6.8%, when compared to the prior fiscal year, primarily due to the unfavorable impact of foreign exchange. The increase in multi-media net sales for the fiscal year was $16.6 million, or 370.1%, when compared to the prior fiscal year. The increase in multi-media net sales is primarily due to the acquisitions of BluePrint and Presentation.
Adjusted for the aforementioned acquisitions that impacted the Europe segment, Europe pro forma net sales were $786.1 million in fiscal 2016 compared to $865.7 million in fiscal 2015, a decrease of $79.6 million. The decrease is principally from the impact of foreign exchange and the aforementioned tobacco customers.
Asia
The increase in Asia net sales for the fiscal year ended June 30, 2016 was $31.6 million, or 53.3%, when compared to the fiscal year ended June 3, 2015. The increase in Asia consumer net sales for fiscal 2016 was $28.7 million, or 71.7% when compared to fiscal 2015. The increase in Asia healthcare net sales for the fiscal year was $2.9 million, or 15.2%, when compared to the prior fiscal year. The overall increase in Asia net sales is primarily the result of the acquisition of ASG in November 2014 and the inclusion of its net sales for the period.
Adjusted for the ASG acquisition in the prior year, Asia net sales decreased $10.2 million when compared to the fiscal 2015 pro forma net sales of $101.2 million. The decrease is principally due to the discontinuance of sales from non-core customers obtained with the ASG acquisition.
Gross Profit
|
|
|
Fiscal Year Ended |
|
||||
|
|
|
June 30, |
|
||||
|
(Dollars in thousands) |
|
2016 |
|
2015 |
|
||
|
Net sales |
|
$ |
1,661,428 |
|
$ |
1,617,640 |
|
|
Cost of goods sold |
|
|
1,307,020 |
|
|
1,285,673 |
|
|
Gross profit |
|
$ |
354,408 |
|
$ |
331,967 |
|
|
Gross profit % |
|
|
21.3% |
|
|
20.5% |
|
Gross profit for the fiscal year ended June 30, 2016 increased when compared to the gross profit for the fiscal year ended June 30, 2015 principally due to the inclusion of the sales from acquisitions for the entire period, as well as the favorable impact of integration programs and synergies realized from the merger with Chesapeake in February 2014 and the acquisition of ASG in November 2014. Gross profit percentage for fiscal 2016 was 21.3%, an increase of 80 basis points compared to 20.5% for fiscal 2015. The increase reflects the Company’s continuing facility improvement programs and realized synergies from acquisitions. Gross profit includes certain restructuring and related charges in both fiscal years, which negatively impacted gross profit percentage by approximately 60 basis points in each fiscal year.
46
Selling, General and Administrative Expenses
Total selling, general and administrative expenses for the fiscal year ended June 30, 2016 were $270.3 million, an increase of $9.3 million when compared to the prior fiscal year. The increase is principally due to an increase of $21.0 million in stock based and deferred compensation expense which was primarily due to the vesting of incentive units held by employees at the date of the Company’s initial public offering in October 2015. This was partially offset by a reduction in transaction related expenses of $9.8 million. Transaction related expenses in the current fiscal year primarily relate to costs associated with the secondary offering, real estate transfer taxes incurred in connection with tax planning associated with the initial public offering, and to a lesser extent our merger and acquisition activities. Excluding stock based and deferred compensation and transaction related expenses, selling, general and administrative expenses for fiscal 2016 were $239.7 million, a decrease of $1.9 million when compared to the prior fiscal year. As a percentage of net sales excluding these items, such expenses were 14.4% for the fiscal year ended June 30, 2016 as compared to 14.9% for the prior period, a favorable decrease of 50 basis points. The reduction in these expenses is principally due to the benefit of reduced personnel costs associated with the integration of the acquired operations discussed above, offset by approximately $2.1 million of additional costs incurred in the current year associated with operating as a public reporting company.
Other (Expense) Income
Other (expense) income is principally related to foreign currency gains and losses and the change in fair value of the Company’s derivative instruments.
Interest expense for the fiscal year ended June 30, 2016 was $64.5 million compared to $75.4 million for the fiscal year ended June 30, 2015. The reduction in interest expense is primarily due to the repayment of $182.4 million of term loans from the proceeds of the Company’s initial public offering and $55.2 million from the voluntary early partial repayment of term and other loans during the fiscal year. Additionally, interest expense reduced as a result of the favorable repricing of the Company’s European debt facilities in December 2014. This reduction was partially offset by the Company’s borrowing in November 2014 to fund the ASG transaction. Included in interest expense in fiscal 2016 and 2015 is amortization of deferred finance fees and debt discount of $4.1 million and $4.5 million, respectively.
In connection with the repayment of the Company’s debt, the Company recognized incremental amortization on the deferred financing and debt discount fees in the amount of $4.0 million as debt extinguishment charges for the fiscal year ended June 30, 2016.
Income Taxes
For the fiscal year ended June 30, 2016, our effective income tax rate was 85.5%, which was significantly impacted by the non-deductible stock compensation expense recorded in connection with the vesting of certain awards at the time of the Company’s IPO. Additionally, we recorded a net benefit totaling $2.4 million as a result of an enacted reduction in the future United Kingdom tax rates and the granting of the High Tech Tax Exemption at one of our facilities in China.
For the fiscal year ended June 30, 2015, we recorded income before income taxes of $5.1 million; however a $1.9 million tax benefit was recorded. This was primarily the result of the recognition of previously unrecognized tax benefits due to the expirations of the statute of limitations for certain foreign uncertain tax positions and change in the estimated state income tax rate from 3.5% to 2.0%.
Our effective tax rate may change from period to period based on recurring and non-recurring factors including the geographical mix of earnings, enacted tax legislation, state and local income taxes and tax audit settlements.
47
Operating Income/Adjusted EBITDA*
|
|
|
Fiscal Year Ended |
|
||||
|
|
|
June 30, |
|
||||
|
(amounts in thousands) |
|
2016 |
|
2015 |
|
||
|
Operating Income |
|
|
|
|
|
|
|
|
North America |
|
$ |
28,503 |
|
$ |
18,317 |
|
|
Europe |
|
|
44,085 |
|
|
46,442 |
|
|
Asia |
|
|
11,507 |
|
|
6,218 |
|
|
Total |
|
$ |
84,095 |
|
$ |
70,977 |
|
|
|
|
|
|
|
|
|
|
|
Adjusted EBITDA |
|
|
|
|
|
|
|
|
North America |
|
$ |
110,204 |
|
$ |
97,001 |
|
|
Europe |
|
|
128,133 |
|
|
126,350 |
|
|
Asia |
|
|
15,966 |
|
|
7,611 |
|
|
Total |
|
$ |
254,303 |
|
$ |
230,962 |
|
* Our Chief Operating Decision Maker evaluates operating segment profitability and determines resource allocations based on several factors, of which the primary financial measure is Adjusted EBITDA. Adjusted EBITDA is defined as segment net income (loss) before income taxes, interest, depreciation, amortization, restructuring, transaction, stock-based compensation and certain other costs that do not related to the segment’s ongoing operations. The Company believes that the presentation of this financial measure enhances an investor’s understanding of our financial performance and is a useful financial metric to assess our operating performance from period to period by excluding certain items that we believe are not representative of our core business. The Company also believes that this financial measure provides investors with a useful tool for assessing the comparability between periods of the ability to generate cash from operations sufficient to pay taxes, to service debt and to undertake capital expenditures. This financial measure is used for business planning purposes and in measuring performance relative to that of competitors and the Company believes this financial measure is commonly used by investors. However, our use of the term Adjusted EBITDA may vary from that of others in the industry. A reconciliation of Adjusted EBITDA to consolidated net income (loss) is presented in Note 19 to the consolidated financial statements included elsewhere in this report.
North America
North America operating income was $28.5 million and $18.3 million for the fiscal years ended June 30, 2016 and 2015, respectively, and North America Adjusted EBITDA was $110.2 million and $97.0 million for the fiscal years ended June 30, 2016 and 2015, respectively. Operating income as a percentage of net sales was 3.6% and 2.5% for fiscal 2016 and 2015, respectively. North America operating income was significantly negatively impacted in fiscal 2016 due to the recording of $18.5 million of stock compensation expense for North American employees associated with the Company’s initial public offering, and to a lesser extent restructuring charges and transaction expenses. These charges, as well as any similar charges recorded in the prior fiscal year, are excluded from Adjusted EBITDA. Adjusted EBITDA as a percentage of net sales for the North America segment was 14.0% and 13.1% for fiscal 2016 and 2015, respectively. Certain headquarters costs, including the increased costs as a result of operating as a public reporting company are included in the North America segment. The increases in operating income, Adjusted EBITDA and Adjusted EBITDA as a percentage of net sales from the prior fiscal year are principally due to the inclusion of the operating results of the acquired ASG business discussed above and integration activities for this transaction, as well as the Company’s plant improvement programs, which favorably impacted the segment’s operating results.
Europe
Europe operating income was $44.1 million and $46.4 million for the fiscal years ended June 30, 2016 and 2015, respectively, and Europe Adjusted EBITDA was $128.1 million and $126.4 million for the fiscal years ended June 30, 2016 and 2015, respectively. Operating income as a percentage of net sales was 5.6% and 5.7% for fiscal 2016 and 2015, respectively. Europe operating income for fiscal 2016 was negatively impacted due to the recording of $8.5 million of stock compensation expense for European employees associated with the Company’s initial public offering, as well as
48
$7.0 million of restructuring charges primarily as a result of the announced closure of our Stuttgart facility. Adjusted EBITDA as a percentage of net sales for the Europe segment was 16.3% and 15.4% for fiscal 2016 and 2015, respectively. The increase in Adjusted EBITDA from the prior fiscal year is principally due to the inclusion of the operating income from the acquisitions of BluePrint and Presentation, as well as the Company’s plant improvement programs, which was partially offset by unfavorable foreign exchange impacts.
Asia
Asia operating income was $11.5 million and $6.2 million for the fiscal years ended June 30, 2016 and 2015, respectively, and Asia Adjusted EBITDA was $16.0 million and $7.6 million for the fiscal years ended June 30, 2016 and 2015, respectively. Operating income as a percentage of net sales was 12.6% and 10.5% for fiscal 2016 and 2015, respectively. The increases in operating income, Adjusted EBITDA and operating margin are principally due to the inclusion of the operating income resulting from the acquisition of the ASG businesses discussed above, as well as the Company’s plant improvement programs and integration activities for this transaction which favorably impacted the segment’s operating results.
Fiscal Year Ended June 30, 2015 Compared to Periods Ended August 14, 2013 and June 30, 2014
The table below presents our results of operations for the respective fiscal periods.
|
|
|
Successor |
|
|
Predecessor |
|
|||||
|
|
|
Fiscal Year Ended |
|
Period from August |
|
|
Period from July 1, |
|
|||
|
|
|
June 30, |
|
15, 2013 through |
|
|
2013 through |
|
|||
|
(amounts in thousands) |
|
2015 |
|
June 30, 2014 |
|
|
August 14, 2013 |
|
|||
|
Net sales |
|
$ |
1,617,640 |
|
$ |
814,213 |
|
|
$ |
74,081 |
|
|
|
|
|
|
|
|
|
|
|
|
|
|
|
Cost of goods sold |
|
|
1,285,673 |
|
|
668,441 |
|
|
|
58,054 |
|
|
Gross profit |
|
|
331,967 |
|
|
145,772 |
|
|
|
16,027 |
|
|
|
|
|
|
|
|
|
|
|
|
|
|
|
Selling, general and administrative expenses |
|
|
|
|
|
|
|
|
|
|
|
|
Selling, general and administrative expenses |
|
|
241,638 |
|
|
133,678 |
|
|
|
9,868 |
|
|
Stock based and deferred compensation expense |
|
|
5,722 |
|
|
1,534 |
|
|
|
125 |
|
|
Transaction related expenses |
|
|
13,630 |
|
|
38,844 |
|
|
|
28,370 |
|
|
Total selling, general and administrative expenses |
|
|
260,990 |
|
|
174,056 |
|
|
|
38,363 |
|
|
|
|
|
|
|
|
|
|
|
|
|
|
|
Operating income (loss) |
|
|
70,977 |
|
|
(28,284) |
|
|
|
(22,336) |
|
|
|
|
|
|
|
|
|
|
|
|
|
|
|
Other (expense) income, net |
|
|
10,625 |
|
|
370 |
|
|
|
1,063 |
|
|
Debt extinguishment charges |
|
|
(1,019) |
|
|
— |
|
|
|
(14,042) |
|
|
Interest expense |
|
|
(75,437) |
|
|
(43,215) |
|
|
|
(3,991) |
|
|
Total other expense, net |
|
|
(65,831) |
|
|
(42,845) |
|
|
|
(16,970) |
|
|
|
|
|
|
|
|
|
|
|
|
|
|
|
Income (loss) before income taxes |
|
|
5,146 |
|
|
(71,129) |
|
|
|
(39,306) |
|
|
|
|
|
|
|
|
|
|
|
|
|
|
|
Income tax (expense) benefit |
|
|
1,880 |
|
|
19,481 |
|
|
|
15,621 |
|
|
|
|
|
|
|
|
|
|
|
|
|
|
|
Consolidated net income (loss) |
|
|
7,026 |
|
|
(51,648) |
|
|
|
(23,685) |
|
|
|
|
|
|
|
|
|
|
|
|
|
|
|
Net (income) loss attributable to noncontrolling interest |
|
|
(527) |
|
|
(216) |
|
|
|
— |
|
|
|
|
|
|
|
|
|
|
|
|
|
|
|
Net income (loss) attributable to shareholders of |
|
$ |
6,499 |
|
$ |
(51,864) |
|
|
$ |
(23,685) |
|
Net Sales
Our consolidated financial statements will not be directly comparable to the consolidated financial statements of the Predecessor due to the effects of the Madison Dearborn Transaction in August 2013. However, for purposes of discussion of the results of operations for net sales, we compared the net sales for the fiscal year ended June 30, 2015 to the combined results of the Predecessor from July 1, 2013 to August 14, 2013 and the Successor from August 15, 2013 to June 30, 2014.
49
We believe the comparison to combined net sales assists readers in understanding and assessing the trends and significant changes in our net sales, provides a more meaningful method of comparison and does not impact the drivers of the financial changes between the relevant periods.
The increase in net sales for the fiscal year ended June 30, 2015 was $729.3 million, or 82.1%, when compared to the fiscal year ended June 30, 2014 (inclusive of both the Predecessor and Successor periods). The increase is due to the inclusion of a full year’s sales following the combination of Chesapeake, and the inclusion of sales from the acquired operations of ASG and other acquisitions. Sales related to the acquired operations increased sales by approximately $766.5 million. In addition, sales were negatively impacted by foreign exchange by approximately $76.0 million.
We operate our business along the following operating segments, which are grouped based on the basis of geographic region: North America, Europe and Asia. Net sales by geographic segment, as further broken down by end market, are summarized as follows:
|
|
|
Successor |
|
|
Predecessor |
|
|||||
|
|
|
Fiscal Year Ended |
|
Period from August |
|
|
Period from July 1, |
|
|||
|
|
|
June 30, |
|
15, 2013 through |
|
|
2013 through |
|
|||
|
(amounts in thousands) |
|
2015 |
|
June 30, 2014 |
|
|
August 14, 2013 |
|
|||
|
North America |
|
|
|
|
|
|
|
|
|
|
|
|
Consumer |
|
$ |
306,758 |
|
$ |
158,627 |
|
|
$ |
14,071 |
|
|
Healthcare |
|
|
277,832 |
|
|
181,255 |
|
|
|
20,837 |
|
|
Multi-Media |
|
|
153,298 |
|
|
112,149 |
|
|
|
23,820 |
|
|
|
|
$ |
737,888 |
|
$ |
452,031 |
|
|
$ |
58,728 |
|
|
|
|
|
|
|
|
|
|
|
|
|
|
|
Europe |
|
|
|
|
|
|
|
|
|
|
|
|
Consumer |
|
$ |
469,136 |
|
$ |
209,268 |
|
|
$ |
12,023 |
|
|
Healthcare |
|
|
346,777 |
|
|
140,977 |
|
|
|
92 |
|
|
Multi-Media |
|
|
4,478 |
|
|
4,151 |
|
|
|
3,238 |
|
|
|
|
$ |
820,391 |
|
$ |
354,396 |
|
|
$ |
15,353 |
|
|
|
|
|
|
|
|
|
|
|
|
|
|
|
Asia |
|
|
|
|
|
|
|
|
|
|
|
|
Consumer |
|
$ |
39,988 |
|
$ |
— |
|
|
$ |
— |
|
|
Healthcare |
|
|
19,373 |
|
|
7,786 |
|
|
|
— |
|
|
|
|
$ |
59,361 |
|
$ |
7,786 |
|
|
$ |
— |
|
|
|
|
|
|
|
|
|
|
|
|
|
|
|
Total |
|
$ |
1,617,640 |
|
$ |
814,213 |
|
|
$ |
74,081 |
|
North America
The increase in North American net sales for the fiscal year ended June 30, 2015 was $227.1 million, or 44.5%, when compared to the combined fiscal year ended June 30, 2014 (inclusive of both the Predecessor and Successor periods). The increase in North American healthcare sales for the fiscal year ended June 30, 2015 was $75.7 million, or 37.5%, when compared to the combined fiscal year ended June 30, 2014 (inclusive of both the Predecessor and Successor periods). The increase in North American consumer net sales for the fiscal year ended June 30, 2015 was $134.1 million, or 77.6%, when compared to the combined fiscal year ended June 30, 2014 (inclusive of both the Predecessor and Successor periods). The increase in North American media sales for the fiscal year ended June 30, 2015 was $17.3 million or 12.7%, when compared to the combined fiscal year ended June 30, 2014 (inclusive of both the Predecessor and Successor periods).
North American healthcare and consumer net sales primarily increased due to the inclusion of a full year of sales from the merger with Chesapeake, which included customers that sell (i) healthcare-related products and prescription drugs and (ii) consumer products such as confectionary, spirits and cosmetics. Consumer sales are also higher due to inclusion of a full year of operations of Jet and IPS, both of which serve the transaction card consumer market.
50
The acquisition of ASG in November 2014 increased consumer, healthcare and media sales due to that acquisition serving those markets. Multi-media sales went up principally due to that acquisition, but overall sales trends in multi-media are expected to continue to decline and absent the acquisition activity, would have declined. Multi-media sales are declining due to the change in delivery systems towards digital delivery via downloads or online and pay-per-view systems. Our sales are reflective of the overall trend in the multi-media end market.
Europe
The increase in Europe net sales for the fiscal year ended June 30, 2015 was $450.6 million, or 121.9%, when compared to the combined fiscal year ended June 30, 2014 (inclusive of both the Predecessor and Successor periods). Overall, the increase in net sales for Europe was due to the merger with Chesapeake.
The increase in Europe healthcare sales for the fiscal year ended June 30, 2015 was $205.7 million, or 145.8%, when compared to the combined fiscal year ended June 30, 2014 (inclusive of both the Predecessor and Successor periods). The increase in Europe consumer net sales for the fiscal year ended June 30, 2015 was $247.8 million, or 112.0%, when compared to the combined fiscal year ended June 30, 2014 (inclusive of both the Predecessor and Successor periods).
The increase in healthcare sales and consumer sales in Europe is principally due to the merger with Chesapeake and including a full year of its operations in the financial statements. The largest portion of the negative foreign exchange impact was in the consumer segment of the business. Without foreign exchange and the acquisitions, net sales for both markets would have increased slightly.
The decrease in Europe multi-media sales for the fiscal year ended June 30, 2015 was $2.9 million, or 39.4%, when compared to the combined fiscal year ended June 30, 2014 (inclusive of both the Predecessor and Successor periods). This multi-media decline in Europe is for the same reasons as described above for North America.
Asia
The increase in Asia net sales for the fiscal year ended June 30, 2015 was $51.6 million, or 662.4%, when compared to the combined fiscal year ended June 30, 2014 (inclusive of both the Predecessor and Successor periods). The merger with Chesapeake and the inclusion of a full year of operations had a positive impact on sales, but the largest impact was due to the acquisition of ASG in November 2014 and the inclusion of its sales for a portion of the year.
The increase in Asia healthcare sales for the fiscal year ended June 30, 2015 was $11.6 million, or 148.8%, when compared to the combined fiscal year ended June 30, 2014 (inclusive of both the Predecessor and Successor periods). The increase was due to the acquisitions described above.
Gross Profit
|
|
|
Successor |
|
|
Predecessor |
|
|||||
|
|
|
Fiscal Year Ended |
|
Period from August |
|
|
Period from July 1, |
|
|||
|
|
|
June 30, |
|
15, 2013 through |
|
|
2013 through |
|
|||
|
(Dollars in thousands) |
|
2015 |
|
June 30, 2014 |
|
|
August 14, 2013 |
|
|||
|
Net sales |
|
$ |
1,617,640 |
|
$ |
814,213 |
|
|
$ |
74,081 |
|
|
Cost of goods sold |
|
|
1,285,673 |
|
|
668,441 |
|
|
|
58,054 |
|
|
Gross profit |
|
$ |
331,967 |
|
$ |
145,772 |
|
|
$ |
16,027 |
|
|
Gross profit % |
|
|
20.5% |
|
|
17.9% |
|
|
|
21.6% |
|
The gross profit percentage for the fiscal year ended June 30, 2015 increased compared to the gross profit percentage for the Successor period ended June 30, 2014 principally due to the favorable impact of integration programs and synergies realized from the merger with Chesapeake for a full year, and the acquisition of ASG in November 2014. The gross profit for the fiscal year ended June 30, 2015 is lower than the gross profit for the Predecessor period ended August 14, 2013 principally due to the effect of lower gross profit of the ASG operations where integration programs and synergy programs
51
had not yet had a full year of impact. In addition, the gross profit for the period ended June 30, 2015 was lower due to the increased depreciation and amortization as well as inventory step up in value that resulted from the acquisitions discussed above.
Selling, General and Administrative Expenses
Selling, general and administrative expenses as a percentage of net sales for the year ended June 30, 2015 was 15.3% as compared to 16.6% for the Successor period ended June 30, 2014. The reduction in this percentage is principally due to the benefit of reduced personnel costs associated with the integration of the acquired operations discussed above. Selling, general and administrative expenses for the Predecessor period ended August 14, 2013 was 13.1%. The increase in the percentage of selling, general and administrative expenses for the fiscal year ended June 30, 2015 when compared to the period ended August 14, 2013 was principally due to the amortization of intangible assets recorded in connection with the acquisitions described above.
There were no management fees paid in the Successor periods ended June 30, 2014 and fiscal year ended June 30, 2015 as the current sponsors do not charge a management fee.
Transaction expenses for the fiscal year ended June 30, 2015 are directly related to the acquisition and merger activity discussed above, and are comprised primarily of legal fees, diligence expenses and opening balance sheet fair valuation expenses of approximately $8.6 million and synergy achievement bonuses of approximately $5.0 million. Approximately half of these bonus payments were made in August 2015 and the remainder were paid in January 2016.
Other (Expense) Income
Other (expense) income is principally related to foreign currency transaction gains and losses.
The increase in foreign currency transaction gains in the fiscal year ended June 30, 2015 is due to fluctuations in foreign currency exchange rates.
The increase in interest expense in the fiscal year ended June 30, 2015 as compared to the period ended June 30, 2014 and the period ended August 14, 2013 was principally due to the increased debt associated with the acquisitions. We borrowed additional funds in November 2014 to complete the ASG transaction, and interest expense associated with this additional debt was partially offset by the re-pricing of our European debt facilities in December 2014. Included in interest expense in the fiscal year ended June 30, 2015 and the periods ended June 30, 2014 and August 14, 2013 are deferred finance fees and debt discount of approximately $4.6 million, $2.7 million and $0.3 million, respectively.
Income Taxes
Our effective income tax rate for the period from July 1, 2013 to August 14, 2013, the period from August 15, 2013 to June 30, 2014 and the year ended June 30, 2015 was 39.7%, 27.4% and 36.5%, respectively. For the period from July 1, 2013 to August 14, 2013 and the period from August 15, 2013 to June 30, 2014 the effective tax rate was principally impacted by permanent differences arising from transaction costs that were not deductible for tax purposes, as well as foreign tax rate differentials and losses in jurisdictions where no benefit is realized. For the year ended June 30, 2015 the effective tax rate was principally impacted by the recognition of previously unrecognized tax benefits due to the expirations of statute of limitations for certain foreign uncertain tax positions and a change in the state income tax rate from 3.5% to 2.0%.
52
Operating Income/Adjusted EBITDA
Our operating income (loss) and Adjusted EBITDA as presented in the tables below are principally impacted by (i) the period from August 15, 2013 to June 30, 2014 being shorter than the fiscal year ended June 30, 2015 by 1.5 months, (ii) the acquisition of ASG in November 2014, (iii) the inclusion of a full year of operations of Chesapeake in the June 30, 2015 results and (iv) the fiscal year ended June 30, 2015 results being negatively impacted by foreign exchange rates in the amount of $15.0 million.
|
|
|
Successor |
|
|
Predecessor |
|
|||||
|
|
|
Fiscal Year Ended |
|
Period from August |
|
|
Period from July 1, |
|
|||
|
|
|
June 30, |
|
15, 2013 through |
|
|
2013 through |
|
|||
|
(amounts in thousands) |
|
2015 |
|
June 30, 2014 |
|
|
August 14, 2013 |
|
|||
|
Operating Income |
|
|
|
|
|
|
|
|
|
|
|
|
North America |
|
$ |
18,317 |
|
$ |
(37,181) |
|
|
$ |
(24,524) |
|
|
Europe |
|
|
46,442 |
|
|
8,711 |
|
|
|
2,188 |
|
|
Asia |
|
|
6,218 |
|
|
186 |
|
|
|
— |
|
|
Total |
|
$ |
70,977 |
|
$ |
(28,284) |
|
|
$ |
(22,336) |
|
|
|
|
|
|
|
|
|
|
|
|
|
|
|
Adjusted EBITDA |
|
|
|
|
|
|
|
|
|
|
|
|
North America |
|
$ |
97,001 |
|
$ |
71,290 |
|
|
$ |
7,390 |
|
|
Europe |
|
|
126,350 |
|
|
46,816 |
|
|
|
3,081 |
|
|
Asia |
|
|
7,611 |
|
|
684 |
|
|
|
— |
|
|
Total |
|
$ |
230,962 |
|
$ |
118,790 |
|
|
$ |
10,471 |
|
North America
North American operating income (loss) was $(24.5) million, $(37.2) million and $18.3 million for the period from July 1, 2013 to August 14, 2013, the period from August 15, 2013 to June 30, 2014 and the fiscal year ended June 30, 2015, respectively.
North American Adjusted EBITDA was $7.4 million, $71.3 million and $97.0 million for the period from July 1, 2013 to August 14, 2013, the period from August 15, 2013 to June 30, 2014 and the fiscal year ended June 30, 2015, respectively.
North American operating income and Adjusted EBITDA increased for the period from August 15, 2013 to June 30, 2014, compared to the fiscal year ended June 30, 2015, principally due to (i) the period from August 15, 2013 to June 30, 2014 is shorter than the fiscal year ended June 30, 2015 by 1.5 months and (ii) the acquisition of ASG in November 2014 which has the majority of its operations in North America, offset by transaction costs associated with the acquisition of ASG. North American operating loss for the period from July 1, 2013 to August 14, 2013 was lower than the loss for the period August 14, 2013 to June 30, 2014 (and Adjusted EBITDA was higher) principally due to (i) the costs associated with the inclusion of the results of Chesapeake in the June 30, 2014 period, (ii) the transaction costs during the June 30, 2014 period related to the Chesapeake merger and other acquisitions discussed previously, as well as (iii) the amortization of step up adjustments from the fair valuation of assets and liabilities related to the acquisition accounting.
Europe
Europe operating income (loss) was $2.2 million, $8.7 million and $46.4 million for the period from July 1, 2013 to August 14, 2013, the period from August 15, 2013 to June 30, 2014 and the fiscal year ended June 30, 2015, respectively.
Europe Adjusted EBITDA was $3.1 million, $46.8 million and $126.4 million for the period from July 1, 2013 to August 14, 2013, the period from August 15, 2013 to June 30, 2014 and the fiscal year ended June 30, 2015, respectively.
Europe operating income and Adjusted EBITDA increased for the period from August 15, 2013 to June 30, 2014,
53
compared to the fiscal year ended June 30, 2015, principally due to (i) the period from August 15, 2013 to June 30, 2014 is shorter than the fiscal year ended June 30, 2015 by 1.5 months and (ii) the inclusion of a full year of operations of Chesapeake in the June 30, 2015 results which had the majority of its operations in Europe, offset by transaction costs associated with the merger of Chesapeake. Europe operating income and Adjusted EBITDA for the period from July 1, 2013 to August 14, 2013 was higher than the operating income and Adjusted EBITDA for the period August 14, 2013 to June 30, 2014 principally due to (i) the inclusion of the results of Chesapeake in the June 30, 2014 period, (ii) the transaction costs during the June 30, 2014 period related to the Chesapeake merger and other acquisitions discussed previously, as well as (iii) the amortization of step up adjustments from the fair valuation of assets and liabilities related to the acquisition accounting.
Asia
Asia operating income (loss) was $0, $0.2 million and $6.2 million for the period from July 1, 2013 to August 14, 2013, the period from August 15, 2013 to June 30, 2014 and the fiscal year ended June 30, 2015, respectively.
Asia Adjusted EBITDA was $0, $0.7 million and $7.6 million for the period from July 1, 2013 to August 14, 2013, the period from August 15, 2013 to June 30, 2014 and the fiscal year ended June 30, 2015, respectively.
Asia operating income and Adjusted EBITDA increased for the period from August 15, 2013 to June 30, 2014, compared to the fiscal year ended June 30, 2015, principally due to (i) the period from August 15, 2013 to June 30, 2014 is shorter than the fiscal year ended June 30, 2015 by 1.5 months, and (ii) the inclusion of the results of the ASG acquisition which was acquired in November 2014 and had operations in China. Asia operating income and Adjusted EBITDA for the period from July 1, 2013 to August 14, 2013 was higher than the operating income and Adjusted EBITDA for the period August 14, 2013 to June 30, 2014 principally due to the (i) the inclusion of the results of Chesapeake in the June 30, 2014 period (the predecessor did not have operations in Asia.
Liquidity and Capital Resources
At June 30, 2016 and 2015, the Company had cash and cash equivalents of $44.8 million and $55.7 million, respectively, of which $31.1 million and $39.6 million, respectively, were held outside the United States. Liquidity is affected by many factors, some of which are based on normal ongoing operations of the Company’s business and some of which arise from fluctuations related to global economics and markets. Cash balances are generated and held in many locations throughout the world. It is the Company’s current intent to indefinitely reinvest the earnings of its subsidiaries in those respective jurisdictions and its current plans do not demonstrate a need to repatriate them to the parent company. If these funds were needed for the Company’s operations in other jurisdictions, it may be required to record and pay significant income taxes to repatriate these funds to the parent company. Additionally, local government regulations may restrict the Company’s ability to move cash balances to meet cash needs under certain circumstances. The Company currently does not expect such regulations and restrictions to impact its ability to make acquisitions or to pay vendors and conduct operations throughout the global organization.
On October 27, 2015, the Company completed its initial public offering of 16,500,000 common shares at a price of $13.00 per share. In connection with the offering, funds controlled by Carlyle and certain current and former employees sold 1,000,000 common shares (which was included in the 16,500,000 common shares). The Company utilized $182.4 million of the offering proceeds to reduce the Company’s first lien term loans. The underwriters also exercised their rights to purchase an additional 2,475,000 common shares from certain of the selling shareholders, including investment funds controlled by Madison Dearborn and Carlyle, at the public offering price, less the underwriting discount. The Company did not receive any of the proceeds from the shares sold by selling shareholders.
On June 8, 2016, a secondary offering was completed, and the selling shareholders in the offering sold 10,000,000 common shares. The underwriters also exercised their rights to purchase an additional 1,500,000 common shares from the selling shareholders. The Company did not receive any of the proceeds from the secondary offering
54
As of June 30, 2016, we had $48.8 million in borrowing capacity under our U.S. dollar revolving credit facility, net of $1.2 million of outstanding letters of credit, and £50.0 million ($67.0 million as of June 30, 2016) in borrowing capacity available under our Pounds Sterling revolving credit facility. As of June 30, 2016 and 2015, total debt, net of cash, was $863.1 million and $1.13 billion, respectively. Our borrowing agreements are described further in Note 13 to the consolidated financial statements. Working capital was $216.7 million as compared to $199.9 million and the current ratio was 1.8 to one as compared to 1.7 to one as of the same dates, respectively. The increase in working capital is principally due to working capital acquired as part of the fiscal 2016 acquisitions described above.
We believe that our cash on hand at June 30, 2016, as well as projected cash flows from operations and availability under our Credit Agreement are sufficient to fund our working capital needs in the ordinary course of business, anticipated capital expenditures, and other cash requirements, including any restructuring activities completed by the Company, for at least the next twelve months.
Cash flow provided by (used in) operating activities, investing activities and financing activities is summarized in the following table:
|
|
|
Successor |
|
|
Predecessor |
|
||||||||
|
|
|
Fiscal Year Ended |
|
Period from August |
|
|
Period from July 1, |
|
||||||
|
|
|
June 30, |
|
15, 2013 through |
|
|
2013 through |
|
||||||
|
(amounts in thousands) |
|
2016 |
|
2015 |
|
June 30, 2014 |
|
|
August 14, 2013 |
|
||||
|
Cash flows provided by (used in): |
|
|
|
|
|
|
|
|
|
|
|
|
|
|
|
Operating activities |
|
$ |
132,672 |
|
$ |
108,617 |
|
$ |
19,930 |
|
|
$ |
(964) |
|
|
Investing activities |
|
|
(65,710) |
|
|
(190,104) |
|
|
(154,208) |
|
|
|
(2,762) |
|
|
Financing activities |
|
|
(79,280) |
|
|
109,828 |
|
|
145,068 |
|
|
|
(794) |
|
|
Effect of exchange rate changes |
|
|
1,412 |
|
|
(199) |
|
|
97 |
|
|
|
50 |
|
|
Net (decrease) increase in cash and cash equivalents |
|
$ |
(10,906) |
|
$ |
28,142 |
|
$ |
10,887 |
|
|
$ |
(4,470) |
|
Cash Flow Provided by Operating Activities
Cash flow provided by operating activities for the fiscal year ended June 30, 2016 increased by $24.0 million when compared to the prior fiscal year, principally due to the increase in net income and other non-cash items. The increase in net income and other non-cash items was $42.5 million in the current fiscal year as compared to the prior fiscal year. This increase was partially offset by a net increase in the change in working capital accounts of $18.5 million as compared to the prior fiscal year, which was principally the result of timing of receivable collections.
Cash Flow Used in Investing Activities
Cash flow used in investing activities for the fiscal year ended June 30, 2016 was $65.7 million, which was primarily related to current fiscal year capital expenditures of $59.0 million and $10.7 million of net cash paid to acquire BluePrint and CPT. Capital expenditures during fiscal 2015 were $59.5 million, while cash paid in connection with acquisitions totaled $137.3 million, principally due to the acquisition of ASG.
55
Cash Flow (Used in) Provided by Financing Activities
Cash flow used in financing activities was $79.3 million for the fiscal year ended June 30, 2016 compared to cash flow provided by financing activities of $109.8 million for fiscal 2015, a change of $189.1 million. The change is principally due to the lending activity in the prior fiscal year associated with the acquisition of ASG, and the early repayment of debt from available cash balances of $55.2 million in the current period (initial public offering proceeds were generally offset by the related payment of term loans).
Contractual Obligations
The following table summarizes our contractual obligations as June 30, 2016.
|
(amounts in thousands) |
|
Total |
|
Less than 1 year |
|
1-3 years |
|
3-5 years |
|
More than 5 years |
|
|||||
|
Debt obligations - Term Loans (1) |
|
$ |
852,225 |
|
$ |
41,761 |
|
$ |
82,253 |
|
$ |
728,211 |
|
$ |
— |
|
|
Debt obligations - Bonds (1) |
|
|
287,833 |
|
|
17,000 |
|
|
34,000 |
|
|
34,000 |
|
|
202,833 |
|
|
Debt obligations - Other (2) |
|
|
4,712 |
|
|
2,805 |
|
|
1,907 |
|
|
— |
|
|
— |
|
|
Debt obligations - Capital Leases |
|
|
705 |
|
|
658 |
|
|
47 |
|
|
— |
|
|
— |
|
|
Pension obligations (3) |
|
|
4,247 |
|
|
2,332 |
|
|
1,789 |
|
|
126 |
|
|
— |
|
|
Multi-employer pension obligations (4) |
|
|
14,265 |
|
|
916 |
|
|
1,833 |
|
|
1,833 |
|
|
9,683 |
|
|
Operating lease obligations |
|
|
66,792 |
|
|
13,941 |
|
|
19,696 |
|
|
16,621 |
|
|
16,534 |
|
|
Purchase obligations (5) |
|
|
68,532 |
|
|
67,046 |
|
|
590 |
|
|
477 |
|
|
419 |
|
|
Total |
|
$ |
1,299,311 |
|
$ |
146,459 |
|
$ |
142,115 |
|
$ |
781,268 |
|
$ |
229,469 |
|
|
(1) |
Includes principal and interest payments, which for our Term Loans are based on variable interest rates as of June 30, 2016. |
|
(2) |
Consists of other foreign borrowings and estimated cash flows associated with our outstanding interest rate swaps. |
|
(3) |
Represents minimum required contributions for our defined benefit plans as described in Note 12 to the consolidated financial statements. |
|
(4) |
Represents future payments, including interest, associated with the withdrawal from multi-employer pension plans as described in Note 12 to the consolidated financial statements. |
|
(5) |
Represents an estimate of inventory purchase orders and other contractual obligations for information technology and facilities related expenditures. |
Off-Balance Sheet Arrangements
The Company has no off-balance sheet arrangements.
Critical Accounting Policies and Estimates
The discussion and analysis of our financial condition and results of operations is based on our consolidated financial statements, which are prepared in accordance with accounting principles generally accepted in the United States. Our significant accounting policies are described in Note 2, Summary of Significant Accounting Policies in the Notes to Consolidated Financial Statements. The policies below have been identified as the critical accounting policies we use which require us to make estimates and assumptions and exercise judgment that affect the reported amounts of assets and liabilities at the date of the financial statements and amounts of income and expenses during the reporting periods presented. We believe in the quality and reasonableness of our critical accounting estimates; however, materially different amounts might be reported under different conditions or using assumptions, estimates or making judgments different from those that we have applied. Our critical accounting policies are as follows, including our methodology for estimates made and assumptions used:
56
Accounts Receivable and Allowance for Doubtful Accounts
Accounts receivable are presented net of an allowance for doubtful accounts of $2.5 million and $2.9 million as of June 30, 2016 and 2015, respectively. The allowance for doubtful accounts reduces receivables to amounts that are expected to be collected. In estimating the allowance, management considers factors such as current overall and industry-specific economic conditions, statutory requirements, historical and anticipated customer performance, historical experience with write-offs and the level of past-due amounts. Changes in these conditions may result in additional allowances. After all attempts to collect a receivable have failed, the receivable is written off against the allowance.
Inventories
Inventories are stated at the lower of cost or market value. Inventory costs include materials, labor and manufacturing overhead. Cost is determined by the first-in, first-out method. Obsolete inventory is identified based on an analysis of inventory for known obsolescence issues and a write-down or write-off is provided based on this analysis.
Property, Plant and Equipment
Property, plant and equipment was adjusted to fair value on August 15, 2013, which represents a new cost basis. Expenditures for maintenance and repairs are charged to current operations; while major improvements that materially extend useful lives are capitalized. Depreciation is computed over the estimated useful lives of the assets using the straight-line method as follows:
|
Buildings and improvements |
3-40 years |
|
Machinery and equipment |
3-13 years |
|
Furniture and fixtures |
3-7 years |
Depreciation expense was $73.7 million, $78.0 million, $41.8 million and $2.8 million for the fiscal years ended June 30, 2016 and 2015, the period from August 15, 2013 through June 30, 2014 and the period from July 1, 2013 through August 14, 2013, respectively.
Goodwill and Intangible Assets
Goodwill represents the cost of acquired businesses in excess of the fair value of the assets acquired and liabilities assumed of such businesses at the acquisition date. Goodwill is not amortized, but is subject to impairment tests. We review the carrying amounts of goodwill by reporting unit at least annually on April 1 (the annual assessment date), or more frequently when indicators of impairment are present, to determine if goodwill may be impaired. We may first assess qualitative factors to determine whether it is more likely than not that the fair value of goodwill is less than its carrying value. We would not be required to quantitatively determine the fair value of goodwill unless we determine, based on the qualitative assessment, that it is more likely than not that its fair value is less than the carrying value.
If we determine that it is more likely than not that the fair value is less than the carrying value based on the qualitative assessment, a quantitative assessment based upon discounted cash flow and market approach analyses is performed to determine the estimated fair value of the reporting units. We include assumptions about expected future operating performance as part of a discounted cash flow analysis to estimate fair value. If the carrying value of goodwill is not recoverable, based on the discounted cash flow analysis, management performs the next step, which compares the fair value of the reporting unit to the carrying value of the tangible and intangible net assets of the reporting unit. Goodwill is considered impaired if the recorded fair value of the tangible and intangible net assets exceeds the fair value of the reporting unit.
We did not recognize any impairment charges for goodwill during any of the periods presented, as our annual impairment testing indicated that all reporting unit goodwill fair values exceeded their respective carrying values.
57
Intangible assets have been acquired through various business acquisitions and include customer relationships, developed technology, licensing agreements, and a photo library. The intangible assets are initially valued at their acquisition date using either a discounted cash flow model or relief from royalty method. The relief of royalty method is used for developed technology and licensing agreement and assumes that if the acquired company did not own the intangible asset or intellectual property, it would be willing to pay a royalty for its use. The benefit of ownership of the intellectual property is valued as the relief from the royalty expense that would otherwise be incurred. Intangible assets are amortized on a straight-line basis which approximates the expected cash flows generated from such assets, except for customer relationship intangibles that are amortized on an accelerated basis. Useful lives vary by asset type and are determined based on the period over which the intangible asset is expected to contribute directly or indirectly to the company’s future cash flows.
Impairment of Long-Lived Assets
We review our definite-lived long-lived assets for impairment whenever events or changes in circumstances indicate that carrying amount of the asset may not be recoverable. Such circumstances could include, but are not limited to (1) a significant decrease in the market value of an asset, (2) a significant adverse change in the extent or manner in which an asset is used, or (3) an accumulation of costs significantly in excess of the amount originally expected for the acquisition of an asset. We measure the carrying amount of the asset against the estimated undiscounted future cash flows associated with it. Should the carrying value of the asset being evaluated exceed the estimated undiscounted future cash flows, an impairment loss would be indicated, at which point recognition of the impairment would occur based on a determination of the asset’s fair value. There was no impairment with respect to our definite-lived long-lived assets for any periods presented.
Derivative Instruments
We use derivative instruments to manage our exposure to certain risks relating to its ongoing business operations. We have not elected hedge accounting for these derivative instruments, and accordingly are valued at fair value with unrealized gains or losses reported in earnings during the period of the change. No derivative instruments are entered into for speculative purposes.
One risk we manage using derivative instruments is interest rate risk. To manage interest rate exposure, we enter into hedge transactions (interest rate swaps) using derivative financial instruments. The objective of entering into interest rate swaps is to eliminate the variability of cash flows in the LIBOR interest payments associated with variable-rate loans over the life of the loans. As changes in interest rates affect the future cash flow of interest payments, the hedges provide a synthetic offset to interest rate movements.
We are also exposed to foreign-currency exchange-rate fluctuations in the normal course of business, primarily related to Pounds Sterling, Euros, Mexican Peso, Canadian Dollar and the Polish Zloty denominated assets and liabilities within its international subsidiaries whose functional currency is other than the U.S. dollar. We manage these fluctuations, in part, using non-deliverable forward foreign exchange contracts and foreign currency forward contracts, that are intended to offset changes in cash flow attributable to currency exchange movements. These contracts are intended primarily to economically address exposure merchandise inventory expenditures made by our international subsidiaries whose functional currency is other than the U.S. dollar.
Revenue Recognition
We produce packaging products, principally cartons, labels, inserts and rigid packaging for sale to manufacturers of branded and private label consumer goods, pharmaceutical, medical and multi-media products. Products are printed on board, paper or plastic substrates and converted via printing presses and oftentimes subsequently finished in a folding or gluing or other operation. We record revenue on the sales of products manufactured when title to the product transfers, which is generally at the time of shipment to the customer.
In all of the above cases, revenue is recorded only when (i) persuasive evidence of an arrangement exists, (ii) delivery has occurred, (iii) the fee is fixed and determinable and (iv) collectability of the sales is reasonably assured. Provisions for discounts and rebates to customers, estimated returns and allowances and other adjustments are provided for in the same period the related sales are recorded when they are determined to be probable and estimable.
58
Equity-Based Compensation
The 2014 Equity Incentive Plan (the “2014 Plan”) provided for profits interests and restricted capital interests in Mustang Investment Holdings L.P. (“Holdings”) to be granted to directors, officers and employees of the Company. All the awards under the 2014 Plan were remeasured to their estimated fair value quarterly similar to liability awards as the awards are held in the equity interests of an equity method investee company. The profits interest awards included service- and performance-based awards, while the capital interest awards were all service-based. Time-vesting profits interests vested 20% per year on each of the first five anniversaries of August 15, 2013, as per the applicable award agreement. All performance-vesting profits interests would vest based on Holdings’ principal investors obtaining various thresholds of an internal rate of return as defined in the 2014 Plan, which represents a performance condition. On October 22, 2015, the Company completed its initial public offering and in connection with the initial public offering the performance-vesting profits interests vested and the Company accelerated the vesting of the time-vesting profits interest and capital interests.
We used the Black-Scholes option pricing model to measure the fair value of profits interest and restricted capital interest awards. We chose the Black-Scholes model based on our experience with the model and the determination that the model could be used to provide a reasonable estimate of the fair value of awards with terms such as those issued by us. Option-pricing models require estimates of a number of key valuation inputs including: fair value of the underlying common stock, expected volatility, expected dividend yield, expected term and risk-free interest rate. Certain of these inputs are subjective since the Company was privately-held and did not have objective historical or public market value information. The most subjective inputs were the expected term, expected volatility and determination of equity value. The expected term was determined using probability weighted expectations and expected volatility is determined using a selected group of guideline companies which are comparable to the Company.
We utilized and equally weighed three widely recognized valuation models to estimate the fair value of Holdings equity:
|
· |
Discounted Cash Flow Analysis (Income Model) — The discounted cash flow analysis is dependent on a number of significant management assumptions regarding the expected future financial results of us and Holdings as well as upon estimates of an appropriate cost of capital. |
|
· |
Guideline Public Companies (Market Model) — Multiples of historical and projected EBITDA determined based on guideline public companies are applied to estimate the fair value for the equity of Holdings. |
|
· |
Mergers and Acquisition (Market Model) — Multiples of historical equity value divided by last twelve months revenues, and equity value by last twelve months, EBITDA for mergers and acquisitions of companies in the same industry. |
As an input to the Black-Scholes model, and for valuation of the profits interest and restricted capital interest awards, we estimated the fair value of Holdings equity quarterly. After considering all of these estimates of fair value, we then determined a single estimated fair value of the equity of Holdings to be used in the Black-Scholes model to determine the fair value of the profit interest and restricted capital interest awards and equity-based compensation expense.
In connection with Carlyle’s acquisition of Chesapeake, certain members of Chesapeake’s management were allowed to co-invest with Carlyle in an entity controlled by Carlyle that holds an investment in the Company. At the time of the grant, those members of management that invested alongside Carlyle received a specified number of ordinary shares, which were subject to a performance-based ratchet (the “Ratchet”). Pursuant to the Ratchet, members of management’s ownership percentage can increase based on Chesapeake completing an “Exit” that results in a specified return on invested capital (“MOIC”) and internal rate of return (“IRR”) for certain investors. An Exit is defined as the completion of a liquidating event, which includes the completion of an initial public offering. Since a liquidity event, including an initial public offering, is generally not probable until it occurs, no compensation cost had been recognized in the financial statements through the initial public offering date. On October 22, 2015, the Company completed its initial public offering and accordingly the performance-based units vested and the Company recognized stock based compensation expense of approximately $9.5 million during fiscal 2016. The expense at the time of the initial public offering was calculated using the initial public offering stock price of $13 per share on a per share equivalent basis of Carlyle shares, less a lack of marketability discount rate due to the shares not being freely tradeable by the members of management.
59
In connection with our initial public offering, outstanding equity awards held by certain members of our management vested in full, which triggered a related expense in fiscal 2016 comprised of an approximately $26.2 million non-cash compensation expense and an approximately $0.7 million cash expense related to taxes that we were required to pay in Europe as a result of the vesting of these awards. These expenses related to existing equity awards granted to management prior to our IPO, the vesting of which did not result in any additional dilution to shareholders at the time of the initial public offering.
The assumptions used in estimating the fair value of equity-based payment awards represent management’s best estimates, but these estimates involve inherent uncertainties and the application of management judgment. As a result, if factors change and we use different assumptions, equity-based compensation expense could be different in the future.
Following our initial public offering, our common shares became publicly traded and certain key valuation inputs, which are used to estimate the fair value of equity-based compensation, are now based on publicly available information. These key valuation inputs include the fair value of the common shares, and once there is a sufficient trading history, the volatility is expected to be derived from the historical trading activity of the common shares.
Refer to Note 18, Stock Based Compensation, in the Notes to Consolidated Financial Statements for details regarding our equity-based compensation plans.
Income Taxes
We recognize income taxes in accordance with guidance established by U.S. GAAP, which requires an asset and liability approach for financial accounting and reporting for income taxes and establishes a minimum threshold for financial statement recognition of the benefit of tax positions, and requires certain expanded disclosures. The provision for income taxes is based upon income or loss after adjustment for those items that are not considered in the determination of taxable income.
Deferred income taxes represent the tax effects of differences between the financial reporting and tax bases of our assets and liabilities at the enacted tax rates in effect for the years in which the differences are expected to reverse. We evaluate the recoverability of deferred tax assets and establishes a valuation allowance when it is more likely than not that some portion or all of the deferred tax assets will not be realized.
Recent Accounting Pronouncements
See Note 2, Summary of Significant Accounting Policies, in the Notes to Consolidated Financial Statements for information regarding recent accounting pronouncements.
60
Supplementary Quarterly Financial Data
Unaudited quarterly financial data (in thousands, except per share amounts) for fiscal 2016 and 2015 is summarized as follows. Quarterly net income per share is calculated using the weighted-average shares outstanding during each quarterly period, while net income per share for the full year is calculated using the weighted-average shares outstanding during the year. Therefore, the sum of the net income per share for each of the four quarters may not equal the net income per share for the full year.
|
|
|
Three Months Ended |
|
||||||||||
|
|
|
June 30, |
|
March 31, |
|
December 31, |
|
September 30, |
|
||||
|
Net sales |
|
$ |
373,836 |
|
$ |
399,184 |
|
$ |
429,357 |
|
$ |
459,051 |
|
|
Gross profit |
|
$ |
72,595 |
|
$ |
86,747 |
|
$ |
95,725 |
|
$ |
99,341 |
|
|
Operating income |
|
$ |
10,280 |
|
$ |
26,013 |
|
$ |
7,123 |
|
$ |
40,679 |
|
|
Consolidated net income (loss) |
|
$ |
(7,366) |
|
$ |
3,613 |
|
$ |
(8,004) |
|
$ |
13,084 |
|
|
Net income (loss) attributable to shareholders |
|
$ |
(6,741) |
|
$ |
3,783 |
|
$ |
(7,917) |
|
$ |
13,007 |
|
|
|
|
|
|
|
|
|
|
|
|
|
|
|
|
|
Net income (loss) attributable to shareholders per share - basic and diluted |
|
$ |
(0.09) |
|
$ |
0.05 |
|
$ |
(0.11) |
|
$ |
0.21 |
|
Transaction related expenses of $1,053, $371, $2,064 and $350, stock-based and deferred compensation expenses (credits) of $(295), $104, $27,232 and $(272), and restructuring related charges of $6,415, $693, $750 and $2,826 were recorded in the three months ended June 30, 2016, March 31, 2016, December 31, 2015 and September 30, 2015, respectively. Additionally, debt extinguishment costs of $37, $64 and $3,867 were recorded in the three months ended June 30, 2016, March 31, 2016 and December 31, 2015, respectively.
|
|
|
Three Months Ended |
|
||||||||||
|
|
|
June 30, |
|
March 31, |
|
December 31, |
|
September 30, |
|
||||
|
Net sales |
|
$ |
402,524 |
|
$ |
416,207 |
|
$ |
404,827 |
|
$ |
394,082 |
|
|
Gross profit |
|
$ |
82,920 |
|
$ |
84,330 |
|
$ |
82,334 |
|
$ |
82,383 |
|
|
Operating income |
|
$ |
9,483 |
|
$ |
18,830 |
|
$ |
16,461 |
|
$ |
26,203 |
|
|
Consolidated net income (loss) |
|
$ |
(4,857) |
|
$ |
6,990 |
|
$ |
(2,395) |
|
$ |
7,288 |
|
|
Net income (loss) attributable to shareholders |
|
$ |
(4,859) |
|
$ |
6,783 |
|
$ |
(2,432) |
|
$ |
7,007 |
|
|
|
|
|
|
|
|
|
|
|
|
|
|
|
|
|
Net income (loss) attributable to shareholders per share - basic and diluted |
|
$ |
(0.08) |
|
$ |
0.11 |
|
$ |
(0.04) |
|
$ |
0.11 |
|
Transaction related expenses of $7,532, $1,914, $3,463 and $721, stock-based and deferred compensation expenses of $4,319, $517, $455 and $431, and restructuring related charges of $929, $1,700, $3,086 and $704 were recorded in the three months ended June 30, 2015, March 31, 2015, December 31, 2014 and September 30, 2014, respectively. Additionally, debt extinguishment costs of $1,019 were recorded in the three months ended June 30, 2015.
Item 7A.Quantitative and Qualitative Disclosures about Market Risk
We are exposed to changes in interest rates and foreign currency exchange rates because we finance certain operations through fixed and variable rate debt instruments and denominate our transactions in a variety of foreign currencies. We
61
are also exposed to changes in the prices of certain commodities that we use in production. Changes in these rates and commodity prices may have an impact on future cash flow and earnings.
We manage these risks through normal operating and financing activities and, when deemed appropriate, through the use of derivative financial instruments. We do not enter into financial instruments for trading or speculative purposes.
By using derivative instruments, we are subject to credit and market risk. The fair market value of the derivative instruments is determined by using valuation models whose inputs are derived using market observable inputs, including interest rate yield curves, and reflects the asset or liability position as of the end of each reporting period. When the fair value of a derivative contract is positive, the counterparty owes us, thus creating a receivable risk for us. We are exposed to counterparty credit risk in the event of non-performance by counterparties to our derivative agreements. We minimize counterparty credit (or repayment) risk by entering into transactions with major financial institutions of investment grade credit rating.
Our exposure to market risk is not hedged in a manner that completely eliminates the effects of changing market conditions on earnings or cash flow.
Interest Rate Risk
We are subject to interest rate market risk in connection with our borrowings. The term loans under our senior secured credit facilities includes a floor (which is 1.0%) on the applicable benchmark London Interbank Offered Rate (“LIBOR”), Euro Interbank Offered Rate (“EURIBOR”) or prime rate, which is currently in excess of the specified LIBOR, EURIBOR or prime rate that would otherwise apply. Based on these outstanding balances as of June 30, 2016 including the impact from our related outstanding interest rate swaps, and should the applicable rate exceed the 1.0% floor, each 0.125% change in interest rates would result in an approximate $0.6 million change in annual interest expense.
We selectively use derivative instruments to reduce market risk associated with changes in interest rates. The use of derivatives is intended for hedging purposes only and we do not enter into derivative instruments for speculative purposes. The Company maintains two amortizing interest rate swaps that mature in December 2017. The swaps are being used to hedge the exposure to changes in the market LIBOR or EURIBOR rates. At June 30, 2016, one of the swaps had a notional amount of £84.6 million whereby the Company pays a fixed rate of interest of 1.1649% and receives a variable rate based on LIBOR on the amortizing notional amount. The other swap had a notional amount of €97.8 million whereby the Company pays a fixed rate of interest of 1.0139% and receives a variable rate based on EURIBOR (Euro Interbank Offered Rate) on the amortizing notional amount. As of June 30, 2016 and 2015, the swaps had a negative fair value of $3.6 million and $3.0 million, respectively, which is included in other long-term liabilities in the consolidated balance sheets.
Foreign Exchange Rates Risk
We are exposed to foreign currency risk by virtue of our international operations. Our exposure to foreign exchange relates to our European, Mexican, Canadian and Chinese facilities which have Pounds Sterling, Euro, Polish Zloty, Mexican Peso, Canadian Dollar and Chinese Yuan denominated assets and liabilities, and functional currencies. In the majority of our jurisdictions, we earn net sales and incur costs in the local currency of such jurisdiction; however they are not perfectly matched. Movements in exchange rates could cause our expenses to fluctuate, impacting our future profitability and cash flows. Our future business operations and opportunities, including the continued expansion of our business outside North America, may further increase the risk that cash flows resulting from these activities may be adversely affected by changes in currency exchange rates.
Our Sterling Term Loan and Euro Term Loan are denominated in Pounds Sterling and Euros, respectively. As a result, movements in the Pounds Sterling and Euro exchange rate in relation to the U.S. dollar could cause the amount of Sterling Term Loan and Euro Term Loan borrowings to fluctuate, impacting our future profitability and cash flows.
We translate our statements of operations into U.S. dollars at exchange rates for the periods presented. During fiscal 2016 and 2015, net sales were negatively impacted by exchange rate changes by approximately $77.2 million and $68.6 million, respectively.
62
A hypothetical change of 10% in average exchange rates used to translate Pounds Sterling, Euro, Polish Zloty, Mexican Peso, Canadian Dollar and Chinese Yuan to U.S. dollars would have impacted operating income by approximately $9.3 million for the fiscal year ended June 30, 2016.
63
Item 8.Financial Statements and Supplementary Data
Report of Independent Registered Public Accounting Firm
The Board of Directors and Shareholders of
Multi Packaging Solutions International Limited
We have audited the accompanying consolidated balance sheets of Multi Packaging Solutions International Limited and subsidiaries (the “Company”) as of June 30, 2016 and 2015 (Successor), and the related consolidated statements of operations and comprehensive income (loss), shareholders’ equity and cash flows for the fiscal years ended June 30, 2016 and 2015 (Successor), for the period from August 15, 2013 to June 30, 2014 (Successor) and for the period from July 1, 2013 to August 14, 2013 (Predecessor). Our audits also included the financial statement schedule listed in the Index at Item 15(a). These financial statements and schedule are the responsibility of the Company’s management. Our responsibility is to express an opinion on these financial statements and schedule based on our audits.
We conducted our audits in accordance with the standards of the Public Company Accounting Oversight Board (United States). Those standards require that we plan and perform the audit to obtain reasonable assurance about whether the financial statements are free of material misstatement. We were not engaged to perform an audit of the Company’s internal control over financial reporting. Our audits included consideration of internal control over financial reporting as a basis for designing audit procedures that are appropriate in the circumstances, but not for the purpose of expressing an opinion on the effectiveness of the Company’s internal control over financial reporting. Accordingly, we express no such opinion. An audit also includes examining, on a test basis, evidence supporting the amounts and disclosures in the financial statements, assessing the accounting principles used and significant estimates made by management, and evaluating the overall financial statement presentation. We believe that our audits provide a reasonable basis for our opinion.
In our opinion, the financial statements referred to above present fairly, in all material respects, the consolidated financial position of Multi Packaging Solutions International Limited and subsidiaries at June 30, 2016 and 2015 (Successor), and the consolidated results of their operations and their cash flows for the fiscal years ended June 30, 2016 and 2015 (Successor), for the period from August 15, 2013 to June 30, 2014 (Successor) and for the period from July 1, 2013 to August 14, 2013 (Predecessor) in conformity with U.S. generally accepted accounting principles. Also, in our opinion, the related financial statement schedule, when considered in relation to the basic financial statements taken as a whole, presents fairly in all material respects the information set forth therein.
/s/ Ernst & Young LLP
Detroit, Michigan
August 23, 2016
64
MULTI PACKAGING SOLUTIONS INTERNATIONAL LIMITED
AND SUBSIDIARIES
CONSOLIDATED BALANCE SHEETS
(in thousands, except share amounts)
ASSETS
|
|
|
Successor |
|
||||
|
|
|
June 30, |
|
June 30, |
|
||
|
|
|
2016 |
|
2015 |
|
||
|
Current assets |
|
|
|
|
|
|
|
|
Cash and cash equivalents |
|
$ |
44,769 |
|
$ |
55,675 |
|
|
Accounts receivable, net |
|
|
237,179 |
|
|
240,110 |
|
|
Inventories |
|
|
165,617 |
|
|
171,836 |
|
|
Prepaid expenses and other current assets |
|
|
30,742 |
|
|
26,892 |
|
|
Total current assets |
|
|
478,307 |
|
|
494,513 |
|
|
|
|
|
|
|
|
|
|
|
Property, plant and equipment |
|
|
|
|
|
|
|
|
Land |
|
|
52,093 |
|
|
58,316 |
|
|
Buildings and improvements |
|
|
65,827 |
|
|
58,368 |
|
|
Machinery and equipment |
|
|
393,206 |
|
|
373,639 |
|
|
Furniture and fixtures |
|
|
15,580 |
|
|
13,056 |
|
|
Construction in progress |
|
|
12,689 |
|
|
12,255 |
|
|
Total |
|
|
539,395 |
|
|
515,634 |
|
|
Less: Accumulated depreciation |
|
|
(155,700) |
|
|
(86,691) |
|
|
Total property, plant and equipment, net |
|
|
383,695 |
|
|
428,943 |
|
|
|
|
|
|
|
|
|
|
|
Other assets |
|
|
|
|
|
|
|
|
Intangible assets, net |
|
|
340,858 |
|
|
419,733 |
|
|
Goodwill |
|
|
464,714 |
|
|
474,901 |
|
|
Deferred income taxes |
|
|
7,210 |
|
|
16,451 |
|
|
Other assets |
|
|
32,806 |
|
|
36,702 |
|
|
Total assets |
|
$ |
1,707,590 |
|
$ |
1,871,243 |
|
See notes to consolidated financial statements.
65
MULTI PACKAGING SOLUTIONS INTERNATIONAL LIMITED
AND SUBSIDIARIES
CONSOLIDATED BALANCE SHEETS
(in thousands, except share amounts)
LIABILITIES AND SHAREHOLDERS’ EQUITY
|
|
|
Successor |
|
||||
|
|
|
June 30, |
|
June 30, |
|
||
|
|
|
2016 |
|
2015 |
|
||
|
Current liabilities |
|
|
|
|
|
|
|
|
Accounts payable |
|
$ |
171,935 |
|
$ |
176,431 |
|
|
Payroll and benefits |
|
|
36,977 |
|
|
51,606 |
|
|
Other current liabilities |
|
|
40,892 |
|
|
46,097 |
|
|
Short-term foreign borrowings |
|
|
— |
|
|
3,488 |
|
|
Current portion of long-term debt |
|
|
7,307 |
|
|
10,964 |
|
|
Income taxes payable |
|
|
4,489 |
|
|
6,022 |
|
|
Total current liabilities |
|
|
261,600 |
|
|
294,608 |
|
|
|
|
|
|
|
|
|
|
|
Long-term debt, less current portion |
|
|
900,516 |
|
|
1,169,626 |
|
|
Deferred income taxes |
|
|
72,625 |
|
|
86,490 |
|
|
Other long-term liabilities |
|
|
29,955 |
|
|
31,829 |
|
|
Total liabilities |
|
|
1,264,696 |
|
|
1,582,553 |
|
|
|
|
|
|
|
|
|
|
|
Shareholders’ equity |
|
|
|
|
|
|
|
|
Authorized share capital – $1.00 par value, 1,000,000,000 shares authorized |
|
|
|
|
|
|
|
|
Preference shares – no shares issued |
|
|
— |
|
|
— |
|
|
Common shares – 77,452,946 and 61,939,432 issued and outstanding |
|
|
77,453 |
|
|
61,939 |
|
|
Additional paid-in capital |
|
|
469,698 |
|
|
278,695 |
|
|
Accumulated deficit |
|
|
(43,233) |
|
|
(45,365) |
|
|
Accumulated other comprehensive loss |
|
|
(63,290) |
|
|
(13,287) |
|
|
Total Multi Packaging Solutions International Limited shareholders’ equity |
|
|
440,628 |
|
|
281,982 |
|
|
Noncontrolling interest |
|
|
2,266 |
|
|
6,708 |
|
|
Total shareholders’ equity |
|
|
442,894 |
|
|
288,690 |
|
|
Total liabilities and shareholders’ equity |
|
$ |
1,707,590 |
|
$ |
1,871,243 |
|
See notes to consolidated financial statements.
66
MULTI PACKAGING SOLUTIONS INTERNATIONAL LIMITED
AND SUBSIDIARIES
CONSOLIDATED STATEMENTS OF OPERATIONS AND
COMPREHENSIVE INCOME (LOSS)
(in thousands, except per share amounts)
|
|
|
Successor |
|
|
Predecessor |
|
||||||||
|
|
|
Fiscal Year Ended |
|
Period from August |
|
|
Period from July 1, |
|
||||||
|
|
|
June 30, |
|
15, 2013 through |
|
|
2013 through |
|
||||||
|
|
|
2016 |
|
2015 |
|
June 30, 2014 |
|
|
August 14, 2013 |
|
||||
|
Net sales |
|
$ |
1,661,428 |
|
$ |
1,617,640 |
|
$ |
814,213 |
|
|
$ |
74,081 |
|
|
|
|
|
|
|
|
|
|
|
|
|
|
|
|
|
|
Cost of goods sold |
|
|
1,307,020 |
|
|
1,285,673 |
|
|
668,441 |
|
|
|
58,054 |
|
|
Gross profit |
|
|
354,408 |
|
|
331,967 |
|
|
145,772 |
|
|
|
16,027 |
|
|
|
|
|
|
|
|
|
|
|
|
|
|
|
|
|
|
Selling, general and administrative expenses |
|
|
|
|
|
|
|
|
|
|
|
|
|
|
|
Selling, general and administrative expenses |
|
|
239,706 |
|
|
241,638 |
|
|
133,678 |
|
|
|
9,868 |
|
|
Stock based and deferred compensation expense |
|
|
26,769 |
|
|
5,722 |
|
|
1,534 |
|
|
|
125 |
|
|
Transaction related expenses |
|
|
3,838 |
|
|
13,630 |
|
|
38,844 |
|
|
|
28,370 |
|
|
Total selling, general and administrative expenses |
|
|
270,313 |
|
|
260,990 |
|
|
174,056 |
|
|
|
38,363 |
|
|
|
|
|
|
|
|
|
|
|
|
|
|
|
|
|
|
Operating income (loss) |
|
|
84,095 |
|
|
70,977 |
|
|
(28,284) |
|
|
|
(22,336) |
|
|
|
|
|
|
|
|
|
|
|
|
|
|
|
|
|
|
Other (expense) income, net |
|
|
(6,403) |
|
|
10,625 |
|
|
370 |
|
|
|
1,063 |
|
|
Debt extinguishment charges |
|
|
(3,967) |
|
|
(1,019) |
|
|
— |
|
|
|
(14,042) |
|
|
Interest expense |
|
|
(64,543) |
|
|
(75,437) |
|
|
(43,215) |
|
|
|
(3,991) |
|
|
Total other expense, net |
|
|
(74,913) |
|
|
(65,831) |
|
|
(42,845) |
|
|
|
(16,970) |
|
|
|
|
|
|
|
|
|
|
|
|
|
|
|
|
|
|
Income (loss) before income taxes |
|
|
9,182 |
|
|
5,146 |
|
|
(71,129) |
|
|
|
(39,306) |
|
|
|
|
|
|
|
|
|
|
|
|
|
|
|
|
|
|
Income tax (expense) benefit |
|
|
(7,855) |
|
|
1,880 |
|
|
19,481 |
|
|
|
15,621 |
|
|
|
|
|
|
|
|
|
|
|
|
|
|
|
|
|
|
Consolidated net income (loss) |
|
|
1,327 |
|
|
7,026 |
|
|
(51,648) |
|
|
|
(23,685) |
|
|
|
|
|
|
|
|
|
|
|
|
|
|
|
|
|
|
Net (income) loss attributable to noncontrolling interest |
|
|
805 |
|
|
(527) |
|
|
(216) |
|
|
|
— |
|
|
|
|
|
|
|
|
|
|
|
|
|
|
|
|
|
|
Net income (loss) attributable to shareholders of |
|
|
2,132 |
|
|
6,499 |
|
|
(51,864) |
|
|
|
(23,685) |
|
|
|
|
|
|
|
|
|
|
|
|
|
|
|
|
|
|
Preferred stock dividends |
|
|
— |
|
|
— |
|
|
— |
|
|
|
(25) |
|
|
|
|
|
|
|
|
|
|
|
|
|
|
|
|
|
|
Net income (loss) attributable to common shareholders of |
|
$ |
2,132 |
|
$ |
6,499 |
|
$ |
(51,864) |
|
|
$ |
(23,710) |
|
|
|
|
|
|
|
|
|
|
|
|
|
|
|
|
|
|
Net income (loss) attributable to common shareholders of |
|
|
|
|
|
|
|
|
|
|
|
|
|
|
|
Basic |
|
$ |
0.03 |
|
$ |
0.10 |
|
$ |
(1.17) |
|
|
$ |
(203.74) |
|
|
Diluted |
|
$ |
0.03 |
|
$ |
0.10 |
|
$ |
(1.17) |
|
|
$ |
(203.74) |
|
|
|
|
|
|
|
|
|
|
|
|
|
|
|
|
|
|
Weighted-average number of common shares outstanding: |
|
|
|
|
|
|
|
|
|
|
|
|
|
|
|
Basic |
|
|
72,661 |
|
|
61,939 |
|
|
44,229 |
|
|
|
116 |
|
|
Diluted |
|
|
72,661 |
|
|
61,939 |
|
|
44,229 |
|
|
|
116 |
|
|
|
|
|
|
|
|
|
|
|
|
|
|
|
|
|
|
Other comprehensive income (loss) |
|
|
|
|
|
|
|
|
|
|
|
|
|
|
|
Cumulative foreign currency translation adjustment |
|
$ |
(44,371) |
|
$ |
(38,813) |
|
$ |
5,835 |
|
|
$ |
731 |
|
|
Adjustment on available-for-sale securities |
|
|
17 |
|
|
6 |
|
|
9 |
|
|
|
8 |
|
|
Pension adjustments |
|
|
(5,637) |
|
|
12,780 |
|
|
6,943 |
|
|
|
— |
|
|
Total other comprehensive (loss) income |
|
|
(49,991) |
|
|
(26,027) |
|
|
12,787 |
|
|
|
739 |
|
|
|
|
|
|
|
|
|
|
|
|
|
|
|
|
|
|
Comprehensive loss |
|
|
(48,664) |
|
|
(19,001) |
|
|
(38,861) |
|
|
|
(22,946) |
|
|
Comprehensive loss (income) attributable to non-controlling interests |
|
|
805 |
|
|
(151) |
|
|
(112) |
|
|
|
— |
|
|
Comprehensive loss attributable to shareholders of |
|
$ |
(47,859) |
|
$ |
(19,152) |
|
$ |
(38,973) |
|
|
$ |
(22,946) |
|
See notes to consolidated financial statements.
67
MULTI PACKAGING SOLUTIONS INTERNATIONAL LIMITED
AND SUBSIDIARIES
CONSOLIDATED STATEMENT OF SHAREHOLDERS’ EQUITY
(in thousands, except share amounts)
|
|
|
|
|
|
|
|
|
|
|
|
|
|
|
|
|
|
|
|
|
|
|
|
|
Accumulated |
|
|
|
|
|
|
|
|
|
|
|
|
|
|
|
|
|
|
Accumulated |
|
Additional |
|
|
|
|
|
|
|
Other |
|
Total |
|
||||
|
|
|
Series B Preferred |
|
Common Shares |
|
Dividends |
|
Paid-In |
|
Equity Secured |
|
Accumulated |
|
Comprehensive |
|
Shareholders’ |
|
||||||||||||
|
|
|
Shares |
|
Amount |
|
Shares |
|
Amount |
|
in Arrears |
|
Capital |
|
Receivables |
|
(Deficit) |
|
Income (Loss) |
|
Equity |
|
||||||||
|
Predecessor |
|
|
|
|
|
|
|
|
|
|
|
|
|
|
|
|
|
|
|
|
|
|
|
|
|
|
|
|
|
|
Balance at June 30, 2013 |
|
2,136 |
|
$ |
— |
|
116,373 |
|
$ |
1 |
|
$ |
378 |
|
$ |
210 |
|
$ |
(3,801) |
|
$ |
(128,281) |
|
$ |
(1,686) |
|
$ |
(133,179) |
|
|
Dividends accumulated |
|
— |
|
|
— |
|
— |
|
|
— |
|
|
25 |
|
|
(25) |
|
|
— |
|
|
— |
|
|
— |
|
|
— |
|
|
Contingent stock earned |
|
— |
|
|
— |
|
— |
|
|
— |
|
|
— |
|
|
52 |
|
|
— |
|
|
— |
|
|
— |
|
|
52 |
|
|
Net loss |
|
— |
|
|
— |
|
— |
|
|
— |
|
|
— |
|
|
— |
|
|
— |
|
|
(23,685) |
|
|
— |
|
|
(23,685) |
|
|
Stock compensation expense |
|
— |
|
|
— |
|
— |
|
|
— |
|
|
— |
|
|
53 |
|
|
— |
|
|
— |
|
|
— |
|
|
53 |
|
|
Contingent stock deposited in escrow |
|
(2,136) |
|
|
— |
|
— |
|
|
— |
|
|
(403) |
|
|
(898) |
|
|
— |
|
|
— |
|
|
— |
|
|
(1,301) |
|
|
Settlement of shareholder notes |
|
— |
|
|
— |
|
— |
|
|
— |
|
|
— |
|
|
— |
|
|
3,801 |
|
|
— |
|
|
— |
|
|
3,801 |
|
|
Other comprehensive income (loss) |
|
— |
|
|
— |
|
— |
|
|
— |
|
|
— |
|
|
— |
|
|
— |
|
|
— |
|
|
739 |
|
|
739 |
|
|
Balance at August 14, 2013 |
|
— |
|
$ |
— |
|
116,373 |
|
$ |
1 |
|
$ |
— |
|
$ |
(608) |
|
$ |
— |
|
$ |
(151,966) |
|
$ |
(947) |
|
$ |
(153,520) |
|
See notes to consolidated financial statements.
68
MULTI PACKAGING SOLUTIONS INTERNATIONAL LIMITED
AND SUBSIDIARIES
CONSOLIDATED STATEMENT OF SHAREHOLDERS’ EQUITY
(in thousands, except share amounts)
(continued)
|
|
|
|
|
|
|
|
|
|
|
|
|
|
Accumulated |
|
|
|
|
|
|
|
|
|
|
|
|
|
|
|
|
Additional |
|
|
|
|
Other |
|
|
|
|
Total |
|
|||
|
|
|
Common Shares |
|
Paid-In |
|
Accumulated |
|
Comprehensive |
|
Noncontrolling |
|
Shareholders’ |
|
||||||||
|
|
|
Shares |
|
Amount |
|
Capital |
|
(Deficit) |
|
Income (Loss) |
|
Interest |
|
Equity |
|
||||||
|
Successor |
|
|
|
|
|
|
|
|
|
|
|
|
|
|
|
|
|
|
|
|
|
|
Balance at August 15, 2013 |
|
— |
|
$ |
— |
|
$ |
— |
|
$ |
— |
|
$ |
— |
|
$ |
— |
|
$ |
— |
|
|
Issuance of common stock |
|
30,969,716 |
|
|
30,969 |
|
|
130,366 |
|
|
— |
|
|
— |
|
|
— |
|
|
161,335 |
|
|
Mustang shares converted upon reverse merger |
|
30,969,716 |
|
|
30,970 |
|
|
141,371 |
|
|
— |
|
|
— |
|
|
— |
|
|
172,341 |
|
|
Acquisition of noncontrolling interest |
|
— |
|
|
— |
|
|
736 |
|
|
— |
|
|
— |
|
|
5,918 |
|
|
6,654 |
|
|
Net loss |
|
— |
|
|
— |
|
|
— |
|
|
(51,864) |
|
|
— |
|
|
216 |
|
|
(51,648) |
|
|
Stock compensation expense |
|
— |
|
|
— |
|
|
1,063 |
|
|
— |
|
|
— |
|
|
— |
|
|
1,063 |
|
|
Other comprehensive income (loss) |
|
— |
|
|
— |
|
|
— |
|
|
— |
|
|
12,891 |
|
|
(104) |
|
|
12,787 |
|
|
Balance at June 30, 2014 |
|
61,939,432 |
|
|
61,939 |
|
|
273,536 |
|
|
(51,864) |
|
|
12,891 |
|
|
6,030 |
|
|
302,532 |
|
|
|
|
|
|
|
|
|
|
|
|
|
|
|
|
|
|
|
|
|
|
|
|
|
Net income |
|
— |
|
|
— |
|
|
— |
|
|
6,499 |
|
|
— |
|
|
527 |
|
|
7,026 |
|
|
Stock compensation |
|
— |
|
|
— |
|
|
5,159 |
|
|
— |
|
|
— |
|
|
— |
|
|
5,159 |
|
|
Other comprehensive income (loss) |
|
— |
|
|
— |
|
|
— |
|
|
— |
|
|
(26,178) |
|
|
151 |
|
|
(26,027) |
|
|
Balance at June 30, 2015 |
|
61,939,432 |
|
|
61,939 |
|
|
278,695 |
|
|
(45,365) |
|
|
(13,287) |
|
|
6,708 |
|
|
288,690 |
|
|
|
|
|
|
|
|
|
|
|
|
|
|
|
|
|
|
|
|
|
|
|
|
|
Net income |
|
— |
|
|
— |
|
|
— |
|
|
2,132 |
|
|
— |
|
|
(805) |
|
|
1,327 |
|
|
Sale of 15,500,000 common shares, net of offering costs of $7,024 |
|
15,500,000 |
|
|
15,500 |
|
|
163,900 |
|
|
— |
|
|
— |
|
|
— |
|
|
179,400 |
|
|
Stock compensation |
|
13,514 |
|
|
14 |
|
|
26,040 |
|
|
— |
|
|
— |
|
|
— |
|
|
26,054 |
|
|
Purchase of non-controlling interest |
|
— |
|
|
— |
|
|
1,063 |
|
|
— |
|
|
(12) |
|
|
(3,637) |
|
|
(2,586) |
|
|
Other comprehensive income (loss) |
|
— |
|
|
— |
|
|
— |
|
|
— |
|
|
(49,991) |
|
|
— |
|
|
(49,991) |
|
|
Balance at June 30, 2016 |
|
77,452,946 |
|
$ |
77,453 |
|
$ |
469,698 |
|
$ |
(43,233) |
|
$ |
(63,290) |
|
$ |
2,266 |
|
$ |
442,894 |
|
See notes to consolidated financial statements.
69
MULTI PACKAGING SOLUTIONS INTERNATIONAL LIMITED
AND SUBSIDIARIES
CONSOLIDATED STATEMENTS OF CASH FLOWS
(in thousands)
|
|
|
Successor |
|
|
Predecessor |
|
||||||||
|
|
|
Fiscal Year Ended |
|
Period from August |
|
|
Period from July 1, |
|
||||||
|
|
|
June 30, |
|
15, 2013 through |
|
|
2013 through |
|
||||||
|
|
|
2016 |
|
2015 |
|
June 30, 2014 |
|
|
August 14, 2013 |
|
||||
|
Operating Activities |
|
|
|
|
|
|
|
|
|
|
|
|
|
|
|
Net income |
|
$ |
1,327 |
|
$ |
7,026 |
|
$ |
(51,648) |
|
|
$ |
(23,685) |
|
|
Adjustments to reconcile net income (loss) to net cash and cash equivalents provided by operating activities: |
|
|
|
|
|
|
|
|
|
|
|
|
|
|
|
Depreciation expense |
|
|
73,683 |
|
|
78,035 |
|
|
41,831 |
|
|
|
2,824 |
|
|
Amortization expense |
|
|
55,317 |
|
|
53,668 |
|
|
31,375 |
|
|
|
948 |
|
|
Amortization of debt discount and deferred financing fees |
|
|
4,061 |
|
|
4,453 |
|
|
2,661 |
|
|
|
285 |
|
|
Debt extinguishment charges |
|
|
3,967 |
|
|
1,019 |
|
|
— |
|
|
|
11,642 |
|
|
Deferred income taxes |
|
|
(460) |
|
|
(9,477) |
|
|
(24,648) |
|
|
|
(15,377) |
|
|
Stock compensation |
|
|
26,054 |
|
|
5,159 |
|
|
1,063 |
|
|
|
109 |
|
|
Unrealized foreign currency loss (gain) |
|
|
3,060 |
|
|
(11,355) |
|
|
(381) |
|
|
|
— |
|
|
Impairment charges |
|
|
2,026 |
|
|
— |
|
|
1,006 |
|
|
|
— |
|
|
Other |
|
|
3,105 |
|
|
4,077 |
|
|
2,445 |
|
|
|
4,115 |
|
|
Change in assets and liabilities: |
|
|
|
|
|
|
|
|
|
|
|
|
|
|
|
Accounts receivable |
|
|
(1,537) |
|
|
13,615 |
|
|
9,427 |
|
|
|
(12,810) |
|
|
Inventories |
|
|
(4,093) |
|
|
3,021 |
|
|
7,509 |
|
|
|
(1,985) |
|
|
Prepaid expenses and other current assets |
|
|
(3,538) |
|
|
1,137 |
|
|
2,390 |
|
|
|
516 |
|
|
Other assets |
|
|
(11,035) |
|
|
(10,246) |
|
|
(2,446) |
|
|
|
(129) |
|
|
Accounts payable |
|
|
1,347 |
|
|
(17,775) |
|
|
21,110 |
|
|
|
8,534 |
|
|
Payroll and benefits |
|
|
(13,030) |
|
|
3,530 |
|
|
(8,003) |
|
|
|
1,749 |
|
|
Other current liabilities |
|
|
(5,997) |
|
|
(4,239) |
|
|
(16,556) |
|
|
|
26,209 |
|
|
Income taxes payable |
|
|
1,157 |
|
|
2,653 |
|
|
(2,248) |
|
|
|
(217) |
|
|
Other long-term liabilities |
|
|
(2,742) |
|
|
(15,684) |
|
|
5,043 |
|
|
|
(3,692) |
|
|
Net cash and cash equivalents provided by (used in) operating activities |
|
|
132,672 |
|
|
108,617 |
|
|
19,930 |
|
|
|
(964) |
|
|
|
|
|
|
|
|
|
|
|
|
|
|
|
|
|
|
Investing Activities |
|
|
|
|
|
|
|
|
|
|
|
|
|
|
|
Additions to property, plant and equipment |
|
|
(58,954) |
|
|
(59,535) |
|
|
(39,888) |
|
|
|
(2,741) |
|
|
Additions to intangible assets |
|
|
(297) |
|
|
(207) |
|
|
(209) |
|
|
|
(21) |
|
|
Proceeds from sale of assets |
|
|
4,226 |
|
|
6,907 |
|
|
2,226 |
|
|
|
— |
|
|
Acquisitions of businesses, net of cash acquired |
|
|
(10,685) |
|
|
(137,269) |
|
|
(116,337) |
|
|
|
— |
|
|
Net cash and cash equivalents used in investing activities |
|
|
(65,710) |
|
|
(190,104) |
|
|
(154,208) |
|
|
|
(2,762) |
|
|
|
|
|
|
|
|
|
|
|
|
|
|
|
|
|
|
Financing Activities |
|
|
|
|
|
|
|
|
|
|
|
|
|
|
|
Proceeds from initial public offering |
|
|
186,424 |
|
|
— |
|
|
— |
|
|
|
— |
|
|
Payments of offering costs |
|
|
(7,024) |
|
|
— |
|
|
— |
|
|
|
— |
|
|
Proceeds from issuance of long-term debt |
|
|
— |
|
|
133,650 |
|
|
172,137 |
|
|
|
— |
|
|
Proceeds from short-term borrowings |
|
|
47,628 |
|
|
171,456 |
|
|
66,369 |
|
|
|
— |
|
|
Payments on short-term borrowings |
|
|
(51,107) |
|
|
(174,442) |
|
|
(80,494) |
|
|
|
(295) |
|
|
Payments on long-term debt |
|
|
(255,201) |
|
|
(15,816) |
|
|
(6,555) |
|
|
|
(499) |
|
|
Debt issuance costs |
|
|
— |
|
|
(5,020) |
|
|
(6,974) |
|
|
|
— |
|
|
Issuance of common stock |
|
|
— |
|
|
— |
|
|
585 |
|
|
|
— |
|
|
Net cash and cash equivalents (used in) provided by financing activities |
|
|
(79,280) |
|
|
109,828 |
|
|
145,068 |
|
|
|
(794) |
|
|
|
|
|
|
|
|
|
|
|
|
|
|
|
|
|
|
Effect of exchange rate changes on cash and cash equivalents |
|
|
1,412 |
|
|
(199) |
|
|
97 |
|
|
|
50 |
|
|
(Decrease) increase in cash and cash equivalents |
|
|
(10,906) |
|
|
28,142 |
|
|
10,887 |
|
|
|
(4,470) |
|
|
Cash and cash equivalents—beginning |
|
|
55,675 |
|
|
27,533 |
|
|
16,646 |
|
|
|
27,123 |
|
|
Cash and cash equivalents—ending |
|
$ |
44,769 |
|
$ |
55,675 |
|
$ |
27,533 |
|
|
$ |
22,653 |
|
See notes to consolidated financial statements.
70
Multi Packaging Solutions International Limited and subsidiaries
NOTES TO THE CONSOLIDATED FINANCIAL STATEMENTS
(amounts in thousands, except per share amounts)
Note 1—Nature of Business
The Company
“MPS” and the “Company” refer to Multi Packaging Solutions International Limited and its controlled subsidiaries. MPS is a leading, global provider of value-added packaging solutions to a diverse customer base across the healthcare, consumer, and multi-media end markets. MPS provides its customers with print-based specialty packaging, including premium-folding cartons, labels and inserts across a variety of substrates and finishes. The former Multi Packaging Solutions, Inc. and, as the context may require, its subsidiaries, are referred to herein as the “Predecessor.”
On August 15, 2013, the Predecessor and its primary shareholder, IPC/Packaging LLC (solely in its capacity as shareholder representative), entered into an Agreement and Plan of Merger to be purchased by Mustang Parent Corp. (“Mustang”), an entity controlled by funds advised by Madison Dearborn Partners, LLC (“MDP”) (the “Transaction”). Following completion of the Transaction, Mustang owned 100% of the outstanding equity of the Predecessor.
On February 14, 2014, MDP and the Carlyle Group (“Carlyle”) entered into a Combination Agreement, whereby MDP contributed 100% of the outstanding equity of Mustang to a subsidiary of Chesapeake Finance 2, Ltd. (“CF2”), in exchange for a 50% equity interest in CF2 (the “Merger”). The other 50% equity interest in CF2 is held by funds advised by Carlyle. CF2 emerged from the Merger as the new Parent entity, incorporated under the laws of England and Wales. Subsequent to the Merger, the name of CF2 was changed to Multi Packaging Solutions Global Holdings Limited. The Merger was accounted for as a reverse acquisition in accordance with Financial Accounting Standards Board (“FASB”), Accounting Standards Codification (“ASC”) 805, whereby MPS was the accounting acquirer. The equity of the Successor was adjusted to reflect the exchange of shares pursuant to the Combination Agreement.
Bermuda Reincorporation
On October 7, 2015, 100% of the share capital of Multi Packaging Solutions Global Holdings Limited was acquired by the Company, a company incorporated and organized under the laws of Bermuda, from Chesapeake Finance 1 Limited and Mustang Investment Holdings L.P. The consideration for such acquisition was the issuance of shares in the Company to Chesapeake Finance 1 Limited and Mustang Investment Holdings L.P. In connection with the issuance of shares, the number of shares was increased as a result of the par value changing from one British Pound Sterling to one U.S. dollar. The total authorized share capital of the Company is 1 billion shares. The Company’s Board of Directors has the authority to allot and issue any unissued shares as common shares or preference shares, provided the total number of shares of the classes combined does not exceed the total authorized amount. The Board of Directors may also determine the number and specific rights attaching to any preference shares that may be issued. The Company has not issued any preference shares to date.
Stock-split and Initial Public Offering
On October 8, 2015, the Company’s Board of Directors approved and the Company executed a 1 for 5.08 reverse stock split of its common shares prior to completing its proposed initial public offering. All share and per share data has been presented to reflect this reverse split. On October 22, 2015, the Company completed its initial public offering of 16,500,000 common shares at a price of $13.00 per share. In connection with the offering, funds controlled by The Carlyle Group (“Carlyle”) and certain current and former employees, sold 1,000,000 common shares (which was included in the 16,500,000 common shares). The underwriters also exercised their rights to purchase an additional 2,475,000 common shares from certain of the selling shareholders, including investment funds controlled by Madison Dearborn (“Madison”) and Carlyle, at the public offering price, less the underwriting discount. The Company did not receive any of the proceeds from the shares sold by Madison or Carlyle, certain current and former employees, or from the exercise of the underwriters’ option. The Company received proceeds of $186,424 from the initial public offering, of which $182,414 was used to repay outstanding borrowings under the Company’s Term Loans (see Note 13), with the remaining amount used to pay a portion of the total offering costs of $7,024.
71
On June 8, 2016, a secondary offering was completed, and the same selling shareholders sold 10,000,000 common shares. The underwriters also exercised their rights to purchase an additional 1,500,000 common shares from the selling shareholders. The Company did not receive any of the proceeds from the secondary offering.
Note 2—Summary of Significant Accounting Policies
Basis of Presentation
The accompanying consolidated financial statements have been prepared in conformity with accounting principles generally accepted in the United States of America (“GAAP”). The financial information set forth herein reflects: (a) the consolidated results of operations and cash flows of the Successor for the fiscal year ended June 30, 2016 and 2015, the period from August 15, 2013 through June 30, 2014 and the Predecessor for the period from July 1, 2013 through August 14, 2013, and (b) the financial position of the Successor as of June 30, 2016 and 2015.
Principles of Consolidation
The consolidated financial statements include the accounts of Multi Packaging Solutions International Limited and its controlled subsidiaries (collectively, referred to as the “Company”). All material intercompany accounts and transactions have been eliminated in consolidation.
Use of Estimates
The preparation of the consolidated financial statements in conformity with GAAP requires management to make estimates and assumptions that affect the amounts reported in the consolidated financial statements and accompanying notes. Actual results could differ from those estimates.
Foreign Currency
The functional currencies of the Company’s foreign subsidiaries are the respective local currencies. Assets and liabilities of the Company’s foreign subsidiaries and affiliates are translated into U.S. dollars at the period-end exchange rates, and revenues and expenses are translated at average monthly exchange rates. Translation gains and losses are recorded as a component of accumulated other comprehensive income (loss) within the accompanying consolidated statements of shareholders’ equity. Transaction gains and losses resulting from transactions entered into under contracts in a currency other than the subsidiary’s functional currency are accounted for on a transactional basis as a credit or charge to operations. The Company recognized foreign currency transaction gains (losses) in the amounts of $(5,182), $12,171, $777 and $364 for the fiscal years ended June 30, 2016 and 2015, the period from August 15, 2013 through June 30, 2014 and the period from July 1, 2013 through August 14, 2013, respectively, which is recorded in other (expense) income, net in the accompanying consolidated statements of operations and comprehensive income (loss).
Cash and Cash Equivalents
The Company considers all short-term investments with a maturity of three months or less when purchased to be cash equivalents. The Company had restricted cash deposited in an escrow account relating to contingent consideration from the June 9, 2011 acquisition of CD Cartondruck AG (“Cartondruck”). The escrow balance was released to the selling shareholders of Cartondruck on June 13, 2016 (see Note 4). The balance of the restricted cash as of June 30, 2015 was $1,985, and is included in other assets in the consolidated balance sheet.
Accounts Receivable and Allowance for Doubtful Accounts
Accounts receivable are presented net of an allowance for doubtful accounts of $2,491 and $2,932 as of June 30, 2016 and 2015, respectively. The allowance for doubtful accounts reduces receivables to amounts that are expected to be collected. In estimating the allowance, management considers factors such as current overall and industry-specific economic conditions, statutory requirements, historical and anticipated customer performance, historical experience with write-offs
72
and the level of past-due amounts. Changes in these conditions may result in additional allowances. After all attempts to collect a receivable have failed, the receivable is written off against the allowance.
Inventories
Inventories are stated at the lower of cost or market value. Inventory costs include materials, labor and manufacturing overhead. Cost is determined by the first-in, first-out method. Obsolete inventory is identified based on an analysis of inventory for known obsolescence issues and a write-down or write-off is provided based on this analysis.
Property, Plant and Equipment
Property, plant and equipment is carried at cost and depreciated or amortized on a straight-line basis over the estimated useful lives or lease life, whichever is shorter. Expenditures for maintenance and repairs are charged to current operations, while major improvements that materially extend useful lives are capitalized. Depreciation is computed over the estimated useful lives of the assets using the straight-line method as follows:
|
Buildings and improvements |
3-40 years |
|
Machinery and equipment |
3-13 years |
|
Furniture and fixtures |
3-7 years |
Depreciation expense was $73,683, $78,035, $41,831 and $2,824 for the fiscal years ended June 30, 2016 and 2015, the period from August 15, 2013 through June 30, 2014 and the period from July 1, 2013 through August 14, 2013, respectively.
Deferred Financing Costs
Costs relating to obtaining debt financing are amortized over the term of the related debt using effective interest method. Amortization of deferred financing costs charged to interest expense was $776, $871, $478 and $279 for the fiscal years ended June 30, 2016 and 2015, the period from August 15, 2013 through June 30, 2014 and the period from July 1, 2013 through August 14, 2013, respectively. See also Newly Adopted Accounting Pronouncements section below for a change in accounting principle related to deferred financing costs.
Goodwill and Intangible Assets
Goodwill represents the cost of acquired businesses in excess of the fair value of the assets acquired and liabilities assumed of such businesses at the acquisition date. Goodwill is not amortized, but instead tested for impairment at least annually at the reporting unit level. The Company performs its test for impairment at the beginning of the fourth quarter of its fiscal year, and earlier if an event occurs or circumstances change that indicates impairment might exist. The Company has the option to first assess qualitative factors to determine whether it is more likely than not that the fair value of a reporting unit is less than its carrying amount. Otherwise, a two-step impairment test is performed. The impairment test for goodwill requires the Company to compare the fair value of a reporting unit to its carrying value, including goodwill. The Company uses a blended analysis of a discounted cash flow model and market valuation approach to determine the fair values of its reporting units. If the carrying value of a reporting unit exceeds its fair value, the Company would then compare the carrying value of the goodwill to its implied fair value in order to determine the amount of the impairment, if any.
The Company did not recognize any impairment charges for goodwill during any of the periods presented, as the Company’s annual impairment testing indicated that the estimated fair value of each reporting unit exceeded the respective carrying values.
Intangible assets have been acquired through various business acquisitions and include customer relationships, developed technology, licensing agreements, and a photo library. The intangible assets are initially valued at their acquisition date typically using either an excess earnings or relief from royalty method. The relief from royalty method is used for developed technology and licensing agreements and assumes that if the acquired company did not own the intangible asset or intellectual property, it would be willing to pay a royalty for its use. The benefit of ownership of the intellectual property is valued as the relief from the royalty expense that would otherwise be incurred. Customer relationship intangibles are amortized on an accelerated basis in a manner that approximates the estimated future cash flows. Other intangible assets are amortized on a straight-line basis which approximates the associated estimated future cash flows. Useful lives vary by
73
asset type and are determined based on the period over which the intangible asset is expected to contribute directly or indirectly to the Company’s future cash flows.
Impairment of Long-Lived Assets
The Company reviews its definite-lived long-lived assets for impairment whenever events or changes in circumstances indicate that carrying amount of the asset may not be recoverable. Such circumstances could include, but are not limited to (1) a significant decrease in the market value of an asset, (2) a significant adverse change in the extent or manner in which an asset is used, or (3) an accumulation of costs significantly in excess of the amount originally expected for the acquisition of an asset. The Company measures the carrying amount of the asset against the estimated undiscounted future cash flows associated with it. Should the carrying value of the asset being evaluated exceed the estimated undiscounted future cash flows, an impairment loss could be present, at which point recognition of the impairment, if any, would occur based on a determination of the asset’s fair value as compared to its carrying value. During the fiscal year ended June 30, 2016, the Company recorded impairment charges totaling $2,026 related to land, buildings and machinery and equipment at our Stuttgart, Germany facility. As an indicator of impairment resulting from the planned closure of this facility by the end of fiscal 2017, the respective assets were adjusted to their estimated fair values using a market valuation approach. No other impairment charges on long-lived assets were recorded for any of the other periods presented.
Investments in Unconsolidated Entities
Investments in unconsolidated entities over which the Company has significant influence are accounted for under the equity method of accounting, whereby the investment is carried at the cost of the acquisition, plus the Company’s equity in the undistributed earnings or losses. Investments in entities over which the Company does not have the ability to exert significant influence over the investees’ operating and financing activities are accounted for under the cost method of accounting. If there is objective evidence that indicates an equity or cost method investment is impaired, a loss is recognized. For the period from August 15, 2013 through June 30, 2014, the Company recorded an impairment loss of $1,006 related to an equity method investment (see Note 9). No such impairment was recorded for the fiscal years ended June 30, 2016 or 2015.
Available-For-Sale Securities
The Company determines the appropriate classification of its investments in debt and equity securities at the time of purchase and reevaluates such determinations at each balance sheet date. Securities not classified as held to maturity or as trading, are classified as available for sale, and are carried at fair market value, with the unrealized gains and losses, net of tax, included in the determination of comprehensive income (loss). The Company reviews its holdings on a regular basis to determine if there has been an other-than-temporary decline in market value. If it is determined that an other-than-temporary decline exists in a marketable equity security, the Company writes down the investment to its fair market value and records the related write-down as an investment loss in its consolidated statement of operations and comprehensive income (loss). Available-for-sale securities were $261 and $253 as of June 30, 2016 and 2015, respectively, and are recorded in other assets in the consolidated balance sheets. No other-than-temporary decline was recorded within the periods presented.
Derivative Instruments
The Company uses derivative instruments to manage its exposure to certain risks relating to its ongoing business operations. The Company has not elected hedge accounting for certain of these derivative instruments, and accordingly are valued at fair value with unrealized gains or losses reported in earnings during the period of the change. No derivative instruments are entered into for speculative purposes.
One risk managed by the Company using derivative instruments in which the Company did not elect hedge accounting is interest rate risk. To manage interest rate exposure, the Company enters into hedge transactions (interest rate swaps) using derivative financial instruments. The objective of entering into interest rate swaps is to eliminate the variability of cash flows in the London Interbank Offered Rate (“LIBOR”) interest payments associated with variable-rate loans over the life of the loans. As changes in interest rates affect the future cash flow of interest payments, the hedges provide a synthetic offset to interest rate movements. For the fiscal years ended June 30, 2016 and 2015 and the period from August 15, 2013 through June 30, 2014, the change in the fair value of interest rate swaps was $(1,147), $(2,307) and $391, respectively,
74
which is recorded in other (expense) income, net in the accompanying statements of operations and comprehensive income (loss).
The Company is also exposed to foreign-currency exchange-rate fluctuations in the normal course of business, primarily related to the Great Britain Pound Sterling, Euros and the Polish Zloty denominated liabilities within its international subsidiaries whose functional currency is other than the U.S. dollar. The Company manages these fluctuations, in part, using non-deliverable forward foreign exchange contracts and foreign currency forward contracts, that are intended to offset changes in cash flow attributable to currency exchange movements. These contracts are intended primarily to economically address exposure related to merchandise inventory expenditures made by the Company’s international subsidiaries whose functional currency is other than the U.S. dollar. The volume and amounts of foreign currency derivative instruments entered into by the Company are not significant.
Net Investment Hedge
In January 2016, the Company designated the Euro Term Loan (see Note 13) as a net investment hedge of investments in international subsidiaries that use the Euro as their functional currency. For this non-derivative financial instrument designated as a net investment hedge, the change in balance due to the remeasurement of the effective portion for each reporting period is recorded in accumulated other comprehensive income (loss) in the consolidated balance sheets. The spot method is used to measure the effectiveness at the beginning of each reporting period. There was no ineffectiveness for the net investment hedge during fiscal 2016.
Fair Value Measurements
The fair value of a financial instrument is the amount that would be received in an asset sale or paid to transfer a liability in an orderly transaction between unaffiliated market participants. Assets and liabilities measured at fair value are categorized based on whether the inputs are observable in the market and the degree that the inputs are observable. The categorization of financial instruments within the valuation hierarchy is based on the lowest level of input that is significant to the fair value measurement. The hierarchy is prioritized into three levels with the highest priority given to Level 1, as these are the most transparent or reliable. The following fair value hierarchy is used in selecting inputs, with the highest priority given to Level 1, as these are the most transparent or reliable:
|
· |
Level 1 – unadjusted quoted prices in active markets that are accessible at the measurement date for identical, unrestricted assets or liabilities. |
|
· |
Level 2 – quoted prices in markets that are not active, or inputs which are observable, either directly or indirectly, for substantially the full term of the asset or liability. |
|
· |
Level 3 – prices or valuation techniques that require inputs that are both significant to the fair value measurement and unobservable (i.e., supported by little or no market activity). |
The Company calculates the fair value of financial instruments and includes this additional information in the notes to the consolidated financial statements where the fair value is different from the book value of those financial instruments. When the fair value approximates book value, no additional disclosure is made.
Concentrations
Financial instruments that potentially subject the Company to concentrations of credit risk consist primarily of cash and cash equivalents and accounts receivable.
The Company places its cash and cash equivalents with high quality financial institutions and limits the amount of credit exposure with any one institution. At times, the Company’s cash may be uninsured or in deposit accounts that exceed the Federal Deposit Insurance Corporation insurance limits or comparable insurance in Europe.
Concentrations of credit risk with respect to accounts receivable are limited because a large number of geographically diverse customers make up the Company’s customer base, thus spreading the credit risk. The Company controls credit risk through credit approvals, credit limits, and monitoring procedures. The Company performs credit evaluations of its customers, but generally does not require collateral to support accounts receivable. At June 30, 2016 and June 30, 2015, no customers accounted for more than 10% of accounts receivable. For the fiscal years ended June 30, 2016 and 2015 and
75
the period from August 15, 2013 through June 30, 2014, no customers accounted for more than 10% of net sales. For the period from July 1, 2013 through August 14, 2013, one customer accounted for approximately 11% of net sales.
Revenue Recognition
The Company produces packaging products, principally cartons, labels, inserts and rigid packaging for sale to manufacturers of branded and private label consumer goods, pharmaceutical, medical and multi-media products. Products are printed on board, paper or plastic substrates and converted via printing presses and oftentimes subsequently finished in a folding or gluing or other operation. The Company records revenue on the sales of products manufactured when title to the product transfers, which is generally at the time of shipment to the customer.
In all of the above cases, revenue is recorded only when (i) persuasive evidence of an arrangement exists, (ii) delivery has occurred, (iii) the fee is fixed and determinable and (iv) collectability of the sales is reasonably assured. Provisions for discounts and rebates to customers, estimated returns and allowances and other adjustments are provided for in the same period the related sales are recorded when they are determined to be probable and estimable.
Shipping and Handling Fees and Expenses
The Company records shipping and handling related fees charged to customers in net sales and records the related expenses in costs of goods sold in the consolidated statements of operations and comprehensive income (loss).
Advertising Costs
Advertising costs are expensed as incurred. Advertising costs for the fiscal years ended June 30, 2016 and 2015, the period from August 15, 2013 through June 30, 2014 and the period from July 1, 2013 through August 14, 2013 were $853, $828, $585 and $28, respectively. Advertising costs are included in selling, general and administrative expenses in the accompanying consolidated statements of operations and comprehensive income (loss).
Equity-Based Compensation
The Company and its affiliates sponsored various equity compensation plans. The cost of employee services received in exchange for equity-based compensation is measured at the grant date fair value of the equity issued. The cost is recognized as compensation expense over the requisite service period, which is generally as the equity instruments vest. Refer to Note 18 for further discussion of the Company’s equity compensation plans and the amounts recorded in the consolidated financial statements for the periods presented.
Income Taxes
The Company recognizes income taxes in accordance with guidance established by GAAP, which requires an asset and liability approach for financial accounting and reporting for income taxes and establishes a minimum threshold for financial statement recognition of the benefit of tax positions. The provision for income taxes is based upon income or loss after adjustment for those items that are not considered in the determination of taxable income.
Deferred income taxes represent the tax effects of differences between the financial reporting and tax bases of the Company’s assets and liabilities at the enacted tax rates in effect for the years in which the differences are expected to reverse. The Company evaluates the recoverability of deferred tax assets and establishes a valuation allowance when it is more likely than not that some portion or all of the deferred tax assets will not be realized.
Newly Adopted Accounting Pronouncements
In November 2015, the FASB issued ASU No. 2015-17, Income Taxes (Topic 740): Balance Sheet Classification of Deferred Taxes. ASU No. 2015-17 requires that deferred tax assets and liabilities be classified as noncurrent on the balance sheet. ASU 2015-17 is effective for annual reporting periods beginning after December 15, 2016, and interim periods within those annual periods, with early adoption permitted as of the beginning of an interim or annual reporting period. The Company elected to adopt this new guidance, on a retrospective basis, in the fourth quarter of fiscal 2016. The adoption of this guidance impacted the balance sheet classification of such assets and liabilities. As a result of this retrospective application, total current deferred income tax assets as of June 30, 2015 of $8,454 have now been reclassified, which
76
resulted in an increase to noncurrent deferred income tax assets of $1,883 and a decrease of $6,571 to noncurrent deferred income tax liabilities. The adoption did not otherwise impact the consolidated financial statements.
In September 2015, the Financial Accounting Standards Board (“FASB”) issued ASU No. 2015-16, Business Combinations (Topic 805): Simplifying the Accounting for Measurement-Period Adjustments. ASU No. 2015-16 requires that an acquirer recognize adjustments to provisional amounts that are identified during the measurement period in the reporting period in which the adjustment amounts are determined. ASU No. 2015-16 is effective for annual reporting periods beginning after December 15, 2015 and for interim periods within such annual period. Early application is permitted for financial statements that have not been previously issued. The Company elected to early adopt the provisions of ASU No. 2015-16 at the end of the third quarter in fiscal 2016 (March 31, 2016). The adoption of the new guidance did not materially impact the Company’s consolidated financial position or results of operations.
In April 2015, the FASB issued ASU No. 2015-03, Interest - Imputation of Interest (Subtopic 835-30): Simplifying the Presentation of Debt Issuance Costs. The amendments in ASU No. 2015-03 require that debt issuance costs related to a recognized debt liability be presented in the balance sheet as a direct deduction from the carrying amount of that debt liability. The recognition and measurement guidance for debt issuance costs are not affected by the amendments. ASU No. 2015-03 must be applied retrospectively and is effective for annual reporting periods beginning after December 15, 2015 and for interim periods within such annual period. Early application is permitted for financial statements that have not been previously issued. In August 2015, the FASB issued ASU No. 2015-15, Interest - Imputation of Interest (Subtopic 835-30): Presentation and Subsequent Measurement of Debt Issuance Costs Associated with Line-of-Credit Arrangements. ASU No. 2015-15 states that for debt issuance costs related to line-of-credit arrangements, the SEC staff would not object to an entity deferring and presenting such costs as an asset and subsequently amortizing the deferred debt issuance costs ratably over the term of the line-of-credit arrangement, regardless of whether there are any outstanding borrowings on the line-of-credit arrangement. The Company elected to early adopt the provisions of ASU Nos. 2015-03 and 2015-15 on a retrospective bases in the fourth quarter of fiscal 2016. The adoption of the new guidance resulted in the reclassification of $4,311 in deferred financing costs at June 30, 2015 from other long-term assets to long-term debt. The adoption did not otherwise impact the consolidated financial statements.
Recently Issued Accounting Pronouncements
In June 2016, the FASB issued ASU No. 2016-13, Financial Instruments-Credit Losses (Topic 326): Measurement of Credit Losses on Financial Instruments, which requires measurement and recognition of expected credit losses for financial assets held. The amendments in this update are effective for annual periods beginning after December 15, 2019, and interim periods within such annual period. Early adoption is permitted for fiscal years beginning after December 15, 2018, including interim periods within such year. The Company is currently evaluating the potential impacts of adopting the provisions of ASU No. 2016-13.
In March 2016, the FASB issued ASU No. 2016-09, Compensation-Stock Compensation (Topic 718). ASU No. 2016-09 requires all income tax effects of awards to be recognized in the income statement when the awards vest or are settled. It also will allow an employer to repurchase more of an employee’s shares than it can today for tax withholding purposes without triggering liability accounting and to make a policy election to account for forfeitures as they occur. The amendments in this update are effective for annual periods beginning after December 15, 2016, and interim periods within such annual period. Early adoption is permitted, however all of guidance must be adopted in the same period under the transition requirements. The Company is currently evaluating the potential effects of adopting the provisions of ASU No. 2016-02.
In February 2016, the FASB issued ASU No. 2016-02, Leases (Topic 842). ASU No. 2016-02 requires an entity to recognize lease assets and lease liabilities on the balance sheet and to disclose key information about the entity’s leasing arrangements. Lease expenses will be recognized in the income statement in a manner similar to existing requirements. The amendments in this update are effective for annual periods beginning after December 15, 2018, and interim periods within such annual period, and must be adopted using a modified retrospective method for leases existing at, or entered into after, the beginning of the earliest comparative period presented in the financial statements. Early adoption is permitted. The Company is currently evaluating the potential effects of adopting the provisions of ASU No. 2016-02.
77
In July 2015, the FASB issued ASU No. 2015-11, Inventory (Topic 330): Simplifying the Measurement of Inventory. ASU No. 2015-11 requires inventory measured using any method other than last-in, first out or the retail inventory method to be subsequently measured at the lower of cost or net realizable value, rather than at the lower of cost or market. ASU No. 2015-11 is effective for annual reporting periods beginning after December 15, 2016 and for interim periods within such annual period. Early application is permitted. The Company is currently evaluating the potential effects of adopting the provisions of ASU No. 2015-11.
In May 2014, the FASB issued ASU No. 2014-09, Revenue from Contracts with Customers (Topic 606). ASU No. 2014-09 supersedes the revenue recognition requirements in Topic 605, Revenue Recognition, and most industry-specific guidance throughout the Industry Topics of the Codification. Additionally, ASU No. 2014-09 supersedes some cost guidance included in Subtopic 605-35, Revenue Recognition-Construction-Type and Production-Type Contracts. Under ASU No. 2014-09, an entity should recognize revenue when it transfers promised goods or services to customers in an amount that reflects the consideration to which the entity expects to be entitled in exchange for those goods or services. ASU No. 2014-09 also requires additional disclosure about the nature, amount, timing, and uncertainty of revenue and cash flows arising from customer contracts, including significant judgments and changes in judgments and assets recognized from costs incurred to obtain or fulfill a contract. Additionally, in May 2016, the FASB issued ASU 2016-12, Revenue from contracts with customers (Topic 606): Narrow-scope improvements and practical expedients, which contains certain provision and practical expedients in response to identified implementation issues. The guidance is effective for annual reporting periods beginning after December 15, 2017 and for interim periods within such annual period, with early application prohibited for annual reporting periods beginning after December 15, 2016. Either full retrospective or modified retrospective adoption is permitted. The Company is evaluating the transition method that will be elected and the potential effects of adopting the provisions of ASU No. 2014-09.
Note 3—Earnings Per Share
Earnings per share are computed by dividing net income available to common shareholders by the weighted average number of common shares outstanding during the period. Diluted earnings per share are computed using the weighted average number of common shares and, if dilutive, potential common shares outstanding during the period. Potential common shares consist of the incremental common shares issuable for unvested restricted stock, as calculated using the treasury stock method.
|
|
|
Successor |
|
|
Predecessor |
|
||||||||
|
|
|
Fiscal Year Ended |
|
Period from August |
|
|
Period from July 1, |
|
||||||
|
|
|
June 30, |
|
15, 2013 through |
|
|
2013 through |
|
||||||
|
|
|
2016 |
|
2015 |
|
June 30, 2014 |
|
|
August 14, 2013 |
|
||||
|
Numerator: |
|
|
|
|
|
|
|
|
|
|
|
|
|
|
|
Net income (loss) available to common |
|
$ |
2,132 |
|
$ |
6,499 |
|
$ |
(51,864) |
|
|
$ |
(23,710) |
|
|
|
|
|
|
|
|
|
|
|
|
|
|
|
|
|
|
Denominator: |
|
|
|
|
|
|
|
|
|
|
|
|
|
|
|
Weighted average number of |
|
|
72,661 |
|
|
61,939 |
|
|
44,229 |
|
|
|
116 |
|
|
Effect of dilutive securities |
|
|
— |
|
|
— |
|
|
— |
|
|
|
— |
|
|
Weighted average number of |
|
|
72,661 |
|
|
61,939 |
|
|
44,229 |
|
|
|
116 |
|
|
|
|
|
|
|
|
|
|
|
|
|
|
|
|
|
|
Basic earnings (loss) per common share |
|
$ |
0.03 |
|
$ |
0.10 |
|
$ |
(1.17) |
|
|
$ |
(203.74) |
|
|
Dilutive earnings (loss) per common share |
|
$ |
0.03 |
|
$ |
0.10 |
|
$ |
(1.17) |
|
|
$ |
(203.74) |
|
Stock options and unvested restricted stock units in the amounts of 1,992 and 10 for the period from August 15, 2013 through June 30, 2014 and the period from July 1, 2013 through August 14, 2013, respectively, are excluded from the diluted earnings (loss) per common share as their inclusion would be anti-dilutive. There were no stock options in the Company’s stock for the fiscal year ended June 30, 2015. The effect of unvested restricted stock and restricted stock units for the fiscal year ended June 30, 2016 was not material.
78
Note 4—Acquisitions
The Company accounts for acquisitions using the acquisition method of accounting. The results of operations of the acquisitions are included in the consolidated results from their respective dates of acquisition. The purchase price of each acquisition is allocated to the tangible assets, liabilities, and identifiable intangible assets acquired based on their estimated fair values.
Chicago Paper Tube and Can Co.
On January 26, 2016, the Company completed the acquisition of Chicago Paper Tube & Can Co. (“CPT”). The acquisition of CPT provides the Company with high-end, round rigid packaging capability in North America. Consideration in the transaction consisted of cash totaling $8,189, net of cash acquired, and was funded from existing cash balances. CPT’s operations, which are included in the North America operating segment, are not material to the Company’s consolidated financial statements.
BluePrint Media Limited
On July 1, 2015, the Company completed the acquisition of BP Media, Ltd. (“BluePrint”). The acquisition of BluePrint provides the Company with pre-press and digital services in the European market, facilitating the processes surrounding translation and interchangeability of print content for foreign locations. In addition, BluePrint provides the Company with an established sales presence in the media markets in Europe, which will enable the Company to serve the European needs of global media releases. BluePrint had annual revenue of approximately $23,000 in its most recently completed year prior to the acquisition. Consideration in the transaction consisted of cash totaling £1,587 (approximately $2,496 at the transaction date exchange rate), net of cash acquired. The purchase price was funded from existing cash balances. Subject to the provisions in the agreement, additional consideration of £1,000 (approximately $1,340 at current period-end exchange rates) is payable on June 30, 2018. Further consideration of 25% of the acquired businesses EBITDA, as defined in the share purchase agreement, for the three fiscal years ending June 30, 2018 is also payable to the sellers, subject to the achievement of a minimum EBITDA. The Company estimated £944 (approximately $1,265 at current period-end exchange rates) as the fair value of such contingent consideration as of the acquisition date. BluePrint’s operations, which are included in the Europe operating segment, are not material to the Company’s consolidated financial statements.
Presentation Products Group
On February 28, 2015, the Company acquired 100% of the outstanding Class A Common Units of Presentation Products Group (“Presentation Products”) for an aggregate purchase price of approximately $15,615 in cash. The Company acquired Presentation Products to expand its manufacturing operations and sourcing expertise in rigid packaging. Presentation’s operations, which are included in the Europe operating segment, are not material to the Company’s consolidated financial statements.
AGI Shorewood
On November 21, 2014, the Company acquired the Non-European Folding Carton and Lithographic Printing Business of AGI Global Holdings Coöperatief U.A. and the US Folding Carton and Lithographic Printing Business of Atlas AGI Holdings LLC (collectively, “ASG”) for an aggregate purchase price of approximately $133,794 in cash. The purchase price was funded with borrowings under the Company’s Credit Agreement (see Note 13). The Company acquired ASG to
79
further expand the Company’s global network and customer base. The following table summarizes the components of the purchase price for ASG.
|
|
|
|
|
|
|
Assets |
|
|
|
|
|
Cash and cash equivalents |
|
$ |
19,401 |
|
|
Accounts receivable |
|
|
76,435 |
|
|
Inventories |
|
|
32,851 |
|
|
Prepaid expenses and other current assets |
|
|
6,142 |
|
|
Deferred income taxes |
|
|
15,322 |
|
|
Property, plant and equipment |
|
|
49,470 |
|
|
Other long-term assets |
|
|
3,610 |
|
|
Less: Liabilities |
|
|
|
|
|
Current liabilities |
|
|
(62,869) |
|
|
Other long-term liabilities |
|
|
(6,568) |
|
|
|
|
|
|
|
|
Purchase price |
|
$ |
133,794 |
|
Armstrong Packaging Limited
On July 8, 2014, the Company acquired 100% of Armstrong Packaging Limited (“Armstrong”) for an aggregate purchase price of approximately $12,747 in cash. The Company acquired Armstrong to expand the Company’s global platform for luxury packaging, gift sets, travel retail, and commemorative editions. Armstrong’s product development and rigid box manufacturing complements the Company’s existing manufacturing, creative design, project management, and global sourcing capabilities. Armstrong’s operations, which are included in the Europe operating segment, are not material to the Company’s consolidated financial statements.
Acquisition of Integrated Print Solutions and Jet Lithocolor
On April 4, 2014, the Company completed the acquisitions of 70% of Integrated Printing Solutions (“IPS”) and all of Jet Lithocolor (“Jet”) to create a comprehensive end-to-end solution for the credit, debit, gift, loyalty and insurance card markets. The acquisitions solidify the Company’s market position by adding a full complement of card production capabilities to our existing creative services, decorative technologies and sustainable solutions. These capabilities include laminated card production, imaging, affixing, direct mail and fulfillment. Furthermore, the acquisitions provide a fully integrated supply chain for cards, carriers, multi-packs and point-of-purchase displays in a range of materials, with turnkey resources for design, production and distribution for open and closed-loop card programs. IPS and Jet had annual sales of approximately $34,000 and $61,000, respectively, for the twelve months ending immediately prior to the date of the acquisition. IPS and Jet’s operations, which are included in the North America operating segment, are not material to the Company’s consolidated financial statements.
Chesapeake/Multi Packaging Solutions Merger
On February 14, 2014, MDP and the Carlyle Group (“Carlyle”) entered into a Combination Agreement, whereby MDP contributed 100% of the outstanding equity of Mustang to a subsidiary of Chesapeake Finance 2, Ltd. (“CF2”), in exchange for a 50% equity interest in CF2. The other 50% equity interest in CF2 is held by funds advised by Carlyle. CF2 emerged from the Merger as the new Parent entity, incorporated under the laws of England and Wales. Subsequent to the Merger, the name of CF2 was changed to Multi Packaging Solutions Global Holdings Limited.
80
In accordance with the terms of the Merger Agreement, Chesapeake issued shares of Chesapeake stock for all of the outstanding shares of MPS. Additionally, MPS paid Chesapeake an equalization payment of approximately $101,917. Chesapeake, an international manufacturer of consumer packaging, is a leading supplier of printed folding cartons, ridged cartons, tubes, booklets, leaflets and labels, as well as other specialist packaging to the pharmaceutical, healthcare, confectionery, spirits, agrichemical and food markets with annual sales of approximately $841,323. This Merger creates an extensive global network strategically positioned to service the healthcare, consumer, personal care, confectionery, premium drinks, and multi-media markets with manufacturing locations in the United States, Europe, and Asia. The merger was accounted for as a reverse acquisition in accordance with ASC 805, whereby MPS was the accounting acquirer. The equity of the Successor was adjusted to reflect the exchange of shares pursuant to the Merger Agreement.
The Company recorded Chesapeakes’s assets and liabilities based on their estimated fair values at the date of the Merger. The assets included intangible assets related to customer relationships and technology. The fair value estimates for the assets and liabilities assumed were based on estimates and analysis using widely recognized valuation models. The goodwill comprised of expected synergies from combining Chesapeake’s operations with that of the Company, reduction in future combined research and development expenses and overall overhead costs. The goodwill is not deductible for tax purposes.
The operations of the acquired Chesapeake business are included in the Company’s consolidated statements of operations and comprehensive income (loss) since February 14, 2014. For the period from August 15, 2013 through June 30, 2014, $306,928 is included in the consolidated net sales and $(11,345) in the consolidated net income (loss).
The allocation of the purchase price to the fair value of the assets and liabilities assumed is as follows:
|
Assets |
|
|
|
|
|
Cash and cash equivalents |
|
$ |
35,175 |
|
|
Accounts receivable |
|
|
107,246 |
|
|
Inventories |
|
|
90,001 |
|
|
Prepaid expenses and other current assets |
|
|
16,532 |
|
|
Deferred income taxes |
|
|
10,730 |
|
|
Property, plant and equipment |
|
|
290,528 |
|
|
Other assets |
|
|
1,847 |
|
|
Intangible assets |
|
|
261,748 |
|
|
Goodwill |
|
|
201,632 |
|
|
Less: Liabilities |
|
|
|
|
|
Current liabilities |
|
|
(168,259) |
|
|
Debt |
|
|
(487,781) |
|
|
Deferred income taxes |
|
|
(57,125) |
|
|
Other long-term liabilities |
|
|
(28,015) |
|
|
Purchase price |
|
$ |
274,259 |
|
MDP Transaction
On August 15, 2013, the Predecessor and its primary shareholder, IPC/Packaging LLC (solely in its capacity as shareholder representative), entered into the Transaction under which the Predecessor was purchased by Mustang, an entity controlled by funds advised by MDP. Following completion of the Transaction, Mustang owned 100% of the outstanding equity of the Predecessor.
MDP acquired 100% of the stock of the Predecessor for an aggregate purchase price of approximately $646,749. The purchase price was allocated to the assets acquired and liabilities assumed based on their estimated fair values at the date of acquisition. The fair value estimates for the assets and liabilities assumed were based on estimates and analysis using widely recognized valuation models. The purchase price allocation included acquired intangible assets related to customer relationships and photo library. The excess of the purchase price over the fair value of net assets acquired was allocated to goodwill which is not deductible for income tax purposes.
81
The allocation of the purchase price to the fair value of assets acquired and liabilities assumed is as follows:
|
Assets |
|
|
|
|
|
Cash and cash equivalents |
|
$ |
16,646 |
|
|
Accounts receivable |
|
|
70,985 |
|
|
Inventories |
|
|
51,668 |
|
|
Prepaid expenses and other current assets |
|
|
5,878 |
|
|
Deferred income taxes |
|
|
3,438 |
|
|
Property, plant and equipment |
|
|
147,845 |
|
|
Other assets |
|
|
4,588 |
|
|
Intangible assets |
|
|
229,052 |
|
|
Goodwill |
|
|
269,084 |
|
|
Less: Liabilities |
|
|
|
|
|
Current liabilities |
|
|
(70,122) |
|
|
Deferred income taxes |
|
|
(73,678) |
|
|
Other long-term liabilities |
|
|
(8,635) |
|
|
Purchase price |
|
$ |
646,749 |
|
The consolidated statement of cash flows excludes certain non-cash activity of the Company on August 15, 2013 resulting from the Transaction. The following table reconciles the Predecessor’s ending cash at August 14, 2013 to the Successor’s beginning cash at August 15, 2013:
|
Cash at August 14, 2013 (Predecessor) |
|
$ |
22,653 |
|
|
Issuance of common stock |
|
|
160,750 |
|
|
Issuance of long-term debt, net |
|
|
465,561 |
|
|
Settlement of Predecessor debt |
|
|
(369,047) |
|
|
Settlement of Predecessor equity and option holders |
|
|
(244,240) |
|
|
Settlement of transaction and other fees |
|
|
(19,031) |
|
|
Cash at August 15, 2013 (Successor) |
|
$ |
16,646 |
|
Pro Forma Financial Information
The following table provides unaudited pro forma net sales, net income (loss) and earnings (loss) per share data, as if the acquisitions of Presentation Products, ASG, Armstrong, IPS, Jet, Chesapeake and the MDP Transaction occurred as of July 1, 2013. Unaudited pro forma financial information is not provided for the fiscal year ended June 30, 2016 as the fiscal 2016 acquisitions were not material to the consolidated financial statements.
|
|
|
For the fiscal year ended June 30, |
|
||||
|
|
|
2015 |
|
2014 |
|
||
|
Net sales |
|
$ |
1,807,513 |
|
$ |
1,902,429 |
|
|
Net income (loss) |
|
$ |
14,172 |
|
$ |
(120,420) |
|
|
Earnings (loss) per share - basic and diluted |
|
$ |
0.22 |
|
$ |
(1.94) |
|
CD Cartondruck AG
The Company had deferred consideration relating to the June 9, 2011 purchase of Cartondruck that was subject to satisfaction of certain employment contingencies. The value of the contingent consideration was recorded as compensation expense on a straight-line basis over the period of a required employment agreement. The Company had a restricted cash balance at June 30, 2015 related to this arrangement in the amount of $1,985, which is recorded in other assets on the accompanying consolidated balance sheets. On June 13, 2016 the restricted cash that was held in escrow was released to the sellers as required. Additionally, an additional “earnout” payment would have been payable based on the future performance of the acquired company. On June 13, 2016 the Company and the sellers agreed that no additional payment was due under this “earnout” arrangement. In connection with the resolution of these contingencies in June 2016 and the final payments made, the Company recorded a $320 reduction of expense, which is included within stock based and deferred compensation expense in the consolidated statements of operations and comprehensive income (loss).
82
Note 5—Inventories
Inventories consisted of the following:
|
|
|
Successor |
|
||||
|
|
|
As of |
|
As of |
|
||
|
|
|
June 30, 2016 |
|
June 30, 2015 |
|
||
|
Raw materials |
|
$ |
52,964 |
|
$ |
55,667 |
|
|
Work in progress |
|
|
28,806 |
|
|
28,234 |
|
|
Finished goods |
|
|
83,847 |
|
|
87,935 |
|
|
|
|
$ |
165,617 |
|
$ |
171,836 |
|
Note 6—Intangible Assets
Intangible assets, net, consisted of the following:
|
|
|
Successor |
|
|||||||||
|
|
|
Gross Carrying |
|
Accumulated |
|
|
|
Weighted Average |
|
|||
|
As of June 30, 2016 |
|
Amount |
|
Amortization |
|
Net |
|
Useful Life (Years) |
|
|||
|
Customer relationships |
|
$ |
450,505 |
|
$ |
(122,540) |
|
$ |
327,965 |
|
20 |
|
|
Developed technology |
|
|
17,746 |
|
|
(8,256) |
|
|
9,490 |
|
5 |
|
|
Photo library |
|
|
1,396 |
|
|
(667) |
|
|
729 |
|
5 |
|
|
Licensing agreements |
|
|
3,372 |
|
|
(698) |
|
|
2,674 |
|
20 |
|
|
Total |
|
$ |
473,019 |
|
$ |
(132,161) |
|
$ |
340,858 |
|
|
|
|
|
|
Successor |
|
|||||||||
|
|
|
Gross Carrying |
|
Accumulated |
|
|
|
Weighted Average |
|
|||
|
As of June 30, 2015 |
|
Amount |
|
Amortization |
|
Net |
|
Useful Life (Years) |
|
|||
|
Customer relationships |
|
$ |
479,778 |
|
$ |
(78,457) |
|
$ |
401,321 |
|
20 |
|
|
Developed technology |
|
|
19,907 |
|
|
(5,508) |
|
|
14,399 |
|
5 |
|
|
Photo library |
|
|
1,259 |
|
|
(403) |
|
|
856 |
|
5 |
|
|
Licensing agreements |
|
|
3,524 |
|
|
(367) |
|
|
3,157 |
|
20 |
|
|
Total |
|
$ |
504,468 |
|
$ |
(84,735) |
|
$ |
419,733 |
|
|
|
Amortization expense included in selling, general and administrative expenses was as follows:
|
|
|
Successor |
|
|
Predecessor |
|
||||||||
|
|
|
Fiscal Year Ended |
|
Period from August |
|
|
Period from July 1 |
|
||||||
|
|
|
June 30, |
|
15, 2013 through |
|
|
2013 through |
|
||||||
|
|
|
2016 |
|
2015 |
|
June 30, 2014 |
|
|
August 14, 2013 |
|
||||
|
Amortization of intangible assets |
|
$ |
55,317 |
|
$ |
53,668 |
|
$ |
31,375 |
|
|
$ |
948 |
|
Estimated future amortization expense related to intangible assets over the next five fiscal years is as follows:
|
|
|
Fiscal Year ended June 30, |
|
|||||||||||||
|
|
|
2017 |
|
2018 |
|
2019 |
|
2020 |
|
2021 |
|
|||||
|
Estimated amortization expense |
|
$ |
51,441 |
|
$ |
47,804 |
|
$ |
40,687 |
|
$ |
33,085 |
|
$ |
28,459 |
|
83
Note 7—Goodwill
Goodwill represents the excess of the cost of an acquisition over the fair value of the net assets acquired. The Company tests goodwill for impairment annually as of the first day of the fourth fiscal quarter, or more frequently if indicators of potential impairment exist.
Changes in the carrying amount of goodwill by segment for the fiscal years ended June 30, 2016 and 2015 were as follows:
|
|
|
Successor |
|
||||||||||
|
|
|
North America |
|
Europe |
|
Asia |
|
Total |
|
||||
|
Balance as of June 30, 2014 |
|
$ |
250,784 |
|
$ |
239,778 |
|
$ |
176 |
|
$ |
490,738 |
|
|
Acquisition activity |
|
|
— |
|
|
5,444 |
|
|
666 |
|
|
6,110 |
|
|
Translation adjustments |
|
|
— |
|
|
(21,947) |
|
|
— |
|
|
(21,947) |
|
|
Balance as of June 30, 2015 |
|
|
250,784 |
|
|
223,275 |
|
|
842 |
|
|
474,901 |
|
|
Acquisition activity |
|
|
7,297 |
|
|
330 |
|
|
— |
|
|
7,627 |
|
|
Translation adjustments |
|
|
— |
|
|
(17,801) |
|
|
(13) |
|
|
(17,814) |
|
|
Balance as of June 30, 2016 |
|
$ |
258,081 |
|
$ |
205,804 |
|
$ |
829 |
|
$ |
464,714 |
|
Note 8—Fair Value of Financial Instruments
The following table sets forth the Company’s financial assets and liabilities carried at fair value on a recurring basis by level within the fair value hierarchy:
|
|
|
Successor |
|
||||||||||
|
As of June 30, 2016 |
|
Level 1 |
|
Level 2 |
|
Level 3 |
|
Total |
|
||||
|
Assets: |
|
|
|
|
|
|
|
|
|
|
|
|
|
|
Available for sale securities |
|
$ |
261 |
|
$ |
— |
|
$ |
— |
|
$ |
261 |
|
|
Foreign currency contracts |
|
|
— |
|
|
435 |
|
|
— |
|
|
435 |
|
|
|
|
|
|
|
|
|
|
|
|
|
|
|
|
|
Liabilities: |
|
|
|
|
|
|
|
|
|
|
|
|
|
|
Interest rate swaps |
|
|
— |
|
|
3,573 |
|
|
— |
|
|
3,573 |
|
|
Foreign currency contracts |
|
|
— |
|
|
323 |
|
|
— |
|
|
323 |
|
|
Contingent consideration |
|
|
— |
|
|
— |
|
|
1,265 |
|
|
1,265 |
|
|
|
|
Successor |
|
||||||||||
|
As of June 30, 2015 |
|
Level 1 |
|
Level 2 |
|
Level 3 |
|
Total |
|
||||
|
Assets: |
|
|
|
|
|
|
|
|
|
|
|
|
|
|
Available for sale securities |
|
$ |
253 |
|
$ |
— |
|
$ |
— |
|
$ |
253 |
|
|
Foreign currency contracts |
|
|
— |
|
|
57 |
|
|
— |
|
|
57 |
|
|
|
|
|
|
|
|
|
|
|
|
|
|
|
|
|
Liabilities: |
|
|
|
|
|
|
|
|
|
|
|
|
|
|
Interest rate swaps |
|
|
— |
|
|
2,988 |
|
|
— |
|
|
2,988 |
|
|
Foreign currency contracts |
|
|
— |
|
|
34 |
|
|
— |
|
|
34 |
|
Available for sale securities represent an investment in Zoo Digital Group PLC (“Zoo”), a provider of software and software-led services for the filmed entertainment and pharmaceutical markets, and is reported at fair value based on quoted market prices. The fair value of interest rate swaps and foreign currency contracts are based on pricing models that rely on market observable inputs such as yield curves, currency exchange rates and forward prices.
84
The Company maintains two amortizing interest rate swaps that mature in December 2017. The swaps are being used to hedge the exposure to changes in the market LIBOR or EURIBOR rates. At June 30, 2016 and 2015, one of the swaps had a notional amount of £84,608 and £113,970 respectively, whereby the Company pays a fixed rate of interest of 1.1649% and receives a variable rate based on LIBOR on the amortizing notional amount. The other swap had a notional amount of €97,786 and €131,719, respectively, whereby the Company pays a fixed rate of interest of 1.0139% and receives a variable rate based on EURIBOR on the amortizing notional amount. As of June 30, 2016 and 2015, the swaps had a negative fair value of $3,573 and $2,988, respectively, which is included in other long-term liabilities in the consolidated balance sheets. The Company has not designated these interest rate swaps as effective hedges and, as such, the change in the fair value each period is recorded in other (expense) income, net.
In connection with the acquisition of BluePrint in July 2015, payment of a portion of the purchase price is contingent upon the achievement of certain operating results (see Note 4). The Company estimated the acquisition date fair value of the contingent consideration as the present value of the expected contingent payments, determined using the weighted probabilities of the possible payments. The Company is required to reassess the fair value of contingent payments on a periodic basis. The significant inputs used in the estimate of this obligation includes numerous possible scenarios for the payments based on the contractual terms of the contingent consideration, for which probabilities are assigned to each scenario, which are then discounted based on an individual risk analysis of the liability. Although the Company believes its estimates and assumptions are reasonable, different assumptions, including those regarding the operating results of the respective businesses, or changes in the future may result in different estimated amounts. Other than translation adjustments, there were no changes in the balance of the contingent consideration during the fiscal year ended June 30, 2016.
During the fiscal year ended June 30, 2016, the Company recorded an impairment charge of $2,026 related to certain property, plant and equipment at the Stuttgart, Germany facility (part of the Europe operating segment) as a result of the indicator of impairment related to the announced decision to close this location. The impairment charge was based on the excess of the carrying value of such assets over their estimate fair values. The estimated fair values of the land and building portion of the impairment charge were determined based on level 3 measurements, while the estimated fair values of machinery and equipment were based on level 3 measurements.
Note 9—Other (Expense) Income, net
Other (expense) income, net is comprised of the following:
|
|
|
Successor |
|
|
Predecessor |
|
||||||||
|
|
|
Fiscal Year Ended |
|
Period from August |
|
|
Period from July 1 |
|
||||||
|
|
|
June 30, |
|
15, 2013 through |
|
|
2013 through |
|
||||||
|
|
|
2016 |
|
2015 |
|
June 30, 2014 |
|
|
August 14, 2013 |
|
||||
|
Equity in net earnings of unconsolidated entities |
|
$ |
— |
|
$ |
138 |
|
$ |
225 |
|
|
$ |
23 |
|
|
Foreign currency (losses) gains |
|
|
(5,182) |
|
|
12,171 |
|
|
777 |
|
|
|
364 |
|
|
Gain on settlement of multiemployer pension liability |
|
|
— |
|
|
— |
|
|
— |
|
|
|
676 |
|
|
Impairment on investment |
|
|
— |
|
|
— |
|
|
(1,006) |
|
|
|
— |
|
|
(Loss) gain on derivatives |
|
|
(1,147) |
|
|
(2,307) |
|
|
391 |
|
|
|
— |
|
|
Other (loss) income |
|
|
(74) |
|
|
623 |
|
|
(17) |
|
|
|
— |
|
|
Other (expense) income, net |
|
$ |
(6,403) |
|
$ |
10,625 |
|
$ |
370 |
|
|
$ |
1,063 |
|
The Company previously held a 50% ownership interest in SR3 Solutions, LLC (“SR3”), a packaging brokerage business, which was accounted for using the equity method of accounting. In June 2014, the two principals of SR3 informed the Company that they would not renew their employment agreements that were to expire in August 2014 and began discussions to dissolve the partnership. Due to the principals’ decision the Company determined the investment was fully impaired and recorded an impairment loss of $1,006 in the period from August 15, 2013 through June 30, 2014.
85
Note 10—Accumulated Other Comprehensive Income (Loss)
The change in accumulated other comprehensive income (loss) is as follows:
|
|
|
Foreign Currency |
|
|
|
|
|
|
|
|
|
|
|
|
|
|
Translation |
|
|
|
|
|
|
|
|
|
|
|
|
|
|
Adjustments and |
|
Available for |
|
Pension |
|
|
|
|
|||
|
|
|
other (a) |
|
Sale Securities |
|
Adjustments (b) |
|
Total |
|
||||
|
Predecessor |
|
|
|
|
|
|
|
|
|
|
|
|
|
|
Balance as of June 30, 2013 |
|
$ |
(1,686) |
|
$ |
— |
|
$ |
— |
|
$ |
(1,686) |
|
|
Other comprehensive income (loss) |
|
|
731 |
|
|
8 |
|
|
— |
|
|
739 |
|
|
Balance as of August 14, 2013 |
|
$ |
(955) |
|
$ |
8 |
|
$ |
— |
|
$ |
(947) |
|
|
|
|
|
|
|
|
|
|
|
|
|
|
|
|
|
Successor |
|
|
|
|
|
|
|
|
|
|
|
|
|
|
Balance as of August 15, 2013 |
|
$ |
— |
|
$ |
— |
|
$ |
— |
|
$ |
— |
|
|
Other comprehensive income (loss) |
|
|
5,919 |
|
|
9 |
|
|
6,963 |
|
|
12,891 |
|
|
Balance as of June 30, 2014 |
|
|
5,919 |
|
|
9 |
|
|
6,963 |
|
|
12,891 |
|
|
Other comprehensive income (loss) |
|
|
(38,964) |
|
|
6 |
|
|
12,780 |
|
|
(26,178) |
|
|
Balance as of June 30, 2015 |
|
|
(33,045) |
|
|
15 |
|
|
19,743 |
|
|
(13,287) |
|
|
Other comprehensive income (loss) |
|
|
(44,371) |
|
|
17 |
|
|
(5,637) |
|
|
(49,991) |
|
|
Other comprehensive income from noncontrolling interest due to the purchase of CD Cartondruck GmbH |
|
|
(12) |
|
|
— |
|
|
— |
|
|
(12) |
|
|
Balance as of June 30, 2016 |
|
$ |
(77,428) |
|
$ |
32 |
|
$ |
14,106 |
|
$ |
(63,290) |
|
|
(a) |
Foreign currency translation adjustments includes $12,119 (net of taxes of $3,001) of unrealized foreign currency losses for the fiscal year ended June 30, 2016 related to intercompany foreign currency transactions that are of a long-term investment nature and a net investment hedge. |
|
(b) |
Pension adjustments are reported net of taxes of $2,967 as of June 30, 2016. |
There were no amounts reclassified from accumulated other comprehensive income during the periods from July 1, 2013 to August 14, 2013 and August 15, 2013 to June 30, 2014, or the fiscal years ended June 30, 2015 and 2016.
Note 11—Income Taxes
The Company’s provision for income taxes consists of the following:
|
|
|
Successor |
|
|
Predecessor |
|
||||||||
|
|
|
Fiscal Year Ended |
|
Period from August |
|
|
Period from July 1 |
|
||||||
|
|
|
June 30, |
|
15, 2013 through |
|
|
2013 through |
|
||||||
|
|
|
2016 |
|
2015 |
|
June 30, 2014 |
|
|
August 14, 2013 |
|
||||
|
Current: |
|
|
|
|
|
|
|
|
|
|
|
|
|
|
|
State |
|
$ |
113 |
|
$ |
270 |
|
$ |
127 |
|
|
$ |
(395) |
|
|
Federal |
|
|
149 |
|
|
— |
|
|
3 |
|
|
|
— |
|
|
Foreign |
|
|
8,053 |
|
|
7,327 |
|
|
4,504 |
|
|
|
375 |
|
|
Total current |
|
|
8,315 |
|
|
7,597 |
|
|
4,634 |
|
|
|
(20) |
|
|
Deferred: |
|
|
|
|
|
|
|
|
|
|
|
|
|
|
|
State |
|
|
314 |
|
|
(2,880) |
|
|
(2,043) |
|
|
|
(1,535) |
|
|
Federal |
|
|
1,094 |
|
|
(7,497) |
|
|
(17,850) |
|
|
|
(13,818) |
|
|
Foreign |
|
|
(1,868) |
|
|
900 |
|
|
(4,222) |
|
|
|
(248) |
|
|
Total deferred |
|
|
(460) |
|
|
(9,477) |
|
|
(24,115) |
|
|
|
(15,601) |
|
|
Income tax expense (benefit) |
|
$ |
7,855 |
|
$ |
(1,880) |
|
$ |
(19,481) |
|
|
$ |
(15,621) |
|
86
The geographic components of income (loss) before income taxes are as follows:
|
|
|
Successor |
|
|
Predecessor |
|
||||||||
|
|
|
Fiscal Year Ended |
|
Period from August |
|
|
Period from July 1 |
|
||||||
|
|
|
June 30, |
|
15, 2013 through |
|
|
2013 through |
|
||||||
|
|
|
2016 |
|
2015 |
|
June 30, 2014 |
|
|
August 14, 2013 |
|
||||
|
United States |
|
$ |
5,326 |
|
$ |
(29,377) |
|
$ |
(68,079) |
|
|
$ |
(41,656) |
|
|
Rest of World |
|
|
3,856 |
|
|
34,523 |
|
|
(3,050) |
|
|
|
2,350 |
|
|
Income (loss) before income taxes |
|
$ |
9,182 |
|
$ |
5,146 |
|
$ |
(71,129) |
|
|
$ |
(39,306) |
|
Reconciliations of expected income taxes at the U.S. federal statutory rate of 35% to the Company’s provision for income taxes are as follows:
|
|
|
Successor |
|
|
Predecessor |
|
||||||||
|
|
|
Fiscal Year Ended |
|
Period from August |
|
|
Period from July 1 |
|
||||||
|
|
|
June 30, |
|
15, 2013 through |
|
|
2013 through |
|
||||||
|
|
|
2016 |
|
2015 |
|
June 30, 2014 |
|
|
August 14, 2013 |
|
||||
|
Income tax expense (benefit) at statutory rate |
|
$ |
3,214 |
|
$ |
1,801 |
|
$ |
(24,895) |
|
|
$ |
(13,757) |
|
|
Non-deductible transaction costs |
|
|
449 |
|
|
608 |
|
|
3,907 |
|
|
|
1,467 |
|
|
Foreign tax rate differentials |
|
|
(499) |
|
|
(4,245) |
|
|
723 |
|
|
|
(455) |
|
|
State taxes, net of federal benefit |
|
|
427 |
|
|
(134) |
|
|
(1,916) |
|
|
|
(2,461) |
|
|
Adjustment of uncertain tax positions and interest |
|
|
(347) |
|
|
(1,253) |
|
|
— |
|
|
|
— |
|
|
Non-deductible stock based compensation |
|
|
5,241 |
|
|
1,806 |
|
|
— |
|
|
|
— |
|
|
Permanent differences |
|
|
1,428 |
|
|
1,043 |
|
|
1,354 |
|
|
|
16 |
|
|
Valuation allowance |
|
|
1,012 |
|
|
316 |
|
|
1,445 |
|
|
|
— |
|
|
Change in enacted tax rates |
|
|
(2,438) |
|
|
(2,746) |
|
|
— |
|
|
|
— |
|
|
Other |
|
|
(632) |
|
|
924 |
|
|
(99) |
|
|
|
(431) |
|
|
Income tax expense (benefit) |
|
$ |
7,855 |
|
$ |
(1,880) |
|
$ |
(19,481) |
|
|
$ |
(15,621) |
|
|
|
|
|
|
|
|
|
|
|
|
|
|
|
|
|
|
Effective tax rate |
|
|
85.5% |
|
|
-36.5% |
|
|
27.4% |
|
|
|
39.7% |
|
Foreign rate differentials are attributable to lower foreign statutory tax rates in multiple jurisdictions outside of the United States and based on economic zone status and foreign government tax reduction approval.
Included in the fiscal year ending June 30, 2016 is an expense of $5,241 for non-deductible stock based compensation and a net benefit of $2,438 related to a change in the enacted income tax rates in the United Kingdom and the granting of a High and New Technology Exemption (“HNTE”) for one of our subsidiaries in China, both of which impacted the amount of our net deferred tax liabilities at the respective subsidiaries.
Included in the fiscal year ending June 30, 2015 is a benefit of $1,253 reflecting the recognition of previously unrecognized tax benefits due to the expirations of statute of limitations for certain foreign uncertain tax positions and a benefit of $2,746 related to a change in the state income tax rate from 3.5% to 2%.
87
Deferred income taxes
The Company’s deferred tax assets and liabilities consist of the following:
|
|
|
Successor |
|
||||
|
|
|
As of |
|
As of |
|
||
|
|
|
June 30, 2016 |
|
June 30, 2015 |
|
||
|
Deferred tax assets: |
|
|
|
|
|
|
|
|
Inventories |
|
$ |
2,183 |
|
$ |
2,194 |
|
|
Net operating losses and other carryforwards |
|
|
32,374 |
|
|
37,342 |
|
|
Allowance for doubtful accounts |
|
|
686 |
|
|
894 |
|
|
Stock based and other compensation |
|
|
3 |
|
|
1,502 |
|
|
Post-retirement benefits |
|
|
1,690 |
|
|
6,125 |
|
|
Interest |
|
|
— |
|
|
— |
|
|
Goodwill |
|
|
— |
|
|
2,057 |
|
|
Accrued expenses and other |
|
|
5,843 |
|
|
9,306 |
|
|
Gross deferred tax assets |
|
|
42,779 |
|
|
59,420 |
|
|
Valuation allowance |
|
|
(10,544) |
|
|
(10,050) |
|
|
Deferred tax assets |
|
|
32,235 |
|
|
49,370 |
|
|
Deferred tax liabilities: |
|
|
|
|
|
|
|
|
Property and equipment |
|
|
(18,005) |
|
|
(19,469) |
|
|
Goodwill |
|
|
(685) |
|
|
— |
|
|
Intangible assets |
|
|
(78,960) |
|
|
(99,940) |
|
|
Deferred tax liabilities |
|
|
(97,650) |
|
|
(119,409) |
|
|
Net deferred tax liability |
|
$ |
(65,415) |
|
$ |
(70,039) |
|
As of June 30, 2016 and 2015, the Company has net operating loss carryforwards of approximately $120,537 and $104,939. As of June 30, 2016, U.S. Federal net operating loss carryforwards comprise approximately $55,380, which expire between 2025 and 2035. U.S. state net operating loss carryforwards are approximately $30,946, of which $17,171 can be carried forward 10-20 years, $12,863 can be carried forward 6-10 years, and $912 can be carried forward 1-5 years. Foreign net operating loss carryforwards comprise approximately $34,211 as of June 30, 2016, of which $10,895 can be carried forward indefinitely, $8,551 can be carried forward for 6-10 years and $14,765 can be carried forward for 1-5 years.
The gross deferred income tax asset for these net operating losses is approximately $29,423 with recorded valuation allowances of approximately $7,128. Approximately $13,345 of the deferred tax asset is attributable to net operating losses in the US that are subject to limitations under Section 382 of the Internal Revenue Code for transactions resulting in ownership changes in the prior periods. A valuation allowance has not been recorded on these deferred tax assets as the limitations imposed by the U.S. tax laws do not result in a change in judgment as to the realizability of such assets.
Cash paid (refunded) for income taxes was approximately $12,596, $6,158, $6,207 and $(19) for the fiscal years ended June 30, 2016 and 2015, the period from August 15, 2013 through June 30, 2014 and the period from July 1, 2013 through August 14, 2013.
Uncertain Tax Positions
As of June 30, 2016 and 2015, the total liability for uncertain tax benefits was $2,106 and $2,794, respectively, including accrued interest and penalties and net of related benefits. While the Company believes its tax estimates are reasonable and that it prepares its tax filings in accordance with applicable tax laws, the final determination with respect to any tax audit could be materially different from our estimates or from our historical income tax provisions and accruals.
88
Unrecognized tax benefits represent the aggregate tax effect of differences between tax return positions and the amounts otherwise recognized in the Company’s consolidated financial statements and are reflected in “Other long-term liabilities” in the Consolidated Balance Sheet. A reconciliation of the beginning and ending amount of unrecognized tax benefits, including interest and penalties, is as follows:
|
|
|
Successor |
|
|
Predecessor |
|
||||||||
|
|
|
Fiscal Year Ended |
|
Period from August |
|
|
Period from July 1 |
|
||||||
|
|
|
June 30, |
|
15, 2013 through |
|
|
2013 through |
|
||||||
|
|
|
2016 |
|
2015 |
|
June 30, 2014 |
|
|
August 14, 2013 |
|
||||
|
At the beginning of the period |
|
$ |
2,794 |
|
$ |
1,601 |
|
$ |
348 |
|
|
$ |
348 |
|
|
Acquisitions |
|
|
— |
|
|
2,636 |
|
|
1,253 |
|
|
|
— |
|
|
Accrued interest and penalties |
|
|
— |
|
|
65 |
|
|
— |
|
|
|
— |
|
|
Decreases for tax positions related to prior periods |
|
|
(341) |
|
|
(255) |
|
|
— |
|
|
|
— |
|
|
Decreases due to lapsed statute of limitations |
|
|
(347) |
|
|
(1,253) |
|
|
— |
|
|
|
— |
|
|
At the end of the period |
|
$ |
2,106 |
|
$ |
2,794 |
|
$ |
1,601 |
|
|
$ |
348 |
|
Included in the balance of unrecognized tax benefits as of June 30, 2016 and 2015, are $2,106 and $2,794, respectively, of tax benefits that, if recognized, would affect the effective tax rate.
The unrecognized tax benefits accrual for the year ended June 30, 2016 consists of federal and foreign tax matters. It is unlikely that the Company’s total unrecognized tax benefits will decrease during the next year. The Company has elected to treat interest and penalties attributable to income taxes to the extent they arise, as a component of its income tax expense or benefit. For the period from August 15, 2013 through June 30, 2014, the period from July 1, 2013 to August 14, 2013, and the fiscal year ended June 30, 2016, no interest or penalties were required to be recorded. During the fiscal year ended June 30, 2015, the Company recorded $65 of interest and penalties.
As part of the acquisition the Company received indemnification for all taxes payable and unrecognized tax positions incurred by ASG prior to the date of acquisition from the prior owners. As of June 30, 2016, the Company has an indemnification receivable balance of $2,106 due from the former owners of ASG.
The Company files tax returns in multiple jurisdictions and is subject to examination by tax authorities in these jurisdictions. Significant tax jurisdictions include the US, UK and Germany. Tax years from fiscal 2012 through 2015 remain open and subject to examination in the Company’s major taxing jurisdictions.
As of June 30, 2016, the Company is under tax audit in Mexico for 2008, Ireland for 2015, Canada for 2012-2014 and Germany for 2009-2011.
It is the intention of the Company to reinvest the earnings of its subsidiaries outside of the UK. At June 30, 2016, approximately $103,722 of accumulated earnings were indefinitely reinvested. Determining the deferred tax liability for these undistributed foreign earnings is not practicable. A deferred tax liability may be required in the future if the Company’s business strategy changes and requires distributions of previously indefinitely reinvested earnings.
Note 12—Employee Benefit Plans
Defined Contribution Plans
The Company maintains various defined contribution benefit plans (the “Plans”). The Plans cover substantially all North America non-union employees and substantially all the European work force of the Company and include provisions for the Company to match a percentage of the employees’ contributions at a rate determined by the Board of Directors each year.
89
Contributions to the Plans were approximately $7,301, $7,920, $3,927 and $295 for the fiscal years ended June 30, 2016 and 2015, the period from August 15, 2013 through June 30, 2014, and the period from July 1, 2013 through August 14, 2013, respectively. Contributions are recorded in cost of goods sold and selling, general and administrative expenses in the consolidated statements of operations and comprehensive income (loss).
Defined Benefit Plans
The Company maintains a number of defined benefit pension plans for the benefit of its employees throughout the world, which vary depending on the conditions and practices in the countries concerned. The principal defined benefit pension plan is the Field Group Pension Plan in the United Kingdom. The assets of the plan are held in an external trustee-administered fund. The Company also operates two further defined benefit pension plans in the United Kingdom (known as the Chesapeake pension plan and the GCM pension plan), as well as a number of defined benefit arrangements in France and Germany. The defined benefit pension plans in the United Kingdom are funded while the French and German plans are mainly unfunded. The benefits are based on a fixed rate of pay per year depending on the department worked in and function of the participant. Charges to expense are based upon costs computed by an independent actuary.
The following table presents, for the fiscal years noted, a summary of the changes in the projected benefit obligation, plan assets and funded status of the Company’s pension plans:
|
|
|
Successor |
|
||||
|
|
|
As of |
|
As of |
|
||
|
|
|
June 30, 2016 |
|
June 30, 2015 |
|
||
|
Change in benefit obligation: |
|
|
|
|
|
|
|
|
Benefit obligation at beginning of year |
|
$ |
585,783 |
|
$ |
579,708 |
|
|
Service cost |
|
|
3,618 |
|
|
3,676 |
|
|
Interest cost |
|
|
20,298 |
|
|
22,891 |
|
|
Foreign exchange impact |
|
|
(95,960) |
|
|
(42,855) |
|
|
Actuarial loss |
|
|
72,299 |
|
|
39,891 |
|
|
Employee contributions |
|
|
1,304 |
|
|
1,394 |
|
|
Benefits paid |
|
|
(19,954) |
|
|
(18,922) |
|
|
Benefit obligation at end of year |
|
$ |
567,388 |
|
$ |
585,783 |
|
|
|
|
|
|
|
|
|
|
|
Change in plan assets: |
|
|
|
|
|
|
|
|
Fair value of plan assets at beginning of year |
|
$ |
594,769 |
|
$ |
557,271 |
|
|
Actual return on plan assets |
|
|
92,936 |
|
|
81,813 |
|
|
Foreign exchange impact |
|
|
(98,248) |
|
|
(41,234) |
|
|
Employer contributions |
|
|
13,360 |
|
|
14,447 |
|
|
Employee contributions |
|
|
1,304 |
|
|
1,394 |
|
|
Benefits paid |
|
|
(19,954) |
|
|
(18,922) |
|
|
Fair value of plan assets at end of year |
|
$ |
584,167 |
|
$ |
594,769 |
|
|
|
|
|
|
|
|
|
|
|
Net overfunded status at end of year |
|
$ |
16,779 |
|
$ |
8,986 |
|
|
|
|
|
|
|
|
|
|
|
Components of the amounts recognized in the Consolidated Balance Sheet: |
|
|
|
|
|
|
|
|
Other long-term assets |
|
$ |
24,880 |
|
$ |
20,576 |
|
|
Other long-term liabilities |
|
|
(8,101) |
|
|
(11,590) |
|
|
Net overfunded status |
|
$ |
16,779 |
|
$ |
8,986 |
|
The accumulated benefit obligation totaled $549,311 and $562,230 as of June 30, 2016 and 2015, respectively.
90
The following table is a summary of the annual cost of the Company’s pension plans:
|
|
|
Successor |
|
|
Predecessor |
|
||||||||
|
|
|
Fiscal Year Ended |
|
Period from August |
|
|
Period from July 1 |
|
||||||
|
|
|
June 30, |
|
15, 2013 through |
|
|
2013 through |
|
||||||
|
|
|
2016 |
|
2015 |
|
June 30, 2014 |
|
|
August 14, 2013 |
|
||||
|
Service cost |
|
$ |
3,618 |
|
$ |
3,676 |
|
$ |
1,331 |
|
|
$ |
— |
|
|
Interest cost |
|
|
20,298 |
|
|
22,891 |
|
|
9,127 |
|
|
|
38 |
|
|
Expected return on plan assets |
|
|
(24,044) |
|
|
(25,730) |
|
|
(9,905) |
|
|
|
— |
|
|
Curtailment gain |
|
|
— |
|
|
— |
|
|
(75) |
|
|
|
— |
|
|
Net periodic benefit cost |
|
$ |
(128) |
|
$ |
837 |
|
$ |
478 |
|
|
$ |
38 |
|
The following table is a summary of the amounts recognized in other comprehensive income:
|
|
|
Successor |
|
|
Predecessor |
|
||||||||
|
|
|
Fiscal Year Ended |
|
Period from August |
|
|
Period from July 1 |
|
||||||
|
|
|
June 30, |
|
15, 2013 through |
|
|
2013 through |
|
||||||
|
|
|
2016 |
|
2015 |
|
June 30, 2014 |
|
|
August 14, 2013 |
|
||||
|
Actuarial gain, net of tax |
|
$ |
(13,807) |
|
$ |
(12,758) |
|
$ |
(6,861) |
|
|
$ |
— |
|
|
Effect of foreign exchange rates |
|
|
— |
|
|
(22) |
|
|
(82) |
|
|
|
— |
|
|
Total recognized in other comprehensive (income) |
|
$ |
(13,807) |
|
$ |
(12,780) |
|
$ |
(6,943) |
|
|
$ |
— |
|
The weighted average assumptions used to determine benefit for the Company’s pension plans as follows:
|
|
|
Successor |
|
||||
|
|
|
As of |
|
As of |
|
||
|
|
|
June 30, 2016 |
|
June 30, 2015 |
|
||
|
Discount rate |
|
|
1.0% - 2.9% |
|
|
1.8% - 3.8% |
|
|
Expected rate of return |
|
|
1.0% - 3.6% |
|
|
1.7% - 4.4% |
|
|
Rate of compensation increase |
|
|
2.0% - 2.8% |
|
|
2.0% - 3.7% |
|
|
Rate of price inflation |
|
|
1.8% - 2.8% |
|
|
1.8% - 3.2% |
|
The Company’s employs a dynamic de-risking investment strategy where target investments are updated quarterly to match the funding status of the plan. As the funding status increases there is a gradual de-risking of the plan assets. At June 30, 2016, the plan asset investments are comparative to the current investment strategy.
The expected return on assets assumptions are derived by considering market expectations of the long-term rates of return on the plan investments. The overall expected return assumption is a weighted average of the expected returns on each asset class in which the schemes invest, reflecting the plan asset allocations.
The long-term rates of return on equities and real estate are derived by considering current risk free rates of return with the addition of an appropriate future risk premium. The long-term rate of return from gilt yields, bonds and cash investments are set in line with market yields at the balance sheet date. The return assumption is a net rate after expenses.
91
The following are the major categories of assets measured at fair value on a recurring basis as of June 30, 2016 and 2015, using quoted prices in active markets for identical assets (Level 1); significant other observable inputs (Level 2); and significant unobservable inputs (Level 3):
|
|
|
Successor |
|
||||||||||
|
|
|
Level 1 |
|
Level 2 |
|
Level 3 |
|
Total |
|
||||
|
As of June 30, 2016 |
|
|
|
|
|
|
|
|
|
|
|
|
|
|
Description: |
|
|
|
|
|
|
|
|
|
|
|
|
|
|
Investment funds |
|
$ |
1,238 |
|
$ |
577,038 |
|
$ |
— |
|
$ |
578,276 |
|
|
Insurance contracts |
|
|
2,862 |
|
|
288 |
|
|
— |
|
|
3,150 |
|
|
Cash and cash equivalents |
|
|
2,741 |
|
|
— |
|
|
— |
|
|
2,741 |
|
|
|
|
$ |
6,841 |
|
$ |
577,326 |
|
$ |
— |
|
$ |
584,167 |
|
|
|
|
|
|
|
|
|
|
|
|
|
|
|
|
|
As of June 30, 2015 |
|
|
|
|
|
|
|
|
|
|
|
|
|
|
Description: |
|
|
|
|
|
|
|
|
|
|
|
|
|
|
Investment funds |
|
$ |
1,307 |
|
$ |
587,743 |
|
$ |
— |
|
$ |
589,050 |
|
|
Debt securities |
|
|
113 |
|
|
— |
|
|
— |
|
|
113 |
|
|
Insurance contracts |
|
|
3,254 |
|
|
284 |
|
|
— |
|
|
3,538 |
|
|
Cash and cash equivalents |
|
|
2,068 |
|
|
— |
|
|
— |
|
|
2,068 |
|
|
|
|
$ |
6,742 |
|
$ |
588,027 |
|
$ |
— |
|
$ |
594,769 |
|
Benefit payments of the defined benefit pension plans are expected to be paid as follows:
|
For the Fiscal Year Ending |
|
Amount |
|
|
|
2017 |
|
$ |
16,492 |
|
|
2018 |
|
|
16,748 |
|
|
2019 |
|
|
17,358 |
|
|
2020 |
|
|
17,671 |
|
|
2021 |
|
|
17,994 |
|
|
2022-2026 |
|
|
96,350 |
|
|
|
|
$ |
182,613 |
|
Based on estimates as of June 30, 2016, the Company expects to make contributions to the pension plans during the year ended June 30, 2017 of $5,290.
The actuarial gain included in other comprehensive income is amortized through the net periodic benefit cost using a period of 30 years, which is the average life expectancy of deferred members.
Other Post-Employment Obligations
Shorewood Packaging Corporation of Canada operates a post-retirement medical plan (the “Shorewood Medical Plan”), which is unfunded. The unfunded benefit obligation as of June 30, 2016 and 2015 was $1,968 and $2,267. The net benefit cost recognized during the fiscal years ended June 30, 2016 and 2015 was $113 and $106. Based on estimates as of June 30, 2016, the Company expects to make contributions to the Shorewood Medical Plan during the fiscal year ended June 30, 2017 of $13.
The Company contributed to multiemployer pension plans covering employees under collective bargaining agreements that were assumed as part of the acquisition of certain assets and assumption of certain liabilities of Ivy Hill Corporation (“Ivy Hill”) in April 2009. In 2014, the Company triggered a complete withdrawal from each of these multiemployer plans, and as a result the Company is required to contribute its share of the respective plans’ unfunded benefit obligations as calculated by the funds’ actuaries. Based on those calculations, the Company was obligated to make 240 monthly payments of approximately $31, or approximately $378 per annum, to one of the pension funds and approximately $45, or approximately $539 per annum, to a second pension fund. As of June 30, 2016 and 2015, the total balance of these liabilities was $8,622 and $8,923, respectively, which represents the present value of the remaining payments at those dates. The portion of the amount to be paid within next 12 months ($323) is recorded in other current liabilities with the remainder recorded in other long-term liabilities in the consolidated balance sheets.
92
Note 13—Indebtedness
Total borrowings outstanding are summarized as follows:
|
|
|
Successor |
|
||||
|
|
|
As of |
|
As of |
|
||
|
|
|
June 30, 2016 |
|
June 30, 2015 |
|
||
|
Term Loans, due September 2020: |
|
|
|
|
|
|
|
|
Dollar Tranche A Term Loan |
|
$ |
94,851 |
|
$ |
120,780 |
|
|
Dollar Tranche B Term Loan |
|
|
255,909 |
|
|
325,875 |
|
|
Dollar Tranche C Term Loan |
|
|
105,223 |
|
|
133,988 |
|
|
Sterling Term Loan |
|
|
118,379 |
|
|
224,037 |
|
|
Euro Term Loan |
|
|
146,744 |
|
|
189,662 |
|
|
Less: discount and issuance costs |
|
|
(12,868) |
|
|
(20,688) |
|
|
Total Term Loans, net of discount and issuance costs |
|
|
708,238 |
|
|
973,654 |
|
|
|
|
|
|
|
|
|
|
|
Bonds Payable, due August 2021, net of discount and issuance costs |
|
|
196,743 |
|
|
196,107 |
|
|
|
|
|
|
|
|
|
|
|
Short-term foreign borrowings |
|
|
— |
|
|
3,488 |
|
|
|
|
|
|
|
|
|
|
|
Other borrowings: |
|
|
|
|
|
|
|
|
Foreign debt |
|
|
2,137 |
|
|
8,049 |
|
|
Capital leases |
|
|
705 |
|
|
2,780 |
|
|
|
|
|
|
|
|
|
|
|
Total borrowings outstanding |
|
|
907,823 |
|
|
1,184,078 |
|
|
|
|
|
|
|
|
|
|
|
Less: short-term foreign borrowings and current portion of |
|
|
(7,307) |
|
|
(14,452) |
|
|
|
|
|
|
|
|
|
|
|
Long-term debt, less current portion |
|
$ |
900,516 |
|
$ |
1,169,626 |
|
Scheduled annual future maturities of debt as of June 30, 2016, including amortization of discount and issuance costs, are as follows:
|
Due in Fiscal Year |
|
Amount |
|
|
|
2017 |
|
$ |
7,271 |
|
|
2018 |
|
|
6,235 |
|
|
2019 |
|
|
6,043 |
|
|
2020 |
|
|
5,599 |
|
|
2021 |
|
|
682,675 |
|
|
Thereafter |
|
|
200,000 |
|
|
|
|
$ |
907,823 |
|
93
Short-Term Foreign Borrowings
The Company previously financed the working capital needs of certain foreign operations using short-term borrowing arrangements in various currencies. As of June 30, 2015, there were borrowings outstanding of $3,488 (weighted average interest rate of 6.0%), while there were no such borrowings outstanding as of June 30, 2016 as these short-term borrowing arrangements were all paid in full and terminated in June 2016. The short-term foreign borrowing arrangements were generally secured by the respective subsidiaries real property. The carrying amount of the Company’s short-term foreign borrowings approximated their fair value.
Bonds Payable
On August 15, 2013, the Company issued $200,000 principal amount of its 8.5% Bonds Payable due 2021 (the “Bonds Payable”) in a private placement offering without registration rights. Interest on the Bonds Payable is payable semiannually. The Bonds Payable are governed by a Base Indenture and a First Supplemental Indenture between the Company and Wells Fargo Bank N.A., as trustee (collectively the “2013 Indenture”). The Senior Notes are the Company’s unsecured and unsubordinated obligations, ranking equally in right of payment to all of the Company’s existing and future unsecured and unsubordinated indebtedness and are guaranteed on an unsubordinated, unsecured basis by certain of the Company’s subsidiaries. The Bonds are not entitled to mandatory redemption or sinking fund payments. The Company may redeem the Bonds in whole or in part at any time and from time to time for cash at the redemption prices described in the 2013 Indenture.
As of June 30, 2016 and 2015, the fair value of the Bonds Payable was $209,000 and $204,000, respectively, and the carrying value was $196,743 and $196,107, respectively. The fair value was determined using quoted market prices (level 2).
Credit Agreement
On February 14, 2014, the Company entered into an Amended and Restated Credit Agreement, as subsequently amended, (collectively, the “Credit Agreement”) with Barclays Bank PLC as Administrative Agent and certain other participating banks. The Credit Agreement provides for various borrowings under term notes and revolving credit facilities. The term notes provided under the Credit Agreement are as follows: $122,000 Dollar Tranche A Term Loan (the “Term Loan A”), $280,000 Dollar Tranche B Term Loan (the “Term Loan B”), £145,000 Sterling Term Loan (the “Sterling Term Loan”), and £145,000 Euro Term Loan (the “Euro Term Loan”) (collectively, the “Term Notes”). The revolving credit facilities provided under the Credit Agreement are as follows: $50,000 Dollar Revolving Credit Facility (the “US Dollar Revolver”) and £50,000 Multi Currency Revolving Credit Facility (the “Non-US Dollar Revolver”). On April 4, 2014 the Company borrowed an additional $50,000 under Term Loan B, the proceeds were used to complete the Jet and IPS acquisitions (see Note 4). No amounts were outstanding under the US Dollar Revolver or the non-US Dollar Revolver at June 30, 2016 and 2015. Obligations under the Credit Agreement are guaranteed by substantially all of the Company’s assets.
The Term Loan A and Term Loan B bear interest equal to the greater of a) Barclay’s prime rate, b) 0.50% above the Federal Funds Rate or c) one month Euro Dollar rate plus 1.00% plus an applicable margin of 2.25%, or the LIBOR rate of 1.0% plus an applicable margin of 3.25%. The Sterling Loan bears interest equal to the greater of a) LIBOR rate or b) 1.0% plus an applicable margin of 5.0%. The Euro Loan bears interest equal to the greater of a) LIBOR rate or b) 1.0% plus an applicable margin of 4.5%.
The US Dollar Revolver bears interest equal to the greater of a) Barclay’s prime rate, or b) 0.50% above the Federal Funds Rate plus an applicable margin of 2.25% or the LIBOR rate plus an applicable margin of 3.25%. The Company is also required to pay an unused commitment fee of 0.5%. The Non-US Dollar Revolver bears interest equal to LIBOR plus 4.0%. The Company is also required to pay an unused commitment fee of 1.6%. The Company is required to remain compliant with certain covenants under its various debt instruments, including a Total Net Leverage Ratio, as defined in the Credit Agreement. The Company was in compliance with all covenants under its various debt instruments as of June 30, 2016.
94
On November 21, 2014, the Company entered into a Second Incremental Joinder Agreement and Amendment with Barclays Bank PLC as Administrative Agent and certain other participating banks. This amended agreement provided the Company borrowings in the amount of $135,000 under a term loan Dollar Tranche C (“Term Loan C”). The proceeds were used to complete the ASG acquisition (see Note 4). Term Loan C bears interest equal to or the LIBOR rate of 1.00% plus an applicable margin of 3.25%.
On December 16, 2014, the Company entered into the Fourth Amendment to the Credit Agreement with Barclays Bank PLC as Administrative Agent and certain other participating banks. This amendment reduced the applicable margin on the Euro Loan to 1.0% plus an applicable margin of 3.75% and on the Sterling Loan to 1.0% plus an applicable margin of 4.5%.
Extinguishment of Debt
On August 15, 2013, the Company settled the remaining principal balance of its previous First and Second Lien Credit Agreements dated December 6, 2012 of $368,600, together with accrued interest and fees of $490. Upon completion of such payment, the First and Second Lien Credit Agreements were terminated in their entirety.
On December 16, 2014, the Company entered into the Fourth Amendment to the Credit Agreement, as discussed above, and recorded a loss on extinguishment of debt in the amount of $1,019 for the pro rata share of the deferred financing fees and original issue discount that was extinguished which is recorded in the accompanying statements of operations and comprehensive income (loss).
During the fiscal year ended June 30, 2016, the Company made voluntary prepayments of $237,634 on our long term debt, which included $182,414 of prepayments on October 29, 2015 made with the proceeds from our initial public offering. In addition, periodic principal repayments are required under certain agreements. At the time of the prepayments, the Company recognized incremental amortization on the deferred financing and debt discount fees as debt extinguishment charges totaling $3,967 during the fiscal year ended June 30, 2016.
The following table summarizes the loss on extinguishment of debt charges recorded as result of these debt retirements:
|
|
|
Successor |
|
|
Predecessor |
|
||||||||
|
|
|
Fiscal Year Ended |
|
Period from August |
|
|
Period from July 1 |
|
||||||
|
|
|
June 30, |
|
15, 2013 through |
|
|
2013 through |
|
||||||
|
|
|
2016 |
|
2015 |
|
June 30, 2014 |
|
|
August 14, 2013 |
|
||||
|
Prepayment fee |
|
$ |
— |
|
$ |
— |
|
$ |
— |
|
|
$ |
2,400 |
|
|
Write-off of original issue discount and |
|
|
3,967 |
|
|
1,019 |
|
|
— |
|
|
|
11,642 |
|
|
Total loss on extinguishment of debt |
|
$ |
3,967 |
|
$ |
1,019 |
|
$ |
— |
|
|
$ |
14,042 |
|
Foreign Debt
The Company’s foreign debt bears interest at rates ranging from 1.75% to 5.35%, with varying maturities through 2019. At June 30, 2016 and 2015, the weighted-average interest rate on these foreign debt instruments was approximately 4.5% and 3.4%, respectively. The foreign debt instruments are generally issued in support of specific capital expenditures and are secured by the underlying value of these assets.
Cash paid for interest was approximately $60,482, $70,609, $41,456 and $3,703 for the fiscal years ended June 30, 2016 and 2015, the period from August 15, 2013 through June 30, 2014, and the period from July 1, 2013 through August 14, 2013, respectively.
95
Note 14—Restructuring Related Costs
In November 2013, the Company announced its intention to reorganize and cease its operations in its Terre Haute, Indiana, Evansville, Indiana and Fairfield, New Jersey facilities. In September 2015, the Company announced the closure of its facility in Melrose Park, Illinois. Additionally, in fiscal 2015, the Company recorded certain restructuring related severance costs primarily in Europe resulting from the integration of businesses subsequent to the merger with Chesapeake in February 2014. In May 2016, the Company announced the planned closure and relocation of the business in Stuttgart, Germany. The following is a summary of the activity with respect to the Company’s restructuring related costs.
|
|
|
Successor |
|
|||||||
|
|
|
Severance and |
|
Buildings and |
|
|
|
|
||
|
|
|
Employee Related |
|
Related Costs |
|
Total |
|
|||
|
Balance at June 30, 2014 |
|
$ |
2,060 |
|
$ |
2,250 |
|
$ |
4,310 |
|
|
Restructuring related costs |
|
|
6,419 |
|
|
— |
|
|
6,419 |
|
|
Amounts paid |
|
|
(8,223) |
|
|
(1,474) |
|
|
(9,697) |
|
|
Balance at June 30, 2015 |
|
|
256 |
|
|
776 |
|
|
1,032 |
|
|
Restructuring related costs |
|
|
6,925 |
|
|
3,759 |
|
|
10,684 |
|
|
Amounts paid |
|
|
(3,705) |
|
|
(2,210) |
|
|
(5,915) |
|
|
Non-cash usage |
|
|
— |
|
|
(2,026) |
|
|
(2,026) |
|
|
Balance at June 30, 2016 |
|
$ |
3,476 |
|
$ |
299 |
|
$ |
3,775 |
|
These costs are primarily recorded in cost of goods sold in the accompanying consolidated statements of operations and comprehensive income (loss). Accrued restructuring related costs are included in other current liabilities on the consolidated balance sheets. The fiscal 2016 activity includes the impairment charge of $2,026 related to certain property, plant and equipment at the Stuttgart, Germany facility (see Note 8).
Of the total restructuring related costs for the fiscal year ended June 30, 2016, $3,576 were recorded in the North America segment and $7,108 were recorded in the Europe segment. Of the total restructuring related costs for the fiscal year ended June 30, 2015, $845 were recorded in the North America segment and $5,574 were recorded in the Europe segment.
Note 15—Operating Leases
The Company has various operating leases for certain facilities and equipment. Future minimum rental payments at June 30, 2016 under non-cancelable operating leases with initial terms of one year or more for the next five years and thereafter are as follows:
|
For the Fiscal Year Ending June 30, |
|
Amount |
|
|
|
2017 |
|
$ |
13,941 |
|
|
2018 |
|
|
11,285 |
|
|
2019 |
|
|
8,411 |
|
|
2020 |
|
|
7,097 |
|
|
2021 |
|
|
9,165 |
|
|
Thereafter |
|
|
16,534 |
|
|
|
|
$ |
66,433 |
|
Rent expense under all operating leases were $13,381, $14,504, $6,788 and $519 for the fiscal years ended June 30, 2016 and 2015, the period from August 15, 2013 through June 30, 2014, and the period from July 1, 2013 through August 14, 2013, respectively.
96
Note 16—Commitments and Contingencies
The Company participates in multiple collective bargaining agreements with various unions, which provide specified benefits to certain union employees. Approximately 8% of the Company’s employees in North America are unionized and approximately 75% of the Company’s employees in Europe are members of a union or works counsel or otherwise covered by labor agreements. The collective bargaining contract agreements with the various unions are set to expire at various dates between 2017, at which time, the Company expects to negotiate a renewal of the agreements.
The Company is involved in various proceedings, legal actions and claims arising in the normal course of business. Such matters are subject to many uncertainties, and outcomes are not predictable with assurance. The Company records amounts for losses that are deemed to be probable and subject to reasonable estimate. The Company does not anticipate losses as a result of these proceedings that would materially affect the Company’s consolidated financial statements.
Note 17—Related Party Transactions
The Company previously maintained a management agreement with an affiliate of the Predecessor’s majority shareholder, which provided for quarterly payments equal to the greater of a fixed annual fee or a variable annual fee based upon the Company’s annual EBITDA. Management fees and related expenses totaled $264 for the period from July 1, 2013 through August 14, 2013. The management agreement was terminated on August 15, 2013 in connection with the Transaction (see Note 1).
Also in connection with the Transaction, the Company paid fees of $3,500 and $4,000 to IPC and MDP, respectively. These amounts were recorded in transaction related expenses in the consolidated statement of operations and comprehensive income (loss) for the period from July 1, 2013 through August 14, 2013.
In connection with the Merger, the Company paid a fee of $5,000 to Carlyle. This amount was recorded in transaction related expenses in the consolidated statement of operations and comprehensive income (loss) for the period from August 15, 2013 through June 30, 2014.
On February 13, 2014, the Company loaned CEP III Chase Finance S.à r.l., an entity owned by Carlyle, and Mustang Intermediate Investments S.à r.l., an entity owned by Madison Dearborn Partners, each $1,677 to enable them to purchase 5.1% of the outstanding capital stock of CD Cartondruck GmbH. The notes bear interest at a rate of 2.0%, compounded annually, and had a maturity date of February 14, 2015. The loan had automatic renewal periods unless terminated through a written notice no less than four weeks prior to maturity. The $3,354 note receivable was recorded in other assets on the consolidated balance sheet as of June 30, 2015. On October 8, 2015, the Company purchased CD Cartondruck GmbH for the value of the note plus interest. The transaction was accounted for as an acquisition of noncontrolling interest and included in the statement of stockholders’ equity. As of October 8, 2015, the Company owns 100% of the outstanding capital stock of CD Cartondruck GmBH.
97
Note 18—Stock Based Compensation
The Company recognized compensation expense related to awards under its stock based compensation plans as follows:
|
|
|
Successor |
|
|
Predecessor |
|
||||||||
|
|
|
Fiscal Year Ended |
|
Period from August |
|
|
Period from July 1 |
|
||||||
|
|
|
June 30, |
|
15, 2013 through |
|
|
2013 through |
|
||||||
|
|
|
2016 |
|
2015 |
|
June 30, 2014 |
|
|
August 14, 2013 |
|
||||
|
Performance Based Units |
|
$ |
9,460 |
|
$ |
— |
|
$ |
— |
|
|
$ |
— |
|
|
2014 Equity Incentive Plan |
|
|
16,352 |
|
|
5,159 |
|
|
1,063 |
|
|
|
53 |
|
|
Payroll taxes related to stock based compensation |
|
|
723 |
|
|
— |
|
|
— |
|
|
|
— |
|
|
|
|
|
26,535 |
|
|
5,159 |
|
|
1,063 |
|
|
|
53 |
|
|
2015 Incentive Award Plan |
|
|
234 |
|
|
— |
|
|
— |
|
|
|
— |
|
|
Other |
|
|
— |
|
|
563 |
|
|
471 |
|
|
|
72 |
|
|
Total |
|
$ |
26,769 |
|
$ |
5,722 |
|
$ |
1,534 |
|
|
$ |
125 |
|
Performance Based Units
In connection with Carlyle’s acquisition of Chesapeake, certain members of Chesapeake’s management were allowed to co-invest with Carlyle in an entity controlled by Carlyle that holds an investment in the Company. At the time of the grant, those members of management that invested alongside Carlyle received a specified number of common shares, which were subject to a performance-based ratchet (the “Ratchet”). Pursuant to the Ratchet, members of management’s ownership percentage could increase based on Chesapeake completing an “Exit” that resulted in a specified return on invested capital (“MOIC”) and internal rate of return (“IRR”) for certain investors. An Exit is defined as the completion of a liquidating event, which includes the completion of an initial public offering (“IPO”). Since a liquidity event, including an IPO, is generally not probable until it occurs, no compensation cost had been recognized in the financial statements through the initial public offering date. On October 22, 2015, the Company completed its IPO (see Note 1) and accordingly the performance-based units vested and the Company recognized stock based compensation expense of approximately $9,460 at this time. The expense at the time of the IPO was calculated using the IPO stock price of $13 per share on a per share equivalent basis of Carlyle shares, less a lack of marketability discount rate due to the shares not being freely tradeable by the members of management.
2014 Equity Incentive Plan (Mustang Investment Holdings L.P.)
The 2014 Equity Incentive Plan (the “2014 Plan”) provides for profits interests and restricted capital interests in Mustang Investment Holdings L.P. (“Holdings”) to be granted to directors, officers and employees of the Company. During fiscal 2016 and 2015, Holdings did not issue any time-vesting profits interests or performance-vesting profits interests. Time-vesting profits interests vested twenty percent per year on each of the first five anniversaries of August 15, 2013, as per the applicable award agreement. All performance-vesting profits interests would vest based on Holdings’ principal investors obtaining various thresholds of an internal rate of return as defined in the 2014 Plan, which represents a performance condition.
Since the profits interests issued under the 2014 Plan are for interests in Holdings, which is outside of the consolidated group, the value of the profits interests was marked to market at each of the Company’s reporting periods. On October 22, 2015, the Company completed its IPO and in connection with the IPO the performance-vesting units vested and the Company accelerated the vesting of the time-vesting profits interest.
98
The Company recognized compensation expense related to awards under the 2014 Plan as follows:
|
|
|
Successor |
|
|
Predecessor |
|
||||||||
|
|
|
Fiscal Year Ended |
|
Period from August |
|
|
Period from July 1 |
|
||||||
|
|
|
June 30, |
|
15, 2013 through |
|
|
2013 through |
|
||||||
|
|
|
2016 |
|
2015 |
|
June 30, 2014 |
|
|
August 14, 2013 |
|
||||
|
Time vesting profit interests |
|
$ |
5,569 |
|
$ |
3,210 |
|
$ |
618 |
|
|
$ |
53 |
|
|
Time vesting restricted capital interests |
|
|
3,410 |
|
|
1,949 |
|
|
445 |
|
|
|
— |
|
|
Performance-vesting profit interests |
|
|
7,373 |
|
|
— |
|
|
— |
|
|
|
— |
|
|
Total |
|
$ |
16,352 |
|
$ |
5,159 |
|
$ |
1,063 |
|
|
$ |
53 |
|
2014 Plan—Profits Interests Valuation
As an input to the Black-Scholes model, and for valuation of the profits interest and restricted capital interest awards, the Company estimated the fair value of Holdings’ equity quarterly. The Company relied on the results of a discounted cash flow analysis but also considered other widely recognized valuation models. The discounted cash flow analysis is dependent on a number of significant management assumptions regarding the expected future financial results of the Company and Holdings, as well as upon estimates of an appropriate cost of capital. A sensitivity analysis was performed in order to establish a narrow range of estimated fair values for the equity of Holdings. The market approach consists of identifying a set of guideline public companies. Multiples of historical and projected earnings before interest, taxes, depreciation and amortization (“EBITDA”) determined based on the guideline companies are applied to Holdings’ EBITDA in order to establish a range of estimated fair value for the equity of Holdings. After considering all of these estimates of fair value, the Company then determines a single estimated fair value of the equity to be used in accounting for equity-based compensation.
The Company calculated the estimated fair value of each award as of the reporting date for each grant prior to the IPO using the Black–Scholes option valuation model. There was no active market for Holdings’ equity. Therefore, as a substitute for Holdings’ volatility, the Company elected to use the historical volatility of various publicly traded companies in the printing industry. The expected term of profits interests granted is derived from the output of the option valuation model and represents the period of time that profits interests granted are expected to be outstanding. The risk-free rate for periods within the life of the profits interests is based on the U.S. Treasury yield curve in effect at the time of grant. During the fiscal year ended June 30, 2015, the Company utilized 4.5 years as the expected term, 42% for its expected volatility, and 1.48% for the risk free rate of interest. The Company does not expect to pay any dividends and the weighted average fair value at the end of fiscal 2015 of all profits interest was $13.37 per profit interest. The expense at the time of the IPO was calculated using the IPO stock price of $13 per share on a per share equivalent basis of Holdings shares less a lack of marketability discount rate due to the shares not being freely tradeable.
At the time of the Company’s IPO all the profit interests in Holdings were converted on an equivalent share basis. As of June 30, 2016, there are no profit interests outstanding, nor is there any unearned compensation related to unvested profit interests.
2014 Plan—Restricted Capital Interests Valuation
For Restricted Capital Interests issued under the 2014 Plan the Company calculated the estimated fair value of each award using the Black-Scholes option valuation model that uses the assumptions described below and considers a lack of marketability discount. There was no active market for Holdings’ equity. Therefore, as a substitute for Holdings’ volatility, the Company elected to use the historical volatility of various publicly traded companies in the printing industry. The Company uses historical data to estimate employee terminations within the valuation model. The expected term of restricted capital interests granted is derived from the output of the option valuation model and represents the period of time that restricted capital interests granted are expected to be outstanding. The risk-free rate for periods within the life of the restricted capital interests is based on the U.S. Treasury yield curve in effect at the time of grant. During the fiscal year ended June 30, 2015, the Company utilized 4.5 years as the expected term, 42% for its expected volatility, and 1.48% for the risk free rate of interest. The Company does not expect to pay any dividends and the weighted average fair value at the end of fiscal 2015 of all restricted capital interests was $13.43 per capital interest. The expense at the time of the IPO was calculated using the IPO stock price of $13 per share on a per share equivalent basis of Holdings shares less a lack of marketability discount rate due to the shares not being freely tradeable.
99
At the time of the Company’s IPO all the restricted capital interests in Holdings were converted on an equivalent share basis. As of June 30, 2016, there are no restricted capital interests outstanding, nor is there any unearned compensation related to unvested restricted capital interests at June 30, 2016.
2015 Incentive Award Plan
The Multi Packaging Solutions International Limited 2015 Incentive Award Plan (the “2015 Plan”) was adopted in October 2015 and provides for the grant of stock options, including incentive stock options and nonqualified stock options, restricted stock, dividend equivalents, restricted stock units, stock appreciation rights, and other stock or cash-based awards. All awards under the 2015 Plan are granted pursuant to award agreements, which, together with the 2015 Plan, detail the terms and conditions of the awards, including any applicable vesting, payment terms and post-termination exercise limitations. Awards may be subject to performance criteria, which are determined by the Company’s Board of Directors (or a committee thereof), and that must be achieved in order for the awards to vest and/or be settled. An aggregate of 9,000 common shares was initially made available for issuance under the 2015 Plan.
The Company compensates its independent board members for their services through an annual cash payment of $75 and an annual stock grant valued at $75, which is fully vested at the date of grant. Additional cash compensation is given for service as chair of a committee of the Board of Directors.
A summary of the restricted stock and restricted stock unit activity for the fiscal year ended June 30, 2016 is as follows:
|
|
|
Number Restricted Stock and Restricted Stock Units |
|
Weighted Average Grant Date Fair Value (per share) |
|
||
|
Non-vested - beginning of year |
|
|
— |
|
$ |
— |
|
|
Granted |
|
|
185,368 |
|
$ |
13.65 |
|
|
Vested |
|
|
(13,514) |
|
$ |
16.65 |
|
|
Non-vested - end of year |
|
|
171,854 |
|
$ |
13.41 |
|
As of June 30, 2016, $2,292 of unrecognized stock-based compensation expense related to non-vested restricted stock awards under the 2015 Incentive Award Plan is expected to be recognized over a weighted-average period of 3.0 years.
Note 19—Segments
The Company operates its business along three operating segments, which are grouped on the basis of geography: North America, Europe and Asia. The Company believes this method of segment reporting reflects both the way its business segments are managed and the way the performance of each segment is evaluated. The three segments consist of similar operating activities as each segment produces similar products.
The Company, including its Chief Operating Decision Maker, evaluates performance based on several factors, of which the primary financial measure is Adjusted EBITDA. Adjusted EBITDA is defined as segment net income (loss) before income taxes, interest, depreciation, amortization, restructuring, transaction, stock-based compensation and certain other costs that do not related to the segment’s ongoing operations. A reconciliation of Adjusted EBITDA to consolidated net income (loss) is provided in the tables below. Inter-segment sales and transfers, which were not material, are accounted for as if the sales or transfers were to third parties, at current market prices.
100
|
|
|
Successor |
|
|
Predecessor |
||||||||
|
|
|
Fiscal Year Ended |
|
Period from August |
|
|
Period from July 1 |
||||||
|
|
|
June 30, |
|
15, 2013 through |
|
|
2013 through |
||||||
|
|
|
2016 |
|
2015 |
|
June 30, 2014 |
|
|
August 14, 2013 |
||||
|
Net Sales |
|
|
|
|
|
|
|
|
|
|
|
|
|
|
North America |
|
$ |
784,453 |
|
$ |
737,888 |
|
$ |
452,031 |
|
|
$ |
58,728 |
|
Europe |
|
|
785,997 |
|
|
820,391 |
|
|
354,396 |
|
|
|
15,353 |
|
Asia |
|
|
90,978 |
|
|
59,361 |
|
|
7,786 |
|
|
|
— |
|
Total Net Sales |
|
$ |
1,661,428 |
|
$ |
1,617,640 |
|
$ |
814,213 |
|
|
$ |
74,081 |
|
|
|
|
|
|
|
|
|
|
|
|
|
|
|
|
Depreciation and Amortization |
|
|
|
|
|
|
|
|
|
|
|
|
|
|
North America |
|
$ |
60,281 |
|
$ |
59,626 |
|
$ |
44,600 |
|
|
$ |
2,915 |
|
Europe |
|
|
64,703 |
|
|
68,663 |
|
|
28,124 |
|
|
|
857 |
|
Asia |
|
|
4,016 |
|
|
3,414 |
|
|
482 |
|
|
|
— |
|
Total Depreciation and Amortization |
|
$ |
129,000 |
|
$ |
131,703 |
|
$ |
73,206 |
|
|
$ |
3,772 |
|
|
|
|
|
|
|
|
|
|
|
|
|
|
|
|
Operating Income (Loss) |
|
|
|
|
|
|
|
|
|
|
|
|
|
|
North America |
|
$ |
28,503 |
|
$ |
18,317 |
|
$ |
(37,181) |
|
|
$ |
(24,524) |
|
Europe |
|
|
44,085 |
|
|
46,442 |
|
|
8,711 |
|
|
|
2,188 |
|
Asia |
|
|
11,507 |
|
|
6,218 |
|
|
186 |
|
|
|
— |
|
Total Operating Income (Loss) |
|
$ |
84,095 |
|
$ |
70,977 |
|
$ |
(28,284) |
|
|
$ |
(22,336) |
|
|
|
|
|
|
|
|
|
|
|
|
|
|
|
|
Adjusted EBITDA |
|
|
|
|
|
|
|
|
|
|
|
|
|
|
North America |
|
$ |
110,204 |
|
$ |
97,001 |
|
$ |
71,290 |
|
|
$ |
7,390 |
|
Europe |
|
|
128,133 |
|
|
126,350 |
|
|
46,816 |
|
|
|
3,081 |
|
Asia |
|
|
15,966 |
|
|
7,611 |
|
|
684 |
|
|
|
— |
|
Total Adjusted EBITDA |
|
$ |
254,303 |
|
$ |
230,962 |
|
$ |
118,790 |
|
|
$ |
10,471 |
|
|
|
Successor |
|
||||
|
|
|
For the Fiscal Year Ended June 30, |
|
||||
|
|
|
2016 |
|
2015 |
|
||
|
Capital Expenditures |
|
|
|
|
|
|
|
|
North America |
|
$ |
20,881 |
|
$ |
19,407 |
|
|
Europe |
|
|
32,158 |
|
|
38,189 |
|
|
Asia |
|
|
5,915 |
|
|
1,939 |
|
|
Total Capital Expenditures |
|
$ |
58,954 |
|
$ |
59,535 |
|
|
|
|
Successor |
|
||||
|
|
|
As of June 30, |
|
As of June 30, |
|
||
|
|
|
2016 |
|
2015 |
|
||
|
Total Assets |
|
|
|
|
|
|
|
|
North America |
|
$ |
754,418 |
|
$ |
904,719 |
|
|
Europe |
|
|
883,361 |
|
|
866,214 |
|
|
Asia |
|
|
69,811 |
|
|
100,310 |
|
|
Total Assets |
|
$ |
1,707,590 |
|
$ |
1,871,243 |
|
The Company’s product offerings consist of print-based specialty packaging products across the consumer, healthcare and multi-media end markets. The Company produces similar products including labels, cartons, inserts and rigid packaging (the “Specific Products”) in all of the geographies it serves, and in all of the end markets it serves. These Specific Products represent one product line. The nature of a specific carton, label, insert or rigid package is similar from end market to end market and geography to geography. Oftentimes, the Specific Products sold to the customer are bundled, including both
101
label and carton, or label, carton and insert or any combination thereof. The following are summaries of gross sales estimated by product category and of net sales estimated by end markets for the respective periods:
|
|
|
Successor |
|
|
Predecessor |
|
||||||||
|
|
|
Fiscal Year Ended |
|
Period from August |
|
|
Period from July 1 |
|
||||||
|
|
|
June 30, |
|
15, 2013 through |
|
|
2013 through |
|
||||||
|
|
|
2016 |
|
2015 |
|
June 30, 2014 |
|
|
August 14, 2013 |
|
||||
|
Premium Folding Cartons |
|
$ |
1,091,063 |
|
$ |
1,051,028 |
|
$ |
513,253 |
|
|
$ |
52,828 |
|
|
Inserts |
|
|
238,969 |
|
|
268,000 |
|
|
138,691 |
|
|
|
9,246 |
|
|
Labels |
|
|
138,284 |
|
|
126,240 |
|
|
79,872 |
|
|
|
8,224 |
|
|
Rigid Packaging |
|
|
111,972 |
|
|
70,463 |
|
|
10,786 |
|
|
|
— |
|
|
Other Consumer Products |
|
|
204,695 |
|
|
216,372 |
|
|
127,270 |
|
|
|
10,088 |
|
|
Total |
|
|
1,784,983 |
|
|
1,732,103 |
|
|
869,872 |
|
|
|
80,386 |
|
|
Sales Reserves and Eliminations |
|
|
(123,555) |
|
|
(114,463) |
|
|
(55,659) |
|
|
|
(6,305) |
|
|
Total Net Sales |
|
$ |
1,661,428 |
|
$ |
1,617,640 |
|
$ |
814,213 |
|
|
$ |
74,081 |
|
|
|
|
Successor |
|
|
Predecessor |
|
||||||||
|
|
|
Fiscal Year Ended |
|
Period from August |
|
|
Period from July 1 |
|
||||||
|
|
|
June 30, |
|
15, 2013 through |
|
|
2013 through |
|
||||||
|
|
|
2016 |
|
2015 |
|
June 30, 2014 |
|
|
August 14, 2013 |
|
||||
|
Consumer |
|
$ |
840,613 |
|
$ |
815,882 |
|
$ |
367,895 |
|
|
$ |
26,094 |
|
|
Healthcare |
|
|
640,348 |
|
|
643,982 |
|
|
330,018 |
|
|
|
20,929 |
|
|
Multi-Media |
|
|
180,467 |
|
|
157,776 |
|
|
116,300 |
|
|
|
27,058 |
|
|
Total Net Sales |
|
$ |
1,661,428 |
|
$ |
1,617,640 |
|
$ |
814,213 |
|
|
$ |
74,081 |
|
102
The following is a reconciliation of EBITDA and Adjusted EBITDA to consolidated net income.
|
|
|
Successor |
|
|
Predecessor |
|
||||||||
|
|
|
Fiscal Year Ended |
|
Period from August |
|
|
Period from July 1 |
|
||||||
|
|
|
June 30, |
|
15, 2013 through |
|
|
2013 through |
|
||||||
|
|
|
2016 |
|
2015 |
|
June 30, 2014 |
|
|
August 14, 2013 |
|
||||
|
Consolidated net income |
|
$ |
1,327 |
|
$ |
7,026 |
|
$ |
(51,648) |
|
|
$ |
(23,685) |
|
|
Depreciation and amortization |
|
|
129,000 |
|
|
131,703 |
|
|
73,206 |
|
|
|
3,772 |
|
|
Interest expense |
|
|
64,543 |
|
|
75,437 |
|
|
43,215 |
|
|
|
3,991 |
|
|
Income tax expense (benefit) |
|
|
7,855 |
|
|
(1,880) |
|
|
(19,481) |
|
|
|
(15,621) |
|
|
EBITDA |
|
|
202,725 |
|
|
212,286 |
|
|
45,292 |
|
|
|
(31,543) |
|
|
|
|
|
|
|
|
|
|
|
|
|
|
|
|
|
|
Transaction costs |
|
|
3,838 |
|
|
13,630 |
|
|
38,844 |
|
|
|
28,370 |
|
|
Stock based and deferred compensation |
|
|
26,769 |
|
|
5,722 |
|
|
1,534 |
|
|
|
125 |
|
|
Debt extinguishment charges |
|
|
3,967 |
|
|
1,019 |
|
|
— |
|
|
|
14,042 |
|
|
Purchase accounting adjustments |
|
|
966 |
|
|
3,094 |
|
|
10,836 |
|
|
|
— |
|
|
Restructuring related costs |
|
|
10,684 |
|
|
6,419 |
|
|
10,037 |
|
|
|
3 |
|
|
Loss on sale of fixed assets |
|
|
1,410 |
|
|
584 |
|
|
2,278 |
|
|
|
(96) |
|
|
Foreign currency (gains) losses |
|
|
5,182 |
|
|
(12,171) |
|
|
(777) |
|
|
|
(364) |
|
|
Multiemployer plan exits |
|
|
— |
|
|
— |
|
|
9,250 |
|
|
|
(676) |
|
|
Other adjustments to EBITDA |
|
|
(1,238) |
|
|
379 |
|
|
1,496 |
|
|
|
610 |
|
|
|
|
|
|
|
|
|
|
|
|
|
|
|
|
|
|
Adjusted EBITDA |
|
$ |
254,303 |
|
$ |
230,962 |
|
$ |
118,790 |
|
|
$ |
10,471 |
|
103
Item 9.Changes in and Disagreements with Accountants and Financial Disclosure
None.
Item 9A.Controls and Procedures
Evaluation of Disclosure Controls and Procedures
We maintain “disclosure controls and procedures,” as defined in Rules 13a-15(e) and 15d-15(e) under the Securities Exchange Act of 1934, as amended (the “Exchange Act”), that are designed to ensure that information required to be disclosed by a company in the reports that it files or submits under the Exchange Act is recorded, processed, summarized and reported, within the time periods specified in the SEC’s rules and forms. Disclosure controls and procedures include, without limitation, controls and procedures designed to ensure that information required to be disclosed by a company in the reports that it files or submits under the Exchange Act is accumulated and communicated to the company’s management, including its principal executive and principal financial officers, as appropriate to allow timely decisions regarding required disclosure.
Our management, with the participation of our Chief Executive Officer and our Chief Financial Officer, evaluated the effectiveness of our disclosure controls and procedures as of June 30, 2016. Based on the evaluation of our disclosure controls and procedures as of June 30, 2016, our Chief Executive Officer and Chief Financial Officer concluded that, as of such date, our disclosure controls and procedures were effective at the reasonable assurance level.
Management’s Report on Internal Control Over Financial Reporting
This Annual Report does not include a report of management’s assessment regarding internal control over financial reporting or an attestation report of our independent registered public accounting firm due to a transition period established by the rules of the SEC for newly public companies.
Not applicable.
104
Item 10.Directors, Executive Officers and Corporate Governance
The information required by this item is incorporated by reference to our Proxy Statement for the 2016 Annual Meeting of Stockholders of the Company to be filed with the SEC within 120 days of the fiscal year ended June 30, 2016.
Item 11.Executive Compensation
The information required by this item is incorporated by reference to our Proxy Statement for the 2016 Annual Meeting of Stockholders of the Company to be filed with the SEC within 120 days of the fiscal year ended June 30, 2016.
Item 12.Security Ownership of Certain Beneficial Owners and Management and Related Stockholder Matters
The information required by this item is incorporated by reference to our Proxy Statement for the 2016 Annual Meeting of Stockholders of the Company to be filed with the SEC within 120 days of the fiscal year ended June 30, 2016.
Item 13.Certain Relationships and Related Transactions, and Director Independence
The information required by this item is incorporated by reference to our Proxy Statement for the 2016 Annual Meeting of Stockholders of the Company to be filed with the SEC within 120 days of the fiscal year ended June 30, 2016.
Item 14.Principal Accountant Fees and Services
The information required by this item is incorporated by reference to our Proxy Statement for the 2016 Annual Meeting of Stockholders of the Company to be filed with the SEC within 120 days of the fiscal year ended June 30, 2016.
105
Item 15.Exhibits and Financial Statement Schedules
(a)(1)Financial Statements. The following consolidated financial statements of Multi Packaging Solutions International Limited are filed as part of this report under Part II, Item 8 – Financial Statements and Supplementary Data:
|
· |
Report of Independent Registered Public Accounting Firm |
|
· |
Consolidated Balance Sheets – June 30, 2016 and 2015 |
|
· |
Consolidated Statements of Operations and Comprehensive Income (Loss) – Fiscal Years ended June 30, 2016 and 2015, and the Period from August 15, 2013 through June 30, 2014 (Successor) and the Period from July 1, 2013 through August 14, 2013 (Predecessor) |
|
· |
Consolidated Statements of Shareholders’ Equity – Fiscal Years ended June 30, 2016 and 2015, and the Period from August 15, 2013 through June 30, 2014 (Successor) and the Period from July 1, 2013 through August 14, 2013 (Predecessor) |
|
· |
Consolidated Statements of Cash Flows – Fiscal Years ended June 30, 2016 and 2015, and the Period from August 15, 2013 through June 30, 2014 (Successor) and the Period from July 1, 2013 through August 14, 2013 (Predecessor) |
|
· |
Notes to Consolidated Financial Statements |
106
(a)(2)Financial Statement Schedules. The following financial statement schedule should be read in conjunction with the consolidated financial statements included in Part II, Item 8, of this Annual Report on Form 10-K. All other financial schedules are not required under the related instructions, or are not applicable and therefore have been omitted.
Multi Packaging Solutions International Limited
Schedule II – Valuation and Qualifying Accounts
|
|
|
|
|
Additions |
|
|
|
|
|
|
|
||||
|
|
Balance at |
|
Charged to |
|
Charged to |
|
|
|
|
|
|||||
|
|
beginning |
|
costs and |
|
other accounts |
|
Deductions - |
|
Balance at |
|
|||||
|
|
of period |
|
expenses |
|
- describe (i) |
|
describe (ii) |
|
end of period |
|
|||||
|
Successor |
|
|
|
|
|
|
|
|
|
|
|
|
|
|
|
|
Fiscal Year Ended June 30, 2016: |
|
|
|
|
|
|
|
|
|
|
|
|
|
|
|
|
Allowance for |
$ |
2,932 |
|
$ |
681 |
|
$ |
(262) |
|
$ |
(860) |
|
$ |
2,491 |
|
|
Valuation allowance for |
$ |
10,050 |
|
$ |
1,239 |
|
$ |
(745) |
|
$ |
— |
|
$ |
10,544 |
|
|
|
|
|
|
|
|
|
|
|
|
|
|
|
|
|
|
|
Fiscal Year Ended June 30, 2015: |
|
|
|
|
|
|
|
|
|
|
|
|
|
|
|
|
Allowance for |
$ |
2,689 |
|
$ |
1,945 |
|
$ |
(213) |
|
$ |
(1,489) |
|
$ |
2,932 |
|
|
Valuation allowance for |
$ |
9,280 |
|
$ |
1,185 |
|
$ |
(1,429) |
|
$ |
1,014 |
|
$ |
10,050 |
|
|
|
|
|
|
|
|
|
|
|
|
|
|
|
|
|
|
|
Period from August 15, 2013 through June 30, 2014: |
|
|
|
|
|
|
|
|
|
|
|
|
|
|
|
|
Allowance for |
$ |
1,168 |
|
$ |
1,834 |
|
$ |
2 |
|
$ |
(315) |
|
$ |
2,689 |
|
|
Valuation allowance for |
$ |
— |
|
$ |
1,435 |
|
$ |
7,845 |
|
$ |
— |
|
$ |
9,280 |
|
|
|
|
|
|
|
|
|
|
|
|
|
|
|
|
|
|
|
Predecessor |
|
|
|
|
|
|
|
|
|
|
|
|
|
|
|
|
Period from July 1, 2013 through August 14, 2014: |
|
|
|
|
|
|
|
|
|
|
|
|
|
|
|
|
Allowance for |
$ |
1,054 |
|
$ |
106 |
|
$ |
8 |
|
$ |
— |
|
$ |
1,168 |
|
|
Valuation allowance for |
$ |
— |
|
$ |
— |
|
$ |
— |
|
$ |
— |
|
$ |
— |
|
|
(i) |
Includes foreign exchange rate changes |
|
(ii) |
Includes reductions for write-off of uncollectible receivables |
(a)(3)Exhibits. The exhibits that form a part of this Annual Report on Form 10-K are listed on the Exhibit Index immediately following the signature page hereto, which is incorporated herein by reference.
107
Pursuant to the requirements of Section 13 or 15(d) of the Securities Exchange Act of 1934, the registrant has duly caused this report to be signed on its behalf by the undersigned thereunto duly authorized.
|
|
MULTI PACKAGING SOLUTIONS INTERNATIONAL LIMITED |
||
|
Date: August 23, 2016 |
By: |
/s/ William H. Hogan |
|
|
|
|
William H. Hogan |
|
|
|
|
Executive Vice President and Chief Financial Officer |
|
|
|
|
|
|
108
Pursuant to the requirements of the Securities Exchange Act of 1934, this report has been signed below by the following persons on behalf of the registrant and in the capacities and on the dates indicated.
|
Signature |
|
Title |
Date |
|
|
|
|
|
|
/s/ Marc Shore |
|
Chairman of the Board and Chief Executive Officer |
August 23, 2016 |
|
Marc Shore |
|
(Principal Executive Officer) |
|
|
|
|
|
|
|
|
|
|
|
|
/s/ William H. Hogan |
|
Executive Vice President and Chief Financial Officer |
August 23, 2016 |
|
William H. Hogan |
|
(Principal Financial Officer) |
|
|
|
|
|
|
|
|
|
|
|
|
/s/ Ross Weiner |
|
Vice President – Finance and Chief Accounting Officer |
August 23, 2016 |
|
Ross Weiner |
|
(Principal Accounting Officer) |
|
|
|
|
|
|
|
|
|
|
|
|
/s/ Zeina Bain |
|
Director |
August 23, 2016 |
|
Zeina Bain |
|
|
|
|
|
|
|
|
|
|
|
|
|
|
/s/ George Bayly |
|
Director |
August 23, 2016 |
|
George Bayly |
|
|
|
|
|
|
|
|
|
|
|
|
|
|
/s/ Richard H. Copans |
|
Director |
August 23, 2016 |
|
Richard H. Copans |
|
|
|
|
|
|
|
|
|
|
|
|
|
|
/s/ Eric Kump |
|
Director |
August 23, 2016 |
|
Eric Kump |
|
|
|
|
|
|
|
|
|
|
|
|
|
|
/s/ Gary McGann |
|
Director |
August 23, 2016 |
|
Gary McGann |
|
|
|
|
|
|
|
|
|
|
|
|
|
|
/s/ Thomas S. Souleles |
|
Director |
August 23, 2016 |
|
Thomas S. Souleles |
|
|
|
|
|
|
|
|
|
|
|
|
|
|
/s/ Jason J. Tyler |
|
Director |
August 23, 2016 |
|
Jason J. Tyler |
|
|
|
|
|
|
|
|
|
|
|
|
|
109
|
Exhibit |
|
Description |
|
3.1 |
Amended Memorandum of Association of Multi Packaging Solutions International Limited (the “Company”) (incorporated by reference to Exhibit 3.1 of Amendment No. 4 to the Company’s Registration Statement on Form S-1 (File No. 333-205278), originally filed with the SEC on October 9, 2015) |
|
|
|
|
|
|
3.2 |
|
Amendment to the Memorandum of Association of the Company (incorporated by reference to Exhibit 3.1 to the Company’s Quarterly Report on Form 10-Q (File No. 001-37598), filed with the SEC on November 13, 2015) |
|
|
|
|
|
3.3 |
|
Amended and Restated Bye-laws of the Company (incorporated by reference to Exhibit 3.1 to the Company’s Quarterly Report on Form 10-Q (File No. 001-37598), filed with the SEC on November 13, 2015) |
|
|
|
|
|
4.1 |
|
Indenture governing the 8.500% Senior Notes due 2021, dated August 15, 2013 (the “Indenture”), among Multi Packaging Solutions, Inc. (successor by merger to Mustang Merger Corp.) as Issuer, and Wells Fargo Bank, National Association, as Trustee (incorporated by reference to Exhibit 4.1 of Amendment No. 1 to the Company’s Registration Statement on Form S-1 (File No. 333-205278), originally filed with the SEC on August 10, 2015) |
|
|
|
|
|
4.2 |
|
Form of 8.500% Senior Note due 2021 (included in Exhibit 4.1) (incorporated by reference to Exhibit 4.2 of Amendment No. 1 to the Company’s Registration Statement on Form S-1 (File No. 333-205278), originally filed with the SEC on August 10, 2015) |
|
|
|
|
|
4.3 |
|
Second Supplemental Indenture to the Indenture, dated as of December 12, 2013, by and among Multi Packaging Solutions, Inc. (successor by merger to Mustang Merger Corp.), the Guarantors party thereto and Wells Fargo Bank, National Association, as Trustee (incorporated by reference to Exhibit 4.3 of Amendment No. 4 to the Company’s Registration Statement on Form S-1 (File No. 333-205278), originally filed with the SEC on October 9, 2015) |
|
|
|
|
|
10.1 |
|
Second Amendment and Waiver to the Credit Agreement and First Amendment to the Security Agreement, dated as of December 24, 2013, by and among Chesapeake/MPS Merger Limited (f/k/a, Chesapeake Services Limited, f/k/a Chase BidCo Limited), Chesapeake US Holdings Inc. (f/k/a Chase US Holdco Inc.), Chesapeake Finance 2 Limited (f/k/a Chase MidCo 2 Limited), each Lender party thereto, Barclays Bank PLC as Administrative Agent, Collateral Agent, initial Dollar Tranche A Lender and initial Dollar Tranche B Lender, and the Lenders under the Dollar Revolving Credit Facility party thereto (incorporated by reference to Exhibit 10.1 of Amendment No. 1 to the Company’s Registration Statement on Form S-1 (File No. 333-205278), originally filed with the SEC on August 10, 2015) |
|
|
|
|
|
10.2 |
|
Second Amended and Restated Employment Agreement between Marc Shore, Multi Packaging Solutions, Inc. and Chesapeake Finance 2 Limited, dated February 14, 2014. (incorporated by reference to Exhibit 10.2 of Amendment No. 3 to the Company’s Registration Statement on Form S-1 (File No. 333-205278), originally filed with the SEC on September 30, 2015) |
|
|
|
|
|
10.3 |
|
Letter Agreement between Rick Smith and Multi Packaging Solutions UK Limited, dated November 25, 2014. (incorporated by reference to Exhibit 10.5 of Amendment No. 3 to the Company’s Registration Statement on Form S-1 (File No. 333-205278), originally filed with the SEC on September 30, 2015) |
|
|
|
|
|
10.4 |
|
2014/2015 Manager Incentive Plan (incorporated by reference to Exhibit 10.6 of Amendment No. 4 to the Company’s Registration Statement on Form S-1 (File No. 333-205278), originally filed with the SEC on October 9, 2015) |
|
|
|
|
110
|
Exhibit
|
|
Description |
|
10.5 |
|
2015 Incentive Award Plan (incorporated by reference to Exhibit 10.7 of Amendment No. 4 to the Company’s Registration Statement on Form S-1 (File No. 333-205278), originally filed with the SEC on October 9, 2015) |
|
|
|
|
|
10.6 |
|
Separation Agreement between Mike Cheetham, Multi Packaging Solutions UK Limited, Chesapeake Holdings Ltd. and CEP III Chase S.à r.l, dated October 8, 2014. (incorporated by reference to Exhibit 10.8 of Amendment No. 3 to the Company’s Registration Statement on Form S-1 (File No. 333-205278), originally filed with the SEC on September 30, 2015) |
|
|
|
|
|
10.7 |
|
Written Statement of Terms and Conditions of Employment between Rick Smith and Chesapeake, effective February 1, 2010 (incorporated by reference to Exhibit 10.7 of Amendment No. 4 to the Company’s Registration Statement on Form S-1 (File No. 333-205278), originally filed with the SEC on October 9, 2015) |
|
|
|
|
|
10.8 |
|
Form of Stock Option Agreement under the 2015 Incentive Award Plan (incorporated by reference to Exhibit 10.7 of Amendment No. 4 to the Company’s Registration Statement on Form S-1 (File No. 333-205278), originally filed with the SEC on October 9, 2015) |
|
|
|
|
|
10.9 |
|
Form of Restricted Stock Agreement under the 2015 Incentive Award Plan (incorporated by reference to Exhibit 10.7 of Amendment No. 4 to the Company’s Registration Statement on Form S-1 (File No. 333-205278), originally filed with the SEC on October 9, 2015) |
|
|
|
|
|
10.10 |
|
Form of Restricted Stock Unit Agreement under the 2015 Incentive Award Plan (incorporated by reference to Exhibit 10.7 of Amendment No. 4 to the Company’s Registration Statement on Form S-1 (File No. 333-205278), originally filed with the SEC on October 9, 2015) |
|
|
|
|
|
10.11 |
|
Form of Indemnification Agreement (incorporated by reference to Exhibit 10.7 of Amendment No. 4 to the Company’s Registration Statement on Form S-1 (File No. 333-205278), originally filed with the SEC on October 9, 2015) |
|
|
|
|
|
10.12 |
|
Shareholders’ Agreement, dated as of October 21, 2015, by and among Mustang Investment Holdings L.P., CEP III Chase S.à r.l. and the Company (incorporated by reference to Exhibit 4.1 to the Company’s Quarterly Report on Form 10-Q (File No. 001-37598), filed with the SEC on November 13, 2015) |
|
|
|
|
|
10.13 |
|
Offer Letter between Ross Weiner and the Company, executed January 7, 2016 (incorporated by reference to Exhibit 10.1 to the Company’s Current Report on Form 8-K (File No. 001-37598), filed with the SEC on January 25, 2016) |
|
|
|
|
|
10.14 |
|
Summary of Director Compensation Program for Non-Employee Directors (incorporated by reference to Exhibit 10.14 of the Company’s Registration Statement on Form S-1 (File No. 333-211402), filed with the SEC on May 16, 2016) |
|
|
|
|
|
21.1* |
|
Subsidiaries of Company |
|
|
|
|
|
23.1* |
|
Consent of Independent Registered Public Accounting Firm |
|
|
|
|
|
31.1* |
|
Certification of Chief Executive Officer pursuant to Section 302 of the Sarbanes-Oxley Act of 2002 |
|
31.2* |
|
Certification of Chief Financial Officer pursuant to Section 302 of the Sarbanes-Oxley Act of 2002 |
|
32* |
|
Certification of Chief Executive Officer and Chief Financial Officer pursuant to Section 906 of the Sarbanes-Oxley Act of 2002 |
|
101.INS* |
|
XBRL Instance Document |
111
|
Exhibit
|
|
Description |
|
101.SCH* |
|
XBRL Taxonomy Extension Schema |
|
101.CAL* |
|
XBRL Taxonomy Extension Calculation Linkbase Document |
|
101.DEF* |
|
XBRL Taxonomy Extension Definition Linkbase Document |
|
101.LAB* |
|
XBRL Taxonomy Extension Label Linkbase Document |
|
101.PRE* |
|
XBRL Taxonomy Extension Presentation Linkbase Document |
* Filed herewith
112