Attached files
| file | filename |
|---|---|
| 8-K - SECOND QUARTER 2016 OVERVIEW - GUGGENHEIM CREDIT INCOME FUND 2016 T | ccif2016tform8-k2016q2.htm |

Exhibit 99.1
CAREY CREDIT INCOME FUND 2016 T
SECOND QUARTER 2016 OVERVIEW
Details about Carey Credit Income Fund's ("CCIF") and Carey Credit Income Fund 2016 T's ("CCIF 2016 T" or the "Company") second quarter 2016 portfolio and operating results are contained in this overview. This overview should be read in conjunction with the CCIF 2016 T Quarterly Report on Form 10-Q, as filed with the U.S. Securities and Exchange Commission (the "SEC") on August 15, 2016.
CCIF 2016 T Second Quarter 2016 Highlights
• | During the second quarter ended June 30, 2016, CCIF 2016 T paid fully covered distributions of $0.16 per share. |
• | For the period from December 31, 2015 to June 30, 2016, CCIF 2016 T's total investment return was 6.27%.1 |
• | For the period from December 31, 2015 to June 30, 2016, CCIF 2016 T raised gross proceeds from the sale of common shares of $45.3 million. |
• | CCIF 2016 T's net asset value per share was $8.89 as of June 30, 2016, compared to $8.68 as of December 31, 2015. |
• | CCIF 2016 T's net asset value per share has since increased to $9.10 as of August 15, 2016. |
• | CCIF's portfolio investments at fair value totaled $144.2 million as of June 30, 2016, of which 96.9% was in senior secured investments. The portfolio consisted of 63 debt investments and one attached equity investment in 52 portfolio companies. |
• | For the six months ended June 30, 2016, CCIF invested $88.0 million. |
• | CCIF's gross portfolio yield as of June 30, 2016 was 7.3%.2 |
• | On June 28, 2016, the SEC issued an order granting co-investment exemptive relief to CCIF (the "Exemptive Order"), permitting CCIF to invest alongside Guggenheim’s institutional clients and private funds in certain directly negotiated investments. |
________________________
(1) | Total investment return is a measure of total return for shareholders, assuming the purchase of the Company’s common share at the beginning of the period and the reinvestment of all distributions declared during the period. More specifically, total investment return is based on (i) the purchase of one common share at the net offering price on the first day of the period, (ii) the sale at the net asset value per common share on the last day of the period, of (A) one common share plus (B) any fractional common shares issued in connection with the reinvestment of distributions, and (iii) distributions payable relating to one common share, if any, on the last day of the period. The total investment return calculation assumes that (i) cash distributions are reinvested in accordance with the Company’s distribution reinvestment plan and (ii) the fractional common shares issued pursuant to the distribution reinvestment plan are issued at the then net offering price per common share on each distribution payment date. Since there is no public market for the Company’s common shares, then the terminal sales price per common share is assumed to be equal to net asset value per common share on the last day of the period presented. Total investment return does not reflect the impact of the sales load, if any, incurred when subscribing to the purchase of the Company’s common shares. Total investment return is not annualized. The Company’s performance changes over time and currently may be different than that shown above. Past performance is no guarantee of future results. |
(2) | Weighted average effective yield ("gross portfolio yield") by investment type is calculated as the effective yield of each investment and weighted by its amortized cost as compared to the aggregate amortized cost of all investments of that investment type. Effective yield is the return earned on an investment net of any discount, premium, or issuance costs. Non-income producing assets are excluded. The gross portfolio yield is higher than what investors in the Company will realize because it does not include the operating expenses of the Company. |
- 1 -
Exhibit 99.1
Business Environment
Maintaining their first-quarter momentum, high-yield bonds and leveraged loans kicked off the second quarter with strong performance. In April, high-yield bonds turned in their second best monthly return since October 2011, and leveraged loans, their strongest since March 2012. The rally, which began in February 2016, was interrupted in June by the United Kingdom’s ("U.K.") vote to leave the European Union. Despite the sell-off following the U.K. vote, high-yield bonds and leveraged loans still turned in quarterly total returns of 5.9 percent and 2.9 percent, respectively, bringing year-to-date returns to 9.3 percent and 4.2 percent, respectively.
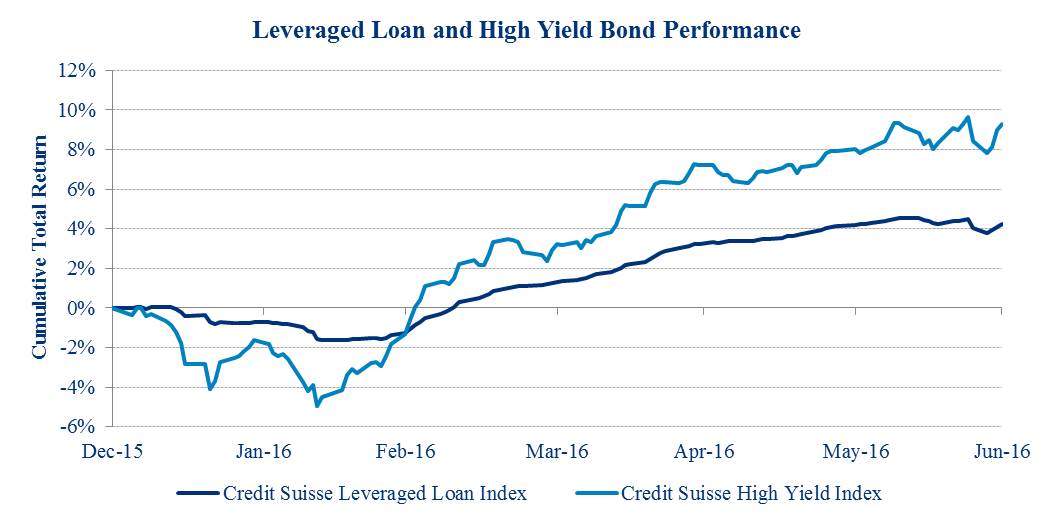
An important driver of positive performance for the quarter was the rebound in commodity markets. Together, the energy and metals sectors in the Credit Suisse High-Yield Index delivered a total return of 12.6 percent in the second quarter, compared to a return of 2.7 percent for the index excluding commodities. Commodity-related loans in the Credit Suisse Leveraged Loan Index returned 20 percent in the second quarter, but because the loan markets have only a 5 percent exposure to energy and metals, their combined contribution to total index return is much smaller. Non-commodity sectors in the leveraged loan market produced a total return of 2.2 percent over the quarter.
Recent default experience, characterized by lower-than-average recovery rates in leveraged credit, may serve as a preview of the next default cycle. We expect that high-yield bond recoveries should improve, but loan recoveries will remain depressed in light of weaker covenants and poor debt subordination. This serves to further emphasize the importance of loan underwriting and secured debt positions in today's credit market environment. Despite the lingering technical headwinds in the markets, we believe that, fundamentally, the credit markets are performing well and our outlook for leveraged credit remains constructive.
We believe that this credit environment provides experienced credit managers, such as CCIF's Advisors - Guggenheim Partners, LLC ("Guggenheim") and W. P. Carey ("WPC"), the opportunity to invest in new assets with attractive yields while remaining in senior positions of companies' capital structures. Specifically, we are seeing buying opportunities in sectors that are not commodity-sensitive where there has been a technical sell-off but in which we believe that the fundamentals remain strong and credit risk remains low. Given that CCIF commenced its capital raising efforts in the midst of this evolving credit cycle, we believe CCIF has a significant competitive advantage compared to investors who have large legacy portfolios.
- 2 -
Exhibit 99.1
Investment Activity, Investment Performance, and Portfolio Update
CCIF commenced investment operations on April 2, 2015 and the second quarter of 2016 marked the one year anniversary of investment activity. Within the three and six month periods ended June 30, 2016, investment activity was primarily concentrated in sourcing debt investments through primary issuance channels (72.4% and 69.8%, respectively), and the remainder was through secondary market channels (i.e., syndicated investments). On June 28, 2016 CCIF received the SEC Exemptive Order, granting us exemptive relief and expanding our ability to co-invest with specific Guggenheim affiliates in privately negotiated transactions, subject to the conditions of the Exemptive Order.
Portfolio highlights for the three months ended June 30, 2016 are set forth below:
Portfolio Highlights ($ in thousands) | For the Three Months Ended | ||
June 30, 2016 | |||
Gross Commitments | $ | 71,302 | |
Investments Sold or Repaid | $ | (15,768 | ) |
Total Fair Value of Investments | $ | 144,155 | |
Gross Portfolio Yield | 7.3 | % | |
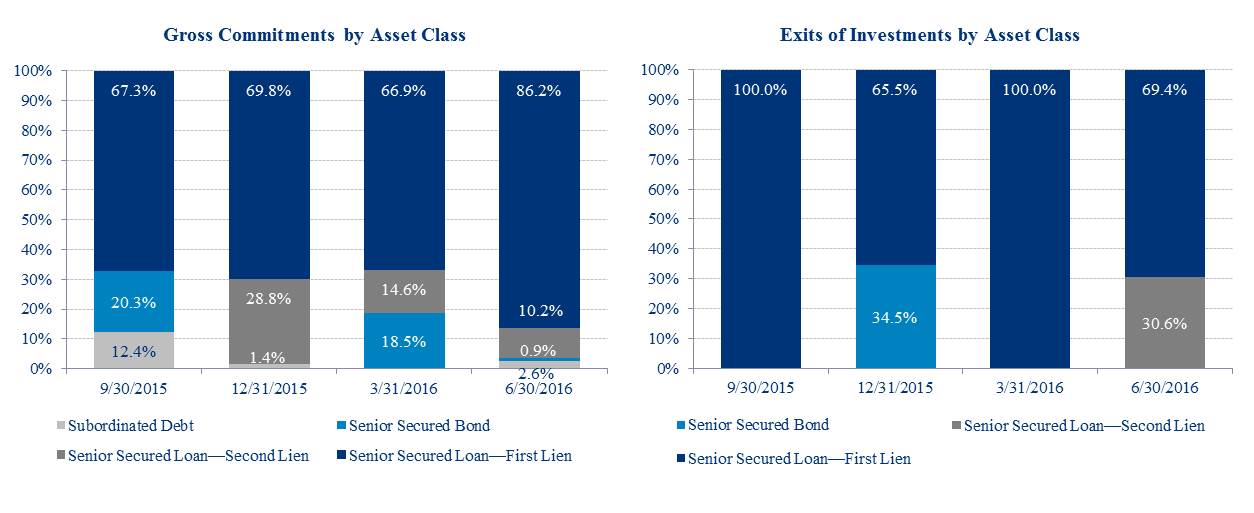
As of June 30, 2016, the portfolio consisted of $144.2 million of total investments at fair value and, consistent with prior quarters, our debt portfolio remains predominately invested in senior secured debt investments which represented 96.9% of the portfolio at fair value. We believe senior secured debt investments provide for downside protection which is particularly important given today's credit environment. Set forth below is the composition of the portfolio by asset class for each quarter end based on fair value:

- 3 -
Exhibit 99.1
As of June 30, 2016, there were 52 portfolio companies in which CCIF held 63 debt investments and one attached equity investment. The weighted average portfolio company age, based on fair value, was 42 years as of June 30, 2016. Furthermore, and aligned with our strategy of mitigating industry specific risk, the companies comprising the CCIF portfolio were diversified across 18 industries. Set forth below are the industry concentrations in CCIF's portfolio as of June 30, 2016 by fair value:

________________________
(*) Portfolio companies in this category represent insurance brokers and are not classified as insurance companies.
(**) Industry classifications based upon Moody's standard industry classifications.
During the second quarter of 2016, we made $71.3 million in new commitments, including commitments to 17 new portfolio companies and nine existing portfolio companies. Over the quarter, we experienced an increase in volume of investment opportunities, predominately through the primary issuance channels, as issuers that were unable to access the syndicated markets during the first quarter looked to alternative lenders, such as CCIF, to borrow capital in the second quarter. We continued investing in new assets with what we believe are attractive yields while remaining in senior positions of companies' capital structures. This is evidenced by our investment activity during the quarter, in which, 97.4% of commitments were to senior secured assets.
- 4 -
Exhibit 99.1
Investment activity by quarter and by asset class as of each of the last four quarters was as follows:
With the investment focus shifted toward primary issuance and, going forward, on directly originated investments, we continue to exit select lower yielding positions and deploy that capital into assets with favorable spreads while maintaining high exposure to senior secured assets. CCIF's gross portfolio yield was 7.3% as of June 30, 2016 compared to 6.6% at the end of the second quarter of 2015.
Set forth below are the weighted average effective yields as of each of the prior four quarters:

- 5 -
Exhibit 99.1
Set forth below are the weighted average EBITDA, weighted average total leverage multiple, and weighted average interest rate coverage of CCIF's portfolio companies. The quarter-over-quarter changes were primarily due to incremental investment activity during the quarter which added 17 new portfolio companies to CCIF's portfolio (and removed 4 portfolio companies) as well as improving financial metrics in existing portfolio companies.

________________________
(3) | Weighted average EBITDA amounts are weighted based on the amortized cost of the portfolio company investments. EBITDA amounts are estimated from the most recent portfolio company financial statements, have not been independently verified by CCIF or its advisors, and may reflect a normalized or adjusted amount. Accordingly, neither CCIF nor its advisors makes any representation or warranty in respect of this information. |
(4) | Weighted average interest coverage represents the portfolio company’s EBITDA as a multiple of interest expense. Portfolio company credit statistics are derived from the most recently available portfolio company financial statements, have not been independently verified by CCIF or its advisors, and may reflect a normalized or adjusted amount. Accordingly, neither CCIF nor its advisors makes any representation or warranty in respect of this information. |
(5) | Portfolio weighted average EBITDA, weighted average total leverage multiple, and interest coverage ratio data includes information solely in respect of portfolio companies in which CCIF has a debt investment. |
(6) | EBITDA is a non-GAAP financial measure. For a particular portfolio company, EBITDA is generally defined as net income before net interest expense, income tax expense, depreciation and amortization. EBITDA amounts are estimated from the most recent portfolio company's financial statements, have not been independently verified by CCIF or its advisors, and may reflect a normalized or adjusted amount. Accordingly, neither CCIF nor its advisors makes any representation or warranty in respect of this information. |
As of June 30, 2016 we had two debt investments on non-accrual status, meaning that the Company has ceased recognizing interest income on these investments, associated with two portfolio companies in the Energy: Oil and Gas industry. In May 2016 both portfolio companies voluntarily filed petitions to reorganize under Chapter 11of the U.S. Bankruptcy Code. Investments on non-accrual represented 1.3% and 2.8% of total investments on a fair value and amortized cost basis, respectively. These issuers represent CCIF's 1.3% of exposure to energy in the portfolio on a fair value basis as of June 30, 2016. We are actively monitoring these situations and evaluate our positions on an ongoing basis. Given today's environment, we believe it is prudent to continue limiting the exposure to these sectors, and we expect that as we raise and deploy capital the current exposure will continue to decline as a percentage of the total portfolio.
- 6 -
Exhibit 99.1
The following charts show debt investments on non-accrual status based on their amortized cost and fair value as of June 30, 2016.

The following chart shows the maturity schedule of CCIF's debt investments, excluding unfunded commitments, based on their principal amount as of June 30, 2016.

CCIF's publicly offered feeder funds, CCIF 2016 T and CCIF - I, which have committed to seek liquidity events on or before December 31, 2021 and December 31, 2040, respectively, collectively represented 54.3% of CCIF's total ownership as of June 30, 2016. The following chart shows the liquidity schedule of CCIF's publicly offered feeder funds as of June 30, 2016 based on the net assets of CCIF.

- 7 -
Exhibit 99.1
About Carey Credit Income Fund
CCIF is a non-traded business development company (BDC) that invests primarily in large, privately negotiated loans to private middle market U.S. companies. CCIF is the master fund which pools investor capital raised through its feeder fund offerings, such as the current offering CCIF 2016 T. CCIF is managed by affiliates of WPC and Guggenheim and is designed to provide investors with current income, capital preservation, and, to a lesser extent, capital appreciation. CCIF and CCIF 2016 T share the same investment objectives and strategies, and all portfolio investments are made by CCIF, the master fund.
About W. P. Carey Inc.
Founded in 1973, WPC is a publicly-traded real estate investment trust (NYSE: WPC) that provides long-term sale-leaseback and build-to-suit financing for companies worldwide. WPC has expertise in credit and real estate underwriting, with more than 35 years of experience in evaluating credit and real estate investment opportunities. A capital provider to growing U.S. companies since its inception, WPC had an enterprise value of approximately $11.7 billion at June 30, 2016. In addition to its owned portfolio of diversified global real estate, WPC manages a series of non-traded publicly registered investment programs with assets under management of approximately $11.7 billion. WPC is subject to the information and reporting requirements of the Securities Exchange Act of 1934, as amended (the “Exchange Act”). As a result, it files periodic reports and financial statements with the SEC, copies of which are available on the SEC's website at www.sec.gov.
For four decades, WPC has provided companies around the globe with capital to expand their businesses, make acquisitions, invest in research and development, or fund other corporate initiatives. Its corporate finance-focused credit and underwriting process is a constant that has been leveraged across a wide variety of companies and industries. WPC's investment process has largely focused on identifying companies with stable and improving credit profiles using a top-down and bottom-up approach, without relying on outside rating agencies. Credit-quality characteristics, capital structure, operating history, margin and ratio analysis, industry market share, and management team are all key considerations in evaluating and determining investment suitability of potential credits.
About Guggenheim Partners, LLC
Guggenheim Investments represents the investment management businesses of Guggenheim Partners and includes Guggenheim, an SEC-registered investment adviser. Guggenheim Partners is a privately-held, global financial services firm with over 2,500 employees and more than $240 billion in assets under management as of June 30, 2016. It produces customized solutions for its clients, which include institutions, governments and agencies, corporations, insurance companies, investment advisors, family offices, and individual investors.
Guggenheim Investments manages $202 billion in assets across fixed income, equity, and alternatives as of June 30, 2016. Its 275+ investment professionals perform research to understand market trends and identify undervalued opportunities in areas that are often complex and underfollowed. This approach to investment management has enabled Guggenheim to deliver long-term results to its clients.
Within Guggenheim Investments is the Guggenheim Corporate Credit Team, which is responsible for all corporate credit strategies and asset management of more than $66.5 billion. A unified credit platform is utilized for all strategies and is organized by industry as opposed to asset class, which increases its ability to uncover relative value opportunities and to identify and source opportunities. The scale of the platform, combined with the expertise across a wide range of industries and in-house legal resources, allows Guggenheim to be a solution provider to the market and maintain an active pipeline of investment opportunities.
Cautionary Statement Concerning Forward-Looking Statements
This document contains forward-looking statements within the meaning of the Federal securities laws. These statements are not guarantees of future performance and are subject to risks, uncertainties and other factors, some of which are beyond our control, are difficult to predict and could cause actual results to differ materially from those expressed or forecasted in the forward-looking statements. CCIF and CCIF 2016 T undertake no obligation to update any forward-looking statements contained herein to conform the statements to actual results or changes in their expectations. A number of factors may cause CCIF’s and CCIF 2016 T's actual results, performance or achievement to differ materially from those anticipated. For further information on factors that could impact CCIF and CCIF 2016 T performance, please review CCIF’s and CCIF 2016 T's respective filings at the SEC website at www.sec.gov.
- 8 -