Attached files
| file | filename |
|---|---|
| 8-K - CHINA FUND INC | fp0021098_8k.htm |

Data as of 7/31/16
Manager's Commentary
Market Review
Greater China equities rebounded strongly post Brexit, with the MSCI Golden Dragon Index returning 5.1% in US dollar terms as of July 31,2016. Almost all sectors saw positive returns, driven by funds flowing back into emerging markets. Companies in the property and construction, as well as the services and conglomerates sectors, led the market higher, while companies in the oil and resources sector detracted. High dividend-yielding companies performed better as investors looked to increase income generation within the equity markets.
Looking at the macro front, there has not been much of an improvement or recovery in the Chinese economy. China's official Purchasing Managers' Index declined marginally in July to slightly below 50, due to slowing global demand. Private investment remains weak due to falling returns and waning business confidence. In Hong Kong, retail sales and export numbers remain weak amid the sharp slowdown in tourism and uncertainties over US interest rates and weakness in the Eurozone weighing on consumer sentiment. On the other hand, some earnings preannounced by Chinese listed firms have shown signs of stabilization, or even acceleration, in earnings for the second quarter compared with those of a year ago.
Fund Review
During the month, the Fund's Net Asset Value ("NAV”) price underperformed the MSCI Golden Dragon Index (the "Benchmark Index”). In contrast to June, stock selection in financials was the largest contributor to performance, while stock selection in industrials was the main detractor.
The top detractor during the month was our position in China Everbright International Limited, a Chinese waste treatment company that should benefit from the rising urbanization and demand for waste treatment. Given that this is a business that requires economies of scale, we believe an established player such as China Everbright International Limited will have an advantage in gaining further market share, especially given its strong track record in securing projects with local governments. We believe this is a multi-year structural growth story and the company remains a core holding for our portfolio. However, the sentiment favoring yield stocks worked against China Everbright International Ltd. as the company has negative cash flow under its current expansionary phase. We believe this weakness is temporary, and are willing to hold the position through the current rough market conditions for its long term growth prospects.
On the other hand, Sun Hung Kai Properties Limited, a leading Hong Kong property developer, was the top contributor to performance. The developer saw strong sales at its recent property launches, reflecting its strong execution capabilities in tough market conditions. The company also benefited from its recurring rental income that can support a sustainable dividend of about 3%. At the beginning of this year, we argued that a 50% discount to NAV makes this company too cheap to ignore, especially given its high quality projects and strong track record. Our investment case gradually materialized recently, as investors turned their focus to cheap, dividend yielding stocks. We also expect the market to reevaluate the property sector as the physical residential market continues to improve.
Key Transactions
In July, our major portfolio changes focused on adding to companies that can provide sustainable growth with good cash flow and trimming positions on companies where we might face a potential earnings downside. For example, we initiated a position in China Resources Power Holdings Company Limited to narrow our underweight in the utility sector. This sector has been de-rating over the past nine years due to concerns about overcapacity, a potential tariff cut and a structural shift from coal fire power plants towards renewable energy. However, we believe most of the negatives are priced in and expect the 7% dividend payout to be well supported by a Capital Expenditure (CAPEX) cut and dividend discipline.
Outlook
The Greater China markets have rallied post-Brexit, benefiting from the 'lower for longer' expectation for US interest rates. However, we are mindful that despite the feel-good factor currently in the Chinese markets, fundamentally little has changed. The macro situation remains challenging in China, which will continue to weigh on aggregate corporate earnings, especially the over-capacity sectors. While monetary easing measures are yet to boost firms' willingness to invest for growth, we believe the government is more inclined to rely on fiscal stimulus to boost economic growth going forward
We do not see a solid base for strong recovery yet; therefore we are wary of chasing the current rally and believe that selecting stocks with sustainable and visible earnings growth is crucial. We often find such companies in turnaround situations, as is the case of China Resources Power Holdings Co., Ltd., driven by a shift in business strategy, change in management or improving industry outlook. This approach has largely resulted in the portfolio positioning more towards companies that should benefit from the ongoing economic rebalancing in China, including consumer services, industrial upgrade, healthcare and the growth of e-commerce.
|
In Brief
|
|
|
Fund Data
|
|
|
Description
|
Seeks to achieve long-term capital appreciation through investments in China companies.
|
|
Listing Date (NYSE)
|
July 10, 1992
|
|
Total Fund Assets (millions)
|
$275.3
|
|
Median Market Cap (in billions)
|
$11.3
|
|
Distribution Frequency
|
Annual
|
|
Management Firm
|
Allianz Global Investors U.S. LLC
|
|
Portfolio Management
|
Christina Chung, CFA, CMA Lead Portfolio Manager
|
Performance (US$ Returns)
(as of 7/31/16)
|
Fund
|
Benchmark1
|
|
|
One Month
|
4.66%
|
5.08%
|
|
Three Month
|
4.79%
|
7.06%
|
|
One Year
|
-8.13%
|
-5.26%
|
|
Three Year
|
4.15%
|
4.84%
|
Net Asset Value / Market Price
|
Net Asset Value (NAV) / Market Price at Inception
|
$13.15 / $14.26
|
|
NAV / Market Price (as of 7/31/16)
|
$17.51 / $15.22
|
High / Low Ranges (52-Week)
|
High / Low NAV
|
$20.96 / $14.65
|
|
High / Low Market Price
|
$17.86 / $12.85
|
|
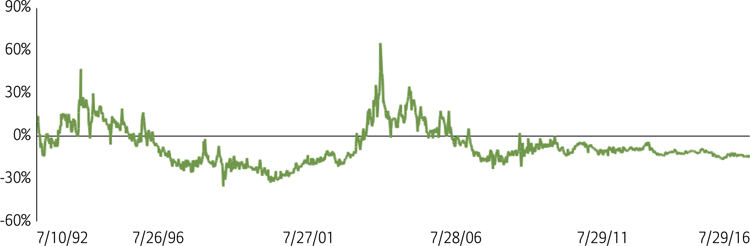
Premium/Discount to NAV (as of 7/31/16)
|
-13.08%
|
Fund Data (Common Shares)
|
Shares Outstanding
|
15,722,675
|
|
Average Daily Volume
|
33,248
|
|
Expense Ratio
|
1.53%
|
Fund Manager

Christina Chung, CFA, CMA
Lead Portfolio Manager
1. MSCI Golden Dragon Index.

The China Fund, Inc.
Investment Objective
The investment objective of the Fund is to achieve long-term capital appreciation. The Fund seeks to achieve its objective through investment in the equity securities of companies and other entities with significant assets, investments, production activities, trading or other business interests in China or which derive a significant part of their revenue from China.
The Fund has an operating policy that the Fund will invest at least 80% of its assets in China companies. For this purpose, 'China companies' are (i) companies for which the principal securities trading market is in China; (ii) companies for which the principal securities trading market is outside of China or in companies organized outside of China, that in both cases derive at least 50% of their revenues from goods or services sold or produced, or have a least 50% of their assets in China; or (iii) companies organized in China. Under the policy, China means the People's Republic of China, including Hong Kong, and Taiwan. The Fund will provide its stockholders with at least 60 days' prior notice of any change to this policy.
Returns For Periods Ending July 31, 2016*
|
1 Month
|
3 Month
|
YTD
|
1 Year
|
3 Year
|
5 Year
|
10 Year
|
Inception | |
|
NAV
|
4.66%
|
4.79%
|
-1.41%
|
-8.13%
|
4.15%
|
1.03%
|
10.48%
|
9.87%
|
|
Market Price
|
5.26%
|
4.68%
|
-1.93%
|
-5.70%
|
4.36%
|
0.60%
|
9.05%
|
8.86%
|
|
MSCI Golden Dragon Index
|
5.08%
|
7.06%
|
4.82%
|
-5.26%
|
4.84%
|
2.52%
|
6.73%
|
—
|
|
Calendar Year Returns
|
|
2008
|
2009
|
2010
|
2011
|
2012
|
2013
|
2014
|
2015
|
|
|
NAV
|
-46.95%
|
72.83%
|
27.26%
|
-24.37%
|
12.12%
|
18.31%
|
7.82%
|
-5.51%
|
|
Market Price
|
-40.65%
|
72.19%
|
23.60%
|
-27.51%
|
20.52%
|
12.70%
|
5.29%
|
-6.38%
|
|
MSCI Golden Dragon Index
|
-49.37%
|
67.12%
|
13.60%
|
-18.35%
|
22.65%
|
7.25%
|
8.06%
|
-7.12%
|
Past performance is not a guide to future returns.
*Annualized for periods greater than one year.
Source: State Street Bank and Trust Company. Source for index data: MSCI as at July 31, 2016. Investment returns are historical and do not guarantee future results. Investment returns reflect changes in net asset value and market price per share during each period and assumes that dividends and capital gains distributions, if any, were reinvested. The net asset value (NAV) percentages are not an indication of the performance of a shareholder's investment in the Fund, which is based on market price. NAV performance includes the deduction of management fees and other expenses. Market price performance does not include the deduction of brokerage commissions and other expenses of trading shares and would be lower had such commissions and expenses been deducted. It is not possible to invest directly in an index.
Premium/Discount
Sector Allocation
|
Fund
|
Benchmark1
|
|
|
Information Technology
|
32.41%
|
31.35%
|
|
Financials
|
26.18%
|
33.42%
|
|
Industrials
|
13.92%
|
6.73%
|
|
Consumer Discretionary
|
8.99%
|
7.41%
|
|
Telecom Services
|
8.58%
|
6.55%
|
|
Energy
|
2.38%
|
3.69%
|
|
Consumer Staples
|
1.58%
|
2.31%
|
|
Utilities
|
1.03%
|
4.45%
|
|
Health Care
|
0.91%
|
1.19%
|
|
Materials
|
0.20%
|
2.90%
|
|
Other assets & liabilities
|
3.84%
|
0.00%
|
Source: IDS GmbH - Analysis and Reporting Services, a subsidiary of Allianz SE.
|
Country Allocation
|
|
Fund
|
Benchmark1
|
|
|
China
|
73.78%
|
74.67%
|
|
Hong Kong Red Chips
|
31.26%
|
10.53%
|
|
Hong Kong 'H' shares
|
13.58%
|
20.79%
|
|
Equity linked securities ('A' shares)
|
1.82%
|
0.00%
|
|
China 'A' & 'B' shares
|
0.00%
|
0.15%
|
|
Other Hong Kong securities
|
27.12%
|
31.67%
|
|
Others
|
0.00%
|
11.53%
|
|
Taiwan
|
22.40%
|
25.33%
|
|
Other assets & liabilities
|
3.82%
|
0.00%
|
|
Top 10 Holdings
|
|
TAIWAN SEMIC CO LTD (Taiwan)
|
8.76%
|
|
SUN HUNG KAI PROPERTIES LTD (H.K.)
|
6.70%
|
|
TENCENT HOLDINGS LTD (China)
|
6.62%
|
|
HONG KONG EXCHANGES AND CLEARING LTD (H.K.)
|
4.29%
|
|
CHINA MERCHANTS BANK CO LTD (China)
|
4.14%
|
|
CHINA MOBILE LTD (China)
|
3.59%
|
|
ALIBABA GROUP HOLDING LTD (China)
|
3.44%
|
|
QINGLING MOTORS CO LTD (China)
|
3.36%
|
|
PING AN INSURANCE (China)
|
3.08%
|
|
DELTA ELECTRONICS INC (Taiwan)
|
2.96%
|
|
Portfolio Characteristics
|
||
|
Fund
|
Benchmark1
|
|
|
P/E Ratio
|
13.71
|
12.85
|
|
P/B Ratio
|
1.42
|
1.39
|
|
Issues in Portfolio
|
42
|
283
|
|
Foreign Holdings (%)
|
96.16
|
100.00
|
|
Other assets & liabilities (%)
|
3.84
|
0.00
|
|
Yield (%)
|
2.99
|
3.00
|
Source: IDS GmbH - Analysis and Reporting Services, a subsidiary of Allianz SE.
1. MSCI Golden Dragon Index.
The China Fund, Inc.
Distribution History (10 Year)
|
Declaration Date
|
Ex-dividend Date
|
Record Date
|
Payable Date
|
Distribution/
Share
|
Income
|
Long-term
Capital Gain
|
Short-term
Capital Gain
|
|
12/8/06
|
12/19/06
|
12/21/06
|
12/29/06
|
$4.01170
|
$0.29960
|
$2.73090
|
$0.98120
|
|
12/7/07
|
12/19/07
|
12/21/07
|
1/25/08
|
$12.12000
|
$0.28000
|
$9.00000
|
$2.84000
|
|
12/8/08
|
12/22/08
|
12/24/08
|
1/23/09
|
$5.81740
|
$0.48130
|
$5.33610
|
—
|
|
12/9/09
|
12/22/09
|
12/24/09
|
12/29/09
|
$0.25570
|
$0.25570
|
—
|
—
|
|
12/8/10
|
12/21/10
|
12/24/10
|
12/29/10
|
$2.27420
|
$0.37460
|
$1.89960
|
—
|
|
12/8/11
|
12/21/11
|
12/23/11
|
12/29/11
|
$2.99640
|
$0.17420
|
$2.82220
|
—
|
|
12/10/12
|
12/20/12
|
12/24/12
|
12/28/12
|
$3.25170
|
$0.34730
|
$2.90440
|
—
|
|
12/13/13
|
12/19/13
|
12/23/13
|
12/27/13
|
$3.31400
|
$0.43870
|
$2.87530
|
—
|
|
12/8/14
|
12/18/14
|
12/22/14
|
1/5/15
|
$3.76510
|
$0.29820
|
$3.46690
|
—
|
|
12/16/15
|
12/23/15
|
12/28/15
|
1/6/16
|
$1.49580
|
$0.21330
|
$0.84620
|
$0.43630
|
Distribution/Share includes Income, Long-term Capital gains and Short-term Capital gains.
The China Fund NAV Performance of $10,000 since inception

Past performance is not a guide to future returns.
Index Description
MSCI Golden Dragon Index
The MSCI Golden Dragon Index captures the equity market performance of large and mid cap China securities (H shares, B shares, Red-Chips and P-Chips) and non-domestic China securities listed in Hong Kong and Taiwan.
It is not possible to invest directly in an index.
The China Fund, Inc.
Portfolio in Full
|
Sector
|
Company (exchange ticker)
|
Market Price
|
Holding
|
Value US$
|
% of net assets
|
|
Information Technology
|
32.41
|
||||
|
TAIWAN SEMICONDUCTOR MANUFACTURING CO LTD
|
2330
|
172.50
|
4,461,000
|
24,105,582
|
8.76
|
|
TENCENT HOLDINGS LTD
|
700
|
186.50
|
757,500
|
18,207,961
|
6.62
|
|
ALIBABA GROUP HOLDING LTD
|
BABA
|
82.48
|
114,718
|
9,461,941
|
3.44
|
|
DELTA ELECTRONICS INC
|
2308
|
168.00
|
1,548,359
|
8,148,492
|
2.96
|
|
DIGITAL CHINA HOLDINGS LTD
|
861
|
6.03
|
9,360,000
|
7,274,330
|
2.64
|
|
ADVANTECH CO LTD
|
2395
|
248.00
|
798,841
|
6,205,951
|
2.25
|
|
SEMICONDUCTOR MANUFACTURING INTERNATIONAL CORP
|
981
|
0.63
|
56,362,000
|
4,576,430
|
1.66
|
|
LARGAN PRECISION CO LTD
|
3008
|
3,420.00
|
41,000
|
4,392,444
|
1.60
|
|
HON HAI PRECISION INDUSTRY CO LTD
|
2317
|
87.90
|
1,002,000
|
2,759,008
|
1.00
|
|
BAIDU INC
|
BIDU
|
159.60
|
16,749
|
2,673,140
|
0.97
|
|
GOLDPAC GROUP LTD
|
3315
|
2.15
|
5,021,000
|
1,391,325
|
0.51
|
|
Financials
|
26.19
|
||||
|
SUN HUNG KAI PROPERTIES LTD
|
16
|
111.00
|
1,289,000
|
18,440,629
|
6.70
|
|
HONG KONG EXCHANGES AND CLEARING LTD
|
388
|
191.50
|
477,900
|
11,795,209
|
4.29
|
|
CHINA MERCHANTS BANK CO LTD
|
3968
|
16.60
|
5,322,000
|
11,386,305
|
4.14
|
|
PING AN INSURANCE GROUP CO OF CHINA LTD
|
2318
|
36.20
|
1,819,500
|
8,489,077
|
3.08
|
|
CHINA OVERSEAS LAND & INVESTMENT LTD
|
688
|
25.50
|
2,282,000
|
7,499,903
|
2.73
|
|
FUBON FINANCIAL HOLDING CO LTD
|
2881
|
39.65
|
4,270,000
|
5,303,559
|
1.93
|
|
CHINA CONSTRUCTION BANK CORP
|
939
|
5.20
|
7,828,000
|
5,246,311
|
1.91
|
|
CATHAY FINANCIAL HOLDING CO LTD
|
2882
|
35.85
|
3,462,000
|
3,887,877
|
1.41
|
|
Industrials
|
13.92
|
||||
|
CHINA EVERBRIGHT INTERNATIONAL LTD
|
257
|
8.38
|
7,256,000
|
7,836,843
|
2.85
|
|
CK HUTCHISON HOLDINGS LTD
|
1
|
90.80
|
596,500
|
6,980,654
|
2.54
|
|
BEIJING ENTERPRISES HOLDINGS LTD
|
392
|
43.70
|
1,182,500
|
6,660,126
|
2.42
|
|
ZHUZHOU CRRC TIMES ELECTRIC CO LTD
|
3898
|
42.80
|
968,000
|
5,339,726
|
1.94
|
|
QINGDAO PORT INTERNATIONAL CO LTD
|
6198
|
3.54
|
6,596,000
|
3,009,427
|
1.09
|
|
KING SLIDE WORKS CO LTD
|
2059
|
387.50
|
239,000
|
2,901,121
|
1.05
|
|
CN STATE CONSTRUCTION INTERNATIONAL HOLDINGS LTD
|
3311
|
10.38
|
2,110,000
|
2,822,797
|
1.03
|
|
JARDINE MATHESON HOLDINGS LTD
|
J36
|
59.30
|
46,400
|
2,751,520
|
1.00
|
|
Consumer Discretionary
|
9.02
|
||||
|
QINGLING MOTORS CO LTD
|
1122
|
2.48
|
28,960,000
|
9,256,570
|
3.36
|
|
CITIGROUP GLOBAL MARKETS HOLD (exch. for CHINA CYTS TOURS HOLDIN)
|
N/A |
3.06
|
1,635,575
|
5,004,860
|
1.82
|
|
SANDS CHINA LTD
|
1928
|
29.60
|
1,204,400
|
4,594,754
|
1.67
|
|
LI & FUNG LTD
|
494
|
3.88
|
7,010,000
|
3,505,497
|
1.27
|
|
BRILLIANCE CHINA AUTOMOTIVE HOLDINGS LTD
|
1114
|
8.61
|
2,224,000
|
2,467,958
|
0.90
|
|
Telecom Services
|
8.58
|
||||
|
CHINA MOBILE LTD
|
941
|
95.65
|
801,000
|
9,874,551
|
3.59
|
|
CHINA UNICOM HONG KONG LTD
|
762
|
8.27
|
6,608,000
|
7,043,287
|
2.56
|
|
CHUNGHWA TELECOM CO LTD
|
2412
|
113.50
|
1,110,000
|
3,946,528
|
1.43
|
|
HUTCHISON TELECOMMUNICATIONS HK HOLDINGS LTD
|
215
|
2.84
|
7,552,000
|
2,764,268
|
1.00
|
|
Energy
|
2.38
|
||||
|
CNOOC LTD
|
883
|
9.28
|
5,467,000
|
6,538,783
|
2.38
|
|
Consumer Staples
|
1.58
|
||||
|
WANT WANT CHINA HOLDINGS LTD
|
151
|
4.75
|
3,993,000
|
2,444,515
|
0.89
|
|
VINDA INTERNATIONAL HOLDINGS LTD
|
3331
|
15.00
|
984,000
|
1,902,332
|
0.69
|
|
Utilities
|
1.03
|
The China Fund, Inc.
Portfolio in Full
|
Sector
|
Company (exchange ticker)
|
Market Price
|
Holding
|
Value US$
|
% of net assets
|
|
CHINA RESOURCES POWER HOLDINGS CO LTD
|
836
|
12.36
|
1,778,000
|
2,832,371
|
1.03
|
|
Health Care
|
0.91
|
||||
|
CSPC PHARMACEUTICAL GROUP LTD
|
1093
|
6.71
|
2,892,000
|
2,501,040
|
0.91
|
|
Materials
|
0.20
|
||||
|
TIANGONG INTERNATIONAL CO LTD
|
826
|
0.58
|
7,246,000
|
541,659
|
0.20
|
Source: State Street Bank and Trust Company, IDS GmbH - Analysis and Reporting Services, a subsidiary of Allianz SE.
Important Information:
Holdings are subject to change daily. The Fund seeks to achieve its objective through investment in the equity securities of companies and other entities with significant assets, investments, production activities, trading or other business interests in China or which derive a significant part of their revenue from China. Investing in non-U.S. securities entails additional risks, including political and economic risk and the risk of currency fluctuations, as well as lower liquidity. These risks, which can result in greater price volatility, will generally be enhanced in less diversified funds that concentrate investments in a particular geographic region.
The information contained herein has been obtained from sources believed to be reliable but Allianz Global Investors U.S. LLC and its affiliates do not warrant the information to be accurate, complete or reliable. The opinions expressed herein are subject to change at any time and without notice. Past performance is not indicative of future results. This material is not intended as an offer or solicitation for the purchase or sale of any financial instrument. Investors should consider the investment objectives, risks, charges and expenses of any mutual fund carefully before investing. This and other information is contained in the Fund's annual and semiannual reports, proxy statement and other Fund information, which may be obtained by contacting your financial advisor or visiting the Fund's website at www.chinafundinc.com. This information is unaudited and is intended for informational purposes only. It is presented only to provide information on the Fund's holdings, performance and strategies. The Fund is a closed-end exchange traded management investment company. This material is presented only to provide information and is not intended for trading purposes. Closed-end funds, unlike open-end funds, are not continuously offered. After the initial public offering by a closed-end fund, its shares can be purchased and sold on the open market through a stock exchange, where shares may trade at a premium or a discount. The market price of holdings is subject to change daily.
P/E is a ratio of security price to earnings per share. Typically, an undervalued security is characterized by a low P/E ratio, while an overvalued security is characterized by a high P/E ratio. P/B is a ratio of the current stock price to the book value. This is used to identify undervalued stocks. Dividend yield is the annual percentage of return earned by an investor on a common or preferred stock. The average dividend yield is the dividend rate divided by current share price.
©2016 Allianz Global Investors Distributors LLC.
|
Investment Products: Not FDIC Insured | May Lose Value | Not Bank Guaranteed
|
FS-CHN-0716
|