Attached files
| file | filename |
|---|---|
| 8-K - 8-K - STIFEL FINANCIAL CORP | d228990d8k.htm |
 Stifel Financial Corp. August 2016 Exhibit 99.1 |
 2 Disclaimer Forward-Looking Statements
This presentation may contain
“forward-looking statements” within the meaning of the Private Securities Litigation Reform Act of 1995 that involve significant risks, assumptions, and uncertainties, including statements relating to the market
opportunity and future business prospects of
Stifel Financial Corp., as well as Stifel, Nicolaus & Company, Incorporated and its subsidiaries (collectively, “SF” or the “Company”). These statements can be identified by the use of the
words “may,” “will,” “should,” “could,” “would,” “plan,” “potential,” “estimate,”
“project,” “believe,” “intend,” “anticipate,” “expect,” and similar expressions. In particular, these statements may refer to our goals, intentions, and expectations, our business plans and growth
strategies, our ability to integrate and
manage our acquired businesses, estimates of our risks and future costs and benefits, and forecasted demographic and economic trends relating to our industry. You should not place undue reliance on any forward-looking statements, which speak only as of the date they were
made. We will not update these
forward-looking statements, even though our situation may change in the future, unless we are obligated to do so under federal securities laws. Actual results may differ materially and reported results should not be considered as an indication of future
performance. Factors that could cause
actual results to differ are included in the Company’s annual and quarterly reports and from time to time in other reports filed by the Company with the Securities and Exchange Commission and include, among other things, changes in
general economic and business conditions,
actions of competitors, regulatory and legal actions, changes in legislation, and technology changes.
Use of Non-GAAP Financial Measures The Company utilized non-GAAP calculations of presented net revenues, compensation and benefits,
non-compensation operating expenses,
income before income taxes, provision for income taxes, net income, compensation and non-compensation operating expense ratios, pre-tax margin and diluted earnings per share as an additional measure to aid in
understanding and analyzing the
Company’s financial results for the three and six months ended June 30, 2016. Specifically, the Company believes that the non-GAAP measures provide useful information by excluding certain items that may not be indicative of
the Company’s operating results and
business outlook. The Company believes that these non-GAAP measures will allow for a better evaluation of the operating performance of the business and facilitate a meaningful comparison of the Company’s results in the
current period to those in prior periods and
future periods. Reference to these non-GAAP measures should not be considered as a substitute for results that are presented in a manner consistent with GAAP. These non-GAAP measures are provided to enhance
investors' overall understanding of the
Company’s financial performance. |
 Our Strategy |
 4 Strategic Vision To build a premier wealth management and investment banking firm
2,298 financial
advisors in
over 360
branches with
more than
$200B in client
assets
Private
Client
Asset
Management
Bank
$26B in total
assets
managed
through
various
strategies
Equities
Sales +
Trading
$9.4B in assets
funded by
client deposits
Global Wealth Management
Institutional
Fixed
Income
Sales +
Trading
Investment
Banking
Research
Experienced
sales force with
extensive
distribution
capabilities
Comprehensive
platform
including
research,
strategy and
DCM teams
Over 350
professionals
with extensive
experience
across all
products and
industry
verticals
Largest
research
platform with
approximately
1,300 U.S. and
290 European
stocks covered |
 5 A History of Growth 2005 Legg Mason’s Capital Markets Division 2008 Butler Wick 2009 56 UBS Private Client Branches 2010 Thomas Weisel Partners 2007 Ryan Beck Acquisition Stifel Bank & Trust 2011 Stone & Youngberg 2012 Miller Buckfire 2013 Knight Capital Group’s Fixed Income Division 2014 De La Rosa, Oriel Securities, 1919 Investment Counsel, Merchant Capital 2013 Keefe, Bruyette & Woods 2013 Acacia Bank & Ziegler Lotsoff 2015 Barclays Wealth & Investment Management, Sterne Agee, Sidoti Joint Venture, Leumi Partners Collaboration Agreement * 2016 Net Revenue annualized based on 1H16 results and adjustment for 2H16 for impact of the sale of legacy Sterne
Agee business 2016
Eaton Partners
ISM Capital |
 Driving Shareholder Value Through Deal Integration & Balance Sheet Growth |
 7 Core & GAAP EPS to Converge as Deal Charges Realized
Footnotes:
• EPS estimates for 3Q16 - 4Q17 as well as 2016 and 2017 based on consensus core EPS estimates as of 8/15/2016
• Analysis of convergence between Core and GAAP EPS based solely on current announced acquisitions.
2012 2013 2014 2015 2016 2017 Core $0.63 $0.58 $0.60 $0.53 $0.79 $0.69 $0.68 $0.64 $0.75 $0.65 $0.71 $0.60 $0.51 $0.57 $0.69 $0.60 $0.68 $0.65 $0.74 $0.72 $0.84 GAAP $0.63 $0.21 $0.40 $1.00 $0.64 $0.63 $0.58 $0.52 $0.58 $0.56 $0.27 $0.22 $0.14 $0.36 $0.15 $0.30 $0.60 $0.61 $0.70 $0.68 $0.80 CORE to GAAP% 100% 36% 67% 189% 81% 91% 85% 81% 77% 86% 38% 37% 27% 63% 22% 51% 88% 94% 94% 94% 95% Share Price $31.97 $34.67 $35.67 $41.22 $47.92 $49.76$47.35 $46.89 $51.02 $55.75$57.74 $42.10 $42.36 $29.60 $31.45 Price Growth 0% 8% 12% 29% 50% 56% 48% 47% 60% 74% 81% 32% 32% -7% -2% Net Revenue $411 $439 $495 $480 $565 $548 $561 $525 $578 $564 $598 $592 $582 $620 $652 NR Growth 0% 7% 20% 17% 37% 33% 37% 28% 41% 37% 45% 44% 42% 51% 59% Diluted Shares 63 69 74 75 75 76 76 77 78 77 78 80 79 76 76 Share Growth 0% 9% 17% 19% 19% 20% 19% 21% 22% 22% 23% 26% 26% 20% 20% |
 8 Balance Sheet Growth Balance sheet growth has resumed with ability to further lever the existing
capital base
Ratio
2008
2009
2010
2011
2012
2013
2014
2015
Q1 16
Q2 16
Illustrative
Tier 1 Leverage
32.3%
30.5%
25.6%
21.4%
17.7%
15.4%
16.5%
16.6%
11.6%
11.5%
9.5%
Tier 1 Risk Based Capital
49.4%
40.5%
29.1%
27.4%
26.8%
26.7%
25.0%
26.3%
21.3%
20.9%
19.9%
Risk Weighting Assets Density
64.9%
56.2%
67.3%
62.7%
57.0%
50.7%
58.2%
46.6%
49.0%
49.1%
50.0%
Infrastructure
Build |
 9 Bank Drove Significant Balance Sheet & Revenue Growth
Bank growth has been balanced
between loans and investments:
Loans:
• Comprised of securities based loans, C&I, and residential mortgages • Focused lending to high net worth retail clients • Effective duration of approximately 1 year as of 6/30/16 AFS & HTM Investments: • 67% of the portfolio is fully guaranteed by a US GSE or rated AAA as of 6/30/16 • Portfolio primarily GSE MBS, ABS, and Corporate bonds • Effective duration of approximately 2 years Impact of Bank Growth LTM on Consolidated Results (mil.) 6/30/2015 6/30/2016 Total consolidated assets $10,140 $15,385 Investment securities $1,913 $4,587 Loans $2,604 $4,422 Total deposits $4,314 $7,881 Total equity $2,520 $2,491 Annualized NII $135 $194 Tier 1 Risk Based Capital 29.4% 20.9% Tier 1 Leverage 18.3% 11.5% NIM (Bank) 2.52% 2.36% ROAA (Bank) 1.48% 1.25% ROAE (Bank) 19.1% 18.6% NPAs/Assets 0.14% 0.37% |
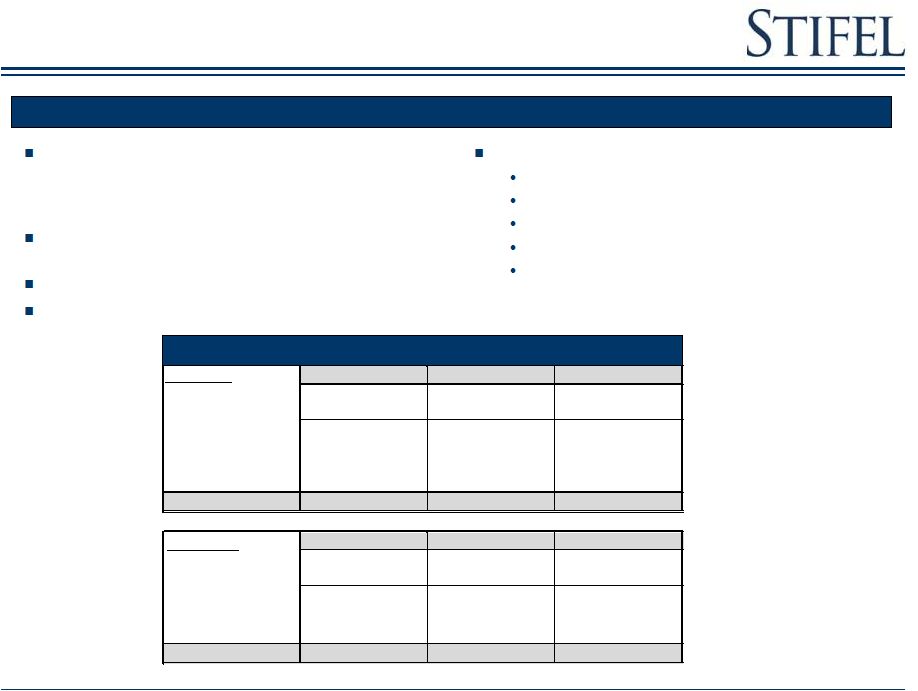
  10 Potential Impact of Target Asset Levels on Results Targeted Bank Growth Would have Significantly Impacted Second Quarter Results: • Pro forma: • Tier 1 capital levels up 10% • RWA up 15% • Net revenue up 4% • Pre-tax margin up 290 bps • 2Q16 EPS up $0.15 • Annualized 2Q16 EPS up 22% Excess Capital Opportunities to Support Further Growth: • As GAAP deal related expenses run off, organic capital growth is expected to accelerate. • Additional capital flexibility as a result of sale of Sterne Agee legacy businesses and preferred share issuance. • Ability to downstream capital from holding company to bank to support growth. • Changes in money market regulations could generate increased bank sweeps. Footnotes: • Normalized; • Results incorporate average assets at targeted period-end level, reversal of non-recurring
interest expenses
• Preferred & Fully Levered: • Expenses assume an 80% pre-tax margin on incremental bank revenues.
• Tier 1 capital, net income to common equity, and EPS account for impact of $9.4 mil. of
annual preferred dividends
Impact of Bank Growth to Targeted Levels
(mil.)
6/30/2016
Normalized
6/30/2016
Preferred &
Fully Levered
Average Assets
$13,599
$15,000
$18,000
Risk Weighted Assets
$7,483
$7,866
$8,629
Tier 1 Capital
$1,565
$1,573
$1,717
Tier 1 Risk Based Capital
20.9%
20.0%
19.9%
Tier 1 Leverage
11.5%
10.0%
9.5%
Revenue
$652
$660
$680
Bank NIM
2.36%
2.42%
2.42%
Compensation
$410
$410
$411
Non-compensation operating expense
$158
$159
$162
Pre-tax income
$84
$91
$107
Net income
$52
$56
$66
Net income to common equity
$52
$56
$64
EPS
$0.69
$0.74
$0.84
Pre-tax operating margin
12.9%
13.7%
15.8%
Annualized EPS
$2.75
$2.96
$3.36 |
 Stifel Overview |
 12 Stifel – Premier Investment Bank and Wealth Management Firm Stifel at a Glance GAAP Net Revenue - $2,446 million (Q2’16 LTM) Global Wealth Management (GWM) Net Revenue - $1,470 million (Q2’16 LTM) Private Client Stifel Bank & Trust Margin and Securities-based Lending Asset Management Institutional Group (IG) Net Revenue - $980 million (Q2’16 LTM) Equity & Fixed Income Capital Raising M&A Advisory / Restructuring Institutional Equity and Fixed Income Brokerage Independent Research (1) Assets / equity (as adjusted). (2) As of 6/30/2016. (3) As of 7/29/2016. (4) Insider ownership percentage includes all fully diluted shares, units outstanding and options outstanding, as of
4/11/2016. (5)
Excludes 540 independent advisors from legacy Sterne Agee
business sold to INTL FCStone Low
leverage
(6.2x)
(1)
(2)
,
$2.5
billion
stockholders’
equity
(2)
and
$2.4
billion
market
capitalization
(3)
34%
Insider
ownership
aligns
employees'
interests
with
other
shareholders
(4)
Over 7,000 associates
(3)
Balanced business mix (60% GWM / 40% IG) (2016 YTD net
revenues) National
presence
with
approximately
2,300
financial
advisors
(2)
(5)
Largest
U.S.
equity
research
platform
with
roughly
1,300
stocks
under
coverage
(3)
Broad
investment
banking
and
institutional
sales
and
trading
capabilities
–
domestic
and
international |
 13 Leading broker-dealer providing wealth management and
institutional services to consumers and companies
Stifel’s Differentiated Value Proposition: Growth, Scale
and Stability #6
Largest
Retail
Brokerage
Network
(2)
LARGEST
provider of U.S. equity research
2
nd
LARGEST
Equity trading platform in the U.S.
outside
of
the
Bulge
Bracket
firms
(1)
FULL SERVICE
investment banking with
expertise across products and industry sectors
ACCESS TO top ten private client platform (1) Based on 2015 U.S. trading volume per Bloomberg. (2) Source: SIFMA and publicly available information for U.S. brokerage networks. Includes investment banks only.
Stifel
figure reflects sale of legacy Sterne Agee Independent
Contractor business. Bank of
America Merrill Lynch 10
Janney Montgomery Scott
725
Rank
Firm
Brokers
1
16,134
2
Morgan Stanley Wealth Management
16,000
3
Wells Fargo Securities
15,187
4
UBS
6,997
5
Raymond James
6,265
6
Stifel
2,298
7
RBC Capital Markets
2,000
8
Oppenheimer & Co Inc
1,300
9
JPMorgan
800
Bulge Bracket
Boutique
Size / scale
Large distribution
Trading
Retail
Issues
Lack of focus
Banker turnover
Lack of commitment
Research indifference
Lack of growth investors
Firm focus
Good research
Growth investor access
Issues
Financial / firm stability
Trading support
Few with retail
Size / scale
Firm focus
Stability (financial & personnel)
Large distribution
Trading
Outstanding research
Retail
Wealth Management
Institutional |
 14 Well-diversified, low risk business model with balanced retail
and institutional exposure
14
Unburdened by capital constraints
Low leverage business model and conservative risk
management Limited balance sheet
risk Stable wealth management business is
augmented by profitable and growing institutional business Drive revenue synergies by leveraging the wealth management and institutional business
Net Revenues
2015
2016 YTD
Non-GAAP Operating Contribution
Balanced business model facilitates growth in all market
environments Note: Net revenues and operating
contribution percentages excludes the Other segment. 2015 2016 YTD |
 15 (1) CAGR reflects years 2006 through Q2’16 YTD Annualized.
(2)
Excludes impact of sale of Sterne Agee Independent
Contractor & Correspondent Clearing businesses (3) Book Value Per Share adjusted for April 2011 three-for-two stock split (2006-2010).
CAGR: 16%
CAGR: 21%
Non-GAAP Net Revenues ($MM)
(1)
Non-GAAP Net Income ($MM)
(1)
Total Equity ($MM)
(1)
Total Client Assets
(1) (2)
($BN)
Book Value Per Share
(1) (3)
CAGR: 19%
CAGR: 17%
CAGR: 28%
A Stable Track Record Through Multiple Business
Cycles $35
$59
$53
$94
$114
$122
$138
$166
$187
$220
$226
$0
$50
$100
$150
$200
$250
2006
2007
2008
2009
2010
2011
2012
2013
2014
2015
2016 |
 Global Wealth Management |
 17 (1) Excludes 540 legacy Sterne Agee Independent Contractors included in sale to INTL FCStone.
(2)
Full year 2016 net revenue and operating contribution
adjust for impact to 2H16 due to sale of legacy Sterne Agee businesses. Global Wealth Management (GWM) Provides Securities Brokerage Services and Stifel Bank Products
Net Revenues
(2)
($MM)
Operating
Contribution
(2)
($MM)
Overview
National Presence
Grown from 600+ financial advisors in 2005 to nearly
2,300
(1)
financial advisors currently
Proven organic growth and acquirer of private client
business
Strategy of recruiting experienced advisors with
established client relationships
Expanding U.S. footprint
|
 18 Building Scale and Capabilities into a $1.5B Revenue Segment…
Private Client –
350 financial advisors and support
Revenue production has exceeded expectations
October 2009
Bank holding company
Grown assets from ~ $100M to $7.3B
April 2007
Private Client –
75 financial advisors
Public Finance
December 2008
Private Client –
400 financial advisors
Capital Markets
February 2007
Asset Management
Over $4 billion in assets
November 2013
One-branch community bank; 95% of loan portfolio
sold in 3Q15
October 2013
Customized investment advisory and trust
services November 2014
Private Client
Asset Management
Bank
~100 advisors managing over $20B in AUM
December 2015
~130 advisors managing ~ $10B in AUM
June 2015 |
 19 (1) Excludes Legacy Sterne Agee Independent Contractor Business.
Key Operating Metrics
Accounts
(1)
Financial Advisors
(1)
Total Client Assets
(1)
($MM)
Branches
(1)
GWM -
Private Client Group |
 20 GWM - Stifel Bank & Trust Investment Portfolio (2) Loan Portfolio (3) (Gross) Acquired FirstService Bank, a St. Louis-based, Missouri-chartered commercial bank, in April 2007
Stifel Financial became a bank holding company and
financial services holding company
Substantial Balance sheet growth with
low-risk assets Funded by Stifel Nicolaus
client deposits Maintain high levels of
liquidity Overview
Key Statistics
(000s) Interest Earnings Assets (1) Note: Data as of 6/30/16. (1) Average interest earning assets for quarter ended 6/30/16.
(2)
Non-agency MBS makes up less than 1% of Investment
Portfolio. (3)
Other includes construction and land, consumer loans, and
home equity lines of credit. (4)
NPAs include: nonaccrual loans, restructured loans, loans
90+ days past due, and other real estate owned.
Total assets
$9,431,000
Total deposits
7,881,000
Total equity
613,000
ROAA
1.3%
ROAE
18.6%
Tier 1 Risk Based Capital
13.7%
Tier 1 Leverage
7.4%
NPAs/Assets
0.4% |
 Growing Asset Management Capabilities Total Assets: $26.3 Billion¹ Assets $11.4 Billion $10.3 Billion $2.5 Billion $889* Million $1.2 Billion Offices Chicago St. Louis Milwaukee New York San Francisco Baltimore Cincinnati New York Philadelphia Baltimore New York Florham Park, NJ ¹As of 6/30/2016 *Sagewood assets represent billable assets EquityCompass Strategies is a research and investment advisory unit of Choice Financial Partners, Inc. (“Choice”). Choice and
Ziegler Capital Management, LLC (“ZCM”) are wholly-owned subsidiaries and affiliated SEC Registered Investment Advisers of Stifel Financial Corp. (“Stifel”). Sagewood Asset Management LLC is a
wholly-owned subsidiary of ZCM. 1919ic is an SEC Registered Investment Adviser and indirect subsidiary of Stifel. 1919 IC&T is an OCC-regulated national trust company that is a wholly-owned
subsidiary of Stifel. Washington Crossing Advisors is a Stifel investment advisory program. Assets Under Management represents the aggregate fair value of all discretionary and non-discretionary assets, including
fee-paying and non-fee-paying portfolios. Assets Under Advisement represent advisory-only assets where the firm provides a model portfolio and does not have trading authority over the assets.
|
 Institutional Group |
 23 (1) Based on 2015 U.S. trading volume per Bloomberg.
(2)
Includes Thomas Weisel
historical investment banking revenues for years 2006
through September 30, 2010. (3)
2012 includes realized and unrealized gains on the
Company’s investment in Knight Capital Group, Inc. of $39.0 million. Institutional Group Net Revenues ($MM) (2)(3) Fixed Income Brokerage + Investment Banking Overview Provides securities brokerage, trading, research, underwriting and corporate advisory services Largest provider of U.S. Equity Research 2nd largest Equity trading platform in the U.S. outside of the Bulge Bracket (1) Full-service Investment Bank Comprehensive Fixed Income platform Equity Brokerage + Investment Banking (2) |
 24 Building Scale and Capabilities into a $1.0B Revenue Segment…
Growth Focused
Investment Banking, Research, Sales and
Trading July 2010
Core of our Institutional sales, trading and research
group December 2005
Fixed Income IB, Sales and Trading
Private Client
October 2011
FIG Investment Banking
FIG Sales and Trading / Research
February 2013
Restructuring advisory
December 2012
Fixed
Income
Sales
and
Trading
–
U.S.
&
Europe
Fixed Income Research
July 2013
California-based investment bank and bond
underwriter April 2014
UK-based full service investment bank
July 2014
Expands Public Finance in Southeast
December 2014
Equities
Fixed Income
Investment
Banking
Highly complementary fixed income platforms
June 2015
One of the largest, global fund placement and advisory
firms January 2016
Enhances European debt capital markets
capabilities February 2016
|
 25 Institutional Group – Investment Banking Accomplished U.S. Equity Underwriting Franchise – All Equity Transactions Bookrun Equity Deals Since 2010 All Managed Equity Deals Since 2010 Source: Dealogic. Rank eligible SEC registered IPOs and Follow-On offerings since 2010. Includes
demutualizations. As of 2/29/16. Overlapping deals between Stifel and its acquired firms have been removed. Note: $ Volume represents full credit to underwriter for All Managed Equity Deals and apportioned credit to
bookrunner for Bookrun Equity Deals. Bold font indicates middle-market firms. ($ in billions) # of $ Rank Firm Deals Volume 1 Bank of America Merrill Lynch 1,419 $798.3 2 JPMorgan 1,405 $795.8 3 Citi 1,293 $787.6 4 Morgan Stanley 1,264 $760.6 5 Barclays 1,165 $657.4 6 Credit Suisse 1,152 $657.0 7 Wells Fargo Securities 1,122 $584.4 8 Goldman Sachs 1,056 $675.1 9 Deutsche Bank 1,043 $621.6 10 Stifel / KBW 1,031 $325.5 11 RBC Capital Markets 1,017 $483.8 12 UBS 780 $433.1 13 Raymond James & Associates 750 $320.2 14 Piper Jaffray & Co 637 $248.9 15 Jefferies LLC 591 $139.4 16 Robert W Baird & Co 561 $154.9 17 JMP Securities LLC 494 $90.9 18 Oppenheimer & Co Inc 478 $118.5 19 Cowen & Company LLC 474 $92.5 20 William Blair & Co LLC 441 $113.5 21 KeyBanc Capital Markets 440 $187.9 22 BMO Capital Markets 407 $156.0 23 Canaccord Genuity Corp 362 $46.5 24 SunTrust Robinson Humphrey 344 $168.1 25 Ladenburg Thalmann & Co 312 $44.2 ($ in billions) # of $ Rank Firm Deals Volume 1 Bank of America Merrill Lynch 1,303 $150.4 2 JPMorgan 1,264 $165.6 3 Morgan Stanley 1,160 $166.8 4 Citi 1,142 $154.4 5 Barclays 986 $133.5 6 Goldman Sachs 967 $155.5 7 Credit Suisse 962 $123.2 8 Deutsche Bank 840 $94.8 9 Wells Fargo Securities 792 $61.4 10 UBS 567 $55.9 11 RBC Capital Markets 506 $38.7 12 Jefferies LLC 492 $27.0 13 Stifel / KBW 357 $17.1 14 Raymond James & Associates 249 $11.3 15 Piper Jaffray & Co 234 $9.3 16 Cowen & Company LLC 225 $8.0 17 Leerink Partners LLC 168 $7.6 18 Roth Capital Partners 149 $2.6 19 Robert W Baird & Co 144 $5.7 20 BMO Capital Markets 141 $8.7 21 Aegis Capital Corp 103 $1.4 22 KeyBanc Capital Markets 102 $6.0 23 William Blair & Co LLC 96 $3.6 24 Sandler O'Neill & Partners 84 $6.2 25 Canaccord Genuity Corp 76 $3.0 |
 26 U.S. Equity Research Coverage (1) Coverage Balanced Across All Market Caps (1) Institutional Group – Research Stifel Research Highlights Largest U.S. Equity Research Platform Largest provider of U.S. Equity Research Largest provider of U.S. Small Cap Research² #1 U.S. provider of Financial Services coverage Only firm ranked in the Top 12 each year for the last ten years in the Wall Street Journal’s “Best on
the Street” Survey
(1)
Source: StarMine rankings as of 7/29/16. Overall coverage
includes only companies with a rating & domiciled in the U.S. Does not include Closed End Funds. Small Cap includes market caps less than $1 billion; Mid Cap includes
market caps less than $5 billion.
(2)
Small Cap includes market caps less than $1
billion. Note: Bold font indicates
middle-market firms. Companies Under
Coverage Rank
Firm
Overall
Mid Cap
Small Cap
1
Stifel/KBW
1,286
455
427
2
JPMorgan
1,127
409
175
3
BofA Merrill Lynch
1,081
411
131
4
Wells Fargo
974
348
190
5
Jefferies
952
329
207
6
Morgan Stanley
926
302
114
7
Raymond James
911
337
260
8
Goldman Sachs
901
296
71
9
Citi
898
297
126
10
Barclays
880
295
99
11
RBC Capital Markets
866
310
115
12
Deutsche Bank
854
273
129
13
Credit Suisse
849
278
148
14
UBS
725
201
80
15
Piper Jaffray
664
235
220
16
Robert W. Baird & Co
642
234
128
17
Cowen
623
180
182
18
Suntrust Robinson Humphrey
606
244
139
19
William Blair & Co
586
226
157
20
Evercore
567
146
56
21
Morningstar
559
119
17
22
Keybanc
549
262
108
23
BMO Capital Markets
526
151
75
24
Macquarie
457
161
83
25
Oppenheimer
451
139
108
Small Cap
34%
Mid Cap
35%
Large Cap
31% |
 27 Institutional Equity Sales Equity Trading Institutional Group – Equity Sales and Trading 27 Extensive Distribution Network Powerful Platform Spanning North America and Europe
Relationships with over 3,500 institutional accounts
globally Active daily market maker in over
3,700 stocks Traded over 11.8 billion shares
in 2015 Complete coverage of North America
and Europe for North American listed equities
Major liquidity provider to largest equity money
management complexes Multi-execution
venues: high-touch, algorithms, program trading, and direct market access Dedicated convertible sales, trading, and research desk
34 sales traders located in
Baltimore, New York, Boston, Dallas, San
Francisco, and London
12 position traders covering each major
industry 10 specialized traders focused on:
Option Trading Profitable model with
advantages of scale 84 person sales force,
commission-based Experts in small and mid
cap growth and value Team-based sales
model with 2 - 4 coverage sales people
per account
Team leaders have an average of 15 years
experience Offices in all major institutional
markets in North America &
Europe Accounts range from large mutual funds
to small industry- focused
investors Managed over 732 non-deal
roadshow days in 2015 Extensive experience
with traditional and overnight corporate
finance transactions |
 28 Overview Institutional Group – Fixed Income Capital Markets Client Distribution (1)(2) Platform & Products (1) Client Distribution is as of 8/10/2016 (2) Other category includes: Credit Union, Corporation, Hedge Fund, Pension Fund, Trust Company, Foundation,
Endowment, University & Non-Profit.
Comprehensive platform
89 traders with annual client trade volume
approaching $500 billion
58-person Fixed Income Research and Strategy
Group
Widespread distribution
More than 240 Institutional sales professionals
covering over 11,650 accounts
47 institutional fixed income offices
nationwide European offices in London and
Zurich Customer-driven
Focus on long-only money
managers and income funds,
depositories, and hedge
funds
Consistency of execution
Identification of relative
value through asset
class/security selection
High Yield and Distressed Credit
Loan Trading Group
Aircraft Finance & Credit Solutions
Hybrid Securities
Emerging Markets
Structured Products
Investment Grade Credit
Municipal Sales and Trading and
Public Finance
UK Sales and Trading
Strong Fixed Income Brokerage Capabilities
Broker/Dealer
7%
Corporation 1%
Credit Union
1%
Money
Manager 58%
Government
3%
Bank or thrift
17%
Hedge Fund 3%
Insurance
Company 7%
Trust Company
1%
Other 2%
US Government and Agency
Securities
Mortgage-Backed Securities (MBS)
Whole Loans
Government-Guaranteed Loans
Asset-Backed Securities (ABS)
Commercial Mortgage-Backed
Securities (CMBS)
Certificates of Deposit
Cleared Products Group
|
 Overview Institutional Group – Public Finance 29 Stifel has ranked in the top ten nationally for senior
managed negotiated underwritings for the past five
years, and Stifel has ranked #1 nationally
for senior managed K-12 negotiated
underwritings for 2015. Stifel’s Public
Finance Group ranked #1 in municipal
negotiated issues in 2015
Total of 26 Public Finance offices
Nearly 150 Public Finance professionals
Public Finance Underwritings
Specialty sectors:
Education
Local Government/Municipal
Healthcare
Public-Private Partnerships/Development
Housing
Source: Thomson Reuters: SDC (True Economics to Book) Ranked
by number of transactions.
Negotiated
#
Par
Amount
#
Par
Amount
#
Par
Amount
Senior Manager/
Private Placement
857
$14,677
1034
$19,749
630
$11,860
Co-Manager
192
$36,506
255
$38,094
174
$34,775
Total
1049
$51,183
1289
$57,843
804
$46,635
Competitive
#
Par
Amount
#
Par
Amount
#
Par
Amount
Senior Manager
92
$604
67
$1,367
65
$3,358
Co-Manager
330
$8,725
405
$21,171
345
$9,259
Total
422
$9,329
472
$22,538
410
$12,617
2016 YTD
2015
2014
2016 YTD
2015
2014 |
 Financial Information |
 Net Revenue • Total net revenue of $652 mil. in 2Q16 was up 5% sequentially and 9% Y/Y driven by: • Investment Banking revenue increased 32% sequentially but declined 16% Y/Y • Asset Management revenue was flat sequentially & increased 21% Y/Y • Net Interest Income was flat sequentially but up 44% Y/Y • Global Wealth Management represented 59% of net revenue vs. 61% in 1Q16 and 57% in 2Q15 • Institutional net revenue of $261 mil. increased 8% sequentially & 1% Y/Y $- $100 $200 $300 $400 $500 $600 $700 2Q15 3Q15 4Q15 1Q16 2Q16 Net Interest Income Asset Management & Service Fees Investment Banking Brokerage Revenue $598 $592 $581 $620 $652 $343 $357 $347 $380 $386 $259 $232 $246 $241 $261 $- $100 $200 $300 $400 $500 $600 $700 2Q15 3Q15 4Q15 1Q16 2Q16 Global Wealth Management Institutional Core Net Revenue (mil.) Core Segment Net Revenue (mil.) 31 |
 Global Wealth Management • Total net revenue in the GWM segment was $386 mil. in 2Q16, up 2% sequentially & 12% Y/Y • Brokerage revenue declined less than 1% sequentially but increased 8% Y/Y • Asset management revenue was flat sequentially & increased 21% Y/Y • Net interest income increased 5% sequentially & 45% Y/Y • 2,838 total FAs* • $237.5 bil. in client AUA* • Compensation ratio was 56.6% down 170 bps sequentially & 50 bps Y/Y • Non-comp. ratio was 16.2% down 90 bps sequentially but up 70 bps Y/Y • Pre-tax margin was 27.2% up 260 bps sequentially but down 20 bps Y/Y. * Total FA and client AUA are as of 6/30/2016. Included in these figures are 540
independent contractor FAs and $11.5 bil. of AUA, that
were part of the legacy Sterne
Agee business sold to INTL FCStone
on July 1, 2016
-$50
$0
$50
$100
$150
$200
$250
$300
$350
$400
$450
2Q15
3Q15
4Q15
1Q16
2Q16
Brokerage
Asset Management & Service Fees
Net Interest
Investment Banking
Other
GWM Core Net Revenue (mil.)
23.0%
23.5%
24.0%
24.5%
25.0%
25.5%
26.0%
26.5%
27.0%
27.5%
28.0%
0.0%
10.0%
20.0%
30.0%
40.0%
50.0%
60.0%
70.0%
80.0%
2Q15
3Q15
4Q15
1Q16
2Q16
Comp. Ratio
Non-comp. Ratio
Pre-tax Margin
Core Expense Ratios & Pre-Tax Margin
32 |
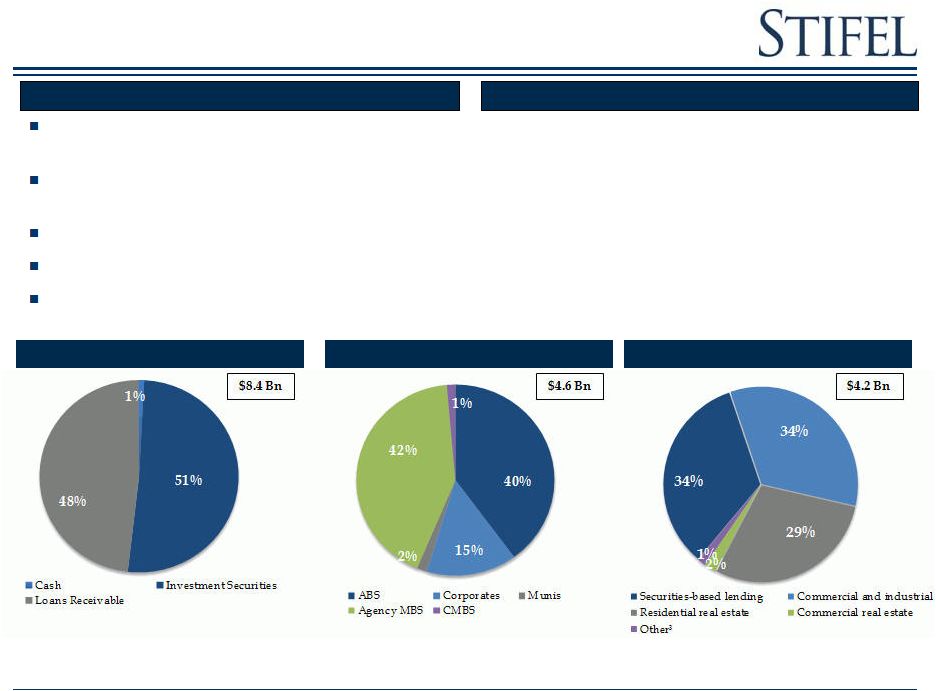
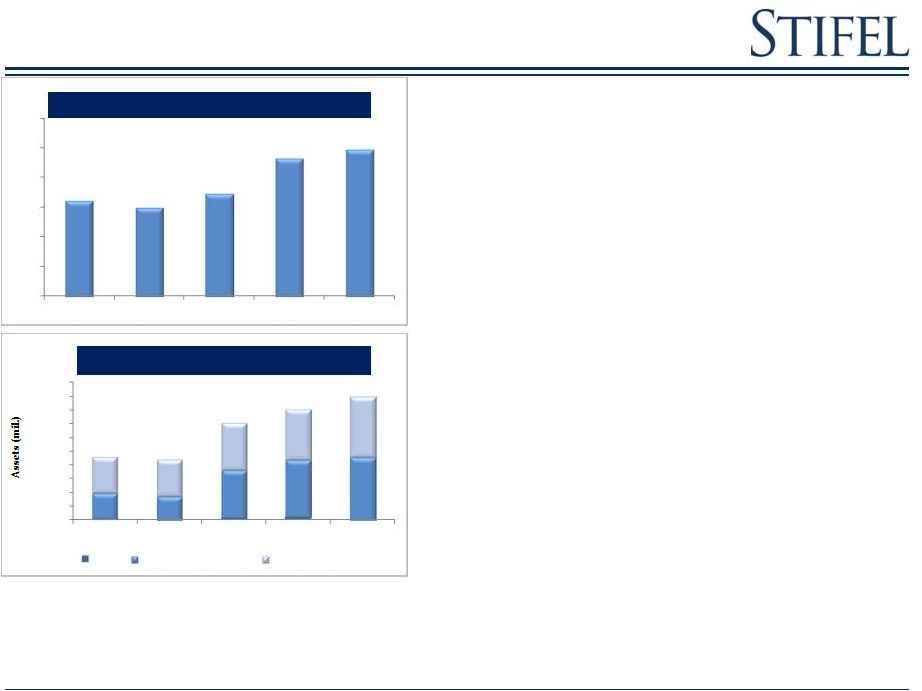 Stifel Bank & Trust • Total net revenue at Stifel Bank & Trust was $56 mil. in 2Q16 was up 5% sequentially & 36% Y/Y • Total bank loans of $4.6 bil. increased 23% sequentially & 75% Y/Y • Total investment securities of $4.6 bil. increased 10% sequentially & 140% Y/Y • NIM of 2.36% was down 12 bps sequentially & 16 bps Y/Y • Allowance for loan losses as a percentage of loans 0.86% of total loans vs. 0.94% in 1Q16 $0.0 $10.0 $20.0 $30.0 $40.0 $50.0 $60.0 2Q15 3Q15 4Q15 1Q16 2Q16 $0 $1,000 $2,000 $3,000 $4,000 $5,000 $6,000 $7,000 $8,000 $9,000 $10,000 2Q15 3Q15 4Q15 1Q16 2Q16 Cash Investment Securities Bank Loans Net Revenue (mil.) Asset Growth 33 |
 Institutional Group Core Expense Ratios & Pre-Tax Margin • Total net revenue of $261 mil. in 2Q16 increased 8% sequentially & 1% Y/Y • Investment banking revenue of $124 mil. increased 34% sequentially but declined 15% Y/Y • Advisory revenue of $68 mil. increased 43% sequentially & 7% Y/Y • Brokerage revenue of $136 mil. decreased 7% sequentially but increased 23% Y/Y • Compensation ratio was 58.8% down 360 bps sequentially & 310 bps Y/Y • Non-comp. ratio was 25.0% down 50 bps sequentially but up 310 bps Y/Y • Pre-tax margin was 16.2% up 410 bps sequentially but flat Y/Y. 34 |
 Institutional Brokerage & Investment Banking Equity & Fixed Income Brokerage Net Revenue Investment Banking Net Revenue • Brokerage revenue in 2Q16 was $136 mil. • Equity brokerage revenue of $55 mil. was down 12% sequentially & 6% Y/Y • Fixed income brokerage revenue of $81 mil. was down 3% sequentially but increased 57% Y/Y • Advisory revenue of $68 mil. increased 43% sequentially & 7% Y/Y • Underwriting revenue of $56 mil. increased 25% sequentially but declined 32% Y/Y • Equity underwriting of $27 mil. increased 43% sequentially but declined 46% Y/Y • Fixed income underwriting of $29 mil. increased 12% sequentially but declined 12% Y/Y 35 |
 GAAP to Non-GAAP Reconciliation GAAP Results (000s) 06/30/16 03/31/16 Total GAAP Compensation & benefits expense 460,023 $ 411,113 $ GAAP comp. ratio 70.5% 66.3% Total GAAP non-compensation expense 176,328 $ 164,948 $ GAAP non-comp. ratio 27.0% 26.6% GAAP pre-tax margin 1.5% 4.4% Three months ended Adjusted Results (000s) 06/30/16 03/31/16 Total Adjusted Compensation & benefits expense 409,887 $ 394,684 $ Adjusted comp. ratio 62.8% 63.6% Total adjusted non-compensation expense 157,974 $ 154,829 $ Adjusted non-comp. ratio 24.2% 25.0% Adjusted pre-tax margin 12.9% 11.4% Three months ended (000s) 06/30/16 03/31/16 GAAP net income 9,772 $ 27,054 $ Duplicative expenses: Compensation & benefits 3,354 5,151 Non-compensation operating expenses 11,378 8,134 Acquistion-related expenses: Compensation & benefits 10,806 11,278 Non-compensation operating expenses 1,297 1,424 Stock-based compensation expense 35,976 - Amortization of intangible assets 5,854 709 Total adjustments: Compensation & benefits 50,136 16,429 Non-compensation operating expenses 18,529 10,267 Total non-GAAP adjustments 68,665 26,696 Provision for income tax 26,145 10,397 Non-GAAP net income 52,292 $ 43,353 $ Total Adjusted Compensation & benefits expense 410,500 $ 394,684 $ Adjusted comp. ratio 62.9% 63.6% Total adjusted non-compensation expense 157,800 $ 154,828 $ Adjusted non-comp. ratio 24.2% 25.0% Adjusted pre-tax margin 12.9% 11.4% Three months ended 36 |
  Balance Sheet & Capital Return • Balance Sheet: • Total assets increased to $15.4 bil. in 2Q16, up 7% sequentially & 50% Y/Y • Average interest earning assets increased to $11.4 bil. up 8% sequentially & 63% Y/Y • NIM decreased to 171 bps , down 15 bps sequentially & 23 bps Y/Y. • Tier 1 leverage ratio was 11.5% in 2Q16 down 10 bps sequentially • Tier 1 risk based capital ratio of 20.9% in 2Q16 was down 40 bps sequentially • Book value per share was $37.41 • Share Repurchases • The firm repurchased 125K shares in 2Q16 and has repurchased 475K to date in 3Q16 • 7.6 mil. shares remaining on current authorization. Net Interest Income Drivers 2Q15 3Q15 4Q15 1Q16 2Q16 Total Assets $10,140 $9,359 $13,326 $14,214 $15,386 Total Equity $2,520 $2,493 $2,492 $2,417 $2,491 Debt to Equity 21.2% 21.4% 33.4% 34.1% 32.4% Tier 1 Leverage Ratio 18.3% 16.4% 16.6% 11.6% 11.5% Tier 1 Risk Based Capital Ratio 29.4% 29.4% 26.3% 21.3% 20.9% Capital Structure (in millions, except ratios) 37 |