Attached files
| file | filename |
|---|---|
| 8-K - 8-K - CarParts.com, Inc. | a16-16317_18k.htm |
Exhibit 99.1
Investor Presentation NASDAQ: PRTS August 2016

Safe Harbor 1 This presentation contains “forward-looking” statements, within the meaning of the federal securities laws, that are based on our management’s beliefs and assumptions and on information currently available to management. Forward-looking statements include information concerning our possible or assumed future results of operations, expected growth and business strategies, key operating metrics, financing plans, competitive position, industry environment, potential product offerings, potential market and growth opportunities and the effects of competition. Forward-looking statements include all statements that are not historical facts and can be identified by terms such as “anticipates,” “believes,” “could,” “seeks,” “estimates,” “intends,” “may,” “plans,” “potential,” “predicts,” “projects,” “should,” “will,” “would” or similar expressions and the negatives of those terms. Forward-looking statements involve known and unknown risks, uncertainties and other factors that may cause our actual results, performance or achievements to be materially different from any future results, performance or achievements expressed or implied by the forward-looking statements. Forward-looking statements represent our management’s beliefs and assumptions only as of the date of this presentation. These statements do not guarantee future performance and speak only as of the date hereof, and qualify for the safe harbor provided by Section 21E of the Securities Exchange Act of 1934, as amended, and Section 27A of the Securities Act of 1933. We refer all of you to the disclosures contained in the U.S. Auto Parts Annual Report on Form 10-K, Quarterly Reports on Form 10-Q and Current Reports on Form 8-K filed with the Securities and Exchange Commission, including the risk factors set forth therein, for more detailed discussion on the factors that can cause actual results to differ materially from those projected in any forward-looking statements. Except as required by law, we assume no obligation to update these forward-looking statements publicly, or to update the reasons actual results could differ materially from those anticipated in the forward-looking statements, even if new information becomes available in the future. This presentation includes certain non-GAAP financial measures as defined by SEC rules. We have provided a reconciliation of those measures to the most directly comparable GAAP measures in this presentation, where applicable, as well as in the appendix to this presentation. All financial measures in this presentation refer solely to the Company’s core auto parts operating segment (“Base USAP”) and exclude the AutoMD operating segment (“AutoMD”), an online automotive repair information source of which we are a majority stockholder, unless otherwise specified on a consolidated basis. Copyright @ 2016 U.S. Auto Parts Network, Inc. All rights reserved
Company Overview US Auto Parts is a leading pure-play internet retailer of aftermarket auto parts We operate online sites, marketplaces and wholesale channels focused on the do-it-yourself (DIY) customer Offer over 1 million SKUs of high quality private label and branded aftermarket products Reach ~10 million online customers per month through our well-established network of websites 2 A Value Leader in Aftermarket Auto Parts
How have we been performing We experienced positive Y/Y traffic growth in the 2nd quarter and that trend is continuing in the 3rd quarter Our private label business continued its strong growth Gross Margin continued to expand above 30%, driven by higher product mix of private label SKUs Adjusted EBITDA for the 2nd quarter came in at $4.0M, up 129% Y/Y and Adjusted EBITDA margin increased 290 basis points to 5.2% Our TTM Q2-16 Adjusted EBITDA is now $13.8M, up over 92% from this time last year We completely eliminated our revolver debt and experienced a $9M swing in our net cash position over last year We are increasing Adjusted EBITDA guidance to range between $13M and $15M, up from $11.5M to $14M 3 Non-GAAP financial measure EBITDA consists of net income before (a) interest expense, net; (b) income tax provisions; (c) amortization of intangible assets; (d) depreciation and amortization. See Appendix for a reconciliation of Adjusted EBITDA to net income
Price & Product Availability: The Two Most Important Factors for DIY Customers Customer Value Proposition 4 Source: Aftermarket Business World, Feb 2014 Low Cost Products Cost-conscious customers are able to purchase over 55,000 products at a significant cost savings because we are able to identify high demand SKUs and source them from one of 350+ reputable factories in Asia; over 60% of USAP unit sales are private label Product Warranties We provide a limited warranty for all products sold including a full parts replacement User-Friendly Websites Customers shop websites designed specifically for the auto parts segment driven by our complex catalogs allowing customers to quickly identify SKUs required and build complete jobs Over 1M SKUs Customers have one-stop shopping on over 1 million products across all major categories for auto parts: Collision, Engine/Under Car, and Performance and Accessories
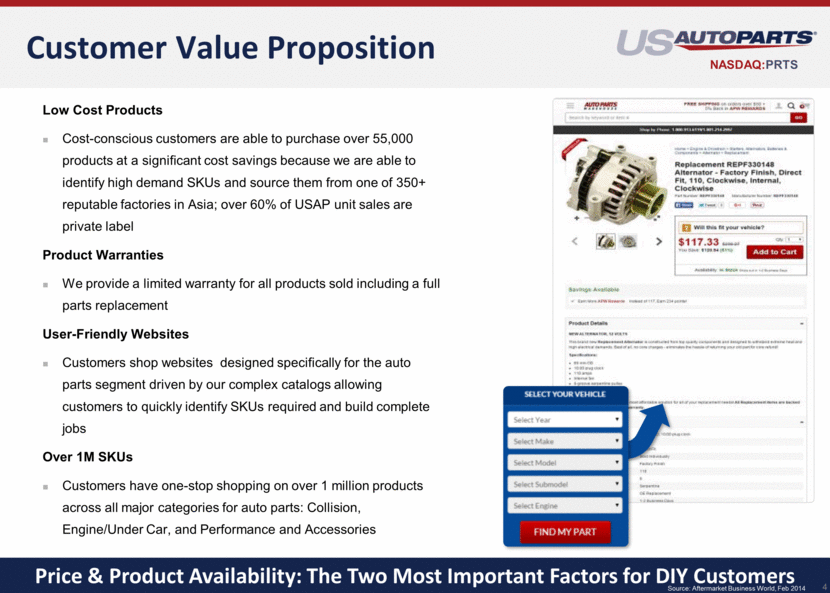
Aftermarket Auto Parts Sales Benefits From Macro Trends 5 Source: Miles Traveled – U.S. Department of Transportation; Gas Prices – U.S. Energy Information Administration. IHS Lower Gas Prices Result in Increased Auto Miles Traveled Average Age of Light Vehicles on the Road Continues to Increase 10.0 10.1 10.3 10.6 10.9 11.0 11.2 11.4 11.5 11.5 11.5 11.5 11.5 11.6 8 9 10 11 12 4.1% 5.1% 6.3% 3.5% 5.4% 3.5% 5.0% 5.1% 1.4% 5.0% 4.5% 1.8% 1.6% $1.50 $1.70 $1.90 $2.10 $2.30 $2.50 $2.70 $2.90 0.0% 1.0% 2.0% 3.0% 4.0% 5.0% 6.0% 7.0% 8.0% May - 15 Jun - 15 Jul - 15 Aug - 15 Sep - 15 Oct - 15 Nov - 15 Dec - 15 Jan - 16 Feb - 16 Mar - 16 Apr - 16 May - 16 Avg.Gas Price Per Gallon Vehicle Miles Traveled (Y/Y Change) Mile Traveled Growth Average Gas Price
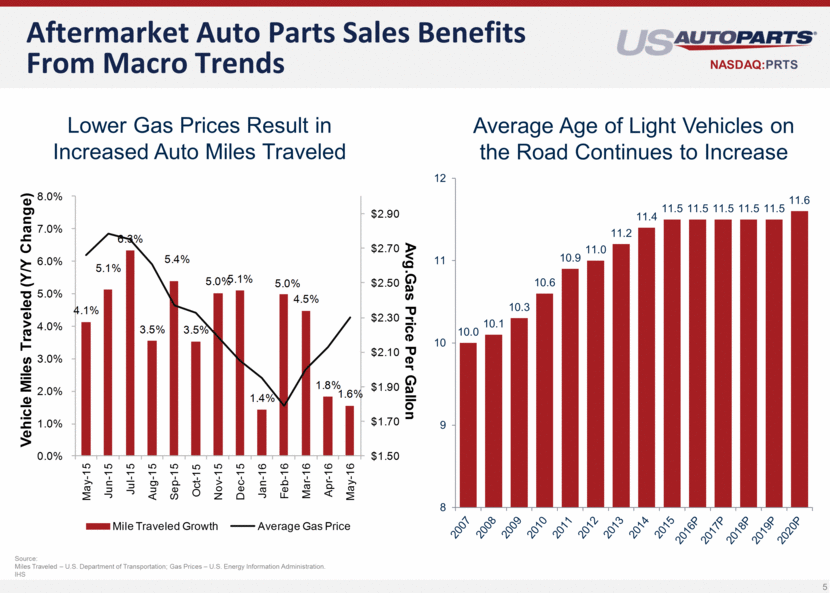
Online Adoption of Aftermarket Auto Parts has Favorable Trends 6 Increased online/mobile adoption, strong search demand for automotive related searches Drivers are increasingly relying on Google to search for parts and service information Source: : Google Relative Google Volume Queries Increased in all Automotive Categories
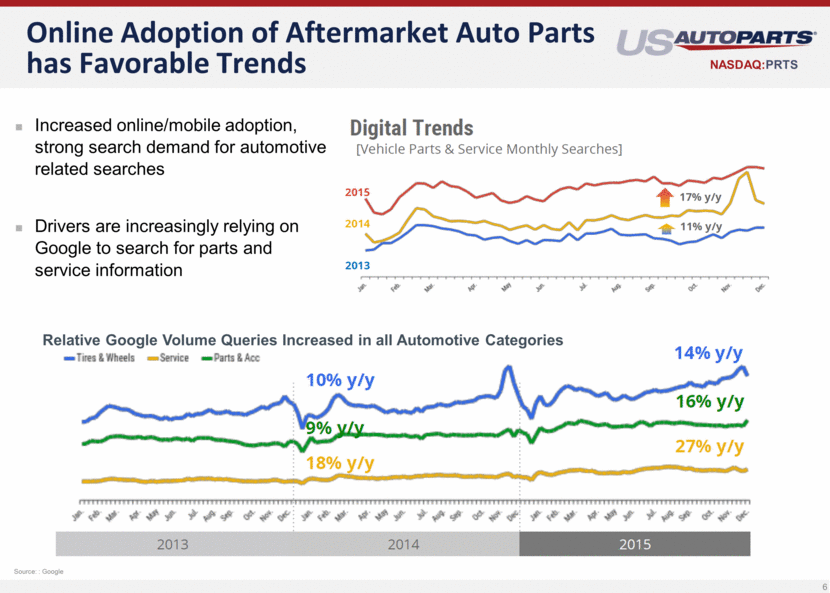
Online DIY Market is Growing Faster than Brick and Mortar 7 2012 – 2020P Online CAGR: 20.2% DIY Online Penetration The online portion of the DIY market is expected to double in the next four year1 Management estimates by 2020 Online DIY could reach 22% of the total DIY Market (1) Based on management assumptions and projections 2012 – 2020P Brick & Mortar CAGR: 1.8% $42.5 $43.3 $44.4 $45.3 $46.1 $46.8 $47.2 $48.1 $48.9 $3.2 $3.8 $4.6 $5.5 $6.7 $8.0 $9.7 $11.6 $13.9 $45.7 $47.2 $48.8 $51.0 $53.5 $55.1 $56.9 $59.7 $62.8 $30 $35 $40 $45 $50 $55 $60 $65 $70 2012 2013 2014 2015 2016P 2017P 2018P 2019P 2020P Revenue (in Billions) Offline Online
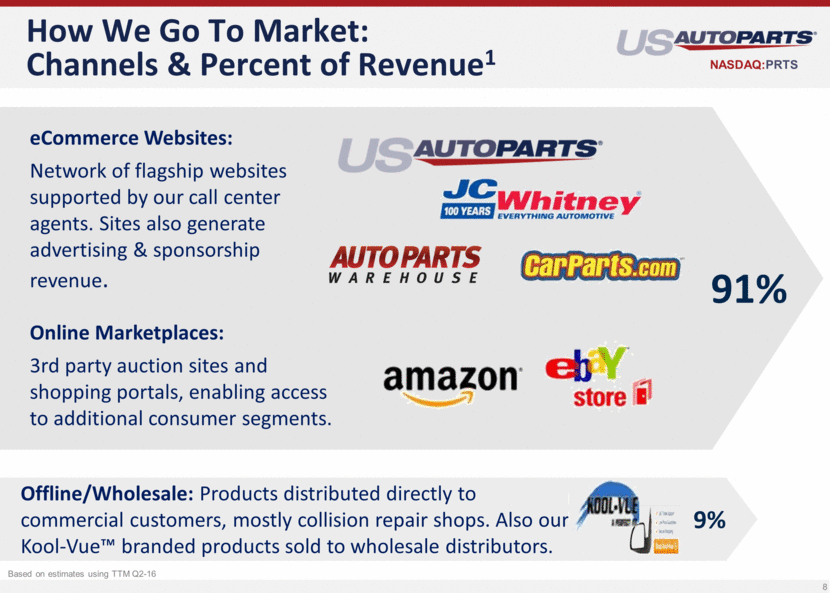
How We Go To Market: Channels & Percent of Revenue1 8 91% Offline/Wholesale: Products distributed directly to commercial customers, mostly collision repair shops. Also our Kool-Vue™ branded products sold to wholesale distributors. 9% Based on estimates using TTM Q2-16 eCommerce Websites: Network of flagship websites supported by our call center agents. Sites also generate advertising & sponsorship revenue. Online Marketplaces: 3rd party auction sites and shopping portals, enabling access to additional consumer segments.
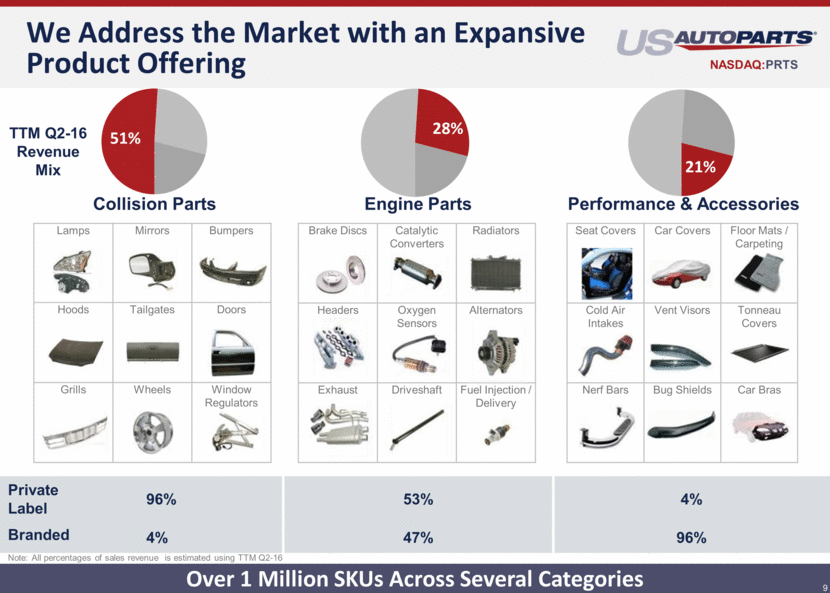
We Address the Market with an Expansive Product Offering Over 1 Million SKUs Across Several Categories 9 Brake Discs Catalytic Converters Radiators Headers Oxygen Sensors Alternators Exhaust Driveshaft Fuel Injection / Delivery Lamps Mirrors Bumpers Hoods Tailgates Doors Grills Wheels Window Regulators Seat Covers Car Covers Floor Mats / Carpeting Cold Air Intakes Vent Visors Tonneau Covers Nerf Bars Bug Shields Car Bras Collision Parts Engine Parts Performance & Accessories TTM Q2-16 Revenue Mix Private Label 96% 53% 4% Branded 4% 47% 96% Note: All percentages of sales revenue is estimated using TTM Q2-16 This image cannot currently be displayed. 51% 28% 21%
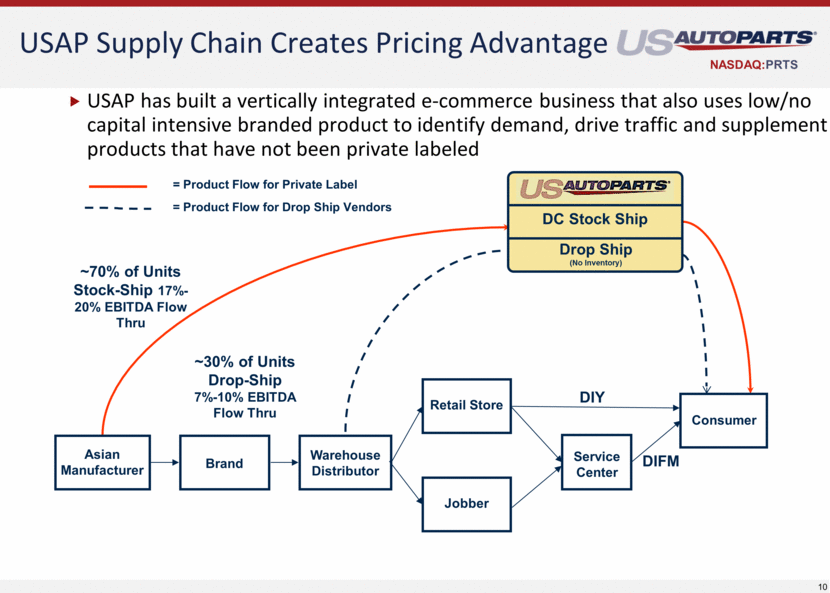
USAP Supply Chain Creates Pricing Advantage 10 USAP has built a vertically integrated e-commerce business that also uses low/no capital intensive branded product to identify demand, drive traffic and supplement products that have not been private labeled Importer Auto Service Center Brand Warehouse Distributor Service Center Consumer Retail Store Consumer Asian Manufacturer ~30% of Units Drop-Ship 7%-10% EBITDA Flow Thru Jobber ~70% of Units Stock-Ship 17%-20% EBITDA Flow Thru DIY DIFM = Product Flow for Private Label = Product Flow for Drop Ship Vendors DC Stock Ship Drop Ship (No Inventory)
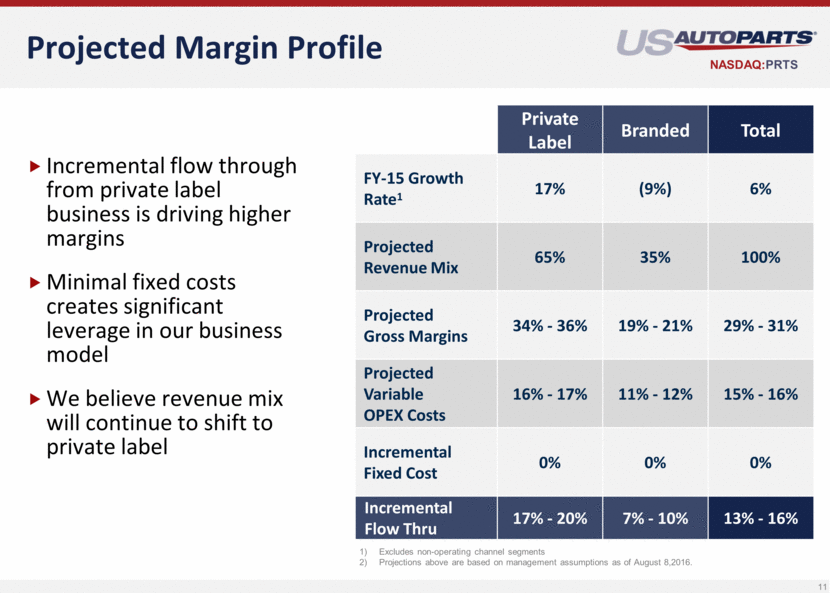
Private Label Branded Total FY-15 Growth Rate1 17% (9%) 6% Projected Revenue Mix 65% 35% 100% Projected Gross Margins 34% - 36% 19% - 21% 29% - 31% Projected Variable OPEX Costs 16% - 17% 11% - 12% 15% - 16% Incremental Fixed Cost 0% 0% 0% Incremental Flow Thru 17% - 20% 7% - 10% 13% - 16% Projected Margin Profile Incremental flow through from private label business is driving higher margins Minimal fixed costs creates significant leverage in our business model We believe revenue mix will continue to shift to private label 11 Excludes non-operating channel segments Projections above are based on management assumptions as of August 8,2016.
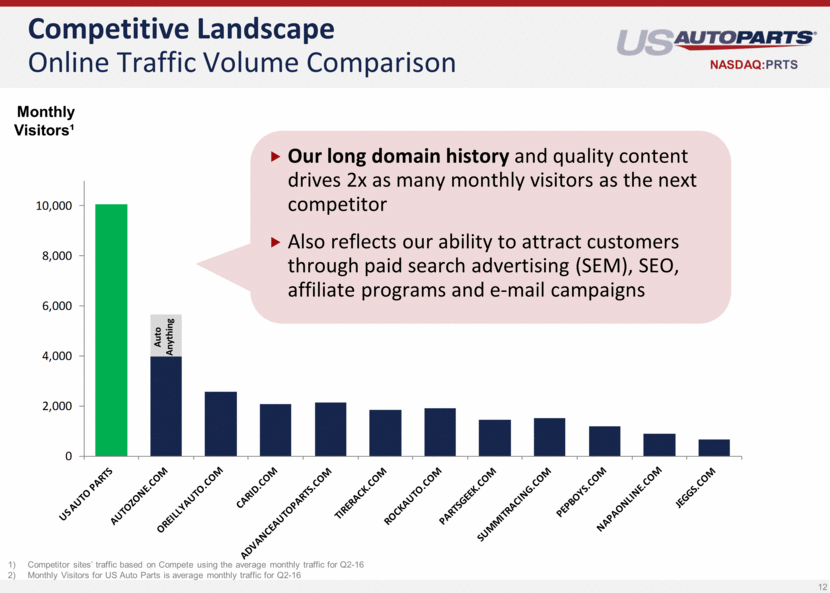
Competitive Landscape Online Traffic Volume Comparison 12 Monthly Visitors¹ Competitor sites’ traffic based on Compete using the average monthly traffic for Q2-16 Monthly Visitors for US Auto Parts is average monthly traffic for Q2-16 Our long domain history and quality content drives 2x as many monthly visitors as the next competitor Also reflects our ability to attract customers through paid search advertising (SEM), SEO, affiliate programs and e-mail campaigns Auto Anything 0 2,000 4,000 6,000 8,000 10,000
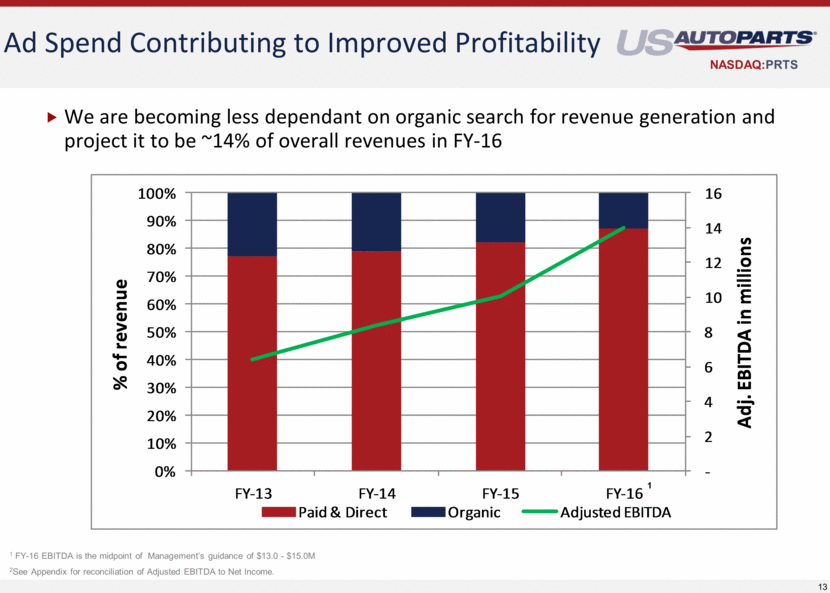
Ad Spend Contributing to Improved Profitability 13 We are becoming less dependant on organic search for revenue generation and project it to be ~14% of overall revenues in FY-16 Center 1 1 FY-16 EBITDA is the midpoint of Management’s guidance of $13.0 - $15.0M 2See Appendix for reconciliation of Adjusted EBITDA to Net Income. - 2 4 6 8 10 12 14 16 0% 10% 20% 30% 40% 50% 60% 70% 80% 90% 100% FY - 13 FY - 14 FY - 15 FY - 16 Adj. EBITDA in millions % of revenue Paid & Direct Organic Adjusted EBITDA
14 Financial Highlights
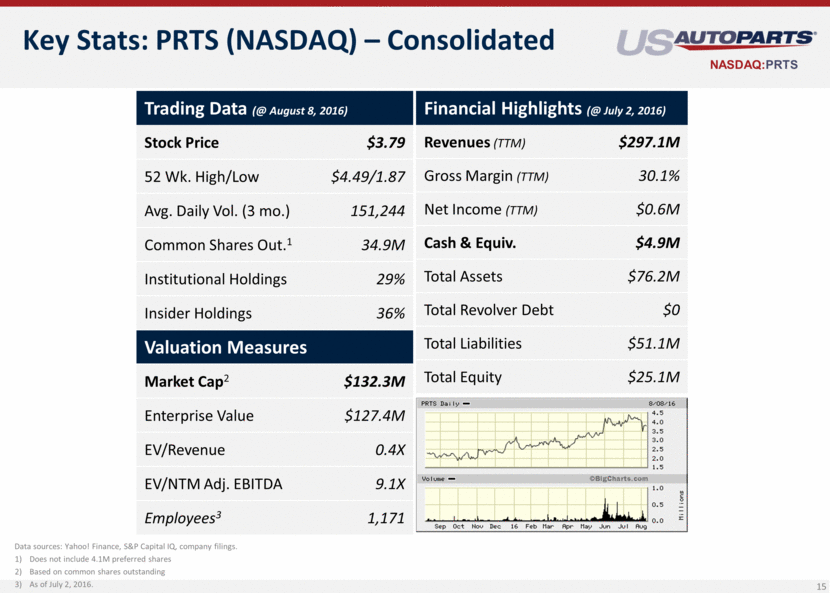
Key Stats: PRTS (NASDAQ) – Consolidated 15 Data sources: Yahoo! Finance, S&P Capital IQ, company filings. Does not include 4.1M preferred shares Based on common shares outstanding As of July 2, 2016. Trading Data (@ August 8, 2016) Stock Price $3.79 52 Wk. High/Low $4.49/1.87 Avg. Daily Vol. (3 mo.) 151,244 Common Shares Out.1 34.9M Institutional Holdings 29% Insider Holdings 36% Valuation Measures Market Cap2 $132.3M Enterprise Value $127.4M EV/Revenue 0.4X EV/NTM Adj. EBITDA 9.1X Employees3 1,171 Financial Highlights (@ July 2, 2016) Revenues (TTM) $297.1M Gross Margin (TTM) 30.1% Net Income (TTM) $0.6M Cash & Equiv. $4.9M Total Assets $76.2M Total Revolver Debt $0 Total Liabilities $51.1M Total Equity $25.1M
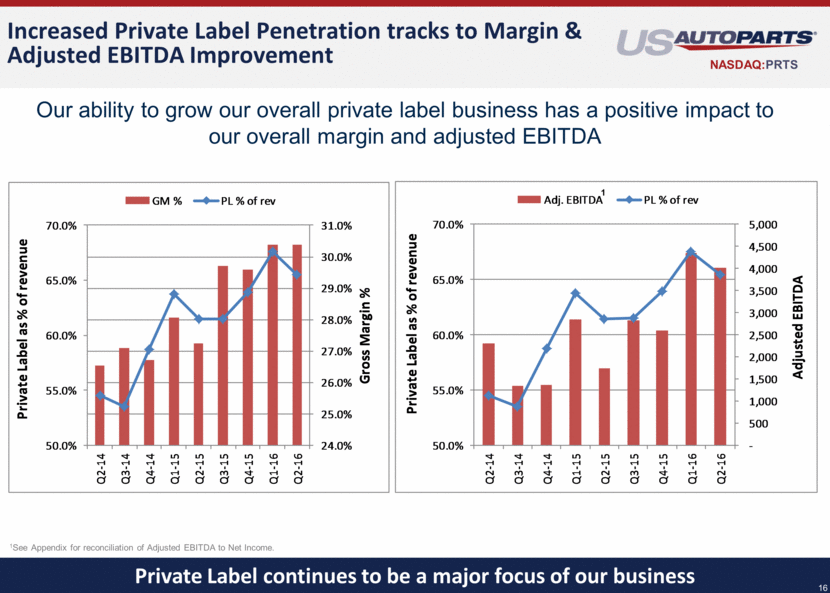
Increased Private Label Penetration tracks to Margin & Adjusted EBITDA Improvement 16 Private Label continues to be a major focus of our business Our ability to grow our overall private label business has a positive impact to our overall margin and adjusted EBITDA 1See Appendix for reconciliation of Adjusted EBITDA to Net Income. 1 16 50.0% 55.0% 60.0% 65.0% 70.0% Q2-14 Q3-14 Q4-14 Q1-15 Q2-15 Q3-15 Q4-15 Q1-16 Q2-16 24.0% 25.0% 26.0% 27.0% 28.0% 29.0% 30.0% 31.0% Private Label as % of revenue Gross Margin % GM % PL % of rev - 500 1,000 1,500 2,000 2,500 3,000 3,500 4,000 4,500 5,000 50.0% 55.0% 60.0% 65.0% 70.0% Q2-14 Q3-14 Q4-14 Q1-15 Q2-15 Q3-15 Q4-15 Q1-16 Q2-16 Adjusted EBITDA Private Label as % of revenue Adj. EBITDA PL % of rev
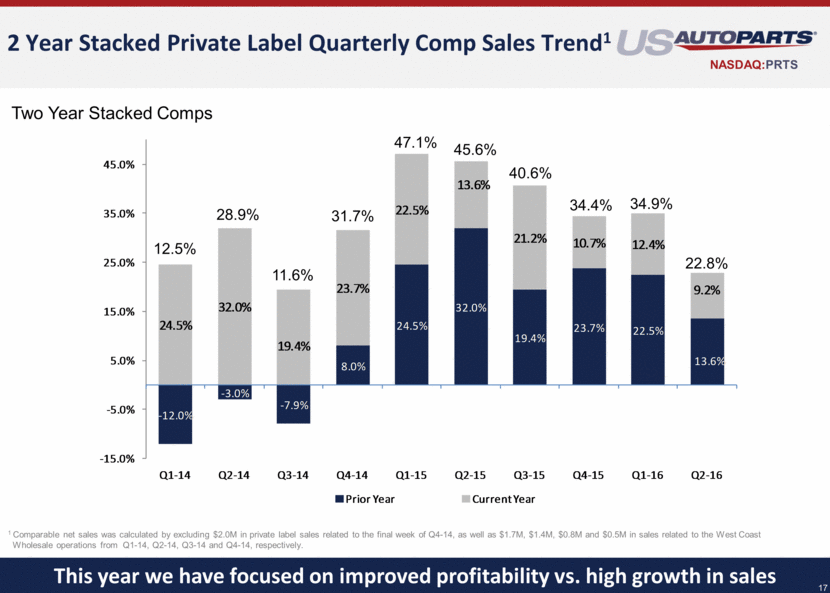
2 Year Stacked Private Label Quarterly Comp Sales Trend1 17 1 Comparable net sales was calculated by excluding $2.0M in private label sales related to the final week of Q4-14, as well as $1.7M, $1.4M, $0.8M and $0.5M in sales related to the West Coast 0Wholesale operations from Q1-14, Q2-14, Q3-14 and Q4-14, respectively. Two Year Stacked Comps 12.5% 28.9% 11.6% 31.7% 47.1% 45.6% 40.6% 34.4% 34.9% 22.8% This year we have focused on improved profitability vs. high growth in sales 17 - 12.0% - 3.0% - 7.9% 8.0% 24.5% 32.0% 19.4% 23.7% 22.5% 13.6% 24.5% 32.0% 19.4% 23.7% 22.5% 13.6% 21.2% 10.7% 12.4% 9.2% - 15.0% - 5.0% 5.0% 15.0% 25.0% 35.0% 45.0% Q1 - 14 Q2 - 14 Q3 - 14 Q4 - 14 Q1 - 15 Q2 - 15 Q3 - 15 Q4 - 15 Q1 - 16 Q2 - 16 Prior Year Current Year
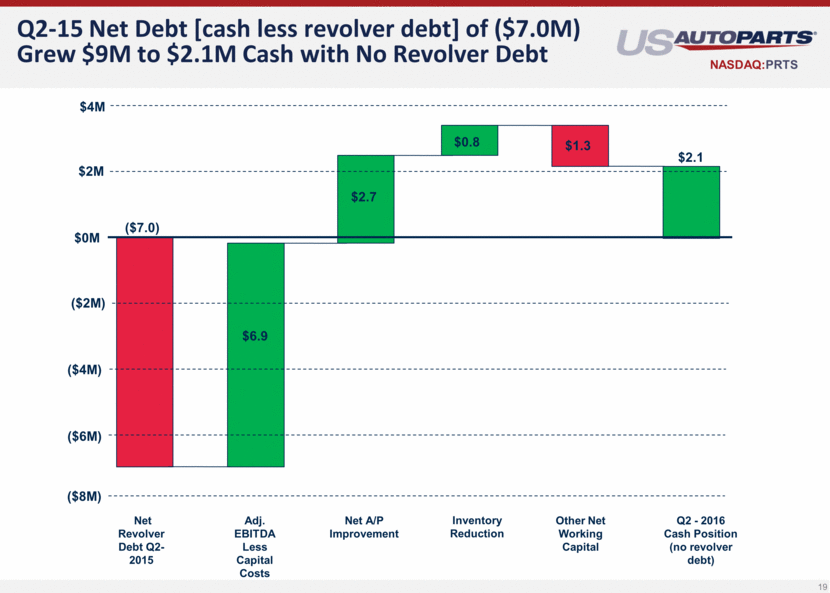
Financial Highlights – Q2-16 Total revenue $78.0M Total sales up 2.1% Gross Margin expansion of 320 basis points over prior year Adjusted EBITDA was 5.2% of net sales or $4.0M . A 129% increase over prior year Net Income $1.3M vs. net loss of ($0.6M) in the prior year $2M in cash with no borrowings on our revolver debt vs. $1.0M in cash and borrowings on our revolver debt of $8.0M last year Unique visitors increased 3% to 30.2 million Added over 2,300 Private Label SKUs during the quarter 18 Non-GAAP financial measure EBITDA consists of net income before (a) interest expense, net; (b) income tax provisions; (c) amortization of intangible assets; (d) depreciation and amortization. See Appendix for a reconciliation of Adjusted EBITDA to net income

Q2-15 Net Debt [cash less revolver debt] of ($7.0M) Grew $9M to $2.1M Cash with No Revolver Debt 19 Net Revolver Debt Q2-2015 Adj. EBITDA Less Capital Costs Net A/P Improvement Inventory Reduction Other Net Working Capital Q2 - 2016 Cash Position (no revolver debt) $6.9 $2.7 $0.8 $1.3 $2.1 ($7.0) ($2M) ($6M) ($4M) $2M $0M ($8M) $4M
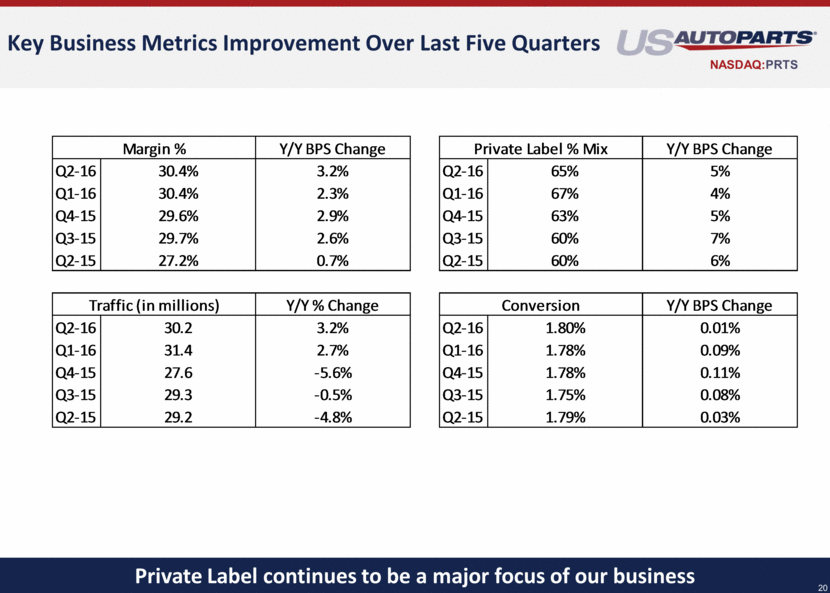
Key Business Metrics Improvement Over Last Five Quarters 20 Private Label continues to be a major focus of our business 20 Y/Y BPS Change Y/Y BPS Change Q2-16 30.4% 3.2% Q2-16 65% 5% Q1-16 30.4% 2.3% Q1-16 67% 4% Q4-15 29.6% 2.9% Q4-15 63% 5% Q3-15 29.7% 2.6% Q3-15 60% 7% Q2-15 27.2% 0.7% Q2-15 60% 6% Y/Y % Change Y/Y BPS Change Q2-16 30.2 3.2% Q2-16 1.80% 0.01% Q1-16 31.4 2.7% Q1-16 1.78% 0.09% Q4-15 27.6 -5.6% Q4-15 1.78% 0.11% Q3-15 29.3 -0.5% Q3-15 1.75% 0.08% Q2-15 29.2 -4.8% Q2-15 1.79% 0.03% Traffic (in millions) Margin % Private Label % Mix Conversion
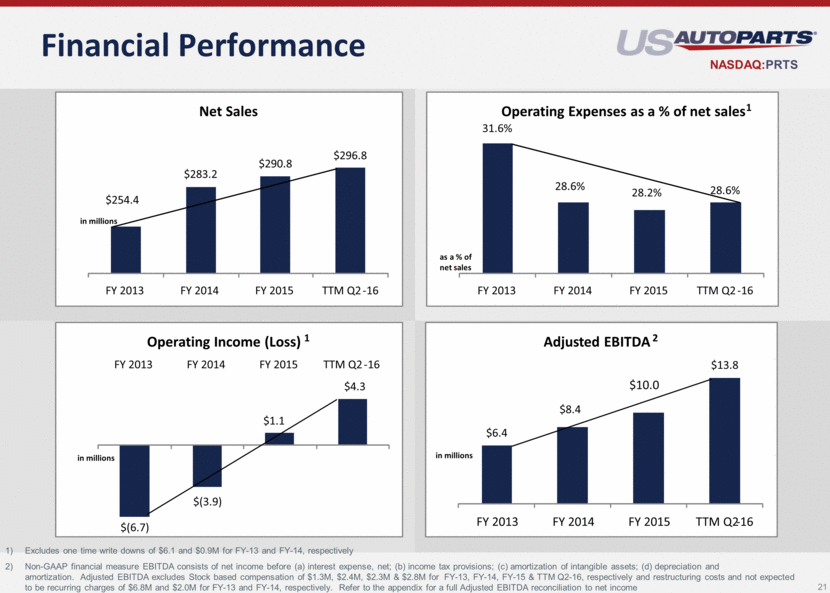
Financial Performance 21 Excludes one time write downs of $6.1 and $0.9M for FY-13 and FY-14, respectively Non-GAAP financial measure EBITDA consists of net income before (a) interest expense, net; (b) income tax provisions; (c) amortization of intangible assets; (d) depreciation and amortization. Adjusted EBITDA excludes Stock based compensation of $1.3M, $2.4M, $2.3M & $2.8M for FY-13, FY-14, FY-15 & TTM Q2-16, respectively and restructuring costs and not expected to be recurring charges of $6.8M and $2.0M for FY-13 and FY-14, respectively. Refer to the appendix for a full Adjusted EBITDA reconciliation to net income $254.4 $283.2 $290.8 $296.8 FY 2013 FY 2014 FY 2015 TTM Q2 - 16 in millions Net Sales 31.6% 28.6% 28.2% 28.6% FY 2013 FY 2014 FY 2015 TTM Q2 - 16 as a % of net sales Operating Expenses as a % of net sales 1 $(6.7) $(3.9) $1.1 $4.3 FY 2013 FY 2014 FY 2015 TTM Q2 - 16 in millions Operating Income (Loss) 1 $6.4 $8.4 $10.0 $13.8 FY 2013 FY 2014 FY 2015 TTM Q2 - 16 in millions Adjusted EBITDA 2
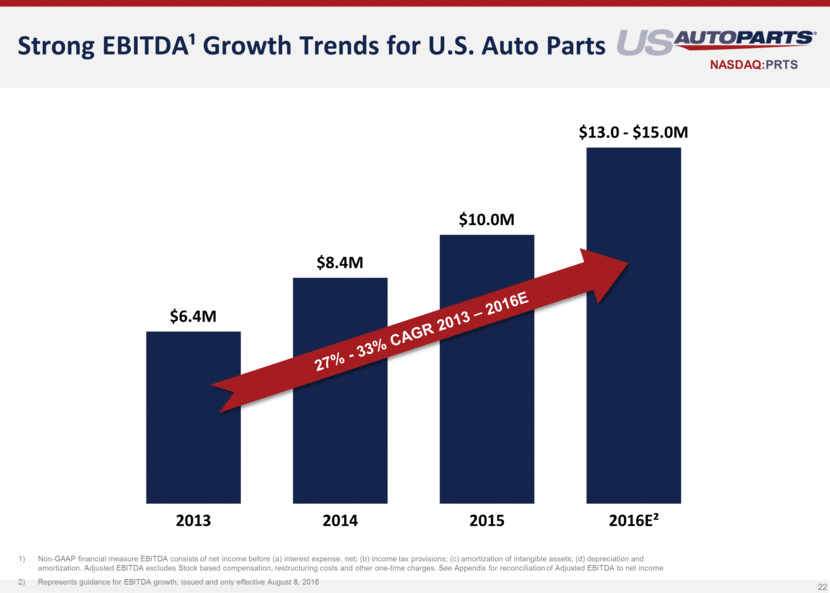
Strong EBITDA¹ Growth Trends for U.S. Auto Parts 22 Non-GAAP financial measure EBITDA consists of net income before (a) interest expense, net; (b) income tax provisions; (c) amortization of intangible assets; (d) depreciation and amortization. Adjusted EBITDA excludes Stock based compensation, restructuring costs and other one-time charges. See Appendix for reconciliation of Adjusted EBITDA to net income Represents guidance for EBITDA growth, issued and only effective August 8, 2016 $6.4M $8.4M $10.0M $13.0 - $15.0M 2013 2014 2015 2016E²
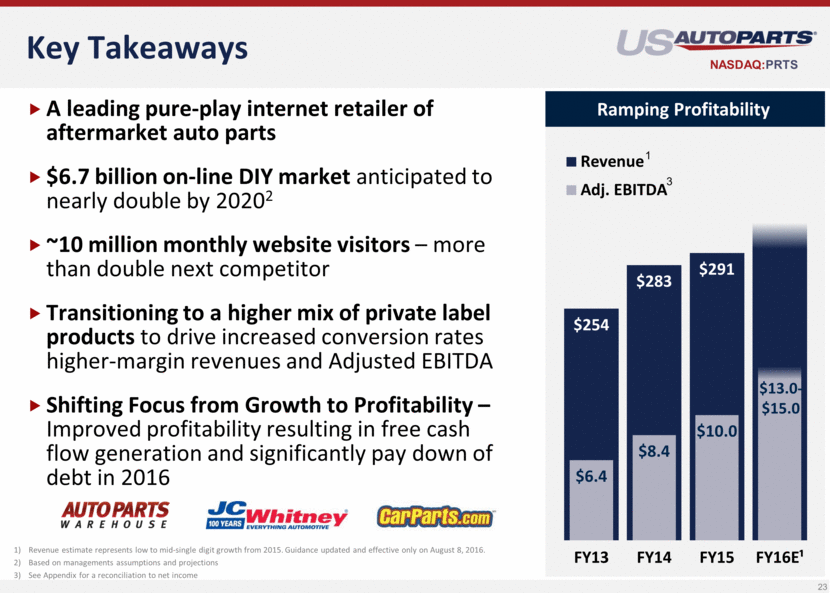
Key Takeaways A leading pure-play internet retailer of aftermarket auto parts $6.7 billion on-line DIY market anticipated to nearly double by 20202 ~10 million monthly website visitors – more than double next competitor Transitioning to a higher mix of private label products to drive increased conversion rates higher-margin revenues and Adjusted EBITDA Shifting Focus from Growth to Profitability – Improved profitability resulting in free cash flow generation and significantly pay down of debt in 2016 23 Ramping Profitability Revenue estimate represents low to mid-single digit growth from 2015. Guidance updated and effective only on August 8, 2016. Based on managements assumptions and projections See Appendix for a reconciliation to net income 3 1 $254 $283 $291 $6.4 $8.4 $10.0 $ 13.0 - $ 15.0 FY13 FY14 FY15 FY16E¹ Revenue Adj. EBITDA
24 APPENDIX
Launched first internet site selling automotive Collision Line Launches a network of sites catered to various consumer segments Company begins significantly expanding its private label engine line JC Whitney completely integrated 1995 2000 2010 2005 2006 2011 Launches AutoMD / Acquires JC Whitney Adds Accessories Line USAP founded to serve local collision shops in Los Angeles IPO (NASDAQ: PRTS) 2007 2008 Acquires PartsBin Adds Engine Line 25 Launched AutoMD IQ / Consolidated websites to focus on Flagship sites 2013 Spun off 36% of AutoMD / Achieved double digit sales growth & positive FCF 2014 Investing in LTV and GMROI / JC Whitney turns 100 years old 2015 Company History
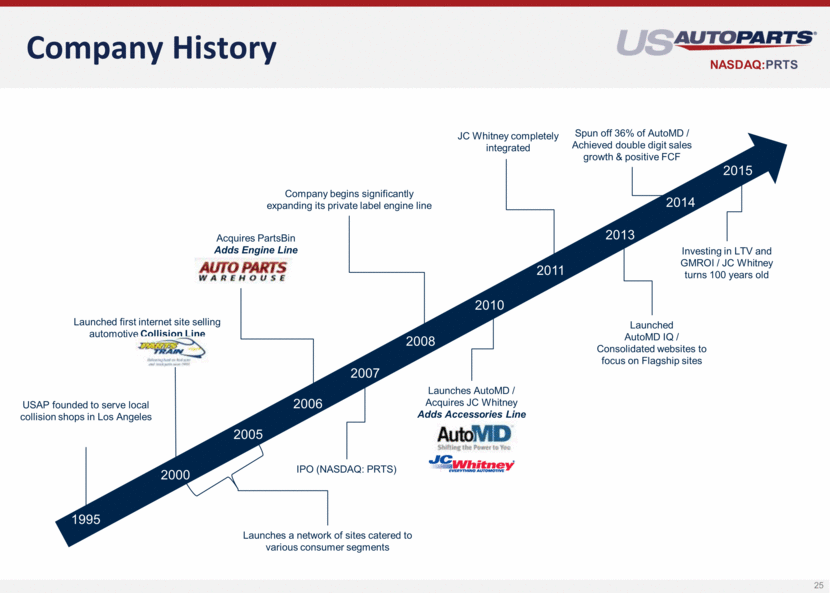
Experienced Leadership Team 26 Aaron E. Coleman Chief Operating Officer Since April 2008 Former Executive Vice President of Operations and CIO from April 2008 - September 2010 Over 18 years of e-commerce experience Senior Vice President – Online Systems at Blockbuster Inc. B.A. degree in Business Administration from Gonzaga University Shane Evangelist Chief Executive Officer Since October 2007 Over 13 years of experience leading internet businesses Senior Vice President and General Manager of Blockbuster Online Vice President of Strategic Planning for Blockbuster Inc. B.A. degree in Business Administration from the University of New Mexico and M.B.A. from Southern Methodist University Neil Watanabe Chief Financial Officer Since March 2015 Over 30 years of finance, accounting and retail experience in both private & public companies Chief Operating Officer of National Stores EVP & Chief Financial Officer – Pet Smart B.A. degree in Social Sciences from the University of California, Los Angeles and CPA certification in Illinois Charles Fischer SVP of Global Procurement Since May 2008 Over 30 years of global sourcing experience Vice President, Supply Chain Management for Keystone Automotive Industries Director, Business Development for Modern Engineering Multiple leadership positions with multiple companies in the automotive aftermarket industry
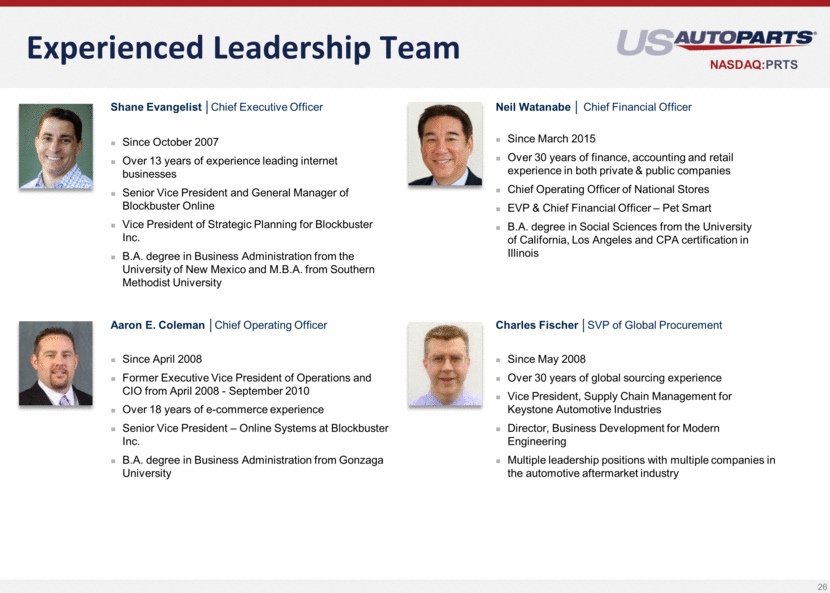
Yearly Adjusted EBITDA Reconciliation 27 Non-GAAP financial measure EBITDA consists of net income before (a) interest expense, net; (b) income tax provisions; (c) amortization of intangible assets; (d) depreciation and amortization. Adjusted EBITDA excludes stock based compensation, restructuring cost, and impairment loss (in thousands) FY-13 52 Weeks Ending December 28, 2013 FY-14 53 Weeks Ending January 2, 2015 FY-15 52 Weeks Ending January 2, 2016 TTM Q2-16 52 Weeks Ending April 2, 2016 Net income (loss) (13,644) $ (4,907) $ (136) $ 3,040 $ Depreciation 10,676 7,230 6,141 6,208 Amortization of intangibles 381 422 431 441 Interest expense, net 972 1,101 1,208 1,161 Taxes 43 137 88 145 EBITDA (1,572) $ 3,983 $ 7,732 $ 10,997 $ Stock comp expense 1,211 2,367 2,297 2,803 Inventory write down related to Carson closure - 897 - - Restructuring Cost 723 1,137 - - Impairment loss on property & equipment 4,832 - - - Impairment loss on intangible assets 1,245 - - - Adjusted EBITDA 6,439 8,384 10,029 13,799
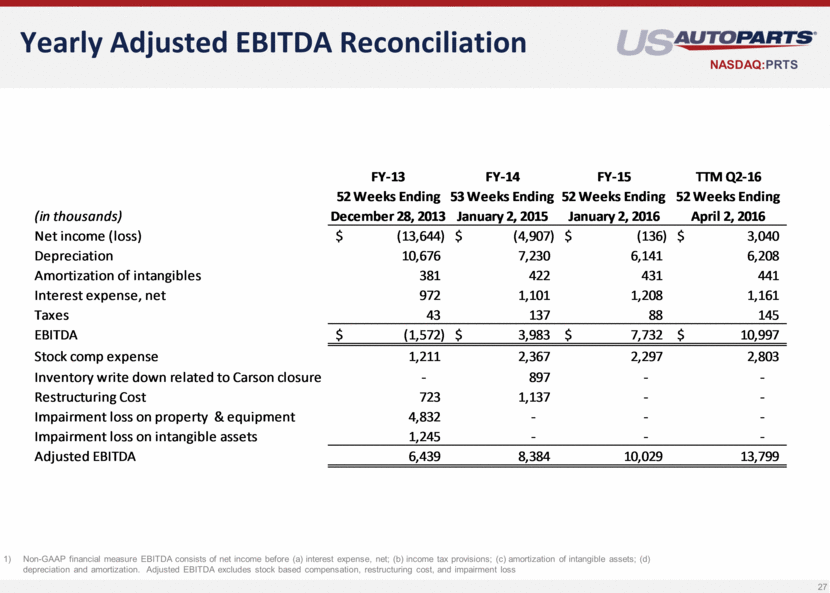
Quarterly Adjusted EBITDA Reconciliation 28 Non-GAAP financial measure EBITDA consists of net income before (a) interest expense, net; (b) income tax provisions; (c) amortization of intangible assets; (d) depreciation and amortization. Adjusted EBITDA excludes stock based compensation, restructuring cost, and impairment loss (in thousands) Q2-14 Q3-14 Q4-14 Q1-15 Q2-15 Q3-15 Q4-15 Q1-16 Q2-16 Net income (loss) (1,619) $ (1,960) $ (2,010) $ 187 $ (611) $ 353 $ (65) $ 1,537 $ 1,216 $ Depreciation 1,817 1,803 1,676 1,549 1,484 1,539 1,570 1,544 1,556 Amortization of intangibles 126 106 106 107 107 107 110 112 113 Interest expense, net 238 283 327 373 272 273 300 346 242 Taxes 21 15 69 158 (69) (22) 21 33 113 EBITDA 583 $ 247 $ 168 $ 2,374 $ 1,183 $ 2,250 $ 1,936 $ 3,572 $ 3,240 $ Stock comp expense 624 682 685 477 574 587 659 772 785 Inventory write down related to Carson closure 478 - 102 - - - - - - Restructuring Cost 625 410 419 - - - - - - Adjusted EBITDA 2,310 1,339 1,374 2,851 1,757 2,837 2,595 4,344 4,025
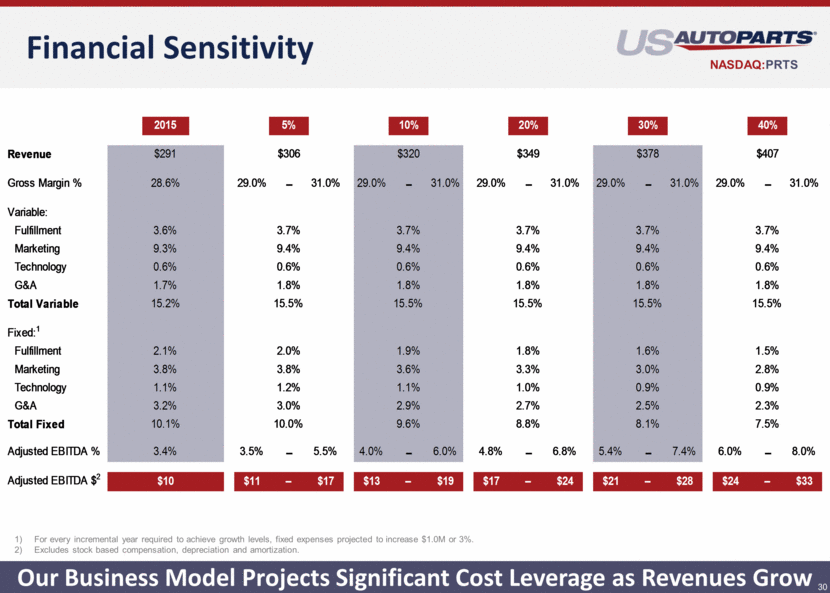
Projected FY-16 Adjusted EBITDA reconciliation 29 Non-GAAP financial measure EBITDA consists of net income before (a) interest expense, net; (b) income tax provisions; (c) amortization of intangible assets; (d) depreciation and amortization. Adjusted EBITDA excludes Stock based compensation (in thousands) Low End 52 Weeks Ending December 31, 2016 High End 52 Weeks Ending December 31, 2016 Net income 1,655 $ 3,655 $ Depreciation 6,349 6,349 Amortization of intangibles 437 437 Interest expense, net 1,099 1,099 Taxes 256 256 EBITDA 9,796 $ 11,796 $ Stock comp expense 3,204 3,204 Adjusted EBITDA 13,000 15,000
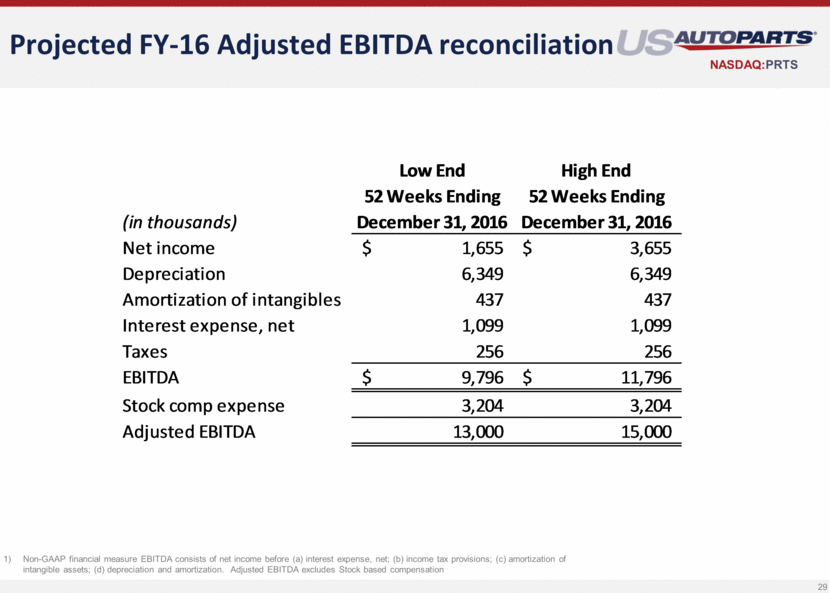
Our Business Model Projects Significant Cost Leverage as Revenues Grow Financial Sensitivity 30 For every incremental year required to achieve growth levels, fixed expenses projected to increase $1.0M or 3%. Excludes stock based compensation, depreciation and amortization. 2015 5% 10% 20% 30% 40% Revenue $291 $306 $320 $349 $378 $407 Gross Margin % 28.6% 29.0% – 31.0% 29.0% – 31.0% 29.0% – 31.0% 29.0% – 31.0% 29.0% – 31.0% Variable: Fulfillment 3.6% 3.7% 3.7% 3.7% 3.7% 3.7% Marketing 9.3% 9.4% 9.4% 9.4% 9.4% 9.4% Technology 0.6% 0.6% 0.6% 0.6% 0.6% 0.6% G&A 1.7% 1.8% 1.8% 1.8% 1.8% 1.8% Total Variable 15.2% 15.5% 15.5% 15.5% 15.5% 15.5% Fixed: 1 Fulfillment 2.1% 2.0% 1.9% 1.8% 1.6% 1.5% Marketing 3.8% 3.8% 3.6% 3.3% 3.0% 2.8% Technology 1.1% 1.2% 1.1% 1.0% 0.9% 0.9% G&A 3.2% 3.0% 2.9% 2.7% 2.5% 2.3% Total Fixed 10.1% 10.0% 9.6% 8.8% 8.1% 7.5% Adjusted EBITDA % 3.4% 3.5% – 5.5% 4.0% – 6.0% 4.8% – 6.8% 5.4% – 7.4% 6.0% – 8.0% Adjusted EBITDA $ 2 $10 $11 – $17 $13 – $19 $17 – $24 $21 – $28 $24 – $33
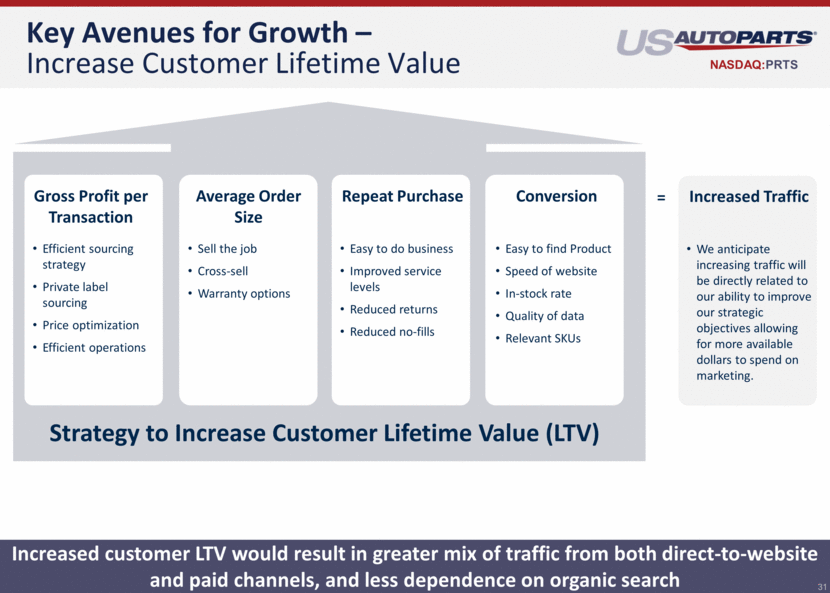
Increased customer LTV would result in greater mix of traffic from both direct-to-website and paid channels, and less dependence on organic search Key Avenues for Growth – Increase Customer Lifetime Value 31 Gross Profit per Transaction Average Order Size Repeat Purchase Conversion Increased Traffic Efficient sourcing strategy Private label sourcing Price optimization Efficient operations Sell the job Cross-sell Warranty options Easy to do business Improved service levels Reduced returns Reduced no-fills Easy to find Product Speed of website In-stock rate Quality of data Relevant SKUs We anticipate increasing traffic will be directly related to our ability to improve our strategic objectives allowing for more available dollars to spend on marketing. = Strategy to Increase Customer Lifetime Value (LTV)
