Attached files
| file | filename |
|---|---|
| EX-23.1 - EX-23.1 - RESOURCES CONNECTION, INC. | d136612dex231.htm |
| EX-32.2 - EX-32.2 - RESOURCES CONNECTION, INC. | d136612dex322.htm |
| EX-32.1 - EX-32.1 - RESOURCES CONNECTION, INC. | d136612dex321.htm |
| EX-31.2 - EX-31.2 - RESOURCES CONNECTION, INC. | d136612dex312.htm |
| EX-31.1 - EX-31.1 - RESOURCES CONNECTION, INC. | d136612dex311.htm |
| EX-21.1 - EX-21.1 - RESOURCES CONNECTION, INC. | d136612dex211.htm |
Table of Contents
UNITED STATES
SECURITIES AND EXCHANGE COMMISSION
Washington, DC 20549
Form 10-K
(Mark One)
| x | ANNUAL REPORT PURSUANT TO SECTION 13 OR 15(d) OF THE SECURITIES EXCHANGE ACT OF 1934 |
For the fiscal year ended May 28, 2016
OR
| ¨ | TRANSITION REPORT PURSUANT TO SECTION 13 OR 15(d) OF THE SECURITIES EXCHANGE ACT OF 1934 |
For the transition period from to
Commission File Number: 0-32113
RESOURCES CONNECTION, INC.
(Exact Name of Registrant as Specified in Its Charter)
| Delaware | 33-0832424 | |
| (State or Other Jurisdiction of Incorporation or Organization) |
(I.R.S. Employer Identification No.) |
17101 Armstrong Avenue, Irvine, California 92614
(Address of principal executive offices) (Zip Code)
Registrant’s telephone number, including area code: (714) 430-6400
Securities registered pursuant to Section 12(b) of the Act:
| Title of Each Class |
Name of Exchange on Which Registered | |
| Common Stock, par value $0.01 per share | The NASDAQ Stock Market LLC (Nasdaq Global Select Market) |
Securities registered pursuant to Section 12(g) of the Act:
None (Title of Class)
Indicate by check mark if the registrant is a well-known seasoned issuer, as defined in Rule 405 of the Securities Act. Yes ¨ No x
Indicate by check mark if the registrant is not required to file reports pursuant to Section 13 or 15(d) of the Act. Yes ¨ No x
Indicate by check mark whether the registrant: (1) has filed all reports required to be filed by Section 13 or 15(d) of the Securities Exchange Act of 1934 during the preceding 12 months (or for such shorter period that the registrant was required to file such reports), and (2) has been subject to such filing requirements for the past 90 days. Yes x No ¨
Indicate by check mark whether the registrant has submitted electronically and posted on its corporate Web site, if any, every Interactive Data File required to be submitted and posted pursuant to Rule 405 of Regulation S-T during the preceding 12 months (or for such shorter period that the registrant was required to submit and post such files). Yes x No ¨
Indicate by check mark if disclosure of delinquent filers pursuant to Item 405 of Regulation S-K (§ 229.405) is not contained herein, and will not be contained, to the best of registrant’s knowledge, in definitive proxy or information statements incorporated by reference in Part III of this Form 10-K or any amendment to this Form 10-K. x
Indicate by check mark whether the registrant is a large accelerated filer, an accelerated filer, a non-accelerated filer, or a smaller reporting company. See the definitions of “large accelerated filer,” “accelerated filer” and “smaller reporting company” in Rule 12b-2 of the Exchange Act. (Check one):
| Large accelerated filer ¨ | Accelerated filer x | Non-accelerated filer ¨ (Do not check if a smaller reporting company) | Smaller reporting company ¨ |
Indicate by check mark whether the registrant is a shell company (as defined in Rule 12b-2 of the Act). Yes ¨ No x
As of November 27, 2015 (the last trading day of the registrant’s most recently completed second fiscal quarter), the approximate aggregate market value of common stock held by non-affiliates of the registrant was $638,144,000 (based upon the closing price for shares of the registrant’s common stock as reported by The Nasdaq Global Select Market). As of August 1, 2016, there were approximately 36,245,851 shares of common stock, $.01 par value, outstanding.
DOCUMENTS INCORPORATED BY REFERENCE
The registrant’s definitive proxy statement for the 2016 Annual Meeting of Stockholders is incorporated by reference in Part III of this Form 10-K to the extent stated herein.
Table of Contents
RESOURCES CONNECTION, INC.
| Page No. |
||||||
| PART I | ||||||
| ITEM 1. |
3 | |||||
| ITEM 1A. |
20 | |||||
| ITEM 1B. |
27 | |||||
| ITEM 2. |
27 | |||||
| ITEM 3. |
28 | |||||
| ITEM 4. |
28 | |||||
| PART II | ||||||
| ITEM 5. |
MARKET FOR REGISTRANT’S COMMON EQUITY, RELATED STOCKHOLDER MATTERS AND ISSUER PURCHASES OF EQUITY SECURITIES | 29 | ||||
| ITEM 6. |
31 | |||||
| ITEM 7. |
MANAGEMENT’S DISCUSSION AND ANALYSIS OF FINANCIAL CONDITION AND RESULTS OF OPERATIONS | 33 | ||||
| ITEM 7A. |
47 | |||||
| ITEM 8. |
48 | |||||
| ITEM 9. |
CHANGES IN AND DISAGREEMENTS WITH ACCOUNTANTS ON ACCOUNTING AND FINANCIAL DISCLOSURE | 71 | ||||
| ITEM 9A. |
71 | |||||
| ITEM 9B. |
73 | |||||
| PART III | ||||||
| ITEM 10. |
73 | |||||
| ITEM 11. |
73 | |||||
| ITEM 12. |
SECURITY OWNERSHIP OF CERTAIN BENEFICIAL OWNERS AND MANAGEMENT AND RELATED STOCKHOLDER MATTERS | 73 | ||||
| ITEM 13. |
CERTAIN RELATIONSHIPS AND RELATED TRANSACTIONS, AND DIRECTOR INDEPENDENCE |
74 | ||||
| ITEM 14. |
74 | |||||
| PART IV | ||||||
| ITEM 15. |
74 | |||||
| 78 | ||||||
Table of Contents
FORWARD LOOKING STATEMENTS
In this Annual Report on Form 10-K, “Resources,” “Resources Connection,” “Resources Global Professionals,” “RGP,” “Resources Global,” “Company,” “we,” “us” and “our” refer to the business of Resources Connection, Inc. and its subsidiaries. References in this Annual Report on Form 10-K to “fiscal,” “year” or “fiscal year” refer to our fiscal year that consists of the 52- or 53-week period ending on the Saturday in May closest to May 31. The fiscal years ended May 28, 2016 and May 30, 2015 consisted of 52 weeks while the year ended May 31, 2014 consisted of 53 weeks.
This Annual Report on Form 10-K, including information incorporated herein by reference, contains “forward-looking statements” within the meaning of Section 27A of the Securities Act of 1933, as amended, and Section 21E of the Securities Exchange Act of 1934, as amended. These statements relate to expectations concerning matters that are not historical facts. Such forward-looking statements may be identified by words such as “anticipates,” “believes,” “can,” “continue,” “could,” “estimates,” “expects,” “intends,” “may,” “plans,” “potential,” “predicts,” “should” or “will” or the negative of these terms or other comparable terminology.
Our actual results, levels of activity, performance or achievements and those of our industry may be materially different from any future results, levels of activity, performance or achievements expressed or implied by these forward-looking statements. These statements and all phases of our operations are subject to known and unknown risks, uncertainties and other factors, including those made in Item 1A of this Annual Report on Form 10-K, as well as our other reports filed with the Securities and Exchange Commission (“SEC”). Readers are cautioned not to place undue reliance on these forward-looking statements, which speak only as of the date of this Annual Report. We do not intend, and undertake no obligation to update the forward-looking statements in this filing to reflect events or circumstances after the date of this Annual Report or to reflect the occurrence of unanticipated events.
Table of Contents
PART I
| ITEM 1. | BUSINESS. |
Overview
Resources Connection is a multinational consulting firm; its operating entities primarily provide services under the name Resources Global Professionals (“RGP” or the “Company”). The Company provides consulting and business initiative support services to its global client base in the areas of accounting; finance; corporate governance, risk and compliance management; corporate advisory, strategic communications and restructuring; information management; human capital; supply chain management; and legal and regulatory.
We assist our clients by providing “intellectual capital on demand” to support projects requiring specialized expertise in areas such as:
| • | Finance and accounting services including process transformation and improvement; financial reporting and analysis; technical and operational accounting; merger and acquisition due diligence; audit response; implementation of new accounting standards such as the revenue recognition pronouncement; and remediation support |
| • | Information management services including strategy development; program and project management; business and technology integration; data strategy including security and privacy; and business performance management (such as core planning and consolidation systems) |
| • | Corporate advisory, strategic communications and restructuring services |
| • | Corporate governance, risk and compliance management services including contract and regulatory compliance efforts under, for example, the Dodd-Frank Wall Street Reform and Consumer Protection Act and the Sarbanes Oxley Act of 2002 (“Sarbanes”); Enterprise Risk Management; internal controls management; and operation and information technology (“IT”) audits |
| • | Supply chain management services including supply chain strategy development; procurement and supplier management; logistics and materials management; supply chain planning and forecasting; and Unique Device Identification compliance |
| • | Human capital services including change management; organization development and effectiveness; and optimization of human resources technology and operations |
| • | Legal and regulatory services with projects, secondments or tactical needs including commercial transactions; compliance initiatives; law department operations; and business strategy and litigation support |
We were founded in June 1996 by a team at Deloitte LLP (“Deloitte”), led by our chairman, Donald B. Murray, who was then a senior partner with Deloitte. Our founders created the Company to capitalize on the increasing demand for high quality outsourced professional services. We operated as a part of Deloitte until April 1999. In April 1999, we completed a management-led buyout. In December 2000, we completed our initial public offering of common stock and began trading on the NASDAQ Stock Market. We currently trade on the NASDAQ Global Select Market. We operate under the acronym RGP, the branding for our operating entity name of Resources Global Professionals.
Our business model combines the client service orientation and commitment to quality from our legacy as part of a Big Four accounting firm with the entrepreneurial culture of an innovative, dynamic company. We are positioned to take advantage of what we believe are two continuing trends in the outsourced professional services industry: global demand for flexible, outsourced professional services by corporate clients and highly-experienced professionals interested in working in a non-traditional professional services firm. We believe our business model allows us to simultaneously offer challenging yet flexible career opportunities to attract well qualified, experienced professionals and to attract clients with enterprise-wide, global consulting needs.
As of May 28, 2016, we employed or contracted with 2,511 consultants serving a diverse base of over 1,800 clients ranging from large multinational corporations to mid-sized companies to small entrepreneurial entities, in a broad range of industries. Our
3
Table of Contents
consultants have professional experience in a wide range of industries and functional areas and tend to be in the latter third of their careers, many with advanced professional degrees or designations. We offer our consultants careers that combine the flexibility of project-based consulting work with many of the advantages of working for a traditional professional services firm.
Our offices serve our multinational clients throughout the world with a client focus rather than from a regional/office perspective. To enhance our ability to serve multinational clients, we served our clients from 45 offices in the United States and from 23 offices within 19 countries abroad as of May 28, 2016.
Revenue from the Company’s major geographic areas was as follows (in thousands):
| Revenue for the Years Ended | % of Total | |||||||||||||||||||
| May 28, 2016 |
May 30, 2015 |
% Change |
May 28, 2016 |
May 30, 2015 |
||||||||||||||||
| North America |
$ | 499,229 | $ | 492,207 | 1.4 | % | 83.4 | % | 83.3 | % | ||||||||||
| Europe |
57,714 | 59,350 | (2.8 | )% | 9.6 | 10.1 | ||||||||||||||
| Asia Pacific |
41,578 | 39,032 | 6.5 | % | 7.0 | 6.6 | ||||||||||||||
|
|
|
|
|
|
|
|
|
|||||||||||||
| Total |
$ | 598,521 | $ | 590,589 | 1.3 | % | 100.0 | % | 100.0 | % | ||||||||||
|
|
|
|
|
|
|
|
|
|||||||||||||
See Note 14 — Segment Information and Enterprise Reporting — to the Consolidated Financial Statements for additional information concerning the Company’s domestic and international operations and Part I Item 1A. “Risk Factors — Our ability to serve clients internationally is integral to our strategy and our international activities expose us to additional operational challenges that we might not otherwise face” for information regarding the risks attendant to our international operations.
We believe our distinctive culture is a valuable asset and is, in large part, due to our management team, which has extensive experience in the professional services industry. Most of our senior management and office managing directors have Big Four, management consulting and/or Fortune 500 experience and an equity interest in the Company. This team has created a culture of professionalism and a client service orientation that we believe fosters in our consultants a feeling of personal responsibility for, and pride in, client projects and enables us to deliver high-quality service and results to our clients.
Industry Background
Changing Market for Project- or Initiative-Based Professional Services
RGP’s services cover a range of professional areas. The market for professional services is broad and fragmented and independent data on the size of the market is not readily available. We believe that companies may be more willing to choose alternatives to traditional professional service providers because of evolving economic competitive pressure and significant increases in government-led regulatory requirements, such as the Dodd-Frank Wall Street Reform and Consumer Protection Act. We believe RGP is positioned as a viable alternative to traditional accounting, consulting and law firms in numerous instances because, by using project consultants, companies can:
| • | Strategically access specialized skills and expertise |
| • | Effectively supplement internal resources |
| • | Increase labor flexibility |
| • | Reduce their overall hiring, training and termination costs |
Typically, companies use a variety of alternatives to fill their project needs. Companies outsource entire projects to consulting firms which provides them access to the expertise of the firm but often entails significant cost and less management control of the project. Companies also supplement their internal resources with employees from the Big Four accounting firms or other traditional professional services firms. Companies use temporary employees from traditional and Internet-based staffing firms, although these employees may be less experienced or less qualified than employees from professional services firms. Finally, some companies rely solely on their own employees who may lack the requisite time, experience or skills.
4
Table of Contents
Supply of Project Consultants
Based on discussions with our consultants, we believe that the number of professionals seeking to work on a project basis has historically increased due to a desire for:
| • | More flexible hours and work arrangements, coupled with a professional culture that offers competitive wages and benefits |
| • | Challenging engagements that advance their careers, develop their skills and add to their experience base |
| • | A work environment that provides a diversity of, and more control over, client engagements |
| • | Alternate employment opportunities in regions throughout the world |
The employment alternatives available to professionals may fulfill some, but not all, of an individual’s career objectives. A professional working for a Big Four firm or a consulting firm may receive challenging assignments and training, but may encounter a career path with less choice and less flexible hours, extensive travel and limited control over work engagements. Alternatively, a professional who works as an independent contractor faces the ongoing task of sourcing assignments and significant administrative burdens.
Resources Global Professionals’ Solution
We believe that RGP is positioned to capitalize on the confluence of the industry trends described above. We believe, based on discussions with our clients, that RGP provides high-quality services to clients seeking project professionals because we are able to combine all of the following:
| • | A relationship-oriented and collaborative approach with our clients |
| • | Client service teams with Big Four, consulting and/or industry backgrounds to assess our clients’ project needs and customize solutions to meet those needs |
| • | Highly qualified consultants with the requisite expertise and experience |
| • | Competitive rates on an hourly, rather than project, basis |
| • | Significant client control of their projects |
Resources Global Professionals’ Strategy
Our Business Strategy
We are dedicated to serving our clients with highly qualified and experienced professionals in support of projects and initiatives in the areas of accounting; finance; corporate governance, risk and compliance management; corporate advisory, strategic communications and restructuring; information management; human capital; supply chain management; and legal and regulatory. Our objective is to be the leading provider of these project-based professional services. We have developed the following business strategies to achieve this objective:
| • | Maintain our distinctive culture. Our corporate culture is the foundation of our business strategy and we believe it has been a significant component of our success. Our senior management, virtually all of whom are Big Four or other professional services firm alumni, has created a culture that combines the commitment to quality and the client service focus of a Big Four firm with the entrepreneurial energy of an innovative, high-growth company. We seek consultants and management with talent, integrity, enthusiasm and loyalty (“TIEL”, an acronym used frequently within the Company) to strengthen our team and support our ability to provide clients with high-quality services and solutions. We believe that our culture has been instrumental to our success in hiring and retaining highly qualified employees and, in turn, attracting quality clients. |
| • | Hire and retain highly qualified, experienced consultants. We believe our highly qualified, experienced consultants provide us with a distinct competitive advantage. Therefore, one of our priorities is to continue to attract and retain high-caliber consultants. We believe we have been successful in attracting and retaining qualified professionals by providing challenging work assignments, competitive compensation and benefits, and continuing education and training opportunities, while offering flexible work schedules and more control over choosing client engagements. |
5
Table of Contents
| • | Build consultative relationships with clients. We emphasize a relationship-oriented approach to business rather than a transaction-oriented or assignment-oriented approach. We believe the professional services experience of our management and consultants enables us to understand the needs of our clients and to deliver an integrated, relationship-oriented approach to meeting their professional services requirements. We regularly meet with our existing and prospective clients to understand their business issues and help them define their project needs. Once an initiative is defined, we identify consultants with the appropriate skills and experience to meet the client’s objectives. We believe that by establishing relationships with our clients to solve their professional services needs, we are more likely to generate new opportunities to serve them. The strength and depth of our client relationships is demonstrated by two key statistics: 1) during fiscal 2016, 47 of our 50 largest clients used more than one practice area and 40 of those top 50 clients used three or more practice areas; and 2) 44 of our largest 50 clients in fiscal 2011 remained clients in fiscal 2016 while 39 of our top 50 clients in 2008 were still clients in 2016. In addition, during fiscal 2016 our top 50 clients were served by an average of six RGP offices, demonstrating the breadth of our relationships with clients world-wide. |
| • | Build the RGP brand. Our objective is to build RGP’s reputation as the premier provider of project-based consulting services. Our primary means of building our brand is by consistently providing high-quality, value-added services to our clients. We have also focused on building a significant referral network through our 2,511 consultants and 772 management and administrative employees working from offices in 20 countries as of May 28, 2016. In addition, we have global, regional and local marketing efforts that reinforce the RGP brand. |
Our Growth Strategy
Since inception, our growth has been primarily organic rather than via acquisition. We believe that we have significant opportunity for continued organic growth in our core business as the global economy strengthens and economic uncertainties decrease and that, in addition, we can grow opportunistically through strategic acquisitions. In both our core and acquired businesses, key elements of our growth strategy include:
| • | Expanding work from existing clients. A principal component of our strategy is to secure additional work from the clients we have served. We believe, based on discussions with our clients, that the amount of revenue we currently receive from many of our clients represents a relatively small percentage of the amount they spend on professional services, and that, consistent with historic industry trends, they may continue to increase the amount they spend on these services as the global economy evolves. We believe that by continuing to deliver high-quality services and by further developing our relationships with our clients, we can capture a significantly larger share of our clients’ expenditures for professional services. |
| • | Growing our client base. We will continue to focus on attracting new clients. We strive to develop new client relationships primarily by leveraging the significant contact networks of our management and consultants and through referrals from existing clients. We believe we can continue to attract new clients by building our brand name and reputation, supplemented by our global, regional and local marketing efforts. We anticipate that our growth efforts this year will continue to focus on identifying strategic target accounts that tend to be large multinational companies. |
| • | Expanding geographically. We have expanded geographically to meet the demand for project professional services around the world and currently have offices in 20 countries. We believe, based upon our clients’ requests, that there are future opportunities to promote growth globally. Consequently, we intend to continue to expand our international presence on a strategic and opportunistic basis. We may also add to our existing domestic office network when our existing clients have a need or if there is a new client opportunity. |
| • | Providing additional professional service offerings. We will continue to develop and consider entry into new professional service offerings. Since our founding, we have diversified our professional service offerings from a primary focus on accounting and finance to other areas in which our clients have significant needs such as human capital; information management; governance, risk and compliance; supply chain management; legal and regulatory services; and corporate advisory, strategic communications and restructuring services. Our considerations when evaluating new professional service offerings include cultural fit, growth potential, profitability, cross-marketing opportunities and competition. |
6
Table of Contents
Consultants
We believe that an important component of our success has been our highly qualified and experienced consultants. As of May 28, 2016, we employed or contracted with 2,511 consultants engaged with clients. Our consultants have professional experience in a wide range of industries and functional areas. We provide our consultants with challenging work assignments, competitive compensation and benefits, and continuing education and training opportunities, while offering more choice concerning work schedules and more control over choosing client engagements.
Almost all of our consultants in the United States are employees of RGP. We typically pay each consultant an hourly rate for each consulting hour worked and for certain administrative time and overtime premiums, and offer benefits, including: paid time off and holidays; a discretionary bonus program; group medical and dental programs, each with an approximate 30-50% contribution by the consultant; a basic term life insurance program; a 401(k) retirement plan with a discretionary company match; and professional development and career training. Typically, a consultant must work a threshold number of hours to be eligible for all of these benefits. In addition, we offer our consultants the ability to participate in the Company’s Employee Stock Purchase Plan (“ESPP”), which enables them to purchase shares of the Company’s stock at a discount. We intend to maintain competitive compensation and benefit programs.
Internationally, our consultants are a blend of employees and independent contractors. Independent contractor arrangements are more common abroad than in the United States due to the labor laws, tax regulations and customs of the international markets we serve. A few international practices also utilize a partial “bench model”; that is, certain consultants are paid a weekly salary rather than for each consulting hour worked with bonus eligibility based upon utilization.
Clients
We provide our services and solutions to a diverse client base in a broad range of industries. In fiscal 2016, we served over 1,800 clients from offices located in 20 countries. Our revenues are not concentrated with any particular client or within any particular industry. No single customer accounted for more than 10% of revenue for the years ended May 28, 2016, May 30, 2015 and May 31, 2014, and in fiscal 2016, our 10 largest clients accounted for approximately 15% of our revenues.
The clients listed below represent the multinational and industry diversity of our client base:
| AIG |
Kawasaki Heavy Industries, Ltd. | |
| American Express Company | Makita Corporation | |
| BASF Corporation | MetLife, Inc. | |
| Bayer Corporation | Mitsubishi Corporation | |
| BP p.l.c. | Mitsui & Co, Ltd. | |
| Chevron Corporation | Phillips 66 Company | |
| Community Health Network Inc. | Sony Corporation | |
| ConocoPhillips | Syngenta International AG | |
| Kaiser Permanente | Unilever |
Services and Products
RGP’s business model and operating philosophy are rooted in the support of client-led projects and consulting initiatives, extending to advisory-based services that leverage the deep experience and expertise of our internal team while partnering with our clients’ business leaders. Often, we deliver our services to clients across multiple functional areas of expertise with consultants from several disciplines working on the same project. Our areas of core competency include: finance and accounting; information management; human capital; corporate advisory, strategic communications and restructuring services; legal and regulatory; governance, risk and compliance; and supply chain management.
Finance & Accounting
RGP’s Finance and Accounting services encompass accounting operations, financial reporting, internal controls, financial analyses and business transactions. Clients utilize our services to bring accomplished talent to bear on internally driven change
7
Table of Contents
initiatives, such as M&A activities, or externally mandated change, such as required implementations of new accounting standards, as well as day-to-day operational issues. We provide specialized skills and then transfer knowledge to clients in order to help them leverage their own personnel. RGP specializes in providing customized solutions to our clients’ most pressing business problems, through project management and providing access to full project teams for a specific initiative. Our scalability and global reach also put us in the ideal position to help organizations manage peak workload periods or add specific skill sets to ongoing client projects.
Our Finance and Accounting core competencies include:
Sample Engagement — Revenue Recognition Assessment and Solution: A U.S. based national retailer engaged RGP to perform a full assessment and develop an implementation roadmap in order to comply with the requirements of the Financial Accounting Standards Board’s revenue recognition guidance, Accounting Standards Update No. 2014-09, Revenue from Contracts with Customers, as amended. Using RGP’s proprietary revenue recognition framework to determine the impact of the new guidance and to implement a solution, our consultants:
| • | Evaluated the client’s revenue streams and processes, conducted company-wide interviews and reviewed and documented a sample of revenue contracts |
| • | Estimated the impact on the client’s revenue and disclosures |
| • | Assessed the client’s system capabilities, designed solutions and documented inter-departmental dependencies, including timeline requirements |
| • | Worked with the client to select the optimal implementation solutions and developed a robust implementation roadmap and work plan |
| • | Facilitated on-going and comprehensive knowledge transfer to position the client for future compliance with the revenue recognition standard |
Sample Engagement — Reorganization, Bankruptcy Support and Human Capital: A U.S. clothing manufacturer and retailer was unable to meet its financial obligations in 2015 and filed for chapter 11 protection in U.S. bankruptcy court. The client initially hired RGP for a three-week engagement to analyze and reconcile their critical vendor claims. It was important to complete this reconciliation quickly in order for the continued flow of product from their vendors.
8
Table of Contents
The client’s satisfaction with the initial project led to expansion of the engagement to include an analysis and reconciliation of 503(b)(9) supplier claims just prior to the bankruptcy filing, administration claims and bankruptcy court reporting, including monthly financial reports.
Because of employee layoffs as well as employee attrition due to the chapter 11 filing, the company was unable to perform certain critical functions. RGP provided consultants to serve as interim controller; AP Manager; Budgeting Manager and HR Manager, including the handling of WARN Act notices, layoffs and COBRA matters. With RGP’s support, the Company successfully exited bankruptcy and RGP continues to assist in the on-going reorganization.
Sample Engagement — Transition of Accounting Cycle Processes Following Significant Acquisition: A Fortune 500 retail company that recently completed a significant acquisition of a competitor embarked on a comprehensive program to recognize synergies from the overlap of certain back-office functions. Under a “lift & shift” scenario, the client engaged RGP to assess the current state of revenue, cash and payables processes for the acquired company and to develop and execute a plan to transition those functions to the client’s existing shared services centers around the world.
Information Management
RGP’s Information Management practice provides planning and execution services in four primary areas: Program & Project Management; Business & Technology Integration; Data Strategy & Management; and IT Strategy & Advisory. By focusing on the initiative as defined by our clients, RGP can provide continuity of service from the creation or expansion of an overall IT strategy through post-implementation support. In addition to these services, we assist clients in implementation of a variety of technology solutions: Enterprise Resource Planning (“ERP”) systems; strategic “front-of-the-house systems”; human resources (“HR”) information systems; supply chain management systems; core finance and accounting systems; audit compliance systems; and financial reporting, planning and consolidation systems.
The following are examples of the core competencies of our Information Management practice:
Sample Engagement — Project Leadership for Global Next Generation Program: A Fortune 50 automotive company is implementing a global program to create the next generation of connected vehicle technology and infotainment applications for all North American vehicle production. The RGP team leads the coordination and integration of a highly complex set of services that requires the seamless integration of six external suppliers and eight internal teams, to create a new customer facing registration portal, secure global network and real-time interfaces needed to enable the new services.
RGP consultants serve as technical Program Management across 13 defined workstreams as well as a variety of internal systems integrations that span enterprise infrastructure. The project also includes systems implementation in the form of architecture support and very complex systems integration across the 14 teams building the technology components. The RGP
9
Table of Contents
Program Manager has managed the transition from vendor selection to solutioning and engineering the services with the supplier and client teams. RGP continues to be the technical systems integrator for all program workstreams and horizontal platforms.
Sample Engagement — Deployment of Third-Party Technology in Call Center: A major provider of entertainment programming needed assistance in deploying third-party technology. The technology allows system intelligent prioritization of customer telephone calls by providing real-time evaluation of customer call intention, comparing the intent with various attributes on file for the particular customer, and aligning customer calls with offers for cross-selling purposes.
The RGP consulting team provided project management, executive stakeholder strategy, organizational change management, enterprise technology implementation and vendor management. In addition to reducing the time associated with each customer call and increasing revenue through targeted cross-sell techniques, our team led the implementation of a number of analytical tools for the business to use in evaluating retention and cross-sell strategies.
Sample Engagement — Integration and Optimization of Significant Acquisition: A large publicly-traded entertainment conglomerate acquired a regional entity that provided home security and monitoring. Our client needed to integrate its existing ordering, billing, supply chain and installation systems with the acquired entity’s systems in order to sell and deliver these new capabilities across its current and prospective customer base. Working with the client’s implementation team, RGP’s activities included:
| • | Serving as interim program manager and senior project manager |
| • | Linking and modifying the client’s existing sales programming to bundle the acquired home security/monitoring products |
| • | Modifying the existing equipment delivery systems capability to reduce the number of days to final install |
Sample Engagement — BI Strategy/Implementation: A large state utility company required assistance in restarting and reenergizing a stalled enterprise-wide BI initiative focused on increasing overall data definition/management, analysis and reporting to support enterprise-wide business decision making. The RGP engagement consisted of:
| • | Partnering with the client’s corporate stakeholder team to define the current state of the stalled BI initiative and redevelop overall objectives/goals |
| • | Providing the framework/approach of how to restart and move forward towards a successful implementation and adoption |
| • | Leading the effort to gain stakeholder, management and end user buy-in for the initiative across the organization |
| • | Providing day to day Program Management oversight, focusing on partnering, advising and managing the redefined approach. Critical deliverables included requirements/process definition, data definition/management, report/dashboard definition and development, change management and training/adoption |
Sample Engagement — Data Analytics PMO: RGP consultants assisted our client with the launch of a Data Analytics Program to better capitalize upon its leading data/analytics processes. The use of data to drive operating decisions has long been a fundamental element behind our client’s competitive positioning and an ongoing source of competitive advantage. Their data infrastructure was scaled up in 2014 to accommodate the increasing demand for new data in their enterprise data platform. The Data Analytics Program has enabled better decision making on pricing, customer segmentation, marketing and yield management. The RGP engagement consisted of:
| • | Supporting program and project management for the Data Analytics Program |
| • | Developing the program structure, defining work streams and assigning appropriate team members |
| • | Identifying and tracking of key activities and milestones |
| • | Developing and managing the program budget |
| • | Communicating to key stakeholders |
| • | Evaluating and selecting tools/technology |
10
Table of Contents
Sitrick Brincko Group
Sitrick Brincko Group (“Sitrick”) offers a unique combination of strategic counsel, tactical execution, and organizational and logistical support critical to both public and private companies and high profile individuals, both in the United States and overseas. Its extensive experience in strategic, corporate, financial and transactional communications as well as general management, finance, strategic planning, manufacturing and distribution have made Sitrick a partner to boards of directors and management engaged in acquisitions, proxy fights, litigation, management changes, government inquisitions, corporate reorganizations or when repositioning, redirecting or unwinding a business.
Combined with RGP’s broad capabilities and global footprint, Sitrick offers a wide variety of services to clients, including:
| • | Strategic and crisis communications |
| • | Repositioning a business or business segment |
| • | Change management |
| • | Litigation support |
| • | Restructuring and reorganization |
| • | Performance improvement |
| • | Loan portfolio review and loan workout |
| • | Bankruptcy administration and management |
| • | Corporate and financial advisory |
| • | Interim and crisis management |
| • | Fiduciary services, trustee, receiver, examiner |
| • | Creditor representation and recovery |
| • | Dispute resolution and litigation support |
Sample Engagement — Financial Restructuring: Sitrick, working with the board of directors, management and other advisors, developed and implemented the strategic communications for the successful restructuring and change in management of a large beverage distributor. This was a cross-border engagement, with the company based in Poland, new investors and management based in Russia and the restructuring in the United States.
Sample Engagement — Litigation Support: Sitrick was retained by a technology company to provide litigation support for a patent infringement suit the company was about to file against a much larger and better known competitor. Sitrick developed a communications strategy that resulted in the case being settled within two days of its filing.
Sample Engagement — Proxy Contest: Sitrick provided strategic communications counsel in a proxy contest launched against an Israeli company where a hedge fund was trying to take control of the board of directors. The company successfully maintained control of the board of directors.
11
Table of Contents
Human Capital
RGP’s Human Capital consultants apply project-management and business analysis skills to help solve the people aspects of business problems. The two primary areas of focus of our human capital practice are change management/business transformation and HR operations. To achieve the desired business outcome, our Human Capital professionals work with client teams to help drive their change management initiatives to successful completion. We help our clients with the people challenges of acquisitions, mergers, downsizing, reorganizations, system implementations or legislative requirements (Sarbanes, Basel II, HIPAA, the Patient Protection and Affordable Care Act, etc.). Our Human Capital professionals also have HR operations and technology skills that provide clients with the means to achieve their initiatives. Our Human Capital core competencies revolve around:
Sample Engagement — Establishment of New Corporate Compensation Function: A fast-growing multi-national pharmaceutical company needed assistance in establishing a new corporate compensation function, addressing core infrastructure issues. Our consultant, working with client personnel, served as Project Manager and subject matter expert, assessing business priorities, development of compensation philosophy and integration of processes with technology. Specific initiatives included:
| • | Establishing a benchmarking strategy for assessing competitive pay levels, coupled with integrating a pay for performance culture |
| • | Evaluating the current HRIS system and identifying relevant issues for replacement |
| • | Positioning the HR function as a valued and integral business partner |
Sample Engagement — Organizational Design: A Fortune 500 life insurance company wanted to design a new organizational and operating model to provide more efficient, “silo-free” operations. Partnering with RGP, our consultants provided subject-matter expertise on organizational design and an operating model development approach, process and content. Specifically, RGP supported the initiative by:
| • | Conducting in-depth current state organizational reviews |
| • | Developing a comprehensive culture and change impact assessment to identify benefits and challenges of the new operating model |
12
Table of Contents
| • | Evaluating the impact on human capital of a shared services center and off-shoring implementation |
| • | Presenting key aspects of the operating model design approach to management and staff and assessing potential interdependencies with other workstreams outside of the HR function |
Sample Engagement — Implementation of HR system: A Fortune 500 provider of electronic products and services selected Workday as their world-wide HR system in order to improve HR workload and processes. The new system would replace the existing, manually intensive and inefficient spreadsheet based process, allowing HR management to focus on analysis rather than data development and reconciliation. RGP led the initiative in the region by developing and implementing a deployment plan and assessing the impact and success of the software usage upon completion.
Legal & Regulatory
RGP Legal helps clients execute their legal, risk management and regulatory initiatives. Our consultants (consisting of attorneys, compliance professionals, paralegals and contract managers) have significant experience working at the nation’s top law firms and companies. RGP Legal provides general counsel access to exceptional talent on an agile basis for the exact subject-matter knowledge and business perspective required for a particular task or workflow. Generally, RGP Legal is engaged to work directly with in-house counsel or with traditional outside counsel for projects or pieces of “unbundled” work. Examples of our core competencies include:
Project Services
| • | Commercial agreement review |
| • | Compliance support (FCPA, Dodd-Frank, data privacy) |
| • | Proxy and quarterly SEC support |
| • | Corporate governance |
Sample Engagement — Unbundling Support for M&A Activity: Our client, a world leader in the in-flight entertainment and communication solutions business, turned to RGP for supplemental support and expertise in connection with a buy-side acquisition. The client’s general counsel engaged us to supplement the bandwidth of the in-house team. Our consultants drove the diligence process, collaborated extensively with internal business units and, working closely with lead outside counsel who focused on the strategy and structure of the deal, assisted in the drafting of deal documents. The client reduced its legal spend by multi-sourcing the work needed to support the transaction.
Legal Operations and Business Strategy
| • | Legal project management, process improvement, change management |
| • | Legal spend analysis |
| • | Strategic sourcing and convergence |
| • | Contract, knowledge, matter management |
| • | Technology assessment, selection, implementation and optimization |
| • | Organizational design |
Sample Engagement — Law Department Organizational Design: The new General Counsel for a multi-billion dollar energy and specialty refining company asked RGP to redesign its legal department structure from the ground up. A series of acquisitions, coupled with a more complex business environment, increased the department’s work flows. Our consultants conducted extensive stakeholder interviews and an analysis of department operations to develop an organizational model stressing business continuity, best practices in organizational design, areas of process and resourcing improvement, and organizational development. RGP’s solution resulted in a leaner legal team that leverages effective and efficient legal services providers, while implementing in-house efficiencies and automation.
13
Table of Contents
Sample Engagement — Development and Implementation of Knowledge Management Tool: Our client, a multi-million dollar asset management firm, lacked an efficient tool for handling information related to its investment/private equity funds. As a result, in-house attorneys often started deals without the benefit of knowledge gleaned from previously negotiated agreements. Documents were difficult to locate, important deal information was lost, and providing information to regulators and third parties was often time consuming and inefficient.
RGP designed a knowledge management tool to increase efficiencies in the client’s deal flow and archiving process. RGP crafted a simple searchable database tool that provided an effective way to access, retrieve, archive and leverage important deal information. RGP also conducted a gap analysis on missing deal documents and developed training to ensure attorney buy-in and acceptance of the management tool.
Unbundling Legal Services
| • | Litigation management and support, including document review and analysis, investigations and regulatory reviews |
| • | M&A due diligence, closing, integration |
| • | Real estate due diligence |
Sample Engagement — Unbundling Fact Finding Activities in Class Action Litigation: Challenged with the process of managing a massive wage and hour class action lawsuit, our client, a multinational publicly-traded food service chain, engaged RGP to provide a seasoned team of attorneys to conduct employee interviews critical to revealing issues important in responding to the class certification process.
After conducting the interviews, our consultants teamed with the client and outside counsel to determine the merit and relevancy of each declaration. The project was completed rapidly over a multi-week period and the client reported cost savings versus traditional solutions.
Supply Chain Management
RGP’s Supply Chain Management practice assists clients in the planning, execution, maintenance and troubleshooting of complex supply chain systems and processes. Our consultants work as part of client teams to reduce the total cost of ownership, improve business performance and produce results. Specifically, our core competencies include:
14
Table of Contents
Sample Engagement — Vendor Risk Management Software Selection and Monitoring: A major publicly-traded financial services company wanted to effectively and proactively identify and manage previously unaddressed significant vendor risks. Working collaboratively, a cross-functional team of client personnel and RGP consultants developed a comprehensive vendor performance monitoring function. The team identified three key project work streams: 1) establishment of solutions to support and maintain the client’s third party vendor management processes, systems, standards and metrics tracking; 2) development of user guides and materials and training on the selected software tool to support the function; 3) development and support of the day to day processes to ensure compliance with regulations, guidelines and firm requirements. Specifically, RGP was responsible for:
| • | Developing the framework and vendor scorecards |
| • | Conducting certification and governance maturity assessments |
| • | Conducting on-site vendor assessments, certification and governance |
| • | Developing program processes, policies and procedures |
| • | Assisting with management of the selected software implementation |
Sample Engagement — Improvement in On-Line Checkout: A U.S. based product distributor initiated a major campaign to drive consumers to using an e-commerce platform. However, during checkout, customers realized that shipping and handling fees associated with the purchase were too high, resulting in an 80% cart abandonment rate and a significant loss in sales. In the current e-commerce environment, consumers have been trained to expect free shipping, free shipping over a specific order value or flat rate shipping.
The client engaged RGP to identify short term solutions to reduce shipping and handling charges prior to the next selling season, as well as longer term ideas for future releases. After conducting a four week assessment of the recent sales cycle and associated data, RGP consultants provided specific recommendations to reduce shipping and handling costs, reduce the order cycle and transit time and reduce packaging waste. In addition, observations were made to improve the consumer experience, with the goal of increasing sales.
Sample Engagement — Procure-to-Pay Assessment: A large multinational consumer electronic company needed assistance in conducting an assessment of its Procure-to-Pay process to review performance and to identify recommendations to fill gaps. The client had two primary goals: 1) to assess the current state; and 2) to provide insights on the future state, with comparison to leading practices and a high-level implementation roadmap. RGP, acting in project management and business analyst roles, was tasked with:
| • | Documenting the current process, controls and policies and procedures |
| • | Outlining benefits of using the new Oracle system |
| • | Providing analysis of current staff skills and appropriate staff size |
| • | Providing recommendations on procure to pay strategy, priorities, organizational structure, risks and dependencies |
| • | Assessing supplier selection, certification and performance monitoring |
| • | Developing recommendations for future state, including ways to maximize effectiveness and efficiency, optimizing cost structures and mitigating risk exposures |
Sample Engagement — Cost Recovery Review: One of the world’s largest multinational energy companies engaged RGP to provide services to ensure contract compliance and to identify cost recovery opportunities with a supplier of significant services. Performing services at the supplier location, the RGP consultants developed the procedure plan, conducted supplier interviews, performed test work on selected transactions and issued a final report. The findings ultimately resulted in a recovery for the client and an enhanced understanding with the supplier.
15
Table of Contents
Governance, Risk and Compliance (“GRC”): Corporate Governance, Risk Management, Internal Audit and Compliance Services
RGP’s GRC practice assists clients with a variety of governance, risk management, internal audit and compliance initiatives. The professionals in our GRC practice have experience in operations, controllership and internal and external audit and serve our clients in any number of roles required — from program manager to team member. In addition to helping clients worldwide in the areas of audit, risk and compliance, we are able to draw on RGP’s other practice areas to bring the required business expertise to the engagement. Our GRC core competencies include:
Sample Engagement — Documentation and Enhancement of Internal Controls in Preparation for IPO or Sale: A highly profitable and fast growing maker of electronic equipment had both inadequate IT general controls and poor documentation of its processes. As a result, highly detailed and expensive substantive audit procedures needed to be performed in order to prepare financial statements for a contemplated IPO or sale of the company. Serving as project manager and change management lead, RGP consultants performed an assessment of IT general controls, identified critical risk areas and prepared detailed action plans to remediate or implement controls.
Sample Engagement — Implementation of the Committee of Sponsoring Organizations of the Treadway Commission (“COSO”) Framework: A Fortune 500 software developer engaged us to serve as the lead in applying the COSO framework of controls in a highly complex business environment. Specifically, our consultants identified and aligned control activities with the respective COSO principles and provided a gap analysis to target points for remediation. In addition, the RGP team developed a user friendly reporting model to facilitate both coordination with the external audit team as well as critical communication points with senior executives and the Audit Committee of the Board of Directors.
Sample Engagement — Documentation and Enhancement of Internal Controls: A rapidly growing maker of automation software needed an assessment of current state business processes and internal controls at its U.S. and India operations for Sarbanes and general business purposes. Our consultants documented current state of internal controls, made recommendations for enhanced future state of controls and presented our findings to executive management. The assessments identified a significant number of high risk items that the client was unaware of, with actionable recommendations for improvement.
Sample Engagement — Internal Audit Co-Sourcing and Internal Control Framework: A global insurance provider engaged RGP to provide co-sourced internal audit functions as well as to implement its Internal Control Framework (“ICF”). After identifying high risk projects and processes in the IT function, we assisted with the following deliverables:
| • | Planning and designing the audit approach to be used across the enterprise for engagements |
| • | Performing testing and evaluation of results in order to prepare draft audit reports |
| • | Producing final audit reports in the required format utilizing the client’s auditor assistant database system |
16
Table of Contents
For the ICF project, RGP consultants were deployed in the U.S. and internationally to document and review accounting and IT processes and controls and to provide recommendations for improvement.
Sample Engagement — Banking Compliance Support: Our client, a Fortune 500 financial services company, wanted to develop and implement a more formal approach to the assessment of the company’s regulatory risk profile. Previously, decisions on assessment of regulatory risk were more of an intuitive exercise than a formalized methodology. To help the client evolve its process, RGP was responsible for the entire project, including:
| • | Identifying risk topics for each product type (real estate loans, consumer loans, credit cards, deposits, trusts and others) |
| • | Determining gaps in regulation coverage |
| • | Creating risk statements for each product |
| • | Defining the inherent and control risk definitions |
| • | Building and scoring the templates to be used to document the efforts |
The final deliverable allowed bank management to better allocate limited resources to maximize coverage of critical compliance issues using the quantifiable basis of risk assessment. Ultimately, RGP consultants deployed the methodology through other facets of the company’s operation, including property/casualty and life insurance and investment management.
Sample Engagement — Audit IT Security Controls: The CIO of a global healthcare company headquartered in Europe planned a series of global IT audits. Working as a part of a client team, RGP was responsible for an assessment of the strength and sophistication of the IT security organization, implementation of the IT security governance model, conducting a series of interviews with top management stakeholders in the IT organization, and transfer of knowledge on audit techniques.
policyIQ
RGP’s policyIQ is our proprietary cloud-based GRC software application, enabling the focused management of a wide range of GRC processes, including Risk Assessments, Sarbanes Compliance, Policy and Procedure Management, Internal Audit Programs, Anti-Corruption Compliance and Contract Administration. policyIQ can be implemented quickly to manage a specific aspect of an overall GRC program, or easily scaled to integrate multiple initiatives, allowing the organization to realize greater efficiency. In addition, our engagement teams often utilize policyIQ as a tool to assist in the efficient collection, storing and review of project workpapers, deliverables and other critical project content. Business problems that our clients have used policyIQ to resolve include:
| • | Sarbanes Compliance Management: Clients use policyIQ to manage their entire Sarbanes compliance program, from risk assessment through remediation tracking. Electronic forms automate quarterly certifications, and reporting allows all stakeholders insight into the status of Sarbanes compliance at any time. |
| • | Policy and Procedure Management: With policyIQ as the central location for all organizational policies and procedures, all employees have access to the most current documentation — and using electronic forms, can easily document annual proof of compliance. |
| • | Internal Audit Programs: Companies use policyIQ to capture workpapers electronically, gathering all evidence in a central location and assigning testing to the appropriate auditors. With robust reporting, audit managers have oversight into the process and with built-in workflow, audits can flow through appropriate channels of approval. |
| • | Contract Management: policyIQ provides a central, secure location to house all contract documentation, allowing companies to index contracts for ease of searching and align view, edit and approve security appropriately. By utilizing custom fields to capture standard meta data, contracts can be categorized and communications established to alert all stakeholders of upcoming renewals or milestones. |
17
Table of Contents
Sample Engagement — Fresh Approach to Sarbanes Compliance: For a publicly traded manufacturing company with global operations, RGP was engaged to bring efficiency and consistency to its Sarbanes compliance and internal audit programs. Using policyIQ, our consulting team was able to:
| • | Implement the 2013 COSO Framework, with mapping to entity level controls, in order to meet expectations by external auditors and the Public Company Accounting Oversight Board |
| • | Integrate workflow processes on all control reviews and audit testing to improve quality assurance over documentation and oversight on audit testing |
| • | Establish consistent processes for Sarbanes documentation and testing across multiple business units |
Operations
We generally provide our professional services to clients at a local level, with the oversight of our regional managing directors and consultation of our corporate management team. The managing director, client service director(s) and recruiting director(s) in each office are responsible for initiating client relationships, identifying consultants specifically skilled to perform client projects, ensuring client and consultant satisfaction throughout engagements and maintaining client relationships post-engagement. Throughout this process, the corporate management team and regional managing directors are available to consult with the managing director with respect to client services.
Our offices operate in an entrepreneurial manner. The managing directors of our offices are given significant autonomy in the daily operations of their respective offices, and are responsible for overall guidance and supervision, budgeting and forecasting, sales and marketing, pricing and hiring within their office. We believe that a substantial portion of the buying decisions made by our clients are made on a local or regional basis and that our offices most often compete with other professional services providers on a local or regional basis. Because our managing directors are in the best position to understand the local and regional outsourced professional services market and because clients often prefer local relationships, we believe that a decentralized operating environment maximizes operating performance and contributes to employee and client satisfaction.
We believe that our ability to deliver professional services successfully to clients is dependent on our managing directors working together as a collegial and collaborative team, at times working jointly on client projects. To build a sense of team effort and increase camaraderie among our managing directors, we have an incentive program for our office management that awards annual bonuses based on both the performance of the Company and the performance of the individual. We also share across the Company the best and most effective practices of our highest achieving offices and use this as an introductory tool with new managing directors. New managing directors also spend time with another practice, partnering with experienced managing directors and other senior management personnel. This allows the veteran managing directors to share their success stories, foster the culture of the Company with new managing directors and review specific client and consultant development programs. We believe these team-based practices enable us to better serve clients who prefer a centrally organized service approach.
From our corporate headquarters in Irvine, California, we provide centralized administrative, marketing, finance, HR, IT, legal and real estate support. Our financial reporting is also centralized in our corporate service center. This center handles invoicing, accounts payable and collections, and administers HR services including employee compensation and benefits administration for North American offices. We also have a business support operations center in our Utrecht, Netherlands office to provide centralized finance, HR, IT, payroll and legal support to our European offices. In addition, in North America, we have a corporate networked IT platform with centralized financial reporting capabilities and a front office client management system. These centralized functions minimize the administrative burdens on our office management and allow them to spend more time focused on client and consultant development.
Business Development
Our business development initiatives are composed of:
| • | local initiatives focused on existing clients and target companies |
| • | national and international targeting efforts focused on multinational companies |
18
Table of Contents
| • | brand marketing activities |
| • | national and local advertising and direct mail programs |
Our business development efforts are driven by the networking and sales efforts of our management. In addition, the local office managing directors are assisted by management professionals focused on business development efforts on a national basis based on firm-wide and industry-focused initiatives. These business development professionals, teamed with the managing director and client service teams, are responsible for initiating and fostering relationships with the senior management and decision makers of our targeted client companies. These local efforts are supplemented with national marketing assistance. We believe that these efforts have been effective in generating incremental revenues from existing clients and developing new client relationships.
Our brand marketing initiatives help develop RGP’s image in the markets we serve. Our brand is reinforced by our professionally designed website, television, print, radio and online advertising, direct marketing, seminars, initiative-oriented brochures, social media and public relations efforts. We believe that our branding initiatives, coupled with our high-quality client service, help to differentiate us from our competitors and to establish RGP as a credible and reputable global professional services firm.
Competition
We operate in a competitive, fragmented market and compete for clients and consultants with a variety of organizations that offer similar services. Our principal competitors include:
| • | consulting firms |
| • | local, regional, national and international accounting and law firms |
| • | independent contractors |
| • | traditional and Internet-based staffing firms |
| • | the in-house or former in-house resources of our clients |
We compete for clients on the basis of the quality of professionals, the timely availability of professionals with requisite skills, the scope and price of services, and the geographic reach of services. We believe that our attractive value proposition, consisting of our highly qualified consultants, relationship-oriented approach and professional culture, enables us to differentiate ourselves from our competitors. Although we believe we compete favorably with our competitors, many of our competitors have significantly greater financial resources, generate greater revenues and have greater name recognition than we do.
Employees
As of May 28, 2016, we had a total of 3,283 employees, including 772 corporate and local office employees and 2,511 consultants. Our employees are not covered by any collective bargaining agreements.
Available Information
The Company’s principal executive offices are located at 17101 Armstrong Avenue, Irvine, California 92614. The Company’s telephone number is (714) 430-6400 and its website address is http://www.rgp.com. The information set forth in the website does not constitute part of this Annual Report on Form 10-K. We file our annual reports on Form 10-K, quarterly reports on Form 10-Q, and current reports on Form 8-K pursuant to Section 13(a) or 15(d) of the Securities Exchange Act of 1934 with the SEC electronically. These reports are maintained on the SEC’s website at http://www.sec.gov.
A free copy of our annual reports on Form 10-K, quarterly reports on Form 10-Q, and current reports on Form 8-K and amendments to those reports may be obtained on our website at http://www.rgp.com as soon as reasonably practicable after we file such reports with the SEC.
19
Table of Contents
| ITEM 1A. | RISK FACTORS. |
You should carefully consider the risks described below before making a decision to buy shares of our common stock. The order of the risks is not an indication of their relative weight or importance. The risks and uncertainties described below are not the only ones facing us but do represent those risks and uncertainties that we believe are material to us. Additional risks and uncertainties not presently known to us or that we currently deem immaterial may also adversely impact and impair our business. If any of the following risks actually occur, our business could be harmed. In that case, the trading price of our common stock could decline, and you might lose all or part of your investment. When determining whether to buy our common stock, you should also refer to the other information in this Annual Report on Form 10-K, including our financial statements and the related notes.
A future economic downturn or change in the use of outsourced professional services consultants could adversely affect our business.
While we believe general economic conditions continue to improve in most parts of the world, there continues to be some uncertainty regarding general economic conditions within some regions and countries in which we operate, leading to reluctance on the part of some multinational companies to spend on discretionary projects. Deterioration of or increased uncertainty related to the global economy or tightening credit markets could result in a reduction in the demand for our services and adversely affect our business in the future. In addition, the use of professional services consultants on a project-by-project basis could decline for non-economic reasons. In the event of a reduction in the demand for our consultants, our financial results would suffer.
Economic deterioration at one or more of our clients may also affect our allowance for doubtful accounts. Our estimate of losses resulting from our clients’ failure to make required payments for services rendered has historically been within our expectations and the provisions established. However, we cannot guarantee that we will continue to experience the same credit loss rates that we have in the past. A significant change in the liquidity or financial position of our clients could cause unfavorable trends in receivable collections and cash flows and additional allowances may be required. These additional allowances could materially affect the Company’s future financial results.
In addition, we are required to periodically, but at least annually, assess the recoverability of certain assets, including deferred tax assets and goodwill. Softening of the United States economy and international economies could adversely affect our evaluation of the recoverability of deferred tax assets, requiring us to record additional tax valuation allowances. Our assessment of impairment of goodwill is currently based upon comparing our market capitalization to our net book value. Therefore, a significant downturn in the future market value of our stock could potentially result in impairment reductions of goodwill and such an adjustment could materially affect the Company’s future financial results and financial condition.
The market for professional services is highly competitive, and if we are unable to compete effectively against our competitors, our business and operating results could be adversely affected.
We operate in a competitive, fragmented market, and we compete for clients and consultants with a variety of organizations that offer similar services. The competition is likely to increase in the future due to the expected growth of the market and the relatively few barriers to entry. Our principal competitors include:
| • | consulting firms; |
| • | local, regional, national and international accounting and other traditional professional services firms; |
| • | independent contractors; |
| • | traditional and Internet-based staffing firms; and |
| • | the in-house or former in-house resources of our clients. |
We cannot assure you that we will be able to compete effectively against existing or future competitors. Many of our competitors have significantly greater financial resources, greater revenues and greater name recognition, which may afford them an advantage in attracting and retaining clients and consultants and in offering pricing concessions. Some of our competitors in certain markets do not provide medical and other benefits to their consultants, thereby allowing them to potentially charge lower rates to clients. In addition, our competitors may be able to respond more quickly to changes in companies’ needs and developments in the professional services industry.
20
Table of Contents
Our business depends upon our ability to secure new projects from clients and, therefore, we could be adversely affected if we fail to do so.
We do not have long-term agreements with our clients for the provision of services and our clients may terminate engagements with us at any time. The success of our business is dependent on our ability to secure new projects from clients. For example, if we are unable to secure new client projects because of improvements in our competitors’ service offerings, or because of a change in government regulatory requirements, or because of an economic downturn decreasing the demand for outsourced professional services, our business is likely to be materially adversely affected. New impediments to our ability to secure projects from clients may develop over time, such as the increasing use by large clients of in-house procurement groups that manage their relationship with service providers.
We may be legally liable for damages resulting from the performance of projects by our consultants or for our clients’ mistreatment of our personnel.
Many of our engagements with our clients involve projects or services that are critical to our clients’ businesses. If we fail to meet our contractual obligations, we could be subject to legal liability or damage to our reputation, which could adversely affect our business, operating results and financial condition. While we are not currently subject to any client-related legal claims which we believe are material, it remains possible, because of the nature of our business, that we may be involved in litigation in the future that could materially affect our future financial results. Claims brought against us could have a serious negative effect on our reputation and on our business, financial condition and results of operations.
Because we are in the business of placing our personnel in the workplaces of other companies, we are subject to possible claims by our personnel alleging discrimination, sexual harassment, negligence and other similar activities by our clients. We may also be subject to similar claims from our clients based on activities by our personnel. The cost of defending such claims, even if groundless, could be substantial and the associated negative publicity could adversely affect our ability to attract and retain personnel and clients.
We may not be able to grow our business, manage our growth or sustain our current business.
Historically, we have grown by opening new offices and by increasing the volume of services provided through existing offices. Since the first quarter of fiscal 2010, we have had difficulty sustaining consistent revenue growth either quarter-over-quarter or in sequential quarters. There can be no assurance that we will be able to maintain or expand our market presence in our current locations or to successfully enter other markets or locations. Our ability to continue to grow our business will depend upon an improving global economy and a number of factors, including our ability to:
| • | grow our client base; |
| • | expand profitably into new geographies; |
| • | provide additional professional services offerings; |
| • | hire qualified and experienced consultants; |
| • | maintain margins in the face of pricing pressures; |
| • | manage costs; and |
| • | maintain or grow revenues and increase other service offerings from existing clients. |
Even if we are able to resume more rapid growth in our revenue, the growth will result in new and increased responsibilities for our management as well as increased demands on our internal systems, procedures and controls, and our administrative, financial, marketing and other resources. For instance, a limited number of clients are requesting that certain engagements be of a fixed fee nature rather than our traditional hourly time and materials approach, thus shifting a portion of the burden of financial risk and monitoring to us. Failure to adequately respond to these new responsibilities and demands may adversely affect our business, financial condition and results of operations.
21
Table of Contents
Our ability to serve clients internationally is integral to our strategy and our international activities expose us to additional operational challenges that we might not otherwise face.
Our international activities require us to confront and manage a number of risks and expenses that we would not face if we conducted our operations solely in the United States. Any of these risks or expenses could cause a material negative effect on our operating results. These risks and expenses include:
| • | difficulties in staffing and managing foreign offices as a result of, among other things, distance, language and cultural differences; |
| • | less flexible or future changes in labor laws and regulations in the U.S. and in foreign countries; |
| • | expenses associated with customizing our professional services for clients in foreign countries; |
| • | foreign currency exchange rate fluctuations when we sell our professional services in denominations other than United States’ dollars; |
| • | protectionist laws and business practices that favor local companies; |
| • | political and economic instability in some international markets; |
| • | multiple, conflicting and changing government laws and regulations; |
| • | trade barriers; |
| • | reduced protection for intellectual property rights in some countries; and |
| • | potentially adverse tax consequences. |
We have acquired, and may continue to acquire, companies, and these acquisitions could disrupt our business.
We have acquired several companies and we may continue to acquire companies in the future. Entering into an acquisition entails many risks, any of which could harm our business, including:
| • | diversion of management’s attention from other business concerns; |
| • | failure to integrate the acquired company with our existing business; |
| • | failure to motivate, or loss of, key employees from either our existing business or the acquired business; |
| • | potential impairment of relationships with our employees and clients; |
| • | additional operating expenses not offset by additional revenue; |
| • | incurrence of significant non-recurring charges; |
| • | incurrence of additional debt with restrictive covenants or other limitations; |
| • | addition of significant amounts of intangible assets, including goodwill, that are subject to periodic assessment of impairment, primarily through comparison of market value of our stock to our net book value, with such impairment potentially resulting in a material impact on our future financial results and financial condition; |
| • | dilution of our stock as a result of issuing equity securities; and |
| • | assumption of liabilities of the acquired company. |
We must provide our clients with highly qualified and experienced consultants, and the loss of a significant number of our consultants, or an inability to attract and retain new consultants, could adversely affect our business and operating results.
Our business involves the delivery of professional services, and our success depends on our ability to provide our clients with highly qualified and experienced consultants who possess the skills and experience necessary to satisfy their needs. At various
22
Table of Contents
times, such professionals can be in great demand, particularly in certain geographic areas or if they have specific skill sets. Our ability to attract and retain consultants with the requisite experience and skills depends on several factors including, but not limited to, our ability to:
| • | provide our consultants with either full-time or flexible-time employment; |
| • | obtain the type of challenging and high-quality projects that our consultants seek; |
| • | pay competitive compensation and provide competitive benefits; and |
| • | provide our consultants with flexibility as to hours worked and assignment of client engagements. |
There can be no assurance that we will be successful in accomplishing any of these factors and, even if we are, we cannot assure that we will be successful in attracting and retaining the number of highly qualified and experienced consultants necessary to maintain and grow our business.
Decreased effectiveness of equity compensation could adversely affect our ability to attract and retain employees.
We have historically used stock options as a component of our employee compensation program in order to align employees’ interests with the interests of our stockholders, encourage employee retention and provide competitive compensation packages. A significant portion of our options outstanding awarded prior to fiscal 2012 are priced at more than the current per share market value of our stock, limiting the grants from those years as a significant incentive to retain employees.
Our computer hardware and software and telecommunications systems are susceptible to damage, breach or interruption.
The management of our business is aided by the uninterrupted operation of our computer and telecommunication systems. These systems are vulnerable to security breaches, natural disasters or other catastrophic events, computer viruses, or other interruptions or damage stemming from power outages, equipment failure or unintended usage by employees. In particular, our employees may have access or exposure to personally identifiable or otherwise confidential information and customer data and systems, the misuse of which could result in legal liability. In addition, we rely on information technology systems to process, transmit and store electronic information and to communicate among our locations around the world and with our clients, partners and consultants. The breadth and complexity of this infrastructure increases the potential risk of security breaches. Security breaches, including cyber-attacks or cyber-intrusions by computer hackers, foreign governments, cyber terrorists or others with grievances against the industry in which we operate or us in particular, may disable or damage the proper functioning of our networks and systems. It is possible that our security controls over personal and other data may not prevent unauthorized access to, or destruction, loss, theft, misappropriation or release of personally identifiable or other proprietary, confidential, sensitive or valuable information of ours or others; this access could lead to potential unauthorized disclosure of confidential Company or client information that others could use to compete against us or for other disruptive, destructive or harmful purposes and outcomes. Any such disclosure or damage to our networks and systems could subject us to third party claims against us and reputational harm. If these events occur, our ability to attract new clients may be impaired or we may be subjected to damages or penalties. In addition, system-wide or local failures of these information technology systems could have a material adverse effect on our business, financial condition, results of operations or cash flows.
Our cash and short-term investments are subject to economic risk.
The Company invests its cash, cash equivalents and short-term investments in foreign and domestic bank deposits, money market funds, commercial paper and certificates of deposit. Certain of these investments are subject to general credit, liquidity, market and interest rate risks. In the event these risks caused a decline in value of any of the Company’s investments, it could adversely affect the Company’s financial condition.
Our business could suffer if we lose the services of one or more key members of our senior management.
Our future success depends upon the continued employment of our senior management team. The unforeseen departure of one or more key members of our senior management team could significantly disrupt our operations.
23
Table of Contents
Our quarterly financial results may be subject to significant fluctuations that may increase the volatility of our stock price.
Our results of operations could vary significantly from quarter to quarter. Factors that could affect our quarterly operating results include:
| • | our ability to attract new clients and retain current clients; |
| • | the mix of client projects; |
| • | the announcement or introduction of new services by us or any of our competitors; |
| • | the expansion of the professional services offered by us or any of our competitors into new locations both nationally and internationally; |
| • | changes in the demand for our services by our clients; |
| • | the entry of new competitors into any of our markets; |
| • | the number of consultants eligible for our offered benefits as the average length of employment with the Company increases; |
| • | the amount of vacation hours used by consultants or number of holidays in a quarter, particularly the day of the week on which they occur; |
| • | availability of consultants with the requisite skills in demand by clients; |
| • | changes in the pricing of our professional services or those of our competitors; |
| • | variation in foreign exchange rates from one quarter to the next used to translate the financial results of our international operations; |
| • | the amount and timing of operating costs and capital expenditures relating to management and expansion of our business; |
| • | the timing of acquisitions and related costs, such as compensation charges that fluctuate based on the market price of our common stock; and |
| • | the periodic fourth quarter consisting of 14 weeks, which occurred during the fiscal year ended May 31, 2014 and next occurs during the fiscal year ending May 30, 2020. |
Due to these factors, we believe that quarter-to-quarter comparisons of our results of operations are not meaningful indicators of future performance. It is possible that in some future periods, our results of operations may be below the expectations of investors. If this occurs, the price of our common stock could decline.
If our internal control over financial reporting does not comply with the requirements of Sarbanes, our business and stock price could be adversely affected.
Section 404 of Sarbanes requires us to evaluate periodically the effectiveness of our internal control over financial reporting, and to include a management report assessing the effectiveness of our internal controls as of the end of each fiscal year. Our management report on internal controls is contained in this Annual Report on Form 10-K. Section 404 also requires our independent registered public accountant to report on our internal control over financial reporting.
Our management does not expect that our internal control over financial reporting will prevent all errors or acts of fraud. A control system, no matter how well designed and operated, can provide only reasonable, not absolute, assurance that the control system’s objectives will be met. Further, the design of a control system must reflect the fact that there are resource constraints, and the benefits of controls must be considered relative to their costs. Because of the inherent limitations in all control systems, no evaluation of controls can provide absolute assurance that all control issues and instances of fraud, if any, involving us have been, or will be, detected. These inherent limitations include the realities that judgments in decision-making can be faulty and that breakdowns can occur because of simple errors or mistakes. Controls can also be circumvented by individual acts of a person, or by collusion among two or more people, or by management override of controls. The design of any system of controls is based in
24
Table of Contents
part on certain assumptions about the likelihood of future events, and we cannot assure you that any design will succeed in achieving its stated goals under all potential future conditions. Over time, controls may become inadequate because of changes in conditions or deterioration in the degree of compliance with policies and procedures. Because of the inherent limitations in a cost-effective control system, misstatements due to errors or fraudulent acts may occur and not be detected.
Although our management has determined, and our independent registered public accountant has attested, that our internal control over financial reporting was effective as of May 28, 2016, we cannot assure you that we or our independent registered public accountant will not identify a material weakness in our internal controls in the future. A material weakness in our internal control over financial reporting may require management and our independent registered public accountant to evaluate our internal controls as ineffective. If our internal control over financial reporting is not considered adequate, we may experience a loss of public confidence, which could have an adverse effect on our business and our stock price. Additionally, if our internal control over financial reporting otherwise fails to comply with the requirements of Sarbanes, our business and stock price could be adversely affected.
We may be subject to laws and regulations that impose difficult and costly compliance requirements and subject us to potential liability and the loss of clients.
In connection with providing services to clients in certain regulated industries, such as the gaming and energy industries, we are subject to industry-specific regulations, including licensing and reporting requirements. Complying with these requirements is costly and, if we fail to comply, we could be prevented from rendering services to clients in those industries in the future. Additionally, changes in these requirements, or in other laws applicable to us, in the future could increase our costs of compliance.
In addition, we may face challenges from certain state regulatory bodies governing the provision of certain professional services, like legal services or audit services. The imposition of such regulations could require additional financial and operational burdens on our business.
It may be difficult for a third party to acquire the Company, and this could depress our stock price.
Delaware corporate law and our amended and restated certificate of incorporation and amended and restated bylaws contain provisions that could delay, defer or prevent a change of control of the Company or our management. These provisions could also discourage proxy contests and make it difficult for you and other stockholders to elect directors and take other corporate actions. As a result, these provisions could limit the price that future investors are willing to pay for your shares. These provisions:
| • | authorize our board of directors to establish one or more series of undesignated preferred stock, the terms of which can be determined by the board of directors at the time of issuance; |
| • | divide our board of directors into three classes of directors, with each class serving a staggered three-year term. Because the classification of the board of directors generally increases the difficulty of replacing a majority of the directors, it may tend to discourage a third party from making a tender offer or otherwise attempting to obtain control of us and may make it difficult to change the composition of the board of directors; |
| • | prohibit cumulative voting in the election of directors which, if not prohibited, could allow a minority stockholder holding a sufficient percentage of a class of shares to ensure the election of one or more directors; |
| • | require that any action required or permitted to be taken by our stockholders must be effected at a duly called annual or special meeting of stockholders and may not be effected by any consent in writing; |
| • | state that special meetings of our stockholders may be called only by the chairman of the board of directors, by our chief executive officer, by the board of directors after a resolution is adopted by a majority of the total number of authorized directors, or by the holders of not less than 10% of our outstanding voting stock; |
| • | establish advance notice requirements for submitting nominations for election to the board of directors and for proposing matters that can be acted upon by stockholders at a meeting; |
| • | provide that certain provisions of our certificate of incorporation and bylaws can be amended only by supermajority vote (a 66 2⁄3 % majority) of the outstanding shares. In addition, our board of directors can amend our bylaws by majority vote of the members of our board of directors; |
25
Table of Contents
| • | allow our directors, not our stockholders, to fill vacancies on our board of directors; and |
| • | provide that the authorized number of directors may be changed only by resolution of the board of directors. |
We are required to recognize compensation expense related to employee stock options and our employee stock purchase plan. There is no assurance that the expense that we are required to recognize measures accurately the value of our share-based payment awards and the recognition of this expense could cause the trading price of our common stock to decline.
We measure and recognize compensation expense for all stock-based compensation based on estimated values. Thus, our operating results contain a non-cash charge for stock-based compensation expense related to employee stock options and our employee stock purchase plan. In general, accounting guidance requires the use of an option-pricing model to determine the value of share-based payment awards. This determination of value is affected by our stock price as well as assumptions regarding a number of highly complex and subjective variables. These variables include, but are not limited to, our expected stock price volatility over the term of the awards, and actual and projected employee stock option exercise behaviors. Option-pricing models were developed for use in estimating the value of traded options that have no vesting restrictions and are fully transferable. Because our employee stock options have certain characteristics that are significantly different from traded options, and because changes in the subjective assumptions can materially affect the estimated value, in management’s opinion the existing valuation models may not provide an accurate measure of the value of our employee stock options. Although the value of employee stock options is determined using an option-pricing model, that value may not be indicative of the fair value observed in a willing buyer/willing seller market transaction.
We may be unable to or elect not to pay our quarterly dividend payment.
The Company pays a regular quarterly dividend, subject to quarterly board of director approval. The payment of, or continuation of, the quarterly dividend is at the discretion of our board of directors and is dependent upon our financial condition, results of operations, capital requirements, general business conditions, tax treatment of dividends in the United States, potential future contractual restrictions contained in credit agreements and other agreements and other factors deemed relevant by our board of directors. We can give no assurance that dividends will be declared and paid in the future. The failure to pay the quarterly dividend or the discontinuance of the quarterly dividend could adversely affect the trading price of our common stock.
We may be unable to adequately protect our intellectual property rights, including our brand name. If we fail to adequately protect our intellectual property rights, the value of such rights may diminish and our results of operations and financial condition may be adversely affected.
We believe that establishing, maintaining and enhancing the RGP and Resources Global Professionals brand name is essential to our business. We have applied for United States and foreign registrations on these service marks. We have previously obtained United States registrations on our Resources Connection service mark and puzzle piece logo, Registration No. 2,516,522 registered December 11, 2001; No. 2,524,226 registered January 1, 2002; and No. 2,613,873, registered September 3, 2002, as well as certain foreign registrations. On March 29, 2013, we filed a United States trademark application for our RGP service mark and puzzle piece logo, Serial No. 85/890,836 as well as United States trademark applications on our RGP service mark, puzzle piece and tag line, Serial No. 85/890,838; our RGP Healthcare service mark and puzzle piece logo, Serial No. 85/890,839; our RGP Legal service mark and puzzle piece logo, Serial No. 85/890,843; and our RGP Search service mark and puzzle piece logo, Serial No. 85/890,845. We received approval of these applications and registration was granted as of December 2, 2014.
We had been aware from time to time of other companies using the name “Resources Connection” or some variation thereof and this contributed to our decision to adopt the operating company name of Resources Global Professionals. We obtained United States registration on our Resources Global Professionals service mark, Registration No. 3,298,841 registered September 25, 2007. However, our rights to this service mark are not currently protected in some of our foreign registrations, and there is no guarantee that any of our pending applications for such registration (or any appeals thereof or future applications) will be successful. Although we are not aware of other companies using the name “Resources Global Professionals” at this time, there could be potential trade name or service mark infringement claims brought against us by the users of these similar names and marks and those users may have service mark rights that are senior to ours. If these claims were successful, we could be forced to cease using
26
Table of Contents
the service mark “Resources Global Professionals” even if an infringement claim is not brought against us. It is also possible that our competitors or others will adopt service names similar to ours or that our clients will be confused by another company using a name, service mark or trademark similar to ours, thereby impeding our ability to build brand identity. We cannot assure you that our business would not be adversely affected if confusion did occur or if we were required to change our name.
In 2014, we developed a software product for the healthcare industry to address enterprise-wide incident management and patient safety issues. We have applied for registration in the United States and in the appropriate jurisdictions on the service mark for this product. On February 13, 2014, we filed a Nonprovisional Application, App. No. H180290, with the United States Patent Office for patent protection for this invention. There is no guarantee that this pending patent application will be approved. In addition, if our patent application is approved, third parties may knowingly or unknowingly infringe our proprietary rights and third parties may challenge the proprietary rights held by us. In any or each of these cases, we may be required to expend significant time and expense in order to prevent infringement or to enforce our rights.
| ITEM 1B. | UNRESOLVED STAFF COMMENTS. |
Not applicable.
| ITEM 2. | PROPERTIES. |
As of May 28, 2016, we maintained 45 domestic offices, all under operating lease agreements (except for the Irvine, California location), in the following metropolitan areas:
| Phoenix, Arizona | Honolulu, Hawaii | Cincinnati, Ohio | ||
| Irvine, California (2) | Chicago, Illinois | Cleveland, Ohio | ||
| Los Angeles, California (2) | Oakbrook Terrace, Illinois | Columbus, Ohio | ||
| Sacramento, California | Indianapolis, Indiana | Tulsa, Oklahoma | ||
| Santa Clara, California | Boston, Massachusetts | Portland, Oregon | ||
| San Diego, California | Detroit, Michigan | Philadelphia, Pennsylvania | ||
| San Francisco, California | Minneapolis, Minnesota | Pittsburgh, Pennsylvania | ||
| Walnut Creek, California | Kansas City, Missouri | Nashville, Tennessee | ||
| Woodland Hills, California | St. Louis, Missouri | Dallas, Texas | ||
| Denver, Colorado | Las Vegas, Nevada | Houston, Texas | ||
| Hartford, Connecticut | Parsippany, New Jersey | San Antonio, Texas | ||
| Stamford, Connecticut | Princeton, New Jersey | Seattle, Washington | ||
| Fort Lauderdale, Florida | New York, New York | Milwaukee, Wisconsin | ||
| Tampa, Florida | Charlotte, North Carolina | Washington, D.C. (McLean, Virginia) | ||
| Atlanta, Georgia |
As of May 28, 2016, we maintained 23 international offices under operating lease agreements, located in the following cities and countries:
| Sydney, Australia | Dublin, Ireland | Hong Kong, People’s Republic of China | ||
| Brussels, Belgium | Milan, Italy | Shanghai, People’s Republic of China | ||
| Calgary, Canada | Tokyo, Japan | Manila, Philippines | ||
| Toronto, Canada | Mexico City, Mexico | Singapore | ||
| Paris, France | Amsterdam (Utrecht), Netherlands | Seoul, South Korea | ||
| Frankfurt, Germany | Oslo, Norway | Stockholm, Sweden | ||
| Bangalore, India | Beijing, People’s Republic of China | Taipei, Taiwan | ||
| Mumbai, India | London, United Kingdom |
Our corporate offices are located in Irvine, California. We own an approximately 56,200 square foot office building in Irvine, California, of which we occupied approximately 38,000 square feet as of May 28, 2016, including space occupied by our Orange County, California practice. Approximately 18,200 square feet is leased to independent third parties.
27
Table of Contents
| ITEM 3. | LEGAL PROCEEDINGS. |
We are not currently subject to any material legal proceedings; however, we are a party to various legal proceedings arising in the ordinary course of our business.
| ITEM 4. | MINE SAFETY DISCLOSURES. |
Not applicable.
28
Table of Contents
PART II
| ITEM 5. | MARKET FOR REGISTRANT’S COMMON EQUITY, RELATED STOCKHOLDER MATTERS AND ISSUER PURCHASES OF EQUITY SECURITIES. |
Price Range of Common Stock
Our common stock has traded on the NASDAQ Global Select Market under the symbol “RECN” since December 15, 2000. Prior to that time, there was no public market for our common stock. The approximate number of holders of record of our common stock as of July 11, 2016 was 40 (a holder of record is the name of an individual or entity that an issuer carries in its records as the registered holder (not necessarily the beneficial owner) of the issuer’s securities).
The following table sets forth the range of high and low closing sales prices reported on the NASDAQ Global Select Market for our common stock for the periods indicated.
| Price Range of Common Stock |
||||||||
| High | Low | |||||||
| Fiscal 2016: |
||||||||
| First Quarter |
$ | 16.85 | $ | 15.03 | ||||
| Second Quarter |
$ | 18.42 | $ | 14.94 | ||||
| Third Quarter |
$ | 18.60 | $ | 13.79 | ||||
| Fourth Quarter |
$ | 15.56 | $ | 13.19 | ||||
| Fiscal 2015: |
||||||||
| First Quarter |
$ | 15.79 | $ | 11.90 | ||||
| Second Quarter |
$ | 15.87 | $ | 13.04 | ||||
| Third Quarter |
$ | 18.23 | $ | 15.09 | ||||
| Fourth Quarter |
$ | 17.90 | $ | 15.69 | ||||
Dividend Policy
Our board of directors has established a quarterly dividend, subject to quarterly board of directors’ approval. Pursuant to declaration and approval by our board of directors, we declared a dividend of $0.10 per share of common stock during each quarter in fiscal 2016 and $0.08 per share of common stock during each quarter in fiscal 2015. On April 21, 2016, our board of directors declared a regular quarterly dividend of $0.10 per share of our common stock. The dividend was payable on June 16, 2016 to stockholders of record at the close of business on May 19, 2016. Continuation of the quarterly dividend will be at the discretion of our board of directors and will depend upon our financial condition, results of operations, capital requirements, general business condition, contractual restrictions contained in our current or future credit agreements and other agreements, and other factors deemed relevant by our board of directors.
Issuances of Unregistered Securities
None.
Issuer Purchases of Equity Securities
In July 2015, our board of directors approved a stock repurchase program, authorizing the purchase, at the discretion of our senior executives, of our common stock for an aggregate dollar limit not to exceed $150.0 million. This program commenced in February 2016 upon the exhaustion of the previous stock repurchase program of $150 million approved by the Company’s board of directors in April 2011. Subject to the aggregate dollar limit, the currently authorized stock repurchase program does not have an expiration date. Repurchases under the program may take place in the open market or in privately negotiated transactions and may be made pursuant to a Rule 10b5-1 plan.
29
Table of Contents
The table below provides information regarding our stock repurchases made during the fourth quarter of fiscal 2016 under our stock repurchase program.
| Period |
Total Number of Shares Purchased |
Average Price Paid per Share |
Total Number of Shares Purchased as Part of Publicly Announced Program |
Approximate Dollar Value of Shares that May Yet be Purchased Under All Programs |
||||||||||||
| February 28, 2016 — March 26, 2016 |
— | $ | — | — | $ | 146,706,942 | ||||||||||
| March 27, 2016 — April 23, 2016 |
167,669 | $ | 13.89 | 167,669 | 144,378,000 | |||||||||||
| April 24, 2016 — May 28, 2016 |
390,840 | $ | 14.82 | 390,840 | 138,586,170 | |||||||||||
|
|
|
|
|
|||||||||||||
| Total February 28, 2016 — May 28, 2016 |
558,509 | $ | 14.54 | 558,509 | $ | 138,586,170 | ||||||||||
|
|
|
|
|
|||||||||||||
Performance Graph
Set forth below is a line graph comparing the annual percentage change in the cumulative total return to the holders of our common stock with the cumulative total return of the Russell 3000 Index, a customized peer group consisting of eleven companies listed below the following table and a combined classification of companies under Standard Industry Codes as 8742-Management Consulting Services for the five years ended May 28, 2016. The graph assumes $100 was invested on May 28, 2011 in our common stock and in each index (based on prices from the close of trading on May 28, 2011), and that all dividends are reinvested. Stockholder returns over the indicated period may not be indicative of future stockholder returns.
The information contained in the performance graph shall not be deemed to be “soliciting material” or to be “filed” with the SEC, nor shall such information be incorporated by reference into any future filing under the Securities Act of 1933 or the Securities Exchange Act of 1934, except to the extent that the Company specifically incorporates it by reference into such filing.
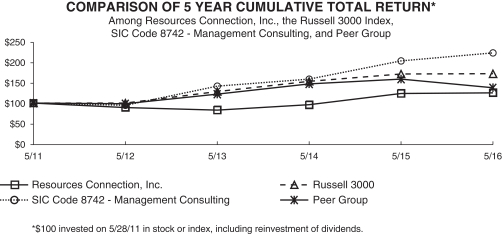
| For the Fiscal Years Ended | ||||||||||||||||||||||||
| May 28, 2011 |
May 26, 2012 |
May 25, 2013 |
May 31, 2014 |
May 30, 2015 |
May 28, 2016 |
|||||||||||||||||||
| Resources Connection, Inc. |
$ | 100.00 | $ | 89.31 | $ | 82.81 | $ | 95.58 | $ | 123.37 | $ | 125.11 | ||||||||||||
| Russell 3000 |
$ | 100.00 | $ | 99.76 | $ | 128.07 | $ | 152.93 | $ | 171.06 | $ | 171.49 | ||||||||||||
| SIC Code 8742 — Management Consulting |
$ | 100.00 | $ | 94.23 | $ | 141.13 | $ | 158.11 | $ | 202.65 | $ | 222.37 | ||||||||||||
| Peer Group |
$ | 100.00 | $ | 98.53 | $ | 121.62 | $ | 146.59 | $ | 158.48 | $ | 137.75 | ||||||||||||
The Company’s customized peer group includes the following eleven professional services companies that we believe reflect the competitive landscape in which the Company operates and acquires talent: CRA International, Inc.; FTI Consulting, Inc.; Heidrick & Struggles International, Inc.; Hudson Global, Inc.; Huron Consulting Group Inc.; ICF International, Inc.; Kforce, Inc.; Korn/Ferry International; Navigant Consulting, Inc.; The Advisory Board Company; and The Corporate Executive Board Company. The Company’s compensation committee, a committee of our board of directors comprised of independent directors, reviews the composition of the peer group annually to ensure its alignment with the Company’s size, practice areas, business model delivery and geographic reach.
30
Table of Contents
| ITEM 6. | SELECTED FINANCIAL DATA. |
You should read the following selected historical consolidated financial data in conjunction with our Consolidated Financial Statements and related notes beginning on page 48 and “Management’s Discussion and Analysis of Financial Condition and Results of Operations” beginning on page 33. The Consolidated Statements of Operations data for the years ended May 25, 2013 and May 26, 2012 and the Consolidated Balance Sheet data at May 31, 2014, May 25, 2013 and May 26, 2012 were derived from our audited Consolidated Financial Statements that are not included in this Annual Report on Form 10-K. The Consolidated Statements of Operations data for the years ended May 28, 2016, May 30, 2015 and May 31, 2014 and the Consolidated Balance Sheet data at May 28, 2016 and May 30, 2015 were derived from our audited Consolidated Financial Statements that are included elsewhere in this Annual Report on Form 10-K. Historical results are not necessarily indicative of results that may be expected for any future periods.
| Years Ended | ||||||||||||||||||||
| May 28, 2016 |
May 30, 2015 |
May 31, 2014 (1) |
May 25, 2013 |
May 26, 2012 |
||||||||||||||||
| (In thousands, except per common share and other data) | ||||||||||||||||||||
| Revenue |
$ | 598,521 | $ | 590,589 | $ | 567,181 | $ | 556,334 | $ | 571,763 | ||||||||||
| Direct cost of services, primarily payroll and related taxes for professional services employees |
366,355 | 362,227 | 351,359 | 342,040 | 352,524 | |||||||||||||||
|
|
|
|
|
|
|
|
|
|
|
|||||||||||
| Gross margin |
232,166 | 228,362 | 215,822 | 214,294 | 219,239 | |||||||||||||||
| Selling, general and administrative expenses |
174,806 | 173,797 | 172,531 | 168,318 | 170,992 | |||||||||||||||
| Employee portion of contingent consideration (2) |
— | — | — | — | (500 | ) | ||||||||||||||
| Contingent consideration adjustment (3) |
— | — | — | — | (33,440 | ) | ||||||||||||||
| Amortization of intangible assets |
90 | 918 | 1,688 | 1,694 | 3,364 | |||||||||||||||
| Depreciation expense |
3,467 | 3,389 | 3,628 | 4,580 | 5,731 | |||||||||||||||
|
|
|
|
|
|
|
|
|
|
|
|||||||||||
| Income from operations |
53,803 | 50,258 | 37,975 | 39,702 | 73,092 | |||||||||||||||
| Interest income |
(186 | ) | (148 | ) | (168 | ) | (175 | ) | (252 | ) | ||||||||||
|
|
|
|
|
|
|
|
|
|
|
|||||||||||
| Income before provision for income taxes |
53,989 | 50,406 | 38,143 | 39,877 | 73,344 | |||||||||||||||
| Provision for income taxes |
23,546 | 22,898 | 18,257 | 19,373 | 32,202 | |||||||||||||||
|
|
|
|
|
|
|
|
|
|
|
|||||||||||
| Net income |
$ | 30,443 | $ | 27,508 | $ | 19,886 | $ | 20,504 | $ | 41,142 | ||||||||||
|
|
|
|
|
|
|
|
|
|
|
|||||||||||
| Net income per common share: |
||||||||||||||||||||
| Basic |
$ | 0.82 | $ | 0.73 | $ | 0.51 | $ | 0.50 | $ | 0.94 | ||||||||||
|
|
|
|
|
|
|
|
|
|
|
|||||||||||
| Diluted |
$ | 0.81 | $ | 0.72 | $ | 0.51 | $ | 0.50 | $ | 0.94 | ||||||||||
|
|
|
|
|
|
|
|
|
|
|
|||||||||||
| Weighted average common shares outstanding: |
||||||||||||||||||||
| Basic |
37,037 | 37,825 | 39,216 | 41,108 | 43,541 | |||||||||||||||
|
|
|
|
|
|
|
|
|
|
|
|||||||||||
| Diluted |
37,608 | 38,248 | 39,307 | 41,151 | 43,599 | |||||||||||||||
|
|
|
|
|
|
|
|
|
|
|
|||||||||||
| Cash dividends declared per common share |
$ | 0.40 | $ | 0.32 | $ | 0.28 | $ | 0.24 | $ | 0.20 | ||||||||||
|
|
|
|
|
|
|
|
|
|
|
|||||||||||
| Other Data: |
||||||||||||||||||||
| Number of offices open at end of year |
68 | 68 | 68 | 73 | 77 | |||||||||||||||
| Total number of consultants on assignment at end of year |
2,511 | 2,516 | 2,401 | 2,208 | 2,317 | |||||||||||||||
| Cash dividends paid |
$ | 14,085 | $ | 11,748 | $ | 10,625 | $ | 9,497 | $ | 8,306 | ||||||||||
| (1) | The year ended May 31, 2014 consisted of 53 weeks. All other years presented consisted of 52 weeks. |
| (2) | During the year ended May 26, 2012, the Company determined that the estimated contingent consideration accrued in a prior year and potentially payable to employees related to the Sitrick Brincko Group acquisition would not be payable and the accrual was reversed. |
31
Table of Contents
| (3) | The contingent consideration adjustment includes a net reduction of the contingent consideration liability related to the purchase of Sitrick Brincko Group of $33.4 million for the year ended May 26, 2012. The fiscal 2012 net adjustment is related to revised estimates of fair value of contingent consideration based upon updates to the probability weighted assessment of various projected average earnings before interest, taxes, depreciation and amortization (“EBITDA”) scenarios associated with the acquisition of Sitrick Brincko Group. |
| May 28, 2016 |
May 30, 2015 |
May 31, 2014 |
May 25, 2013 |
May 26, 2012 |
||||||||||||||||
| (Amounts in thousands) | ||||||||||||||||||||
| Cash, cash equivalents, short-term investments and U.S. government agency securities |
$ | 116,046 | $ | 112,238 | $ | 114,277 | $ | 119,012 | $ | 128,115 | ||||||||||
| Working capital |
156,150 | 152,760 | 150,287 | 155,844 | 166,584 | |||||||||||||||
| Total assets |
422,238 | 416,981 | 420,078 | 417,640 | 430,719 | |||||||||||||||
| Stockholders’ equity |
342,649 | 340,452 | 345,761 | 352,327 | 365,868 | |||||||||||||||
32
Table of Contents
| ITEM 7. | MANAGEMENT’S DISCUSSION AND ANALYSIS OF FINANCIAL CONDITION AND RESULTS OF OPERATIONS. |
The following discussion and analysis of our financial condition and results of operations should be read in conjunction with our financial statements and related notes. This discussion and analysis contains forward-looking statements that involve risks and uncertainties. Our actual results could differ materially from those anticipated in these forward-looking statements as a result of certain factors including, but not limited to, those discussed in Part I Item 1A. “Risk Factors.” and elsewhere in this Annual Report on Form 10-K.
Overview
RGP is a multinational consulting firm that provides consulting and business initiative support services to its global client base in the areas of accounting; finance; corporate governance, risk and compliance management; corporate advisory, strategic communications and restructuring; information management; human capital; supply chain management; and legal and regulatory. We assist our clients with projects requiring specialized expertise in:
| • | Finance and accounting services including process transformation and improvement; financial reporting and analysis; technical and operational accounting; merger and acquisition due diligence; audit response; implementation of new accounting standards such as the new requirements for revenue recognition; and remediation support |
| • | Information management services including strategy development; program and project management; business and technology integration; data strategy, including data security and privacy; and Business Performance Management |
| • | Corporate advisory, strategic communications and restructuring services |
| • | Corporate governance, risk and compliance management services including contract and regulatory compliance efforts under, for example, the Dodd-Frank Wall Street Reform and Consumer Protection Act and the Sarbanes Oxley Act of 2002 (“Sarbanes”); Enterprise Risk Management; internal controls management; and operation and IT audits |
| • | Supply chain management services including supply chain strategy development; procurement and supplier management; logistics and materials management; supply chain planning and forecasting; and Unique Device Identification compliance |
| • | Human capital services including change management; organization development and effectiveness; and optimization of human resources technology and operations |
| • | Legal and regulatory services with projects, secondments or tactical needs including commercial transactions; compliance initiatives; law department operations and business strategy; and litigation support |
We were founded in June 1996 by a team at Deloitte, led by our chairman, Donald B. Murray, who was then a senior partner with Deloitte. Our founders created Resources Connection to capitalize on the increasing demand for high quality outsourced professional services. We operated as a part of Deloitte until April 1999. In April 1999, we completed a management-led buyout in partnership with several investors. In December 2000, we completed our initial public offering of common stock and began trading on the NASDAQ Stock Market. We currently trade on the NASDAQ Global Select Market. We operate under the acronym RGP, branding for our operating entity name of Resources Global Professionals.
We operated solely in the United States until fiscal year 2000, when we opened our first three international offices and began to expand geographically to meet the demand for project consulting services across the world. As of May 28, 2016, we served clients from offices in 20 countries, including 23 international offices and 45 offices in the United States. Our global footprint allows the Company to support the global initiatives of our multinational client base.
We expect to continue opportunistic domestic and multinational expansion while also investing in complementary professional services lines that we believe will augment our service offerings.
We primarily charge our clients on an hourly basis for the professional services of our consultants. We recognize revenue once services have been rendered and invoice the majority of our clients in the United States on a weekly basis. Some of our clients
33
Table of Contents
served by our international offices are billed on a monthly basis. Our clients are contractually obligated to pay us for all hours billed. To a much lesser extent, we also earn revenue if a client hires one of our consultants. This type of contractually non-refundable revenue is recognized at the time our client completes the hiring process and represented 0.5% of our revenue for each of the years ended May 28, 2016, May 30, 2015 and May 31, 2014. We periodically review our outstanding accounts receivable balance and determine an estimate of the amount of those receivables we believe may prove uncollectible. Our provision for bad debts, if any, is included in our selling, general and administrative expenses.
The costs to pay our professional consultants and all related benefit and incentive costs, including provisions for paid time off and other employee benefits, are included in direct cost of services. We pay most of our consultants on an hourly basis for all hours worked on client engagements and, therefore, direct cost of services tends to vary directly with the volume of revenue we earn. We expense the benefits we pay to our consultants as they are earned. These benefits include paid time off and holidays; a discretionary bonus plan; subsidized group health, dental and life insurance programs; a matching 401(k) retirement plan; the ability to participate in the Company’s Employee Stock Purchase Plan (“ESPP”); and professional development and career training. In addition, we pay the related costs of employment, including state and federal payroll taxes, workers’ compensation insurance, unemployment insurance and other costs. Typically, a consultant must work a threshold number of hours to be eligible for all of the benefits. We recognize direct cost of services when incurred.
Selling, general and administrative expenses include the payroll and related costs of our internal management as well as general and administrative, marketing and recruiting costs. Our sales and marketing efforts are led by our management team who are salaried employees and earn bonuses based on operating results for the Company as a whole and each individual’s performance.
The Company’s fiscal year consists of 52 or 53 weeks, ending on the Saturday in May closest to May 31. Fiscal years 2016 and 2015 consisted of four 13 week quarters and a total of 52 weeks of activity for the fiscal year. For fiscal years of 53 weeks, such as fiscal 2014, the first three quarters consisted of 13 weeks each and the fourth quarter consisted of 14 weeks.
Critical Accounting Policies
The following discussion and analysis of our financial condition and results of operations are based upon our Consolidated Financial Statements, which have been prepared in accordance with generally accepted accounting principles (“GAAP”) in the United States. The preparation of these financial statements requires us to make estimates and judgments that affect the reported amounts of assets and liabilities and disclosure of contingent assets and liabilities at the date of the financial statements and the reported amounts of revenues and expenses during the reporting period.
The following represents a summary of our critical accounting policies, defined as those policies that we believe: (a) are the most important to the portrayal of our financial condition and results of operations and (b) involve inherently uncertain issues that require management’s most difficult, subjective or complex judgments.
Valuation of long-lived assets — We assess the potential impairment of long-lived tangible and intangible assets periodically or whenever events or changes in circumstances indicate that the carrying value may not be recoverable. Our goodwill is not subject to periodic amortization. This asset is considered to have an indefinite life and its carrying value is required to be assessed by us for impairment at least annually. Depending on future market values of our stock, our operating performance and other factors, these assessments could potentially result in impairment reductions of this intangible asset in the future and this adjustment may materially affect the Company’s future financial results and financial condition.
Allowance for doubtful accounts — We maintain an allowance for doubtful accounts for estimated losses resulting from our clients failing to make required payments for services rendered. We estimate this allowance based upon our knowledge of the financial condition of our clients (which may not include knowledge of all significant events), review of historical receivable and reserve trends and other pertinent information. While such losses have historically been within our expectations and the provisions established, we cannot guarantee that we will continue to experience the same credit loss rates that we have in the past. A
34
Table of Contents
significant change in the liquidity or financial position of our clients could cause unfavorable trends in receivable collections and additional allowances may be required. These additional allowances could materially affect the Company’s future financial results.
Income taxes — In order to prepare our Consolidated Financial Statements, we are required to make estimates of income taxes, if applicable, in each jurisdiction in which we operate. The process incorporates an assessment of any current tax exposure together with temporary differences resulting from different treatment of transactions for tax and financial statement purposes. These differences result in deferred tax assets and liabilities that are included in our Consolidated Balance Sheets. The recovery of deferred tax assets from future taxable income must be assessed and, to the extent recovery is not likely, we will establish a valuation allowance. An increase in the valuation allowance results in recording additional tax expense and any such adjustment may materially affect the Company’s future financial result. If the ultimate tax liability differs from the amount of tax expense we have reflected in the Consolidated Statements of Operations, an adjustment of tax expense may need to be recorded and this adjustment may materially affect the Company’s future financial results and financial condition.
Revenue recognition — We primarily charge our clients on an hourly basis for the professional services of our consultants. We recognize revenue once services have been rendered and invoice the majority of our clients in the United States on a weekly basis. Some of our clients served by our international offices are billed on a monthly basis. Our clients are contractually obligated to pay us for all hours billed. To a much lesser extent, we also earn revenue if a client hires one of our consultants. This type of contractually non-refundable revenue is recognized at the time our client completes the hiring process.
Stock-based compensation — Under our 2014 Performance Incentive Plan, officers, employees, and outside directors have received or may receive grants of restricted stock, stock units, options to purchase common stock or other stock or stock-based awards. Under our ESPP, eligible officers and employees may purchase our common stock in accordance with the terms of the plan.
The Company estimates a value for employee stock options on the date of grant using an option-pricing model. We have elected to use the Black-Scholes option-pricing model which takes into account assumptions regarding a number of highly complex and subjective variables. These variables include the expected stock price volatility over the term of the awards and actual and projected employee stock option exercise behaviors. Additional variables to be considered are the expected term, expected dividends and the risk-free interest rate over the expected term of our employee stock options. In addition, because stock-based compensation expense recognized in the Consolidated Statements of Operations is based on awards ultimately expected to vest, it is reduced for estimated forfeitures. Forfeitures must be estimated at the time of grant and revised, if necessary, in subsequent periods if actual forfeitures differ from those estimates. Forfeitures are estimated based on historical experience. If facts and circumstances change and we employ different assumptions in future periods, the compensation expense recorded may differ materially from the amount recorded in the current period.
The Company uses its historical volatility over the expected life of the stock option award to estimate the expected volatility of the price of its common stock. The risk-free interest rate assumption is based upon observed interest rates appropriate for the term of our employee stock options. The impact of expected dividends ($0.10 per share for each quarter during fiscal 2016 and $0.08 per share for each quarter of fiscal 2015) is also incorporated in determining the estimated value per share of employee stock option grants. Such dividends are subject to quarterly board of director approval. The Company’s expected life of stock option grants is 5.6 years for non-officers and 7.7 years for officers. The Company uses its historical volatility over the expected life of the stock option award to estimate the expected volatility of the price of its common stock. The Company reviews the underlying assumptions related to stock-based compensation at least annually.
We base our estimates on historical experience and on various other assumptions that are believed to be reasonable under the circumstances, the results of which form the basis for making judgments about the carrying value of assets and liabilities. Actual results may differ from these estimates under different assumptions or conditions.
35
Table of Contents
Results of Operations
The following tables set forth, for the periods indicated, our Consolidated Statements of Operations data. These historical results are not necessarily indicative of future results.
| For the Years Ended | ||||||||||||
| May 28, 2016 |
May 30, 2015 |
May 31, 2014 |
||||||||||
| (Amounts in thousands) | ||||||||||||
| Revenue |
$ | 598,521 | $ | 590,589 | $ | 567,181 | ||||||
| Direct cost of services |
366,355 | 362,227 | 351,359 | |||||||||
|
|
|
|
|
|
|
|||||||
| Gross margin |
232,166 | 228,362 | 215,822 | |||||||||
| Selling, general and administrative expenses |
174,806 | 173,797 | 172,531 | |||||||||
| Amortization of intangible assets |
90 | 918 | 1,688 | |||||||||
| Depreciation expense |
3,467 | 3,389 | 3,628 | |||||||||
|
|
|
|
|
|
|
|||||||
| Income from operations |
53,803 | 50,258 | 37,975 | |||||||||
| Interest income |
(186 | ) | (148 | ) | (168 | ) | ||||||
|
|
|
|
|
|
|
|||||||
| Income before provision for income taxes |
53,989 | 50,406 | 38,143 | |||||||||
| Provision for income taxes |
23,546 | 22,898 | 18,257 | |||||||||
|
|
|
|
|
|
|
|||||||
| Net income |
$ | 30,443 | $ | 27,508 | $ | 19,886 | ||||||
|
|
|
|
|
|
|
|||||||
Our operating results for the periods indicated are expressed as a percentage of revenue below.
| For the Years Ended | ||||||||||||
| May 28, 2016 |
May 30, 2015 |
May 31, 2014 |
||||||||||
| Revenue |
100.0 | % | 100.0 | % | 100.0 | % | ||||||
| Direct cost of services |
61.2 | 61.3 | 61.9 | |||||||||
|
|
|
|
|
|
|
|||||||
| Gross margin |
38.8 | 38.7 | 38.1 | |||||||||
| Selling, general and administrative expenses |
29.2 | 29.4 | 30.4 | |||||||||
| Amortization of intangible assets |
— | 0.2 | 0.3 | |||||||||
| Depreciation expense |
0.6 | 0.5 | 0.7 | |||||||||
|
|
|
|
|
|
|
|||||||
| Income from operations |
9.0 | 8.6 | 6.7 | |||||||||
| Interest income |
— | — | — | |||||||||
|
|
|
|
|
|
|
|||||||
| Income before provision for income taxes |
9.0 | 8.6 | 6.7 | |||||||||
| Provision for income taxes |
3.9 | 3.9 | 3.2 | |||||||||
|
|
|
|
|
|
|
|||||||
| Net income |
5.1 | % | 4.7 | % | 3.5 | % | ||||||
|
|
|
|
|
|
|
|||||||
36
Table of Contents
We also assess the results of our operations using EBITDA, Adjusted EBITDA and Adjusted EBITDA Margin. EBITDA is defined as our earnings before interest, taxes, depreciation and amortization. We define Adjusted EBITDA as EBITDA plus stock-based compensation expense. Adjusted EBITDA Margin is calculated by dividing Adjusted EBITDA by revenue. These measures assist management in assessing our core operating performance. The following table presents EBITDA, Adjusted EBITDA and Adjusted EBITDA Margin for the periods indicated and includes a reconciliation of such measures to net income, the most directly comparable GAAP financial measure:
| For the Years Ended | ||||||||||||
| May 28, 2016 |
May 30, 2015 |
May 31, 2014 |
||||||||||
| (Amounts in thousands) | ||||||||||||
| Net income |
$ | 30,443 | $ | 27,508 | $ | 19,886 | ||||||
| Adjustments: |
||||||||||||
| Amortization of intangible assets |
90 | 918 | 1,688 | |||||||||
| Depreciation expense |
3,467 | 3,389 | 3,628 | |||||||||
| Interest income |
(186 | ) | (148 | ) | (168 | ) | ||||||
| Provision for income taxes |
23,546 | 22,898 | 18,257 | |||||||||
|
|
|
|
|
|
|
|||||||
| EBITDA |
57,360 | 54,565 | 43,291 | |||||||||
| Stock-based compensation expense |
6,280 | 5,989 | 6,519 | |||||||||
|
|
|
|
|
|
|
|||||||
| Adjusted EBITDA |
$ | 63,640 | $ | 60,554 | $ | 49,810 | ||||||
|
|
|
|
|
|
|
|||||||
| Revenue |
$ | 598,521 | $ | 590,589 | $ | 567,181 | ||||||
|
|
|
|
|
|
|
|||||||
| Adjusted EBITDA Margin |
10.6 | % | 10.3 | % | 8.8 | % | ||||||
|
|
|
|
|
|
|
|||||||
The financial measures and key performance indicators we use to assess our financial and operating performance above are not defined by, or calculated in accordance with, GAAP. A non-GAAP financial measure is defined as a numerical measure of a company’s financial performance that (i) excludes amounts, or is subject to adjustments that have the effect of excluding amounts, that are included in the comparable measure calculated and presented in accordance with GAAP in the consolidated statement of operations; or (ii) includes amounts, or is subject to adjustments that have the effect of including amounts, that are excluded from the comparable measure so calculated and presented.
EBITDA, Adjusted EBITDA and Adjusted EBITDA Margin are non-GAAP financial measures. We believe that EBITDA, Adjusted EBITDA and Adjusted EBITDA Margin provide useful information to our investors because they are financial measures used by management to assess the core performance of the Company. EBITDA, Adjusted EBITDA and Adjusted EBITDA Margin are not measurements of financial performance or liquidity under GAAP and should not be considered in isolation or construed as substitutes for net income or other cash flow data prepared in accordance with GAAP for purposes of analyzing our profitability or liquidity. These measures should be considered in addition to, and not as a substitute for, net income, earnings per share, cash flows or other measures of financial performance prepared in conformity with GAAP.
Further, EBITDA, Adjusted EBITDA and Adjusted EBITDA Margin have the following limitations:
| • | Although depreciation and amortization are non-cash charges, the assets being depreciated and amortized will often have to be replaced in the future and EBITDA and Adjusted EBITDA do not reflect any cash requirements for such replacements; |
| • | Equity based compensation is an element of our long-term incentive compensation program, although we exclude it as an expense from Adjusted EBITDA when evaluating our ongoing operating performance for a particular period; and |
| • | Other companies in our industry may calculate Adjusted EBITDA and Adjusted EBITDA Margin differently than we do, limiting their usefulness as a comparative measure. |
Because of these limitations, EBITDA, Adjusted EBITDA and Adjusted EBITDA Margin should not be considered a substitute for performance measures calculated in accordance with GAAP.
37
Table of Contents
Year Ended May 28, 2016 Compared to Year Ended May 30, 2015
Percentage change computations are based upon amounts in thousands.
Revenue. Revenue increased $7.9 million, or 1.3%, to $598.5 million for the year ended May 28, 2016 from $590.6 million for the year ended May 30, 2015. We deliver our services to clients, whether multi-national or locally based, in a similar fashion across the globe. In fiscal 2016, revenue increased in North America and Asia Pacific but declined in Europe as compared to fiscal 2015 as noted in the table below. Bill rates increased 0.8% on average in fiscal 2016 compared to fiscal 2015, while hours worked increased 1.4% over the same period. During fiscal 2016, revenue declined with certain clients in the energy services industries due to the on-going turmoil in the energy market, primarily in the U.S. The timing of stabilization with clients in this industry is uncertain.
The number of consultants on assignment at the end of fiscal 2016 was 2,511 compared to the 2,516 consultants engaged at the end of fiscal 2015 (the average number of consultants assigned was 2,503 in fiscal 2016 compared to 2,487 in fiscal 2015).
We operated 68 offices (23 abroad) at both May 28, 2016 and May 30, 2015. Our clients do not sign long-term contracts with us. As such, there can be no assurance as to future demand levels for the services that we provide or that future results can be reliably predicted by considering past trends.
Revenue for the Company’s major geographies across the globe consisted of the following (dollars in thousands):
| Revenue for the Years Ended | % of Total | |||||||||||||||||||
| May 28, 2016 |
May 30, 2015 |
% Change |
May 28, 2016 |
May 30, 2015 |
||||||||||||||||
| North America |
$ | 499,229 | $ | 492,207 | 1.4 | % | 83.4 | % | 83.3 | % | ||||||||||
| Europe |
57,714 | 59,350 | (2.8 | )% | 9.6 | 10.1 | ||||||||||||||
| Asia Pacific |
41,578 | 39,032 | 6.5 | % | 7.0 | 6.6 | ||||||||||||||
|
|
|
|
|
|
|
|
|
|||||||||||||
| Total |
$ | 598,521 | $ | 590,589 | 1.3 | % | 100.0 | % | 100.0 | % | ||||||||||
|
|
|
|
|
|
|
|
|
|||||||||||||
Our financial results are subject to fluctuations in the exchange rates of foreign currencies in relation to the United States dollar. Revenues denominated in foreign currencies are translated into United States dollars at the monthly average exchange rates in effect during each period. Thus, if the value of the United States dollar strengthens relative to the currencies of our non-United States based operations, our translated revenue (and expenses) will be lower. Using the comparable fiscal 2015 conversion rates, international revenues would have been higher than reported under GAAP by $8.9 million for the year ended May 28, 2016. Using these constant currency rates, which we believe provides a more comprehensive view of our business, our revenue increased by 1.8% in North America, by 6.0% in Europe, by 11.4% in Asia Pacific and by 2.9% overall.
The stronger U.S. dollar against most of the currencies of the international countries in which we operate during fiscal 2016 affected our average bill rate. Using the comparable fiscal 2015 conversion rates, the average bill rate would have increased 1.7% in fiscal 2016 compared to fiscal 2015.
Direct Cost of Services. Direct cost of services increased $4.2 million, or 1.2%, to $366.4 million for the year ended May 28, 2016 from $362.2 million for the year ended May 30, 2015. Comparing fiscal 2016 to fiscal 2015, direct cost of services increased primarily because of a 1.4% increase in hours worked, while the average consultant pay rate per hour was the same in both years. The direct cost of services as a percentage of revenue (“direct cost of services percentage”) was 61.2% and 61.3% for the years ended May 28, 2016 and May 30, 2015, respectively. Comparing the two fiscal years, there were no significant differences in the components comprising the direct cost of services percentage. The stronger U.S. dollar against most of the currencies of the international countries in which we operate during fiscal 2016 affected our average pay rate. Using the comparable fiscal 2015 conversion rates, the average pay rate would have increased 1.7% in fiscal 2016 compared to fiscal 2015.
Our target direct cost of services percentage is 60% for all of our offices.
38
Table of Contents
Selling, General and Administrative Expenses (“S, G & A”). S, G & A increased $1.0 million, or 0.6%, to $174.8 million for the year ended May 28, 2016 from $173.8 million for the year ended May 30, 2015. However, S, G & A decreased as a percentage of revenue from 29.4% in fiscal 2015 to 29.2% in fiscal 2016. Management and administrative head count was 772 at the end of fiscal 2016 and 742 at the end of fiscal 2015. S, G & A for the year ended May 28, 2016 includes additional non-cash stock-based compensation expense of approximately $900,000 related to the accelerated vesting of options previously granted to Donald Murray in connection with his transition from Executive Chairman to Chairman. During fiscal 2016, compensation and related benefit costs increased, attributable to headcount additions in U.S. and Asia Pacific in offices experiencing growth; and the Company increased its reserve for uncollectable accounts by $1.1 million. These costs were offset as compared to the prior year by a decrease in severance charges related to our European operations and decreases in other non-cash stock-based compensation expense. S, G & A in fiscal 2016 was favorably impacted by $3.0 million due to the strengthening of the U.S. dollar compared primarily to the Euro, Swedish Kronor and British Pound.
Sequential Operations. On a sequential quarter basis, fiscal 2016 fourth quarter revenue increased 3.9% to $152.5 million from $146.8 million, hours worked improved 2.8% and bill rates were up 0.8%. The Company’s sequential revenue increased in North America (3.1%), Europe (11.7%), and Asia Pacific (2.8%); using the comparable third quarter fiscal 2016 conversion rates, sequential revenue increased in North America (3.1%) and Europe (9.5%), but was down in Asia Pacific (-0.7%). Third quarter revenue was impacted by the Christmas, New Year’s and Chinese New Year’s holidays; there were no significant holidays in the fourth quarter.
The direct cost of services percentage improved from 62.6% in the third quarter to 60.1% in the fourth quarter. This improvement is primarily attributable to no compensated holidays in the United States during the fourth quarter compared to two in the third quarter, the declining impact of payroll taxes as the calendar year progresses and an improvement in the Company’s cost of its self-insured medical coverage of consultants.
S, G & A expenses increased $1.0 million from the quarter ended February 27, 2016 to the quarter ended May 28, 2016, primarily as a result of the increased spending for marketing programs, offset by the declining impact of payroll taxes as the calendar year progresses and improvement in the Company’s cost of self-insured medical coverage for employees. The leverage of S, G & A expenses improved to 29.1% in the fourth quarter of fiscal 2016 compared to 29.5% in the third quarter. This was attributable to the improved revenue in the fourth quarter, which provided leverage on certain fixed expenses, such as rent, in the fourth quarter.
Amortization and Depreciation Expense. Amortization of intangible assets decreased from $918,000 in fiscal 2015 to $90,000 in fiscal 2016. During fiscal 2016, the Company completed amortization of all of its intangible assets.
Depreciation expense increased from $3.4 million for the year ended May 30, 2015 to $3.5 million for the year ended May 28, 2016.
Interest Income. Interest income increased to $186,000 in fiscal 2016 compared to $148,000 in fiscal 2015. The increase in interest income is the result of improved rates on amounts available for investment in fiscal 2016. The Company has invested available cash in certificates of deposit and money market investments that have been classified as cash equivalents due to the short maturities of these investments. As of May 28, 2016, the Company had $25.0 million of investments in commercial paper and U.S. Government Agency securities with remaining maturity dates between three months and one year from the balance sheet date which are classified as short-term investments and considered “held-to-maturity” securities.
Income Taxes. The provision for income taxes increased from $22.9 million (effective rate of 45.4%) for the year ended May 30, 2015 to $23.5 million (effective rate of 43.6%) for the year ended May 28, 2016. The provision for taxes in both fiscal 2016 and fiscal 2015 resulted from taxes on income from operations in the United States and certain other foreign jurisdictions, a lower benefit for losses in certain foreign jurisdictions with tax rates lower than the United States statutory rates, and no benefit for losses in jurisdictions in which a valuation allowance on operating loss carryforwards had previously been established. The increase in the provision for income taxes is because of higher pretax income. The effective tax rate decreased because of higher U.S. pretax income coupled with lower international pretax losses. Decreased losses from countries with valuation allowances allow the tax expense to be spread over a higher pretax base, which lowers the effective tax rate. The effective tax rate in both fiscal years disproportionately magnifies the effect of the components of the tax rate that differ from the standard federal rate,
39
Table of Contents
including non-deductible permanent differences and incentive stock options (“ISOs”). Based upon current economic circumstances, management will continue to monitor the need to record additional or release existing valuation allowances in the future, primarily related to certain foreign jurisdictions. Realization of the currently reserved foreign deferred tax assets is dependent upon generating sufficient future taxable income in those foreign territories.
Periodically, the Company reviews the components of both book and taxable income to analyze the adequacy of the tax provision. There can be no assurance that the Company’s effective tax rate will remain constant in the future because of the lower benefit from the United States statutory rate for losses in certain foreign jurisdictions, the limitation on the benefit for losses in jurisdictions in which a valuation allowance for operating loss carryforwards has previously been established, and the unpredictability of timing and the amount of eligible disqualifying ISO exercises.
The Company cannot recognize a tax benefit for certain ISO grants unless and until the holder exercises his or her option and then sells the shares within a certain period of time. In addition, the Company can only recognize a potential tax benefit for employees’ acquisition and subsequent sale of shares purchased through the ESPP if the sale occurs within a certain defined period. As a result, the Company’s provision for income taxes is likely to fluctuate from these factors for the foreseeable future. Further, those tax benefits associated with ISO grants fully vested at the date of adoption of the current accounting rules governing stock awards will be recognized as additions to paid-in capital when and if those options are exercised and not as a reduction to the Company’s tax provision. The Company recognized a benefit of approximately $2.1 million and $2.2 million related to stock-based compensation for nonqualified stock options expensed and for eligible disqualifying ISO exercises during fiscal 2016 and 2015, respectively. The proportion of expense related to non-qualified stock option grants (for which the Company may recognize a tax benefit in the same quarter as the related compensation expense in most instances) is significant as compared to expense related to ISOs (including ESPPs). However, the timing and amount of eligible disqualifying ISO exercises cannot be predicted. The Company predominantly grants nonqualified stock options to employees in the United States.
The Company has maintained a position of being indefinitely reinvested in its foreign subsidiaries’ earnings by not expecting to remit foreign earnings in the foreseeable future. Being indefinitely reinvested does not require a deferred tax liability to be recognized on the foreign earnings. Management’s indefinite reinvestment position is supported by:
| 1) | RGP in the United States has generated more than enough cash to fund operations and expansion, including acquisitions. RGP uses its excess cash to, at its discretion, return cash to shareholders through dividend payments and stock repurchases. |
| 2) | RGP in the United States has no debt or any other current or known obligations that require cash to be remitted from foreign subsidiaries. |
| 3) | Management’s growth objectives include allowing cash to accumulate in RGP’s profitable foreign subsidiaries with the expectation of finding strategic expansion plans to further penetrate RGP’s most successful locations. |
| 4) | The consequences of distributing foreign earnings have historically been deemed to be tax inefficient for RGP or not materially beneficial. |
Year Ended May 30, 2015 Compared to Year Ended May 31, 2014
Computations of percentage change period over period are based upon our results, as rounded and presented herein.
Revenue. Revenue increased $23.4 million, or 4.1%, to $590.6 million for the year ended May 30, 2015 from $567.2 million for the year ended May 31, 2014. While we deliver our services to clients in a similar fashion across the globe, in fiscal 2015 revenue increased in North America and Asia Pacific but declined in Europe as compared to fiscal 2014. In light of continuing global economic uncertainty, we believe that certain geographic sectors of our global clients and prospects are initiating operational improvement projects cautiously, resulting in reduced levels of consulting spending, particularly in most European markets. Results in fiscal 2015 consisted of 52 weeks while fiscal 2014 consisted of 53 weeks. Revenue during the extra week of fiscal 2014 (which included the Memorial Day holiday in the United States) was $9.8 million. Excluding this extra week in fiscal 2014, revenue in fiscal 2015 increased $33.2 million (6.0%) over the fiscal 2014 amount. Comparing the 52-week period in fiscal 2015 to the 53-week period in fiscal 2014, the number of hours worked increased 8.1% compared to the prior year, offset by a 4.0% decrease in average bill rates from the prior year.
40
Table of Contents
The number of consultants on assignment at the end of fiscal 2015 was 2,516 compared to the 2,401 consultants engaged at the end of fiscal 2014 (the average number of consultants assigned was 2,487 in fiscal 2015 compared to 2,254 in fiscal 2014).
We operated 68 offices (23 abroad) at both May 30, 2015 and May 31, 2014. Our clients do not sign long-term contracts with us. As such, there can be no assurance as to future demand levels for the services that we provide or that future results can be reliably predicted by considering past trends.
Revenue for the Company’s major geographies across the globe consisted of the following (dollars in thousands):
| Revenue for the Years Ended | % of Total | |||||||||||||||||||
| May 30, 2015 |
May 31, 2014 |
% Change |
May 30, 2015 |
May 31, 2014 |
||||||||||||||||
| North America |
$ | 492,207 | $ | 453,659 | 8.5 | % | 83.3 | % | 80.0 | % | ||||||||||
| Europe |
59,350 | 76,960 | (22.9 | )% | 10.1 | 13.6 | ||||||||||||||
| Asia Pacific |
39,032 | 36,562 | 6.8 | % | 6.6 | 6.4 | ||||||||||||||
|
|
|
|
|
|
|
|
|
|||||||||||||
| Total |
$ | 590,589 | $ | 567,181 | 4.1 | % | 100.0 | % | 100.0 | % | ||||||||||
|
|
|
|
|
|
|
|
|
|||||||||||||
Our financial results are subject to fluctuations in the exchange rates of foreign currencies in relation to the United States dollar. Revenues denominated in foreign currencies are translated into United States dollars at the monthly average exchange rates in effect during each period. Thus, as the value of the United States dollar fluctuates relative to the currencies in our non-United States based operations, our revenue can be impacted. Using the comparable fiscal 2014 conversion rates, international revenues would have been higher than reported under GAAP by $8.8 million for the year ended May 30, 2015. Using these constant currency rates, the increase in revenue in North America and Asia Pacific would have been 8.8% and 12.1%, respectively, while the decline in Europe would have been 15.5%.
The strengthening of the U.S. dollar against most of the currencies of the international countries in which we operate was partially the cause of the average bill rate decline. Using the same exchange rates in fiscal 2015 as in fiscal 2014, the average bill rate would have decreased 2.4%. Average bill rates were also adversely impacted by a significant client engagement in the Philippines where bill rates are lower than most metropolitan areas.
Direct Cost of Services. Direct cost of services increased $10.8 million, or 3.1%, to $362.2 million for the year ended May 30, 2015 from $351.4 million for the year ended May 31, 2014. Comparing fiscal 2015 to fiscal 2014, direct cost of services increased primarily because of an 8.1% increase in hours worked, partially offset by a 4.8% decrease in the average consultant pay rate per hour. As noted above, fiscal 2015 consisted of 52 weeks while fiscal 2014 consisted of 53 weeks; we estimate that fiscal 2014 direct cost of services included an additional approximate $5.9 million because of this extra week. The direct cost of services as a percentage of revenue (“direct cost of services percentage”) was 61.3% and 61.9% for the years ended May 30, 2015 and May 31, 2014, respectively. The improvement in the direct cost of services percentage resulted primarily from a favorable change in the bill rate/pay rate relationship (bill rates were down 4.0% overall while the pay rate average decreased 4.8%). Average pay rates also decreased because of the strengthening U.S. dollar (similar to impact on average bill rates) and a significant client engagement in the Philippines where bill rates are lower than most metropolitan areas.
Our target direct cost of services percentage is 60% for all of our offices.
Selling, General and Administrative Expenses. S, G & A increased $1.3 million, or 0.8%, to $173.8 million for the year ended May 30, 2015 from $172.5 million for the year ended May 31, 2014. However, S, G & A decreased as a percentage of revenue from 30.4% in fiscal 2014 to 29.4% in fiscal 2015. Management and administrative head count was 742 at the end of fiscal 2015 and 712 at the end of fiscal 2014. The increase in S, G & A between the two fiscal periods was primarily attributable to headcount additions and related costs in U.S. offices experiencing growth. Comparing total S, G &A in fiscal 2015 to an adjusted 52-week fiscal 2014, S, G & A would have increased about 2.1%.
Sequential Operations. On a sequential quarter basis, fiscal 2015 fourth quarter revenue increased 1.4% to $148.8 million from $146.8 million, and hours worked improved 2.6% while bill rates were down 1.7%. The decrease in bill rates is attributable to
41
Table of Contents
the strengthening of the U.S. dollar against currencies in most of our foreign operations. The Company’s sequential revenue increased in North America (0.3%) and Asia Pacific (17.4%), and was flat in Europe; on a constant currency basis, sequential revenue increased in North America (0.4%), Asia Pacific (18.5%) and Europe (5.9%). In addition, while the fourth quarter contained the Memorial Day holiday in the U.S., the third quarter included the Christmas, New Year’s and Chinese New Year’s holidays.
The direct cost of services percentage improved from 62.7% in the third quarter to 61.2% in the fourth quarter. This improvement is primarily attributable to only one compensated holiday in the United States during the fourth quarter compared to two in the third quarter and the declining impact of payroll taxes as the calendar year progresses.
S, G & A expenses decreased $1.0 million from the quarter ended February 28, 2015 to the quarter ended May 30, 2015, primarily as a result of the declining impact of payroll taxes as the calendar year progresses and reduced spending for marketing. The leverage of S, G & A expenses improved to 28.5% in the fourth quarter of fiscal 2015 compared to 29.6% in the third quarter. This was attributable to the improved revenue in the fourth quarter, which provided leverage on certain fixed expenses, such as rent, in the fourth quarter.
Amortization and Depreciation Expense. Amortization of intangible assets decreased from $1.7 million in fiscal 2014 to $918,000 in fiscal 2015. During fiscal 2015, virtually all of the Company’s intangible assets were fully amortized except for a $90,000 remaining balance as of May 30, 2015. The remaining balance will be amortized during the fiscal year ending May 28, 2016.
Depreciation expense decreased from $3.6 million for the year ended May 31, 2014 to $3.4 million for the year ended May 30, 2015. Depreciation decreased as a number of assets were fully depreciated during fiscal 2014 and fiscal 2015.
Interest Income. Interest income declined to $148,000 in fiscal 2015 compared to $168,000 in fiscal 2014. The decrease in interest income is the result of lower cash balances available for investment in fiscal 2015. The Company has invested available cash in certificates of deposit and money market investments that have been classified as cash equivalents due to the short maturities of these investments. As of May 30, 2015, the Company had $25.0 million of investments in commercial paper and U.S. Government Agency securities with remaining maturity dates between three months and one year from the balance sheet date which are classified as short-term investments and considered “held-to-maturity” securities.
Income Taxes. The provision for income taxes increased from $18.3 million (effective rate of 47.9%) for the year ended May 31, 2014 to $22.9 million (effective rate of 45.4%) for the year ended May 30, 2015. The provision for taxes in both fiscal 2015 and fiscal 2014 resulted from taxes on income from operations in the United States and certain other foreign jurisdictions, a lower benefit for losses in certain foreign jurisdictions with tax rates lower than the United States statutory rates, and no benefit for losses in jurisdictions in which a valuation allowance on operating loss carryforwards had previously been established. The increase in the provision for income taxes is because of higher pretax income, primarily from the U.S. The effective tax rate decreased because of higher U.S. pretax income coupled with lower international pretax losses. Decreased losses from countries with valuation allowances allow the tax expense to be spread over a higher pretax base, which lowers the effective tax rate. The effective tax rate in both fiscal years disproportionately magnifies the effect of the components of the tax rate that differ from the standard federal rate, including non-deductible permanent differences and ISOs. Based upon current economic circumstances, management will continue to monitor the need to record additional or release existing valuation allowances in the future, primarily related to certain foreign jurisdictions. Realization of the currently reserved foreign deferred tax assets is dependent upon generating sufficient future taxable income in those foreign territories.
The Company cannot recognize a tax benefit for certain ISO grants unless and until the holder exercises his or her option and then sells the shares within a certain period of time. In addition, the Company can only recognize a potential tax benefit for employees’ acquisition and subsequent sale of shares purchased through the ESPP if the sale occurs within a certain defined period. As a result, the Company’s provision for income taxes is likely to fluctuate from these factors for the foreseeable future. Further, those tax benefits associated with ISO grants fully vested at the date of adoption of the current accounting rules governing stock awards will be recognized as additions to paid-in capital when and if those options are exercised and not as a reduction to the Company’s tax provision. The Company recognized a benefit of approximately $2.2 million and $2.1 million related to stock-
42
Table of Contents
based compensation for nonqualified stock options expensed and for eligible disqualifying ISO exercises during fiscal 2015 and 2014, respectively. The proportion of expense related to non-qualified stock option grants (for which the Company may recognize a tax benefit in the same quarter as the related compensation expense in most instances) is significant as compared to expense related to ISOs (including ESPPs). However, the timing and amount of eligible disqualifying ISO exercises cannot be predicted. The Company predominantly grants nonqualified stock options to employees in the United States.
The Company has maintained a position of being indefinitely reinvested in its foreign subsidiaries’ earnings by not expecting to remit foreign earnings in the foreseeable future. Being indefinitely reinvested does not require a deferred tax liability to be recognized on the foreign earnings. Management’s indefinite reinvestment position is supported by:
| 1) | RGP in the United States has generated more than enough cash to fund operations and expansion, including acquisitions. RGP uses its excess cash to, at its discretion, return cash to shareholders through dividend payments and stock repurchases. |
| 2) | RGP in the United States has no debt or any other current or known obligations that require cash to be remitted from foreign subsidiaries. |
| 3) | Management’s growth objectives include allowing cash to accumulate in RGP’s profitable foreign subsidiaries with the expectation of finding strategic expansion plans to further penetrate RGP’s most successful locations. |
| 4) | The consequences of distributing foreign earnings have historically been deemed to be tax inefficient for RGP or not materially beneficial. |
Quarterly Results
The following table sets forth our unaudited quarterly Consolidated Statements of Operations data for each of the eight quarters in the two-year period ended May 28, 2016. In the opinion of management, this data has been prepared on a basis substantially consistent with our audited Consolidated Financial Statements appearing elsewhere in this document, and includes all adjustments, consisting of normal recurring adjustments, necessary for a fair presentation of the data. The quarterly data should be read together with our Consolidated Financial Statements and related notes appearing elsewhere in this document. The operating results are not necessarily indicative of the results to be expected in any future period.
| Quarters Ended | ||||||||||||||||||||||||||||||||
| May 28, 2016 |
Feb. 27, 2016 |
Nov. 28, 2015 |
Aug. 29, 2015 |
May 30, 2015 |
Feb. 28, 2015 |
Nov. 29, 2014 |
Aug. 30, 2014 |
|||||||||||||||||||||||||
| (In thousands, except net income per common share) | ||||||||||||||||||||||||||||||||
| Revenue |
$ | 152,515 | $ | 146,779 | $ | 150,887 | $ | 148,340 | $ | 148,814 | $ | 146,832 | $ | 151,496 | $ | 143,447 | ||||||||||||||||
| Direct cost of services, primarily payroll and related taxes for professional services employees |
91,616 | 91,851 | 92,011 | 90,877 | 90,953 | 91,991 | 92,061 | 87,222 | ||||||||||||||||||||||||
|
|
|
|
|
|
|
|
|
|
|
|
|
|
|
|
|
|||||||||||||||||
| Gross margin |
60,899 | 54,928 | 58,876 | 57,463 | 57,861 | 54,841 | 59,435 | 56,225 | ||||||||||||||||||||||||
| Selling, general and administrative expenses |
44,360 | 43,318 | 43,171 | 43,957 | 42,464 | 43,478 | 43,576 | 44,279 | ||||||||||||||||||||||||
| Amortization of intangible assets |
— | 30 | 30 | 30 | 30 | 62 | 402 | 424 | ||||||||||||||||||||||||
| Depreciation expense |
861 | 867 | 881 | 858 | 847 | 839 | 849 | 854 | ||||||||||||||||||||||||
|
|
|
|
|
|
|
|
|
|
|
|
|
|
|
|
|
|||||||||||||||||
| Income from operations |
15,678 | 10,713 | 14,794 | 12,618 | 14,520 | 10,462 | 14,608 | 10,668 | ||||||||||||||||||||||||
| Interest income |
(68 | ) | (52 | ) | (34 | ) | (32 | ) | (34 | ) | (37 | ) | (39 | ) | (38 | ) | ||||||||||||||||
|
|
|
|
|
|
|
|
|
|
|
|
|
|
|
|
|
|||||||||||||||||
| Income before provision for income taxes |
15,746 | 10,765 | 14,828 | 12,650 | 14,554 | 10,499 | 14,647 | 10,706 | ||||||||||||||||||||||||
| Provision for income taxes |
7,069 | 4,808 | 6,152 | 5,517 | 6,446 | 4,510 | 6,631 | 5,311 | ||||||||||||||||||||||||
|
|
|
|
|
|
|
|
|
|
|
|
|
|
|
|
|
|||||||||||||||||
| Net income |
$ | 8,677 | $ | 5,957 | $ | 8,676 | $ | 7,133 | $ | 8,108 | $ | 5,989 | $ | 8,016 | $ | 5,395 | ||||||||||||||||
|
|
|
|
|
|
|
|
|
|
|
|
|
|
|
|
|
|||||||||||||||||
| Net income per common share (1): |
||||||||||||||||||||||||||||||||
| Basic |
$ | 0.24 | $ | 0.16 | $ | 0.23 | $ | 0.19 | $ | 0.22 | $ | 0.16 | $ | 0.21 | $ | 0.14 | ||||||||||||||||
|
|
|
|
|
|
|
|
|
|
|
|
|
|
|
|
|
|||||||||||||||||
| Diluted |
$ | 0.23 | $ | 0.16 | $ | 0.23 | $ | 0.19 | $ | 0.21 | $ | 0.16 | $ | 0.21 | $ | 0.14 | ||||||||||||||||
|
|
|
|
|
|
|
|
|
|
|
|
|
|
|
|
|
|||||||||||||||||
43
Table of Contents
| (1) | Net income per common share calculations for each of the quarters were based upon the weighted average number of shares outstanding for each period, and the sum of the quarters may not necessarily be equal to the full year net income per common share amount. |
Our quarterly results have fluctuated in the past and we believe they will continue to do so in the future. Certain factors that could affect our quarterly operating results are described in Part I Item 1A. “Risk Factors.” Due to these and other factors, we believe that quarter-to-quarter comparisons of our results of operations are not meaningful indicators of future performance.
Liquidity and Capital Resources
Our primary source of liquidity is cash provided by our operations and, historically, to a lesser extent, stock option exercises. We have generated positive cash flows annually from operations since inception, and we continued to do so during the year ended May 28, 2016. Our ability to continue to increase positive cash flow from operations in the future will be, at least in part, dependent on improvement in global economic conditions.
At May 28, 2016, the Company had operating leases, primarily for office premises, and purchase obligations, primarily for property and equipment, expiring at various dates through September 2025. At May 28, 2016, the Company had no capital leases. The following table summarizes our future minimum rental commitments under operating leases and our other known contractual obligations as of May 28, 2016:
| Payments Due by Period | ||||||||||||||||||||
| Total | Fiscal 2017 |
Fiscal 2018-2019 |
Fiscal 2020-2021 |
Thereafter | ||||||||||||||||
| (Amounts in thousands) | ||||||||||||||||||||
| Operating lease obligations |
$ | 39,984 | $ | 10,006 | $ | 14,466 | $ | 7,950 | $ | 7,562 | ||||||||||
|
|
|
|
|
|
|
|
|
|
|
|||||||||||
| Purchase obligations |
$ | 1,227 | $ | 540 | $ | 551 | $ | 136 | $ | — | ||||||||||
|
|
|
|
|
|
|
|
|
|
|
|||||||||||
The Company has a $3.0 million unsecured revolving credit facility with Bank of America (the “Credit Agreement”). The Credit Agreement allows the Company to choose the interest rate applicable to advances. The interest rate options are Bank of America’s prime rate and a London Inter-Bank Offered Rate plus 2.25%. Interest, if any, is payable monthly. The Credit Agreement expires November 30, 2016, unless extended by the parties. As of May 28, 2016, the Company had approximately $1.9 million available under the terms of the Credit Agreement, as Bank of America has issued approximately $1.1 million of outstanding letters of credit in favor of third parties related to operating leases. As of May 28, 2016, the Company was in compliance with all covenants included in the Credit Agreement.
Operating activities provided $38.3 million and $31.8 million in cash in fiscal 2016 and fiscal 2015, respectively. Cash provided by operations in fiscal 2016 resulted from net income of $30.4 million and net favorable non-cash reconciling adjustments of $12.0 million. Other balance sheet account changes in fiscal 2016, including working capital balances, were a net use of cash of $4.2 million; the primary driver of the use was the increase in the Company’s accounts receivable as of the end of the fiscal year because of higher weekly revenues as compared to the same period of the prior fiscal year. In fiscal 2015, cash provided by operations resulted from net income of $27.5 million and net favorable non-cash reconciling adjustments of $11.1 million. Other balance sheet account changes in fiscal 2015, including working capital balances, were a net use of cash of $6.9 million. Non-cash items in both years include depreciation and amortization (which decreased between the two periods by $0.8 million because certain intangible assets became fully amortized during fiscal 2015) and stock-based compensation expense which increased between the two periods by $0.3 million. Stock-based compensation expense does not reflect an actual cash outflow from the Company but is an estimate of the fair value of the services provided by employees and directors in exchange for share-based payments such as stock options, restricted stock and ESPP purchase rights. The increase in fiscal 2016 is attributable to the acceleration of vesting related to options previously granted to Donald Murray in connection with his transition from Executive Chairman to Chairman.
Net cash used in investing activities was $2.4 million for fiscal 2016 compared to net cash provided of $6.6 million for fiscal 2015. Cash received from the redemption and purchases of short-term investments (primarily commercial paper) was
44
Table of Contents
approximately the same in fiscal 2016 but was a source of cash in fiscal 2015 of $9.0 million. The Company spent the same amount ($2.4 million) on property and equipment in fiscal 2016 as fiscal 2015.
Net cash used in financing activities totaled $32.3 million for the year ended May 28, 2016, compared to $28.9 million for the year ended May 30, 2015. The Company received approximately $9.8 million in fiscal 2016 from the exercise of employee stock options and issuance of shares via the Company’s ESPP compared to $9.1 million in the prior fiscal year. However, the Company used more cash in fiscal 2016 ($28.1 million) to purchase approximately 1.8 million shares of our common stock as compared to $26.3 million to purchase 1.7 million shares of common stock in fiscal 2015. Payments for the Company’s dividend program increased from $11.7 million in fiscal 2015 to $14.1 million in fiscal 2016 as a result of the Company’s increase in fiscal 2016 of its quarterly dividend from $0.08 to $0.10 per common share.
The Company had $116.0 million in cash and cash equivalents and short-term investments at May 28, 2016. We anticipate that our current cash and the ongoing cash flows from operations will be adequate to meet our working capital and capital expenditure needs for at least the next 12 months.
Our ongoing operations and anticipated growth in the geographic markets we currently serve will require us to continue to make investments in capital equipment, primarily technology hardware and software. In addition, we may consider making strategic acquisitions. If we require additional capital resources to grow our business, either internally or through acquisition, we may seek to sell additional equity securities or to secure debt financing. The sale of additional equity securities or certain forms of debt financing could result in additional dilution to our stockholders. We may not be able to obtain financing arrangements in amounts or on terms acceptable to us in the future. In the event we are unable to obtain additional financing when needed, we may be compelled to delay or curtail our plans to develop our business or to pay dividends on our capital stock, which could have a material adverse effect on our operations, market position and competitiveness.
Operating activities provided $31.8 million and $32.0 million in cash in fiscal 2015 and fiscal 2014, respectively. Cash provided by operations in fiscal 2015 resulted from net income of $27.5 million and net favorable non-cash reconciling adjustments of $11.1 million (principally depreciation and amortization and stock-based compensation expense). Other balance sheet account changes between the two periods, including working capital balances, were a net use of cash of $6.9 million; the primary driver of the use was the increase in the Company’s accounts receivable as of the end of the fiscal year because of higher weekly revenues as compared to the same period of the prior fiscal year. In fiscal 2014, cash provided by operations resulted from net income of $19.9 million and net favorable non-cash reconciling adjustments of $14.0 million (principally depreciation and amortization and stock-based compensation expense). Other balance sheet account changes between the two periods, including working capital balances, were a net use of cash of $1.9 million. Stock-based compensation expense, which does not reflect an actual cash outflow from the Company but is an estimate of the fair value of the services provided by employees and directors in exchange for share-based payments such as stock options, restricted stock and ESPP purchase rights, was relatively the same between fiscal 2015 and fiscal 2014. In addition, non-cash depreciation and amortization fell in fiscal 2015 as certain assets were fully amortized in fiscal 2014.
Net cash provided by investing activities was $6.6 million for fiscal 2015 compared to net cash used of $12.7 million for fiscal 2014. Cash received from the redemption of short-term investments (primarily commercial paper), net of cash used to purchase short-term investments, resulted in cash provided of $9.0 million in fiscal 2015 compared to a use of cash in fiscal 2014 of $9.0 million. The Company spent approximately $1.4 million less on property and equipment in fiscal 2015 compared to fiscal 2014.
Net cash used in financing activities totaled $28.9 million for the year ended May 30, 2015, compared to $32.9 million for the year ended May 31, 2014. The Company received approximately $9.1 million in fiscal 2015 from the exercise of employee stock options and issuance of shares via the Company’s ESPP compared to $7.3 million in the prior fiscal year. However, the Company used less cash in fiscal 2015 ($26.3 million) to purchase approximately 1.7 million shares of our common stock as compared to $29.6 million to purchase 2.2 million shares of common stock in fiscal 2014. Payments for the Company’s dividend program increased from $10.6 million in fiscal 2014 to $11.7 million in fiscal 2015 as a result of the Company’s increase in fiscal 2015 of its quarterly dividend from $0.07 to $0.08 per common share.
45
Table of Contents
Off-Balance Sheet Arrangements
The Company has no off-balance sheet arrangements.
Recent Accounting Pronouncements
Information regarding recent accounting pronouncements is contained in Note 2 — Summary of Significant Accounting Policies — to the Consolidated Financial Statements for the year ended May 28, 2016.
Inflation
Inflation was not a material factor in either revenue or operating expenses during the fiscal years ended May 28, 2016, May 30, 2015 or May 31, 2014.
46
Table of Contents
| ITEM 7A. | QUANTITATIVE AND QUALITATIVE DISCLOSURES ABOUT MARKET RISK. |
Interest Rate Risk. At the end of fiscal 2016, we had approximately $116.0 million of cash and cash equivalents and short-term investments. Securities that the Company has the ability and positive intent to hold to maturity are carried at amortized cost. These securities consist of commercial paper. Cost approximates market for these securities. The earnings on these investments are subject to changes in interest rates; however, assuming a constant balance available for investment, a 10% decline in interest rates would reduce our interest income but would not have a material impact on our consolidated financial position or results of operations.
Foreign Currency Exchange Rate Risk. For the year ended May 28, 2016, approximately 18.3% of the Company’s revenues were generated outside of the United States. As a result, our operating results are subject to fluctuations in the exchange rates of foreign currencies in relation to the United States dollar. Revenues and expenses denominated in foreign currencies are translated into United States dollars at the monthly average exchange rates prevailing during the period. Thus, as the value of the United States dollar fluctuates relative to the currencies in our non-United States based operations, our reported results may vary.
Assets and liabilities of our non-United States based operations are translated into United States dollars at the exchange rate effective at the end of each monthly reporting period. Approximately 80% of our fiscal year-end balances of cash, cash equivalents and short-term investments were denominated in United States dollars. The remaining amount of approximately 20% was comprised primarily of cash balances translated from Japanese Yen, Euros, Canadian Dollars and Hong Kong Dollars. The difference resulting from the translation each period of assets and liabilities of our non-United States based operations is recorded in stockholders’ equity as a component of other comprehensive income.
Although we intend to monitor our exposure to foreign currency fluctuations, we do not currently use financial hedging techniques to mitigate risks associated with foreign currency fluctuations including in a limited number of circumstances when we may be asked to transact with our client in one currency but are obligated to pay our consultant in another currency. We cannot provide assurance that exchange rate fluctuations will not adversely affect our financial results in the future.
47
Table of Contents
| ITEM 8. | FINANCIAL STATEMENTS AND SUPPLEMENTARY DATA. |
RESOURCES CONNECTION, INC.
CONSOLIDATED FINANCIAL STATEMENTS
48
Table of Contents
Report of Independent Registered Public Accounting Firm
To the Board of Directors and Stockholders
Resources Connection, Inc.
We have audited the accompanying consolidated balance sheets of Resources Connection, Inc. and subsidiaries as of May 28, 2016 and May 30, 2015, and the related consolidated statements of operations, comprehensive income, stockholders’ equity, and cash flows for each of the three years in the period ended May 28, 2016. These financial statements are the responsibility of the Company’s management. Our responsibility is to express an opinion on these financial statements based on our audits.
We conducted our audits in accordance with the standards of the Public Company Accounting Oversight Board (United States). Those standards require that we plan and perform the audit to obtain reasonable assurance about whether the financial statements are free of material misstatement. An audit includes examining, on a test basis, evidence supporting the amounts and disclosures in the financial statements. An audit also includes assessing the accounting principles used and significant estimates made by management, as well as evaluating the overall financial statement presentation. We believe that our audits provide a reasonable basis for our opinion.
In our opinion, the consolidated financial statements referred to above present fairly, in all material respects, the financial position of Resources Connection, Inc. and subsidiaries as of May 28, 2016 and May 30, 2015, and the results of their operations and their cash flows for each of the three years in the period ended May 28, 2016, in conformity with U.S. generally accepted accounting principles.
We have also audited, in accordance with the standards of the Public Company Accounting Oversight Board (United States), Resources Connection, Inc.’s and subsidiaries’ internal control over financial reporting as of May 28, 2016, based on criteria established in Internal Control — Integrated Framework issued by the Committee of Sponsoring Organizations of the Treadway Commission in 2013, and our report dated August 10, 2016 expressed an unqualified opinion on the effectiveness of Resources Connection, Inc.’s and subsidiaries’ internal control over financial reporting.
/s/ RSM US LLP
Irvine, California
August 10, 2016
49
Table of Contents
RESOURCES CONNECTION, INC.
| May 28, 2016 |
May 30, 2015 |
|||||||
| (Amounts in thousands, except par value per share) |
||||||||
| ASSETS | ||||||||
| Current assets: |
||||||||
| Cash and cash equivalents |
$ | 91,089 | $ | 87,250 | ||||
| Short-term investments |
24,957 | 24,988 | ||||||
| Trade accounts receivable, net of allowance for doubtful accounts of $2,994 and $3,291 as of May 28, 2016 and May 30, 2015, respectively |
97,807 | 96,574 | ||||||
| Prepaid expenses and other current assets |
4,735 | 4,066 | ||||||
| Income taxes receivable |
— | 257 | ||||||
| Deferred income taxes |
8,446 | 8,571 | ||||||
|
|
|
|
|
|||||
| Total current assets |
227,034 | 221,706 | ||||||
| Goodwill |
171,183 | 170,878 | ||||||
| Intangible assets, net |
— | 90 | ||||||
| Property and equipment, net |
21,274 | 22,001 | ||||||
| Deferred income taxes |
774 | 335 | ||||||
| Other assets |
1,973 | 1,971 | ||||||
|
|
|
|
|
|||||
| Total assets |
$ | 422,238 | $ | 416,981 | ||||
|
|
|
|
|
|||||
| LIABILITIES AND STOCKHOLDERS’ EQUITY | ||||||||
| Current liabilities: |
||||||||
| Accounts payable and accrued expenses |
$ | 13,606 | $ | 13,310 | ||||
| Accrued salaries and related obligations |
50,155 | 48,637 | ||||||
| Other liabilities |
7,123 | 6,999 | ||||||
|
|
|
|
|
|||||
| Total current liabilities |
70,884 | 68,946 | ||||||
| Deferred income taxes |
4,983 | 3,434 | ||||||
| Other long-term liabilities |
3,722 | 4,149 | ||||||
|
|
|
|
|
|||||
| Total liabilities |
79,589 | 76,529 | ||||||
|
|
|
|
|
|||||
| Commitments and contingencies |
||||||||
| Stockholders’ equity: |
||||||||
| Preferred stock, $0.01 par value, 5,000 shares authorized; zero shares issued and outstanding |
— | — | ||||||
| Common stock, $0.01 par value, 70,000 shares authorized; 58,237 and 57,488 shares issued, and 36,229 and 37,273 shares outstanding as of May 28, 2016 and May 30, 2015, respectively |
582 | 575 | ||||||
| Additional paid-in capital |
388,763 | 374,285 | ||||||
| Accumulated other comprehensive loss |
(10,794 | ) | (10,917 | ) | ||||
| Retained earnings |
327,954 | 313,268 | ||||||
| Treasury stock at cost, 22,008 and 20,215 shares as of May 28, 2016 and May 30, 2015, respectively |
(363,856 | ) | (336,759 | ) | ||||
|
|
|
|
|
|||||
| Total stockholders’ equity |
342,649 | 340,452 | ||||||
|
|
|
|
|
|||||
| Total liabilities and stockholders’ equity |
$ | 422,238 | $ | 416,981 | ||||
|
|
|
|
|
|||||
The accompanying notes are an integral part of these consolidated financial statements.
50
Table of Contents
RESOURCES CONNECTION, INC.
CONSOLIDATED STATEMENTS OF OPERATIONS
| For the Years Ended | ||||||||||||
| May 28, 2016 |
May 30, 2015 |
May 31, 2014 |
||||||||||
| (Amounts in thousands, except per | ||||||||||||
| share amounts) | ||||||||||||
| Revenue |
$ | 598,521 | $ | 590,589 | $ | 567,181 | ||||||
| Direct cost of services, primarily payroll and related taxes for professional services employees |
366,355 | 362,227 | 351,359 | |||||||||
|
|
|
|
|
|
|
|||||||
| Gross margin |
232,166 | 228,362 | 215,822 | |||||||||
| Selling, general and administrative expenses |
174,806 | 173,797 | 172,531 | |||||||||
| Amortization of intangible assets |
90 | 918 | 1,688 | |||||||||
| Depreciation expense |
3,467 | 3,389 | 3,628 | |||||||||
|
|
|
|
|
|
|
|||||||
| Income from operations |
53,803 | 50,258 | 37,975 | |||||||||
| Interest income |
(186 | ) | (148 | ) | (168 | ) | ||||||
|
|
|
|
|
|
|
|||||||
| Income before provision for income taxes |
53,989 | 50,406 | 38,143 | |||||||||
| Provision for income taxes |
23,546 | 22,898 | 18,257 | |||||||||
|
|
|
|
|
|
|
|||||||
| Net income |
$ | 30,443 | $ | 27,508 | $ | 19,886 | ||||||
|
|
|
|
|
|
|
|||||||
| Net income per common share: |
||||||||||||
| Basic |
$ | 0.82 | $ | 0.73 | $ | 0.51 | ||||||
|
|
|
|
|
|
|
|||||||
| Diluted |
$ | 0.81 | $ | 0.72 | $ | 0.51 | ||||||
|
|
|
|
|
|
|
|||||||
| Weighted average common shares outstanding: |
||||||||||||
| Basic |
37,037 | 37,825 | 39,216 | |||||||||
|
|
|
|
|
|
|
|||||||
| Diluted |
37,608 | 38,248 | 39,307 | |||||||||
|
|
|
|
|
|
|
|||||||
| Cash dividends declared per common share |
$ | 0.40 | $ | 0.32 | $ | 0.28 | ||||||
|
|
|
|
|
|
|
|||||||
The accompanying notes are an integral part of these consolidated financial statements.
51
Table of Contents
RESOURCES CONNECTION, INC.
CONSOLIDATED STATEMENTS OF COMPREHENSIVE INCOME
| For the Years Ended | ||||||||||||
| May 28, 2016 |
May 30, 2015 |
May 31, 2014 |
||||||||||
| (Amounts in thousands) | ||||||||||||
| COMPREHENSIVE INCOME: |
||||||||||||
| Net income |
$ | 30,443 | $ | 27,508 | $ | 19,886 | ||||||
| Foreign currency translation adjustment, net of tax |
123 | (8,344 | ) | 1,385 | ||||||||
|
|
|
|
|
|
|
|||||||
| Total comprehensive income |
$ | 30,566 | $ | 19,164 | $ | 21,271 | ||||||
|
|
|
|
|
|
|
|||||||
The accompanying notes are an integral part of these consolidated financial statements.
52
Table of Contents
RESOURCES CONNECTION, INC.
CONSOLIDATED STATEMENTS OF STOCKHOLDERS’ EQUITY
| Common Stock | Additional Paid-in Capital |
Treasury Stock | Accumulated Other Comprehensive (Loss) Income |
Retained Earnings |
Total Stockholders’ Equity |
|||||||||||||||||||||||||||
| Shares | Amount | Shares | Amount | |||||||||||||||||||||||||||||
| (Amounts in thousands) | ||||||||||||||||||||||||||||||||
| Balances as of May 25, 2013 |
56,082 | $ | 561 | $ | 347,790 | 16,377 | $ | (282,615 | ) | $ | (3,958 | ) | $ | 290,549 | $ | 352,327 | ||||||||||||||||
| Exercise of stock options |
313 | 3 | 3,813 | 3,816 | ||||||||||||||||||||||||||||
| Stock-based compensation expense |
6,519 | 6,519 | ||||||||||||||||||||||||||||||
| Tax shortfall from stock-based compensation arrangements |
(1,125 | ) | (1,125 | ) | ||||||||||||||||||||||||||||
| Issuance of common stock under Employee Stock Purchase Plan |
348 | 3 | 3,448 | 3,451 | ||||||||||||||||||||||||||||
| Issuance of restricted stock |
5 | — | ||||||||||||||||||||||||||||||
| Issuance of restricted stock out of treasury stock to board of director members |
(29 | ) | 694 | (694 | ) | — | ||||||||||||||||||||||||||
| Cancellation of shares |
(10 | ) | (10 | ) | — | |||||||||||||||||||||||||||
| Purchase of shares |
2,242 | (29,587 | ) | (29,587 | ) | |||||||||||||||||||||||||||
| Cash dividends declared ($0.28 per share) |
(10,911 | ) | (10,911 | ) | ||||||||||||||||||||||||||||
| Currency translation adjustment |
1,385 | 1,385 | ||||||||||||||||||||||||||||||
| Net income for the year ended May 31, 2014 |
19,886 | 19,886 | ||||||||||||||||||||||||||||||
|
|
|
|
|
|
|
|
|
|
|
|
|
|
|
|
|
|||||||||||||||||
| Balances as of May 31, 2014 |
56,738 | 567 | 360,445 | 18,580 | (311,508 | ) | (2,573 | ) | 298,830 | 345,761 | ||||||||||||||||||||||
| Exercise of stock options |
408 | 4 | 5,299 | 5,303 | ||||||||||||||||||||||||||||
| Stock-based compensation expense |
5,989 | 5,989 | ||||||||||||||||||||||||||||||
| Tax shortfall from stock-based compensation arrangements |
(1,216 | ) | (1,216 | ) | ||||||||||||||||||||||||||||
| Issuance of common stock under Employee Stock Purchase Plan |
337 | 4 | 3,768 | 3,772 | ||||||||||||||||||||||||||||
| Issuance of restricted stock |
6 | — | ||||||||||||||||||||||||||||||
| Issuance of restricted stock out of treasury stock to board of director members |
(44 | ) | 1,026 | (1,026 | ) | — | ||||||||||||||||||||||||||
| Cancellation of restricted stock |
(1 | ) | — | |||||||||||||||||||||||||||||
| Purchase of shares |
1,679 | (26,277 | ) | (26,277 | ) | |||||||||||||||||||||||||||
| Cash dividends declared ($0.32 per share) |
(12,044 | ) | (12,044 | ) | ||||||||||||||||||||||||||||
| Currency translation adjustment |
(8,344 | ) | (8,344 | ) | ||||||||||||||||||||||||||||
| Net income for the year ended May 30, 2015 |
27,508 | 27,508 | ||||||||||||||||||||||||||||||
|
|
|
|
|
|
|
|
|
|
|
|
|
|
|
|
|
|||||||||||||||||
| Balances as of May 30, 2015 |
57,488 | 575 | 374,285 | 20,215 | (336,759 | ) | (10,917 | ) | 313,268 | 340,452 | ||||||||||||||||||||||
| Exercise of stock options |
418 | 4 | 5,304 | 5,308 | ||||||||||||||||||||||||||||
| Stock-based compensation expense |
6,280 | 6,280 | ||||||||||||||||||||||||||||||
| Tax shortfall from stock-based compensation arrangements |
(1,565 | ) | (1,565 | ) | ||||||||||||||||||||||||||||
| Issuance of common stock under Employee Stock Purchase Plan |
325 | 3 | 4,459 | 4,462 | ||||||||||||||||||||||||||||
| Issuance of restricted stock |
6 | — | ||||||||||||||||||||||||||||||
| Issuance of restricted stock out of treasury stock to board of director members |
(44 | ) | 1,031 | (1,031 | ) | — | ||||||||||||||||||||||||||
| Purchase of shares |
1,837 | (28,128 | ) | (28,128 | ) | |||||||||||||||||||||||||||
| Cash dividends declared ($0.40 per share) |
(14,726 | ) | (14,726 | ) | ||||||||||||||||||||||||||||
| Currency translation adjustment |
123 | 123 | ||||||||||||||||||||||||||||||
| Net income for the year ended May 28, 2016 |
30,443 | 30,443 | ||||||||||||||||||||||||||||||
|
|
|
|
|
|
|
|
|
|
|
|
|
|
|
|
|
|||||||||||||||||
| Balances as of May 28, 2016 |
58,237 | $ | 582 | $ | 388,763 | 22,008 | $ | (363,856 | ) | $ | (10,794 | ) | $ | 327,954 | $ | 342,649 | ||||||||||||||||
|
|
|
|
|
|
|
|
|
|
|
|
|
|
|
|
|
|||||||||||||||||
The accompanying notes are an integral part of these consolidated financial statements.
53
Table of Contents
RESOURCES CONNECTION, INC.
CONSOLIDATED STATEMENTS OF CASH FLOWS
| For the Years Ended | ||||||||||||
| May 28, 2016 |
May 30, 2015 |
May 31, 2014 |
||||||||||
| (Amounts in thousands) | ||||||||||||
| Cash flows from operating activities: |
||||||||||||
| Net income |
$ | 30,443 | $ | 27,508 | $ | 19,886 | ||||||
| Adjustments to reconcile net income to net cash provided by operating activities: |
||||||||||||
| Depreciation and amortization |
3,557 | 4,307 | 5,316 | |||||||||
| Stock-based compensation expense |
6,280 | 5,989 | 6,519 | |||||||||
| Excess tax benefits from stock-based compensation |
(185 | ) | (86 | ) | (35 | ) | ||||||
| Loss on disposal of assets |
— | 15 | 65 | |||||||||
| Bad debt expense |
1,118 | 212 | 300 | |||||||||
| Deferred income taxes |
1,243 | 692 | 1,828 | |||||||||
| Changes in operating assets and liabilities: |
||||||||||||
| Trade accounts receivable |
(2,702 | ) | (10,052 | ) | (5,747 | ) | ||||||
| Prepaid expenses and other current assets |
(651 | ) | 547 | (225 | ) | |||||||
| Income taxes |
(949 | ) | (2,187 | ) | 845 | |||||||
| Other assets |
15 | 254 | 110 | |||||||||
| Accounts payable and accrued expenses |
176 | 304 | (1,496 | ) | ||||||||
| Accrued salaries and related obligations |
1,574 | 4,090 | 6,097 | |||||||||
| Other liabilities |
(1,657 | ) | 158 | (1,445 | ) | |||||||
|
|
|
|
|
|
|
|||||||
| Net cash provided by operating activities |
38,262 | 31,751 | 32,018 | |||||||||
|
|
|
|
|
|
|
|||||||
| Cash flows from investing activities: |
||||||||||||
| Redemption of short-term investments |
45,000 | 49,000 | 73,000 | |||||||||
| Purchase of short-term investments |
(44,969 | ) | (40,002 | ) | (81,990 | ) | ||||||
| Purchase of property and equipment |
(2,381 | ) | (2,364 | ) | (3,725 | ) | ||||||
|
|
|
|
|
|
|
|||||||
| Net cash (used in) provided by investing activities |
(2,350 | ) | 6,634 | (12,715 | ) | |||||||
|
|
|
|
|
|
|
|||||||
| Cash flows from financing activities: |
||||||||||||
| Proceeds from exercise of stock options |
5,308 | 5,303 | 3,816 | |||||||||
| Proceeds from issuance of common stock under Employee Stock Purchase Plan |
4,462 | 3,772 | 3,451 | |||||||||
| Purchase of common stock |
(28,128 | ) | (26,277 | ) | (29,587 | ) | ||||||
| Cash dividends paid |
(14,085 | ) | (11,748 | ) | (10,625 | ) | ||||||
| Excess tax benefits from stock-based compensation |
185 | 86 | 35 | |||||||||
|
|
|
|
|
|
|
|||||||
| Net cash used in financing activities |
(32,258 | ) | (28,864 | ) | (32,910 | ) | ||||||
|
|
|
|
|
|
|
|||||||
| Effect of exchange rate changes on cash |
185 | (2,562 | ) | (118 | ) | |||||||
|
|
|
|
|
|
|
|||||||
| Net increase (decrease) in cash |
3,839 | 6,959 | (13,725 | ) | ||||||||
| Cash and cash equivalents at beginning of period |
87,250 | 80,291 | 94,016 | |||||||||
|
|
|
|
|
|
|
|||||||
| Cash and cash equivalents at end of period |
$ | 91,089 | $ | 87,250 | $ | 80,291 | ||||||
|
|
|
|
|
|
|
|||||||
The accompanying notes are an integral part of these consolidated financial statements.
54
Table of Contents
RESOURCES CONNECTION, INC.
NOTES TO CONSOLIDATED FINANCIAL STATEMENTS
1. Description of the Company and its Business
Resources Connection, Inc. (“Resources Connection”), a Delaware corporation, was incorporated on November 16, 1998. Resources Connection is a multinational professional services firm; its operating entities primarily provide services under the name Resources Global Professionals (“RGP” or the “Company”). The Company is organized around client service teams utilizing experienced professionals and provides consulting and business support services in the areas of accounting; finance; governance, risk and compliance; corporate advisory, strategic communications and restructuring; information management; human capital; supply chain management; and legal and regulatory. The Company has offices in the United States (“U.S.”), Asia, Australia, Canada, Europe and Mexico.
The Company’s fiscal year consists of 52 or 53 weeks, ending on the Saturday in May closest to May 31. Fiscal years 2016 and 2015 consisted of four 13 week quarters and a total of 52 weeks of activity for the fiscal year. For fiscal years of 53 weeks, such as fiscal 2014, the first three quarters consisted of 13 weeks each and the fourth quarter consisted of 14 weeks.
2. Summary of Significant Accounting Policies
Basis of Presentation and Principles of Consolidation
The Consolidated Financial Statements of the Company (“financial statements”) have been prepared in conformity with accounting principles generally accepted in the U.S. (“GAAP”) and the rules of the Securities and Exchange Commission (“SEC”). The financial statements include the accounts of the Company and its subsidiaries. All significant intercompany accounts and transactions have been eliminated in consolidation.
Revenue Recognition
Revenues are recognized and billed when the Company’s professionals deliver services. Conversion fees are recognized when one of the Company’s professionals accepts an offer of permanent employment from a client. Conversion fees were 0.5% of revenue for each of the years ended May 28, 2016, May 30, 2015 and May 31, 2014. All costs of compensating the Company’s professionals are the responsibility of the Company and are included in direct cost of services.
Client Reimbursements of “Out-of-Pocket” Expenses
The Company recognizes all reimbursements received from clients for “out-of-pocket” expenses as revenue and all such expenses as direct cost of services. Reimbursements received from clients were $10.6 million, $10.6 million and $8.9 million for the years ended May 28, 2016, May 30, 2015 and May 31, 2014, respectively.
Foreign Currency Translation
The financial statements of subsidiaries outside the U.S. are measured using the local currency as the functional currency. Assets and liabilities of these subsidiaries are translated at current exchange rates, income and expense items are translated at average exchange rates prevailing during the period and the related translation adjustments are recorded as a component of comprehensive income or loss within stockholders’ equity. Gains and losses from foreign currency transactions are included in selling, general and administrative expenses in the Consolidated Statements of Operations.
Per Share Information
The Company presents both basic and diluted earnings per share (“EPS”). Basic EPS is calculated by dividing net income by the weighted average number of common shares outstanding during the period. Diluted EPS is based upon the weighted average number of common and common equivalent shares outstanding during the period, calculated using the treasury stock method for stock options. Under the treasury stock method, exercise proceeds include the amount the employee must pay for exercising stock options, the amount of compensation cost for future services that the Company has not yet recognized and the amount of tax
55
Table of Contents
RESOURCES CONNECTION, INC.
NOTES TO CONSOLIDATED FINANCIAL STATEMENTS — (Continued)
benefits that would be recorded in additional paid-in capital when the award becomes deductible. Common equivalent shares are excluded from the computation in periods in which they have an anti-dilutive effect. Stock options for which the exercise price exceeds the average market price over the period are anti-dilutive and are excluded from the calculation.
The following table summarizes the calculation of net income per share for the years ended May 28, 2016, May 30, 2015 and May 31, 2014 (in thousands, except per share amounts):
| 2016 | 2015 | 2014 | ||||||||||
| Net income |
$ | 30,443 | $ | 27,508 | $ | 19,886 | ||||||
|
|
|
|
|
|
|
|||||||
| Basic: |
||||||||||||
| Weighted average shares |
37,037 | 37,825 | 39,216 | |||||||||
|
|
|
|
|
|
|
|||||||
| Diluted: |
||||||||||||
| Weighted average shares |
37,037 | 37,825 | 39,216 | |||||||||
| Potentially dilutive shares |
571 | 423 | 91 | |||||||||
|
|
|
|
|
|
|
|||||||
| Total dilutive shares |
37,608 | 38,248 | 39,307 | |||||||||
|
|
|
|
|
|
|
|||||||
| Net income per common share: |
||||||||||||
| Basic |
$ | 0.82 | $ | 0.73 | $ | 0.51 | ||||||
| Dilutive |
$ | 0.81 | $ | 0.72 | $ | 0.51 | ||||||
| Anti-dilutive shares not included above |
4,745 | 5,746 | 7,828 | |||||||||
Cash and Cash Equivalents
The Company considers cash on hand, deposits in banks, and short-term investments purchased with an original maturity date of three months or less to be cash and cash equivalents. The carrying amounts reflected in the consolidated balance sheets for cash and cash equivalents approximate the fair values due to the short maturities of these instruments.
Short-Term Investments
The Company’s short-term investments were $25.0 million as of both May 28, 2016 and May 30, 2015, and had original contractual maturities of between three months and one year. The Company had no investments with a maturity in excess of one year as of the end of either fiscal year 2016 or 2015. The Company carries debt securities that it has the ability and positive intent to hold to maturity at amortized cost.
The fair value of the Company’s financial instruments reflects the amounts that the Company estimates it will receive in connection with the sale of an asset in an orderly transaction between market participants at the measurement date (exit price). The fair value hierarchy prioritizes the use of inputs used in valuation techniques into the following three levels:
Level 1 — Quoted prices in active markets for identical assets and liabilities.
Level 2 — Observable inputs other than quoted prices in active markets for identical assets and liabilities; quoted prices in markets that are not active; or other inputs that are observable or can be corroborated by observable market data for substantially the full term of the assets.
Level 3 — Unobservable inputs.
56
Table of Contents
RESOURCES CONNECTION, INC.
NOTES TO CONSOLIDATED FINANCIAL STATEMENTS — (Continued)
The Company’s investments in commercial paper and U.S. Government Agency securities are measured using quoted prices in markets that are not active (Level 2). There were no unrealized holding gains or losses as of May 28, 2016 and May 30, 2015. Short-term investments consist of the following (in thousands):
| As of May 28, 2016 | As of May 30, 2015 | |||||||||||||||
| Cost | Fair Value | Cost | Fair Value | |||||||||||||
| Commercial paper |
$ | 19,959 | $ | 19,959 | $ | 14,986 | $ | 14,986 | ||||||||
| U.S. Government Agency securities |
4,998 | 4,998 | 10,002 | 10,002 | ||||||||||||
|
|
|
|
|
|
|
|
|
|||||||||
| $ | 24,957 | $ | 24,957 | $ | 24,988 | $ | 24,988 | |||||||||
|
|
|
|
|
|
|
|
|
|||||||||
Allowance for Doubtful Accounts
The Company maintains an allowance for doubtful accounts for estimated losses resulting from its clients’ failure to make required payments for services rendered. Management estimates this allowance based upon knowledge of the financial condition of the Company’s clients (which may not include knowledge of all significant events), review of historical receivable and reserve trends and other pertinent information. If the financial condition of the Company’s clients deteriorates or there is an unfavorable trend in aggregate receivable collections, additional allowances may be required.
The following table summarizes the activity in our allowance for doubtful accounts (in thousands):
| Beginning Balance |
Charged to Operations |
Currency Rate Changes |
(Write-offs)/ Recoveries |
Ending Balance |
||||||||||||||||
| Years Ended: |
||||||||||||||||||||
| May 31, 2014 |
$ | 3,428 | $ | 300 | $ | 20 | $ | (609 | ) | $ | 3,139 | |||||||||
| May 30, 2015 |
$ | 3,139 | $ | 212 | $ | (78 | ) | $ | 18 | $ | 3,291 | |||||||||
| May 28, 2016 |
$ | 3,291 | $ | 1,118 | $ | (16 | ) | $ | (1,399 | ) | $ | 2,994 | ||||||||
Property and Equipment
Property and equipment is stated at cost, less accumulated depreciation and amortization. Depreciation is computed using the straight-line method over the following estimated useful lives:
| Building | 30 years | |
| Furniture | 5 to 10 years | |
| Leasehold improvements | Lesser of useful life of asset or term of lease | |
| Computer, equipment and software | 3 to 5 years |
Costs for normal repairs and maintenance are expensed to operations as incurred, while renewals and major refurbishments are capitalized.
Assessments of whether there has been a permanent impairment in the value of property and equipment are periodically performed by considering factors such as expected future operating income, trends and prospects, as well as the effects of demand, competition and other economic factors. Management believes no permanent impairment has occurred.
Intangible Assets and Goodwill
Goodwill and other intangible assets with indefinite lives are not subject to amortization but are tested for impairment annually or whenever events or changes in circumstances indicate that the asset might be impaired. The Company performed its annual goodwill impairment analysis as of May 28, 2016 and will continue to test for impairment at least annually. The Company
57
Table of Contents
RESOURCES CONNECTION, INC.
NOTES TO CONSOLIDATED FINANCIAL STATEMENTS — (Continued)
performs its impairment analysis by comparing its market capitalization to its book value throughout the fiscal year. For application of this methodology the Company determined that it operates as a single reporting unit resulting from the combination of its practice offices. No impairment was indicated as of May 28, 2016. The Company has no other intangible assets.
See Note 4 — Intangible Assets and Goodwill for a further description of the Company’s intangible assets.
Stock-Based Compensation
The Company recognizes compensation expense for all share-based payment awards made to employees and directors, including employee stock options and employee stock purchases made via the Company’s Employee Stock Purchase Plan (the “ESPP”), based on estimated fair value at the date of grant.
The Company estimates the fair value of share-based payment awards on the date of grant using an option-pricing model. The value of the portion of the award that is ultimately expected to vest is recognized as an expense over the requisite service periods. Stock options vest over four years and restricted stock award vesting is determined on an individual grant basis under the Company’s 2014 Performance Incentive Plan (“2014 Plan”). The Company determines the estimated value of stock options using the Black-Scholes valuation model. The Company recognizes stock-based compensation expense on a straight-line basis over the service period for options that are expected to vest and records adjustments to compensation expense at the end of the service period if actual forfeitures differ from original estimates.
See Note 13 — Stock Based Compensation Plans for further information on the 2014 Plan and stock-based compensation.
Income Taxes
The Company recognizes deferred income taxes for the estimated tax consequences in future years of differences between the tax basis of assets and liabilities and their financial reporting amounts at each year-end based on enacted tax laws and statutory rates applicable to the periods in which the differences are expected to affect taxable income. Valuation allowances are established to reduce deferred tax assets to the amount expected to be realized when, in management’s opinion, it is more likely than not that some portion of the deferred tax assets will not be realized. The provision for income taxes represents current taxes payable net of the change during the period in deferred tax assets and liabilities.
Recent Accounting Pronouncements
Compensation-Stock Compensation (Topic 718): Improvements to Employee Share-Based Payment Accounting. In March 2016, the Financial Accounting Standards Board (“FASB”) issued Accounting Standards Update (“ASU”) 2016-09. The new standard modifies several aspects of the accounting and reporting for employee share-based payments and related tax accounting impacts, including the presentation in the statements of operations and cash flows of certain tax benefits or deficiencies and employee tax withholdings, as well as the accounting for award forfeitures over the vesting period. The new standard is effective for fiscal years beginning after December 15, 2017, and interim periods within annual periods beginning December 15, 2018; early adoption is permitted. The Company is currently evaluating the impact the adoption of this new standard will have on our consolidated financial statements.
Leases (Topic 842):Leases. In February 2016, the FASB issued ASU 2016-02, which amends the existing guidance to require lessees to recognize operating lease obligations on their balance sheets by recording the rights and obligations created by those leases. The requirements are effective for financial statements for annual periods and interim periods within those annual periods beginning after December 15, 2018, and early adoption is permitted. We are currently evaluating the impact that ASU 2016-02 will have on our consolidated financial statements and believe that it will have a significant impact on our reported balance sheet assets and liabilities. Under current accounting guidelines, our office leases are operating lease arrangements, in which rental payments are treated as operating expenses and there is no recognition of the arrangement on the balance sheet as an asset with related obligation to the lessor.
58
Table of Contents
RESOURCES CONNECTION, INC.
NOTES TO CONSOLIDATED FINANCIAL STATEMENTS — (Continued)
Income Taxes (Topic 740): Balance Sheet Classification of Deferred Taxes. In November 2015, the FASB issued ASU 2015-17. This ASU eliminates the current requirement for entities to present deferred tax liabilities and assets as current and noncurrent in a classified statement of financial position and instead requires that deferred income tax liabilities and assets be classified as noncurrent in a classified statement of financial position. The amendments in this update are effective for financial statements issued for annual periods beginning after December 15, 2016, and interim periods within those annual periods. Early adoption is permitted as of the beginning of an interim or annual reporting period. The Company will elect an early adoption for fiscal 2017, and will present the net deferred tax assets as noncurrent and reclassify any current deferred tax assets in its consolidated financial position on a retrospective basis. The adoption of this standard will not have a significant impact on the Company’s consolidated balance sheet.
Business Combinations (Topic 805): Simplifying the Accounting for Measurement-Period Adjustments. In September 2015, the FASB issued ASU 2015-16. This ASU eliminates the requirement to retrospectively account for changes to provisional amounts initially recorded in a business combination. ASU 2015-16 requires that an acquirer recognize adjustments to provisional amounts that are identified during the measurement period in the reporting period in which the adjustments are determined, including the effect of the change in provisional amount as if the accounting had been completed at the acquisition date. The provisions of this ASU are effective for the Company for fiscal 2017 and should be applied prospectively to adjustments to provisional amounts that occur after the effective date. The Company does not believe adoption of this standard will have a material impact on the Company’s financial statements.
Business Combinations (Topic 805): Pushdown Accounting. In November 2014, the FASB issued ASU 2014-17. This ASU provides an acquired entity with an option to apply pushdown accounting in its separate financial statements upon occurrence of an event in which an acquirer obtains control of the acquired entity. If an acquired entity elects the option to apply pushdown accounting in its separate financial statements, it should disclose information that users need to evaluate the effects of pushdown accounting on its financial statements. This guidance was effective on November 18, 2014. After the effective date, an acquired entity can make an election to apply the guidance to future change-in-control events or to its most recent change-in-control event. However, if the financial statements for the period in which the most recent change-in-control event occurred already have been issued or made available for issuance, the application of this guidance would be a change in accounting principle. The Company will utilize this guidance for any future acquisitions.
Presentation of Financial Statements-Going Concern (Subtopic 205-40): Disclosure of Uncertainties about an Entity’s Ability to Continue as a Going Concern. In August 2014, the FASB issued ASU 2014-15. This ASU provides new guidance regarding management’s responsibility in evaluating whether there is substantial doubt about a company’s ability to continue as a going concern and to provide related footnote disclosures. The guidance is effective for the Company for fiscal 2017. The Company does not believe adoption of this guidance will have an impact on its consolidated financial statements and related disclosures.
Compensation-Stock Compensation (Topic 718): Accounting for Share-Based Payments When the Terms of an Award Provide That a Performance Target Could Be Achieved after the Requisite Service Period. In June 2014, the FASB issued ASU 2014-12. This ASU provides new guidance requiring that a performance target that affects vesting and could be achieved after the requisite service period be treated as a performance condition. The guidance is effective for the Company for fiscal 2017. The Company does not currently have performance based awards and thus does not believe adoption of this guidance will have a material impact on its consolidated financial statements.
Revenue from Contracts with Customers (Topic 606): In May 2014, the FASB issued ASU 2014-09, a comprehensive new revenue recognition standard that will supersede most existing revenue recognition guidance and is intended to improve and converge revenue recognition and related financial reporting requirements. The core principle of this guidance is that an entity should recognize revenue to depict the transfer of promised goods or services to customers in an amount that reflects the consideration to which the entity expects to be entitled in exchange for those goods or services. The guidance provides a number of steps to apply to achieve that core principle and requires additional disclosures. In August 2015, the FASB issued ASU 2015-14, which delays the required implementation date for the Company until fiscal 2019, although the Company has the option to adopt
59
Table of Contents
RESOURCES CONNECTION, INC.
NOTES TO CONSOLIDATED FINANCIAL STATEMENTS — (Continued)
this guidance beginning in fiscal 2018. The standard allows for either “full retrospective” adoption, meaning the standard is applied to all periods presented, or “cumulative effect” adoption, meaning the standard is applied only to the most current period presented in the financial statements. In addition, in March 2016, the FASB issued ASU No. 2016-12, Narrow-Scope Improvements and Practical Expedients (Topic 606), which provides clarifying guidance in certain areas and adds some practical expedients. The effective date for this ASU is the same as the effective date for ASU No. 2014-09. The Company is currently evaluating the impact, if any, that these ASUs will have on our consolidated financial statements.
Other recent accounting pronouncements issued by the FASB (including its Emerging Issues Task Force), the American Institute of Certified Public Accountants and the SEC did not, or are not expected to, have a material effect on the Company’s results of operations, financial position or cash flows.
Use of Estimates
The preparation of financial statements in conformity with GAAP requires management to make estimates and assumptions that affect the reported amounts of assets and liabilities and disclosure of contingent assets and liabilities at the date of the financial statements and the reported amounts of revenues and expenses during the reporting period. Although management believes these estimates and assumptions are adequate, actual results could differ from the estimates and assumptions used.
3. Property and Equipment
Property and equipment consist of the following (in thousands):
| As of May 28, 2016 |
As of May 30, 2015 |
|||||||
| Building and land |
$ | 14,172 | $ | 14,100 | ||||
| Computers, equipment and software |
16,568 | 16,612 | ||||||
| Leasehold improvements |
21,170 | 20,037 | ||||||
| Furniture |
10,306 | 10,090 | ||||||
|
|
|
|
|
|||||
| 62,216 | 60,839 | |||||||
| Less accumulated depreciation and amortization |
(40,942 | ) | (38,838 | ) | ||||
|
|
|
|
|
|||||
| $ | 21,274 | $ | 22,001 | |||||
|
|
|
|
|
|||||
4. Intangible Assets and Goodwill
The following table presents details of our intangible assets, estimated lives and related accumulated amortization (in thousands):
| As of May 28, 2016 | As of May 30, 2015 | |||||||||||||||||||||||
| Gross | Accumulated Amortization |
Net | Gross | Accumulated Amortization |
Net | |||||||||||||||||||
| Trade name and trademark (5 years) |
$ | 1,341 | $ | (1,341 | ) | $ | — | $ | 1,341 | $ | (1,251 | ) | $ | 90 | ||||||||||
|
|
|
|
|
|
|
|
|
|
|
|
|
|||||||||||||
The following table summarizes amortization expense for the years ended May 28, 2016, May 30, 2015 and May 31, 2014 (in thousands):
| For the Years Ended | ||||||||||||
| 2016 | 2015 | 2014 | ||||||||||
| Amortization expense |
$ | 90 | $ | 918 | $ | 1,688 | ||||||
60
Table of Contents
RESOURCES CONNECTION, INC.
NOTES TO CONSOLIDATED FINANCIAL STATEMENTS — (Continued)
As of May 28, 2016, all of the Company’s intangible assets subject to amortization have been fully amortized.
The following table summarizes the activity in the Company’s goodwill balance (in thousands):
| For the Years Ended | ||||||||
| May 28, 2016 |
May 30, 2015 |
|||||||
| Goodwill, beginning of year |
$ | 170,878 | $ | 175,427 | ||||
| Impact of foreign currency exchange rate changes |
305 | (4,549 | ) | |||||
|
|
|
|
|
|||||
| Goodwill, end of period |
$ | 171,183 | $ | 170,878 | ||||
|
|
|
|
|
|||||
5. Income Taxes
The following table represents the current and deferred income tax provision for federal, state and foreign income taxes attributable to operations (in thousands):
| For the Years Ended | ||||||||||||
| May 28, 2016 |
May 30, 2015 |
May 31, 2014 |
||||||||||
| Current |
||||||||||||
| Federal |
$ | 18,320 | $ | 18,046 | $ | 13,722 | ||||||
| State |
4,168 | 4,028 | 3,011 | |||||||||
| Foreign |
1,398 | 1,101 | 740 | |||||||||
|
|
|
|
|
|
|
|||||||
| 23,886 | 23,175 | 17,473 | ||||||||||
|
|
|
|
|
|
|
|||||||
| Deferred |
||||||||||||
| Federal |
(178 | ) | (502 | ) | 1,057 | |||||||
| State |
(27 | ) | (120 | ) | 166 | |||||||
| Foreign |
(135 | ) | 345 | (439 | ) | |||||||
|
|
|
|
|
|
|
|||||||
| (340 | ) | (277 | ) | 784 | ||||||||
|
|
|
|
|
|
|
|||||||
| $ | 23,546 | $ | 22,898 | $ | 18,257 | |||||||
|
|
|
|
|
|
|
|||||||
Income before provision for income taxes is as follows (in thousands):
| For the Years Ended | ||||||||||||
| May 28, 2016 |
May 30, 2015 |
May 31, 2014 |
||||||||||
| Domestic |
$ | 53,417 | $ | 51,997 | $ | 43,843 | ||||||
| Foreign |
572 | (1,591 | ) | (5,700 | ) | |||||||
|
|
|
|
|
|
|
|||||||
| $ | 53,989 | $ | 50,406 | $ | 38,143 | |||||||
|
|
|
|
|
|
|
|||||||
61
Table of Contents
RESOURCES CONNECTION, INC.
NOTES TO CONSOLIDATED FINANCIAL STATEMENTS — (Continued)
The provision for income taxes differs from the amount that would result from applying the federal statutory rate as follows:
| For the Years Ended | ||||||||||||
| May 28, 2016 |
May 30, 2015 |
May 31, 2014 |
||||||||||
| Statutory tax rate |
35.0 | % | 35.0 | % | 35.0 | % | ||||||
| State taxes, net of federal benefit |
4.9 | 5.0 | 5.3 | |||||||||
| Non-U.S. rate adjustments |
0.4 | 1.1 | 2.5 | |||||||||
| Stock-based compensation |
0.6 | 0.5 | 0.8 | |||||||||
| Valuation allowance |
1.3 | 2.8 | 3.6 | |||||||||
| Permanent items, primarily meals and entertainment |
1.5 | 1.3 | 1.4 | |||||||||
| FIN 48 adjustments |
— | — | (1.8 | ) | ||||||||
| Other, net |
(0.1 | ) | (0.3 | ) | 1.1 | |||||||
|
|
|
|
|
|
|
|||||||
| Effective tax rate |
43.6 | % | 45.4 | % | 47.9 | % | ||||||
|
|
|
|
|
|
|
|||||||
The impact of state taxes, net of federal benefit, and foreign income taxed at other than U.S. rates fluctuates year over year due to the changes in the mix of operating income and losses amongst the various states and foreign jurisdictions in which the Company operates.
The components of the net deferred tax asset consist of the following (in thousands):
| As of May 28, 2016 |
As of May 30, 2015 |
|||||||
| Deferred tax assets: |
||||||||
| Allowance for doubtful accounts |
$ | 1,685 | $ | 1,665 | ||||
| Accrued compensation |
4,337 | 4,075 | ||||||
| Accrued expenses |
3,163 | 3,561 | ||||||
| Stock options and restricted stock |
15,132 | 15,670 | ||||||
| Foreign tax credit |
557 | 370 | ||||||
| Net operating losses |
15,283 | 14,258 | ||||||
| Property and equipment |
1,550 | 1,369 | ||||||
| State taxes |
368 | 311 | ||||||
|
|
|
|
|
|||||
| Gross deferred tax asset |
42,075 | 41,279 | ||||||
| Valuation allowance |
(15,714 | ) | (15,056 | ) | ||||
|
|
|
|
|
|||||
| Gross deferred tax asset, net of valuation allowance |
26,361 | 26,223 | ||||||
|
|
|
|
|
|||||
| Deferred tax liabilities: |
||||||||
| Goodwill and intangibles |
(22,124 | ) | (20,750 | ) | ||||
|
|
|
|
|
|||||
| Net deferred tax asset |
$ | 4,237 | $ | 5,473 | ||||
|
|
|
|
|
|||||
The Company had an income tax payable of $428,000 and an income tax receivable of $257,000 as of May 28, 2016 and May 30, 2015, respectively.
The tax benefit associated with the exercise of nonqualified stock options and the disqualifying dispositions by employees of incentive stock options, restricted stock awards and shares issued under the Company’s ESPP reduced income taxes payable by $1,086,000 and $940,000 for the years ended May 28, 2016 and May 30, 2015, respectively.
62
Table of Contents
RESOURCES CONNECTION, INC.
NOTES TO CONSOLIDATED FINANCIAL STATEMENTS — (Continued)
The Company has foreign net operating loss carryforwards of $61.4 million and foreign tax credit carryforwards of $560,000. The foreign tax credits will expire beginning in fiscal 2023. The following table summarizes the net operating loss expiration periods.
| Expiration Periods |
Amount of Net Operating Losses | |||
| (in thousands) | ||||
| Fiscal Years Ending: |
||||
| 2017 |
$ | — | ||
| 2018 |
500 | |||
| 2019 |
600 | |||
| 2020 |
1,600 | |||
| 2021 |
5,150 | |||
| 2022-2026 |
3,600 | |||
| Unlimited |
49,950 | |||
|
|
|
|||
| $ | 61,400 | |||
|
|
|
|||
The following table summarizes the activity in our valuation allowance accounts (in thousands):
| Beginning Balance |
Charged to Operations |
Currency Rate Changes |
Ending Balance |
|||||||||||||
| Years Ended: |
||||||||||||||||
| May 31, 2014 |
$ | 14,779 | $ | 1,396 | $ | 544 | $ | 16,719 | ||||||||
| May 30, 2015 |
$ | 16,719 | $ | 1,189 | $ | (2,852 | ) | $ | 15,056 | |||||||
| May 28, 2016 |
$ | 15,056 | $ | 691 | $ | (33 | ) | $ | 15,714 | |||||||
Realization of the deferred tax assets is dependent upon generating sufficient future taxable income. Management believes that it is more likely than not that all other remaining deferred tax assets will be realized through future taxable earnings or alternative tax strategies.
Deferred income taxes have not been provided on the undistributed earnings of approximately $16.2 million from the Company’s foreign subsidiaries as of May 28, 2016 since these amounts are intended to be indefinitely reinvested in foreign operations. If the earnings of the Company’s foreign subsidiaries were to be distributed, management estimates that the income tax impact would be immaterial as the federal taxes would be offset with foreign tax credits.
The following table summarizes the activity related to the gross unrecognized tax benefits (in thousands):
| For the Years Ended | ||||||||
| May 28, 2016 |
May 30, 2015 |
|||||||
| Unrecognized tax benefits, beginning of year |
$ | 42 | $ | 32 | ||||
| Gross increases-tax positions in prior period |
— | 42 | ||||||
| Gross decreases-tax positions in prior period |
— | — | ||||||
| Gross increases-current period tax positions |
— | — | ||||||
| Settlements |
— | — | ||||||
| Lapse of statute of limitations |
— | (32 | ) | |||||
|
|
|
|
|
|||||
| Unrecognized tax benefits, end of year |
$ | 42 | $ | 42 | ||||
|
|
|
|
|
|||||
63
Table of Contents
RESOURCES CONNECTION, INC.
NOTES TO CONSOLIDATED FINANCIAL STATEMENTS — (Continued)
The Company’s total liability for unrecognized gross tax benefits was $42,000 as of both May 28, 2016 and May 30, 2015, which, if ultimately recognized would impact the effective tax rate in future periods. The unrecognized tax benefits include long-term liabilities of $42,000 as of both May 28, 2016 and May 30, 2015; none of the unrecognized tax benefits are short-term liabilities due to the closing of the statute of limitations.
The Company’s major income tax jurisdiction is the U.S., with federal statute of limitations remaining open for fiscal 2013 and thereafter. During the fiscal year ended May 30, 2015, the Company completed federal examinations of fiscal years 2012 and 2013 with an insignificant beneficial change. For states within the U.S. in which the Company does significant business, the Company remains subject to examination for fiscal 2012 and thereafter. Major foreign jurisdictions in Europe remain open for fiscal years ended 2011 and thereafter.
The Company continues to recognize interest expense and penalties related to income tax as a part of its provision for income taxes. While the amount accrued during the current fiscal year is immaterial, the Company has provided $1,000 of accrued interest and penalties as a component of the liability for unrecognized tax benefits.
6. Accrued Salaries and Related Obligations
Accrued salaries and related obligations consist of the following (in thousands):
| As of May 28, 2016 |
As of May 30, 2015 |
|||||||
| Accrued salaries and related obligations |
$ | 18,166 | $ | 17,716 | ||||
| Accrued bonuses |
17,092 | 16,611 | ||||||
| Accrued vacation |
14,897 | 14,310 | ||||||
|
|
|
|
|
|||||
| $ | 50,155 | $ | 48,637 | |||||
|
|
|
|
|
|||||
7. Revolving Credit Agreement
The Company has a $3.0 million unsecured revolving credit facility with Bank of America (the “Credit Agreement”). The Credit Agreement allows the Company to choose the interest rate applicable to advances. The interest rate options are Bank of America’s prime rate and a London Inter-Bank Offered Rate plus 2.25%. Interest, if any, is payable monthly. The Credit Agreement expires November 30, 2016, unless extended by the parties. As of May 28, 2016, the Company had approximately $1.9 million available under the terms of the Credit Agreement, as Bank of America has issued approximately $1.1 million of outstanding letters of credit for the benefit of third parties related to operating leases and guarantees. As of May 28, 2016, the Company was in compliance with all covenants included in the Credit Agreement.
8. Concentrations of Credit Risk
The Company maintains cash and cash equivalent balances, short-term investments in commercial paper and U.S. government agency securities with high credit quality financial institutions. At times, such balances are in excess of federally insured limits.
Financial instruments, which potentially subject the Company to concentration of credit risk, consist primarily of trade receivables. However, concentrations of credit risk are limited due to the large number of customers comprising the Company’s customer base and their dispersion across different business and geographic areas. The Company monitors its exposure to credit losses and maintains an allowance for anticipated losses. A significant change in the liquidity or financial position of one or more of the Company’s customers could result in an increase in the allowance for anticipated losses. No single customer accounted for more than 10% of revenue for the years ended May 28, 2016, May 30, 2015 and May 31, 2014.
64
Table of Contents
RESOURCES CONNECTION, INC.
NOTES TO CONSOLIDATED FINANCIAL STATEMENTS — (Continued)
9. Stockholders’ Equity
The Company’s board of directors has periodically approved a stock repurchase program authorizing the repurchase, at the discretion of the Company’s senior executives, of the Company’s common stock for a designated aggregate dollar limit. The current program was authorized in July 2015 (the “July 2015 program”) and set an aggregate dollar limit not to exceed $150 million. Use of the funds authorized under the July 2015 program commenced in February 2016 upon the exhaustion of the previous stock repurchase program of $150 million approved by the Company’s board of directors in April 2011. Repurchases under the program may take place in the open market or in privately negotiated transactions and may be made pursuant to a Rule 10b5-1 plan. During the years ended May 28, 2016 and May 30, 2015, the Company purchased on the open market approximately 1.8 million and 1.7 million shares of its common stock, respectively, at an average price of $15.32 and $15.65 per share, respectively, for approximately $28.1 million and $26.3 million, respectively. As of May 28, 2016, approximately $138.6 million remains available for future repurchases of our common stock under the July 2015 program.
The Company has 70,000,000 authorized shares of common stock with a $0.01 par value. At May 28, 2016 and May 30, 2015, there were 36,229,000 and 37,273,000 shares of common stock outstanding, respectively, all of which provide the holders with voting rights.
The Company has authorized for issuance 5,000,000 shares of preferred stock with a $0.01 par value per share. The board of directors has the authority to issue preferred stock in one or more series and to determine the related rights and preferences. No shares of preferred stock were outstanding as of May 28, 2016 and May 30, 2015.
The Company’s board of directors has established a quarterly dividend, subject to quarterly board of directors’ approval. On April 21, 2016, the board of directors declared a regular quarterly dividend of $0.10 per share of our common stock. The dividend, payable on June 16, 2016, was accrued in the Consolidated Balance Sheet as of May 28, 2016 for approximately $3.6 million. On July 28, 2016, the board of directors announced approval of an increase of 10% to the regular quarterly dividend to $0.11 per share of common stock. The dividend of approximately $4.0 million is payable on September 21, 2016 to stockholders of record at the close of business on August 24, 2016. Continuation of the quarterly dividend will be at the discretion of the board of directors and will depend upon the Company’s financial condition, results of operations, capital requirements, general business condition, contractual restrictions contained in our current or future credit agreements and other agreements, and other factors deemed relevant by the board of directors.
10. Benefit Plan
The Company has a defined contribution 401(k) plan (“the plan”) which covers all employees in the U.S. who have completed 90 days of service and are age 21 or older. Participants may contribute up to 50% of their annual salary up to the maximum amount allowed by statute. As defined in the plan agreement, the Company may make matching contributions in such amount, if any, up to a maximum of 6% of individual employees’ annual compensation. The Company, at its sole discretion, determines the matching contribution made from quarter to quarter. To receive matching contributions, the employee must be employed on the last business day of the fiscal quarter. For the years ended May 28, 2016, May 30, 2015 and May 31, 2014, the Company contributed approximately $5.0 million, $4.8 million and $4.5 million, respectively, to the plan as Company matching contributions.
11. Supplemental Disclosure of Cash Flow Information
Additional information regarding cash flows is as follows (in thousands):
| For the Years Ended | ||||||||||||
| May 28, 2016 |
May 30, 2015 |
May 31, 2014 |
||||||||||
| Income taxes paid |
$ | 23,135 | $ | 24,326 | $ | 16,187 | ||||||
|
|
|
|
|
|
|
|||||||
| Non-cash investing and financing activities: |
||||||||||||
| Dividends declared, not paid |
$ | 3,623 | $ | 2,982 | $ | 2,677 | ||||||
|
|
|
|
|
|
|
|||||||
| Capitalized leasehold improvements paid directly by landlord |
$ | 405 | $ | 144 | $ | 1,934 | ||||||
|
|
|
|
|
|
|
|||||||
65
Table of Contents
RESOURCES CONNECTION, INC.
NOTES TO CONSOLIDATED FINANCIAL STATEMENTS — (Continued)
12. Commitments and Contingencies
Lease Commitments and Purchase Obligations
At May 28, 2016, the Company had operating leases, expiring at various dates through September 2025, primarily for office premises, and purchase obligations, primarily for fixed assets. At May 28, 2016, the Company had no capital leases. Future minimum rental commitments under operating leases and other known purchase obligations are as follows (in thousands):
| Years Ending: |
Operating Leases |
Purchase Obligations |
||||||
| May 27, 2017 |
$ | 10,006 | $ | 540 | ||||
| May 26, 2018 |
7,899 | 365 | ||||||
| May 25, 2019 |
6,567 | 186 | ||||||
| May 30, 2020 |
4,193 | 102 | ||||||
| May 29, 2021 |
3,757 | 34 | ||||||
| Thereafter |
7,562 | — | ||||||
|
|
|
|
|
|||||
| Total |
$ | 39,984 | $ | 1,227 | ||||
|
|
|
|
|
|||||
Rent expense for the years ended May 28, 2016, May 30, 2015 and May 31, 2014 totaled $13.1 million, $13.1 million and $13.3 million, respectively. Rent expense is recognized on a straight-line basis over the term of the lease, including during any rent holiday periods.
The Company leases approximately 18,200 square feet of the approximately 56,200 square foot Company owned building located in Irvine, California to independent third parties and has operating lease agreements for sub-let space with independent third parties expiring through fiscal 2024. Under the terms of these operating lease agreements, rental income from such third party leases is expected to be $356,000, $193,000, $187,000, $189,000 and $191,000 in fiscal 2017 through 2021, respectively and $650,000 thereafter.
Employment Agreements
The Company’s employment agreement with its president and chief executive officer, Anthony Cherbak, automatically renews for one-year periods commencing May 28, 2015 unless the Company or Mr. Cherbak provides the other party written notice within 60 days of the then-current expiration date that the agreement will not be extended. The employment agreement provides Mr. Cherbak with a specified severance amount depending on whether his separation from the Company is with or without good cause as defined in the agreement. The Company also has employment agreements with certain key members of management, the respective terms of which extended through July 31, 2014 (with the exception of EVP International Operations and Supply Chain Management Tracy Stephens’ employment agreement which extends through July 31, 2016) but automatically renew for additional one year periods unless the Company or the named executive provides the other party written notice no later than 60 days prior to the then-current expiration date that the agreement will not be extended. These agreements provide those employees with a specified severance amount depending on whether the employee is terminated with or without good cause as defined in the applicable agreement.
On July 16, 2015, Mr. Donald Murray announced that he voluntarily retired from the Company’s employ as its Executive Chairman, effective August 31, 2015. Thereafter, at the Board’s request, Mr. Murray continues to serve the Company in his capacity as Chairman of the Board of Directors. On April 6, 2016, the Company announced that Mr. Nathan Franke, Executive Vice President and Chief Financial Officer, intends to retire, and the transition date is expected to be during the first quarter of fiscal 2017.
Legal Proceedings
The Company is involved in certain legal matters in the ordinary course of business. In the opinion of management, all such matters, if disposed of unfavorably, would not have a material adverse effect on the Company’s financial position, cash flows or results of operations.
66
Table of Contents
RESOURCES CONNECTION, INC.
NOTES TO CONSOLIDATED FINANCIAL STATEMENTS — (Continued)
13. Stock Based Compensation Plans
2014 Performance Incentive Plan
On October 23, 2014, the Company’s stockholders approved the 2014 Plan. The 2014 Plan replaced the Resources Connection, Inc. 2004 Performance Incentive Plan and the 1999 Long Term Incentive Plan (the “Prior Stock Plans”). The effective date of the 2014 Plan is September 3, 2014 and, unless terminated earlier by the Board of Directors, will terminate on September 2, 2024. Under the terms of the 2014 Plan, the Company’s board of directors or one or more committees appointed by the board of directors will administer the 2014 Plan. The board of directors has delegated general administrative authority for the 2014 Plan to the Compensation Committee of the board of directors.
The administrator of the 2014 Plan has broad authority to, among other things, select participants and determine the type(s) of award(s) that they are to receive, and determine the number of shares that are to be subject to awards and the terms and conditions of awards, including the price (if any) to be paid for the shares or the award. Persons eligible to receive awards under the 2014 Plan include officers or employees of the Company or any of its subsidiaries, directors of the Company, and certain consultants and advisors to the Company or any of its subsidiaries.
The maximum number of shares of the Company’s common stock that may be issued or transferred pursuant to awards under the 2014 Plan equals the sum of: (1) 2,400,000 shares, plus (2) the number of shares subject to stock options granted under the Prior Stock Plans and outstanding as of September 3, 2014 (the date at which the Prior Stock Plans terminated), which expire, or for any reason are cancelled or terminated, after that date without being exercised, plus (3) the number of shares subject to restricted stock, restricted stock units and other full-value awards granted under the Prior Stock Plans that were outstanding and unvested as of September 3, 2014, which are forfeited, terminated, cancelled, or otherwise reacquired after that date without having become vested. As of May 28, 2016, 3,206,000 shares were available for award grant purposes under the 2014 Plan, subject to future increases as described in (2) and (3) above and subject to increase as then-outstanding awards expire or terminate without having become vested or exercised, as applicable.
The types of awards that may be granted under the 2014 Plan include stock options, restricted stock, stock bonuses, performance stock, stock units, phantom stock and other forms of awards granted or denominated in the Company’s common stock or units of the Company’s common stock, as well as certain cash bonus awards. Under the terms of the 2014 Plan, the option price for the incentive stock options (“ISOs”) and nonqualified stock options (“NQSO”) may not be less than the fair market value of the shares of the Company’s stock on the date of the grant. For ISOs, the exercise price per share may not be less than 110% of the fair market value of a share of common stock on the grant date for any individual possessing more than 10% of the total outstanding stock of the Company. Stock options granted under the 2014 Plan and the Prior Stock Plans generally become exercisable over periods of one to four years and expire not more than ten years from the date of grant. The Company predominantly grants NQSOs to employees in the U.S. The Company granted 50,354 and 49,840 shares of restricted stock during the fiscal years ended May 28, 2016 and May 30, 2015, respectively.
67
Table of Contents
RESOURCES CONNECTION, INC.
NOTES TO CONSOLIDATED FINANCIAL STATEMENTS — (Continued)
A summary of the share-based award activity under the 2014 Plan and the Prior Stock Plans follows (amounts in thousands, except weighted average exercise price):
| Share-Based Awards Available for Grant |
Number of Shares Under Option |
Weighted Average Exercise Price |
Weighted Average Remaining Contractual Life (in years) |
Aggregate Intrinsic Value |
||||||||||||||||
| Options outstanding at May 30, 2015 |
3,449 | 7,647 | $ | 17.64 | 5.33 | $ | 12,414 | |||||||||||||
| Granted, at fair market value |
(1,147 | ) | 1,147 | 15.69 | ||||||||||||||||
| Restricted Stock (1) |
(125 | ) | — | — | ||||||||||||||||
| Exercised |
— | (418 | ) | 12.68 | ||||||||||||||||
| Forfeited (2) |
183 | (183 | ) | 13.54 | ||||||||||||||||
| Expired |
846 | (846 | ) | 26.42 | ||||||||||||||||
|
|
|
|
|
|||||||||||||||||
| Options outstanding at May 28, 2016 |
3,206 | 7,347 | $ | 16.08 | 5.41 | $ | 10,109 | |||||||||||||
|
|
|
|
|
|
|
|
|
|||||||||||||
| Exercisable at May 28, 2016 |
5,068 | $ | 17.95 | 4.01 | $ | 6,294 | ||||||||||||||
|
|
|
|
|
|
|
|||||||||||||||
| Vested and expected to vest at May 28, 2016 (3) |
7,152 | $ | 16.76 | 5.31 | $ | 9,960 | ||||||||||||||
|
|
|
|
|
|
|
|||||||||||||||
| (1) | Amounts represent restricted shares granted. Share-based awards available for grant are reduced by 2.5 shares for each share awarded as stock grants from the 2014 Plan. |
| (2) | Amounts represent both stock options and restricted share awards forfeited. |
| (3) | The expected to vest options are the result of applying the pre-vesting forfeiture rate assumptions to options not yet vested. |
The weighted average grant date fair values of all stock options granted in the years ended May 28, 2016, May 30, 2015 and May 31, 2014 were $15.69, $12.50 and $11.41 per share, respectively.
The aggregate intrinsic value in the preceding table represents the total pre-tax intrinsic value, based on the Company’s closing stock price of $15.51 as of May 27, 2016 (the last actual trading day of fiscal 2016), which would have been received by the option holders had all option holders exercised their options as of that date.
The total pre-tax intrinsic value related to stock options exercised during the years ended May 28, 2016, May 30, 2015 and May 31, 2014 was $1.8 million, $1.2 million and $347,000, respectively. The total estimated fair value of stock options that vested during the years ended May 28, 2016, May 30, 2015 and May 31, 2014 was $4.0 million, $3.8 million and $5.5 million, respectively.
Valuation and Expense Information for Stock Based Compensation Plans
The following table summarizes the impact of the Company’s stock-based compensation plans. Stock-based compensation expense is included in selling, general and administrative expenses and consists of stock-based compensation expense related to employee stock options, ESPP stock purchase rights and restricted stock (in thousands, except per share amounts):
| For the Years Ended | ||||||||||||
| May 28, 2016 |
May 30, 2015 |
May 31, 2014 |
||||||||||
| Income before income taxes |
$ | (6,280 | ) | $ | (5,989 | ) | $ | (6,519 | ) | |||
|
|
|
|
|
|
|
|||||||
| Net income |
$ | (4,159 | ) | $ | (3,823 | ) | $ | (4,424 | ) | |||
|
|
|
|
|
|
|
|||||||
| Net income per share: |
||||||||||||
| Basic |
$ | (0.11 | ) | $ | (0.10 | ) | $ | (0.11 | ) | |||
|
|
|
|
|
|
|
|||||||
| Diluted |
$ | (0.11 | ) | $ | (0.10 | ) | $ | (0.11 | ) | |||
|
|
|
|
|
|
|
|||||||
68
Table of Contents
RESOURCES CONNECTION, INC.
NOTES TO CONSOLIDATED FINANCIAL STATEMENTS — (Continued)
Also included in the stock-based compensation expense for the year ended May 28, 2016 was approximately $900,000 related to the accelerated vesting of options held by Donald Murray in connection with his transition from Executive Chairman to Chairman.
The weighted average estimated fair value per share of employee stock options granted during the years ended May 28, 2016, May 30, 2015 and May 31, 2014 was $4.54, $3.93 and $3.82, respectively, using the Black-Scholes model with the following assumptions:
| For the Years Ended | ||||||
| May 28, 2016 | May 30, 2015 | May 31, 2014 | ||||
| Expected volatility |
35% - 40.5% | 36.2% - 42.1% | 38.4% - 44.1% | |||
| Risk-free interest rate |
1.7% - 2.0% | 1.7% - 2.2% | 1.1% - 1.8% | |||
| Expected dividends |
2.2% | 1.9% - 2.1% | 2.0% - 2.2% | |||
| Expected life |
5.6 - 7.7 years | 5.5 - 7.5 years | 5.3 - 7.5 years | |||
As of May 28, 2016, there was $7.7 million of total unrecognized compensation cost related to non-vested employee stock options granted. That cost is expected to be recognized over a weighted-average period of 31 months. Stock-based compensation expense included in selling, general and administrative expenses for the years ended May 28, 2016, May 30, 2015 and May 31, 2014 was $6.3 million, $6.0 million and $6.5 million, respectively; this consisted of stock-based compensation expense related to employee stock options, employee stock purchases made via the Company’s ESPP and issuances of restricted stock.
Stock-based compensation expense in the tables above includes compensation for restricted shares of $598,000, $515,000 and $406,000 for the years ended May 28, 2016, May 30, 2015 and May 31, 2014, respectively. The Company granted 50,354, 49,840 and 34,632 shares of restricted stock for the years ended May 28, 2016, May 30, 2015 and May 31, 2014, respectively. There were 41,796 and 35,390 restricted shares that vested in fiscal 2016 and 2015, respectively. There were 105,925, 97,938 and 84,379 unvested restricted shares as of May 28, 2016, May 30, 2015 and May 31, 2014, respectively. At May 28, 2016, there was approximately $1.3 million of total unrecognized compensation cost related to restricted shares, which is expected to be recognized over a weighted-average period of 34 months.
Excess tax benefits related to stock-based compensation expense are recognized as an increase to additional paid-in capital and tax shortfalls are recognized as income tax expense unless there are excess tax benefits from previous equity awards to which the shortfall can be offset. On the adoption date of the required accounting for stock-based compensation expense, the Company calculated the amount of eligible excess tax benefits available to offset future tax shortfalls in accordance with the long-form method.
The Company recognizes compensation expense for only the portion of stock options and restricted stock units that are expected to vest, rather than recording forfeitures when they occur. If the actual number of forfeitures differs from that estimated by management, additional adjustments to compensation expense may be required in future periods.
Employee Stock Purchase Plan
On October 23, 2014, the Company’s stockholders approved an amendment to the ESPP to extend the term of the ESPP through October 16, 2024, and to increase the maximum number of shares of the Company’s common stock authorized for issuance under the ESPP by an additional 1.5 million shares.
The Company’s ESPP allows qualified employees (as defined in the ESPP) to purchase designated shares of the Company’s common stock at a price equal to 85% of the lesser of the fair market value of common stock at the beginning or end of each semi-annual stock purchase period. After approval of the amendment, a total of 5.9 million shares of common stock may be issued under the ESPP. The Company issued 325,000, 337,000 and 348,000 shares of common stock pursuant to the ESPP for the years ended May 28, 2016, May 30, 2015 and May 31, 2014, respectively. There are 1.3 million shares of common stock available for issuance under the ESPP as of May 28, 2016.
69
Table of Contents
RESOURCES CONNECTION, INC.
NOTES TO CONSOLIDATED FINANCIAL STATEMENTS — (Continued)
14. Segment Information and Enterprise Reporting
The Company discloses information regarding operations outside of the U.S. The Company operates as one segment. The accounting policies for the domestic and international operations are the same as those described in Note 2 - Summary of Significant Accounting Policies. Summarized information regarding the Company’s domestic and international operations is shown in the following table. Amounts are stated in thousands:
| Revenue for the Years Ended | Long-Lived Assets (1) as of | |||||||||||||||||||
| May 28, 2016 |
May 30, 2015 |
May 31, 2014 |
May 28, 2016 |
May 30, 2015 |
||||||||||||||||
| United States |
$ | 489,035 | $ | 479,972 | $ | 442,784 | $ | 172,155 | $ | 172,637 | ||||||||||
| The Netherlands |
15,859 | 15,777 | 22,304 | 17,728 | 17,582 | |||||||||||||||
| Other |
93,627 | 94,840 | 102,093 | 2,574 | 2,750 | |||||||||||||||
|
|
|
|
|
|
|
|
|
|
|
|||||||||||
| Total |
$ | 598,521 | $ | 590,589 | $ | 567,181 | $ | 192,457 | $ | 192,969 | ||||||||||
|
|
|
|
|
|
|
|
|
|
|
|||||||||||
| (1) | Long-lived assets are comprised of goodwill, intangible assets and property and equipment. |
70
Table of Contents
| ITEM 9. | CHANGES IN AND DISAGREEMENTS WITH ACCOUNTANTS ON ACCOUNTING AND FINANCIAL DISCLOSURE. |
None.
| ITEM 9A. | CONTROLS AND PROCEDURES. |
Evaluation of Disclosure Controls and Procedures
As required by SEC Rule 13a-15(b) under the Securities Exchange Act of 1934, as amended (the “Exchange Act”), the Company carried out an evaluation, under the supervision and with the participation of the Company’s management, including the Company’s Chief Executive Officer and Chief Financial Officer, of the effectiveness of the design and operation of the Company’s disclosure controls and procedures (as such term is defined in Rule 13a-15(e) under the Exchange Act) as of May 28, 2016. Based on this evaluation, the Company’s Chief Executive Officer and Chief Financial Officer concluded that the Company’s disclosure controls and procedures were effective as of May 28, 2016.
Management’s Report on Internal Control Over Financial Reporting
Management is responsible for establishing and maintaining adequate internal control over financial reporting, as such term is defined in Exchange Act Rule 13a-15(f). We maintain internal control over financial reporting designed to provide reasonable assurance regarding the reliability of financial reporting and the preparation of financial statements for external purposes in accordance with generally accepted accounting principles.
Because of its inherent limitations, internal control over financial reporting may not prevent or detect misstatements. Also, projections of any evaluation of effectiveness to future periods are subject to the risk that controls may become inadequate because of changes in conditions, or that the degree of compliance with the policies or procedures may deteriorate.
Under the supervision and with the participation of management, including the Company’s Chief Executive Officer and Chief Financial Officer, the Company conducted an evaluation of the effectiveness of its internal control over financial reporting based on the criteria established in the 2013 Internal Control — Integrated Framework issued by the Committee of Sponsoring Organizations of the Treadway Commission. This evaluation included an assessment of the design of the Company’s internal control over financial reporting and testing of the operational effectiveness of its internal control over financial reporting. Based on this evaluation, management has concluded that the Company’s internal control over financial reporting was effective as of May 28, 2016.
The Company’s independent registered public accounting firm, RSM US LLP, has audited the effectiveness of the Company’s internal control over financial reporting as of May 28, 2016, as stated in their report which is included in this Item under the heading “Report of Independent Registered Public Accounting Firm.”
Changes in Internal Control Over Financial Reporting
There has been no change in the Company’s internal control over financial reporting during the fiscal quarter ended May 28, 2016, that has materially affected, or is reasonably likely to materially affect, the Company’s internal control over financial reporting.
71
Table of Contents
Report of Independent Registered Public Accounting Firm
To the Board of Directors and Stockholders
Resources Connection, Inc.
We have audited Resources Connection, Inc.’s and subsidiaries’ internal control over financial reporting as of May 28, 2016, based on criteria established in Internal Control — Integrated Framework issued by the Committee of Sponsoring Organizations of the Treadway Commission in 2013. Resources Connection, Inc.’s and subsidiaries’ management is responsible for maintaining effective internal control over financial reporting and for its assessment of the effectiveness of internal control over financial reporting included in the accompanying Management’s Report on Internal Control Over Financial Reporting. Our responsibility is to express an opinion on the company’s internal control over financial reporting based on our audit.
We conducted our audit in accordance with the standards of the Public Company Accounting Oversight Board (United States). Those standards require that we plan and perform the audit to obtain reasonable assurance about whether effective internal control over financial reporting was maintained in all material respects. Our audit included obtaining an understanding of internal control over financial reporting, assessing the risk that a material weakness exists, and testing and evaluating the design and operating effectiveness of internal control based on the assessed risk. Our audit also included performing such other procedures as we considered necessary in the circumstances. We believe that our audit provides a reasonable basis for our opinion.
A company’s internal control over financial reporting is a process designed to provide reasonable assurance regarding the reliability of financial reporting and the preparation of financial statements for external purposes in accordance with generally accepted accounting principles. A company’s internal control over financial reporting includes those policies and procedures that (a) pertain to the maintenance of records that, in reasonable detail, accurately and fairly reflect the transactions and dispositions of the assets of the company; (b) provide reasonable assurance that transactions are recorded as necessary to permit preparation of financial statements in accordance with generally accepted accounting principles, and that receipts and expenditures of the company are being made only in accordance with authorizations of management and directors of the company; and (c) provide reasonable assurance regarding prevention or timely detection of unauthorized acquisition, use, or disposition of the company’s assets that could have a material effect on the financial statements.
Because of its inherent limitations, internal control over financial reporting may not prevent or detect misstatements. Also, projections of any evaluation of effectiveness to future periods are subject to the risk that controls may become inadequate because of changes in conditions, or that the degree of compliance with the policies or procedures may deteriorate.
In our opinion, Resources Connection, Inc. and subsidiaries maintained, in all material respects, effective internal control over financial reporting as of May 28, 2016, based on criteria established in Internal Control — Integrated Framework issued by the Committee of Sponsoring Organizations of the Treadway Commission in 2013.
We have also audited, in accordance with the standards of the Public Company Accounting Oversight Board (United States), the consolidated balance sheet and the related consolidated statements of operations, comprehensive income, stockholders’ equity, and cash flows of Resources Connection, Inc. and subsidiaries as of and for the year ended May 28, 2016 and our report dated August 10, 2016 expressed an unqualified opinion.
/s/ RSM US LLP
Irvine, California
August 10, 2016
72
Table of Contents
| ITEM 9B. | OTHER INFORMATION. |
None.
PART III
| ITEM 10. | DIRECTORS, EXECUTIVE OFFICERS AND CORPORATE GOVERNANCE. |
Executive Officers and Directors
Our board of directors has adopted a code of business conduct and ethics that applies to our directors and employees, including our chief executive officer, chief financial officer and principal accounting officer and persons performing similar functions, as required by applicable rules of the SEC and NASDAQ Stock Market. The full text of our code of business conduct and ethics can be found on the investor relations page of our website at www.rgp.com. We intend to disclose any amendment to, or a waiver from, a provision of our code of business conduct and ethics that applies to our directors and executive officers, including our chief executive officer, chief financial officer and principal accounting officer, or persons performing similar functions, by posting such information on the investor relations page of our website at www.rgp.com to the extent required by applicable SEC and NASDAQ rules.
Reference is made to the information regarding directors appearing in Section II under the caption “PROPOSAL 1. ELECTION OF DIRECTORS,” and to the information under the captions “EXECUTIVE OFFICERS,” “SECTION 16(a) BENEFICIAL OWNERSHIP REPORTING COMPLIANCE,” “BOARD OF DIRECTORS” and “BOARD OF DIRECTORS — AUDIT COMMITTEE,” in each case in the Company’s proxy statement related to its 2016 Annual Meeting of Stockholders to be filed with the SEC within 120 days after the end of the fiscal year ended May 28, 2016, which information is incorporated herein by reference.
| ITEM 11. | EXECUTIVE COMPENSATION. |
The information appearing under the captions “COMPENSATION DISCUSSION AND ANALYSIS,” “COMPENSATION COMMITTEE REPORT ON EXECUTIVE COMPENSATION,” “COMPENSATION COMMITTEE INTERLOCKS AND INSIDER PARTICIPATION,” “EXECUTIVE COMPENSATION TABLES FOR FISCAL 2016,” “POTENTIAL PAYMENTS UPON TERMINATION OR CHANGE IN CONTROL” and “BOARD OF DIRECTORS — DIRECTOR COMPENSATION —FISCAL 2016,” in each case, in the Company’s proxy statement related to its 2016 Annual Meeting of Stockholders to be filed with the SEC within 120 days after the end of the fiscal year ended May 28, 2016, is incorporated herein by reference.
| ITEM 12. | SECURITY OWNERSHIP OF CERTAIN BENEFICIAL OWNERS AND MANAGEMENT AND RELATED STOCKHOLDER MATTERS. |
The information appearing under the caption “SECURITY OWNERSHIP OF CERTAIN BENEFICIAL OWNERS AND MANAGEMENT” in the proxy statement related to the Company’s 2016 Annual Meeting of Stockholders to be filed with the SEC within 120 days after the end of the fiscal year ended May 28, 2016, is incorporated herein by reference.
There are no arrangements, known to the Company, which might at a subsequent date result in a change in control of the Company.
73
Table of Contents
The following table sets forth, for the Company’s compensation plans under which equity securities of the Company are authorized for issuance, the number of shares of the Company’s common stock subject to outstanding options, warrants, and rights, the weighted-average exercise price of outstanding options, warrants, and rights, and the number of shares remaining available for future award grants as of May 28, 2016:
| Number of Securities to Be Issued Upon Exercise of Outstanding Options, Warrants and Rights (a) |
Weighted Average Exercise Price of Outstanding Options, Warrants and Rights (b) |
Number of Securities Remaining Available for Future Issuance Under Equity Compensation Plans (Excluding Securities Reflected in Column (a)) (c) |
||||||||||
| Equity compensation plans approved by security holders |
7,346,825 | (1) | $ | 16.08 | (2) | 4,483,427 | (3) | |||||
| Equity compensation plans not approved by security holders |
— | — | — | |||||||||
|
|
|
|
|
|
|
|||||||
| Total |
7,346,825 | $ | 16.08 | 4,483,427 | ||||||||
| (1) | This amount includes 7,346,825 shares of our common stock subject to stock options outstanding under our 2014 Performance Incentive Plan but does not include 105,925 shares of our common stock issued and outstanding pursuant to unvested restricted stock awards under our 2014 Performance Incentive Plan. |
| (2) | This number reflects the weighted-average exercise price of outstanding options and has been calculated exclusive of outstanding restricted stock awards issued under our 2014 Performance Incentive Plan. |
| (3) | Consists of 1,277,509 shares available for issuance under the Company’s ESPP and 3,205,918 shares available for issuance under the Company’s 2014 Performance Incentive Plan. Shares available under the 2014 Performance Incentive Plan generally may be used for any type of award authorized under that plan including stock options, restricted stock, stock bonuses, performance stock, stock units, phantom stock and other forms of awards granted or denominated in the Company’s common stock. |
| ITEM 13. | CERTAIN RELATIONSHIPS AND RELATED TRANSACTIONS, AND DIRECTOR INDEPENDENCE. |
The information appearing under the captions “BOARD OF DIRECTORS — DIRECTOR INDEPENDENCE” and “BOARD OF DIRECTORS — POLICY REGARDING TREATMENT OF RELATED PARTY TRANSACTIONS” in the proxy statement related to the Company’s 2016 Annual Meeting of Stockholders to be filed with the SEC within 120 days after the end of the fiscal year ended May 28, 2016, is incorporated herein by reference.
| ITEM 14. | PRINCIPAL ACCOUNTING FEES AND SERVICES. |
The information appearing under the caption “PROPOSAL 2. RATIFICATION OF APPOINTMENT OF INDEPENDENT REGISTERED PUBLIC ACCOUNTING FIRM FOR FISCAL YEAR 2017” in the proxy statement related to the Company’s 2016 Annual Meeting of Stockholders to be filed with the SEC within 120 days after the end of the fiscal year ended May 28, 2016, is incorporated herein by reference.
PART IV
| ITEM 15. | EXHIBITS AND FINANCIAL STATEMENT SCHEDULES. |
(a) 1. Financial Statements.
The following consolidated financial statements of the Company and its subsidiaries are included in Item 8 of this report:
Report of Independent Registered Public Accounting Firm
Consolidated Balance Sheets as of May 28, 2016 and May 30, 2015
Consolidated Statements of Operations for each of the three years in the period ended May 28, 2016
74
Table of Contents
Consolidated Statements of Comprehensive Income for each of the three years in the period ended May 28, 2016
Consolidated Statements of Stockholders’ Equity for each of the three years in the period ended May 28, 2016
Consolidated Statements of Cash Flows for each of the three years in the period ended May 28 2016
Notes to Consolidated Financial Statements
2. Financial Statement Schedules.
Schedule II-Valuation and Qualifying Accounts are included in Note 2 and 5 to the Registrant’s Notes to Consolidated Financial Statements.
Schedules I, III, IV and V have been omitted as they are not applicable.
3. Exhibits.
75
Table of Contents
EXHIBITS TO FORM 10-K
| Exhibit Number |
Description of Document | |
| 3.1 | Amended and Restated Certificate of Incorporation of Resources Connection, Inc. (incorporated by reference to Exhibit 10.2 to the Registrant’s Quarterly Report on Form 10-Q for the quarter ended November 30, 2004). | |
| 3.2 | Second Amended and Restated Bylaws, as amended (incorporated by reference to Exhibit 3.2 to the Registrant’s Form 8-K filing of July 26, 2012). | |
| 4.1 | Stockholders Agreement, dated December 11, 2000, between Resources Connection, Inc. and certain stockholders of Resources Connection, Inc. (incorporated by reference to Exhibit 4.2 to the Registrant’s Amendment No. 7 to the Registrant’s Registration Statement on Form S-1 filed on December 12, 2000 (File No. 333-45000)). | |
| 4.2 | Specimen Stock Certificate (incorporated by reference to Exhibit 4.3 to the Registrant’s Amendment No. 7 to the Registrant’s Registration Statement on Form S-1 filed on December 12, 2000 (File No. 333-45000)). | |
| 10.1+ | Resources Connection, Inc. 1999 Long-Term Incentive Plan (incorporated by reference to Exhibit 10.2 to the Registrant’s Registration Statement on Form S-1 filed on September 1, 2000 (File No. 333-45000)). | |
| 10.2+ | Resources Connection, Inc. Employee Stock Purchase Plan (incorporated by reference to Annex B to the Company’s Proxy Statement filed with the SEC pursuant to Section 14(a) of the Exchange Act on September 11, 2008). | |
| 10.3+ | Resources Connection, Inc. 2004 Performance Incentive Plan (incorporated by reference to Annex A to the Company’s Proxy Statement filed with the SEC pursuant to Section 14(a) of the Exchange Act on September 11, 2008). | |
| 10.4+ | Resources Connection, Inc. 2004 Performance Incentive Plan Nonqualified Stock Option Agreement (incorporated by reference to Exhibit 10.22 to the Registrant’s Quarterly Report on Form 10-Q for the quarter ended February 28, 2005). | |
| 10.5+ | Resources Connection, Inc. 2004 Performance Incentive Plan Nonqualified Stock Option Agreement (Netherlands) (incorporated by reference to Exhibit 10.23 to the Registrant’s Quarterly Report on Form 10-Q for the quarter ended February 28, 2005). | |
| 10.6+ | Resources Connection, Inc. 2004 Performance Incentive Plan Incentive Stock Option Agreement (incorporated by reference to Exhibit 10.24 to the Registrant’s Quarterly Report on Form 10-Q for the quarter ended February 28, 2005). | |
| 10.7 | Sublease Agreement, dated January 21, 2010, between O’Melveny & Myers LLP and Resources Connection Inc. DBA Resources Global Professionals (incorporated by reference to Exhibit 10.11 to the Registrant’s Annual Report on Form 10-K for the year ended May 28, 2011). | |
| 10.8 | Loan Agreement, dated November 30, 2009, by and among Resources Connection, Inc., Resources Connection LLC and Bank of America, N.A. (incorporated by reference to Exhibit 10.12 to the Registrant’s Annual Report on Form 10-K for the year ended May 28, 2011). | |
| 10.9 | Amendment No. 1 to Loan Agreement, dated November 17, 2010, by and among Resources Connection, Inc., Resources Connection LLC and Bank of America N.A. (incorporated by reference to Exhibit 10.20 to the Registrant’s Quarterly Report on Form 10-Q for the quarter ended November 27, 2010). | |
| 10.10 | Amendment No. 2 to Loan Agreement, dated November 17, 2011, between Bank of America N.A. and Resources Connection, Inc. and Resources Connection LLC (incorporated by reference to Exhibit 10.15 to the Registrant’s Annual Report on Form 10-K for the year ended May 25, 2013). | |
| 10.11 | Amendment No. 3 to Loan Agreement, dated November 13, 2012, between Bank of America N.A. and Resources Connection, Inc. and Resources Connection LLC (incorporated by reference to Exhibit 10. 15 to the Registrant’s Annual Report on Form 10-K for the year ended May 25, 2013). | |
| 10.12 | Amendment No. 4 to Loan Agreement, dated November 15, 2013, between Bank of America N.A. and Resources Connection, Inc. and Resources Connection LLC (incorporated by reference to Exhibit 10.24 to the Registrant’s Quarterly Report on Form 10-Q for the quarter ended November 23, 2013). | |
76
Table of Contents
| Exhibit Number |
Description of Document | |
| 10.13 | Amendment No. 5 to Loan Agreement, dated November 13, 2014, between Bank of America N.A. and Resources Connection, Inc. and Resources Connection LLC (incorporated by reference to Exhibit 10.22 to the Registrant’s Quarterly Report on Form 10-Q for the quarter ended November 29, 2014). | |
| 10.14 | Amendment No. 6 to Loan Agreement, dated November 5, 2015, between Bank of America N.A. and Resources Connection, Inc. and Resources Connection LLC (incorporated by reference to Exhibit 10.25 to the Registrant’s Quarterly Report on Form 10-Q for the quarter ended November 28, 2015). | |
| 10.15+ | Sample Restricted Stock Award Agreement (incorporated by reference to Exhibit 99.3 to the Registrant’s Form 8-K filing of July 15, 2005). | |
| 10.16+ | Employment Agreement, dated July 17, 2008, between Resources Connection, Inc. and Kate W. Duchene (incorporated by reference to Exhibit 10.1 to the Registrant’s Form 8-K filing of July 21, 2008). | |
| 10.17+ | Employment Agreement, dated July 17, 2008, between Resources Connection, Inc. and Nathan W. Franke (incorporated by reference to Exhibit 10.2 to the Registrant’s Form 8-K filing of July 21, 2008). | |
| 10.18+ | Employment Agreement, dated April 23, 2013, between Resources Connection, Inc. and Anthony Cherbak (incorporated by reference to Exhibit 10.1 to the Registrant’s Form 8-K filing of April 24, 2013). | |
| 10.19+ | Employment Agreement, dated July 30, 2013, between Resources Connection, Inc. and Tracy Stephens (incorporated by reference to Exhibit 10.1 to the Registrant’s Form 8-K filing of August 1, 2013). | |
| 10.20+ | Form of Indemnification Agreement between the Registrant and each of its directors and executive officers (incorporated by reference to Exhibit 10.26 to the Registrant’s Form 10-K for the year ended May 31, 2008). | |
| 10.21+ | Resources Connection, Inc. Directors’ Compensation Policy (incorporated by reference to Exhibit 10.21 to the Registrant’s Quarterly Report on Form 10-Q for the quarter ended February 26, 2011). | |
| 10.22+ | Resources Connection, Inc. 2014 Performance Incentive Plan (incorporated by reference to Exhibit 10.22 to the Registrant’s Form 8-K filing of October 28, 2014). | |
| 10.23+ | Resources Connection, Inc. Employee Stock Purchase Plan (incorporated by reference to Annex B to the Company’s Proxy Statement filed with the SEC pursuant to Section 14(a) of the Exchange Act on September 15, 2014). | |
| 21.1* | List of subsidiaries. | |
| 23.1* | Consent of Independent Registered Public Accounting Firm. | |
| 31.1* | Certification of Chief Executive Officer pursuant to 18 U.S.C. Section 1350, as adopted pursuant to Section 302 of the Sarbanes-Oxley Act of 2002. | |
| 31.2* | Certification of Chief Financial Officer pursuant to 18 U.S.C. Section 1350, as adopted pursuant to Section 302 of the Sarbanes-Oxley Act of 2002. | |
| 32.1** | Rule 1350 Certification of Chief Executive Officer. | |
| 32.2** | Rule 1350 Certification of Chief Financial Officer. | |
| 101.INS* | XBRL Instance. | |
| 101.SCH* | XBRL Taxonomy Extension Schema. | |
| 101.CAL* | XBRL Taxonomy Extension Calculation. | |
| 101.DEF* | XBRL Taxonomy Extension Definition. | |
| 101.LAB* | XBRL Taxonomy Extension Labels. | |
| 101.PRE* | XBRL Taxonomy Extension Presentation. | |
| * | Filed herewith. |
| ** | Furnished herewith. |
| + | Indicates a management contract or compensatory plan or arrangement. |
77
Table of Contents
Pursuant to the requirements of Section 13 or 15(d) of the Securities Exchange Act of 1934, the Registrant has duly caused this Annual Report on Form 10-K to be signed on its behalf by the undersigned, thereunto duly authorized.
| RESOURCES CONNECTION, INC. | ||
| By: |
/ S / NATHAN W. FRANKE | |
| Nathan W. Franke | ||
| Chief Financial Officer | ||
Date: August 10, 2016
Pursuant to the requirements of the Securities Exchange Act of 1934, this Annual Report on Form 10-K has been signed below by the following persons on behalf of the Registrant in the capacities and on the dates indicated.
| Signature |
Title |
Date | ||
| / s / ANTHONY CHERBAK Anthony Cherbak |
President, Chief Executive Officer and Director (Principal Executive Officer) |
August 10, 2016 | ||
| / s / NATHAN W. FRANKE Nathan W. Franke |
Chief Financial Officer and Executive Vice President (Principal Financial Officer and Principal Accounting Officer) |
August 10, 2016 | ||
| / S / SUSAN J. CRAWFORD Susan J. Crawford |
Director | August 10, 2016 | ||
| / S / NEIL DIMICK Neil Dimick |
Director | August 10, 2016 | ||
| / S / ROBERT KISTINGER Robert Kistinger |
Director | August 10, 2016 | ||
| / S / DONALD B. MURRAY Donald B. Murray |
Executive Chairman and Director | August 10, 2016 | ||
| / S / A. ROBERT PISANO A. Robert Pisano |
Director | August 10, 2016 | ||
| / S / ANNE SHIH Anne Shih |
Director | August 10, 2016 | ||
| / S / JOLENE SYKES SARKIS Jolene Sykes Sarkis |
Director | August 10, 2016 | ||
| / S / MICHAEL H. WARGOTZ Michael H. Wargotz |
Director | August 10, 2016 | ||
78
Table of Contents
EXHIBIT INDEX
EXHIBITS TO FORM 10-K
| Exhibit Number |
Description of Document | |
| 3.1 | Amended and Restated Certificate of Incorporation of Resources Connection, Inc. (incorporated by reference to Exhibit 10.2 to the Registrant’s Quarterly Report on Form 10-Q for the quarter ended November 30, 2004). | |
| 3.2 | Second Amended and Restated Bylaws, as amended (incorporated by reference to Exhibit 3.2 to the Registrant’s Form 8-K filing of July 26, 2012). | |
| 4.1 | Stockholders Agreement, dated December 11, 2000, between Resources Connection, Inc. and certain stockholders of Resources Connection, Inc. (incorporated by reference to Exhibit 4.2 to the Registrant’s Amendment No. 7 to the Registrant’s Registration Statement on Form S-1 filed on December 12, 2000 (File No. 333-45000)). | |
| 4.2 | Specimen Stock Certificate (incorporated by reference to Exhibit 4.3 to the Registrant’s Amendment No. 7 to the Registrant’s Registration Statement on Form S-1 filed on December 12, 2000 (File No. 333-45000)). | |
| 10.1+ | Resources Connection, Inc. 1999 Long-Term Incentive Plan (incorporated by reference to Exhibit 10.2 to the Registrant’s Registration Statement on Form S-1 filed on September 1, 2000 (File No. 333-45000)). | |
| 10.2+ | Resources Connection, Inc. Employee Stock Purchase Plan (incorporated by reference to Annex B to the Company’s Proxy Statement filed with the SEC pursuant to Section 14(a) of the Exchange Act on September 11, 2008). | |
| 10.3+ | Resources Connection, Inc. 2004 Performance Incentive Plan (incorporated by reference to Annex A to the Company’s Proxy Statement filed with the SEC pursuant to Section 14(a) of the Exchange Act on September 11, 2008). | |
| 10.4+ | Resources Connection, Inc. 2004 Performance Incentive Plan Nonqualified Stock Option Agreement (incorporated by reference to Exhibit 10.22 to the Registrant’s Quarterly Report on Form 10-Q for the quarter ended February 28, 2005). | |
| 10.5+ | Resources Connection, Inc. 2004 Performance Incentive Plan Nonqualified Stock Option Agreement (Netherlands) (incorporated by reference to Exhibit 10.23 to the Registrant’s Quarterly Report on Form 10-Q for the quarter ended February 28, 2005). | |
| 10.6+ | Resources Connection, Inc. 2004 Performance Incentive Plan Incentive Stock Option Agreement (incorporated by reference to Exhibit 10.24 to the Registrant’s Quarterly Report on Form 10-Q for the quarter ended February 28, 2005). | |
| 10.7 | Sublease Agreement, dated January 21, 2010, between O’Melveny & Myers LLP and Resources Connection Inc. DBA Resources Global Professionals (incorporated by reference to Exhibit 10.11 to the Registrant’s Annual Report on Form 10-K for the year ended May 28, 2011). | |
| 10.8 | Loan Agreement, dated November 30, 2009, by and among Resources Connection, Inc., Resources Connection LLC and Bank of America, N.A. (incorporated by reference to Exhibit 10.12 to the Registrant’s Annual Report on Form 10-K for the year ended May 28, 2011). | |
| 10.9 | Amendment No. 1 to Loan Agreement, dated November 17, 2010, by and among Resources Connection, Inc., Resources Connection LLC and Bank of America N.A. (incorporated by reference to Exhibit 10.20 to the Registrant’s Quarterly Report on Form 10-Q for the quarter ended November 27, 2010). | |
| 10.10 | Amendment No. 2 to Loan Agreement, dated November 17, 2011, between Bank of America N.A. and Resources Connection, Inc. and Resources Connection LLC (incorporated by reference to Exhibit 10.15 to the Registrant’s Annual Report on Form 10-K for the year ended May 25, 2013). | |
| 10.11 | Amendment No. 3 to Loan Agreement, dated November 13, 2012, between Bank of America N.A. and Resources Connection, Inc. and Resources Connection LLC (incorporated by reference to Exhibit 10.15 to the Registrant’s Annual Report on Form 10-K for the year ended May 25, 2013). | |
| 10.12 | Amendment No. 4 to Loan Agreement, dated November 15, 2013, between Bank of America N.A. and Resources Connection, Inc. and Resources Connection LLC (incorporated by reference to Exhibit 10.24 to the Registrant’s Quarterly Report on Form 10-Q for the quarter ended November 23, 2013). | |
79
Table of Contents
| Exhibit Number |
Description of Document | |
| 10.13 | Amendment No. 5 to Loan Agreement, dated November 13, 2014, between Bank of America N.A. and Resources Connection, Inc. and Resources Connection LLC (incorporated by reference to Exhibit 10.22 to the Registrant’s Quarterly Report on Form 10-Q for the quarter ended November 29, 2014). | |
| 10.14 | Amendment No. 6 to Loan Agreement, dated November 5, 2015, between Bank of America N.A. and Resources Connection, Inc. and Resources Connection LLC (incorporated by reference to Exhibit 10.25 to the Registrant’s Quarterly Report on Form 10-Q for the quarter ended November 28, 2015). | |
| 10.15+ | Sample Restricted Stock Award Agreement (incorporated by reference to Exhibit 99.3 to the Registrant’s Form 8-K filing of July 15, 2005). | |
| 10.16+ | Employment Agreement, dated July 17, 2008, between Resources Connection, Inc. and Kate W. Duchene (incorporated by reference to Exhibit 10.1 to the Registrant’s Form 8-K filing of July 21, 2008). | |
| 10.17+ | Employment Agreement, dated July 17, 2008, between Resources Connection, Inc. and Nathan W. Franke (incorporated by reference to Exhibit 10.2 to the Registrant’s Form 8-K filing of July 21, 2008). | |
| 10.18+ | Employment Agreement, dated April 23, 2013, between Resources Connection, Inc. and Anthony Cherbak (incorporated by reference to Exhibit 10.1 to the Registrant’s Form 8-K filing of April 24, 2013). | |
| 10.19+ | Employment Agreement, dated July 30, 2013, between Resources Connection, Inc. and Tracy Stephens (incorporated by reference to Exhibit 10.1 to the Registrant’s Form 8-K filing of August 1, 2013). | |
| 10.20+ | Form of Indemnification Agreement between the Registrant and each of its directors and executive officers (incorporated by reference to Exhibit 10.26 to the Registrant’s Form 10-K for the year ended May 31, 2008). | |
| 10.21+ | Resources Connection, Inc. Directors’ Compensation Policy (incorporated by reference to Exhibit 10.21 to the Registrant’s Quarterly Report on Form 10-Q for the quarter ended February 26, 2011). | |
| 10.22+ | Resources Connection, Inc. 2014 Performance Incentive Plan (incorporated by reference to Exhibit 10.22 to the Registrant’s Form 8-K filing of October 28, 2014). | |
| 10.23+ | Resources Connection, Inc. Employee Stock Purchase Plan (incorporated by reference to Annex B to the Company’s Proxy Statement filed with the SEC pursuant to Section 14(a) of the Exchange Act on September 15, 2014). | |
| 21.1* | List of Subsidiaries. | |
| 23.1* | Consent of Independent Registered Public Accounting Firm. | |
| 31.1* | Certification of Chief Executive Officer pursuant to 18 U.S.C. Section 1350, as adopted pursuant to Section 302 of the Sarbanes-Oxley Act of 2002. | |
| 31.2* | Certification of Chief Financial Officer pursuant to 18 U.S.C. Section 1350, as adopted pursuant to Section 302 of the Sarbanes-Oxley Act of 2002. | |
| 32.1* | Rule 1350 Certification of Chief Executive Officer. | |
| 32.2* | Rule 1350 Certification of Chief Financial Officer. | |
| 101.INS* | XBRL Instance. | |
| 101.SCH* | XBRL Taxonomy Extension Schema. | |
| 101.CAL* | XBRL Taxonomy Extension Calculation. | |
| 101.DEF* | XBRL Taxonomy Extension Definition. | |
| 101.LAB* | XBRL Taxonomy Extension Labels. | |
| 101.PRE* | XBRL Taxonomy Extension Presentation. | |
| * | Filed herewith. |
| + | Indicates a management contract or compensatory plan or arrangement. |
80