Attached files
| file | filename |
|---|---|
| 8-K - FORM 8-K - ServisFirst Bancshares, Inc. | v446634_8k.htm |
Exhibit 99.1
OUR NAME IS OUR MISSION. ServisFirst Bancshares, Inc. NASDAQ: SFBS August 2016
Forward - Looking Statements This presentation contains forward - looking statements within the meaning of the Private Securities Litigation Reform Act of 1995 . In addition, ServisFirst Bancshares, Inc . may file or furnish documents with the Securities and Exchange Commission which contain forward - looking statements and management may make forward - looking statements orally to analysts, investors, representatives of the media and others . These statements are based on the current beliefs and expectations of ServisFirst Bancshares, Inc . ’s management and are subject to significant risks and uncertainties . Actual results may differ from those set forth in the forward - looking statements . Factors that could cause ServisFirst Bancshares, Inc . ’s actual results to differ materially from those described in the forward - looking statements can be found in ServisFirst Bancshares, Inc . ’s Annual Report on Form 10 - K for the year ended December 31 , 2015 , and Quarterly Reports on Form 10 - Q for the quarters ended June 30 , 2016 , March 31 , 2016 , and September 30 , 2015 which have been filed with the Securities and Exchange Commission and which are available on ServisFirst Bancshares, Inc . ’s website ( www . servisfirstbank . com ) and on the Securities and Exchange Commission’s website ( www . sec . gov ) . ServisFirst Bancshares, Inc . does not undertake to update the forward - looking statements to reflect the impact of circumstances or events that may arise after the date of the forward - looking statements . ▪ Non - GAAP Financial Measures This presentation includes non - GAAP financial measures . Information about any such non - GAAP financial measures, including a reconciliation of those measures to GAAP, can be found in the presentation . 2 OUR NAME IS OUR MISSION.
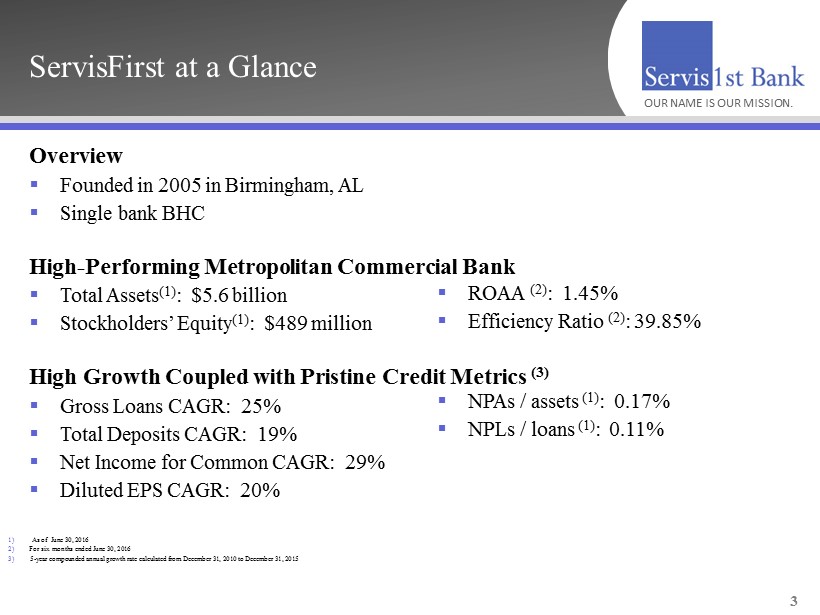
ServisFirst at a Glance Overview ▪ Founded in 2005 in Birmingham, AL ▪ Single bank BHC High - Performing Metropolitan Commercial Bank ▪ Total Assets (1) : $5.6 billion ▪ Stockholders’ Equity (1) : $489 million High Growth Coupled with Pristine Credit Metrics (3) ▪ Gross Loans CAGR: 25% ▪ Total Deposits CAGR: 19% ▪ Net Income for Common CAGR: 29% ▪ Diluted EPS CAGR: 20% 3 ▪ ROAA (2) : 1.45% ▪ Efficiency Ratio (2) : 39.85% 1) As of June 30, 2016 2) For six months ended June 30, 2016 3) 5 - year compounded annual growth rate calculated from December 31, 2010 to December 31, 2015 ▪ NPAs / assets (1) : 0.17% ▪ NPLs / loans (1) : 0.11% OUR NAME IS OUR MISSION.
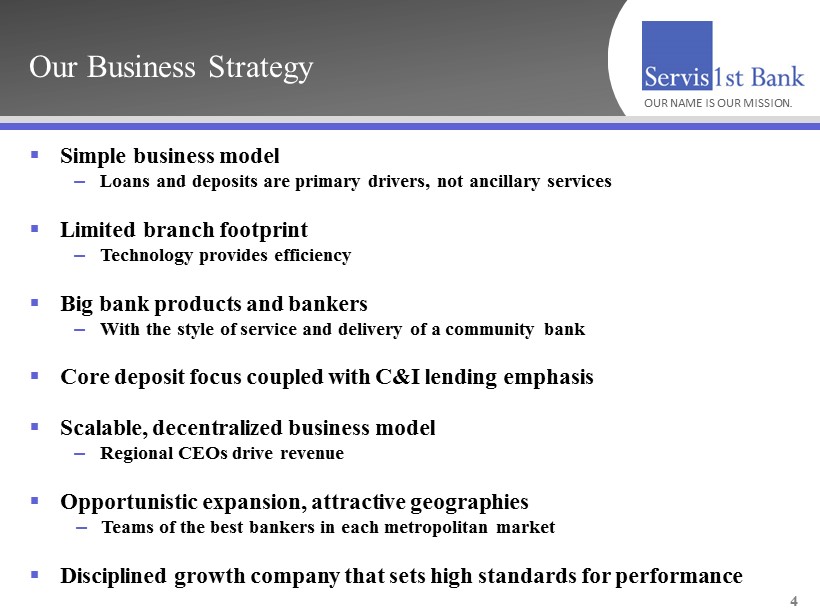
Our Business Strategy ▪ Simple business model – Loans and deposits are primary drivers, not ancillary services ▪ Limited branch footprint – Technology provides efficiency ▪ Big bank products and bankers – With the style of service and delivery of a community bank ▪ Core deposit focus coupled with C&I lending emphasis ▪ Scalable, decentralized business model – Regional CEOs drive revenue ▪ Opportunistic expansion, attractive geographies – Teams of the best bankers in each metropolitan market ▪ Disciplined growth company that sets high standards for performance 4 OUR NAME IS OUR MISSION .
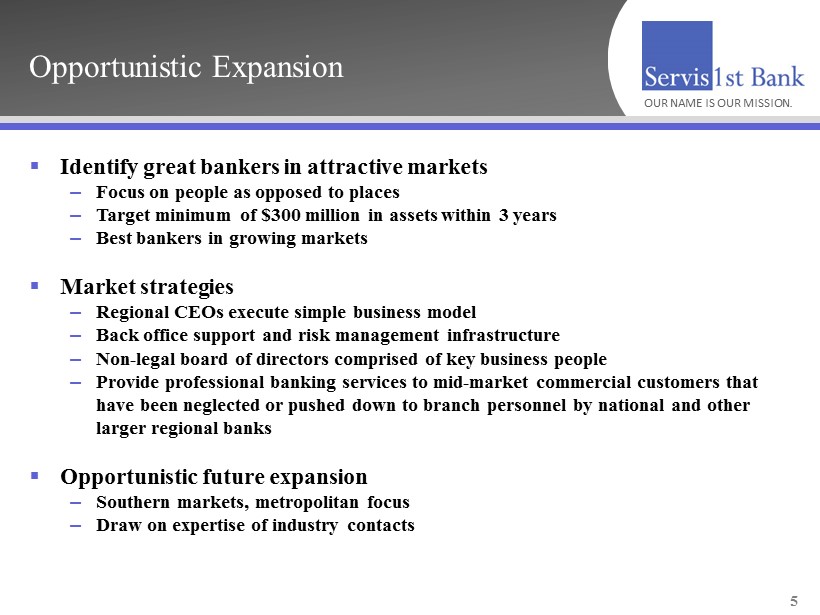
Opportunistic Expansion ▪ Identify great bankers in attractive markets – Focus on people as opposed to places – Target minimum of $300 million in assets within 3 years – Best bankers in growing markets ▪ Market strategies – Regional CEOs execute simple business model – Back office support and risk management infrastructure – Non - legal board of directors comprised of key business people – Provide professional banking services to mid - market commercial customers that have been neglected or pushed down to branch personnel by national and other larger regional banks ▪ Opportunistic future expansion – Southern markets, metropolitan focus – Draw on expertise of industry contacts 5 OUR NAME IS OUR MISSION .
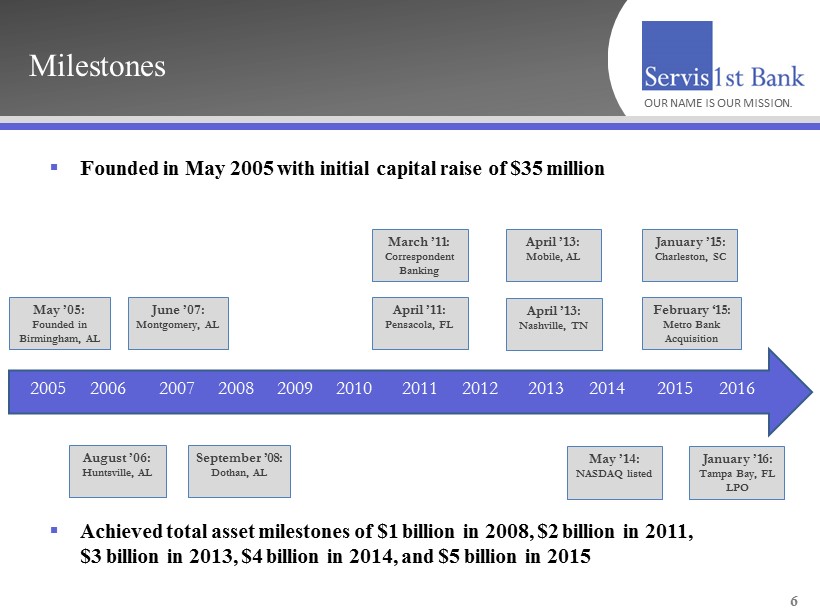
Milestones 6 ▪ Founded in May 2005 with initial capital raise of $35 million ▪ Achieved total asset milestones of $1 billion in 2008, $2 billion in 2011, $3 billion in 2013, $4 billion in 2014, and $5 billion in 2015 2013 2014 May ’05: Founded in Birmingham, AL June ’07: Montgomery, AL March ’11: Correspondent Banking April ’13: Mobile, AL May ’14: NASDAQ listed August ’06: Huntsville, AL September ’08: Dothan, AL April ’11: Pensacola, FL April ’13: Nashville, TN February ‘15: Metro Bank Acquisition OUR NAME IS OUR MISSION . January ’15: Charleston, SC 2015 2012 2013 2011 2010 2009 2008 2007 2006 2005 January ’16: Tampa Bay, FL LPO 2016
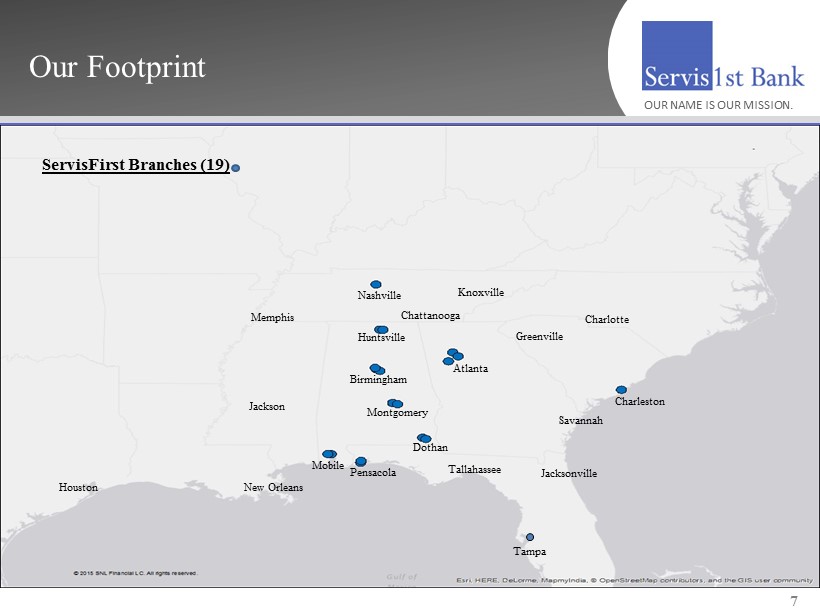
ServisFirst Branches (17) Our Footprint 7 Pensacola Mobile Dothan ServisFirst Branches (19) Nashville Huntsville Birmingham Atlanta Charleston Montgomery Jacksonville Tallahassee Savannah Greenville Knoxville Memphis Chattanooga Houston New Orleans Charlotte Jackson Tampa OUR NAME IS OUR MISSION.
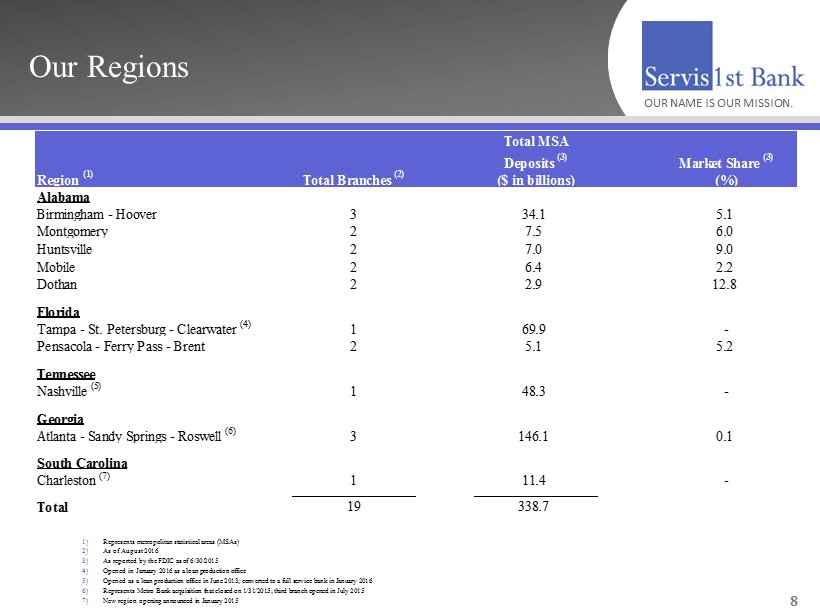
Our Regions 8 OUR NAME IS OUR MISSION. 1) Represents metropolitan statistical areas (MSAs) 2) As of August 2016 3) As reported by the FDIC as of 6/30/2015 4) Opened in January 2016 as a loan production office 5) Opened as a loan production office in June 2013; converted to a full service bank in January 2016 6) Represents Metro Bank acquisition that closed on 1/31/2015; third branch opened in July 2015 7) New region opening announced in January 2015 Total Branches (2) Total MSA Deposits (3) ($ in billions) Market Share (3) (%) 3 34.1 5.1 2 7.5 6.0 2 7.0 9.0 2 6.4 2.2 2 2.9 12.8 1 69.9 - 2 5.1 5.2 1 48.3 - Atlanta - Sandy Springs - Roswell (6) 3 146.1 0.1 Charleston (7) 1 11.4 - 19 338.7 Region (1) Alabama Georgia South Carolina Birmingham - Hoover Huntsville Pensacola - Ferry Pass - Brent Tennessee Total Nashville (5) Montgomery Dothan Mobile Florida Tampa - St. Petersburg - Clearwater (4)
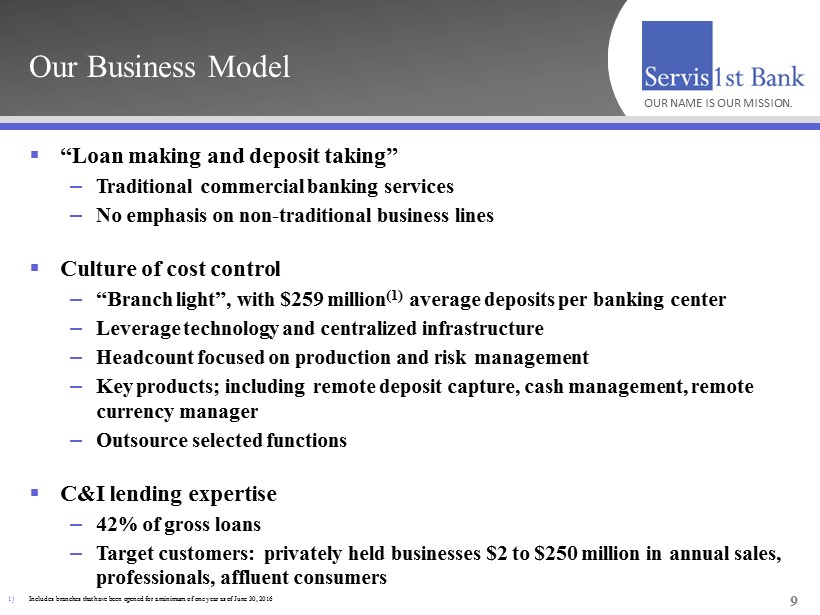
Our Business Model ▪ “Loan making and deposit taking” – Traditional commercial banking services – No emphasis on non - traditional business lines ▪ Culture of cost control – “Branch light”, with $259 million (1) average deposits per banking center – Leverage technology and centralized infrastructure – Headcount focused on production and risk management – Key products; including remote deposit capture, cash management, remote currency manager – Outsource selected functions ▪ C&I lending expertise – 42% of gross loans – Target customers: privately held businesses $2 to $250 million in annual sales, professionals, affluent consumers 9 OUR NAME IS OUR MISSION . 1) Includes branches that have been opened for a minimum of one year as of June 30, 2016
Scalable, Decentralized Structure ▪ Local decision - making – Emphasize local decision - making to drive customer revenue – Centralized, uniform risk management and support – Conservative local lending authorities, covers most lending decisions ▪ Geographic organizational structure (as opposed to line of business structure) ▪ Regional CEOs empowered and held accountable – Utilize stock based compensation to align goals ▪ Top - down sales culture – Senior management actively involved in customer acquisition 10 OUR NAME IS OUR MISSION.
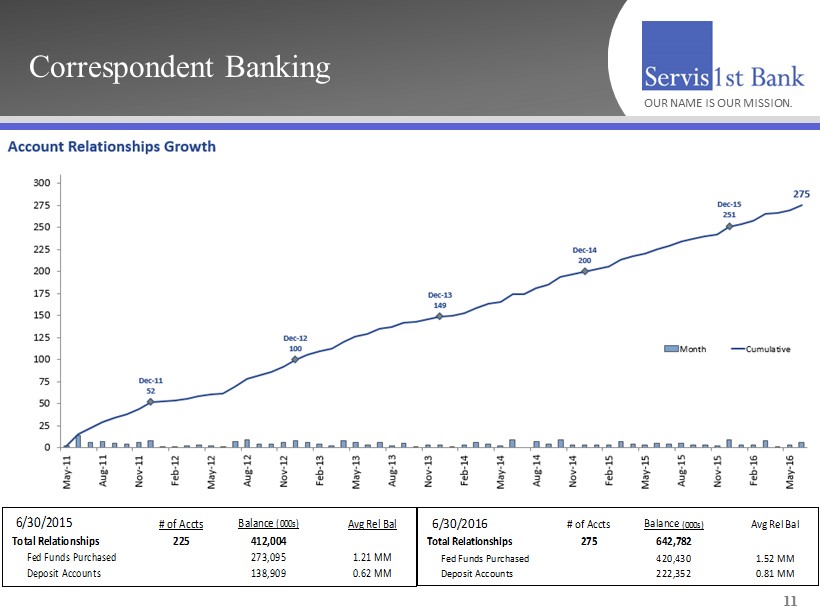
Correspondent Banking OUR NAME IS OUR MISSION . 11 6/30/2015 # of Accts Balance (000s) Avg Rel Bal Total Relationships 225 412,004 Fed Funds Purchased 273,095 1.21 MM Deposit Accounts 138,909 0.62 MM 6/30/2016 # of Accts Balance (000s) Avg Rel Bal Total Relationships 275 642,782 Fed Funds Purchased 420,430 1.52 MM Deposit Accounts 222,352 0.81 MM
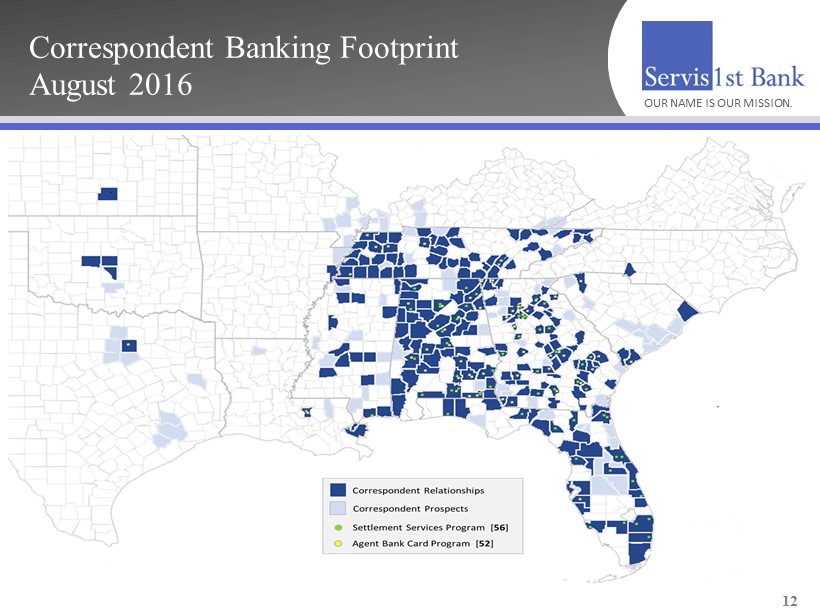
Correspondent Banking Footprint August 2016 12 OUR NAME IS OUR MISSION .
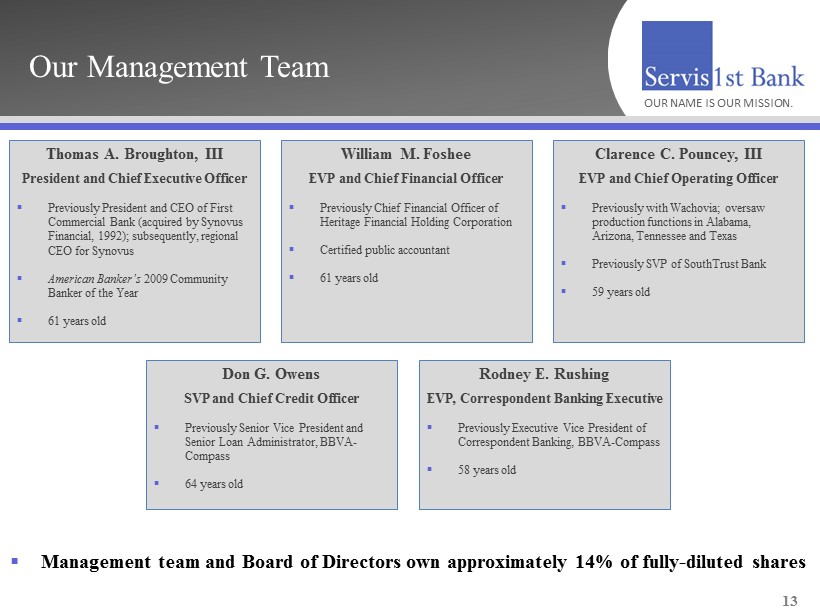
Our Management Team Thomas A. Broughton, III President and Chief Executive Officer ▪ Previously President and CEO of First Commercial Bank (acquired by Synovus Financial, 1992); subsequently, regional CEO for Synovus ▪ American Banker’s 2009 Community Banker of the Year ▪ 61 years old 13 OUR NAME IS OUR MISSION. William M. Foshee EVP and Chief Financial Officer ▪ Previously Chief Financial Officer of Heritage Financial Holding Corporation ▪ Certified public accountant ▪ 61 years old Clarence C. Pouncey , III EVP and Chief Operating Officer ▪ Previously with Wachovia; oversaw production functions in Alabama, Arizona, Tennessee and Texas ▪ Previously SVP of SouthTrust Bank ▪ 59 years old Don G. Owens SVP and Chief Credit Officer ▪ Previously Senior Vice President and Senior Loan Administrator, BBVA - Compass ▪ 64 years old Rodney E. Rushing EVP, Correspondent Banking Executive ▪ Previously Executive Vice President of Correspondent Banking, BBVA - Compass ▪ 58 years old ▪ Management team and Board of Directors own approximately 14% of fully - diluted shares
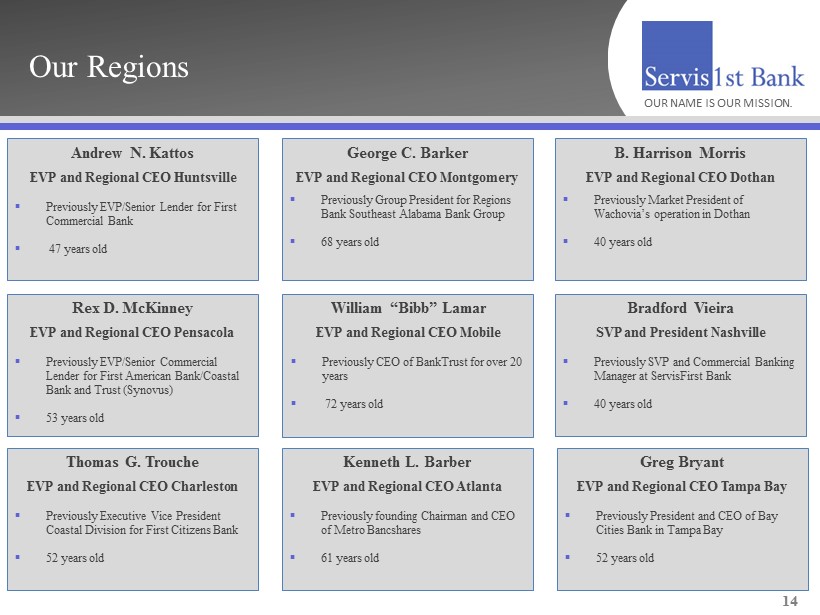
Our Regions Rex D. McKinney EVP and Regional CEO Pensacola ▪ Previously EVP/Senior Commercial Lender for First American Bank/Coastal Bank and Trust ( Synovus ) ▪ 53 years old 14 OUR NAME IS OUR MISSION . Andrew N. Kattos EVP and Regional CEO Huntsville ▪ Previously EVP/Senior Lender for First Commercial Bank ▪ 47 years old Kenneth L. Barber EVP and Regional CEO Atlanta ▪ Previously founding Chairman and CEO of Metro Bancshares ▪ 61 years old William “Bibb” Lamar EVP and Regional CEO Mobile ▪ Previously CEO of BankTrust for over 20 years ▪ 72 years old George C. Barker EVP and Regional CEO Montgomery ▪ Previously Group President for Regions Bank Southeast Alabama Bank Group ▪ 68 years old B. Harrison Morris EVP and Regional CEO Dothan ▪ Previously Market President of Wachovia’s operation in Dothan ▪ 40 years old Greg Bryant EVP and Regional CEO Tampa Bay ▪ Previously President and CEO of Bay Cities Bank in Tampa Bay ▪ 52 years old Thomas G. Trouche EVP and Regional CEO Charleston ▪ Previously Executive Vice President Coastal Division for First Citizens Bank ▪ 52 years old Bradford Vieira SVP and President Nashville ▪ Previously SVP and Commercial Banking Manager at ServisFirst Bank ▪ 40 years old
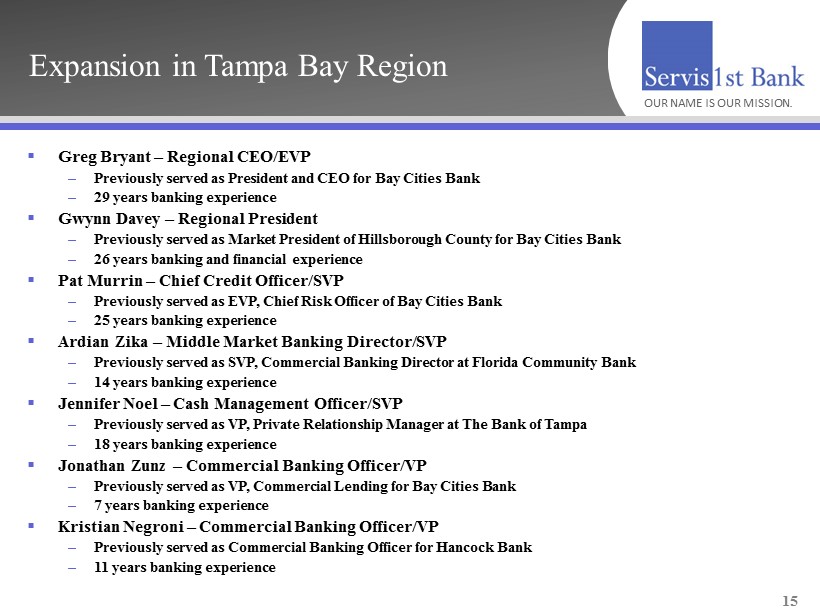
Expansion in Tampa Bay Region ▪ Greg Bryant – Regional CEO/EVP – Previously served as President and CEO for Bay Cities Bank – 29 years banking experience ▪ Gwynn Davey – Regional President – Previously served as Market President of Hillsborough County for Bay Cities Bank – 26 years banking and financial experience ▪ Pat Murrin – Chief Credit Officer/SVP – Previously served as EVP, Chief Risk Officer of Bay Cities Bank – 25 years banking experience ▪ Ardian Zika – Middle Market Banking Director/SVP – Previously served as SVP, Commercial Banking Director at Florida Community Bank – 14 years banking experience ▪ Jennifer Noel – Cash Management Officer/SVP – Previously served as VP, Private Relationship Manager at The Bank of Tampa – 18 years banking experience ▪ Jonathan Zunz – Commercial Banking Officer/VP – Previously served as VP, Commercial Lending for Bay Cities Bank – 7 years banking experience ▪ Kristian Negroni – Commercial Banking Officer/VP – Previously served as Commercial Banking Officer for Hancock Bank – 11 years banking experience OUR NAME IS OUR MISSION . 15

OUR NAME IS OUR MISSION. Financial Results
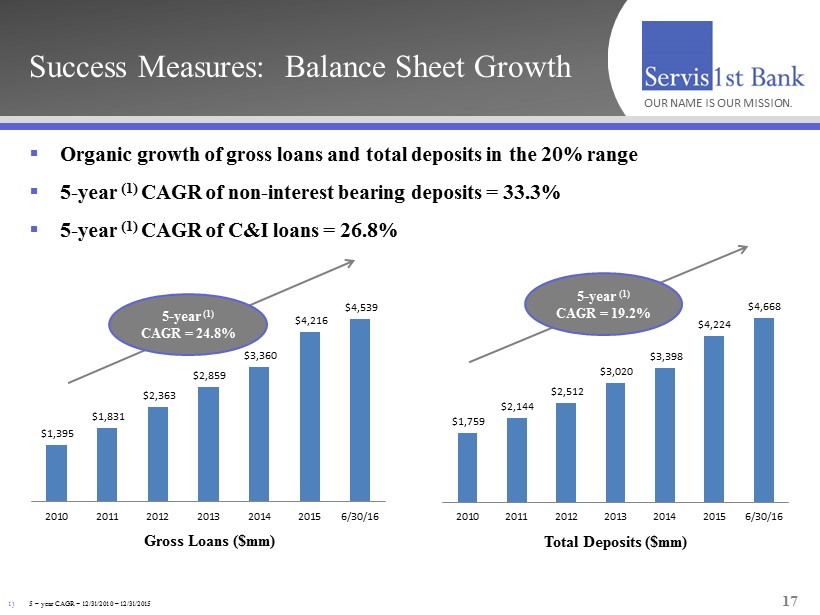
Success Measures: Balance Sheet Growth 17 OUR NAME IS OUR MISSION . 5 - year (1) CAGR = 24.8% 5 - year (1) CAGR = 19.2% Gross Loans ($mm) Total Deposits ($mm) ▪ Organic growth of gross loans and total deposits in the 20% range ▪ 5 - year (1) CAGR of non - interest bearing deposits = 33.3% ▪ 5 - year (1) CAGR of C&I loans = 26.8% $1,395 $1,831 $2,363 $2,859 $3,360 $4,216 $4,539 2010 2011 2012 2013 2014 2015 6/30/16 1) 5 – year CAGR = 12/31/2010 – 12/31/2015 $1,759 $2,144 $2,512 $3,020 $3,398 $4,224 $4,668 2010 2011 2012 2013 2014 2015 6/30/16
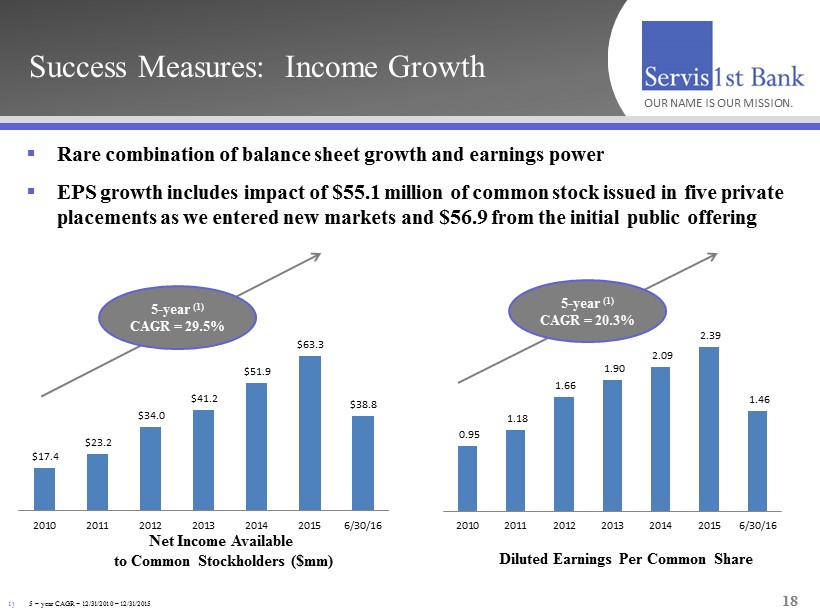
▪ Rare combination of balance sheet growth and earnings power ▪ EPS growth includes impact of $55.1 million of common stock issued in five private placements as we entered new markets and $56.9 from the initial public offering Success Measures: Income Growth 18 OUR NAME IS OUR MISSION. 5 - year (1) CAGR = 29.5% 5 - year (1) CAGR = 20.3% Net Income Available to Common Stockholders ($mm) Diluted Earnings Per Common Share $17.4 $23.2 $34.0 $41.2 $51.9 $63.3 $38.8 2010 2011 2012 2013 2014 2015 6/30/16 0.95 1.18 1.66 1.90 2.09 2.39 1.46 2010 2011 2012 2013 2014 2015 6/30/16 1) 5 – year CAGR = 12/31/2010 – 12/31/2015
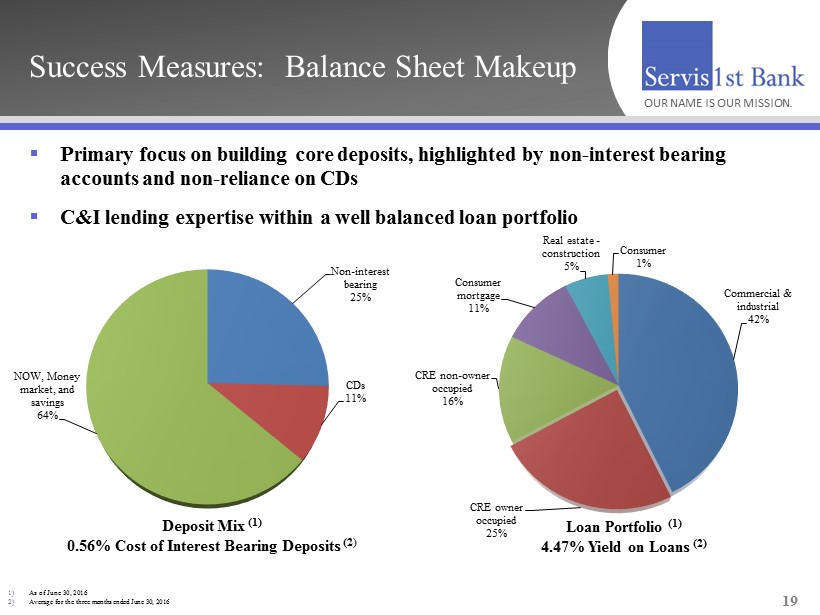
▪ Primary focus on building core deposits, highlighted by non - interest bearing accounts and non - reliance on CDs ▪ C&I lending expertise within a well balanced loan portfolio Success Measures: Balance Sheet Makeup 19 OUR NAME IS OUR MISSION . Deposit Mix (1) 0.56% Cost of Interest Bearing Deposits (2 ) Loan Portfolio (1) 4.47% Yield on Loans (2) 1) As of June 30, 2016 2) Average for the three months ended June 30, 2016 Commercial & industrial 42% CRE owner occupied 25% CRE non - owner occupied 16% Consumer mortgage 11% Real estate - construction 5% Consumer 1% Non - interest bearing 25% CDs 11% NOW, Money market, and savings 64%
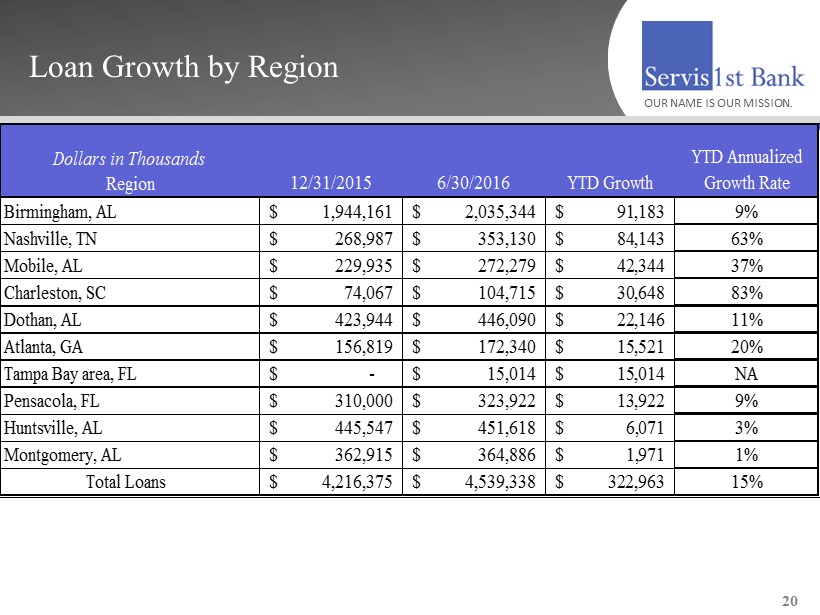
Loan Growth by Region 20 OUR NAME IS OUR MISSION . 12/31/2015 6/30/2016 YTD Growth YTD Annualized Growth Rate Birmingham, AL 1,944,161$ 2,035,344$ 91,183$ 9% Nashville, TN 268,987$ 353,130$ 84,143$ 63% Mobile, AL 229,935$ 272,279$ 42,344$ 37% Charleston, SC 74,067$ 104,715$ 30,648$ 83% Dothan, AL 423,944$ 446,090$ 22,146$ 11% Atlanta, GA 156,819$ 172,340$ 15,521$ 20% Tampa Bay area, FL -$ 15,014$ 15,014$ NA Pensacola, FL 310,000$ 323,922$ 13,922$ 9% Huntsville, AL 445,547$ 451,618$ 6,071$ 3% Montgomery, AL 362,915$ 364,886$ 1,971$ 1% Total Loans 4,216,375$ 4,539,338$ 322,963$ 15% Dollars in Thousands Region
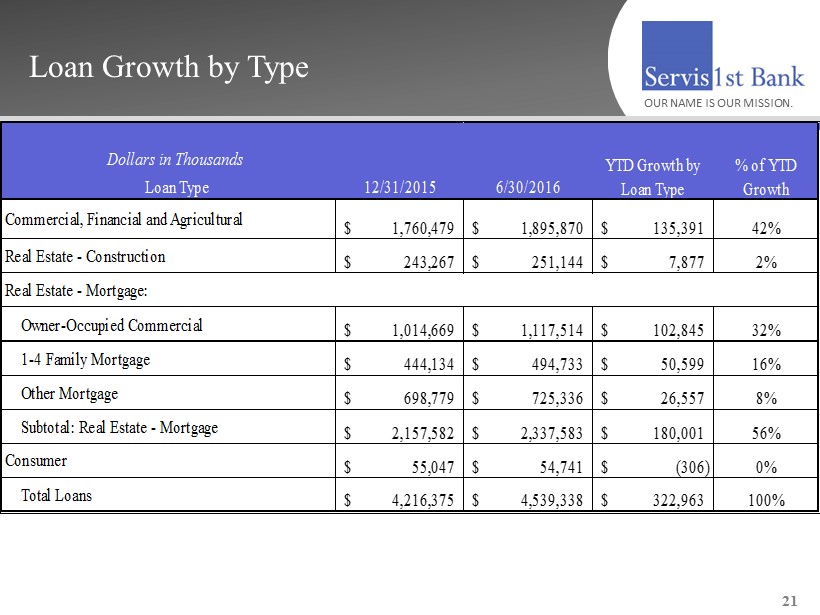
Loan Growth by Type OUR NAME IS OUR MISSION. 21 Dollars in Thousands Loan Type 12/31/2015 6/30/2016 1,760,479$ 1,895,870$ 135,391$ 42% 243,267$ 251,144$ 7,877$ 2% Owner-Occupied Commercial 1,014,669$ 1,117,514$ 102,845$ 32% 1-4 Family Mortgage 444,134$ 494,733$ 50,599$ 16% Other Mortgage 698,779$ 725,336$ 26,557$ 8% Subtotal: Real Estate - Mortgage 2,157,582$ 2,337,583$ 180,001$ 56% 55,047$ 54,741$ (306)$ 0% Total Loans 4,216,375$ 4,539,338$ 322,963$ 100% YTD Growth by Loan Type % of YTD Growth Real Estate - Mortgage: Commercial, Financial and Agricultural Real Estate - Construction Consumer
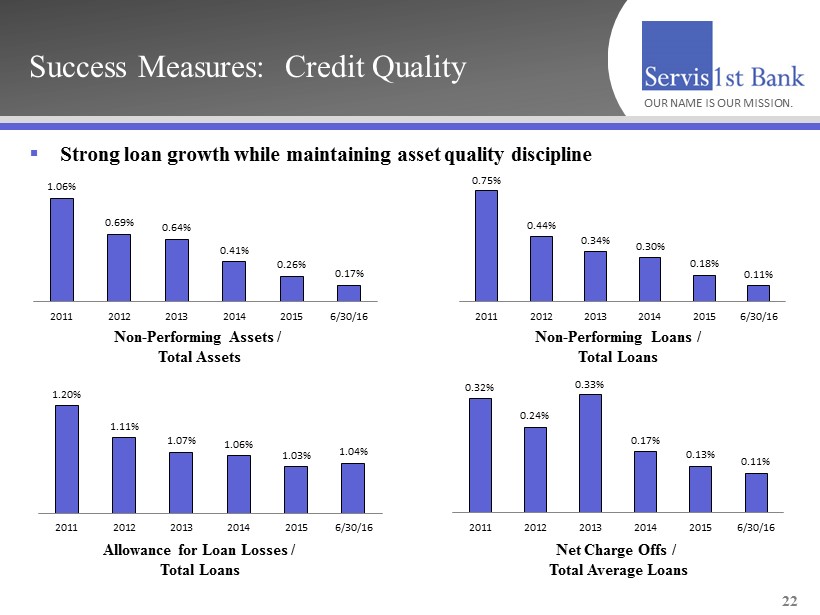
▪ Strong loan growth while maintaining asset quality discipline Success Measures: Credit Quality 22 OUR NAME IS OUR MISSION. Allowance for Loan Losses / Total Loans Net Charge Offs / Total Average Loans Non - Performing Assets / Total Assets Non - Performing Loans / Total Loans 1.06% 0.69% 0.64% 0.41% 0.26% 0.17% 2011 2012 2013 2014 2015 6/30/16 0.75% 0.44% 0.34% 0.30% 0.18% 0.11% 2011 2012 2013 2014 2015 6/30/16 0.32% 0.24% 0.33% 0.17% 0.13% 0.11% 2011 2012 2013 2014 2015 6/30/16 1.20% 1.11% 1.07% 1.06% 1.03% 1.04% 2011 2012 2013 2014 2015 6/30/16
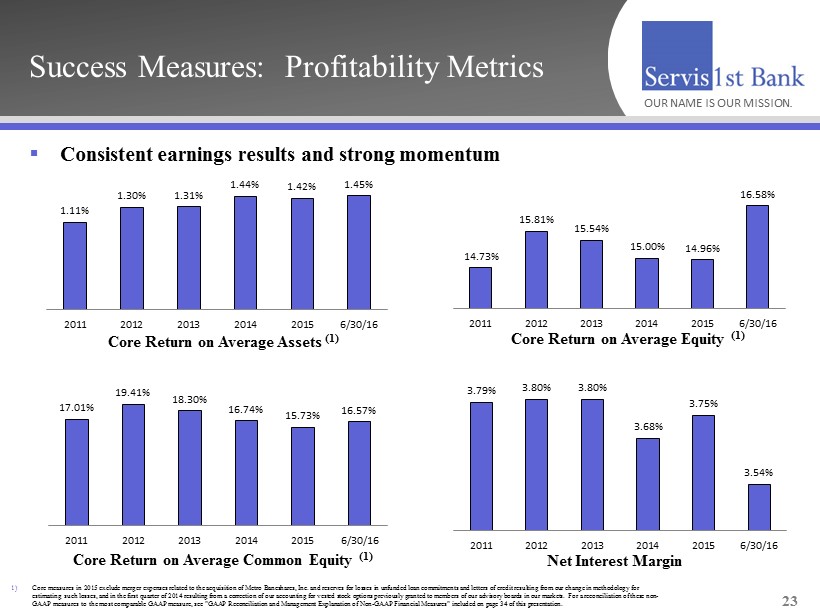
▪ Consistent earnings results and strong momentum Success Measures: Profitability Metrics 23 OUR NAME IS OUR MISSION . Core Return on Average Assets (1) Core Return on Average Equity (1) Core Return on Average Common Equity (1) Net Interest Margin 1) Core measures in 2015 exclude merger expenses related to the acquisition of Metro Bancshares, Inc. and reserves for losses in un funded loan commitments and letters of credit resulting from our change in methodology for estimating such losses, and in the first quarter of 2014 resulting from a correction of our accounting for vested stock optio ns previously granted to members of our advisory boards in our markets. For a reconciliation of these non - GAAP measures to the most comparable GAAP measure, see "GAAP Reconciliation and Management Explanation of Non - GAAP Financial Mea sures" included on page 34 of this presentation. 1.11% 1.30% 1.31% 1.44% 1.42% 1.45% 2011 2012 2013 2014 2015 6/30/16 17.01% 19.41% 18.30% 16.74% 15.73% 16.57% 2011 2012 2013 2014 2015 6/30/16 3.79% 3.80% 3.80% 3.68% 3.75% 3.54% 2011 2012 2013 2014 2015 6/30/16 14.73% 15.81% 15.54% 15.00% 14.96% 16.58% 2011 2012 2013 2014 2015 6/30/16
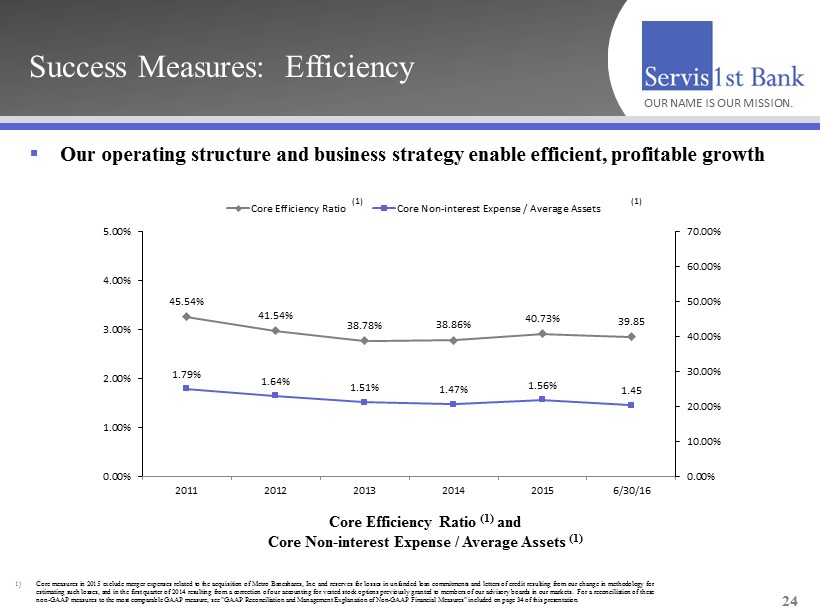
▪ Our operating structure and business strategy enable efficient, profitable growth Success Measures: Efficiency 24 OUR NAME IS OUR MISSION. Core Efficiency Ratio (1) and Core Non - interest Expense / Average Assets (1) (1) (1) 45.54% 41.54% 38.78% 38.86% 40.73% 39.85 1.79% 1.64% 1.51% 1.47% 1.56% 1.45 0.00% 1.00% 2.00% 3.00% 4.00% 5.00% 2011 2012 2013 2014 2015 6/30/16 0.00% 10.00% 20.00% 30.00% 40.00% 50.00% 60.00% 70.00% Core Efficiency Ratio Core Non-interest Expense / Average Assets 1) Core measures in 2015 exclude merger expenses related to the acquisition of Metro Bancshares, Inc . and reserves for losses in unfunded loan commitments and letters of credit resulting from our change in methodology for estimating such losses, and in the first quarter of 2014 resulting from a correction of our accounting for vested stock options previously granted to members of our advisory boards in our markets . For a reconciliation of these non - GAAP measures to the most comparable GAAP measure, see "GAAP Reconciliation and Management Explanation of Non - GAAP Financial Measures" included on page 34 of this presentation .
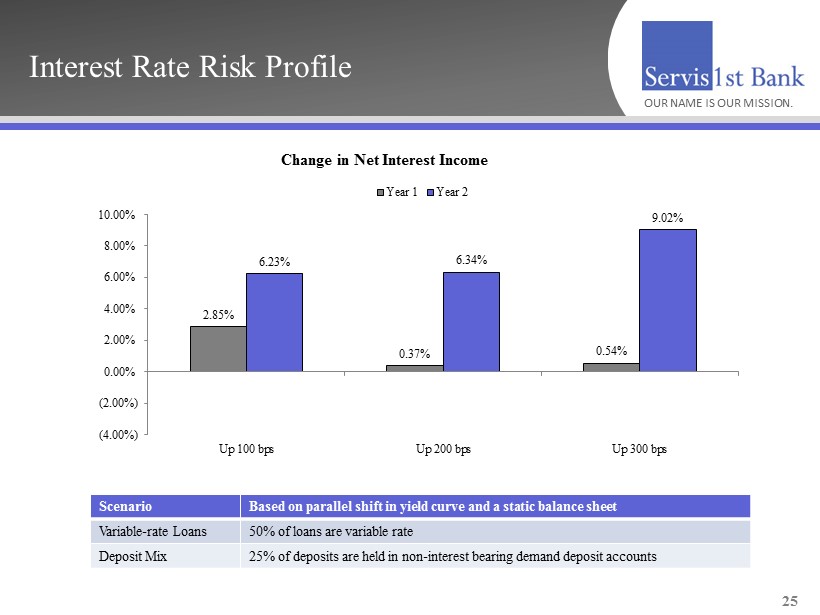
Interest Rate Risk Profile 25 OUR NAME IS OUR MISSION. Change in Net Interest Income Scenario Based on parallel shift in yield curve and a static balance sheet Variable - rate Loans 50% of loans are variable rate Deposit Mix 25% of deposits are held in non - interest bearing demand deposit accounts 2.85% 0.37% 0.54% 6.23% 6.34% 9.02% (4.00%) (2.00%) 0.00% 2.00% 4.00% 6.00% 8.00% 10.00% Up 100 bps Up 200 bps Up 300 bps Year 1 Year 2
Appendix OUR NAME IS OUR MISSION .
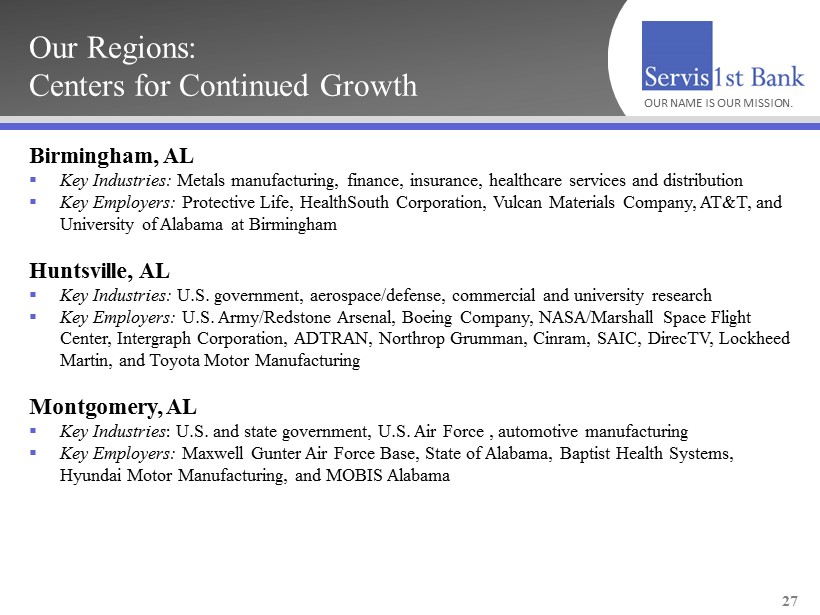
Our Regions: Centers for Continued Growth Birmingham, AL ▪ Key Industries: Metals manufacturing, finance, insurance, healthcare services and distribution ▪ Key Employers: Protective Life, HealthSouth Corporation, Vulcan Materials Company, AT&T, and University of Alabama at Birmingham Huntsville, AL ▪ Key Industries: U.S. government, aerospace/defense, commercial and university research ▪ Key Employers: U.S. Army/Redstone Arsenal, Boeing Company, NASA/Marshall Space Flight Center, Intergraph Corporation, ADTRAN, Northrop Grumman, Cinram, SAIC, DirecTV, Lockheed Martin, and Toyota Motor Manufacturing Montgomery, AL ▪ Key Industries : U.S. and state government, U.S. Air Force , automotive manufacturing ▪ Key Employers: Maxwell Gunter Air Force Base, State of Alabama, Baptist Health Systems, Hyundai Motor Manufacturing, and MOBIS Alabama 27 OUR NAME IS OUR MISSION.
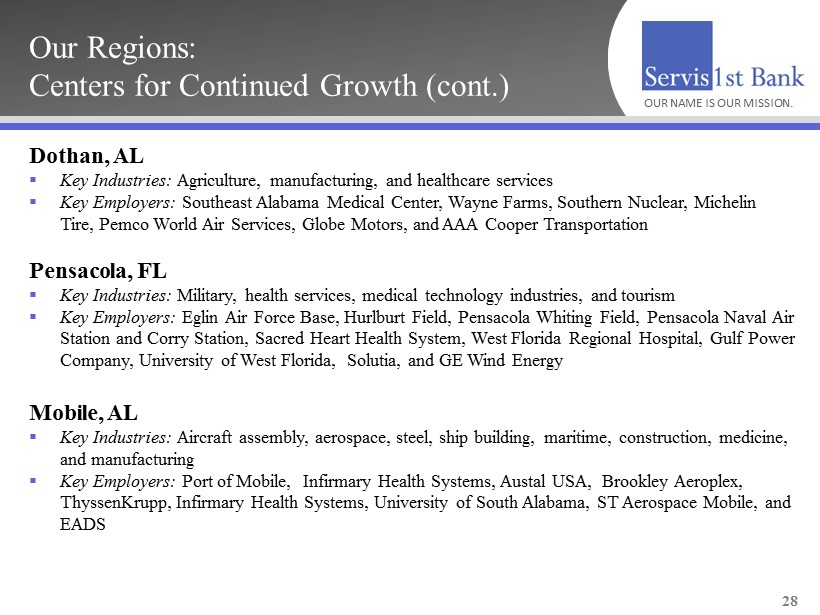
Our Regions: Centers for Continued Growth (cont.) Dothan, AL ▪ Key Industries: Agriculture, manufacturing, and healthcare services ▪ Key Employers: Southeast Alabama Medical Center, Wayne Farms, Southern Nuclear, Michelin Tire, Pemco World Air Services, Globe Motors, and AAA Cooper Transportation Pensacola, FL ▪ Key Industries: Military, health services, medical technology industries, and tourism ▪ Key Employers: Eglin Air Force Base, Hurlburt Field, Pensacola Whiting Field, Pensacola Naval Air Station and Corry Station, Sacred Heart Health System, West Florida Regional Hospital, Gulf Power Company, University of West Florida, Solutia, and GE Wind Energy Mobile, AL ▪ Key Industries: Aircraft assembly, aerospace, steel, ship building, maritime, construction, medicine, and manufacturing ▪ Key Employers: Port of Mobile, Infirmary Health Systems, Austal USA, Brookley Aeroplex , ThyssenKrupp, Infirmary Health Systems, University of South Alabama, ST Aerospace Mobile, and EADS 28 OUR NAME IS OUR MISSION.
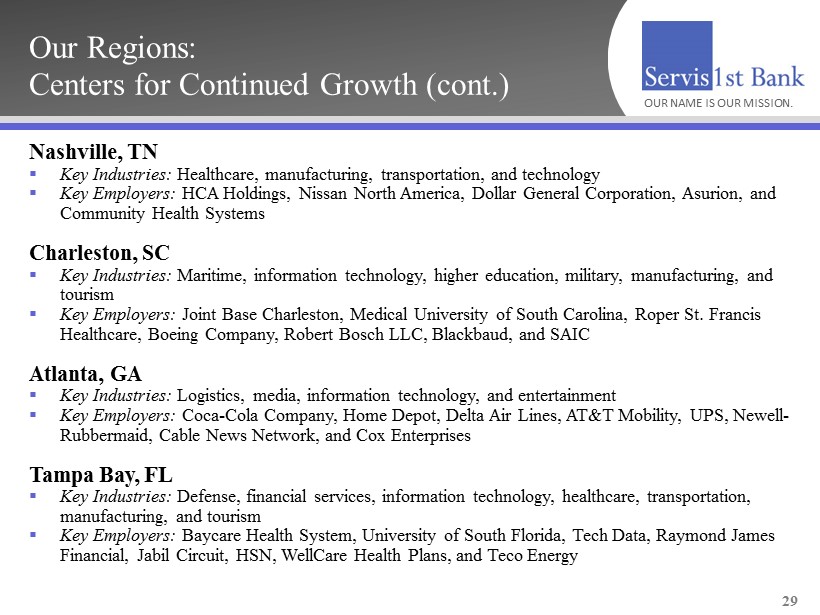
Our Regions: Centers for Continued Growth (cont.) Nashville, TN ▪ Key Industries: Healthcare, manufacturing, transportation, and technology ▪ Key Employers: HCA Holdings, Nissan North America, Dollar General Corporation, Asurion , and Community Health Systems Charleston, SC ▪ Key Industries: Maritime, information technology, higher education, military, manufacturing, and tourism ▪ Key Employers: Joint Base Charleston, Medical University of South Carolina, Roper St. Francis Healthcare, Boeing Company, Robert Bosch LLC, Blackbaud , and SAIC Atlanta, GA ▪ Key Industries: Logistics, media, information technology, and entertainment ▪ Key Employers: Coca - Cola Company, Home Depot, Delta Air Lines, AT&T Mobility, UPS, Newell - Rubbermaid, Cable News Network, and Cox Enterprises Tampa Bay, FL ▪ Key Industries: Defense, financial services, information technology, healthcare, transportation, manufacturing, and tourism ▪ Key Employers: Baycare Health System, University of South Florida, Tech Data, Raymond James Financial, Jabil Circuit, HSN, WellCare Health Plans, and Teco Energy OUR NAME IS OUR MISSION. 29
Tax Credit Partnership Investments The Bank has invested in three types of tax credit partnerships which provide loan opportunities and allow for the recognition of tax credits ▪ New Market Tax Credit – designed to encourage private sector equity investments in low income communities ▪ Low Income Housing Tax Credits – designed to encourage private sector investment in the development of affordable rental housing ▪ Historical Tax Credits – designed to encourage the preservation and reuse of historic buildings 30 OUR NAME IS OUR MISSION.
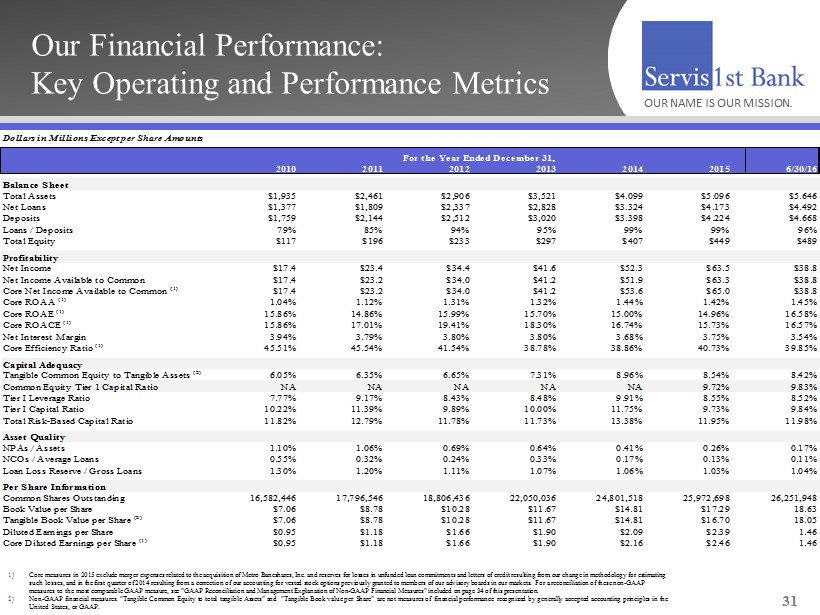
Our Financial Performance: Key Operating and Performance Metrics 31 OUR NAME IS OUR MISSION . Dollars in Millions Except per Share Amounts 2010 2011 2012 2013 2014 2015 6/30/16 Balance Sheet Total Assets $1,935 $2,461 $2,906 $3,521 $4.099 $5.096 $5.646 Net Loans $1,377 $1,809 $2,337 $2,828 $3.324 $4.173 $4.492 Deposits $1,759 $2,144 $2,512 $3,020 $3.398 $4.224 $4.668 Loans / Deposits 79% 85% 94% 95% 99% 99% 96% Total Equity $117 $196 $233 $297 $407 $449 $489 Profitability Net Income $17.4 $23.4 $34.4 $41.6 $52.3 $63.5 $38.8 Net Income Available to Common $17.4 $23.2 $34.0 $41.2 $51.9 $63.3 $38.8 Core Net Income Available to Common (1) $17.4 $23.2 $34.0 $41.2 $53.6 $65.0 $38.8 Core ROAA (1) 1.04% 1.12% 1.31% 1.32% 1.44% 1.42% 1.45% Core ROAE (1) 15.86% 14.86% 15.99% 15.70% 15.00% 14.96% 16.58% Core ROACE (1) 15.86% 17.01% 19.41% 18.30% 16.74% 15.73% 16.57% Net Interest Margin 3.94% 3.79% 3.80% 3.80% 3.68% 3.75% 3.54% Core Efficiency Ratio (1) 45.51% 45.54% 41.54% 38.78% 38.86% 40.73% 39.85% Capital Adequacy Tangible Common Equity to Tangible Assets (2) 6.05% 6.35% 6.65% 7.31% 8.96% 8.54% 8.42% Common Equity Tier 1 Capital Ratio NA NA NA NA NA 9.72% 9.83% Tier I Leverage Ratio 7.77% 9.17% 8.43% 8.48% 9.91% 8.55% 8.52% Tier I Capital Ratio 10.22% 11.39% 9.89% 10.00% 11.75% 9.73% 9.84% Total Risk-Based Capital Ratio 11.82% 12.79% 11.78% 11.73% 13.38% 11.95% 11.98% Asset Quality NPAs / Assets 1.10% 1.06% 0.69% 0.64% 0.41% 0.26% 0.17% NCOs / Average Loans 0.55% 0.32% 0.24% 0.33% 0.17% 0.13% 0.11% Loan Loss Reserve / Gross Loans 1.30% 1.20% 1.11% 1.07% 1.06% 1.03% 1.04% Per Share Information Common Shares Outstanding 16,582,446 17,796,546 18,806,436 22,050,036 24,801,518 25,972,698 26,251,948 Book Value per Share $7.06 $8.78 $10.28 $11.67 $14.81 $17.29 18.63 Tangible Book Value per Share (2) $7.06 $8.78 $10.28 $11.67 $14.81 $16.70 18.05 Diluted Earnings per Share $0.95 $1.18 $1.66 $1.90 $2.09 $2.39 1.46 Core Diluted Earnings per Share (1) $0.95 $1.18 $1.66 $1.90 $2.16 $2.46 1.46 For the Year Ended December 31, 1) Core measures in 2015 exclude merger expenses related to the acquisition of Metro Bancshares, Inc. and reserves for losses in un funded loan commitments and letters of credit resulting from our change in methodology for estimating such losses, and in the first quarter of 2014 resulting from a correction of our accounting for vested stock options previous ly granted to members of our advisory boards in our markets. For a reconciliation of these non - GAAP measures to the most comparable GAAP measure, see "GAAP Reconciliation and Management Explanation of Non - GAAP Financial Measures " included on page 34 of this presentation. 2) Non - GAAP financial measures . "Tangible Common Equity to total tangible Assets" and "Tangible Book value per Share" are not measures of financial performance recognized by generally accepted accounting principles in the United States, or GAAP .
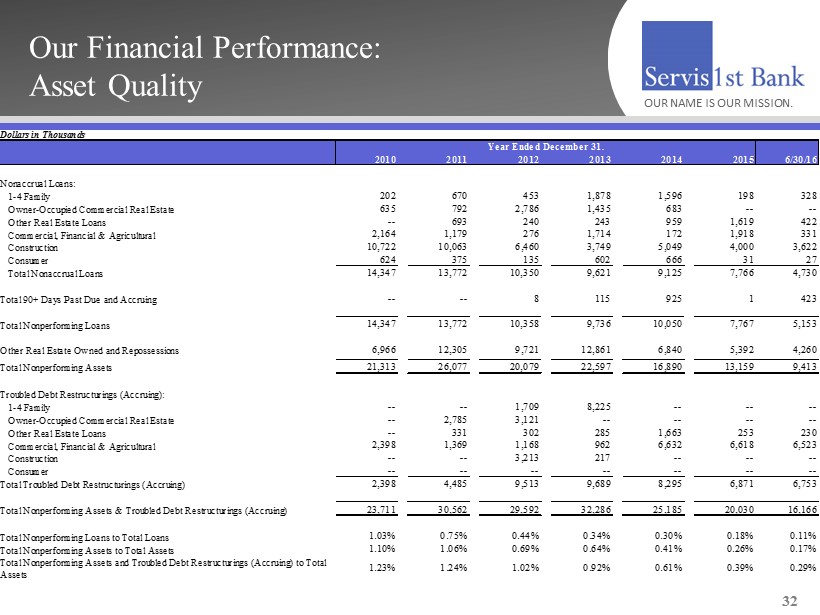
Our Financial Performance: Asset Quality 32 OUR NAME IS OUR MISSION. Dollars in Thousands 2010 2011 2012 2013 2014 2015 6/30/16 Nonaccrual Loans: 1-4 Family 202 670 453 1,878 1,596 198 328 Owner-Occupied Commercial Real Estate 635 792 2,786 1,435 683 -- -- Other Real Estate Loans -- 693 240 243 959 1,619 422 Commercial, Financial & Agricultural 2,164 1,179 276 1,714 172 1,918 331 Construction 10,722 10,063 6,460 3,749 5,049 4,000 3,622 Consumer 624 375 135 602 666 31 27 Total Nonaccrual Loans 14,347 13,772 10,350 9,621 9,125 7,766 4,730 Total 90+ Days Past Due and Accruing -- -- 8 115 925 1 423 Total Nonperforming Loans 14,347 13,772 10,358 9,736 10,050 7,767 5,153 Other Real Estate Owned and Repossessions 6,966 12,305 9,721 12,861 6,840 5,392 4,260 Total Nonperforming Assets 21,313 26,077 20,079 22,597 16,890 13,159 9,413 Troubled Debt Restructurings (Accruing): 1-4 Family -- -- 1,709 8,225 -- -- -- Owner-Occupied Commercial Real Estate -- 2,785 3,121 -- -- -- -- Other Real Estate Loans -- 331 302 285 1,663 253 230 Commercial, Financial & Agricultural 2,398 1,369 1,168 962 6,632 6,618 6,523 Construction -- -- 3,213 217 -- -- -- Consumer -- -- -- -- -- -- -- Total Troubled Debt Restructurings (Accruing) 2,398 4,485 9,513 9,689 8,295 6,871 6,753 Total Nonperforming Assets & Troubled Debt Restructurings (Accruing) 23,711 30,562 29,592 32,286 25,185 20,030 16,166 Total Nonperforming Loans to Total Loans 1.03% 0.75% 0.44% 0.34% 0.30% 0.18% 0.11% Total Nonperforming Assets to Total Assets 1.10% 1.06% 0.69% 0.64% 0.41% 0.26% 0.17% Total Nonperforming Assets and Troubled Debt Restructurings (Accruing) to Total Assets 1.23% 1.24% 1.02% 0.92% 0.61% 0.39% 0.29% Year Ended December 31,
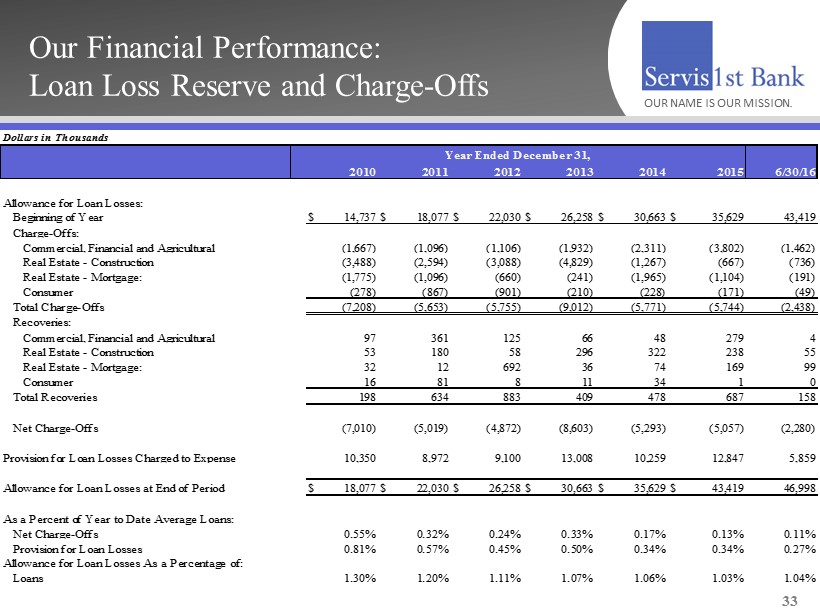
Our Financial Performance: Loan Loss Reserve and Charge - Offs 33 OUR NAME IS OUR MISSION . Dollars in Thousands 6/30/16 Allowance for Loan Losses: Beginning of Year $ 14,737 $ 18,077 $ 22,030 $ 26,258 $ 30,663 $ 35,629 43,419 Charge-Offs: Commercial, Financial and Agricultural (1,667) (1,096) (1,106) (1,932) (2,311) (3,802) (1,462) Real Estate - Construction (3,488) (2,594) (3,088) (4,829) (1,267) (667) (736) Real Estate - Mortgage: (1,775) (1,096) (660) (241) (1,965) (1,104) (191) Consumer (278) (867) (901) (210) (228) (171) (49) Total Charge-Offs (7,208) (5,653) (5,755) (9,012) (5,771) (5,744) (2,438) Recoveries: Commercial, Financial and Agricultural 97 361 125 66 48 279 4 Real Estate - Construction 53 180 58 296 322 238 55 Real Estate - Mortgage: 32 12 692 36 74 169 99 Consumer 16 81 8 11 34 1 0 Total Recoveries 198 634 883 409 478 687 158 Net Charge-Offs (7,010) (5,019) (4,872) (8,603) (5,293) (5,057) (2,280) Provision for Loan Losses Charged to Expense 10,350 8,972 9,100 13,008 10,259 12,847 5,859 Allowance for Loan Losses at End of Period $ 18,077 $ 22,030 $ 26,258 $ 30,663 $ 35,629 $ 43,419 46,998 As a Percent of Year to Date Average Loans: Net Charge-Offs 0.55% 0.32% 0.24% 0.33% 0.17% 0.13% 0.11% Provision for Loan Losses 0.81% 0.57% 0.45% 0.50% 0.34% 0.34% 0.27% Allowance for Loan Losses As a Percentage of: Loans 1.30% 1.20% 1.11% 1.07% 1.06% 1.03% 1.04% Year Ended December 31, 2010 2011 2012 2013 2014 2015
GAAP Reconciliation and Management Explanation of Non - GAAP Financial Measures 34 OUR NAME IS OUR MISSION . We recorded expenses of $2.1 million for the first quarter of 2015 related to the acquisition of Metro Bancshares, Inc. and t he merger of Metro Bank with and into the Bank, and recorded an expense of $500,000 resulting from the initial funding of reserves for unfunded loan commi tme nts as of March 31, 2015, consistent with guidance provided in the Federal Reserve Bank’s Inter - agency Policy Statement SR 06 - 17. We recorded a non - routine expense of $703,000 for the first quarter of 2014 resulting from the correction of our accounting for vested stock options previously gr ant ed to members of our advisory boards in our Dothan, Huntsville and Montgomery, Alabama markets. This change in accounting treatment is a non - cash it em and does not impact our operating activities or cash from operations. The non - GAAP financial measures included in this presentation release of our results are “core net income available to common stockholders,” “core diluted earnings per share,” “core return on average assets” , “core retu rn on average common stockholders’ equity”, “core return on average stockholders’ equity”, “core efficiency ratio”, and “core non - interest expense.” Each of these seven core financial measures excludes the impact of the merger expenses, the initial funding of a reserve for unfunded loan commitments , a nd the non - routine expense attributable to the correction of our accounting for vested stock options. None of the other periods included in thi s p resentation are affected by such non - routine expenses. “Core net income available to common stockholders” is defined as net income available to common stockholders, adjusted by the ne t effect of the non - routine expense. “Core diluted earnings per share” is defined as net income available to common stockholders, adjusted by the net effect of th e n on - routine expense, divided by weighted average diluted shares outstanding. “Core return on average assets” is defined as net income, adjusted by the net effect of the non - routine expense, divided by aver age total assets. “Core return on average common stockholders’ equity” is defined as net income, adjusted by the net effect of the non - routine exp ense, divided by average common stockholders’ equity. “Core return of average stockholders’ equity” is defined as net income, adjusted by the net effect of the non - routine expense, d ivided by average total stockholders’ equity. “Core efficiency ratio” is defined as non - interest expense, adjusted by the effect of the non - routine expense, divided by the su m of net interest income and non - interest income. “Core non - interest expense” is defined as non - interest expense, adjusted by the effect of the non - routine expense. We believe these non - GAAP financial measures provide useful information to management and investors that is supplementary to our financial condition, results of operations and cash flows computed in accordance with GAAP; however, we acknowledge that these non - GAAP fi nancial measures have a number of limitations. As such, you should not view these disclosures as a substitute for results determined in accor dan ce with GAAP, and they are not necessarily comparable to non - GAAP financial measures that other companies, including those in our industry, use. The f ollowing reconciliation table provides a more detailed analysis of the non - GAAP financial measures for the twelve month comparative periods ended Decemb er 31, 2015 and 2014 included in this presentation. Dollars are in thousands, except share and per share data.
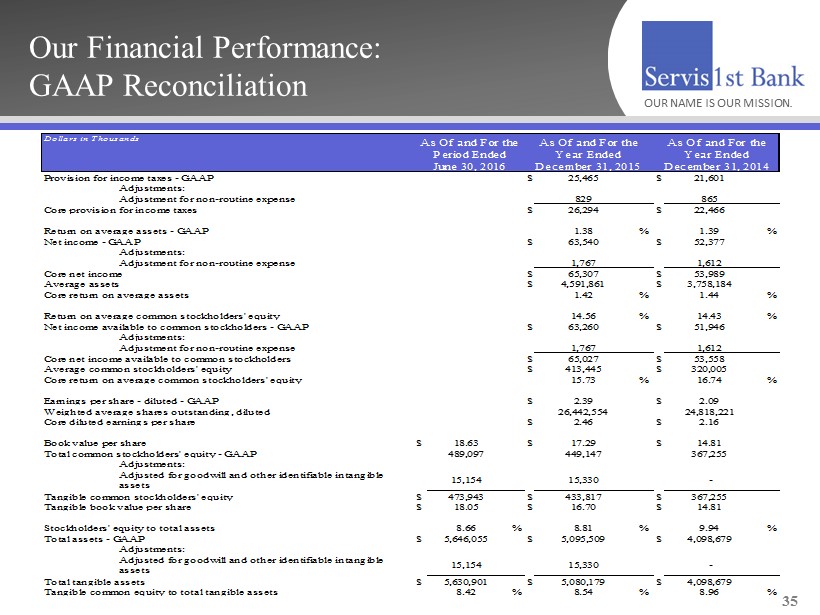
Our Financial Performance: GAAP Reconciliation OUR NAME IS OUR MISSION . 35 Dollars in Thousands $ 25,465 $ 21,601 Adjustments: Adjustment for non-routine expense 829 865 $ 26,294 $ 22,466 1.38 % 1.39 % $ 63,540 $ 52,377 Adjustments: Adjustment for non-routine expense 1,767 1,612 $ 65,307 $ 53,989 $ 4,591,861 $ 3,758,184 1.42 % 1.44 % 14.56 % 14.43 % $ 63,260 $ 51,946 Adjustments: Adjustment for non-routine expense 1,767 1,612 $ 65,027 $ 53,558 $ 413,445 $ 320,005 15.73 % 16.74 % $ 2.39 $ 2.09 26,442,554 24,818,221 $ 2.46 $ 2.16 $ 18.63 $ 17.29 $ 14.81 489,097 449,147 367,255 Adjustments: Adjusted for goodwill and other identifiable intangible assets 15,154 15,330 - $ 473,943 $ 433,817 $ 367,255 $ 18.05 $ 16.70 $ 14.81 8.66 % 8.81 % 9.94 % $ 5,646,055 $ 5,095,509 $ 4,098,679 Adjustments: Adjusted for goodwill and other identifiable intangible assets 15,154 15,330 - $ 5,630,901 $ 5,080,179 $ 4,098,679 8.42 % 8.54 % 8.96 % Average common stockholders' equity Core return on average common stockholders' equity Tangible book value per share As Of and For the Year Ended December 31, 2014 Book value per share As Of and For the Year Ended December 31, 2015 Provision for income taxes - GAAP Return on average assets - GAAP Core net income As Of and For the Period Ended June 30, 2016 Stockholders' equity to total assets Total assets - GAAP Total tangible assets Tangible common equity to total tangible assets Core provision for income taxes Net income - GAAP Core diluted earnings per share Total common stockholders' equity - GAAP Tangible common stockholders' equity Average assets Core return on average assets Return on average common stockholders' equity Net income available to common stockholders - GAAP Earnings per share - diluted - GAAP Weighted average shares outstanding, diluted Core net income available to common stockholders