Attached files
| file | filename |
|---|---|
| 8-K - 8-K - LAYNE CHRISTENSEN CO | layn-8k_20160810.htm |

Jefferies Industrials Conference August 2016 Exhibit 99.1
Safe harbor This presentation contains forward-looking statements within the meaning of the Private Securities Litigation Reform Act of 1995. Such statements may include, but are not limited to, statements of plans and objectives, statements of future economic performance and statements of assumptions underlying such statements, and statements of management's intentions, hopes, beliefs, expectations or predictions of the future. Forward-looking statements can often be identified by the use of forward-looking terminology, such as "should," "intend," "continue," "believe," "may," "hope," "anticipate," "goal," "forecast," "plan," "estimate" and similar words or phrases. Such statements are based on current expectations and are subject to certain risks, uncertainties and assumptions, including but not limited to: estimates and assumptions regarding our strategic direction and business strategy, our ability to implement our restructuring plan for our Africa operations, the extent and timing of a recovery in the mining industry, prevailing prices for various commodities, longer term weather patterns, unanticipated slowdowns in our major markets, the seasonality of our business, the availability of credit, the risks and uncertainties normally incident to our construction industries, the impact of competition, the effectiveness of operational changes expected to reduce operating expenses and increase efficiency, productivity and profitability, the availability of equity or debt capital needed for our business, worldwide economic and political conditions and foreign currency fluctuations that may affect our results of operations. Should one or more of these risks or uncertainties materialize, or should underlying assumptions prove incorrect, actual results may vary materially and adversely from those anticipated, estimated or projected. These forward-looking statements are made as of the date of this presentation, and we assume no obligation to update such forward-looking statements or to update the reasons why actual results could differ materially from those anticipated in such forward-looking statements.
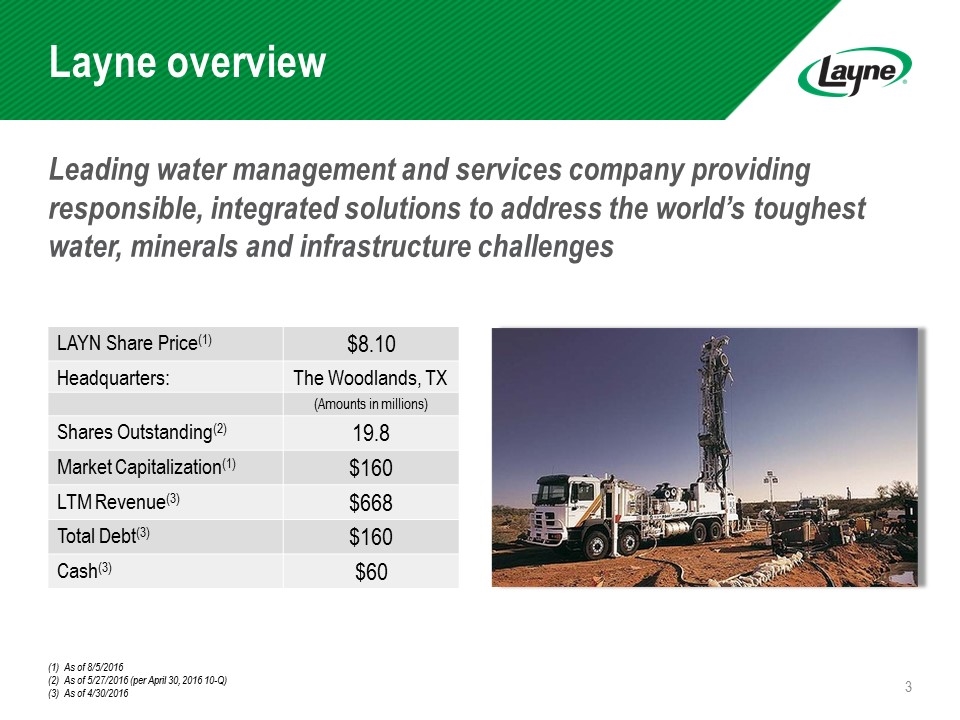
Leading water management and services company providing responsible, integrated solutions to address the world’s toughest water, minerals and infrastructure challenges Layne overview (1) As of 8/5/2016 (2) As of 5/27/2016 (per April 30, 2016 10-Q) (3) As of 4/30/2016 LAYN Share Price(1) $8.10 Headquarters: The Woodlands, TX (Amounts in millions) Shares Outstanding(2) 19.8 Market Capitalization(1) $160 LTM Revenue(3) $668 Total Debt(3) $160 Cash(3) $60
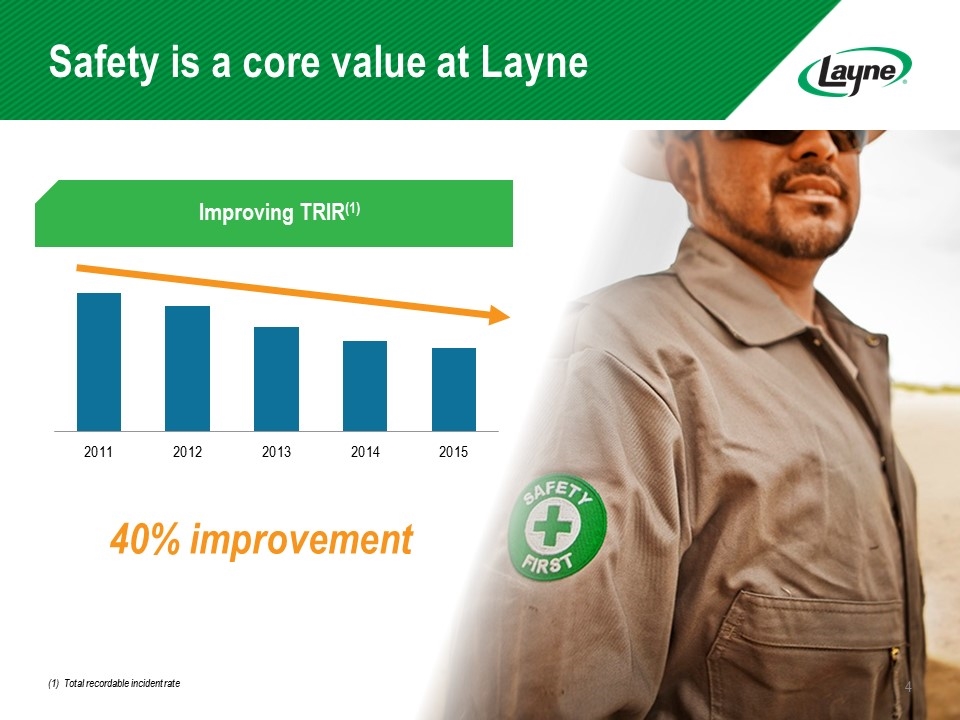
Safety is a core value at Layne (1) Total recordable incident rate Improving TRIR(1) 40% improvement
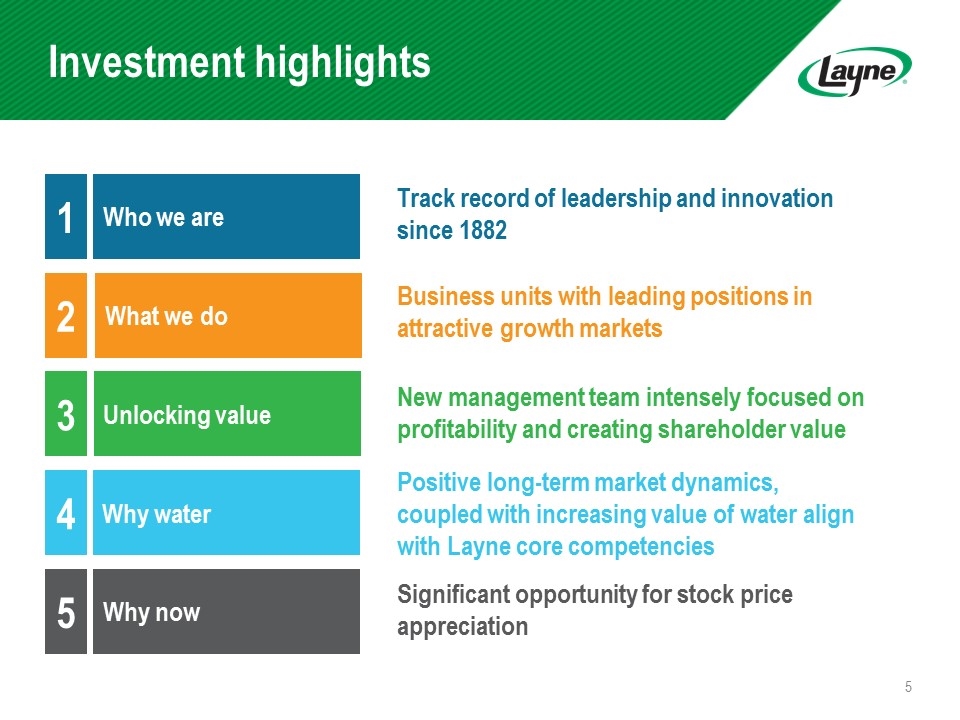
Investment highlights Why now 1 2 3 5 What we do Unlocking value Who we are 4 Why water Track record of leadership and innovation since 1882 Business units with leading positions in attractive growth markets New management team intensely focused on profitability and creating shareholder value Positive long-term market dynamics, coupled with increasing value of water align with Layne core competencies Significant opportunity for stock price appreciation
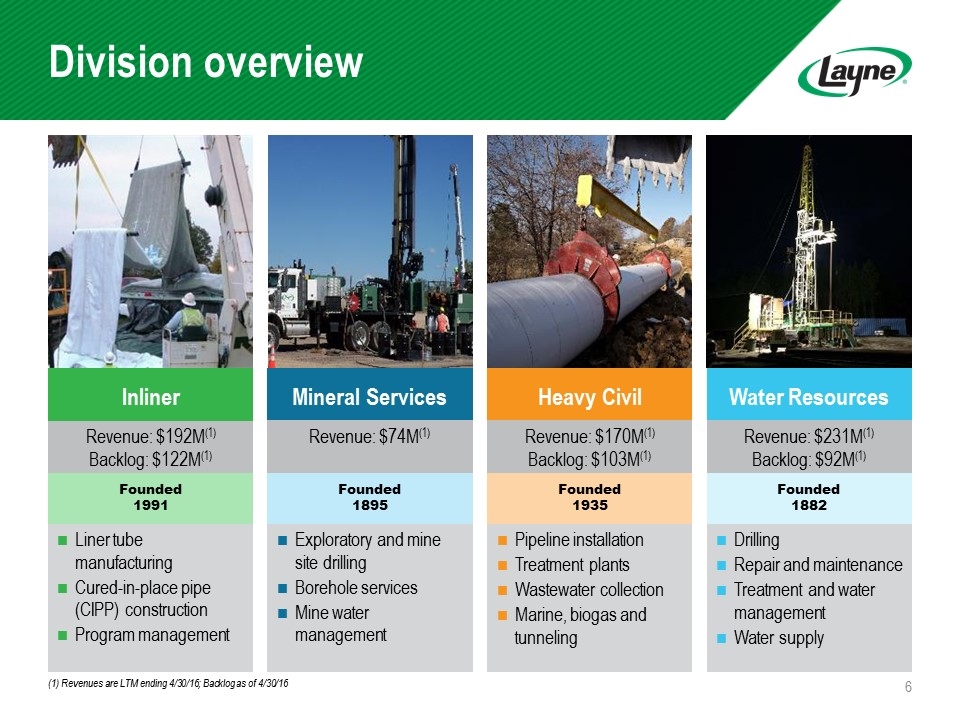
Division overview (1) Revenues are LTM ending 4/30/16; Backlog as of 4/30/16 Water Resources Revenue: $231M(1) Backlog: $92M(1) Drilling Repair and maintenance Treatment and water management Water supply Heavy Civil Revenue: $170M(1) Backlog: $103M(1) Pipeline installation Treatment plants Wastewater collection Marine, biogas and tunneling Mineral Services Revenue: $74M(1) Exploratory and mine site drilling Borehole services Mine water management Revenue: $192M(1) Backlog: $122M(1) Liner tube manufacturing Cured-in-place pipe (CIPP) construction Program management Inliner Founded 1882 Founded 1935 Founded 1895 Founded 1991
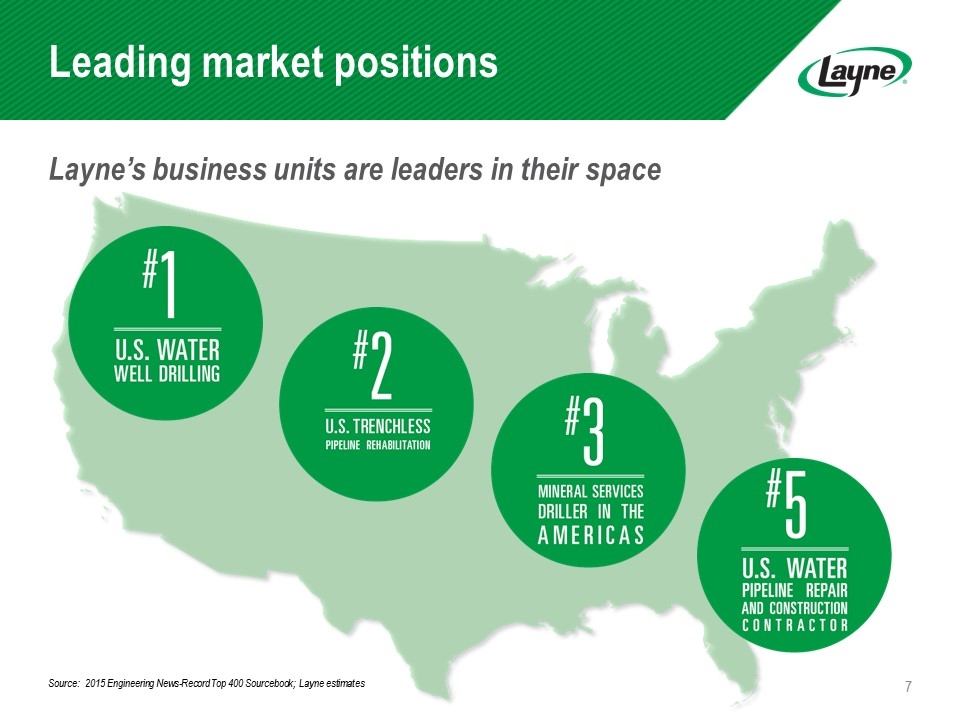
Layne’s business units are leaders in their space Leading market positions Source: 2015 Engineering News-Record Top 400 Sourcebook; Layne estimates
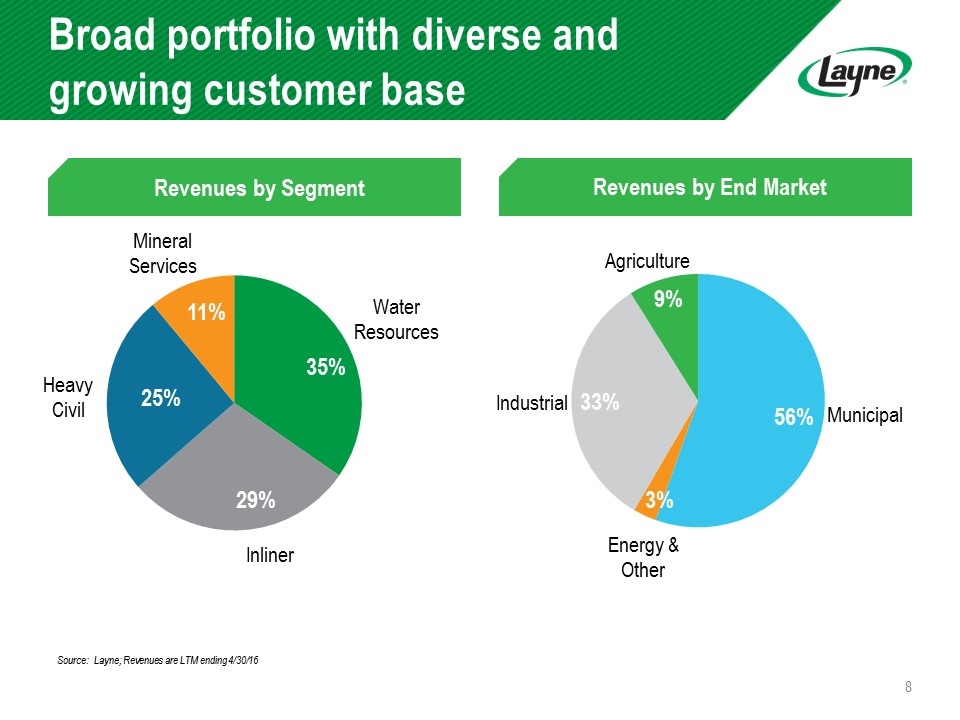
Broad portfolio with diverse and growing customer base Revenues by Segment Revenues by End Market Source: Layne; Revenues are LTM ending 4/30/16
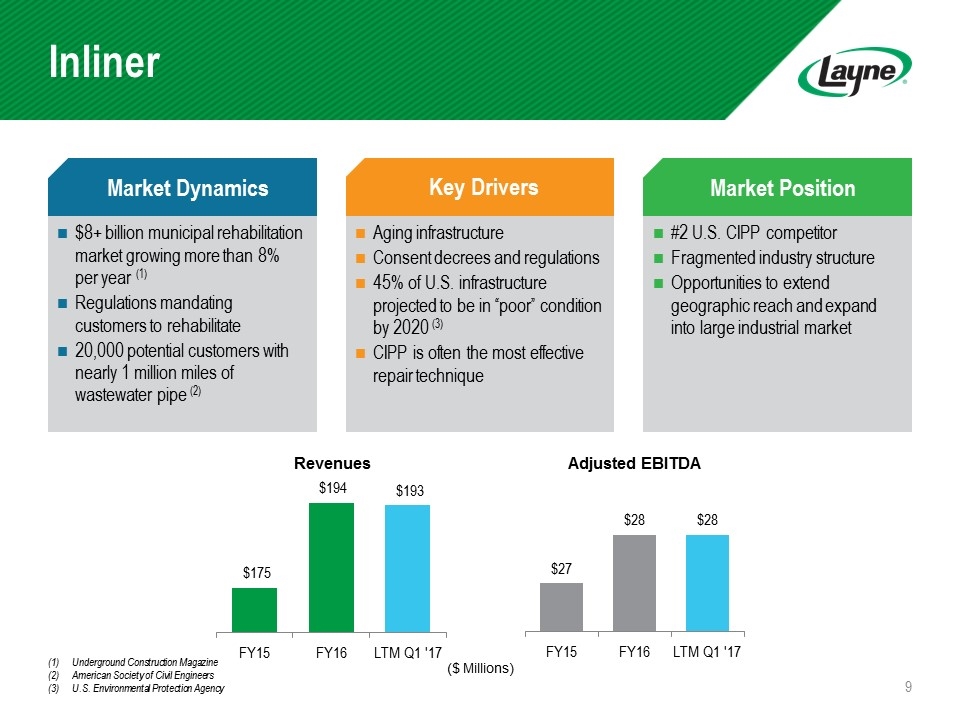
Inliner Market Dynamics $8+ billion municipal rehabilitation market growing more than 8% per year (1) Regulations mandating customers to rehabilitate 20,000 potential customers with nearly 1 million miles of wastewater pipe (2) Market Position Key Drivers #2 U.S. CIPP competitor Fragmented industry structure Opportunities to extend geographic reach and expand into large industrial market Aging infrastructure Consent decrees and regulations 45% of U.S. infrastructure projected to be in “poor” condition by 2020 (3) CIPP is often the most effective repair technique ($ Millions) Underground Construction Magazine American Society of Civil Engineers U.S. Environmental Protection Agency Adjusted EBITDA Revenues
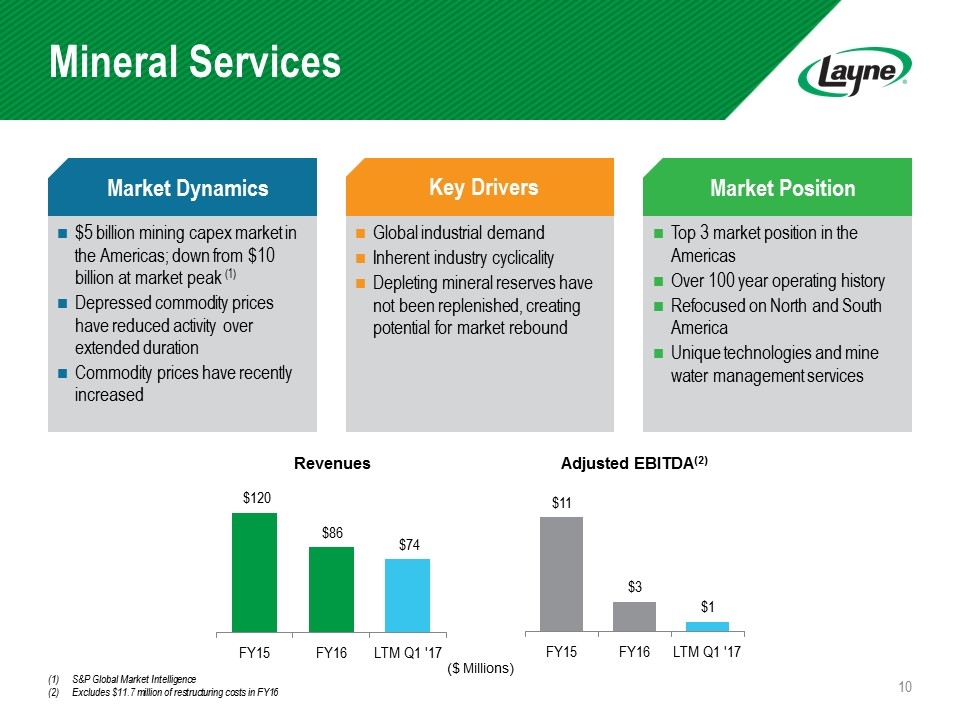
Mineral Services S&P Global Market Intelligence Excludes $11.7 million of restructuring costs in FY16 Market Dynamics $5 billion mining capex market in the Americas; down from $10 billion at market peak (1) Depressed commodity prices have reduced activity over extended duration Commodity prices have recently increased Market Position Key Drivers Top 3 market position in the Americas Over 100 year operating history Refocused on North and South America Unique technologies and mine water management services Global industrial demand Inherent industry cyclicality Depleting mineral reserves have not been replenished, creating potential for market rebound Adjusted EBITDA(2) Revenues ($ Millions)
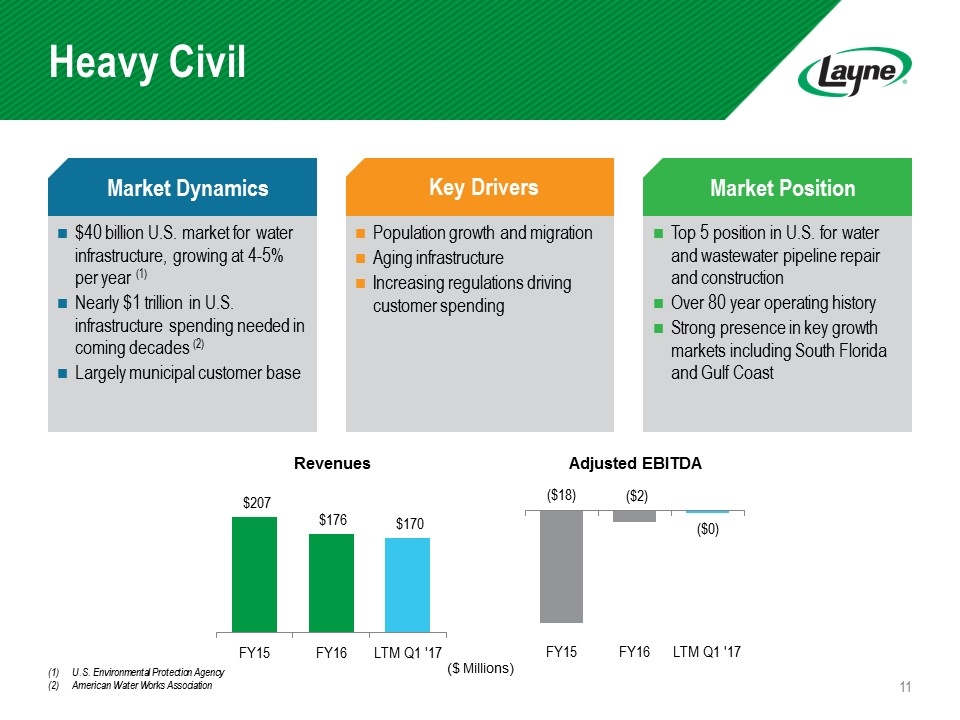
Heavy Civil Market Dynamics $40 billion U.S. market for water infrastructure, growing at 4-5% per year (1) Nearly $1 trillion in U.S. infrastructure spending needed in coming decades (2) Largely municipal customer base Market Position Key Drivers Top 5 position in U.S. for water and wastewater pipeline repair and construction Over 80 year operating history Strong presence in key growth markets including South Florida and Gulf Coast Population growth and migration Aging infrastructure Increasing regulations driving customer spending U.S. Environmental Protection Agency American Water Works Association Adjusted EBITDA Revenues ($ Millions)
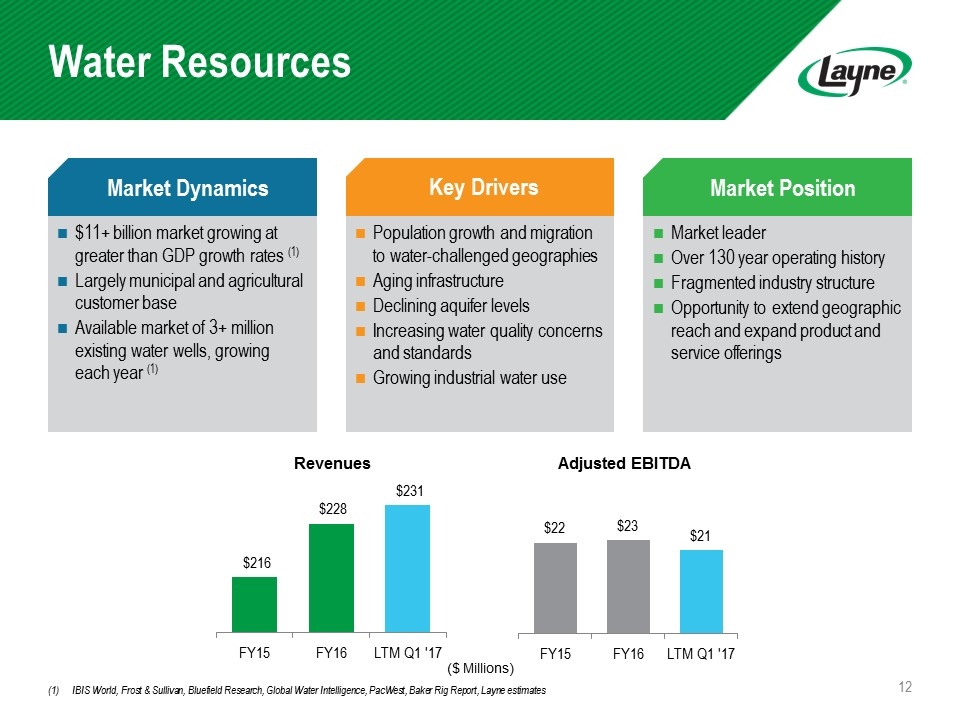
Water Resources Market Dynamics $11+ billion market growing at greater than GDP growth rates (1) Largely municipal and agricultural customer base Available market of 3+ million existing water wells, growing each year (1) Market Position Key Drivers Market leader Over 130 year operating history Fragmented industry structure Opportunity to extend geographic reach and expand product and service offerings Population growth and migration to water-challenged geographies Aging infrastructure Declining aquifer levels Increasing water quality concerns and standards Growing industrial water use IBIS World, Frost & Sullivan, Bluefield Research, Global Water Intelligence, PacWest, Baker Rig Report, Layne estimates Adjusted EBITDA Revenues ($ Millions)
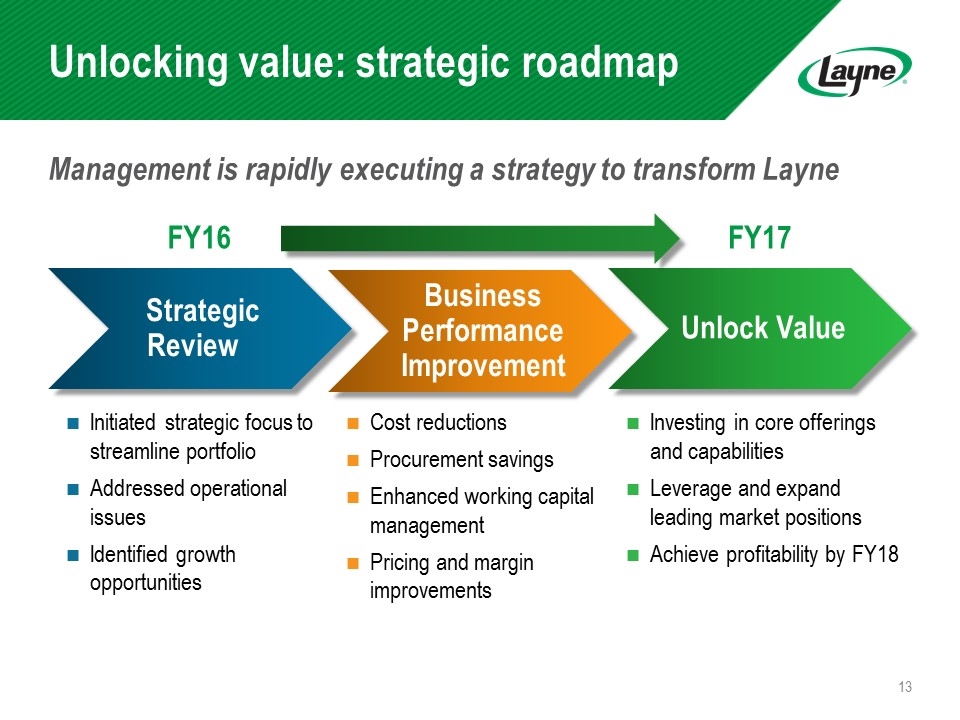
Management is rapidly executing a strategy to transform Layne Unlocking value: strategic roadmap Strategic Review Business Performance Improvement Unlock Value Initiated strategic focus to streamline portfolio Addressed operational issues Identified growth opportunities Investing in core offerings and capabilities Leverage and expand leading market positions Achieve profitability by FY18 Cost reductions Procurement savings Enhanced working capital management Pricing and margin improvements FY16 FY17
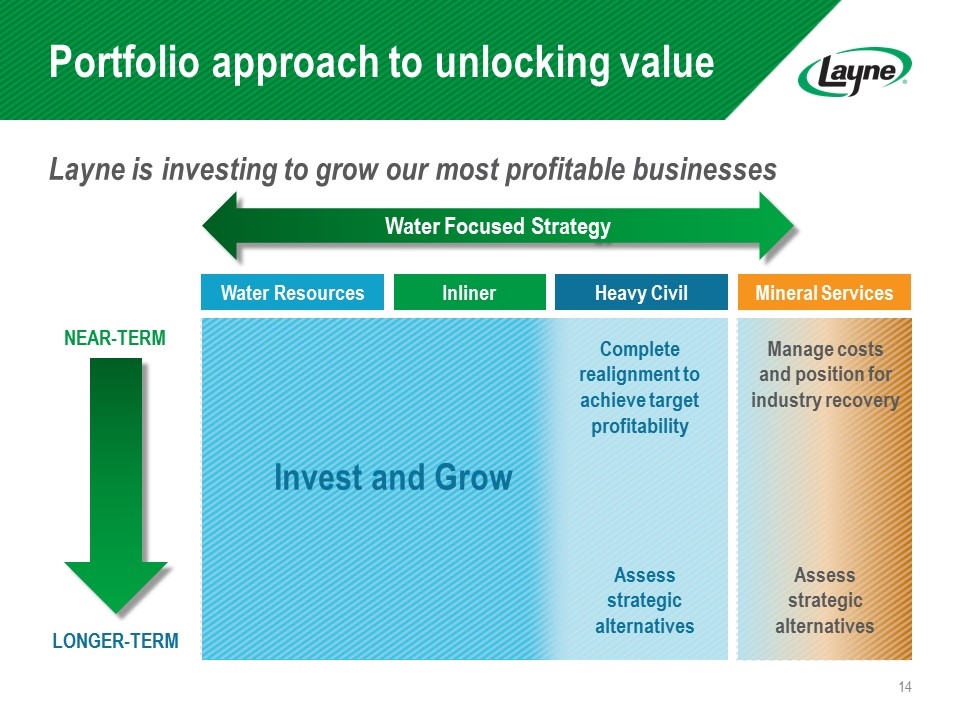
Portfolio approach to unlocking value Water Focused Strategy Water Resources Inliner Heavy Civil Mineral Services NEAR-TERM LONGER-TERM Invest and Grow Complete realignment to achieve target profitability Assess strategic alternatives Manage costs and position for industry recovery Assess strategic alternatives Layne is investing to grow our most profitable businesses
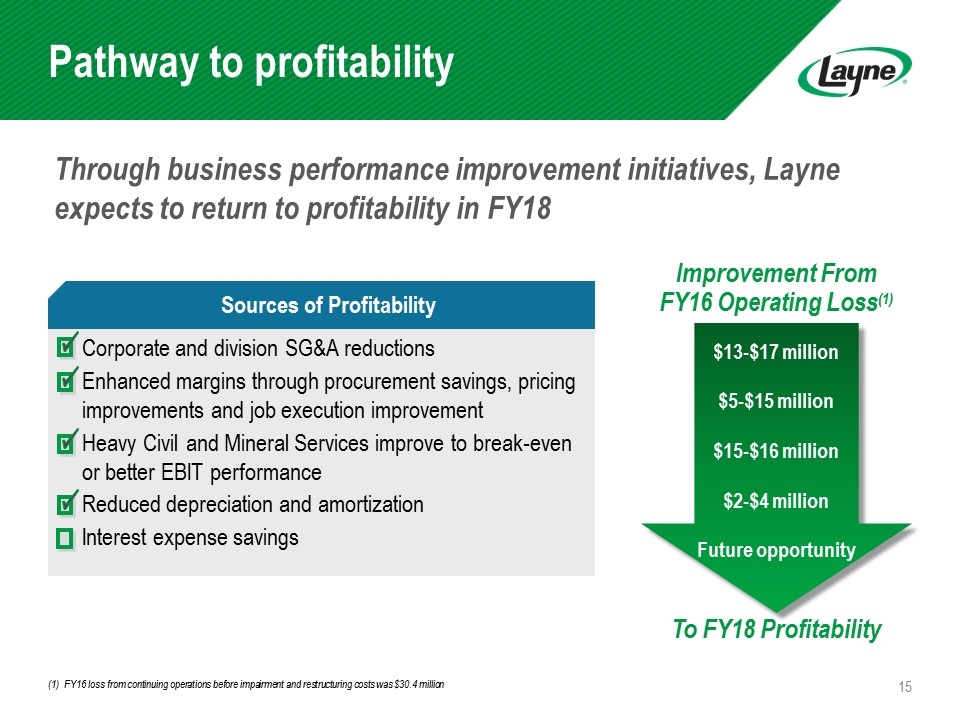
Pathway to profitability Through business performance improvement initiatives, Layne expects to return to profitability in FY18 Corporate and division SG&A reductions Enhanced margins through procurement savings, pricing improvements and job execution improvement Heavy Civil and Mineral Services improve to break-even or better EBIT performance Reduced depreciation and amortization Interest expense savings $13-$17 million $5-$15 million $15-$16 million $2-$4 million Future opportunity (1) FY16 loss from continuing operations before impairment and restructuring costs was $30.4 million Improvement From FY16 Operating Loss(1) To FY18 Profitability Sources of Profitability
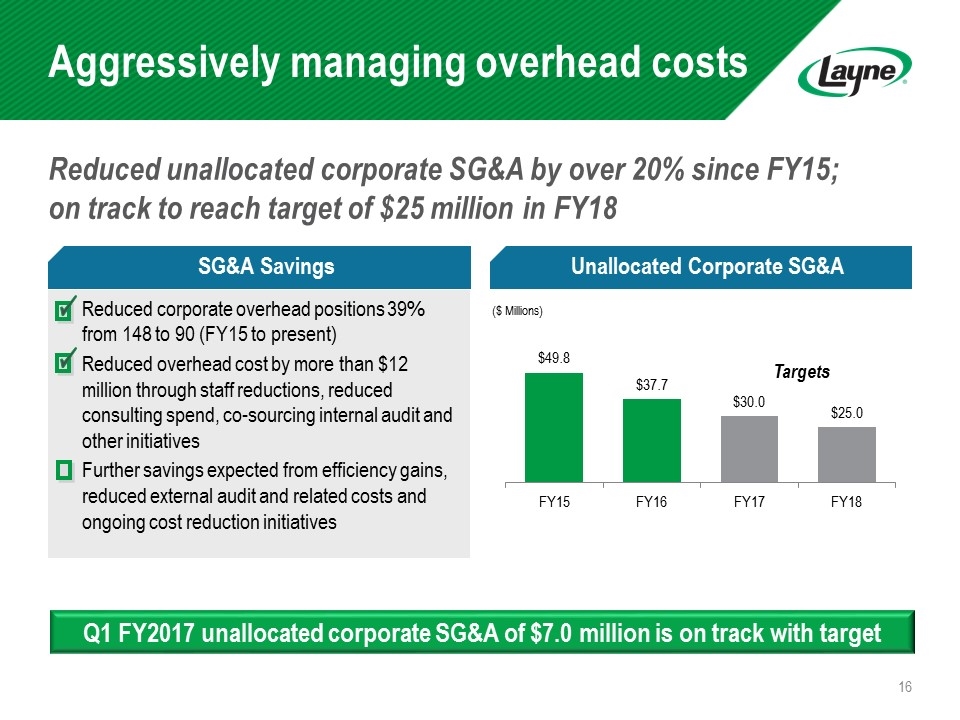
Aggressively managing overhead costs Reduced unallocated corporate SG&A by over 20% since FY15; on track to reach target of $25 million in FY18 Reduced corporate overhead positions 39% from 148 to 90 (FY15 to present) Reduced overhead cost by more than $12 million through staff reductions, reduced consulting spend, co-sourcing internal audit and other initiatives Further savings expected from efficiency gains, reduced external audit and related costs and ongoing cost reduction initiatives SG&A Savings Unallocated Corporate SG&A ($ Millions) Targets Q1 FY2017 unallocated corporate SG&A of $7.0 million is on track with target
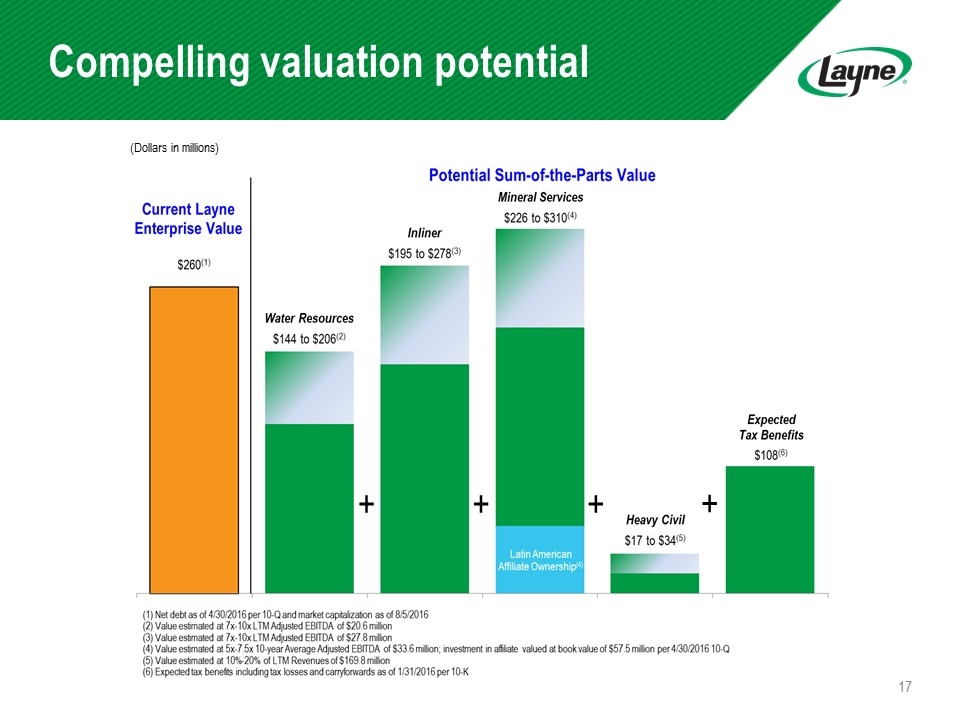
Compelling valuation potential + + + + (Dollars in millions)
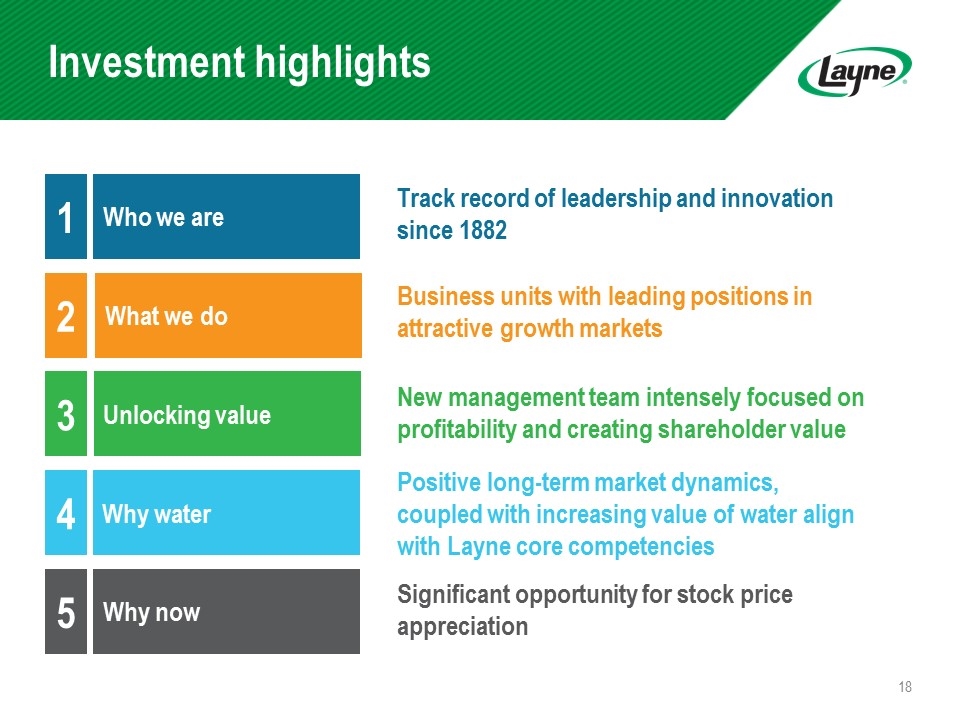
Investment highlights Why now 1 2 3 5 What we do Unlocking value Who we are 4 Why water Track record of leadership and innovation since 1882 Business units with leading positions in attractive growth markets New management team intensely focused on profitability and creating shareholder value Positive long-term market dynamics, coupled with increasing value of water align with Layne core competencies Significant opportunity for stock price appreciation
Appendix
Non-GAAP disclosure Use of Non- GAAP Financial Information We use Adjusted EBITDA to assess performance which is not defined in generally accepted accounting principles (GAAP). Adjusted EBITDA represents income or loss from continuing operations before interest, taxes, depreciation and amortization, non-cash share-based compensation, equity in earnings or losses from affiliates, certain non-recurring or extraordinary items such as impairment charges, restructuring costs, gain on extinguishment of debt, and certain other gains or losses, plus dividends received from affiliates. We believe that the presentation of Adjusted EBITDA included in this report helps us explain underlying performance trends in the business and provides useful information to both management and investors. Adjusted EBITDA should be considered in addition to results prepared in accordance with GAAP, but should not be considered a substitute for, or superior to, GAAP results. The following tables reconcile Adjusted EBITDA to income (loss) from continuing operations before income taxes, which we consider to be the most directly comparable GAAP financial measure to Adjusted EBITDA.
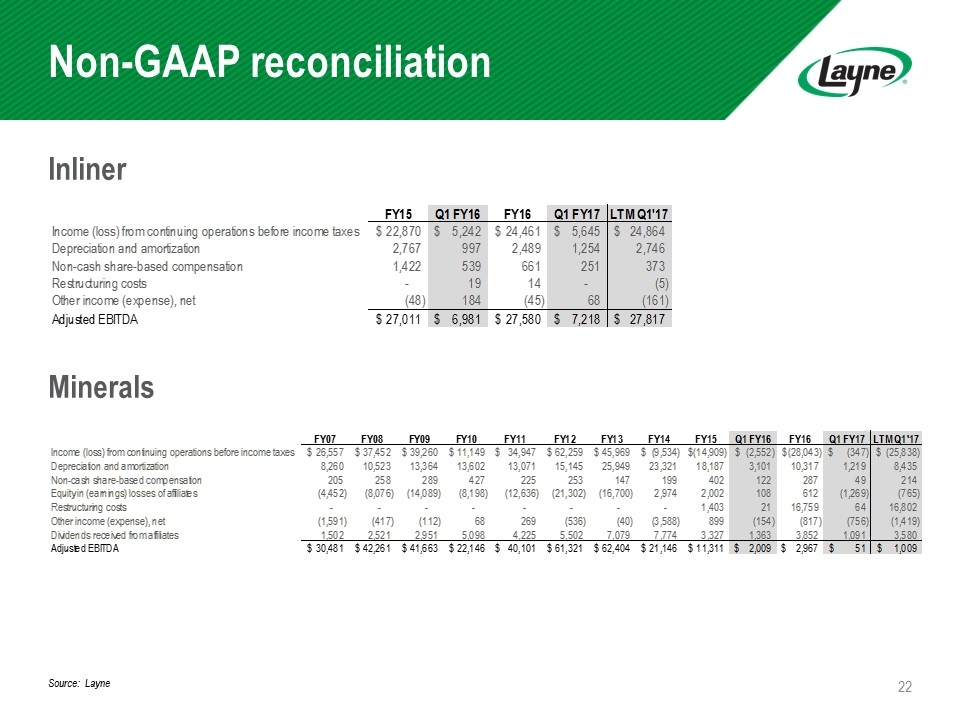
Non-GAAP reconciliation Inliner Minerals Source: Layne
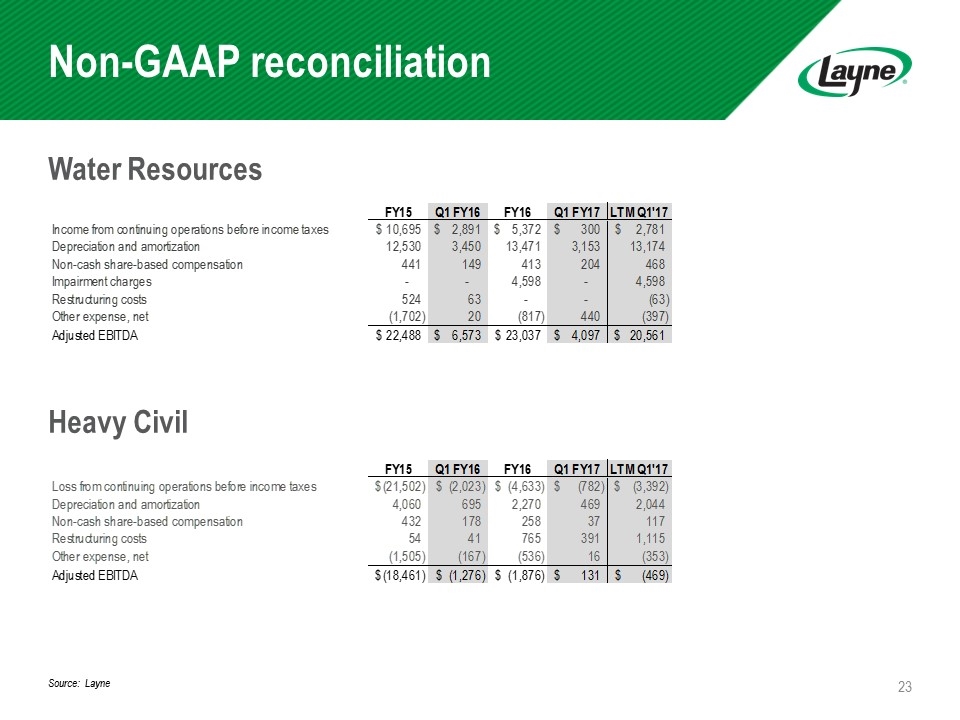
Non-GAAP reconciliation Water Resources Heavy Civil Source: Layne
