Attached files
| file | filename |
|---|---|
| 8-K - CURRENT REPORT - FAUQUIER BANKSHARES, INC. | form8kinvestorpresentation.htm |

August 2016NASDAQ: FBSS

Safe Harbor Statement Certain statements in this presentation may constitute “forward-looking statements” within the meaning of the Private Securities Litigation Reform Act of 1995. Forward-looking statements are statements that include projections, predictions, expectations, or beliefs about future events or otherwise and are not statements of historical fact. Such statements are often characterized by the use of qualified words (and their derivatives) such as “expect,” “believe,” “estimate,” “plan,” “project,” “anticipate,” “intend,” “will,” or words of similar meaning or other statements concerning opinions or judgments of the Company and its management about future events. Although the Company believes that its expectations with respect to forward-looking statements are based upon reasonable assumptions within the bounds of its existing knowledge of its business and operations, there can be no assurance that actual results, performance, or achievements of the Company will not differ materially from any future results, performance, or achievements expressed or implied by such forward-looking statements. Actual future results and trends may differ materially from historical results or those anticipated depending on a variety of factors, including, but not limited to, the effects of and changes in: general economic and bank industry conditions, the interest rate environment, legislative and regulatory requirements, competitive pressures, new projects and delivery systems, inflation, changes in the stock and bond markets, accounting standards or interpretations of existing standards, mergers and acquisitions, technology, and consumer spending and savings habits. More information is available on the Company’s website at www.tfb.bank and on the Securities and Exchange Commission’s website, www.sec.gov. The information on the Company’s website is not a part of this presentation. The Company does not intend or assume any obligation to update or revise any forward-looking statements that may be made from time to time by or on behalf of the Company. * FAUQUIER BANKSHARES, INC.

Table of Contents VisionManagementMarket OpportunitiesFinancial PerformanceBuilding Shareholder Value * FAUQUIER BANKSHARES, INC.

TFB’s Guiding Principles Vision TFB seeks Excellencethrough an Engaged and Empowered Team, building valued Relationships with our Customers and Community. FAUQUIER BANKSHARES, INC. *

Management Marc J. Bogan – President & CEONew to the company 201626 Years banking experienceChris Headly – CFO (effective 9/3/16)17 years with TFB24 years banking experienceMike York – COONew to the company 201629 years banking experienceEdna Brannan – CCO15 years with TFB36 years banking experienceChip Register – CAO8 years with TFB20 years banking experience FAUQUIER BANKSHARES, INC. *

Summary Statistics Founded 1902Headquarters Warrenton, VirginiaTotal Assets $619 millionTotal Loans, net $451 millionShares Outstanding 3,753,117Insider Ownership 4.58%Institutional Ownership 18.08% Shareholders 926All data provided as of June 30, 2016, unless otherwise noted. * FAUQUIER BANKSHARES, INC.

Northern Virginia Marketplace Strong population, economic and employment growthExceptional higher education Diverse industry employment, mostly “clean” industriesHigh median household incomeVirginia – Consistently ranked one of the top ten “Best States for Business” Forbes * FAUQUIER BANKSHARES, INC.

Deposit Market ShareFauquier and Western Prince William Counties Financial Institution Current Number ofBranches Total Deposits 2015($000) Total Deposits 2014($000) Year to Year Deposit Change 2015(%) MarketShare 2015 MarketShare2014 BB&T Corp. 15 1,045,212 1,025,824 1.89 24.21% 25.00% Fauquier Bankshares 11 516,933 523,148 -1.19 11.97% 12.75% Wells Fargo Co. 6 474,753 457,658 3.73 11.00% 11.15% SunTrust Bank 7 440,289 424,282 3.77 10.20% 10.34% Capital One Financial Corp 8 317,590 259,626 22.33 7.36% 6.33% Bank of America 5 295,925 271,696 8.92 6.86% 6.62% Cardinal Bank 2 208,010 121,486 71.22 4.82% 2.96% PNC Financial Services Group 6 156,760 145,015 8.10 3.63% 3.53% Oak View National Bank 2 133,941 123,398 8.54 3.10% 3.01% First Virginia Community Bank 1 133,920 96,501 38.78 3.10% 2.35% Other 12 Institutions 21 593,507 655,211 -9.42 13.75% 15.96% Total 84 4,316,840 4,103,845 5.19 100% 100% FAUQUIER BANKSHARES, INC. * Source: FDIC – Deposit Market Share Report Data as of June 30, 2015.
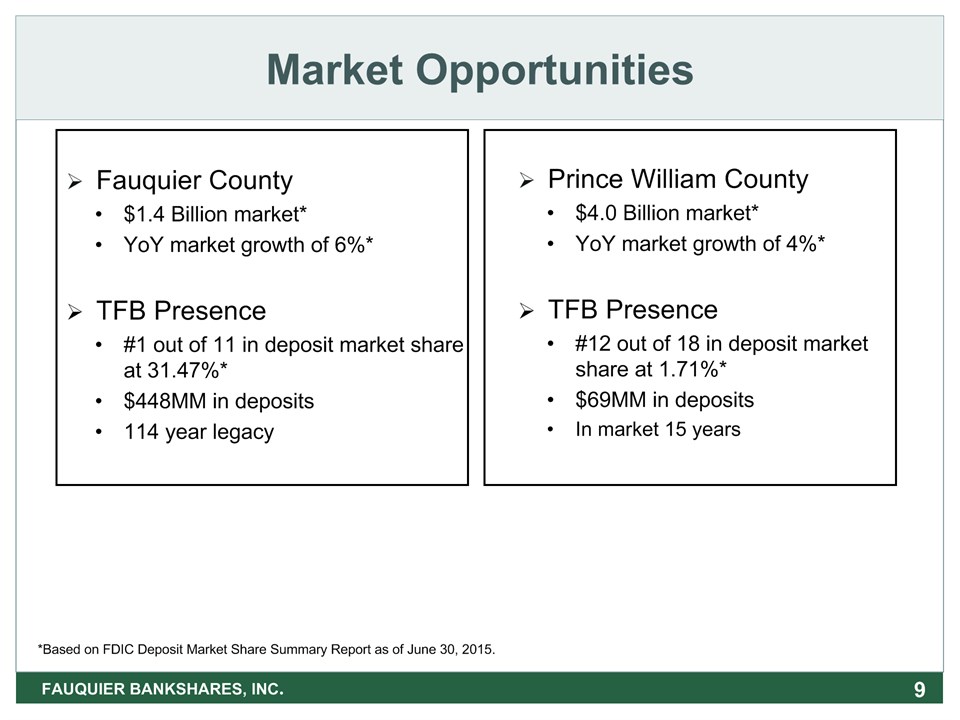
Market Opportunities * Fauquier County$1.4 Billion market*YoY market growth of 6%*TFB Presence#1 out of 11 in deposit market share at 31.47%*$448MM in deposits114 year legacy Prince William County$4.0 Billion market*YoY market growth of 4%*TFB Presence#12 out of 18 in deposit market share at 1.71%*$69MM in depositsIn market 15 years *Based on FDIC Deposit Market Share Summary Report as of June 30, 2015. FAUQUIER BANKSHARES, INC.

Sustainable Growth Demographics * FAUQUIER BANKSHARES, INC. Market National Ranking by Median HH Income 2016 TotalPopulation2016(actual) PopulationChange2010 - 2016(%) ProjectedChange2016-2021(%) Unemployment Rate 2015 (%) TotalHouseholds2016(actual) MedianHH Income2016($) Projected HHIncome Change2016- 2021(%) Per Capita Income2016($) City of Falls Church 1 13,936 13.01 8.19 2.7 5,672 121,854 1.86 64,376 Loudoun County 2 379,575 21.54 10.63 3.2 123,011 118,545 1.37 48,868 Fairfax County 4 1,144,095 5.77 4.83 3.2 413,833 112,427 3.33 54,128 Arlington County 6 232,696 12.07 7.68 2.4 111,149 109,708 7.19 72,028 City of Fairfax 10 25,236 11.84 7.65 3.0 9,316 102,784 4.95 50,650 Prince William County 19 454,950 13.17 8.12 3.5 146,030 96,644 1.84 39,091 City of Alexandria 28 155,545 11.13 7.3 2.6 75,942 90,054 5.32 60,285 Fauquier County 32 69,061 5.92 4.85 3.4 25,108 88,533 3.97 41,204 Source: SNL Financial. Note: All data is as of June 30, 2016, except unemployment rate..

Q2 and YTD Highlights * For the Quarter Ended June 30, 2016 For the Six Month Period Ended June 30, 2016 Return on average assets 1.02% 0.72% Return on average equity 11.73% 8.17% Efficiency ratio 82.75% 83.71% Since December 31, 2015 ($million) Since June 30, 2015 ($million) Asset growth 17.8 21.4 Loan growth, net 8.4 3.8 Deposit growth 16.1 24.2 FAUQUIER BANKSHARES, INC.
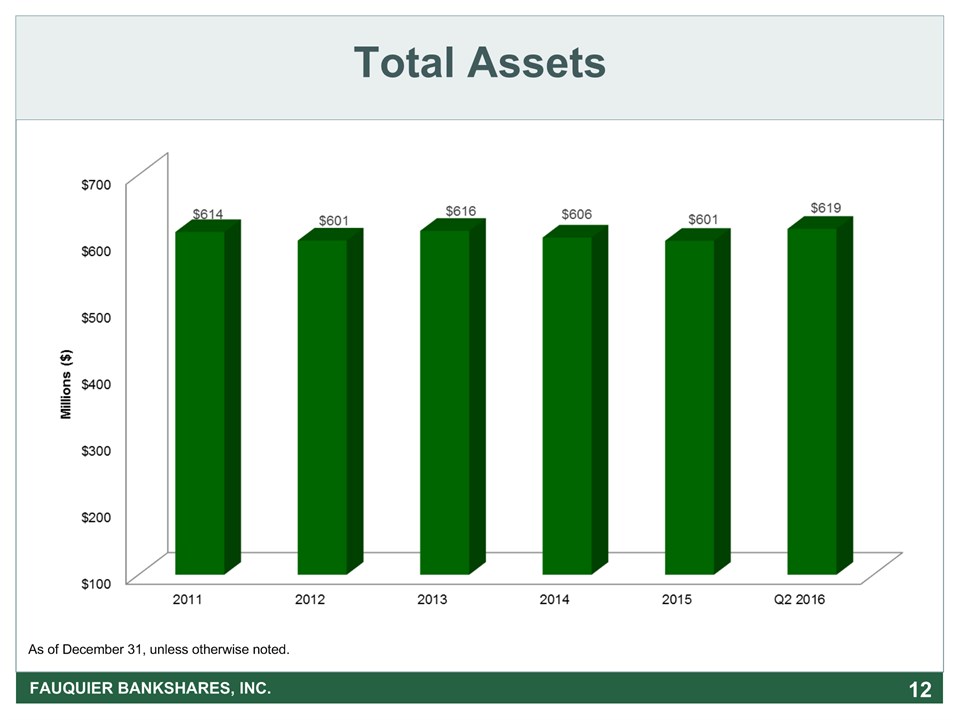
* Total Assets FAUQUIER BANKSHARES, INC. As of December 31, unless otherwise noted.

Return on Average Equity (ROAE) FAUQUIER BANKSHARES, INC. * National Peer Group consists of 441 Bank Holding Companies and Commercial Banks with Consolidated Assets of $500MM - $1B. (Source: SNL)Averages used for National Peer Group. As of December 31, unless otherwise noted..

* Return on Average Assets (ROAA) FAUQUIER BANKSHARES, INC. National Peer Group consists of 441 Bank Holding Companies and Commercial Banks with Consolidated Assets of $500MM - $1B. (Source: SNL)Averages used for National Peer Group. As of December 31, unless otherwise noted..

* Loans, Net FAUQUIER BANKSHARES, INC. As of December 31, unless otherwise noted.

* Loan Portfolio Loan Portfolio At June 30, 2016 FAUQUIER BANKSHARES, INC. Source: Fauquier Bankshares Financials *Includes $14MM in U.S. Government Guaranteed Student Loans** Includes Multi-Family Residential Mortgages

* Nonperforming Loans to Period End Loans Nonperforming Loans to Period End Loans National Peer Group consists of 441 Bank Holding Companies and Commercial Banks with Consolidated Assets of $500MM - $1B. (Source: SNL)Averages used for National Peer Group. As of December 31, unless otherwise noted..

* Total Deposits FAUQUIER BANKSHARES, INC. As of December 31, unless otherwise noted.

Core Deposit Portfolio* FAUQUIER BANKSHARES, INC. * Average Daily Balances as of December 31, unless otherwise noted. CAGR – December 31, 2010 to June 30, 2016.*Excludes Time Deposits. CAGR 8.08%

Deposit PortfolioAt June 30, 2016 FAUQUIER BANKSHARES, INC. CDARS are large-dollar investments of local depositors in FDIC insured CDs.Brokered CDs are used to offset interest rate risk. *
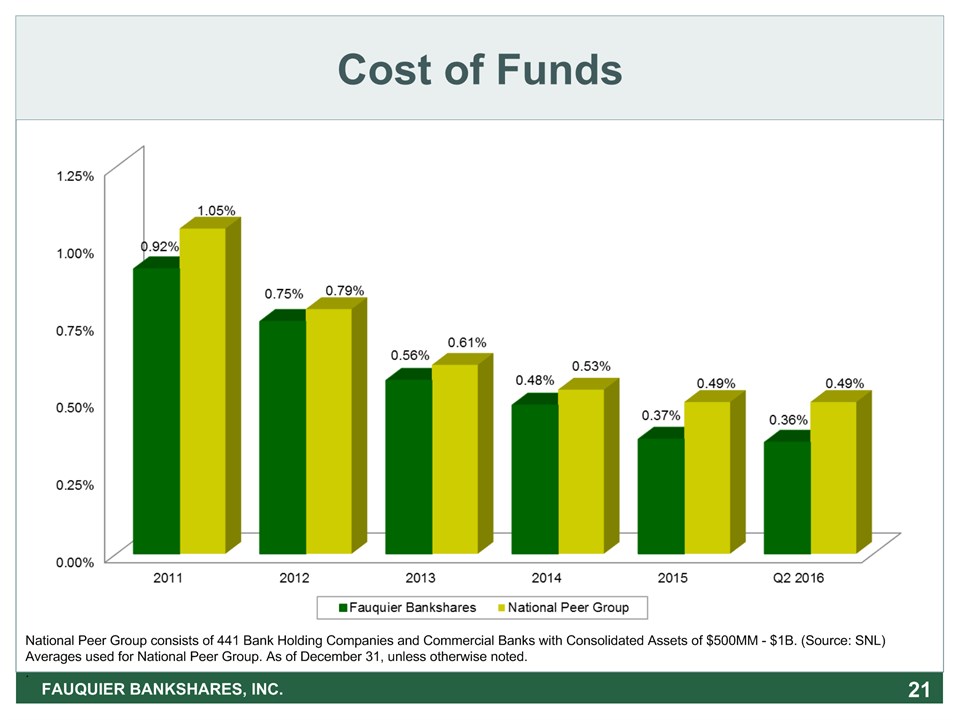
Cost of Funds * FAUQUIER BANKSHARES, INC. National Peer Group consists of 441 Bank Holding Companies and Commercial Banks with Consolidated Assets of $500MM - $1B. (Source: SNL)Averages used for National Peer Group. As of December 31, unless otherwise noted..

Net Interest Margin* * FAUQUIER BANKSHARES, INC. *Net interest income on a taxable equivalent basis divided by average earning assets.National Peer Group consists of 441 Bank Holding Companies and Commercial Banks with Consolidated Assets of $500MM - $1B. (Source: SNL)Averages used for National Peer Group. As of December 31, unless otherwise noted..

* FAUQUIER BANKSHARES, INC. Tangible Equity to Assets Ratio As of December 31, unless otherwise noted.

Total Non-Interest IncomeAs a Percent of Average Assets FAUQUIER BANKSHARES, INC. * National Peer Group consists of 441 Bank Holding Companies and Commercial Banks with Consolidated Assets of $500MM - $1B. (Source: SNL)Averages used for National Peer Group. As of December 31, unless otherwise noted..

Total Non-Interest ExpenseAs a Percent of Average Assets FAUQUIER BANKSHARES, INC. * National Peer Group consists of 441 Bank Holding Companies and Commercial Banks with Consolidated Assets of $500MM - $1B. (Source: SNL)Averages used for National Peer Group. As of December 31, unless otherwise noted..

Regulatory Capital Ratios(Bank Only) FAUQUIER BANKSHARES, INC. * June 30, 2016 December 31, 2015 Leverage Ratio 9.19% 9.13% Common Equity Tier 1 Capital Ratio 11.89% 11.64% Tier 1 Capital Ratio 11.89% 11.64% Total Capital Ratio 12.86% 12.53% Well Capitalized Threshold 5.00% 6.00% 6.00% 10.00%

* Stock Total Return Performance(December 1999 – August 8, 2016) FAUQUIER BANKSHARES, INC. Source: SNL Financial – As of August 8, 2016

Building Shareholder Value * FAUQUIER BANKSHARES, INC. Loan growth Disciplined loan and deposit pricing Non-interest fee incomeWealth management and financial planningLeverage technologyExpense management

Contact Information Investor Relations ContactsMarc J. BoganPresident & Chief Executive Officermarc.bogan@tfb.bankChristine HeadlyExecutive Vice President& Chief Financial Officerchris.headly@tfb.bankDanielle JenkinsShareholder Relations Specialistdanielle.jenkins@tfb.bankwww.tfb.bank FAUQUIER BANKSHARES, INC. *