Attached files
| file | filename |
|---|---|
| EX-32.2 - EXHIBIT 32.2 - RITCHIE BROS AUCTIONEERS INC | v446035_ex32-2.htm |
| EX-32.1 - EXHIBIT 32.1 - RITCHIE BROS AUCTIONEERS INC | v446035_ex32-1.htm |
| EX-31.2 - EXHIBIT 31.2 - RITCHIE BROS AUCTIONEERS INC | v446035_ex31-2.htm |
| EX-31.1 - EXHIBIT 31.1 - RITCHIE BROS AUCTIONEERS INC | v446035_ex31-1.htm |
| EX-10.1 - EXHIBIT 10.1 - RITCHIE BROS AUCTIONEERS INC | v446035_ex10-1.htm |
UNITED STATES
SECURITIES AND EXCHANGE COMMISSION
Washington, D.C. 20549
FORM 10-Q
| x | QUARTERLY REPORT PURSUANT TO SECTION 13 OR 15(d) OF THE SECURITIES EXCHANGE ACT OF 1934 | |
| For the quarterly period ended June 30, 2016 | ||
| OR | ||
| ¨ | TRANSITION REPORT PURSUANT TO SECTION 13 OR 15(d) OF THE SECURITIES EXCHANGE ACT OF 1934 | |
| For the transition period from ______ to ______ | ||
Commission file number: 001-13425

| Ritchie Bros. Auctioneers Incorporated |
(Exact Name of Registrant as Specified in its Charter)
| Canada | N/A | |
| (State or other jurisdiction of incorporation or organization) | (I.R.S. Employer Identification No.) | |
| 9500 Glenlyon Parkway | ||
| Burnaby, British Columbia, Canada | V5J 0C6 | |
| (Address of Principal Executive Offices) | (Zip Code) |
(778) 331-5500
(Registrant’s Telephone Number, including Area Code)
Indicate by checkmark whether the registrant (1) filed all reports required to be filed by Section 13 or 15(d) of the Securities Exchange Act of 1934 during the preceding 12 months (or for such shorter period that the registrant was required to file such reports), and (2) has been subject to such filing requirements for the past 90 days. Yes x No ¨
Indicate by check mark whether the Registrant has submitted electronically and posted on its corporate Web site, if any, every Interactive Data File required to be submitted and posted pursuant to Rule 405 of Regulation S-T (§ 229.405 of this chapter) during the preceding 12 months (or for such shorter period that the registrant was required to submit and post such files). Yes x No ¨
Indicate by check mark whether the registrant is a large accelerated filer, an accelerated filer, or a non-accelerated filer. See definition of “Accelerated filer and large accelerated filer” in Rule 12b-2 of the Exchange Act (Check one):
Large Accelerated Filer x Accelerated Filer ¨ Non-Accelerated Filer ¨ Smaller Reporting Company ¨
Indicate by check mark whether the registrant is a shell company (as defined in Rule 12b-2 of the Exchange Act):
Yes ¨ No x
Indicate the number of shares outstanding of each of the issuer’s classes of common stock, as of the latest practical date: 106,624,829 common shares, without par value, outstanding as of August 5, 2016.
RITCHIE BROS. AUCTIONEERS INCORPORATED
FORM 10-Q
For the quarter ended June 30, 2016
INDEX
Cautionary Note Regarding Forward-Looking Statements
The information discussed in this Form 10-Q of Ritchie Bros. Auctioneers Incorporated (“Ritchie Bros.”, the “Company”, “we” or “us”) includes “forward-looking statements” within the meaning of Section 27A of the Securities Act of 1933 (the “Securities Act”) and Section 21E of the Securities Exchange Act of 1934 (the “Exchange Act”) and Canadian securities laws. These statements are based on our current expectations and estimates about our business and markets, and include, among others, statements relating to:
| · | our future strategy, objectives, targets, projections, and performance; |
| · | our ability to drive shareholder value; |
| · | market opportunities; |
| · | our internet initiatives and the level of participation in our auctions by internet bidders, and the success of EquipmentOne and our other online marketplaces; |
| · | our ability to grow our core auction business, including our ability to increase our market share among traditional customer groups, including those in the used equipment market, and do more business with new customer groups in new sectors; |
| · | the impact of our new initiatives, services, investments, and acquisitions on us and our customers; |
| · | our ability to integrate our acquisitions; |
| · | potential future acquisitions; |
| · | our ability to add new business and information solutions, including, among others, our ability to maximize and integrate technology to enhance our existing services and support additional value-added service offerings; |
| · | the effect of Original Equipment Manufacturer production on our Gross Auction Proceeds (“GAP”)1; |
| · | the supply trend of equipment in the market and the anticipated price environment for late model equipment, as well as the resulting effect on our business and GAP; |
| · | the growth potential of Ritchie Bros. Financial Services, as well as expectations towards and significance of its service offerings and geographical expansion in the near future; |
| · | fluctuations in our quarterly revenues and operating performance resulting from the seasonality of our business; |
| · | our ability to grow our sales force, minimize turnover, and improve Sales Force Productivity (as described below); |
| · | our ability to implement new performance measurement metrics to gauge our effectiveness and progress; |
| · | the relative percentage of GAP represented by straight commission or underwritten (guarantee and inventory) contracts, and its impact on revenues and profitability; |
| · | our Revenue Rates (as described below), the sustainability of those rates, the impact of our commission rate and fee changes, and the seasonality of GAP and revenues; |
| · | our future capital expenditures and returns on those expenditures; |
| · | the proportion of our revenues, operating expenses, and operating income denominated in currencies other than the United States (“U.S.”) dollar or the effect of any currency exchange and interest rate fluctuations on our results of operations; |
| · | financing available to us, our ability to refinance borrowings, and the sufficiency of our working capital to meet our financial needs; and |
| · | our ability to satisfy our present operating requirements and fund future growth through existing working capital and credit facilities. |
| 1 | GAP represents the total proceeds from all items sold at our auctions and online marketplaces. It is a measure of operational performance and not a measure of financial performance, liquidity, or revenue. It is not presented in our consolidated financial statements. |
| Ritchie Bros. | 1 |
Forward-looking statements are typically identified by such words as “anticipate”, “believe”, “could”, “continue”, “estimate”, “expect”, “intend”, “may”, “ongoing”, “plan”, “potential”, “predict”, “will”, “should”, “would”, “could”, “likely”, “generally”, “future”, “period to period”, “long-term”, or the negative of these terms, and similar expressions intended to identify forward-looking statements. Our forward-looking statements are not guarantees of future performance and involve risks, uncertainties and assumptions that are difficult to predict.
While we have not described all potential risks related to our business and owning our common shares, the important factors discussed in “Part 1, Item 1A: Risk Factors” of our Annual Report on Form 10-K for the year ended December 31, 2015, which is available on our website at www.rbauction.com, on EDGAR at www.sec.gov, or on SEDAR at www.sedar.com, are among those that we consider may affect our performance materially or could cause our actual financial and operational results to differ significantly from our expectations. Except as required by applicable securities law and regulations of relevant securities exchanges, we do not intend to update publicly any forward-looking statements, even if our expectations have been affected by new information, future events or other developments. You should consider our forward-looking statements in light of the factors listed or referenced under “Risk Factors” herein and other relevant factors.
| Ritchie Bros. | 2 |
ITEM 1: CONDENSED CONSOLIDATED FINANCIAL STATEMENTS
Condensed Consolidated Income Statements
(Expressed in thousands of United States dollars, except where noted)
(Unaudited)
| Three months ended | Six months ended | |||||||||||||||
| June 30, | June 30, | |||||||||||||||
| 2016 | 2015 | 2016 | 2015 | |||||||||||||
| Revenues (note 6) | $ | 158,805 | $ | 155,477 | $ | 290,750 | $ | 271,095 | ||||||||
| Costs of services, excluding depreciation and amortization (note 7) | 19,758 | 17,027 | 35,071 | 28,636 | ||||||||||||
| 139,047 | 138,450 | 255,679 | 242,459 | |||||||||||||
| Selling, general and administrative expenses (note 7) | 74,595 | 65,239 | 142,902 | 128,995 | ||||||||||||
| Depreciation and amortization expenses (note 7) | 10,284 | 10,769 | 20,364 | 21,385 | ||||||||||||
| Gain on disposition of property, plant and equipment | (201 | ) | (791 | ) | (447 | ) | (966 | ) | ||||||||
| Foreign exchange loss (gain) | 734 | 438 | 51 | (2,769 | ) | |||||||||||
| Operating income | 53,635 | 62,795 | 92,809 | 95,814 | ||||||||||||
| Other income (expense): | ||||||||||||||||
| Interest income | 487 | 680 | 985 | 1,527 | ||||||||||||
| Interest expense | (1,060 | ) | (1,308 | ) | (2,423 | ) | (2,577 | ) | ||||||||
| Equity income (note 18) | 477 | 173 | 996 | 406 | ||||||||||||
| Other, net | 269 | 918 | 967 | 1,631 | ||||||||||||
| 173 | 463 | 525 | 987 | |||||||||||||
| Income before income taxes | 53,808 | 63,258 | 93,334 | 96,801 | ||||||||||||
| Income tax expense (recovery) (note 8): | ||||||||||||||||
| Current | 16,106 | 19,365 | 26,115 | 30,078 | ||||||||||||
| Deferred | (2,889 | ) | (1,953 | ) | (3,366 | ) | (3,233 | ) | ||||||||
| 13,217 | 17,412 | 22,749 | 26,845 | |||||||||||||
| Net income | $ | 40,591 | $ | 45,846 | $ | 70,585 | $ | 69,956 | ||||||||
| Net income attributable to: | ||||||||||||||||
| Stockholders | $ | 39,710 | $ | 45,083 | $ | 69,116 | $ | 68,860 | ||||||||
| Non-controlling interests | 881 | 763 | 1,469 | 1,096 | ||||||||||||
| $ | 40,591 | $ | 45,846 | $ | 70,585 | $ | 69,956 | |||||||||
| Earnings per share attributable to stockholders (note 10): | ||||||||||||||||
| Basic | $ | 0.37 | $ | 0.42 | $ | 0.65 | $ | 0.64 | ||||||||
| Diluted | $ | 0.37 | $ | 0.42 | $ | 0.65 | $ | 0.64 | ||||||||
| Weighted average number of shares outstanding (note 10): | ||||||||||||||||
| Basic | 106,245,307 | 106,506,916 | 106,581,294 | 106,993,228 | ||||||||||||
| Diluted | 106,979,810 | 106,978,061 | 107,069,410 | 107,390,303 | ||||||||||||
See accompanying notes to the condensed consolidated financial statements.
| Ritchie Bros. | 3 |
Condensed Consolidated Statements of Comprehensive Income
(Expressed in thousands of United States dollars)
(Unaudited)
| Three months ended | Six months ended | |||||||||||||||
| June 30, | June 30, | |||||||||||||||
| 2016 | 2015 | 2016 | 2015 | |||||||||||||
| Net income | $ | 40,591 | $ | 45,846 | $ | 70,585 | $ | 69,956 | ||||||||
| Other comprehensive income (loss), net of income tax: | ||||||||||||||||
| Foreign currency translation adjustment | (4,795 | ) | 5,212 | 7,400 | (23,086 | ) | ||||||||||
| Total comprehensive income | $ | 35,796 | $ | 51,058 | $ | 77,985 | $ | 46,870 | ||||||||
| Total comprehensive income attributable to: | ||||||||||||||||
| Stockholders | 34,914 | 50,295 | 76,348 | 45,960 | ||||||||||||
| Non-controlling interests | 882 | 763 | 1,637 | 910 | ||||||||||||
| $ | 35,796 | $ | 51,058 | $ | 77,985 | $ | 46,870 | |||||||||
See accompanying notes to the condensed consolidated financial statements.
| Ritchie Bros. | 4 |
Condensed Consolidated Balance Sheets
(Expressed in thousands of United States dollars, except share data)
(Unaudited)
| June 30, | December 31, | |||||||
| 2016 | 2015 | |||||||
| Assets | ||||||||
| Current assets: | ||||||||
| Cash and cash equivalents | $ | 166,501 | $ | 210,148 | ||||
| Restricted cash | 196,171 | 83,098 | ||||||
| Trade and other receivables | 131,183 | 59,412 | ||||||
| Inventory (note 13) | 74,164 | 58,463 | ||||||
| Advances against auction contracts | 1,877 | 4,797 | ||||||
| Prepaid expenses and deposits | 14,444 | 11,057 | ||||||
| Assets held for sale (note 14) | 632 | 629 | ||||||
| Income taxes receivable | 7,340 | 2,495 | ||||||
| 592,312 | 430,099 | |||||||
| Property, plant and equipment (note 15) | 529,329 | 528,591 | ||||||
| Equity-accounted investments (note 18) | 7,491 | 6,487 | ||||||
| Other non-current assets | 3,507 | 3,369 | ||||||
| Intangible assets (note 16) | 65,862 | 46,973 | ||||||
| Goodwill (note 17) | 111,576 | 91,234 | ||||||
| Deferred tax assets | 15,343 | 13,362 | ||||||
| $ | 1,325,420 | $ | 1,120,115 | |||||
| Liabilities and Equity | ||||||||
| Current liabilities: | ||||||||
| Auction proceeds payable | $ | 275,293 | $ | 101,215 | ||||
| Trade and other payables | 114,754 | 120,042 | ||||||
| Income taxes payable | 4,095 | 13,011 | ||||||
| Short-term debt (note 19) | 22,437 | 12,350 | ||||||
| Current portion of long-term debt (note 19) | - | 43,348 | ||||||
| 416,579 | 289,966 | |||||||
| Long-term debt (note 19) | 102,728 | 54,567 | ||||||
| Share unit liabilities | 3,225 | 5,633 | ||||||
| Other non-current liabilities | 9,325 | 6,735 | ||||||
| Deferred tax liabilities | 33,030 | 31,070 | ||||||
| 564,887 | 387,971 | |||||||
| Contingencies (note 22) | ||||||||
| Contingently redeemable: | ||||||||
| Non-controlling interest (note 9) | 44,141 | 24,785 | ||||||
| Performance share units (note 21) | 2,661 | - | ||||||
| Stockholders' equity (note 20): | ||||||||
| Share capital: | ||||||||
| Common stock; no par value, unlimited shares authorized, issued and outstanding shares: 106,547,039 (December 31, 2015: 107,200,470) | 117,554 | 131,530 | ||||||
| Additional paid-in capital | 25,691 | 27,728 | ||||||
| Retained earnings | 615,672 | 601,051 | ||||||
| Accumulated other comprehensive income | (49,901 | ) | (57,133 | ) | ||||
| Stockholders' equity | 709,016 | 703,176 | ||||||
| Non-controlling interest | 4,715 | 4,183 | ||||||
| 713,731 | 707,359 | |||||||
| $ | 1,325,420 | $ | 1,120,115 | |||||
See accompanying notes to the condensed consolidated financial statements.
| Ritchie Bros. | 5 |
Condensed Consolidated Statements of Changes in Equity
(Expressed in thousands of United States dollars, except where noted)
(Unaudited)
| Attributable to stockholders | Contingently redeemable | |||||||||||||||||||||||||||||||||||
| Additional | Accumulated | Non- | Non- | Performance | ||||||||||||||||||||||||||||||||
| Common stock | paid-In | other | controlling | controlling | share | |||||||||||||||||||||||||||||||
| Number of | capital | Retained | comprehensive | interest | Total | interest | units | |||||||||||||||||||||||||||||
| shares | Amount | ("APIC") | earnings | income (loss) | ("NCI") | equity | ("NCI") | ("PSUs") | ||||||||||||||||||||||||||||
| Balance, December 31, 2015 | 107,200,470 | $ | 131,530 | $ | 27,728 | $ | 601,051 | $ | (57,133 | ) | $ | 4,183 | $ | 707,359 | $ | 24,785 | $ | - | ||||||||||||||||||
| Net income | - | - | - | 69,116 | - | 236 | 69,352 | 1,233 | - | |||||||||||||||||||||||||||
| Other comprehensive income (loss) | - | - | - | - | 7,232 | (2 | ) | 7,230 | 170 | - | ||||||||||||||||||||||||||
| - | - | - | 69,116 | 7,232 | 234 | 76,582 | 1,403 | - | ||||||||||||||||||||||||||||
| Change in value of contingently redeemable NCI | - | - | - | (20,249 | ) | - | - | (20,249 | ) | 20,249 | - | |||||||||||||||||||||||||
| Stock option exercises | 806,569 | 22,750 | (4,693 | ) | - | - | - | 18,057 | - | - | ||||||||||||||||||||||||||
| Stock option tax adjustment | - | - | 186 | - | - | - | 186 | - | - | |||||||||||||||||||||||||||
| Stock option compensation expense (note 21) | - | - | 2,470 | - | - | - | 2,470 | - | - | |||||||||||||||||||||||||||
| Modification of PSUs (note 21) | - | - | - | (70 | ) | - | - | (70 | ) | - | 2,175 | |||||||||||||||||||||||||
| Equity-classified PSU | ||||||||||||||||||||||||||||||||||||
| expense (note 21) | - | - | - | - | - | - | - | - | 486 | |||||||||||||||||||||||||||
| NCI acquired in a business combination (note 23) | - | - | - | - | - | 596 | 596 | - | - | |||||||||||||||||||||||||||
| Acquisition of NCI (note 23) | - | - | - | - | - | (226 | ) | (226 | ) | - | - | |||||||||||||||||||||||||
| Shares repurchased (note 20) | (1,460,000 | ) | (36,726 | ) | - | - | - | - | (36,726 | ) | - | - | ||||||||||||||||||||||||
| Cash dividends paid (note 20) | - | - | - | (34,176 | ) | - | (72 | ) | (34,248 | ) | (2,296 | ) | - | |||||||||||||||||||||||
| Balance, June 30, 2016 | 106,547,039 | $ | 117,554 | $ | 25,691 | $ | 615,672 | $ | (49,901 | ) | $ | 4,715 | $ | 713,731 | $ | 44,141 | $ | 2,661 | ||||||||||||||||||
See accompanying notes to the condensed consolidated financial statements.
| Ritchie Bros. | 6 |
Condensed Consolidated Statements of Cash Flows
(Expressed in thousands of United States dollars)
(Unaudited)
| Six months ended June 30, | 2016 | 2015 | ||||||
| Cash provided by (used in): | ||||||||
| Operating activities: | ||||||||
| Net income | $ | 70,585 | $ | 69,956 | ||||
| Adjustments for items not affecting cash: | ||||||||
| Depreciation and amortization expenses (note 7) | 20,364 | 21,385 | ||||||
| Inventory write down (note 13) | 1,402 | 313 | ||||||
| Stock option compensation expense (note 21) | 2,470 | 2,056 | ||||||
| Equity-classified PSU expense (note 21) | 486 | - | ||||||
| Deferred income tax recovery | (3,366 | ) | (3,233 | ) | ||||
| Equity income less dividends received | (996 | ) | (406 | ) | ||||
| Unrealized foreign exchange loss (gain) | (12 | ) | 187 | |||||
| Gain on disposition of property, plant and equipment | (447 | ) | (966 | ) | ||||
| Net changes in operating assets and liabilities (note 11) | (52,931 | ) | 43,865 | |||||
| Net cash provided by operating activities | 37,555 | 133,157 | ||||||
| Investing activities: | ||||||||
| Acquisition of Mascus (note 23) | (28,123 | ) | - | |||||
| Acquisition of NCI (note 23) | (226 | ) | - | |||||
| Property, plant and equipment additions | (4,997 | ) | (4,612 | ) | ||||
| Intangible asset additions | (6,693 | ) | (4,467 | ) | ||||
| Proceeds on disposition of property, plant and equipment | 1,428 | 3,896 | ||||||
| Net cash used in investing activities | (38,611 | ) | (5,183 | ) | ||||
| Financing activities: | ||||||||
| Issuances of share capital | 18,057 | 27,946 | ||||||
| Share repurchase (note 20) | (36,726 | ) | (47,489 | ) | ||||
| Dividends paid to stockholders (note 20) | (34,176 | ) | (30,044 | ) | ||||
| Dividends paid to contingently redeemable NCI | (2,368 | ) | (1,340 | ) | ||||
| Proceeds from short-term debt | 31,336 | 6,682 | ||||||
| Repayment of short-term debt | (24,156 | ) | (601 | ) | ||||
| Proceeds from long-term debt | 46,572 | - | ||||||
| Repayment of long-term debt | (46,568 | ) | - | |||||
| Repayment of finance lease obligations | (907 | ) | (1,054 | ) | ||||
| Other, net | 268 | 201 | ||||||
| Net cash used in financing activities | (48,668 | ) | (45,699 | ) | ||||
| Effect of changes in foreign currency rates on | ||||||||
| cash and cash equivalents | 6,077 | (7,881 | ) | |||||
| Increase (decrease) in cash and cash equivalents | (43,647 | ) | 74,394 | |||||
| Cash and cash equivalents, beginning of period | 210,148 | 139,815 | ||||||
| Cash and cash equivalents, end of period | $ | 166,501 | 214,209 | |||||
See accompanying notes to the condensed consolidated financial statements.
| Ritchie Bros. | 7 |
| Notes to the Condensed Consolidated Financial Statements |
| (Tabular amounts expressed in thousands of United States dollars, except where noted) |
| (Unaudited) |
| 1. | General information |
Ritchie Bros. Auctioneers Incorporated and its subsidiaries (collectively referred to as the “Company”) provide asset management and disposition services for the construction, agricultural, transportation, energy, mining, forestry, material handling, marine and real estate industries through its unreserved auctions, online marketplace services, value-added services and listing and software services. Ritchie Bros. Auctioneers Incorporated is a company incorporated in Canada under the Canada Business Corporations Act, whose shares are publicly traded on the Toronto Stock Exchange (“TSX”) and the New York Stock Exchange (“NYSE”).
| 2. | Significant accounting policies |
| (a) | Basis of preparation |
These unaudited condensed consolidated interim financial statements have been prepared in accordance with United States generally accepted accounting principles (“US GAAP”). They include the accounts of Ritchie Bros. Auctioneers Incorporated and its subsidiaries (collectively referred to as the “Company”) from their respective dates of formation or acquisition. All significant intercompany balances and transactions have been eliminated.
Certain information and footnote disclosure required by US GAAP for complete annual financial statements have been omitted and, therefore, these condensed consolidated interim financial statements should be read in conjunction with the Company’s audited consolidated financial statements for the year ended December 31, 2015, included in the Company’s Annual Report on Form 10-K, filed with the Securities Exchange Commission (“SEC”). A selection of the accounting policies for which there has been a change since the annual consolidated financial statements are set out below. In the opinion of management, these unaudited condensed consolidated interim financial statements reflect all adjustments, consisting of normal recurring adjustments, which are necessary to present fairly, in all material respects, the Company’s consolidated financial position, results of operations, cash flows and changes in equity for the interim periods presented. The preparation of financial statements in conformity with US GAAP requires management to make estimates and assumptions that affect the amounts reported in the financial statements and accompanying notes. Actual results could differ from those estimates.
Previously, the Company prepared its consolidated financial statements under International Financial Reporting Standards (“IFRS”) as permitted by securities regulators in Canada, as well as in the United States under the status of a Foreign Private Issuer as defined by the United States SEC. At the end of the second quarter of 2015, the Company determined that it no longer qualified as a Foreign Private Issuer under the SEC rules. As a result, beginning January 1, 2016 the Company was required to report with the SEC on domestic forms and comply with domestic company rules in the United States. The transition to US GAAP was made retrospectively for all periods from the Company’s inception.
| (b) | Revenue recognition |
Revenues are comprised of:
| · | commissions earned at our auctions through the Company acting as an agent for consignors of equipment and other assets, as well as commissions on online marketplace sales, and |
| · | fees earned in the process of conducting auctions through all our auction channels and from value-added services, as well as subscription revenues from our listing and software services. |
The Company recognizes revenue when persuasive evidence of an arrangement exists, delivery has occurred or services have been rendered, the price is fixed or determinable, and collectability is reasonably assured. For auction or online marketplace sales, revenue is recognized when the auction or online marketplace sale is complete and the Company has determined that the sale proceeds are collectible. Revenue is measured at the fair value of the consideration received or receivable and is shown net of value-added tax and duties.
| Ritchie Bros. | 8 |
| Notes to the Condensed Consolidated Financial Statements |
| (Tabular amounts expressed in thousands of United States dollars, except where noted) |
| (Unaudited) |
| 2. | Significant accounting policies (continued) |
| (b) | Revenue recognition (continued) |
Commissions from sales at our auctions represent the percentage earned by the Company on the gross auction proceeds from equipment and other assets sold at auction. The majority of commissions are earned as a pre-negotiated fixed rate of the gross selling price. Other commissions from sales at our auctions are earned from underwritten commission contracts, when the Company guarantees a certain level of proceeds to a consignor or purchases inventory to be sold at auction. Commissions also include those earned on online marketplace sales.
Commissions from sales at auction
The Company accepts equipment and other assets on consignment or takes title for a short period of time prior to auction, stimulates buyer interest through professional marketing techniques, and matches sellers (also known as consignors) to buyers through the auction or private sale process.
In its role as auctioneer, the Company matches buyers to sellers of equipment on consignment, as well as to inventory held by the Company, through the auction process. Following the auction, the Company invoices the buyer for the purchase price of the property, collects payment from the buyer, and where applicable, remits to the consignor the net sale proceeds after deducting its commissions, expenses and applicable taxes. Commissions are calculated as a percentage of the hammer price of the property sold at auction.
On the fall of the auctioneer’s hammer, the highest bidder becomes legally obligated to pay the full purchase price, which is the hammer price of the property purchased and the seller is legally obligated to relinquish the property in exchange for the hammer price less any seller’s commissions. Commission revenue is recognized on the date of the auction sale upon the fall of the auctioneer’s hammer, which is the point in time when the Company has substantially accomplished what it must do to be entitled to the benefits represented by the commission revenue. Subsequent to the date of the auction sale, the Company’s remaining obligations for its auction services relate only to the collection of the purchase price from the buyer and the remittance of the net sale proceeds to the seller.
Under the standard terms and conditions of its auction sales, the Company is not obligated to pay a consignor for property that has not been paid for by the buyer, provided that the property has not been released to the buyer. In the rare event where a buyer refuses to take title of the property, the sale is cancelled in the period in which the determination is made, and the property is returned to the consignor. Historically, cancelled sales have not been material in relation to the aggregate hammer price of property sold at auction.
Commission revenues are recorded net of commissions owed to third parties, which are principally the result of situations when the commission is shared with a consignor or with the counterparty in an auction guarantee risk and reward sharing arrangement. Additionally, in certain situations, commissions are shared with third parties who introduce the Company to consignors who sell property at auction.
Underwritten commission contracts can take the form of guarantee or inventory contracts. Guarantee contracts typically include a pre-negotiated percentage of the guaranteed gross proceeds plus a percentage of proceeds in excess of the guaranteed amount. If actual auction proceeds are less than the guaranteed amount, commission is reduced; if proceeds are sufficiently lower, the Company can incur a loss on the sale. Losses, if any, resulting from guarantee contracts are recorded in the period in which the relevant auction is completed. If a loss relating to a guarantee contract held at the period end to be sold after the period end is known or is probable and estimable at the financial statement reporting date, the loss is accrued in the financial statements for that period. The Company’s exposure from these guarantee contracts fluctuates over time (note 22).
| Ritchie Bros. | 9 |
| Notes to the Condensed Consolidated Financial Statements |
| (Tabular amounts expressed in thousands of United States dollars, except where noted) |
| (Unaudited) |
| 2. | Significant accounting policies (continued) |
| (b) | Revenue recognition (continued) |
Revenues related to inventory contracts are recognized in the period in which the sale is completed, title to the property passes to the purchaser and the Company has fulfilled any other obligations that may be relevant to the transaction, including, but not limited to, delivery of the property. Revenue from inventory sales is presented net of costs within revenues on the income statement, as the Company takes title only for a short period of time and the risks and rewards of ownership are not substantially different than the Company’s other underwritten commission contracts.
Fees
Fees earned in the process of conducting our auctions include administrative, documentation, and advertising fees. Fees from value-added services include financing and technology service fees. Fees also include subscription revenues from our listing and software services, as well as amounts paid by buyers (a “buyer’s premium”) on online marketplace sales. Fees are recognized in the period in which the service is provided to the customer.
| (c) | Costs of services, excluding depreciation and amortization expenses |
Costs of services are comprised of expenses incurred in direct relation to conducting auctions (“direct expenses”), earning online marketplace revenues, and earning other fee revenues. Direct expenses include direct labour, buildings and facilities charges, and travel, advertising and promotion costs. Costs of services incurred to earn online marketplace revenues include inventory management, referral, inspection, sampling, and appraisal fees. Costs of services incurred in earning other fee revenues include direct labour (including commissions on sales), software maintenance fees, and materials. Costs of services exclude depreciation and amortization expenses. In comparative periods, costs of services consisted entirely of direct expenses. As a result of the Xcira LLC (“Xcira”) and Mascus International Holdings BV (“Mascus”) acquisitions, significant other costs of services are now incurred in earning our revenues (note 23).
| (d) | Share-based payments |
The Company classifies a share-based payment award as an equity or liability payment based on the substantive terms of the award and any related arrangement.
Equity-classified share-based payments
The Company has a stock option compensation plan that provides for the award of stock options to selected employees, directors and officers of the Company. The cost of options granted is measured at the fair value of the underlying option at the grant date using the Black-Scholes option pricing model. The Company also has a senior executive performance share unit (“PSU”) plan that provides for the award of PSUs to selected senior executives of the Company. The Company has the option to settle executive PSU awards in cash or shares and expects to settle them in shares. The cost of PSUs granted is measured at the fair value of the underlying PSUs at the grant date using a binomial model.
This fair value of awards expected to vest under these plans is expensed over the respective remaining service period of the individual awards, on a straight-line basis, with recognition of a corresponding increase to APIC in equity. At the end of each reporting period, the Company revises its estimate of the number of equity instruments expected to vest. The impact of the revision of the original estimates, if any, is recognized in earnings, such that the consolidated expense reflects the revised estimate, with a corresponding adjustment to equity.
Any consideration paid on exercise of the stock options is credited to the common shares together with any related compensation recognized for the award. Dividend equivalents on the senior executive plan PSUs are recognized as a reduction to retained earnings over the service period.
| Ritchie Bros. | 10 |
| Notes to the Condensed Consolidated Financial Statements |
| (Tabular amounts expressed in thousands of United States dollars, except where noted) |
| (Unaudited) |
| 2. | Significant accounting policies (continued) |
| (d) | Share-based payments (continued) |
Equity-classified share-based payments (continued)
PSUs awarded under the senior executive and employee PSU plans (described in note 21) are contingently redeemable in cash in the event of death of the participant. The contingently redeemable portion of the senior executive PSU awards, which represents the amount that would be redeemable based on the conditions at the date of grant, to the extent attributable to prior service, is recognized as temporary equity. The balance reported in temporary equity increases on the same basis as the related compensation expense over the service period of the award, with any excess of the temporary equity value over the amount recognized in compensation expense charged against retained earnings. In the event it becomes probable an award is going to become eligible for redemption by the holder, the award would be reclassified to a liability award.
Liability-classified share-based payments
The Company maintains other share unit compensation plans that vest over a period of up to five years after grant. Under those plans, the Company is either required or expects to settle vested awards on a cash basis or by providing cash to acquire shares on the open market on the employee’s behalf, where the settlement amount is determined using the volume weighted average price of the Company’s common shares for the twenty days prior to the vesting date or, in the case of deferred share unit (“DSU”) recipients, following cessation of service on the Board of Directors.
These awards are classified as liability awards, measured at fair value at the date of grant and re-measured at fair value at each reporting date up to and including the settlement date. The determination of the fair value of the share units under these plans is described in note 21. The fair value of the awards is expensed over the respective vesting period of the individual awards with recognition of a corresponding liability. Changes in fair value after vesting are recognized through compensation expense. Compensation expense reflects estimates of the number of instruments expected to vest.
The impact of fair value and forfeiture estimate revisions, if any, are recognized in earnings such that the cumulative expense reflects the revised estimates, with a corresponding adjustment to the settlement liability. Liability-classified share unit liabilities due within 12 months of the reporting date are presented in trade and other payables while settlements due beyond 12 months of the reporting date are presented in non-current liabilities.
Employee share purchase plan
The Company matches employees’ contributions to the share purchase plan, which is described in more detail in note 21. The Company’s contributions are expensed as share-based compensation.
| (e) | New and amended accounting standards |
| (i) | Effective January 1, 2016, the Company adopted ASU 2014-12, Compensation – Stock Compensation (Topic 718), Accounting for Share-Based Payments When the Terms of an Award Provide That a Performance Target Could Be Achieved after the Requisite Service Period, which requires that a performance target that (1) affects vesting of an award, and (2) could be achieved after the requisite service period of the employee be treated as a performance condition. The adoption of this standard did not have an impact on the Company’s consolidated financial statements. |
| Ritchie Bros. | 11 |
| Notes to the Condensed Consolidated Financial Statements |
| (Tabular amounts expressed in thousands of United States dollars, except where noted) |
| (Unaudited) |
| 2. | Significant accounting policies (continued) |
| (e) | New and amended accounting standards (continued) |
| (i) | Effective January 1, 2016, the Company adopted ASU 2015-02, Consolidation (Topic 810), Amendments to the Consolidation Analysis, which changes the evaluation of whether limited partnerships and similar legal entities are variable interest entities (“VIEs”), and eliminates the presumption that a general partner should consolidate a limited partnership that is a voting interest entity. The new guidance also alters the analysis for determining when fees paid to a decision maker or service provider represent a variable interest in a VIE and how interests of related parties affect the primary beneficiary determination. The adoption of this standard did not have an impact on the Company’s consolidated financial statements. |
| (ii) | Effective January 1, 2016, the Company adopted ASU 2015-05, Intangibles – Goodwill and Other – Internal-Use Software (Subtopic 350-40), Customer’s Accounting for Fees Paid in a Cloud Computing Arrangement, which provides clarity around a customer’s accounting for fees paid in a cloud computing arrangement. The amendments in ASU 2015-05 add guidance to assist customers in determining whether a cloud computing arrangement includes a software license. Software license elements of cloud computing arrangements are accounted for consistent with the acquisition of other intangible asset licenses. Where there is no software license element, the cloud computing arrangement is accounted for as a service contract. The standard was applied prospectively and did not have an impact on the Company’s consolidated financial statements. |
| (iii) | Effective January 1, 2016, the Company adopted Accounting Standards Update (“ASU”) 2015-16, Business Combinations (Topic 805), Simplifying the Accounting for Measurement-Period Adjustments, which requires that an acquirer recognize adjustments to provisional amounts that are identified during the measurement period in the reporting period in which the adjustment amounts are determined. The adoption of this standard did not have an impact on the Company’s consolidated financial statements with respect to the acquisition of Xcira (note 23(b)) as no adjustments to provisional amounts were identified during the measurement period. During the three months ended June 30, 2016, the Company recognized working capital adjustments related to the Mascus acquisition (note 23(a)), which resulted in a $418,000 increase in goodwill. |
| (f) | Recent accounting standards not yet adopted |
| (i) | In May 2014, the FASB issued ASU 2014-09, Revenue from Contracts with Customers (Topic 606), which requires an entity to recognize revenue when it transfers promised goods or services to customers in an amount that reflects the consideration to which the entity expects to be entitled in exchange for those goods or services. In particular, it moves away from the current industry and transaction specific requirements. ASU 2014-09 creates a five-step model that requires entities to exercise judgment when considering the terms of the contract(s) which include: |
| 1. | Identifying the contract(s) with the customer, |
| 2. | Identifying the separate performance obligations in the contract, |
| 3. | Determining the transaction price, |
| 4. | Allocating the transaction price to the separate performance obligations, and |
| 5. | Recognizing revenue as each performance obligation is satisfied. |
The amendments also contain extensive disclosure requirements designed to enable users of the financial statements to understand the nature, amount, timing and uncertainty of revenue and cash flows arising from contracts with customers. In July 2015, the FASB delayed the effective date of ASU 2014-09 by one year so that ASU 2014-09 is effective for fiscal years, and interim periods within those fiscal years, beginning after December 15, 2017. The Company is evaluating the new guidance to determine the impact it will have on its consolidated financial statements.
| Ritchie Bros. | 12 |
| Notes to the Condensed Consolidated Financial Statements |
| (Tabular amounts expressed in thousands of United States dollars, except where noted) |
| (Unaudited) |
| 2. | Significant accounting policies (continued) |
| (f) | Recent accounting standards not yet adopted (continued) |
| (ii) | In January 2016, the FASB issued ASU 2016-01, Financial Instruments – Overall (Subtopic 825-10), Recognition and Measurement of Financial Assets and Financial Liabilities, the first of three standards related to financial instrument accounting. The amendments of ASU 2016-01 require equity method investments (except for equity-method accounted investments and those resulting in consolidation of the investee) to be measured at fair value with changes recognized in net income. For equity investments that do not have readily determinable fair values, the entity may elect to measure the investment at cost less any impairment, plus or minus changes resulting from observable price changes in orderly transactions for the identical or a similar investment of the same issuer. The amendments also: |
| · | Simplify the impairment assessment of equity investments that do not have readily determinable fair values, by requiring a qualitative assessment to identify impairment. The entity is only required to measure the investment at fair value if the qualitative assessment indicates that impairment exists. |
| · | Eliminate the requirement to disclose the method(s) and significant assumptions used to estimate the fair value that is required to be disclosed for financial instruments measured at amortized cost. |
| · | Require the exit price notion to be used when measuring the fair value of financial instruments for disclosure purposes. |
| · | Require separate presentation of financial assets and liabilities by measurement category and form of financial asset (i.e. securities or loans & receivables) on the balance sheet or the accompanying notes to the financial statements. |
ASU 2016-01 is effective for fiscal years, and interim periods within those fiscal years, beginning after December 15, 2017. Early adoption is only permitted for the provisions under ASU 2016-01 related to the recognition of changes in fair value of financial liabilities. The Company is evaluating the new guidance to determine the impact it will have on its consolidated financial statements.
| (iii) | In February 2016, the FASB issued ASU 2016-02, Leases (Topic 842), which requires lessees to recognize almost all leases, including operating leases, on the balance sheet through a right-of-use asset and a corresponding lease liability. For short-term leases, defined as those with a term of 12 months or less, the lessee is permitted to make an accounting policy election not to recognize the lease assets and liabilities, and instead recognize the lease expense generally on a straight-line basis over the lease term. The accounting treatment under this election is consistent with current operating lease accounting. No extensive amendments were made to lessor accounting, but amendments of note include changes to the definition of initial direct costs and accounting for collectability uncertainties in a lease. ASU 2016-02 is effective for fiscal years, and interim periods within those fiscal years, beginning after December 15, 2018, with early adoption permitted. Both lessees and lessors must apply ASU 2016-02 using a “modified retrospective transition”, which reflects the new guidance from the beginning of the earliest period presented in the financial statements. However, lessees and lessors can elect to apply certain practical expedients on transition. The Company is evaluating the new guidance to determine the impact it will have on its consolidated financial statements. |
| (iv) | In March 2016, the FASB issued ASU 2016-08, Revenue from Contracts with Customers (Topic 606), Principal versus Agent Considerations (Reporting Revenue Gross versus Net). The amendments in ASU 2016-08 clarify the implementation guidance on principal versus agent considerations, focusing on whether an entity controls a specified good or service before that good or service is transferred to a customer. Where such control exists – i.e. where the entity is required to provide the specified good or service itself – the entity is a ‘principal’. Where the entity is required to arrange for another party to provide the good or service, it is an agent. |
| Ritchie Bros. | 13 |
| Notes to the Condensed Consolidated Financial Statements |
| (Tabular amounts expressed in thousands of United States dollars, except where noted) |
| (Unaudited) |
| 2. | Significant accounting policies (continued) |
| (f) | Recent accounting standards not yet adopted (continued) |
The effective date and transition requirements of ASU 2016-08 are the same as for ASU 2014-09, which is for fiscal years, and interim periods within those fiscal years, beginning after December 15, 2017. The Company is evaluating the new guidance to determine the impact it will have on its consolidated financial statements.
| (v) | In March 2016, the FASB issued ASU No. 2016-09, Compensation—Stock Compensation (Topic 718), which makes several modifications to Topic 718 related to the accounting for forfeitures, employer tax withholding on share-based compensation and the financial statement presentation of excess tax benefits or deficiencies. ASU 2016-09 also clarifies the statement of cash flows presentation for certain components of share-based awards. Specifically, ASU 2016-09 requires an entity to recognize share-based payment award income tax effects in the income statement when the awards vest or are settled, and as a result, the requirement for entities to track APIC pools is eliminated. In addition, the amendments allow entities to make a policy election to either estimate forfeiture or recognize forfeitures as they occur. ASC 2016-09 is effective for fiscal years, and interim periods within those fiscal years, beginning after December 15, 2016, with early adoption permitted. The Company is evaluating the new guidance to determine the impact it will have on its consolidated financial statements. |
| (vi) | In April 2016, the FASB issued ASU 2016-10, Identifying Performance Obligations and Licensing, which clarifies the following two aspects of ASU 2014-09 (Topic 606): identifying performance obligations and the licensing implementation guidance. ASC 2016-10 affects the guidance in ASU 2014-09, and so has the same effective date and transition requirements. ASU 2016-10 is effective for fiscal years, and interim periods within those fiscal years, beginning after December 15, 2017. The Company is evaluating the new guidance to determine the impact it will have on its consolidated financial statements. |
| (vii) | In May 2016, the FASB issued ASU 2016-12, Narrow Scope Improvements and Practical Expedients, which makes narrow scope improvements and practical expedients to the following aspects of ASU 2014-09 (Topic 606): |
| · | Assessing one specific collectability criterion and accounting for contracts that do not meet certain criteria |
| · | Presentation for sales taxes and other similar taxes collected from customers |
| · | Non-cash consideration |
| · | Contract modification at transition |
| · | Completed contracts at transition |
| · | Technical correction |
ASC 2016-10 affects the guidance in ASU 2014-09, and so has the same effective date and transition requirements. ASU 2016-10 is effective for fiscal years, and interim periods within those fiscal years, beginning after December 15, 2017. The Company is evaluating the new guidance to determine the impact it will have on its consolidated financial statements.
| (viii) | In June 2016, the FASB issued ASU 2016-13, Financial Instruments – Credit Losses (Topic 326), Measurement of Credit Losses on Financial Statements, which replaces the ‘incurred loss methodology’ credit impairment model with a new forward-looking “methodology that reflects expected credit losses and requires consideration of a broader range of reasonable and supportable information to inform credit loss estimates.” ASU 2016-13 is effective for fiscal years, and interim periods within those fiscal years, beginning after December 15, 2019. Early adoption is only permitted for fiscal years beginning after December 15, 2018, including interim periods within those years. The Company is evaluating the new guidance to determine the impact it will have on its consolidated financial statements. |
| Ritchie Bros. | 14 |
| Notes to the Condensed Consolidated Financial Statements |
| (Tabular amounts expressed in thousands of United States dollars, except where noted) |
| (Unaudited) |
| 3. | Significant judgments, estimates and assumptions |
The preparation of financial statements in conformity with US GAAP requires management to make judgments, estimates and assumptions that affect the reported amounts of assets and liabilities and the disclosure of contingent liabilities at the date of the financial statements, and the reported amounts of revenues and expenses during the reporting period.
Future differences arising between actual results and the judgments, estimates and assumptions made by the Company at the reporting date, or future changes to estimates and assumptions, could necessitate adjustments to the underlying reported amounts of assets, liabilities, revenues and expenses in future reporting periods.
Judgments, estimates and underlying assumptions are evaluated on an ongoing basis by management, and are based on historical experience and other factors including expectations of future events that are believed to be reasonable under the circumstances. Existing circumstances and assumptions about future developments, however, may change due to market changes or circumstance and such changes are reflected in the assumptions when they occur. Significant estimates include the estimated useful lives of long-lived assets, as well as valuation of goodwill, underwritten commission contracts, contingently redeemable non-controlling interest and share-based compensation.
| 4. | Seasonality of operations |
The Company's operations are both seasonal and event driven. Revenues tend to be highest during the second and fourth calendar quarters. The Company generally conducts more auctions during these quarters than during the first and third calendar quarters. Late December through mid-February and mid-July through August are traditionally less active periods.
| 5. | Segmented information |
The Company’s principal business activity is the sale of industrial equipment and other assets at auctions. The Company’s operations are comprised of one reportable segment and other business activities that are not reportable as follows:
| · | Core Auction segment, a network of auction locations that conduct live, unreserved auctions with both on-site and online bidding; and |
| · | Other includes the results of the Company’s EquipmentOne and Mascus online services, which are not material to the Company’s consolidated financial statements. On February 19, 2016, the Company acquired Mascus and updated its segment reporting such that the results of EquipmentOne and Mascus (subsequent to acquisition) are reported as “Other.” |
The Chief Operating Decision Maker evaluates segment performance based on earnings (loss) from operations, which is calculated as revenues less costs of services, selling, general and administrative (“SG&A”) expenses, and depreciation and amortization expenses. The significant non-cash item included in segment earnings (loss) from operations is depreciation and amortization expenses.
| Ritchie Bros. | 15 |
| Notes to the Condensed Consolidated Financial Statements |
| (Tabular amounts expressed in thousands of United States dollars, except where noted) |
| (Unaudited) |
| 5. | Segmented information (continued) |
| Three months ended | Six months ended | |||||||||||||||||||||||
| June 30, 2016 | June 30, 2016 | |||||||||||||||||||||||
| Core | Core | |||||||||||||||||||||||
| Auction | Other | Consolidated | Auction | Other | Consolidated | |||||||||||||||||||
| Revenues | $ | 152,542 | $ | 6,263 | $ | 158,805 | $ | 279,882 | $ | 10,868 | $ | 290,750 | ||||||||||||
| Costs of services, excluding depreciation and amortization | (19,438 | ) | (320 | ) | (19,758 | ) | (34,223 | ) | (848 | ) | (35,071 | ) | ||||||||||||
| SG&A expenses | (69,153 | ) | (5,442 | ) | (74,595 | ) | (133,973 | ) | (8,929 | ) | (142,902 | ) | ||||||||||||
| Depreciation and amortization expenses | (9,397 | ) | (887 | ) | (10,284 | ) | (18,701 | ) | (1,663 | ) | (20,364 | ) | ||||||||||||
| 54,554 | $ | (386 | ) | $ | 54,168 | $ | 92,985 | $ | (572 | ) | $ | 92,413 | ||||||||||||
| Gain on disposition of property, plant and equipment | 201 | 447 | ||||||||||||||||||||||
| Foreign exchange loss | (734 | ) | (51 | ) | ||||||||||||||||||||
| Operating income | $ | 53,635 | $ | 92,809 | ||||||||||||||||||||
| Equity income | 477 | 996 | ||||||||||||||||||||||
| Other and income tax expenses | (13,521 | ) | (23,220 | ) | ||||||||||||||||||||
| Net income | $ | 40,591 | $ | 70,585 | ||||||||||||||||||||
| Three months ended | Six months ended | |||||||||||||||||||||||
| June 30, 2015 | June 30, 2015 | |||||||||||||||||||||||
| Core | Core | |||||||||||||||||||||||
| Auction | Other | Consolidated | Auction | Other | Consolidated | |||||||||||||||||||
| Revenues | $ | 151,645 | $ | 3,832 | $ | 155,477 | $ | 264,290 | $ | 6,805 | $ | 271,095 | ||||||||||||
| Costs of services, excluding depreciation and amortization | (17,027 | ) | - | (17,027 | ) | (28,636 | ) | - | (28,636 | ) | ||||||||||||||
| SG&A expenses | (61,801 | ) | (3,438 | ) | (65,239 | ) | (122,399 | ) | (6,596 | ) | (128,995 | ) | ||||||||||||
| Depreciation and amortization expenses | (9,972 | ) | (797 | ) | (10,769 | ) | (19,668 | ) | (1,717 | ) | (21,385 | ) | ||||||||||||
| $ | 62,845 | $ | (403 | ) | $ | 62,442 | $ | 93,587 | $ | (1,508 | ) | $ | 92,079 | |||||||||||
| Gain on disposition of property, plant and equipment | 791 | 966 | ||||||||||||||||||||||
| Foreign exchange gain (loss) | (438 | ) | 2,769 | |||||||||||||||||||||
| Operating income | $ | 62,795 | $ | 95,814 | ||||||||||||||||||||
| Equity income | 173 | 406 | ||||||||||||||||||||||
| Other and income tax expenses | (17,122 | ) | (26,264 | ) | ||||||||||||||||||||
| Net income | $ | 45,846 | $ | 69,956 | ||||||||||||||||||||
| Ritchie Bros. | 16 |
| Notes to the Condensed Consolidated Financial Statements |
| (Tabular amounts expressed in thousands of United States dollars, except where noted) |
| (Unaudited) |
| 6. | Revenues |
The Company’s revenue from the rendering of services is as follows:
| Three months ended | Six months ended | |||||||||||||||
| June 30, | June 30, | |||||||||||||||
| 2016 | 2015 | 2016 | 2015 | |||||||||||||
| Commissions | $ | 118,180 | $ | 124,592 | $ | 217,973 | $ | 217,732 | ||||||||
| Fees | 40,625 | 30,885 | 72,777 | 53,363 | ||||||||||||
| $ | 158,805 | $ | 155,477 | $ | 290,750 | $ | 271,095 | |||||||||
Net profits on inventory sales included in commissions are:
| Three months ended | Six months ended | |||||||||||||||
| June 30, | June 30, | |||||||||||||||
| 2016 | 2015 | 2016 | 2015 | |||||||||||||
| Revenue from inventory sales | $ | 111,032 | $ | 150,147 | $ | 235,589 | $ | 303,428 | ||||||||
| Cost of inventory sold | (104,978 | ) | (136,255 | ) | (216,514 | ) | (274,832 | ) | ||||||||
| $ | 6,054 | $ | 13,892 | $ | 19,075 | $ | 28,596 | |||||||||
| 7. | Operating expenses |
Costs of services, excluding depreciation and amortization
| Three months ended | Six months ended | |||||||||||||||
| June 30, | June 30, | |||||||||||||||
| 2016 | 2015 | 2016 | 2015 | |||||||||||||
| Employee compensation expenses | $ | 9,332 | $ | 6,278 | $ | 15,590 | $ | 10,875 | ||||||||
| Buildings, facilities and technology expenses | 2,394 | 1,832 | 4,689 | 3,447 | ||||||||||||
| Travel, advertising and promotion expenses | 7,979 | 6,933 | 13,916 | 11,087 | ||||||||||||
| Other costs of services | 53 | 1,984 | 876 | 3,227 | ||||||||||||
| $ | 19,758 | $ | 17,027 | $ | 35,071 | $ | 28,636 | |||||||||
SG&A expenses
| Three months ended | Six months ended | |||||||||||||||
| June 30, | June 30, | |||||||||||||||
| 2016 | 2015 | 2016 | 2015 | |||||||||||||
| Employee compensation expenses | $ | 47,560 | $ | 44,046 | $ | 92,050 | $ | 85,775 | ||||||||
| Buildings, facilities and technology expenses | 12,969 | 10,287 | 24,205 | 20,333 | ||||||||||||
| Travel, advertising and promotion expenses | 6,792 | 4,805 | 12,354 | 10,886 | ||||||||||||
| Professional fees | 3,115 | 3,205 | 6,567 | 6,305 | ||||||||||||
| Other SG&A expenses | 4,159 | 2,896 | 7,726 | 5,696 | ||||||||||||
| $ | 74,595 | $ | 65,239 | $ | 142,902 | $ | 128,995 | |||||||||
| Ritchie Bros. | 17 |
| Notes to the Condensed Consolidated Financial Statements |
| (Tabular amounts expressed in thousands of United States dollars, except where noted) |
| (Unaudited) |
| 7. | Operating expenses (continued) |
Depreciation and amortization expenses
| Three months ended | Six months ended | |||||||||||||||
| June 30, | June 30, | |||||||||||||||
| 2016 | 2015 | 2016 | 2015 | |||||||||||||
| Depreciation expense | $ | 7,932 | $ | 8,947 | $ | 15,715 | $ | 18,227 | ||||||||
| Amortization expense | 2,352 | 1,822 | 4,649 | 3,158 | ||||||||||||
| $ | 10,284 | $ | 10,769 | $ | 20,364 | $ | 21,385 | |||||||||
| 8. | Income taxes |
At the end of each interim period, the Company estimates the effective tax rate expected to be applicable for the full fiscal year. The estimate reflects, among other items, our best estimate of operating results. It does not include the estimated impact of foreign exchange rates or unusual and/or infrequent items, which may cause significant variations in the customary relationship between income tax expense and income before income taxes.
The Company’s consolidated effective tax rate in respect of operations for the three and six months ended June 30, 2016 was 24.6% and 24.4%, respectively (2015: 27.5% and 27.7%).
| 9. | Contingently redeemable non-controlling interest in Ritchie Bros. Financial Services |
At June 30, 2016, the Company held a 51% interest in Ritchie Bros. Financial Services (”RBFS”), an entity that provides loan origination services to enable the Company’s auction customers to obtain financing from third party lenders. As a result of the Company’s involvement with RBFS, the Company is exposed to risks related to the recovery of the net assets of RBFS as well as liquidity risks associated with the put option discussed below.
The Company determined that RBFS was a variable interest entity because the Company provided subordinated financial support to RBFS and because the Company’s voting interest was disproportionately low in relation to its economic interest in RBFS while substantially all the activities of RBFS involved or were conducted on behalf of the Company. The Company also determined it was the primary beneficiary of RBFS as it was part of a related party group that had the power to direct the activities that most significantly impacted RBFS’s economic performance, and although no individual member of that group had such power, the Company represented the member of the related party group that was most closely associated with RBFS.
On June 30, 2016, the Company and the non-controlling interest (“NCI”) holders each held options pursuant to which the Company could acquire, or be required to acquire, the NCI holders’ 49% interest in RBFS. These call and put options became exercisable on April 6, 2016, and the Company had the option to elect to pay the purchase price in either cash or shares of the Company, subject to the Company obtaining all relevant security exchange and regulatory consents and approvals. As a result of the existence of the put option, the NCI was accounted for as a contingently redeemable equity instrument (the “contingently redeemable NCI”). The NCI could be redeemed at a purchase price to be determined through an independent appraisal process conducted in accordance with the terms of the agreement, or at a negotiated price (the “redemption value”).
| Ritchie Bros. | 18 |
| Notes to the Condensed Consolidated Financial Statements |
| (Tabular amounts expressed in thousands of United States dollars, except where noted) |
| (Unaudited) |
| 9. | Contingently redeemable non-controlling interest in Ritchie Bros. Financial Services (continued) |
For the comparative reporting period presented, the Company determined that redemption was probable and measured the carrying value of the contingently redeemable NCI at its estimated December 31, 2015 redemption value of $24,785,000. The estimation of redemption value at that date required management to make significant judgments, estimates, and assumptions.
On June 30, 2016, the Company recorded the contingently redeemable NCI at a redemption value of $44,141,000, which reflected the actual purchase price on July 12, 2016 when the Company completed its acquisition of the NCI.
The July 12, 2016 acquisition of the NCI holders’ 49% interest in RBFS was completed for total consideration of 57,900,000 Canadian dollars ($44,141,000). That purchase price consisted of cash consideration of 53,900,000 Canadian dollars and 4,000,000 Canadian dollars representing the acquisition date fair value of contingent consideration payable to the former shareholders of RBFS. The contingent payment is payable if RBFS achieves a specified annual revenue growth rate over a three-year post-acquisition period, and is calculated as a specified percentage of the accumulated earnings of RBFS after the three-year post-acquisition period. The maximum amount payable under the contingent payment arrangement is 10,000,000 Canadian dollars. The Company may pay an additional amount not exceeding 1,500,000 Canadian dollars over a three-year period based on the former NCI holders providing continued management services to RBFS.
| 10. | Earnings per share attributable to stockholders |
Basic earnings per share (“EPS”) attributable to stockholders was calculated by dividing the net income attributable to stockholders by the weighted average (“WA”) number of common shares outstanding. Diluted EPS attributable to stockholders was calculated by dividing the net income attributable to stockholders after giving effect to outstanding dilutive stock options and PSUs by the WA number of shares outstanding adjusted for all dilutive securities.
| Three months ended | Six months ended | |||||||||||||||||||||||
| June 30, 2016 | June 30, 2016 | |||||||||||||||||||||||
| Net income | WA | Net income | WA | |||||||||||||||||||||
| attributable to | number | Per share | attributable to | number | Per share | |||||||||||||||||||
| stockholders | of shares | amount | stockholders | of shares | amount | |||||||||||||||||||
| Basic | $ | 39,710 | 106,245,307 | $ | 0.37 | $ | 69,116 | 106,581,294 | $ | 0.65 | ||||||||||||||
| Effect of dilutive securities: | ||||||||||||||||||||||||
| PSUs | - | - | - | - | - | - | ||||||||||||||||||
| Stock options | - | 734,503 | - | - | 488,116 | - | ||||||||||||||||||
| Diluted | $ | 39,710 | 106,979,810 | $ | 0.37 | $ | 69,116 | 107,069,410 | $ | 0.65 | ||||||||||||||
| Ritchie Bros. | 19 |
| Notes to the Condensed Consolidated Financial Statements |
| (Tabular amounts expressed in thousands of United States dollars, except where noted) |
| (Unaudited) |
| 10. | Earnings per share attributable to stockholders (continued) |
| Three months ended | Six months ended | |||||||||||||||||||||||
| June 30, 2015 | June 30, 2015 | |||||||||||||||||||||||
| Net income | WA | Net income | WA | |||||||||||||||||||||
| attributable to | number | Per share | attributable to | number | Per share | |||||||||||||||||||
| stockholders | of shares | amount | stockholders | of shares | amount | |||||||||||||||||||
| Basic | $ | 45,083 | 106,506,916 | $ | 0.42 | $ | 68,860 | 106,993,228 | $ | 0.64 | ||||||||||||||
| Effect of dilutive securities: | ||||||||||||||||||||||||
| Stock options | - | 471,145 | - | - | 397,075 | - | ||||||||||||||||||
| Diluted | $ | 45,083 | 106,978,061 | $ | 0.42 | $ | 68,860 | 107,390,303 | $ | 0.64 | ||||||||||||||
At June 30, 2016, there were 263,203 senior executive PSUs outstanding and 178,165 employee PSUs outstanding, which had no dilutive impact at June 30, 2016. Performance and market conditions, depending on their outcome at the end of the contingency period, can reduce the number of vested awards to nil or to a maximum of 200% of the number of outstanding PSUs.
For the three and six months ended June 30, 2016, stock options to purchase 28,318 and 1,504,394 common shares, respectively, were outstanding but excluded from the calculation of diluted earnings per share as they were anti-dilutive (2015: 72,309 and 253,622).
| 11. | Supplemental cash flow information |
| Six months ended June 30, | 2016 | 2015 | ||||||
| Restricted cash | $ | (110,557 | ) | $ | (60,394 | ) | ||
| Trade and other receivables | (68,680 | ) | (55,670 | ) | ||||
| Inventory | (15,871 | ) | 7,261 | |||||
| Advances against auction contracts | 2,897 | 17,004 | ||||||
| Prepaid expenses and deposits | (2,534 | ) | 1,289 | |||||
| Income taxes receivable | (4,845 | ) | (3,175 | ) | ||||
| Auction proceeds payable | 171,660 | 149,860 | ||||||
| Trade and other payables | (13,152 | ) | (23,545 | ) | ||||
| Income taxes payable | (9,385 | ) | 4,950 | |||||
| Share unit liabilities | 2,606 | 3,643 | ||||||
| Other | (5,070 | ) | 2,642 | |||||
| Net changes in operating | ||||||||
| assets and liabilities | $ | (52,931 | ) | $ | 43,865 | |||
| Ritchie Bros. | 20 |
| Notes to the Condensed Consolidated Financial Statements |
| (Tabular amounts expressed in thousands of United States dollars, except where noted) |
| (Unaudited) |
| 11. | Supplemental cash flow information (continued) |
| Six months ended June 30, | 2016 | 2015 | ||||||
| Interest paid, net of interest capitalized | $ | 2,922 | $ | 2,619 | ||||
| Interest received | 984 | 1,527 | ||||||
| Net income taxes paid | 36,870 | 26,057 | ||||||
| Non-cash transactions: | ||||||||
| Non-cash purchase of property, plant and equipment under capital lease | 756 | - | ||||||
| 12. | Fair value measurement |
All assets and liabilities for which fair value is measured or disclosed in the condensed consolidated financial statements are categorized within the fair value hierarchy, described as follows, based on the lowest level input that is significant to the fair value measurement or disclosure:
● Level 1: Unadjusted quoted prices in active markets for identical assets or liabilities that the entity can access at measurement date;
● Level 2: Inputs other than quoted prices included in Level 1 that are observable for the asset or liability, either directly or indirectly; and
● Level 3: Unobservable inputs for the asset or liability.
| June 30, 2016 | December 31, 2015 | |||||||||||||||||
| Category | Carrying amount | Fair value | Carrying amount | Fair value | ||||||||||||||
| Fair values disclosed, recurring: | ||||||||||||||||||
| Cash and cash equivalents | Level 1 | $ | 166,501 | $ | 166,501 | $ | 210,148 | $ | 210,148 | |||||||||
| Restricted cash | Level 1 | 196,171 | 196,171 | 83,098 | 83,098 | |||||||||||||
| Short-term debt (note 19) | Level 2 | 22,437 | 22,437 | 12,350 | 12,350 | |||||||||||||
Current portion of long-term debt (note 19) | Level 2 | - | - | 43,348 | 43,348 | |||||||||||||
| Long-term debt (note 19) | Level 2 | 102,728 | 104,585 | 54,567 | 56,126 | |||||||||||||
The carrying value of the Company‘s cash and cash equivalents, restricted cash, trade and other current receivables, advances against auction contracts, auction proceeds payable, trade and other payables, short-term debt, and current portion of long-term debt approximate their fair values due to their short terms to maturity. The fair values of the Company’s long-term debt are determined through the calculation of each liability‘s present value using market rates of interest at period close.
| 13. | Inventory |
At each period end, inventory is reviewed to ensure that it is recorded at the lower of cost and net realizable value. During the three and six months ended June 30, 2016, the Company recorded an inventory write-down of $1,402,000 (2015: $253,000 and $313,000). No write down was recorded during the three months ended March 31, 2016.
| Ritchie Bros. | 21 |
| Notes to the Condensed Consolidated Financial Statements |
| (Tabular amounts expressed in thousands of United States dollars, except where noted) |
| (Unaudited) |
| 13. | Inventory (continued) |
Of inventory held at June 30, 2016, 99% is expected to be sold prior to the end of September 2016, with the remainder to be sold by the end of November 2016 (December 31, 2015: 91% sold by the end of March 2016 with the remainder sold by the end of June 2016).
| 14. | Assets held for sale |
| Balance, December 31, 2015 | $ | 629 | ||
| Other | 3 | |||
| Balance, June 30, 2016 | $ | 632 |
As at June 30, 2016, the Company’s assets held for sale consisted of excess auction site acreage located in Denver, United States, and Orlando, United States. Management made the strategic decision to sell this excess acreage to maximize the Company’s return on invested capital. These land assets belong to the Core Auction reportable segment.
The properties continue to be actively marketed for sale through an independent real estate broker, and management expects the sales to be completed within 12 months of June 30, 2016.
| 15. | Property, plant and equipment |
| As at June 30, 2016 | Cost | Accumulated depreciation | Net book value | |||||||||
| Land and improvements | $ | 365,762 | $ | (58,545 | ) | $ | 307,217 | |||||
| Buildings | 260,677 | (88,403 | ) | 172,274 | ||||||||
| Yard and automotive equipment | 59,429 | (39,665 | ) | 19,764 | ||||||||
| Computer software and equipment | 66,355 | (57,332 | ) | 9,023 | ||||||||
| Office equipment | 23,358 | (16,771 | ) | 6,587 | ||||||||
| Leasehold improvements | 21,507 | (13,227 | ) | 8,280 | ||||||||
| Assets under development | 6,184 | - | 6,184 | |||||||||
| $ | 803,272 | $ | (273,943 | ) | $ | 529,329 | ||||||
| As at December 31, 2015 | Cost | Accumulated depreciation | Net book value | |||||||||
| Land and improvements | $ | 356,905 | $ | (54,551 | ) | $ | 302,354 | |||||
| Buildings | 254,760 | (82,100 | ) | 172,660 | ||||||||
| Yard and automotive equipment | 59,957 | (38,848 | ) | 21,109 | ||||||||
| Computer software and equipment | 60,586 | (50,754 | ) | 9,832 | ||||||||
| Office equipment | 22,432 | (15,660 | ) | 6,772 | ||||||||
| Leasehold improvements | 20,893 | (12,160 | ) | 8,733 | ||||||||
| Assets under development | 7,131 | - | 7,131 | |||||||||
| $ | 782,664 | $ | (254,073 | ) | $ | 528,591 | ||||||
| Ritchie Bros. | 22 |
| Notes to the Condensed Consolidated Financial Statements |
| (Tabular amounts expressed in thousands of United States dollars, except where noted) |
| (Unaudited) |
| 16. | Intangible assets |
| As at June 30, 2016 | Cost | Accumulated amortization | Net book value | |||||||||
| Trade names and trademarks | $ | 4,910 | $ | - | $ | 4,910 | ||||||
| Customer relationships | 32,686 | (8,396 | ) | 24,290 | ||||||||
| Software | 29,901 | (9,603 | ) | 20,298 | ||||||||
| Software under development | 16,364 | - | 16,364 | |||||||||
| $ | 83,861 | $ | (17,999 | ) | $ | 65,862 | ||||||
| As at December 31, 2015 | Cost | Accumulated amortization | Net book value | |||||||||
| Trade names and trademarks | $ | 800 | $ | - | $ | 800 | ||||||
| Customer relationships | 22,800 | (7,097 | ) | 15,703 | ||||||||
| Software | 23,269 | (5,848 | ) | 17,421 | ||||||||
| Software under development | 13,049 | - | 13,049 | |||||||||
| $ | 59,918 | $ | (12,945 | ) | $ | 46,973 | ||||||
During the three and six months ended June 30, 2016, interest of $97,000 and $177,000, respectively was capitalized to the cost of software under development (2015: $212,000 and $513,000). These interest costs relating to qualifying assets are capitalized at a weighted average rate of 6.01% (2015: 6.39%).
| 17. | Goodwill |
| Balance, December 31, 2015 | $ | 91,234 | ||
| Additions (note 23) | 19,739 | |||
| Foreign exchange movement | 603 | |||
| Balance, June 30, 2016 | $ | 111,576 |
| 18. | Equity-accounted investments |
The Company holds a 48% share interest in a group of companies detailed below (together, the Cura Classis entities), which have common ownership. The Cura Classis entities provide dedicated fleet management services in three jurisdictions to a common customer unrelated to the Company. The Company has determined the Cura Classis entities are variable interest entities and the Company is not the primary beneficiary, as it does not have the power to make any decisions that significantly affect the economic results of the Cura Classis entities. Accordingly, the Company accounts for its investments in the Cura Classis entities following the equity method.
| Ritchie Bros. | 23 |
| Notes to the Condensed Consolidated Financial Statements |
| (Tabular amounts expressed in thousands of United States dollars, except where noted) |
| (Unaudited) |
| 18. | Equity-accounted investments (continued) |
A condensed summary of the Company's investments in and advances to equity-accounted investees are as follows (in thousands of U.S. dollars, except percentages):
| Ownership | June 30, | December 31, | ||||||||||
| percentage | 2016 | 2015 | ||||||||||
| Cura Classis entities | 48 | % | $ | 4,611 | $ | 3,487 | ||||||
| Other equity investments | 32 | % | 2,880 | 3,000 | ||||||||
| 7,491 | 6,487 | |||||||||||
As a result of the Company’s investments, the Company is exposed to risks associated with the results of operations of the Cura Classis entities. The Company has no other business relationships with the Cura Classis entities. The Company’s maximum risk of loss associated with these entities is the investment carrying amount.
| 19. | Debt |
| Carrying value | ||||||||
| June 30, | December 31, | |||||||
| 2016 | 2015 | |||||||
| Short-term debt | $ | 22,437 | $ | 12,350 | ||||
| Long-term debt: | ||||||||
| Term loan, denominated in Canadian dollars, unsecured, bearing interest at 4.225%, due in quarterly installments of interest only, with the full amount of the principal due in May 2022. | 26,306 | 24,567 | ||||||
| Term loan, denominated in United States dollars, unsecured, bearing interest at 3.59%, due in quarterly installments of interest only, with the full amount of the principal due in May 2022. | 30,000 | 30,000 | ||||||
| Revolving loan, denominated in Canadian dollars, unsecured, bearing interest at a weighted average rate of 1.75%, due in monthly installments of interest only, with the committed, revolving credit facility available until May 2018. | 46,422 | - | ||||||
| Term loan, denominated in Canadian dollars, unsecured, bearing interest at 6.385%, due in quarterly installments of interest only, with the full amount of the principal due in May 2016. | - | 43,348 | ||||||
| 102,728 | 97,915 | |||||||
| Total debt | $ | 125,165 | $ | 110,265 | ||||
| Total long-term debt: | ||||||||
| Current portion | $ | - | $ | 43,348 | ||||
| Non-current portion | 102,728 | 54,567 | ||||||
| $ | 102,728 | $ | 97,915 | |||||
| Ritchie Bros. | 24 |
| Notes to the Condensed Consolidated Financial Statements |
| (Tabular amounts expressed in thousands of United States dollars, except where noted) |
| (Unaudited) |
| 19. | Debt (continued) |
At December 31, 2015, the current portion of long-term debt consisted of a Canadian dollar 60,000,000 term loan under the Company’s uncommitted, revolving credit facility. The Company refinanced this term loan on a long-term basis when it fell due on May 4, 2016 by drawing on its committed, revolving credit facility.
Short-term debt at June 30, 2016 is comprised of drawings in different currencies on the Company’s committed revolving credit facilities of $313,323,000 (December 31, 2015: $312,693,000), and have a weighted average interest rate of 1.8% (December 31, 2015: 1.8%).
As at June 30, 2016, the Company had available committed revolving credit facilities aggregating $244,373,000, of which $156,051,000 is available until May 2018. The Company also had available uncommitted credit facilities aggregating $222,221,000, of which $168,694,000 expires November 2017. The Company has a committed seasonal bulge credit facility of $50,000,000, which is available in February, March, August and September until May 2018. This bulge credit facility is not included in the available credit facilities totals above as at June 30, 2016.
| 20. | Equity and dividends |
Share capital
Preferred stock
Unlimited number of senior preferred shares, without par value, issuable in series.
Unlimited number of junior preferred shares, without par value, issuable in series.
All issued shares are fully paid. No preferred shares have been issued.
Share repurchase
During March 2016, 1,460,000 common shares (March 2015: 1,900,000) were repurchased at a weighted average (“WA”) share price of $25.16 (2015: $24.98) per common share. The repurchased shares were cancelled on March 15, 2016 (2015: March 26, 2015). There were no share repurchases during the three months ended June 30, 2016 and 2015.
Dividends
Declared and paid
The Company declared and paid the following dividends during the three and six months ended June 30, 2016 and 2015:
| Declaration date | Dividend per share | Record date | Total dividends | Payment date | ||||||||||
| Six months ended June 30, 2016: | ||||||||||||||
| Fourth quarter 2015 | January 15, 2016 | $ | 0.1600 | February 12, 2016 | $ | 17,154 | March 4, 2016 | |||||||
| First quarter 2016 | May 9, 2016 | 0.1600 | May 24, 2016 | 17,022 | June 14, 2016 | |||||||||
| Six months ended June 30, 2015: | ||||||||||||||
| Fourth quarter 2014 | January 12, 2015 | $ | 0.1400 | February 13, 2015 | $ | 15,089 | March 6, 2015 | |||||||
| First quarter 2015 | May 7, 2015 | 0.1400 | May 29, 2015 | 14,955 | June 19, 2015 | |||||||||
| Ritchie Bros. | 25 |
| Notes to the Condensed Consolidated Financial Statements |
| (Tabular amounts expressed in thousands of United States dollars, except where noted) |
| (Unaudited) |
| 20. | Equity and dividends (continued) |
Dividends (continued)
Declared and undistributed
Subsequent to June 30, 2016, the Company’s Board of Directors declared a quarterly dividend of $0.17 cents per common share, payable on September 23, 2016 to stockholders of record on September 2, 2016. This dividend payable has not been recognized as a liability in the financial statements. The payment of this dividend will not have any tax consequence for the Company.
Foreign currency translation reserve
Foreign currency translation adjustments include intra-entity foreign currency transactions that are of a long-term investment nature, which generated net losses of $271,000 and net gains of $8,611,000 for the three and six months ended June 30, 2016, respectively (2015: net gains of $2,926,000 and net losses of $11,527,000).
| 21. | Share-based payments |
Share-based payments consist of the following compensation costs recognized in selling, general and administrative expenses:
| Three months ended | Six months ended | |||||||||||||||
| June 30, | June 30, | |||||||||||||||
| 2016 | 2015 | 2016 | 2015 | |||||||||||||
| Stock option compensation expense | $ | 1,400 | $ | 1,333 | $ | 2,470 | $ | 2,056 | ||||||||
| Share unit expense: | ||||||||||||||||
| Equity-classified PSUs | 486 | - | 486 | - | ||||||||||||
| Liability-classified share units | 5,508 | 2,902 | 6,780 | 3,919 | ||||||||||||
| Employee share purchase plan - employer contributions | 396 | 323 | 749 | 631 | ||||||||||||
| $ | 7,790 | $ | 4,558 | $ | 10,485 | $ | 6,606 | |||||||||
Stock option plan
The Company has a stock option plan that provides for the award of stock options to selected employees, directors and officers of the Company.
| Ritchie Bros. | 26 |
| Notes to the Condensed Consolidated Financial Statements |
| (Tabular amounts expressed in thousands of United States dollars, except where noted) |
| (Unaudited) |
| 21. | Share-based payments (continued) |
Stock option plan (continued)
Stock option activity for the six months ended June 30, 2016 and the year ended December 31, 2015 is presented below:
| WA | ||||||||||||||||
| Common | WA | remaining | Aggregate | |||||||||||||
| shares under | exercise | contractual | intrinsic | |||||||||||||
| option | price | life (in years) | value | |||||||||||||
| Outstanding, December 31, 2014 | 3,897,791 | 22.09 | ||||||||||||||
| Granted | 880,706 | 25.50 | ||||||||||||||
| Exercised | (1,412,535 | ) | 21.11 | $ | 9,426 | |||||||||||
| Forfeited | (89,884 | ) | 23.10 | |||||||||||||
| Outstanding, December 31, 2015 | 3,276,078 | 23.40 | ||||||||||||||
| Granted | 1,237,633 | 24.25 | ||||||||||||||
| Exercised | (806,569 | ) | 22.39 | $ | 5,774 | |||||||||||
| Forfeited | (65,259 | ) | 24.32 | |||||||||||||
| Outstanding, June 30, 2016 | 3,641,883 | $ | 23.90 | 7.8 | $ | 35,992 | ||||||||||
| Exercisable, June 30, 2016 | 1,433,078 | $ | 22.84 | 5.8 | $ | 15,675 | ||||||||||
The fair value of the stock option grants is estimated on the date of the grant using the Black-Scholes option pricing model. The significant assumptions used to estimate the fair value of stock options granted during the six months ended June 30, 2016 and 2015 are presented in the following table on a weighted average basis:
| Six months ended June 30, | 2016 | 2015 | ||||||
| Risk free interest rate | 1.2 | % | 1.8 | % | ||||
| Expected dividend yield | 2.66 | % | 2.18 | % | ||||
| Expected lives of the stock options | 5 years | 5 years | ||||||
| Expected volatility | 26.5 | % | 26.3 | % | ||||
Risk free interest rate is the US Treasury Department five year treasury yield curve rate on the date of the grant. Expected dividend yield assumes a continuation of the most recent quarterly dividend payments. Expected life of options is based on the age of the options on the exercise date over the past 25 years. Expected volatility is based on the historical common share price volatility over the past five years.
The compensation expense arising from option grants is amortized over the relevant vesting periods of the underlying options. As at June 30, 2016, the unrecognized stock-based compensation cost related to the non-vested stock options was $6,866,000, which is expected to be recognized over a weighted average period of 2.5 years.
| Ritchie Bros. | 27 |
| Notes to the Condensed Consolidated Financial Statements |
| (Tabular amounts expressed in thousands of United States dollars, except where noted) |
| (Unaudited) |
| 21. | Share-based payments (continued) |
Share unit plans
Share unit activity for the six months ended June 30, 2016 and the year ended December 31, 2015 is presented below:
| Equity-classified awards | Liability-classified awards | |||||||||||||||||||||||||||||||
| PSUs | PSUs (1) | Restricted share units | DSUs | |||||||||||||||||||||||||||||
| WA grant | WA grant | WA grant | WA grant | |||||||||||||||||||||||||||||
| date fair | date fair | date fair | date fair | |||||||||||||||||||||||||||||
| Number | value | Number | value | Number | value | Number | value | |||||||||||||||||||||||||
| Outstanding, December 31, 2014 | - | $ | - | 238,573 | $ | 23.38 | 403,587 | $ | 22.32 | 42,289 | $ | 22.33 | ||||||||||||||||||||
| Granted | - | - | 218,699 | 24.57 | 20,528 | 26.38 | 29,072 | 26.07 | ||||||||||||||||||||||||
| Vested and settled | - | - | (6,870 | ) | 22.22 | (28,887 | ) | 22.53 | (13,365 | ) | 22.34 | |||||||||||||||||||||
| Forfeited | - | - | (28,817 | ) | 23.23 | (62,274 | ) | 21.56 | - | - | ||||||||||||||||||||||
| Outstanding, December 31, 2015 | - | $ | - | 421,585 | $ | 24.03 | 332,954 | $ | 22.70 | 57,996 | $ | 24.21 | ||||||||||||||||||||
| Granted | 5,288 | 29.66 | 248,910 | 23.32 | 3,033 | 25.92 | 9,714 | 26.08 | ||||||||||||||||||||||||
| Transferred to (from) equity awards on modification | 257,934 | 27.34 | (257,934 | ) | 23.86 | - | - | - | - | |||||||||||||||||||||||
| Vested and settled | - | - | (41,898 | ) | 22.17 | (157,406 | ) | 22.11 | (1,847 | ) | 25.28 | |||||||||||||||||||||
| Forfeited | - | - | (31,089 | ) | 22.65 | (8,944 | ) | 22.61 | - | - | ||||||||||||||||||||||
| Outstanding, June 30, 2016 | 263,222 | $ | 27.39 | 339,574 | $ | 23.99 | 169,637 | $ | 23.31 | 65,863 | $ | 24.45 | ||||||||||||||||||||
| (1) | Liability-classified PSUs include PSUs awarded under the employee PSU plan, the sign-on grant PSU plan, and other PSUs plans in place prior to 2015 that are cash-settled and not subject to market vesting conditions. |
As at June 30, 2016, the unrecognized share unit expense related to equity-classified PSUs was $6,432,000, which is expected to be recognized over a weighted average period of 2.2 years. The unrecognized share unit expense related to liability-classified PSUs was $8,044,000, which is expected to be recognized over a weighted average period of 2.2 years. The unrecognized share unit expense related to liability-classified restricted share units (“RSUs”) was $1,479,000, which is expected to be recognized over a weighted average period of 0.9 years. There is no unrecognized share unit expense related to liability-classified DSUs as they vest immediately upon grant.
Senior executive and employee PSU plans
In 2015 and 2016, the Company granted share units under two new PSU plans, a senior executive PSU plan and an employee PSU plan (the “new plans”). Under the new plans, the number of PSUs that vest is conditional upon specified market, service, and performance vesting conditions being met. The market vesting condition is based on the relative performance of the Company’s share price in comparison to the performance of a pre-determined portfolio of other companies’ share prices. The non-market vesting conditions are based on the achievement of specific performance measures and can result in participants earning between 0% and 200% of the target number of PSUs granted.
Prior to May 2, 2016, the Company was only able to settle the PSU awards under the new plans in cash, and as such, both new plans were classified as liability awards. On May 2, 2016 (the “modification date”), the shareholders approved amendments to the new plans, allowing the Company to choose whether to settle the awards in cash or in shares. With respect to settling in shares, the new settlement options allow the Company to either (i) arrange for the purchase shares on the open market on the employee’s behalf based on the cash value that otherwise would be delivered, or (ii) to issue a number of shares equal to the number of units that vest.
| Ritchie Bros. | 28 |
| Notes to the Condensed Consolidated Financial Statements |
| (Tabular amounts expressed in thousands of United States dollars, except where noted) |
| (Unaudited) |
| 21. | Share-based payments (continued) |
Share unit plans (continued)
Senior executive and employee PSU plans (continued)
Under the first option, the shareholders authorized an unlimited number of open-market purchases of common shares for settlement of the PSUs. Under the second option, the shareholders authorized 1,000,000 shares to be issued for settlement of the PSUs.
On the modification date, the employee PSU plan remained classified as a liability and the senior executive PSU plan awards were reclassified to equity awards, based on the Company’s settlement intentions for each plan. The fair value of the senior executive awards outstanding on the modification date was $27.34. The share unit liability, representing the portion of the fair value attributable to past service, was $2,105,000, which was reclassified to equity on that date. No incremental compensation was recognized as a result of the modification. Unrecognized compensation expense based on the fair value of the senior executive PSU awards on the modification date will be amortized over the remaining service period.
Because the PSUs awarded under the new plans are contingently redeemable in cash in the event of death of the participant, on the modification date, the Company reclassified $2,175,000 to temporary equity, representing the portion of the contingent redemption amount of the senior executive PSU awards as if redeemable on May 2, 2016, to the extent attributable to prior service.
PSUs awarded under the new plans are subject to market vesting conditions. The fair value of the liability-classified PSUs awarded under the employee PSU plan is estimated on the date of grant and at each reporting date using a binomial model. The significant assumptions used to estimate the fair value of the liability-classified PSUs awarded under the employee PSU plan during the six months ended June 30, 2016 and 2015 are presented in the following table on a weighted average basis:
| Six months ended June 30, | 2016 | 2015 | ||||||
| Risk free interest rate | 1.2 | % | 1.3 | % | ||||
| Expected dividend yield | 2.49 | % | 2.17 | % | ||||
| Expected lives of the PSUs | 3 years | 3 years | ||||||
| Expected volatility | 29.9 | % | 29.4 | % | ||||
| Average expected volatility of comparable companies | 37.0 | % | 32.8 | % | ||||
Risk free interest rate is estimated using Bloomberg’s U.S. dollar Swap Rate as of the valuation date. Expected dividend yield assumes a continuation of the most recent quarterly dividend payments. Given the limited historical information available for the PSUs, the Company estimated the expected life of PSUs with reference to the expected life of stock options. Stock options have five-year expected lives, whereas PSUs vest after three years. As such, the Company estimates the expected life of the PSUs to equal the three-year vesting period. Expected volatility is estimated from Bloomberg’s volatility surface of the common shares as of the valuation date.
The fair value of the equity-classified PSUs was estimated on the modification date using the same binomial model and the same significant assumptions as the liability-classified PSUs during the six months ended June 30, 2016.
Sign-on grant PSUs
On August 11, 2014, the Company awarded 102,375 one-time sign-on grant PSUs (the “SOG PSUs”). The SOG PSUs are cash-settled and subject to market vesting conditions related to the Company’s share performance over rolling two, three, four, and five-year periods.
| Ritchie Bros. | 29 |
| Notes to the Condensed Consolidated Financial Statements |
| (Tabular amounts expressed in thousands of United States dollars, except where noted) |
| (Unaudited) |
| 21. | Share-based payments (continued) |
Share unit plans (continued)
SOG PSUs (continued)
The fair value of the liability-classified SOG PSUs is estimated on the date of grant and at each reporting date using a binomial model. The significant assumptions used to estimate the fair value of the SOG PSUs during the six months ended June 30, 2016 and 2015 are presented in the following table on a weighted average basis:
| Six months ended June 30, | 2016 | 2015 | ||||||
| Risk free interest rate | 0.9 | % | 1.5 | % | ||||
| Expected dividend yield | 2.31 | % | 2.07 | % | ||||
| Expected volatility | 28.3 | % | 35.2 | % | ||||
Risk free interest rate is estimated using Bloomberg’s U.S. dollar Swap Rate as of the valuation date. Expected dividend yield assumes a continuation of the most recent quarterly dividend payments. Given the limited historical information available for the SOG PSUs, the Company estimated the expected life of PSUs with reference to the expected life of stock options. Stock options have five-year expected lives. Comparatively, the SOG PSUs vest in four tranches with the last tranche vesting five years after the grant date. As such, the Company estimates the expected lives of each tranche of SOG PSUs to equal the respective vesting period for the tranche, which is two, three, four, or five years. Expected volatility is estimated from Bloomberg’s volatility surface of the common shares as of the valuation date.
Other PSUs
The Company also has other liability-classified PSUs granted under plans in place prior to 2015 that are cash-settled and not subject to market vesting conditions. The fair values of these liability-classified PSUs is estimated on grant date and at each reporting date using the 20-day volume weighted average price of the Company’s common shares listed on the New York Stock Exchange.
RSUs and DSUs
The Company has RSU and DSU plans that are cash-settled and not subject to market vesting conditions. Fair values of share units under these plans are estimated on grant date and at each reporting date using the 20-day volume weighted average price of the Company’s common shares listed on the New York Stock Exchange. DSUs are granted under the DSU plan to members of the Board of Directors.
Employee share purchase plan
The Company has an employee share purchase plan that allows all employees that have completed 60 days of service to contribute funds to purchase common shares at the current market value at the time of share purchase. Employees may contribute up to 4% of their salary. The Company will match between 50% and 100% of the employee‘s contributions, depending on the employee‘s length of service with the Company.
| 22. | Contingencies |
Legal and other claims
The Company is subject to legal and other claims that arise in the ordinary course of its business. The Company does not believe that the results of these claims will have a material effect on the Company’s balance sheet or income statement.
Guarantee contracts
In the normal course of business, the Company will in certain situations guarantee to a consignor a minimum level of proceeds in connection with the sale at auction of that consignor’s equipment.
| Ritchie Bros. | 30 |
| Notes to the Condensed Consolidated Financial Statements |
| (Tabular amounts expressed in thousands of United States dollars, except where noted) |
| (Unaudited) |
| 22. | Contingencies (continued) |
Guarantee contracts (continued)
At June 30, 2016 there was $37,318,000 of industrial assets guaranteed under contract, of which 100% is expected to be sold prior to the end of September 2016 (December 31, 2015: $25,267,000 of which 100% was expected to be sold prior to the end of May 2016).
At June 30, 2016 there was $19,956,000 of agricultural assets guaranteed under contract, of which 86% is expected to be sold prior to the end of September 2016 (December 31, 2015: $30,509,000 of which 100% was expected to be sold prior to the end of August 2016).
The outstanding guarantee amounts are undiscounted and before estimated proceeds from sale at auction.
| 23. | Business combinations |
| (a) | Mascus acquisition |
On February 19, 2016 (the “Mascus Acquisition Date”), the Company acquired 100% of the issued and outstanding shares of Mascus International Holdings BV (“Mascus”), for cash consideration of €26,553,000 ($29,580,000). In addition to cash consideration, €3,080,000 ($3,431,000) of consideration is contingent on Mascus achieving certain operating performance targets over the three-year period following acquisition. Mascus is based in Amsterdam and provides an online equipment listing service for used heavy machines and trucks. The acquisition expands the breadth and depth of equipment disposition and management solutions the Company can offer its customers.
The acquisition was accounted for in accordance with ASC 805. The assets acquired and liabilities assumed were recorded at their estimated fair values at the Mascus Acquisition Date. Goodwill of $19,739,000 was calculated as the fair value of consideration over the estimated fair value of the net assets acquired.
Mascus provisional purchase price allocation
| February 19, 2016 | ||||
| Purchase price | $ | 29,580 | ||
| Fair value of contingent consideration | 3,431 | |||
| Non-controlling interests (1) | 596 | |||
| Total fair value at Mascus Acquisition Date | 33,607 | |||
| Fair value of assets acquired: | ||||
| Cash and cash equivalents | $ | 1,457 | ||
| Trade and other receivables | 1,290 | |||
| Prepaid expenses | 453 | |||
| Property, plant and equipment | 104 | |||
| Intangible assets (2) | 14,817 | |||
| Fair value of liabilities assumed: | ||||
| Trade and other payables | 1,533 | |||
| Other non-current liabilities | 37 | |||
| Deferred tax liabilities | 2,683 | |||
| Fair value of identifiable net assets acquired | 13,868 | |||
| Goodwill acquired on acquisition | $ | 19,739 | ||
| Ritchie Bros. | 31 |
| Notes to the Condensed Consolidated Financial Statements |
| (Tabular amounts expressed in thousands of United States dollars, except where noted) |
| (Unaudited) |
| 23. | Business combinations (continued) |
| (a) | Mascus acquisition (continued) |
| (1) | The Company acquired 100% of Mascus and within the Mascus group of entities there were two subsidiaries that were not wholly-owned, one domiciled in the United States and one domiciled in Denmark. As such, the Company acquired non-controlling interests. The fair value of each non-controlling interest was determined using an income approach based on cash flows of the respective entities that were attributable to the non-controlling interest. On May 27, 2016, Ritchie Bros. Holdings (America) Inc. acquired the remaining issued and outstanding shares of the Mascus subsidiary domiciled in the United States for cash consideration of $226,000. |
| (2) | Intangible assets consist of customer relationships with estimated useful lives of 17 years, indefinite-lived trade names, and software assets with estimated useful lives of five years. |
The amounts included in the Mascus provisional purchase price allocation are preliminary in nature and are subject to adjustment as additional information is obtained about the facts and circumstances that existed as of the Mascus Acquisition Date. The final determination of the fair values of certain assets and liabilities will be completed within the measurement period of up to one year from the Mascus Acquisition Date. Adjustments to the preliminary values during the measurement period will be recorded in the operating results of the period in which the adjustments are determined. Changes to the amounts recorded as assets and liabilities will result in a corresponding adjustment to goodwill.
Goodwill
Goodwill has been allocated entirely to the Mascus reporting unit based on an analysis of the fair value of assets acquired. The main drivers generating goodwill are the anticipated synergies from (1) the Company's core auction expertise and transactional capabilities to Mascus' existing customer base, and (2) Mascus' providing existing technology to the Company's current customer base. Other factors generating goodwill include the acquisition of Mascus' assembled work force and their associated technical expertise.
Contributed revenue and net income
The results of Mascus’ operations are included in these condensed consolidated financial statements from Mascus’ Acquisition Date. For the three months ended June 30, 2016, and for the period from February 19, 2016 to June 30, 2016, Mascus’ contribution to the Company’s revenues was $2,037,000 and $3,305,000, respectively. Mascus’ contribution to net income during those periods was insignificant. Pro forma results of operations have not been presented as such pro forma financial information would not be materially different from historical results.
Contingent Consideration
The Company may pay an additional amount not exceeding €3,080,000 ($3,432,000) contingent upon the achievement of certain operating performance targets over the next three-year period. The Company has recognized a liability equal to the estimated fair value of the contingent payments the Company expects to make as of the acquisition date. The Company will re-measure this liability each reporting period and record changes in the fair value in the consolidated income statement. There was no change in the fair value in the three months ended June 30, 2016.
Transactions recognized separately from the acquisition of assets and assumptions of liabilities
Acquisition-related costs
Expenses totalling $749,000 for legal and other acquisition-related costs are included in the condensed consolidated income statement for the period ended June 30, 2016.
Employee compensation in exchange for continued services
The Company may pay additional amounts not exceeding €1,625,000 ($1,849,000) over three-year periods based on key employees’ continuing employment with Mascus.
| Ritchie Bros. | 32 |
| Notes to the Condensed Consolidated Financial Statements |
| (Tabular amounts expressed in thousands of United States dollars, except where noted) |
| (Unaudited) |
| 23. | Business combinations (continued) |
| (b) | Xcira acquisition |
On November 4, 2015 (the “Xcira Acquisition Date”), the Company acquired 75% of the issued and outstanding shares of Xcira LLC (“Xcira”) for cash consideration of $12,359,000. The remaining 25% interests remain with the two founders of Xcira. Xcira is a Florida-based company, incorporated in the United States and its principal activity is the provision of software and technology solutions to auction companies. By acquiring Xcira, the Company acquired information technology capability and platform to build on its strong online bidding customer experience, and further differentiate itself from other industrial auction companies.
The Company has the option to buy out the remaining interest of the Xcira sellers subject to the terms of the Xcira Purchase Agreement. The acquisition was accounted for in accordance with ASC 805. The assets acquired, liabilities assumed, and the non-controlling interest were recorded at their estimated fair values at the Xcira Acquisition Date. Full goodwill of $10,659,000 was calculated as the fair value of consideration over the estimated fair value of the net assets acquired.
Xcira final purchase price allocation
| November 4, 2015 | ||||
| Purchase price | $ | 12,359 | ||
| Non-controlling interest | 4,119 | |||
| Total fair value at Xcira acquisition date | 16,478 | |||
| Assets acquired: | ||||
| Cash and cash equivalents | $ | 252 | ||
| Trade and other receivables | 1,382 | |||
| Prepaid expenses | 62 | |||
| Property, plant and equipment | 314 | |||
| Other non-current assets | 11 | |||
| Intangible assets ~ | 4,300 | |||
| Liabilities assumed: | ||||
| Trade and other payables | 502 | |||
| Fair value of identifiable net assets acquired | 5,819 | |||
| Goodwill acquired on acquisition | $ | 10,659 | ||
~Consists of existing technology and customer relationships with an amortization life of five and 20 years, respectively
There was no contingent consideration under the terms of the acquisition, and as such no acquisition provisions were created.
Assets acquired and liabilities assumed
At the date of acquisition, the carrying values of the assets and liabilities acquired approximated their fair values, except intangible assets, whose fair values were determined using appropriate valuation techniques.
Goodwill
Goodwill has been allocated entirely to the Company’s Core Auction segment and based on an analysis of the fair value of assets acquired. The main drivers generating goodwill are the Company’s ability to utilize Xcira’s experience to differentiate the Company’s online bidding service from other industrial auction companies, as well as to secure Xcira’s bidding technology. Online bidding represents a significant and growing portion of all bidding conducted at the Company’s auctions.
| Ritchie Bros. | 33 |
| Notes to the Condensed Consolidated Financial Statements |
| (Tabular amounts expressed in thousands of United States dollars, except where noted) |
| (Unaudited) |
| 23. | Business combinations (continued) |
| (b) | Xcira acquisition (continued) |
Non-controlling interests
The fair value of the 25% non-controlling interest in Xcira is estimated to be $4,119,000.
Contributed revenue and net income
The results of Xcira’s operations are included in these condensed consolidated financial statements from the date of acquisition. For the three and six months ended June 30, 2016, Xcira recorded revenues of $2,204,000 and $4,297,000, respectively, and net income of $453,000 and $922,000, respectively. On consolidation, $1,020,000 and $1,862,000 of inter-entity revenues recorded by Xcira during the three and six months ended June 30, 2016, respectively, were eliminated against the same amounts of inter-entity expenses recorded by another subsidiary within the wholly-owned group.
Pro forma results of operations have not been presented as such pro forma financial information would not be materially different from historical results.
Future development of internally-generated software
The Company may pay an additional amount not exceeding $2,700,000 over a two-year period upon achievement of certain conditions related to the delivery of an upgrade to its existing technology.
Employee compensation in exchange for continued services
The Company may pay an additional amount not exceeding $2,000,000 over a three-year period based on the Founder’s continuing employment with Xcira.
| 24. | Subsequent event |
On July 12, 2016, the acquisition of the NCI holders’ 49% interest in RBFS was completed (note 9).
On August 1, 2016, the Company acquired 100% of the assets of Petrowsky Auctioneers, a Connecticut-based company that conducts auctions mainly in the New England, United States region, for cash consideration of $7,000,000. The Company is obligated to pay an additional amount not exceeding $3,000,000 upon achievement of certain conditions by the third anniversary date of the acquisition.
| Ritchie Bros. | 34 |
| ITEM 2: | MANAGEMENT’S DISCUSSION AND ANALYSIS OF FINANCIAL CONDITION AND RESULTS OF OPERATIONS |
About Us
Ritchie Bros. Auctioneers Incorporated (“Ritchie Bros.”, the “Company”, “we”, or “us”) (NYSE & TSX: RBA) is the world leader for the exchange of used equipment. Our expertise, global reach, market insight and trusted brand provide us with a unique and leading position in the used equipment market. We primarily sell equipment for our customers through unreserved auctions held on a worldwide basis. In addition, during 2013 we launched EquipmentOne, an online used equipment marketplace, to reach a broader customer base. These two complementary exchange solutions provide different value propositions to equipment owners and allow us to meet the needs and preferences of a wide spectrum of equipment sellers.
Ritchie Bros. focuses on the sale of heavy machinery. Through our unreserved auctions and online marketplaces, we sell a broad range of used and unused industrial assets, including equipment and other assets used in the construction, agricultural, transportation, energy, mining, forestry, material handling and marine industries. The majority of the assets sold through our sales channels represent construction machinery.
We operate from 45 permanent and regional auction sites in over 15 countries worldwide. Our world headquarters are located in Burnaby, Canada.
On November 4, 2015, we acquired a 75% interest in Xcira LLC (“Xcira”), a Florida-based company specializing in software and technology solutions related to online auction bidding and sales. Ritchie Bros. was one of Xcira’s first customers, and has worked very closely with Xcira over the past 14 years to customize Xcira’s solutions to meet our needs. Xcira primarily operates in the industrial auction space, but also offers solutions to auto, art, and other luxury item auctioneers.
On February 19, 2016, we acquired a 100% interest in Mascus International Holding BV (“Mascus”), an Amsterdam-based company that operates a global online portal for the sale and purchase of heavy equipment and vehicles, with the largest online market presence in Europe for heavy machinery and trucks. Mascus offers subscriptions to equipment dealers, brokers, exporters and equipment manufacturers to list equipment available for sale. In addition to online listing services, they also provide online advertising services, business tools, and other software solutions to many of the world’s leading equipment dealerships and equipment manufacturers. Founded in Scandinavia, Mascus has grown rapidly over the past 15 years and now includes operations across Europe, Asia, Africa, and North America, catering to the construction, transport, agriculture, material handling, forestry, and grounds-care industries.
On July 12, 2016, we completed our acquisition of the 49% non-controlling interest in Ritchie Bros. Financial Services (“RBFS”). RBFS provides equipment buyers with the confidence to make offers on equipment, trucks and other industrial assets, with pre-approved loans and financing arrangements. The business finances all brands of equipment and provides equipment buyers with the option to purchase assets at Ritchie Bros. auctions, Ritchie Bros. EquipmentOne, or through other sales channels. RBFS has arrangements with a diverse group of financial partners to provide lending solutions that meet the specific needs of equipment owners and dealers. Services offered include pre-approved commercial equipment financing, re-financing, and leasing, as well as equipment dealer financing.
Also on July 12, 2016, we announced our minority investment in Machinio Corp. (“Machinio”), a global search engine for finding, buying, and selling used machinery and equipment. With more active listings than any other website, Machinio is the most comprehensive real-time database of for-sale listings. Machinio connects hundreds of thousands of buyers each month with thousands of used machinery dealers from all over the world. Having launched in late 2012, Machinio is now the fastest growing online platform for used machinery.
On August 1, 2016, we acquired 100% of the assets of Petrowsky Auctioneers (“Petrowsky”), a Connecticut-based company that conducts reserved auctions. Petrowsky sold nearly $50 million worth of equipment and other assets at auctions in 2015, mostly in the New England, United States region.
| Ritchie Bros. | 35 |
Overview
The following discussion and analysis summarizes significant factors affecting our consolidated operating results and financial condition for the three and six months ended June 30, 2016 and 2015. This discussion and analysis contains forward-looking statements that involve risks and uncertainties. Our actual results could differ materially from those expressed or implied in any forward-looking statements as a result of various factors, including those set forth under “Part I, Item 1A: Risk Factors” in our Annual Report on Form 10-K for the year ended December 31, 2015, which is available on our website at www.rbauction.com, on EDGAR at www.sec.gov, or on SEDAR at www.sedar.com.
This discussion and analysis should be read in conjunction with the “Cautionary Note Regarding Forward-Looking Statements” and the consolidated financial statements and the notes thereto included in “Part I, Item 1: Consolidated Financial Statements” of this Form 10-Q. The following discussion should also be read in conjunction with our Annual Report on Form 10-K for the year ended December 31, 2015. None of the information on our website, EDGAR, or SEDAR is incorporated by reference into this document by this or any other reference.
We prepare our consolidated financial statements in accordance with United States generally accepted accounting principles (“US GAAP”). Except for Gross Auction Proceeds (“GAP”) and Gross Transaction Value (“GTV”) (both described below), which are measures of operational performance and not measures of financial performance, liquidity, or revenue, the amounts discussed below are based on our consolidated financial statements and are presented in United States (“U.S.”) dollars. Unless indicated otherwise, all tabular dollar amounts, including related footnotes, presented below are expressed in thousands of dollars.
We make reference to various non-GAAP financial and performance measures throughout this discussion and analysis. These measures do not have a standardized meaning, and are therefore unlikely to be comparable to similar measures presented by other companies.
Consolidated Highlights
Key second quarter and first half 2016 financial results include:
| · | Record second quarter and first half GAP of $1.3 billion and $2.3 billion, respectively |
| · | Second quarter 2016 revenues increased 2% over second quarter 2015 |
| · | Second quarter Revenue Rate (as described below) of 12.45%, driven mostly by growing fee-based revenue streams |
| · | Costs of services and selling, general and administrative expenses grew due to newly acquired businesses, increased headcount to drive strategic initiatives, and growth in lot volume |
| · | Diluted earnings per share (“EPS”) attributable to stockholders of $0.37, a 12% decrease relative to $0.42 in the second quarter of 2015 |
| · | Increasing quarterly cash dividend by 6% to $0.17 per share |
| · | Acquisition of Petrowsky will significantly strengthen our market presence in the northeast United States |
| · | During the second quarter of 2016, for the first time in our history, more than half of our GAP was generated through online transactions |
Strategy
The following discussion highlights how we acted on the three main drivers to our strategy during the first half of 2016.
GROW Revenues and Net Income
Our revenues are comprised of:
| · | commissions earned at our auctions where we act as an agent for consignors of equipment and other assets, as well as commissions on online marketplace sales; and |
| · | fees earned in the process of conducting auctions through all our auction channels and from value-added service offerings, as well as subscription revenues from our listing and software services. |
| Ritchie Bros. | 36 |
Commissions from sales at our auctions represent the percentage we earn on GAP. GAP represents the total proceeds from all items sold at our auctions and the GTV of all items sold through our online marketplaces2. GTV represents total proceeds from all items sold at our online marketplaces, as well as a buyers’ premium component applicable only to our online marketplace transactions. The majority of commissions are earned as a pre-negotiated fixed rate of the gross selling price. Other commissions are earned from underwritten commission contracts, when we guarantee a certain level of proceeds to a consignor or purchase inventory to be sold at auction. We believe that revenues are best understood by considering their relationship to GAP. We use Revenue Rate, which is calculated by dividing revenues by GAP, to determine the amount of GAP changes that flow through to our revenues.
We achieved a record level of second quarter and first half revenues in 2016, primarily as a result of an increase in GAP combined with a strong Revenue Rate compared to 2015. Changes in our Revenue Rate are driven by fluctuations in the commissions we charge on GAP and in our fee revenues, which are not directly linked to GAP. The increase in Revenue Rate in the second quarter and first half of 2016 compared to the second quarter and first half of 2015 was primarily the result of the performance of our straight commission contracts combined with an increase in fee revenues.
We continued to see foreign currency exchange rates negatively impacting our GAP and revenues in the second quarter of 2016 compared to the second quarter of 2015, primarily due to the declining value of the Canadian dollar relative to the U.S. dollar, but ultimately having an insignificant impact on operating income as a result of the partially mitigating natural hedge we experience between our foreign-currency denominated revenues and operating expenses.
On a U.S. dollar basis, the proportion of GAP earned in Canada (33% of total GAP) grew in the first half of 2016 compared to the first half of 2015 (31% of total GAP), which is consistent with our focus on driving geographic depth in our existing geographies. The proportion of revenues attributable to Canada also grew by 82 basis points in the first half of 2016 compared to the first half of 2015.
On February 19, 2016, we acquired Mascus, a leading global online equipment listing service. The acquisition expands the breadth of equipment disposition and management solutions we can offer our customers. Mascus operates a vibrant online equipment listing service with over 360,000 items for sale and 3.3 million monthly website visits across 58 countries and in 42 languages. The business also provides equipment sellers with a turn-key suite of business tools and software solutions. Mascus customers will benefit from our deep equipment experience and extensive global buying audience, providing further global exposure for Mascus equipment listings.
On July 12, 2016, we completed our acquisition of the 49% non-controlling interest in RBFS and announced our strategic investment in Machinio. In 2015, RBFS received more than $1 billion of credit applications and facilitated $222 million in equipment financing for Ritchie Bros. customers – representing 31% growth in funded loans compared to 2014, and 116% growth compared to 2013. RBFS acts as an intermediary with select lending partners to find financing solutions for customers purchasing equipment, including loans and lease-to-own programs. RBFS does not utilize Ritchie Bros. capital in its financing activities. These corporate development initiatives are expected to help position us for future growth and further extend our involvement in the digital innovation of the equipment industry.
On August 1, 2016, we acquired Petrowsky, significantly enhancing our market presence in the New England, United States region and providing Ritchie Bros. with a new live reserve auction platform. Petrowsky’s auction sales are well aligned with Ritchie Bros.’ sector focus as they cater largely to equipment sellers in the construction and transportation industries. Petrowsky also serves customers selling assets in the underground utility, waste recycling, marine, and commercial real estate industries. The business operates one permanent auction site, in North Franklin, United States, which will continue to hold auctions, and also specializes in off-site auctions held on the land of the consignor. All Petrowksy auctions are also simulcast live online, allowing online bidders to participate.
| 2 | GAP and GTV are measures of operational performance and are not measures of our financial performance, liquidity or revenue. GAP and GTV are not presented in our consolidated income statements. We believe that comparing GAP and GTV for different financial periods provides useful information about the growth or decline of our revenue and net income for the relevant financial period. |
| Ritchie Bros. | 37 |
The Petrowsky brand will be maintained as a brand extension within the Ritchie Bros. family of brands, given its strong and loyal customer base and its offering of reserve auction options.
DRIVE Efficiencies and Effectiveness
During the first half of 2016, we initiated a revision to our short-term incentive plans for all management levels. This revision simplified the plans to focus on three rather than four financial measures. For directors and above, the revision prioritizes financial measures above individual goals, with a minimum of 70% of the short-term incentive based on financial results, as opposed to a 50% minimum. We believe that such a shift will better align employee incentives with our objective of increasing shareholder value.
In addition, we announced the following appointments, which improved the alignment of our organizational structure:
| · | Becky Alseth as Chief Marketing Officer effective January 4, 2016 |
| · | Marianne Marck as Chief Information Officer effective April 18, 2016 |
Also during the first half of 2016, we implemented a new capital expenditure approval process, which included the establishment of a Capital Committee to review and approve all significant capital information technology projects. The primary goal of the Capital Committee is to continue to control our capital expenditure, maximizing returns on information technology investments and realizing ‘quick wins’ with respect to process and customer service improvements.
During the second quarter of 2016, our first ‘quick win’ project was successfully launched. This project involved an integration of our auction site operational processes with our administrative office accounting procedures. By automating the post-sale customer receipt process, we were able to greatly reduce the amount of time and expense required to match customer receipts with sale invoices, thereby ensuring timely release of customer equipment purchased at auction. These time savings have enabled our personnel to focus on customer needs and improve the customer experience. The project qualified as a ‘quick win’ due to the minimal capital expenditure that was required, the short implementation timeframe, and the fact that it drove significant efficiencies in our post-sale processes.
During the first half of 2016, we continued to be diligent in our valuations and methodology as it pertains to sectors that continue to experience pressure, including oil and gas and mining, in order to compete effectively and grow the business in those sectors.
OPTIMIZE our Balance Sheet
On March 1, 2016, we were granted approval of a new normal course issuer bid by the Toronto Stock Exchange (“TSX”), to allow us to continue pursuing share repurchases through both the New York Stock Exchange and the TSX. We intend to continue using our share repurchase program to primarily neutralize dilution from options. In March 2016, we repurchased 1.46 million of our common shares at a total cost of $36.7 million in order to address option dilution, consistent with our capital allocation priorities.
Also during the first half of 2016, we paid dividends of $34.2 million to our stockholders. In total we returned $70.9 million to our stockholders as we executed on our capital allocation strategy during the first half of 2016. We also managed our net capital spending such that it remains well below our target of 10% of our revenues on a rolling 12-month basis. We calculate the GAAP measure, net capital spending, directly from consolidated statement of cash flows by adding property, plant and equipment additions to intangible asset additions, and subtracting proceeds on disposition of property, plant and equipment.
| Ritchie Bros. | 38 |
Used Equipment Market Update
Overall, the used equipment market was stable through the first half of 2016. However, pricing remained lower than the used equipment valuation peak that occurred in the first quarter of 2015. We continued to see performance vary among asset sectors. In particular, pricing for dump trucks and smaller construction based assets was strong in the first half of 2016. Comparatively, there was an excess of transportation assets, especially in North America, during the six months ended June 30, 2016. We believe this excess fleet turnover was the source of some price deterioration for transportation assets in the first half of 2016. Also, oil and gas specific assets and assets tied to commodities, such as mining assets, continued to face price deterioration in the first six months of 2016.
Overall, we continued to see an improvement in the overall age of equipment coming to market relative to recent years; a trend that we believe results from the increase in Original Equipment Manufacturer production that began in 2010 and is generating more transactions in the current used equipment marketplace, as well as creating larger pools of used equipment for future transactions. We continue to closely monitor new equipment production models, dealer and rental sales performance, and pricing actions in light of pressures in the broader industrial equipment sector.
In terms of equipment values, North America was our strongest geographical region in the first half of 2016, responding most favorably to changes in its overall economic environment, including, but not limited to, softening of the oil and gas and mining sectors, and stabilization in the residential and non-residential construction sectors.
| Ritchie Bros. | 39 |
Results of Operations
Second Quarter Update
| Financial overview | Three months ended June 30, | |||||||||||
| % Change | ||||||||||||
| (in U.S.$000's, except EPS) | 2016 | 2015 | 2016 over 2015 | |||||||||
| Revenues | $ | 158,805 | $ | 155,477 | 2 | % | ||||||
| Costs of services, excluding depreciation and amortization | 19,758 | 17,027 | 16 | % | ||||||||
| Selling, general and administrative expenses | 74,595 | 65,239 | 14 | % | ||||||||
| Depreciation and amortization expenses | 10,284 | 10,769 | (5 | )% | ||||||||
| Gain on disposal of property, plant and equipment | (201 | ) | (791 | ) | (75 | )% | ||||||
| Foreign exchange loss | 734 | 438 | 68 | % | ||||||||
| Operating income | 53,635 | 62,795 | (15 | )% | ||||||||
| Other income | 173 | 463 | (63 | )% | ||||||||
| Income tax expense | 13,217 | 17,412 | (24 | )% | ||||||||
| Net income attributable to stockholders | 39,710 | 45,083 | (12 | )% | ||||||||
| Diluted EPS attributable to stockholders | $ | 0.37 | $ | 0.42 | (12 | )% | ||||||
| Effective tax rate | 24.6 | % | 27.5 | % | (11 | )% | ||||||
| GAP | $ | 1,275,682 | $ | 1,262,168 | 1 | % | ||||||
| Revenue Rate | 12.45 | % | 12.32 | % | 1 | % | ||||||
Gross Auction Proceeds
GAP was $1.3 billion for the three months ended June 30, 2016, a second quarter record and a 1% increase over the second quarter of 2015. Included in our second quarter 2016 GAP is $41.6 million of GTV from our online marketplaces, which represents a 31% increase over GTV of $31.7 million in the second quarter of 2015. The increase in GAP is primarily due to an increase in the number of core auction lots year-over-year. The total number of lots at industrial and agricultural auctions grew 14%, increasing to 128,300 in the second quarter of 2016 from 112,900 in the second quarter of 2015. However, core auction GAP decreased 11% on a per-lot basis to $9,700 in the second quarter of 2016 from $10,900 in the second quarter of 2015.
GAP, on a U.S. dollar basis, grew in Europe and the United States in the second quarter of 2016 compared to the second quarter of 2015. However, this growth was partially offset by reductions in GAP in Canada and the rest of the world over the same comparative period. Second quarter 2016 GAP would have been $28.1 million higher, resulting in a 3% increase over second quarter 2015, if foreign exchange rates had remained consistent with those in 2015. This adverse effect on GAP is primarily due to the declining value of the Canadian dollar relative to the U.S. dollar.
| Ritchie Bros. | 40 |
During the second quarter of 2016, we continued to actively pursue the use of underwritten commission contracts from a strategic perspective, entering into such contracts only when the risk/reward profile of the terms were agreeable. The volume of underwritten commission contracts decreased to 26% of our GAP in the second quarter of 2016 from 29% in the second quarter of 2015. Straight commission contracts continue to account for the majority of our GAP.
Revenues and Revenue Rate
| (in U.S. $000's) | Three months ended June 30, | |||||||||||
| Better/(Worse) | ||||||||||||
| 2016 | 2015 | 2016 over 2015 | ||||||||||
| United States | $ | 68,724 | $ | 64,356 | 7 | % | ||||||
| Canada | 63,307 | 63,911 | (1 | )% | ||||||||
| Europe | 14,861 | 11,761 | 26 | % | ||||||||
| Other | 11,913 | 15,449 | (23 | )% | ||||||||
| Revenues | $ | 158,805 | $ | 155,477 | 2 | % | ||||||
Our commission rate and overall Revenue Rate are presented in the graph below:
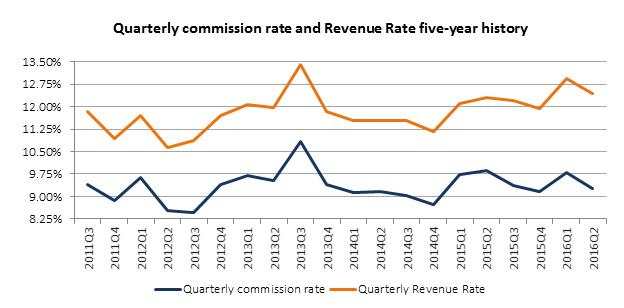
The distribution of our revenues across the geographic regions in which we operate was as follows, where the geographic location of revenues corresponds to the location in which the sale occurred, or in the case of online sales, where the company earning the revenues is incorporated:
| Revenue distribution | Canada | Outside of Canada | United States | Europe | Other | |||||||||||||||
| Three months ended June 30, 2016 | 40 | % | 60 | % | 43 | % | 9 | % | 8 | % | ||||||||||
| Three months ended June 30, 2015 | 41 | % | 59 | % | 41 | % | 8 | % | 10 | % | ||||||||||
Revenues increased 2% in the second quarter of 2016 compared to the second quarter of 2015, primarily due to volume increases in GAP combined with a strong Revenue Rate. Included in second quarter 2016 revenues were $4.2 million of revenues from EquipmentOne, which represents a 10% increase over EquipmentOne revenues of $3.8 million in the second quarter of 2015.
Our Revenue Rate increased 13 basis points to 12.45% in the second quarter of 2016 compared to 12.32% in the second quarter of 2015. This increase is primarily due to an increase in fee revenue, which is not directly linked to GAP.
| Ritchie Bros. | 41 |
Our second quarter 2016 overall average commission rate was 9.26%, compared to 9.87% in the second quarter of 2015. This decrease is primarily due to the performance of our underwritten business. Our underwritten contract commission rates and volume decreased during the three months ended June 30, 2016 compared to the same period in 2015.
Our fee revenue earned in the second quarter of 2016 represented 3.18% of GAP compared to 2.45% of GAP in the second quarter of 2015. The increase was primarily due to an increase in financing and other fees resulting from the improved performance of our value-added service offerings, combined with the mix of equipment sold at our auctions. Financing fees from RBFS increased 16% to $3.6 million in the second quarter of 2016 from $3.1 million in the second quarter of 2015. Mascus contributed $2.0 million of subscription, license, and other fee revenues in the second quarter of 2016. Xcira contributed $1.2 million of technology service fees in the second quarter of 2016.
Revenue grew in Europe and the United States during the three months ended June 30, 2016 compared to the same period in 2015, primarily due to the acquisitions of Mascus and Xcira, as well as due to increases in GAP in those regions. Comparatively, revenues in Canada in the second quarter of 2016 were consistent with those in the second quarter of 2015, and revenues in the rest of the world decreased over the same comparative period, primarily due to the decreases in GAP in those regions.
Foreign exchange rates had a negative impact on revenues in the second quarter of 2016 as a significant portion of revenues are in Canada and the Netherlands. Refer to the table under “Translational impact of foreign exchange rates” below for details of this negative foreign exchange rate impact.
Costs of services
Costs of services are comprised of expenses incurred in direct relation to conducting auctions, earning online marketplace revenues, and earning other fee revenues. Costs incurred in direct relation to conducting our auctions include labour, buildings, facilities and technology expenses, and travel, advertising and promotion expenses. Costs of services incurred to earn online marketplace revenues include inventory management, referral, inspection, sampling, and appraisal fees. Costs of services incurred in earning other fee revenues include labour, commissions on sales, software maintenance fees, and materials.
Costs of services exclude depreciation, and amortization expenses. In comparative periods, costs of services consisted entirely of direct expenses. Primarily as a result of the Xcira and Mascus acquisitions, significant other costs of services are now incurred in earning our revenues.
Costs of services increased $2.7 million or 16% in the second quarter of 2016 compared to the second quarter of 2015. Costs of services related to our Core Auction segment were $19.4 million, or 1.58% of GAP, in the second quarter of 2016 compared $17.0 million, or 1.38% of GAP, in the second quarter of 2015. This $2.4 million increase is primarily due to the increase in number of lots at our auctions, combined with an increase in the number of agricultural auctions – which are typically more costly to operate than auctions held at our permanent and regional auction sites – and the recognition of costs of services from Xcira of $0.7 million. During the second quarter of 2016, 81% of our GAP was attributable to auctions held at our permanent and regional auction sites, including those located in frontier regions, compared to 83% in the second quarter of 2015. We held 143 auctions in the second quarter of 2016 compared to 141 in the second quarter of 2015.
Mascus and EquipmentOne contributed $0.2 million and $0.1 million, respectively, to our total costs of services in the second quarter of 2016. Prior to fiscal 2016, costs of services generated by EquipmentOne were insignificant and recorded within selling, general and administrative (“SG&A”) expenses.
| Ritchie Bros. | 42 |
Selling, general and administrative expenses
SG&A expenses by nature are presented below:
| (in U.S. $000's) | Three months ended June 30, | |||||||||||
| % Change | ||||||||||||
| 2016 | 2015 | 2016 over 2015 | ||||||||||
| Employee compensation | $ | 47,560 | $ | 44,046 | 8 | % | ||||||
| Buildings, facilities and technology | 12,969 | 10,287 | 26 | % | ||||||||
| Travel, advertising and promotion | 6,792 | 4,805 | 41 | % | ||||||||
| Professional fees | 3,115 | 3,205 | (3 | )% | ||||||||
| Other SG&A expenses | 4,159 | 2,896 | 44 | % | ||||||||
| $ | 74,595 | $ | 65,239 | 14 | % | |||||||
Our SG&A expenses increased $9.4 million, or 14%, in the second quarter of 2016 compared to the second quarter of 2015. Foreign exchange rates had a positive impact on SG&A expenses in the second quarter of 2016 as a significant portion of administration expenses are in Canada and the Netherlands. Refer to the table under “Translational impact of foreign exchange rates” below for details of this positive foreign exchange rate impact.
Employee compensation expenses increased $3.5 million in the second quarter of 2016 compared to the second quarter of 2015. This increase included a positive effect from foreign exchange rates of $0.9 million. Removing foreign exchange impacts, the primary drivers of the increase in employee compensation were $3.4 million higher share-based payments, the 6% net growth of our headcount, $1.1 million from Mascus, and $0.4 million from Xcira. These increases were offset by a $3.0 million decrease in incentive compensation, which was the result of a decrease in the accrual for the estimated fiscal 2016 incentive compensation between the first and second quarters of 2016, combined with an increase in the accrual for the estimated fiscal 2015 incentive compensation between the first and second quarters of 2015.
The increase in share-based payment expenses over the same period is primarily due to an increase in the fair value of our share units related to the performance of our common share price, the impact of the change in accounting treatment of certain of our performance share units (“PSUs”) from liability to equity-classified as a result of shareholder approval of our PSU plans on May 2, 2016, and an increase in the number of participants in the plans as a result of promotions and headcount increases (including new executives). Our share price closed at $33.78 per common share on June 30, 2016, compared to $27.92 per common share on June 30, 2015.
Buildings, facilities and technology costs increased $2.7 million in the second quarter of 2016 compared to the second quarter of 2015. This increase is primarily attributable to our value-added service offerings, and in particular, the costs required to support the growing fee revenues generated by that business. The increase is also due to the fact that we had fewer software capitalization projects to which various information technology costs were able to be capitalized to in the second quarter of 2016 compared to the second quarter of 2015. The reduction in the number of projects is a result of significant system transformation projects (in which legacy software systems were replaced or upgraded) having reached completion at the end of the first quarter of 2015, combined with controlled capital spending.
Travel, advertising and promotion increased $2.0 million in the second quarter of 2016 compared to the second quarter of 2015, primarily due to a strategic increase in advertising and promotional expenditure targeted at our larger auction events and integration of acquired businesses. In addition, rental fees have increased as a result of a replacement of our aged and retired company vehicles with new vehicles under operating leases. Travel costs increased in the second quarter of 2016 compared to the second quarter of 2015, primarily due to the increase in executive headcount combined with direct oversight of strategy execution on a global basis.
| Ritchie Bros. | 43 |
Other SG&A increased $1.3 million in the second quarter of 2016 compared to the second quarter of 2015, primarily due to increased yard and office supplies required to support the increased auction activity, headcount, and ancillary services.
Included in second quarter 2016 SG&A expenses are $3.8 million of SG&A expenses from EquipmentOne, which increased 9% over EquipmentOne SG&A expenses of $3.4 million in the second quarter of 2015.
Depreciation and amortization expenses
Our depreciation and amortization expenses decreased $0.5 million, or 5%, in the second quarter of 2016 compared to the same period in 2015, primarily due to the positive impact of foreign exchange rate changes combined with assets related to our website development becoming fully depreciated in 2015. The positive impact from foreign exchange is primarily due to the declining value of the Canadian dollar relative to the U.S. dollar. The replacement of our aged and retired company vehicles with new vehicles under operating leases has also contributed to the decrease in depreciation in the second quarter of 2016 compared to the second quarter of 2015.
Included in second quarter 2016 depreciation and amortization expenses are $0.7 million of EquipmentOne depreciation and amortization expenses, which represents a 13% decrease over EquipmentOne depreciation and amortization expenses of $0.8 million in the second quarter of 2015.
Operating income
Operating income decreased 15% to $53.6 million in the second quarter of 2016 compared to $62.8 million in the second quarter of 2015. Operating Income Margin, which is our operating income divided by revenues, decreased to 33.8% in the second quarter of 2016 compared to 40.4% in the second quarter of 2015. These decreases are primarily due to increases in SG&A expenses, costs of services, and foreign exchange losses, combined with a decrease in the gain on disposition of property, plant and equipment, and partially offset by the increase in revenues.
Foreign exchange rates had a negative impact on operating income in the second quarter of 2016. Refer to the table under “Translational impact of foreign exchange rates” below for details of this negative foreign exchange rate impact.
Adjusted results
We use income statement and balance sheet performance scorecards to align our operations with our strategic priorities. We concentrate on a limited number of metrics to ensure focus and to facilitate quarterly performance discussions.
Our income statement scorecard includes the non-GAAP financial measures, Adjusted Operating Income and Adjusted Operating Income Margin. We believe that comparing Adjusted Operating Income for different financial periods provides useful information about the growth or decline of operating income and net income for the relevant financial period, and eliminates the financial impact of items we do not consider to be part of our normal operating results.
We believe that comparing Adjusted Operating Income Margin for different financial periods provides useful information about of how efficiently we translate revenues into pre-tax profit. Adjusted Operating Income Margin is also an element of the performance criteria for certain annual short-term incentive awards we grant to our employees and officers.
We calculate Adjusted Operating Income as operating income excluding the pre-tax effects of significant items that we do not consider to be part of our normal operating results such as management reorganization costs, severance, gains/losses on sale of certain property, plant and equipment, impairment losses, and certain other items, which we refer to as ‘adjusting items’. We calculate Adjusted Operating Income Margin as Adjusted Operating Income divided by revenues.
There were no adjusting items during the three months ended June 30, 2016 and 2015.
| Ritchie Bros. | 44 |
Foreign exchange loss and effect of exchange rate movement on income statement components
We conduct operations around the world in a number of different currencies, but our presentation currency is the U.S. dollar.
Transactional impact of foreign exchange rates
We recognized $0.7 million of transactional foreign exchange losses in the second quarter of 2016, compared to $0.4 million during the same period in 2015. Foreign exchange losses and gains are primarily the result of settlement of foreign-denominated monetary assets and liabilities.
Translational impact of foreign exchange rates
Since late 2014, there has been significant weakening of the Canadian dollar and the Euro relative to the U.S. dollar. This weakening has affected our reported operating income when non-U.S. dollar amounts were translated into U.S. dollars for financial statement reporting purposes.
Constant Currency amounts and Translational FX Impact are non-GAAP financial measures. We calculate our Constant Currency amounts by applying prior period foreign exchange rates to current period transactional currency amounts. We define Translational FX Impact as the amounts we report under GAAP, less Constant Currency amounts. We believe that presenting Constant Currency amounts and Translational FX Impact, and comparing Constant Currency amounts to prior period results, provides useful information regarding the potential effect of changes in foreign exchange rates on our performance and the growth or decline in our operating income by eliminating the financial impact of items we do not consider to be part of our normal operating results.
The following tables present our Constant Currency results and the Translational FX Impact for the three months ended June 30, 2016 and 2015, as well as reconcile those metrics to second quarter 2016, 2015, and 2014 revenues, costs of services, SG&A expenses, depreciation and amortization expenses, gain on disposition of property, plant and equipment, foreign exchange loss, and operating income, which are the most directly comparable GAAP measures in our consolidated financial statements:
| (in U.S. $000's) | Three months ended June 30, 2016 | Three months | 2016 over 2015 | Constant | ||||||||||||||||||||||||||||
| Translational | Constant | ended | reported change | Currency change | ||||||||||||||||||||||||||||
| As reported | FX Impact | Currency | June 30, 2015 | $ | % | $ | % | |||||||||||||||||||||||||
| GAP | $ | 1,275,682 | $ | 28,070 | $ | 1,303,752 | $ | 1,262,168 | $ | 13,514 | 1 | % | $ | 41,584 | 3 | % | ||||||||||||||||
| Revenues | $ | 158,805 | $ | 3,286 | $ | 162,091 | $ | 155,477 | $ | 3,328 | 2 | % | $ | 6,614 | 4 | % | ||||||||||||||||
| Costs of services, excluding depreciation and amortization | 19,758 | 270 | 20,028 | 17,027 | 2,731 | 16 | % | 3,001 | 18 | % | ||||||||||||||||||||||
| SG&A expenses | 74,595 | 1,272 | 75,867 | 65,239 | 9,356 | 14 | % | 10,628 | 16 | % | ||||||||||||||||||||||
| Depreciation and amortization expenses | 10,284 | 190 | 10,474 | 10,769 | (485 | ) | (5 | )% | (295 | ) | (3 | )% | ||||||||||||||||||||
| Gain on disposition of property, plant and equipment | (201 | ) | 1 | (200 | ) | (791 | ) | 590 | (75 | )% | 591 | (75 | )% | |||||||||||||||||||
| Foreign exchange loss | 734 | 362 | 1,096 | 438 | 296 | 68 | % | 658 | 150 | % | ||||||||||||||||||||||
| Operating income | $ | 53,635 | $ | 1,191 | $ | 54,826 | $ | 62,795 | $ | (9,160 | ) | (15 | )% | $ | (7,969 | ) | (13 | )% | ||||||||||||||
| Ritchie Bros. | 45 |
| (in U.S. $000's) | Three months ended June 30, 2015 | Three months | 2015 over 2014 | Constant | ||||||||||||||||||||||||||||
| Translational | Constant | ended | reported change | Currency change | ||||||||||||||||||||||||||||
| As reported | FX Impact | Currency | June 30, 2014 | $ | % | $ | % | |||||||||||||||||||||||||
| GAP | $ | 1,262,168 | $ | 98,746 | $ | 1,360,914 | $ | 1,229,204 | $ | 32,964 | 3 | % | $ | 131,710 | 11 | % | ||||||||||||||||
| Revenues | 155,477 | 12,708 | 168,185 | $ | 141,835 | $ | 13,642 | 10 | % | $ | 26,350 | 19 | % | |||||||||||||||||||
| Costs of services, excluding depreciation and amortization | 17,027 | 1,393 | 18,420 | 17,616 | (589 | ) | (3 | )% | 804 | 5 | % | |||||||||||||||||||||
| SG&A expenses | 65,239 | 5,475 | 70,714 | 61,513 | 3,726 | 6 | % | 9,201 | 15 | % | ||||||||||||||||||||||
| Depreciation and amortization expenses | 10,769 | 900 | 11,669 | 10,979 | (210 | ) | (2 | )% | 690 | 6 | % | |||||||||||||||||||||
| Gain on disposition of property, plant and equipment | (791 | ) | (28 | ) | (819 | ) | (258 | ) | (533 | ) | 207 | % | (561 | ) | 217 | % | ||||||||||||||||
| Foreign exchange loss | 438 | 39 | 477 | 212 | 226 | 107 | % | 265 | 125 | % | ||||||||||||||||||||||
| Operating income | $ | 62,795 | $ | 4,929 | $ | 67,724 | $ | 51,773 | $ | 11,022 | 21 | % | $ | 15,951 | 31 | % | ||||||||||||||||
U.S. dollar exchange rate comparison
| Value of one U.S. dollar | Three months ended June 30, | |||||||||||
| % Change | ||||||||||||
| 2016 | 2015 | 2016 over 2015 | ||||||||||
| Period-end exchange rate | ||||||||||||
| Canadian dollar | $ | 1.2925 | $ | 1.2495 | 3 | % | ||||||
| Euro | 0.9003 | 0.8976 | - | |||||||||
| Average exchange rate | ||||||||||||
| Canadian dollar | $ | 1.2886 | $ | 1.2294 | 5 | % | ||||||
| Euro | 0.8854 | 0.9044 | (2 | )% | ||||||||
The majority of the change in the value of the U.S. dollar to the Canadian dollar and the Euro occurred during the first quarter of 2015. Since that time, the U.S. dollar continued a more moderate appreciation against the Canadian dollar.
Other income (expense)
Other income (expense) is comprised of the following:
| (in U.S. $000's) | Three months ended June 30, | |||||||||||
| % Change | ||||||||||||
| 2016 | 2015 | 2016 over 2015 | ||||||||||
| Interest income | $ | 487 | $ | 680 | (28 | )% | ||||||
| Interest expense | (1,060 | ) | (1,308 | ) | (19 | )% | ||||||
| Equity income | 477 | 173 | 176 | % | ||||||||
| Other, net | 269 | 918 | (71 | )% | ||||||||
| Other income | $ | 173 | $ | 463 | (63 | )% | ||||||
Income tax expense and effective tax rate
At the end of each interim period, we make our best estimate of the effective tax rate expected to be applicable for the full fiscal year. The estimate reflects, among other items, our best estimate of operating results. It does not include the estimated impact of foreign exchange rates or unusual and/or infrequent items, which may cause significant variations in the customary relationship between income tax expense and income before income taxes.
| Ritchie Bros. | 46 |
For the three months ended June 30, 2016, income tax expense was $13.2 million, compared to an income tax expense of $17.4 million for the same comparative period in 2015. Our effective tax rate was 24.6% in the second quarter of 2016, compared to 27.5% in the second quarter of 2015. The decrease in the effective tax rate in the second quarter of 2016 compared to the second quarter of 2015 was primarily due to a greater estimated proportion of annual earnings taxed in jurisdictions with lower tax rates for fiscal 2016 compared to fiscal 2015. The decrease in effective tax rate was also the result of the valuation allowance of deferred tax assets remaining consistent during the three months ended June 30, 2016 compared to an increase in the valuation allowance of deferred tax assets during the three months ended June 30, 2015.
Net income attributable to stockholders
Net income attributable to stockholders decreased 12% to $39.7 million in the second quarter of 2016 compared to $45.1 million in the second quarter of 2015, primarily due the decrease in operating income and partially offset by the decrease in income tax expense over the same comparative period.
Adjusted results
Adjusted Net Income and Diluted Adjusted EPS attributable to stockholders are non-GAAP financial measures. We believe that comparing Adjusted Net Income and Diluted Adjusted EPS attributable to stockholders for different financial periods provides useful information about the growth or decline of our net income attributable to stockholders for the relevant financial period, and eliminates the financial impact of items we do not consider to be part of our normal operating results.
Adjusted Net Income attributable to stockholders represents net income attributable to stockholders excluding the effects of adjusting items. We calculate Diluted Adjusted EPS attributable to stockholders by dividing Adjusted Net Income attributable to stockholders by the weighted average number of diluted shares outstanding.
There were no adjusting items during the three months ended June 30, 2016 and 2015.
Earnings Before Interest, Taxes, Depreciation and Amortization (“EBITDA”)
EBITDA and EBITDA Margin are non-GAAP financial measures that we believe provide useful information about the growth or decline of our net income when compared between different financial periods. EBITDA is also an element of the performance criteria for certain PSUs we granted to our employees and officers in 2013 and 2014. EBITDA is calculated by adding back depreciation and amortization expenses, interest expense, and current income tax expense, and subtracting interest income and deferred income tax recovery from net income. EBITDA Margin presents EBITDA as a multiple of revenues.
| Ritchie Bros. | 47 |
The following table presents our EBITDA and EBITDA Margin results for the three months ended June 30, 2016 and 2015, as well as reconciles those metrics to net income and revenues, which are the most directly comparable GAAP measures in our consolidated income statements:
| (in U.S.$000's) | Three months ended June 30, | |||||||||||
| % Change | ||||||||||||
| 2016 | 2015 | 2016 over 2015 | ||||||||||
| Net income | $ | 40,591 | $ | 45,846 | (11 | )% | ||||||
| Add: depreciation and amortization expenses | 10,284 | 10,769 | (5 | )% | ||||||||
| Less: interest income | (487 | ) | (680 | ) | (28 | )% | ||||||
| Add: interest expense | 1,060 | 1,308 | (19 | )% | ||||||||
| Add: current income tax expense | 16,106 | 19,365 | (17 | )% | ||||||||
| Less: deferred income tax recovery | (2,889 | ) | (1,953 | ) | 48 | % | ||||||
| EBITDA | $ | 64,665 | $ | 74,655 | (13 | )% | ||||||
| Revenues | $ | 158,805 | $ | 155,477 | 2 | % | ||||||
| EBITDA Margin | 40.7 | % | 48.0 | % | (15 | )% | ||||||
The decreases in our EBITDA and EBITDA Margin during the second quarter of 2016 compared to the second quarter of 2015 are primarily due to the increases in SG&A expenses, costs of services, and foreign exchange losses, combined with a decrease in the gain on disposition of property, plant and equipment, and partially offset by the increase in revenues.
Adjusted results
Our balance sheet scorecard includes the performance metric, Debt/Adjusted EBITDA, which is a non-GAAP financial measure. We believe that comparing Debt/Adjusted EBIDTA on a 12-month rolling basis for different financial periods provides useful information about the performance of our operations, and in particular, it is an indicator of the amount of time it would take for us to settle both our short and long-term debt. We do not consider this to be a measure of our liquidity, which is our ability to settle only short-term obligations, but rather a measure of how well we fund liquidity. Measures of liquidiy are discussed further below under “liquidity and capital resources”.
We calculate Debt/Adjusted EBITDA by dividing debt by EBITDA excluding the effects of pre-tax adjusting items.
| Ritchie Bros. | 48 |
The following table presents our Debt/Adjusted EBITDA results as at and for the 12 months ended June 30, 2016 and 2015, as well as reconciles that metric to debt and net income, which are the most directly comparable GAAP measures in our consolidated financial statements:
| (in U.S. $ millions) | As at and for the 12 months ended June 30, | |||||||||||
| % Change | ||||||||||||
| 2016 | 2015 | 2016 over 2015 | ||||||||||
| Short-term debt | $ | 22.4 | $ | 13.8 | 62 | % | ||||||
| Long-term debt | 102.7 | 105.2 | (2 | )% | ||||||||
| Debt | $ | 125.1 | $ | 119.0 | 5 | % | ||||||
| Net income | $ | 139.2 | $ | 111.5 | 25 | % | ||||||
| Add: depreciation and amortization expenses | 41.0 | 44.4 | (8 | )% | ||||||||
| Less: interest income | (2.1 | ) | (2.6 | ) | (19 | )% | ||||||
| Add: interest expense | 4.8 | 5.1 | (6 | )% | ||||||||
| Add: current income tax expense | 38.5 | 45.4 | (15 | )% | ||||||||
| Less: deferred income tax recovery | (4.7 | ) | (1.8 | ) | 161 | % | ||||||
| Pre-tax adjusting items: | ||||||||||||
| Management reorganization | - | 5.5 | (100 | )% | ||||||||
| Gain on sale of excess property | (8.4 | ) | (3.4 | ) | (147 | )% | ||||||
| Impairment loss | - | 8.1 | (100 | )% | ||||||||
| Adjusted EBITDA | $ | 208.3 | $ | 212.2 | (2 | )% | ||||||
| Debt/Adjusted EBITDA | 0.6 | x | 0.6 | x | - | |||||||
The Debt/Adjusted EBITDA multiple remained consistent during the 12 months ended June 30, 2016 compared to the same period in 2015.
| Ritchie Bros. | 49 |
Year-to-Date Performance
| Financial overview | Six months ended June 30, | |||||||||||
| % Change | ||||||||||||
| (in U.S.$000's, except EPS) | 2016 | 2015 | 2016 over 2015 | |||||||||
| Revenues | $ | 290,750 | $ | 271,095 | 7 | % | ||||||
| Costs of services, excluding depreciation and amortization | 35,071 | 28,636 | 22 | % | ||||||||
| Selling, general and administrative expenses | 142,902 | 128,995 | 11 | % | ||||||||
| Depreciation and amortization expenses | 20,364 | 21,385 | (5 | )% | ||||||||
| Gain on disposal of property, plant and equipment | (447 | ) | (966 | ) | (54 | )% | ||||||
| Foreign exchange loss (gain) | 51 | (2,769 | ) | (102 | )% | |||||||
| Operating income | 92,809 | 95,814 | (3 | )% | ||||||||
| Other income | 525 | 987 | (47 | )% | ||||||||
| Income tax expense | 22,749 | 26,845 | (15 | )% | ||||||||
| Net income attributable to stockholders | 69,116 | 68,860 | - | |||||||||
| Diluted EPS attributable to stockholders | $ | 0.65 | $ | 0.64 | 2 | % | ||||||
| Effective tax rate | 24.4 | % | 27.7 | % | (12 | )% | ||||||
| GAP | $ | 2,295,604 | $ | 2,217,729 | 4 | % | ||||||
| Revenue Rate | 12.67 | % | 12.22 | % | 4 | % | ||||||
Gross Auction Proceeds
GAP was $2.3 billion for the six months ended June 30, 2016, a first half record and a 4% increase over the first half of 2015. Included in our first half 2016 GAP is $65.3 million of GTV from our online marketplaces, which represents a 22% increase over GTV of $53.5 million in the first half of 2015. The increase in GAP is primarily due to an increase in the number of core auction lots year-over-year. The total number of lots at industrial and agricultural auctions grew 20%, increasing to 225,500 in the first half of 2016 from 188,700 in the first half of 2015. However, core auction GAP decreased 14% on a per-lot basis to $9,900 in the first half of 2016 from $11,500 in the first half of 2015.
GAP, on a U.S. dollar basis, grew in Canada and Europe in the first half of 2016 compared to the first half of 2015. However, this growth was partially offset by reductions in GAP in the United States over the same comparative period. GAP in the rest of the world grew during the six months ended June 30, 2016 compared to the same period in 2015. First half 2016 GAP would have been $49.6 million higher, resulting in a 6% increase over first half 2015, if foreign exchange rates had remained consistent with those in 2015. This adverse effect on GAP is primarily due to the declining value of the Canadian dollar and the Euro relative to the U.S. dollar.
During the first half of 2016, we continued to actively pursue the use of underwritten commission contracts from a strategic perspective, entering into such contracts only when the risk/reward profile of the terms were agreeable. The volume of underwritten commission contracts decreased to 25% of our GAP in the first half of 2016 from 30% in the first half of 2015, primarily due to the underwritten contracts associated with the Casper, Wyoming, offsite auction that was held on March 25, 2015. Straight commission contracts continue to account for the majority of our GAP.
| Ritchie Bros. | 50 |
Revenues and Revenue Rate
| (in U.S. $000's) | Six months ended June 30, | |||||||||||
| Better/(Worse) | ||||||||||||
| 2016 | 2015 | 2016 over 2015 | ||||||||||
| United States | $ | 143,492 | $ | 137,013 | 5 | % | ||||||
| Canada | 95,554 | 86,870 | 10 | % | ||||||||
| Europe | 26,404 | 22,809 | 16 | % | ||||||||
| Other | 25,300 | 24,403 | 4 | % | ||||||||
| Revenues | $ | 290,750 | $ | 271,095 | 7 | % | ||||||
The distribution of our revenues across the geographic regions in which we operate was as follows, where the geographic location of revenues corresponds to the location in which the sale occurred, or in the case of online sales, where the company earning the revenues is incorporated:
| Revenue distribution | Canada | Outside of Canada | United States | Europe | Other | |||||||||||||||
| Six months ended June 30, 2016 | 33 | % | 67 | % | 49 | % | 9 | % | 9 | % | ||||||||||
| Six months ended June 30, 2015 | 32 | % | 68 | % | 51 | % | 8 | % | 9 | % | ||||||||||
Revenues increased 7% in the first half of 2016 compared to the first half of 2015, primarily due to volume increases in GAP combined with a strong Revenue Rate. Included in first half 2016 revenues were $7.6 million of revenues from EquipmentOne, which represents an 11% increase over EquipmentOne revenues of $6.8 million in the first half of 2015.
Our Revenue Rate increased 45 basis points to 12.67% in the first half of 2016 compared to 12.22% in the first half of 2015. This increase is primarily due to the performance of our straight commission contracts combined with an increase in fee revenue, which is not directly linked to GAP. Our first half 2016 overall average commission rate was 9.50%, compared to 9.82% in the first half of 2015. This decrease is primarily due to the performance of our underwritten business. Our underwritten contract commission rates and volume decreased in the first six months of 2016 compared to the same period in 2015.
Our fee revenue earned in the first half of 2016 represented 3.17% of GAP compared to 2.41% of GAP in the first half of 2015. The increase was primarily due to an increase in financing and other fees resulting from the improved performance of our value-added service offerings, combined with the mix of equipment sold at our auctions. Financing fees from RBFS increased 30% to $6.1 million in the first half of 2016 from $4.7 million in the first half of 2015. Mascus contributed $3.3 million of subscription, license, and other fee revenues in the first half of 2016. Xcira contributed $2.4 million of technology service fees in the first half of 2016.
Revenue grew in all regions in the first six months of 2016 compared to the same period in 2015, primarily as a result of increases in GAP and Revenue Rate, as well as the acquisitions of Mascus and Xcira.
Foreign exchange rates had a negative impact on revenues in the first half of 2016 as a significant portion of revenues are in Canada and the Netherlands. Refer to the table under “Translational impact of foreign exchange rates” below for details of this negative foreign exchange rate impact.
Costs of services
Costs of services increased $6.4 million or 22% in the first half of 2016 compared to the first half of 2015. Costs of services related to our Core Auction segment were $34.2 million, or 1.53% of GAP, in the first half of 2016 compared to $28.6 million, or 1.32% of GAP, in the first half of 2015.
| Ritchie Bros. | 51 |
This $5.6 million increase is primarily due to the increase in number of lots at our auctions, the increase in the number of agricultural auctions, the recognition of costs of services from Xcira of $1.4 million, and a strategic increase in advertising and promotional expenditure targeted at our larger auctions, including our five-day, premier global auction in Orlando, United States. We believe the targeted increase in advertising and promotional expenditure contributed to the increase in GAP.
During the first half of 2016, 86% of our GAP was attributable to auctions held at our permanent and regional auction sites, including those located in frontier regions, compared to 84% in the first half of 2015. We held 194 auctions in the first half of 2016, compared to 189 in the first half of 2015. The proportion of GAP earned at those sites increased over the same comparative period.
EquipmentOne and Mascus contributed $0.5 million and $0.3 million, respectively, to our total costs of services in the first half of 2016. Prior to fiscal 2016, costs of services generated by EquipmentOne were insignificant and recorded within SG&A expenses.
Selling, general and administrative expenses
SG&A expenses by nature are presented below:
| (in U.S. $000's) | Six months ended June 30, | |||||||||||
| % Change | ||||||||||||
| 2016 | 2015 | 2016 over 2015 | ||||||||||
| Employee compensation | $ | 92,050 | $ | 85,775 | 7 | % | ||||||
| Buildings, facilities and technology | 24,205 | 20,333 | 19 | % | ||||||||
| Travel, advertising and promotion | 12,354 | 10,886 | 13 | % | ||||||||
| Professional fees | 6,567 | 6,305 | 4 | % | ||||||||
| Other SG&A expenses | 7,726 | 5,696 | 36 | % | ||||||||
| $ | 142,902 | $ | 128,995 | 11 | % | |||||||
Our SG&A expenses increased $13.9 million, or 11%, in the first half of 2016 compared to the first half of 2015. Foreign exchange rates had a positive impact on SG&A expenses in the first half of 2016 as a significant portion of administration expenses are in Canada and the Netherlands. Refer to the table under “Translational impact of foreign exchange rates” below for details of this positive foreign exchange rate impact.
Employee compensation expenses increased $6.3 million in the first half of 2016 compared to the first half of 2015. This increase included a positive effect from foreign exchange rates of $2.9 million. Removing foreign exchange impacts, the primary drivers of the increase in employee compensation were the $4.1 million higher share-based payments, 6% net growth of our headcount, $1.8 million from Mascus, and $1.3 million from Xcira. Employee compensation expenses in the first half of 2015 included $2.1 million in termination benefits resulting from the Separation Agreement with our former Chief Sales Officer.
The increase in share-based payment expenses over the same period is primarily due to an increase in the fair value of our share units related to the performance of our common share price, the impact of the change in accounting treatment of certain of our PSUs from liability to equity-classified as a result of shareholder approval of our PSU plans on May 2, 2016, and an increase in the number of participants in the plans as a result of promotions and headcount increases (including new executives).
Buildings, facilities and technology costs increased $3.9 million in the first half of 2016 compared to the first half of 2015. This increase is primarily attributable to our value-added service offerings, and in particular, the costs required to support the growing fee revenues generated by that business. The increase is also due to the fact that we had fewer software capitalization projects to which various information technology costs were able to be capitalized to in the first half of 2016 compared to the first half of 2015.
| Ritchie Bros. | 52 |
The reduction in the number of projects is a result of significant system transformation projects (in which legacy software systems were replaced or upgraded) having reached completion at the end of the first quarter of 2015, combined with controlled capital spending.
Travel, advertising and promotion increased $1.5 million in the first half of 2016 compared to the first half of 2015, primarily due to a strategic increase in advertising and promotional expenditure targeted at our larger auction events and integration of acquired businesses. In addition, rental fees have increased as a result of a replacement of our aged and retired company vehicles with new vehicles under operating leases.
Other SG&A increased $2.0 million in the first half of 2016 compared to the first half of 2015, primarily due to increased yard and office supplies required to support the increased ancillary service and auction activity, as well as headcount. Also contributing to the increase are costs associated with the Mascus acquisition in the first half of 2016.
Included in first half 2016 SG&A expenses are $6.2 million of SG&A expenses from EquipmentOne, which decreased 5% over EquipmentOne SG&A expenses of $6.6 million in the first half of 2015.
Depreciation and amortization expenses
Our depreciation and amortization expenses decreased $1.0 million, or 5%, in the first half of 2016 compared to the same period in 2015, primarily due to the positive impact of foreign exchange rate changes combined with assets related to our website development becoming fully depreciated in 2015. The positive impact from foreign exchange is primarily due to the declining value of the Canadian dollar and the Euro relative to the U.S. dollar. The replacement of our aged and retired company vehicles with new vehicles under operating leases has also contributed to the decrease in depreciation in the first half of 2016 compared to the first half of 2015.
Included in first half 2016 depreciation and amortization expenses are $1.3 million of EquipmentOne depreciation and amortization expenses, which represents a 22% decrease over EquipmentOne depreciation and amortization expenses of $1.7 million in the first half of 2015.
Operating income
Operating income decreased 3% to $92.8 million in the first half of 2016 compared to $95.8 million in the first half of 2015. Operating Income Margin decreased to 31.9% in the first half of 2016 compared to 35.3% in the first half of 2015. These decreases are primarily due to increases in SG&A expenses, costs of services, and foreign exchange losses, combined with a decrease in the gain on disposition of property, plant and equipment, and partially offset by the increase in revenues.
Foreign exchange rates had a negative impact on operating income in the first half of 2016. Refer to the table under “Translational impact of foreign exchange rates” below for details of this negative foreign exchange rate impact.
Adjusted results
With respect to our Adjusted Operating Income and Adjusted Operating Income Margin, there were no adjusting items during the six months ended June 30, 2016 and 2015.
Foreign exchange loss and effect of exchange rate movement on income statement components
In the first half of 2016, approximately 46% of our revenues and 57% of our operating expenses were denominated in currencies other than the U.S. dollar, compared to 44% and 58%, respectively in the first half of 2015.
| Ritchie Bros. | 53 |
Transactional impact of foreign exchange rates
We recognized $0.1 million of transactional foreign exchange losses in the first half of 2016, compared to $2.8 million of transactional foreign exchange gains during the same period in 2015. Foreign exchange losses and gains are primarily the result of settlement of foreign-denominated monetary assets and liabilities.
Translational impact of foreign exchange rates
The following tables presents our Constant Currency results and Translational FX Impact for the six months ended June 30, 2016 and 2015, as well as reconcile those metrics to first half 2016, 2015 and 2014 revenues, costs of services, SG&A expenses, depreciation and amortization expenses, gain on disposition of property, plant and equipment, foreign exchange loss/gain, and operating income, which are the most directly comparable GAAP measures in our consolidated financial statements:
| (in U.S. $000's) | Six months ended June 30, 2016 | Six months | 2016 over 2015 | Constant | ||||||||||||||||||||||||||||
| Translational | Constant | ended | reported change | Currency change | ||||||||||||||||||||||||||||
| As reported | FX Impact | Currency | June 30, 2015 | $ | % | $ | % | |||||||||||||||||||||||||
| GAP | $ | 2,295,604 | $ | 49,578 | $ | 2,345,182 | $ | 2,217,729 | $ | 77,875 | 4 | % | $ | 127,453 | 6 | % | ||||||||||||||||
| Revenues | 290,750 | 6,236 | 296,986 | $ | 271,095 | $ | 19,655 | 7 | % | $ | 25,891 | 10 | % | |||||||||||||||||||
| Costs of services, excluding depreciation and amortization | 35,071 | 510 | 35,581 | 28,636 | 6,435 | 22 | % | 6,945 | 24 | % | ||||||||||||||||||||||
| SG&A expenses | 142,902 | 3,985 | 146,887 | 128,995 | 13,907 | 11 | % | 17,892 | 14 | % | ||||||||||||||||||||||
| Depreciation and amortization expenses | 20,364 | 685 | 21,049 | 21,385 | (1,021 | ) | (5 | )% | (336 | ) | (2 | )% | ||||||||||||||||||||
| Gain on disposition of property, plant and equipment | (447 | ) | (3 | ) | (450 | ) | (966 | ) | 519 | (54 | )% | 516 | (53 | )% | ||||||||||||||||||
| Foreign exchange loss (gain) | 51 | 353 | 404 | (2,769 | ) | 2,820 | (102 | )% | 3,173 | (115 | )% | |||||||||||||||||||||
| Operating income | $ | 92,809 | $ | 706 | $ | 93,515 | $ | 95,814 | $ | (3,005 | ) | (3 | )% | $ | (2,299 | ) | (2 | )% | ||||||||||||||
| (in U.S. $000's) | Six months ended June 30, 2015 | Six months | 2015 over 2014 | Constant | ||||||||||||||||||||||||||||
| Translational | Constant | ended | reported change | Currency change | ||||||||||||||||||||||||||||
| As reported | FX Impact | Currency | June 30, 2014 | $ | % | $ | % | |||||||||||||||||||||||||
| GAP | $ | 2,217,729 | $ | 151,638 | $ | 2,369,367 | $ | 2,084,581 | $ | 133,148 | 6 | % | $ | 284,786 | 14 | % | ||||||||||||||||
| Revenues | 271,095 | 19,453 | 290,548 | $ | 240,423 | $ | 30,672 | 13 | % | $ | 50,125 | 21 | % | |||||||||||||||||||
| Costs of services, excluding depreciation and amortization | 28,636 | 2,061 | 30,697 | 27,916 | 720 | 3 | % | 2,781 | 10 | % | ||||||||||||||||||||||
| SG&A expenses | 128,995 | 10,123 | 139,118 | 121,485 | 7,510 | 6 | % | 17,633 | 15 | % | ||||||||||||||||||||||
| Depreciation and amortization expenses | 21,385 | 1,700 | 23,085 | 21,576 | (191 | ) | (1 | )% | 1,509 | 7 | % | |||||||||||||||||||||
| Gain on disposition of property, plant and equipment | (966 | ) | (34 | ) | (1,000 | ) | (329 | ) | (637 | ) | 194 | % | (671 | ) | 204 | % | ||||||||||||||||
| Foreign exchange gain | (2,769 | ) | 25 | (2,744 | ) | (1,079 | ) | (1,690 | ) | 157 | % | (1,665 | ) | 154 | % | |||||||||||||||||
| Operating income | $ | 95,814 | $ | 5,578 | $ | 101,392 | $ | 70,854 | $ | 24,960 | 35 | % | $ | 30,538 | 43 | % | ||||||||||||||||
U.S. dollar exchange rate comparison
| Value of one U.S. dollar | Six months ended June 30, | |||||||||||
| % Change | ||||||||||||
| 2016 | 2015 | 2016 over 2015 | ||||||||||
| Average exchange rate | ||||||||||||
| Canadian dollar | $ | 1.3317 | $ | 1.2353 | 8 | % | ||||||
| Euro | 0.8963 | 0.8967 | - | |||||||||
| Ritchie Bros. | 54 |
The majority of the change in the value of the U.S. dollar to the Canadian dollar and the Euro occurred during the first quarter of 2015. Since that time, the U.S. dollar continued a more moderate appreciation against the Canadian dollar.
Other income (expense)
Other income (expense) is comprised of the following:
| (in U.S. $000's) | Six months ended June 30, | |||||||||||
| % Change | ||||||||||||
| 2016 | 2015 | 2016 over 2015 | ||||||||||
| Interest income | $ | 985 | $ | 1,527 | (35 | )% | ||||||
| Interest expense | (2,423 | ) | (2,577 | ) | (6 | )% | ||||||
| Equity income | 996 | 406 | 145 | % | ||||||||
| Other, net | 967 | 1,631 | (41 | )% | ||||||||
| Other income | $ | 525 | $ | 987 | (47 | )% | ||||||
Income tax expense and effective tax rate
For the six months ended June 30, 2016, income tax expense was $22.7 million, compared to an income tax expense of $26.8 million for the same comparative period in 2015. Our effective tax rate was 24.4% in the first half of 2016, compared to 27.7% in the first half of 2015. The decrease in the effective tax rate in the first half of 2016 compared to the first half of 2015 was primarily due to a greater estimated proportion of annual earnings taxed in jurisdictions with lower tax rates for fiscal 2016 compared to fiscal 2015. The decrease in effective tax rate was also the result of a decrease in the valuation allowance of deferred tax assets during the six months ended June 30, 2016 compared to an increase in the valuation allowance of deferred tax assets during the six months ended June 30, 2015.
Net income attributable to stockholders
Net income attributable to stockholders of $69.1 million in the first half of 2016 increased from $68.9 million in the first half of 2015, primarily due the increase in revenues combined with the decrease in income tax expense, and partially offset by the increases in SG&A expenses, costs of services, and foreign exchange loss over the same comparative period.
Adjusted results
With respect to Adjusted Net Income and Diluted Adjusted EPS attributable to stockholders, there were no adjusting items during the six months ended June 30, 2016 and 2015.
| Ritchie Bros. | 55 |
EBITDA
The following table presents our EBITDA and EBITDA Margin results for the six months ended June 30, 2016 and 2015, as well as reconciles those metrics to net income and revenues, which are the most directly comparable GAAP measures in our consolidated income statements:
| (in U.S.$000's) | Six months ended June 30, | |||||||||||
| % Change | ||||||||||||
| 2016 | 2015 | 2016 over 2015 | ||||||||||
| Net income | $ | 70,585 | $ | 69,956 | 1 | % | ||||||
| Add: depreciation and amortization expenses | 20,364 | 21,385 | (5 | )% | ||||||||
| Less: interest income | (985 | ) | (1,527 | ) | (35 | )% | ||||||
| Add: interest expense | 2,423 | 2,577 | (6 | )% | ||||||||
| Add: current income tax expense | 26,115 | 30,078 | (13 | )% | ||||||||
| Less: deferred income tax recovery | (3,366 | ) | (3,233 | ) | 4 | % | ||||||
| EBITDA | $ | 115,136 | $ | 119,236 | (3 | )% | ||||||
| Revenues | $ | 290,750 | $ | 271,095 | 7 | % | ||||||
| EBITDA Margin | 39.6 | % | 44.0 | % | (10 | )% | ||||||
The decreases in our EBITDA and EBITDA Margin during the first half of 2016 compared to the first half of 2015 are primarily due to the increases in SG&A expenses, costs of services, and foreign exchange losses, combined with a decrease in the gain on disposition of property, plant and equipment, and partially offset by the increase in revenues.
Operations Update
The majority of our business continues to be generated by our core auction operations. During the first half of 2016, we conducted 109 unreserved industrial auctions at locations in North America, Europe, the Middle East, Australia, New Zealand, and Asia, as compared to 108 in the first half of 2015. We also held 85 unreserved agricultural auctions in the first half of 2016, compared to 81 in the first half of 2015.
Our key industrial auction metrics3 are shown below:
| Six months ended June 30, | ||||||||||||
| % Change | ||||||||||||
| 2016 | 2015 | 2016 over 2015 | ||||||||||
| Bidder registrations | 276,000 | 250,000 | 10 | % | ||||||||
| Consignments | 26,350 | 22,500 | 17 | % | ||||||||
| Buyers | 70,150 | 59,650 | 18 | % | ||||||||
| Lots | 203,500 | 168,500 | 21 | % | ||||||||
We continued to see increases in all key industrial auction metrics in the first half of 2016 compared to the first half of 2015, primarily as a result of our focused efforts on growing the business combined with a stable used equipment market.
| 3 | For a breakdown of these key industrial auction metrics by month, please refer to our website at www.rbauction.com. None of the information in our website is incorporated by reference into this document by this or any other reference. |
| Ritchie Bros. | 56 |
Although our auctions vary in size, our average industrial auction results on a rolling 12-month basis are described in the following table:
| 12 months ended June 30, | ||||||||||||
| Change | ||||||||||||
| 2016 | 2015 | 2016 over 2015 | ||||||||||
| GAP | $ | 17.0 million | $ | 16.7 million | $ | 0.3 million | ||||||
| Bidder registrations | 2,322 | 2,092 | 11 | % | ||||||||
| Consignors | 225 | 195 | 15 | % | ||||||||
| Lots | 1,698 | 1,432 | 19 | % | ||||||||
For the same reasons discussed above, we continued to see improvements in all of our average industrial auction metrics for the 12 months ended June 30, 2016 compared to the 12 months ended June 30, 2015.
Website metrics4
The Ritchie Bros. website (www.rbauction.com) is a gateway to our online bidding system, which allows bidders to participate in our auctions over the internet and showcases upcoming auctions and equipment to be sold. This online bidding service gives our auction customers the choice of how they want to do business with us and access to both live and online auction participation.
Internet bidders comprised 64% of the total bidder registrations at our industrial auctions in the first half of 2016, compared to 62% in the first half of 2015. This increase in the level of internet bidders continues to demonstrate our ability to drive multichannel participation at our auctions.
Our EquipmentOne website (www.equipmentone.com) provides access to our online equipment marketplace.
The following table provides information about the average monthly users of our websites:
| As at June 30, | ||||||||||||
| % Change | ||||||||||||
| 2016 | 2015 | 2016 over 2015 | ||||||||||
| www.rbauction.com | 1,040,858 | 936,906 | 11 | % | ||||||||
| www.equipmentone.com | 99,805 | 92,046 | 8 | % | ||||||||
In the first half of 2016 compared to the first half of 2015, we continued to see a significant increase in the number of average monthly users of www.rbauction.com. This increase is primarily due to greater search traffic, which we believe is a direct result of our search engine optimization efforts that were focused on adapting our website to mobile devices.
Over the same comparative period, we also saw an increase in the number of average monthly users of www.equipmentone.com. We believe this increase is primarily due to greater efforts to focus the marketing effort in the first half of 2016, targeting to an audience that was more likely to transact on the online marketplace. As such, we believe this targeted marketing contributed to the increase in EquipmentOne revenues in the first half of 2016 compared to the first half of 2015.
During the first half of 2016, the average number of monthly visits to Mascus’ global websites was 3,342,357.
| 4 | None of the information in our websites is incorporated by reference into this document by this or any other reference. |
| Ritchie Bros. | 57 |
Online bidding and equipment marketplace purchase metrics
We continue to see an increase in the use and popularity of both our online bidding system and our online equipment marketplace. During the first six months of 2016, we attracted record first half online bidder registrations and sold approximately $1.1 billion of equipment, trucks and other assets to online auction bidders and EquipmentOne customers. This represents an 11% increase over the $1.0 billion of assets sold online in the first half of 2015, and a first half sales record.
Productivity
We measure Sales Force Productivity as rolling 12-month core auction GAP per Revenue Producer. It is an operational statistic that we believe provides a gauge of the effectiveness of Revenue Producers in increasing our GAP, and ultimately our net income. Sales Force Productivity was $12.0 million per Revenue Producer5 at June 30, 2016 and 2015. Sales Force Productivity remained consistent between June 30, 2016 and 2015 primarily as a result of increased turnover in Revenue Producers, particularly in the United States. New hires generally require a period of at least 18 months to reach productivity levels equal to that of their incumbents.
Our headcount statistics, which exclude Xcira and Mascus employees, as at the end of each period are presented below:
| Q2 2016 | Q1 2016 | Q4 2015 | Q3 2015 | Q2 2015 | Q1 2015 | Q4 2014 | Q3 2014 | |||||||||||||||||||||||||
| Total full-time employees | 1,600 | 1,559 | 1,522 | 1,513 | 1,515 | 1,479 | 1,468 | 1,472 | ||||||||||||||||||||||||
| Regional Sales Managers | 45 | 49 | 46 | 48 | 46 | 45 | 46 | 48 | ||||||||||||||||||||||||
| Territory Managers | 304 | 296 | 296 | 307 | 307 | 308 | 307 | 296 | ||||||||||||||||||||||||
| Revenue Producers | 349 | 345 | 342 | 355 | 353 | 353 | 353 | 344 | ||||||||||||||||||||||||
| Trainee Territory Managers | 28 | 26 | 31 | 26 | 24 | 30 | 29 | 31 | ||||||||||||||||||||||||
| Other sales personnel | 103 | 99 | 95 | 88 | 87 | 79 | 81 | 84 | ||||||||||||||||||||||||
| Sales personnel | 480 | 470 | 468 | 469 | 464 | 462 | 463 | 459 | ||||||||||||||||||||||||
Total headcount (excluding Xcira and Mascus employees) increased by net 85 between June 30, 2015 and June 30, 2016, which consisted of increases of net 16 sales personnel and net 69 administrative and operational personnel. Included in the administrative and operational personnel increase is an increase of net 15 personnel from RBFS. RBFS account managers generate financing fee revenue but do not produce GAP. As such, they are excluded from our definition of Revenue Producers and the measurement of Sales Force Productivity, which is based on core auction GAP.
Between June 30, 2015 and June 30, 2016, the number of Revenue Producers decreased by net four while the number of other sales personnel, including Trainee Territory Managers, increased by net 20, resulting in the overall net 16 increase in total sales personnel. Compared to December 31, 2015, the number of Revenue Producers and Territory Managers increased by net seven and eight, respectively, during the six-month period ended June 30, 2016.
Xcira had a total headcount of 51 at June 30, 2016, which has increased by net one since December 31, 2015. Mascus had a total headcount of 41 at June 30, 2016.
Outstanding Share Data
We are a public company and our common shares are listed under the symbol “RBA” on the NYSE and the TSX. On August 5, 2016, we had 106,624,829 common shares issued and outstanding and stock options outstanding to purchase a total of 3,560,664 common shares. No preferred shares have been issued or are outstanding. The outstanding stock options had a weighted average exercise price of $23.90 per share and a weighted average remaining term of 7.8 years.
| 5 | Revenue Producers is a term used to describe our revenue-producing sales personnel. This definition is comprised of Regional Sales Managers and Territory Managers. |
| Ritchie Bros. | 58 |
Share repurchase program
In March 2016, we executed the following share repurchases at a total cost of $36.7 million:
| Issuer purchases of equity securities | ||||||||||||||||
| (a) Total number of shares purchased (2) | (b) Average price paid per share (2) | (c) Total number of shares purchased as part of publically announced program (2) | (d) Maximum approximate dollar value of shares that may yet be purchased under the program (1) | |||||||||||||
| March 2016 (3) | 1,460,000 | $ | 25.15 | 1,460,000 | $ | 15.8 million | ||||||||||
| (1) | On January 12, 2015, we announced that our Board of Directors had authorized a share repurchase program for the repurchase of up $100 million worth of our common shares (subject to TSX approval) over the next three years. The initial normal course issuer bid approved by the TSX (the “initial NCIB”) was for a one-year period from March 3, 2015 through March 2, 2016. No purchases were made under the initial NCIB during the first quarter of 2016, and the initial NCIB expired in accordance with its terms on March 2, 2016. | |
| (2) | On February 25, 2016, we announced our intention to renew our normal course issuer bid on the expiry of the initial NCIB. On March 1, 2016, the TSX approved a new normal course issuer bid (the “new NCIB”) for a one-year period from March 3, 2016 to March 2, 2017. The information in the above table relates to purchases made, and eligible to be made in the future, pursuant to the new NCIB. | |
| (3) | Repurchases under the new NCIB during the month of March 2016 began on March 8, 2016 and ended on March 15, 2016. All repurchased shares were cancelled on March 15, 2016. No further share repurchases were made pursuant to the new NCIB, or by any other means, during the six months ended June 30, 2016. |
Liquidity and Capital Resources
Working capital
| (in U.S. $000's) | June 30, | December 31, | ||||||||||
| 2016 | 2015 | % Change | ||||||||||
| Cash and cash equivalents | $ | 166,501 | $ | 210,148 | (21 | )% | ||||||
| Restricted cash | $ | 196,171 | $ | 83,098 | 136 | % | ||||||
| Current assets | $ | 592,312 | $ | 430,099 | 38 | % | ||||||
| Current liabilities | 416,579 | 289,966 | 44 | % | ||||||||
| Working capital | $ | 175,733 | $ | 140,133 | 25 | % | ||||||
We believe that working capital is a more meaningful measure of our liquidity than cash alone. Our working capital increased during the six months ended June 30, 2016, primarily due to the refinancing of our long-term loan that fell due in May 2016, which resulted in the replacement of the current portion of long-term debt with non-current long-term debt. Net income generated during the period also contributed to the increase in working capital, partially offset by our repurchase of 1.46 million common shares for $36.7 million and the payment of dividends of $36.5 million.
Cash flows
| (in U.S. $000's) | Six months ended June 30, | |||||||||||
| % Change | ||||||||||||
| 2016 | 2015 | 2016 over 2015 | ||||||||||
| Cash provided by (used in): | ||||||||||||
| Operating activities | $ | 37,555 | $ | 133,157 | (72 | )% | ||||||
| Investing activities | (38,611 | ) | (5,183 | ) | 645 | % | ||||||
| Financing activities | (48,668 | ) | (45,699 | ) | 6 | % | ||||||
| Effect of changes in foreign currency rates | 6,077 | (7,881 | ) | (177 | )% | |||||||
| Net increase (decrease) in cash and cash equivalents | $ | (43,647 | ) | $ | 74,394 | (159 | )% | |||||
| Ritchie Bros. | 59 |
Operating activities
Net cash provided by operating activities decreased $95.6 million, or 72%, during the first half of 2016 compared to the first half of 2015. This decrease is primarily due to changes in our operating assets and liabilities, and in particular, restricted cash and inventory. Net cash provided by operating activities can fluctuate significantly from period to period due to factors such as differences in the timing, size and number of auctions during the period, the timing of the receipt of auction proceeds from buyers and of the payment of net amounts due to consignors, as well as the location of the auction with respect to restrictions on the use of cash generated therein.
Investing activities
Net cash used in investing activities increased $33.4 million, or 645%, during the first half of 2016 compared to the first half of 2015. This increase is primarily due to the acquisition of Mascus for cash consideration of $28.1 million, which is net of cash and cash equivalents acquired.
CAPEX Intensity presents net capital spending as a percentage of revenue. We believe that comparing CAPEX Intensity on a 12-month rolling basis for different financial periods provides useful information as to the amount of capital expenditure that we require to generate revenues.
| (in U.S. $ millions) | 12 months ended June 30, | |||||||||||
| % Change | ||||||||||||
| 2016 | 2015 | 2016 over 2015 | ||||||||||
| Property, plant and equipment additions | $ | 22.4 | $ | 17.2 | 30 | % | ||||||
| Intangible asset additions | 11.0 | 11.0 | - | |||||||||
| Proceeds on disposition of property plant and equipment | (14.2 | ) | (11.7 | ) | 21 | % | ||||||
| Net capital spending | $ | 19.2 | $ | 16.5 | 16 | % | ||||||
| Revenues | $ | 535.5 | $ | 511.8 | 5 | % | ||||||
| CAPEX Intensity | 3.6 | % | 3.2 | % | 13 | % | ||||||
The increase in CAPEX Intensity for the 12 months ended June 30, 2016 compared to the 12 months ended June 30, 2015 is primarily due to the increase in net capital spending, partially offset by the increase in revenues. The net capital spending increase was primarily the result of a 30% increase in property, plant and equipment additions, partially offset by a 21% increase in proceeds on disposition of property, plant and equipment. The majority of the property, plant and equipment additions during the 12 months ended June 30, 2016 occurred in the third and fourth quarters of 2015. These additions included the capitalization of costs to assets under development related to auction site improvements and computer system transformation initiatives, as well as the acquisition of yard and automotive equipment to support our operational and headcount growth.
Financing activities
Net cash used in financing activities increased $3.0 million, or 6%, in the first half of 2016 compared to the first half of 2015. The increase was primarily due to $9.9 million less cash provided in exchange for issuances of share capital combined with $5.2 million greater dividend payments in the first half of 2016 compared to the first half of 2015. The increase in cash used in financing activities was partially offset by our March 2016 share repurchase, which required $10.8 million less cash than our March 2015 share repurchase as a result of fewer shares being repurchased.
The $31.3 million in proceeds from short-term debt received during the first half of 2016, which were primarily borrowed in order to fund the Mascus acquisition, were significantly offset by the repayment of short-term debt of $24.2 million. In addition, the repayment of long-term debt of $46.6 million related to the Canadian dollar 60 million term loan that fell due in May 2016 was offset by the proceeds from long-term debt of $46.6 million received during the six months ended June 30, 2016 in order to refinance the aforementioned term loan.
| Ritchie Bros. | 60 |
We declared and paid regular cash dividends of $0.16 per common share for the quarter ended June 30, 2015, and declared and paid regular cash dividends of $0.16 per common share for the quarters ended September 30, 2015, December 31, 2015, and March 31, 2016. We have declared, but not yet paid, a dividend of $0.17 per common share for the quarter ended June 30, 2016.
Total dividend payments during the six months ended June 30, 2016 were $34.2 million to stockholders and $2.4 million to non-controlling interests. This compares to total dividend payments of $30.0 million to stockholders and $1.3 million to non-controlling interests during the six months ended June 30, 2015. All dividends we pay are “eligible dividends” for Canadian income tax purposes unless indicated otherwise.
Adjusted results
Adjusted Dividend Payout Ratio
Adjusted Dividend Payout Ratio is non-GAAP financial measure. We believe that comparing the Adjusted Dividend Payout Ratio for different financial periods provides useful information about how well our net income supports our dividend payments. Refer to the table under “Return on Invested Capital” below for a reconciliation of Adjusted Net Income attributable to stockholders to the most directly comparable GAAP measures in the consolidated income statements on a rolling 12-month basis. Adjusted Dividend Payout Ratio is calculated by dividing dividends paid to stockholders by Adjusted Net Income attributable to stockholders.
The following table presents our Adjusted Net Income attributable to stockholders and Adjusted Dividend Payout Ratio results on a rolling 12-month basis, and reconciles those metrics to dividends paid to stockholders and net income attributable to stockholders, which are the most directly comparable GAAP measures in our consolidated financial statements:
| (in U.S. $ millions) | 12 months ended June 30, | |||||||||||
| % Change | ||||||||||||
| 2016 | 2015 | 2016 over 2015 | ||||||||||
| Dividends paid to stockholders | $ | 68.5 | $ | 60.1 | 14 | % | ||||||
| Net income attributable to stockholders | $ | 136.5 | $ | 109.7 | 24 | % | ||||||
| Pre-tax adjusting items: | ||||||||||||
| Management reorganization | - | 5.5 | (100 | %) | ||||||||
| Gain on sale of excess property | (8.4 | ) | (3.4 | ) | (147 | %) | ||||||
| Impairment loss | - | 8.1 | (100 | %) | ||||||||
| Current income tax effect of adjusting items: | ||||||||||||
| Management reorganization | - | (1.3 | ) | 100 | % | |||||||
| Gain on sale of excess property | 1.1 | 0.4 | 175 | % | ||||||||
| Deferred tax adjusting item: | ||||||||||||
| Tax loss utilization | (7.9 | ) | - | (100 | %) | |||||||
| Adjusted Net Income attributable to stockholders | $ | 121.3 | $ | 119.0 | 2 | % | ||||||
| Adjusted Dividend Payout Ratio | 56.5 | % | 50.5 | % | 12 | % | ||||||
Adjusting items for the 12 months ended June 30, 2016 included a $7.3 million ($8.4 million before tax, or $0.07 per diluted share) gain on the sale of excess property in Edmonton, Canada, and a $7.9 million (or $0.07 per diluted share) tax saving generated by tax loss utilization, both recognized in the fourth quarter of 2015.
| Ritchie Bros. | 61 |
Adjusting items for the 12 months ended June 30, 2015 included $4.2 million ($5.5 million before tax, or $0.04 per diluted share) in termination benefit expenses related to the fourth quarter 2014 management reorganization, a $2.9 million ($3.4 million before tax, or $0.03 per diluted share) gain on the sale of our former permanent auction site in Grande Prairie, Canada, recognized in the third quarter of 2014, and an $8.1 million (or $0.08 per diluted share; no tax effect) impairment loss recorded against our land and improvements and auction building in Narita, Japan, also recognized in the third quarter of 2014.
The increase in our Adjusted Dividend Payout Ratio reflects our use of net income for providing returns to shareholders.
Operating Free Cash Flow (“OFCF”)
OFCF is non-GAAP financial measure that we believe, when compared on a 12-month rolling basis to different financial periods, provides an effective measure of the cash generated by our business and provides useful information regarding cash flows remaining for discretionary return to stockholders, mergers and acquisitions, or debt reduction. OFCF is also an element of the performance criteria for certain annual short-term incentive awards we grant to our employees and officers. We calculate OFCF by subtracting net capital spending from cash provided by operating activities.
The following table presents our OFCF results on a rolling 12-month basis, and reconciles that metric to cash provided by operating activities and net capital spending, which are the most directly comparable GAAP measures in our consolidated statements of cash flows:
| (in U.S. $ millions) | 12 months ended June 30, | |||||||||||
| % Change | ||||||||||||
| 2016 | 2015 | 2016 over 2015 | ||||||||||
| Cash provided by operating activities | $ | 100.8 | $ | 234.6 | (57 | )% | ||||||
| Property, plant and equipment additions | 22.4 | 17.2 | 30 | % | ||||||||
| Intangible asset additions | 11.0 | 11.0 | - | |||||||||
| Proceeds on disposition of property plant and equipment | (14.2 | ) | (11.7 | ) | 21 | % | ||||||
| Net capital spending | $ | 19.2 | $ | 16.5 | 16 | % | ||||||
| Operating Free Cash Flow | $ | 81.6 | $ | 218.1 | (63 | )% | ||||||
The OFCF decrease for the 12 months ended June 30, 2016 compared to the 12 months ended June 30, 2015 was primarily the result of a $133.8 million decrease in cash provided by operating activities over the same comparative period. The decrease in cash provided by operating activities is primarily due to changes in our operating assets and liabilities, and in particular, inventory and restricted cash. The most significant change in inventory occurred during the second quarter of 2016, which resulted in a decrease in cash provided by operating activities of $46.3 million. Restricted cash balances can fluctuate significantly from period to period due to factors such as differences in the timing, size and location of the auction.
Return on Invested Capital (“ROIC”)
ROIC is a non-GAAP financial measure that we believe, by comparing on a 12-month rolling basis for different financial periods, provides useful information about the after-tax return generated by our investments. ROIC is also an element of the performance criteria for certain PSUs we granted to our employees and officers in 2013 and 2014. We calculate ROIC as Adjusted Net Income attributable to stockholders divided by average invested capital. Average invested capital is a GAAP measure calculated as the average long-term debt (including current and non-current portions) and stockholders’ equity over a rolling 12-month period.
| Ritchie Bros. | 62 |
The following table presents our Adjusted Net Income attributable to stockholders and ROIC results on a 12-month rolling basis, and reconciles those metrics to net income attributable to stockholders, long-term debt, and stockholders’ equity, which are the most directly comparable GAAP measures in our consolidated financial statements:
| (in U.S. $ millions) | 12 months ended June 30, | |||||||||||
| % Change | ||||||||||||
| 2016 | 2015 | 2016 over 2015 | ||||||||||
| Net income attributable to stockholders | $ | 136.5 | $ | 109.7 | 24 | % | ||||||
| Pre-tax adjusting items: | ||||||||||||
| Management reorganization | - | 5.5 | (100 | )% | ||||||||
| Gain on sale of excess property | (8.4 | ) | (3.4 | ) | (147 | )% | ||||||
| Impairment loss | - | 8.1 | (100 | )% | ||||||||
| Current income tax effect of adjusting items: | ||||||||||||
| Management reorganization | - | (1.3 | ) | 100 | % | |||||||
| Gain on sale of excess property | 1.1 | 0.4 | 175 | % | ||||||||
| Deferred tax adjusting item: | ||||||||||||
| Tax loss utilization | (7.9 | ) | - | (100 | )% | |||||||
| Adjusted Net Income attributable to stockholders | $ | 121.3 | $ | 119.0 | 2 | % | ||||||
| Opening long-term debt | 105.2 | 128.3 | (18 | )% | ||||||||
| Ending long-term debt | 102.7 | 105.2 | (2 | )% | ||||||||
| Average long-term debt | $ | 104.0 | $ | 116.8 | (11 | )% | ||||||
| Opening stockholders' equity | 691.1 | 715.8 | (3 | )% | ||||||||
| Ending stockholders' equity | 709.0 | 691.1 | 3 | % | ||||||||
| Average stockholders' equity | $ | 700.1 | $ | 703.5 | - | |||||||
| Average invested capital | $ | 804.1 | $ | 820.3 | (2 | )% | ||||||
| ROIC | 15.1 | % | 14.5 | % | 4 | % | ||||||
The increase in ROIC for the 12 months ended June 30, 2016 compared to the 12 months ended June 30, 2015 was the result of an increase in net income attributable to stockholders combined with a decrease in average invested capital. Average invested capital decreased primarily due to reductions in long-term debt resulting from lower levels of borrowings combined with the effect that the weakening Canadian dollar, relative to the U.S. dollar, had on our Canadian dollar-denominated debt.
Debt and credit facilities
At June 30, 2016, our short-term debt of $22.4 million consisted of borrowings under our committed, revolving credit facility, and had a weighted average annual interest rate of 1.8%. This compares to current borrowings of $12.4 million as at December 31, 2015, with a weighted average annual interest rate of 1.8%.
The $43.3 million current portion of long-term debt as at December 31, 2015 consisted entirely of our Canadian dollar 60 million term loan under our uncommitted, revolving credit facility. We refinanced this term loan on a long-term basis when it fell due on May 4, 2016 by drawing on our committed, revolving credit facility. As at June 30, 2016, we had a total of $102.7 million long-term debt, with a weighted average annual interest rate of 2.9%. This compares to long-term debt of $97.9 million as at December 31, 2015, with a weighted average annual interest rate of 5.0%.
| Ritchie Bros. | 63 |
Future scheduled interest payments over the next five years relating to our long-term debt outstanding at June 30, 2016 were as follows:
| (in U.S. $000's) | Scheduled interest payments | |||||||||||||||||||||||
| In 2016 | In 2017 | In 2018 | In 2019 | In 2020 | Thereafter | |||||||||||||||||||
| On long-term debt | $ | 1,501 | $ | 3,002 | $ | 2,525 | $ | 2,188 | $ | 2,188 | $ | 3,015 | ||||||||||||
Our credit facilities are with financial institutions in the United States, Canada and the Netherlands. Certain of the facilities include commitment fees applicable to the unused credit amount. We were in compliance with all financial and other covenants applicable to our credit facilities at June 30, 2016.
We believe our existing working capital and availability under our credit facilities are sufficient to satisfy our present operating requirements, as well as to fund future growth including, but not limited to, mergers and acquisitions, development of EquipmentOne, and other growth opportunities.
Scorecard Summary
The following tables summarize the adjusted results discussed above that appear in our performance scorecards:
Income statement scorecard
| (in U.S. $ millions, except EPS) | Three months ended June 30, | Six months ended June 30, | ||||||||||||||||||||||
| Better/(Worse) | Better/(Worse) | |||||||||||||||||||||||
| 2016 | 2015 | 2016 over 2015 | 2016 | 2015 | 2016 over 2015 | |||||||||||||||||||
| GAP | $ | 1,275.7 | $ | 1,262.2 | 1 | % | $ | 2,295.6 | $ | 2,217.7 | 4 | % | ||||||||||||
| Revenues | $ | 158.8 | $ | 155.5 | 2 | % | $ | 290.8 | $ | 271.1 | 7 | % | ||||||||||||
| Revenue Rate | 12.45 | % | 12.32 | % | 13 bps | 12.67 | % | 12.22 | % | 45 bps | ||||||||||||||
| Operating income | $ | 53.6 | $ | 62.8 | (15 | )% | $ | 92.8 | $ | 95.8 | (3 | )% | ||||||||||||
| Operating Income Margin | 33.8 | % | 40.4 | % | (660 bps | ) | 31.9 | % | 35.3 | % | (340 bps | ) | ||||||||||||
| Diluted EPS attributable to stockholders | $ | 0.37 | $ | 0.42 | (12 | )% | $ | 0.65 | $ | 0.64 | 2 | % | ||||||||||||
Balance sheet scorecard
| (in U.S. $ millions) | 12 months ended June 30, | |||||||||||
| Better/(Worse) | ||||||||||||
| 2016 | 2015 | 2016 over 2015 | ||||||||||
| Operating Free Cash Flow | $ | 81.6 | $ | 218.1 | (63 | )% | ||||||
| CAPEX Intensity | 3.6 | % | 3.2 | % | (40 bps | ) | ||||||
| Return on Invested Capital | 15.1 | % | 14.5 | % | 60 bps | |||||||
| Debt/Adjusted EBITDA | 0.6 | x | 0.6 | x | - | |||||||
Off-Balance Sheet Arrangements
We have no off-balance sheet arrangements that have or are reasonably likely to have a current or future material effect on our financial condition, changes in financial condition, revenues or expenses, financial performance, liquidity, capital expenditures or capital resources.
| Ritchie Bros. | 64 |
Critical Accounting Policies, Judgments, Estimates and Assumptions
Aside from those discussed below, there were no material changes in our critical accounting policies, judgments, estimates and assumptions from those disclosed in our Annual Report on Form 10-K for the year ended December 31, 2015, which is available on our website at www.rbauction.com, on EDGAR at www.sec.gov, or on SEDAR at www.sedar.com, or in the notes to our consolidated financial statements included in “Part I, Item 1: Consolidated Financial Statements” in this Form 10-Q
Changes in Accounting Policies
There have been no changes in our significant accounting policies during the three months ended June 30, 2016.
| ITEM 3: | QUANTITATIVE AND QUALITATIVE DISCLOSURES ABOUT MARKET RISK |
There have been no material changes to the Company’s market risk during the six months ended June 30, 2016 from those disclosed in the Company’s Annual Report on Form 10-K for the year ended December 31, 2015, which is available on our website at www.rbauction.com, on EDGAR at www.sec.gov, or on SEDAR at www.sedar.com.
| ITEM 4: | CONTROLS AND PROCEDURES |
Disclosure Controls and Procedures
Management of the Company, including the Chief Executive Officer (“CEO”) and Chief Financial Officer (“CFO”), have evaluated the effectiveness of the Company’s disclosure controls and procedures as at June 30, 2016. The term “disclosure controls and procedures” means controls and other procedures established by the Company that are designed to ensure that information required to be disclosed by the Company in the reports that it files or submits under the Exchange Act is recorded, processed, summarized and reported within the time periods specified in the Securities and Exchange Commission’s (“SEC’s”) rules and forms. Disclosure controls and procedures include, without limitation, controls and procedures designed to ensure that information required to be disclosed by the Company in the reports that it files or submits under the Exchange Act is accumulated and communicated to the Company’s management, including its CEO and CFO, as appropriate, to allow timely decisions regarding required disclosure.
Based upon their evaluation of the Company’s disclosure controls and procedures, the CEO and the CFO concluded that the disclosure controls are effective to provide reasonable assurance that information required to be disclosed by the Company in the reports that it files or submits under the Exchange Act is accumulated and communicated to management, including the CEO and CFO, as appropriate, to allow timely decisions regarding required disclosure and are effective to provide reasonable assurance that such information is recorded, processed, summarized and reported within the time periods specified by the SEC’s rules and forms.
The Company, including its CEO and CFO, does not expect that its internal controls and procedures will prevent or detect all error and all fraud. A control system, no matter how well conceived or operated, can provide only reasonable, not absolute, assurance that the objectives of the control system are met.
Changes in Internal Control over Financial Reporting
Management, with the participation of the CEO and CFO, concluded that there were no changes in the Company’s internal control over financial reporting during the quarter ended June 30, 2016 that have materially affected, or are reasonably likely to materially affect, the Company’s internal control over financial reporting.
| Ritchie Bros. | 65 |
| ITEM 1: | LEGAL PROCEEDINGS |
The Company has no material legal proceedings pending, other than ordinary routine litigation incidental to the business, and management does not know of any material proceedings contemplated by governmental authorities.
| ITEM 1A: | RISK FACTORS |
Our business is subject to a number of risks and uncertainties, and our past performance is no guarantee of our performance in future periods. In addition to the other information set forth in this Form 10-Q, you should carefully consider the risks and uncertainties discussed in “Part 1, Item 1A: Risk Factors” of our Annual Report on Form 10-K for the year ended December 31, 2015, which is available on our website at www.rbauction.com, on EDGAR at www.sec.gov, or on SEDAR at www.sedar.com, before purchasing our common shares. Our business could also be affected by additional risks not currently known to us or that we currently deem to be immaterial. If any of the risks actually occur, our business, financial condition and results of operations could materially suffer. As a result, the trading price of our common shares could decline, and you may lose all or part of your investment.
There were no material changes in risk factors during the six months ended June 30, 2016.
| ITEM 2: | UNREGISTERED SALES OF EQUITY SECURITIES AND USE OF PROCEEDS |
None during the three months ended June 30, 2016.
| ITEM 6: | EXHIBITS |
Exhibits
The exhibits listed in below are filed as part of this Form 10-Q and incorporated herein by reference.
| Exhibit | ||
| Number | Document | |
| 10.1 | Amended and Restated Stock Option Plan, dated May 2, 2016 | |
| 31.1 | Certification of Chief Executive Officer pursuant to Rule 13a-14(a) under the Securities Exchange Act of 1934, as amended | |
| 31.2 | Certification of Chief Financial Officer pursuant to Rule 13a-14(a) under the Securities Exchange Act of 1934, as amended | |
| 32.1 | Certification of Chief Executive Officer pursuant to 18 U.S.C. Section 1350, as adopted pursuant to Section 906 of the Sarbanes-Oxley Act of 2002 | |
| 32.2 | Certification of Chief Financial Officer pursuant to 18 U.S.C. Section 1350, as adopted pursuant to Section 906 of the Sarbanes-Oxley Act of 2002 | |
| 101.INS | XBRL Instance Document | |
| 101.SCH | XBRL Taxonomy Extension Schema Document | |
| 101.CAL | XBRL Taxonomy Extension Calculation Linkbase Document | |
| 101.DEF | XBRL Taxonomy Extension Definition Linkbase Document | |
| 101.LAB | XBRL Taxonomy Extension Label Linkbase Document | |
| 101.PRE | XBRL Taxonomy Extension Presentation Linkbase Document |
| Ritchie Bros. | 66 |
Pursuant to the requirements of the Securities Exchange Act of 1934, the registrant has duly caused this report to be signed on its behalf by the undersigned, thereunto duly authorized.
| RITCHIE BROS. AUCTIONEERS INCORPORATED | ||
| Dated: August 8, 2016 | By: | /s/ Ravichandra K. Saligram |
| Ravichandra K. Saligram | ||
| Chief Executive Officer | ||
| Dated: August 8, 2016 | By: | /s/ Sharon R. Driscoll |
| Sharon R. Driscoll | ||
| Chief Financial Officer | ||
| Ritchie Bros. | 67 |