Attached files
| file | filename |
|---|---|
| EX-99.1 - EARNINGS PRESS RELEASE FOR THE SECOND QUARTER OF 2016 - Global Eagle Entertainment Inc. | v446258_ex99-1.htm |
| 8-K - FORM 8-K - Global Eagle Entertainment Inc. | v446258_8-k.htm |
Exhibit 99.2

August 8, 2016 Second Quarter 2016 Earnings

Page 2 SAFE HARBOR STATEMENT Global Eagle Entertainment We make forward - looking statements in this presentation within the meaning of the Private Securities Litigation Reform Act of 1995 . These forward - looking statements relate to expectations or forecasts for future events, including, without limitation, our ability to achieve synergies from the EMC acquisition, our ability to complete negotiations with major record labels to settle legacy sound recording liabilities on contemplated terms, our earnings, Adjusted EBITDA, revenues, expenses, capital expenditures, aircraft connectivity installations or other future financial or business performance or strategies, or the impact of legal or regulatory matters on our business, results of operations or financial condition . These statements may be preceded by, followed by or include the words “may,” “might,” “will,” “will likely result,” “should,” “estimate,” “plan,” “project,” “forecast,” “intend,” “expect,” “anticipate,” “believe,” “seek,” “continue,” “target” or similar expressions . These forward - looking statements are based on information available to us as of the date they were made (which is August 8 , 2016 ), and involve a number of risks and uncertainties which may cause them to turn out to be wrong . Accordingly, forward - looking statements should not be relied upon as representing our views as of any subsequent date, and we do not undertake any obligation to update forward - looking statements to reflect events or circumstances after the date they were made, whether as a result of new information, future events or otherwise, except as may be required under applicable securities laws . As a result of a number of known and unknown risks and uncertainties, our actual results or performance may be materially different from those expressed or implied by these forward - looking statements . Please refer to our second quarter earnings release, furnished on Form 8 - K, our most recent quarterly reports filed on Form 10 - Q, and our most recent annual report filed on Form 10 - K, and in particular any discussion of risk factors or forward - looking statements therein, which are available on the SEC’s website (www . sec . gov), for a full discussion of the risks and other factors that may impact any forward - looking statements in this presentation or that you may hear today .

Page 3 + Acquisition creates leading provider of global satellite - based connectivity and media across air, sea and land Fast and Reliable Connectivity Premium Media Solutions 3 CLOSED EMC ACQUISITION Introduction

Page 4 GROWTH, INTEGRATION, AND SYNERGY REALIZATION EMC Acquisition Maritime Opportunities Commercial Aviation Opportunities Cross - Selling Opportunities • Integration process underway • Immediately initiated cost - saving synergy realization plan Expected cost - synergies of $15M in 2017, and $40M in 2018 and thereafter
Page 5 ACQUISITION HIGHLIGHTS EMC Acquisition T he combination provides GEE with: • An unparalleled portfolio of products and services tailored to mobility markets • A global sales force and support organization that reaches all major mobility verticals • A satellite and ground - based network infrastructure that can provide customers connectivity and media anywhere in the world • Proprietary , patented technologies that reach across air, sea and land markets • Enhanced engineering, technical and managerial resources • Significant cross - selling opportunities for content services, digital media and content distribution

Page 6 2Q16 FINANCIAL OVERVIEW Second Quarter 2016 Results • Solid financial results and business execution for 2Q16 • Revenue of $112.3 million • Adjusted EBITDA* of $11.2 million * See Appendix A and Appendix B for the definition of Adjusted EBITDA and a reconciliation to Net Income Dollars in Millions Dollars in Millions

Page 7 CONTENT HIGHLIGHTS Second Quarter 2016 Results • Revenue of $78.7 million, representing year over year growth of 7% • Content business unit continues steady growth • Won new business in Asia - Pacific during the quarter • Added rights for international cricket & UK Premiership Rugby Union • Signed deals with four new television channels • Added advertisers such as Westin, Allstate, Marriott, and Cadillac • Substantially completed settlement negotiations with major labels regarding legacy sound - recording liabilities, and expect to enter into settlement agreements in 3Q16

Page 8 CONNECTIVITY HIGHLIGHTS Second Quarter 2016 Results • Revenue of $33.6 million, representing year over year growth of 17% • 30 new aircraft installations in Q2, a record since the formation of GEE – Total of nearly 750 installed aircraft – Expect significant 2H16 ramp • Strong sales pipeline; activity in industry increasing • Announced inflight connectivity deal with Avianca Brasil • Continued installations on flydubai with expectation of full fleet completion in six to nine months • Added four new airline customers for n avAero EFB solution • Signed two new customers for masFlight operations data platform

Page 9 AVIANCA BRASIL WIN Second Quarter 2016 Results • Contract to provide inflight connectivity solutions to Avianca Brasil’s fleet of 40 aircraft with installations expected to begin in the Fall • Avianca Brasil and its partner airline Avianca have been GEE Content customers since 2015 • Expands our relationship to provide a fully - integrated entertainment and connectivity solution that is unparalleled in the industry • Leverages EMC bandwidth in South America and reduces start - up costs • Implementing EMC’s Speednet technology to improve browsing speeds
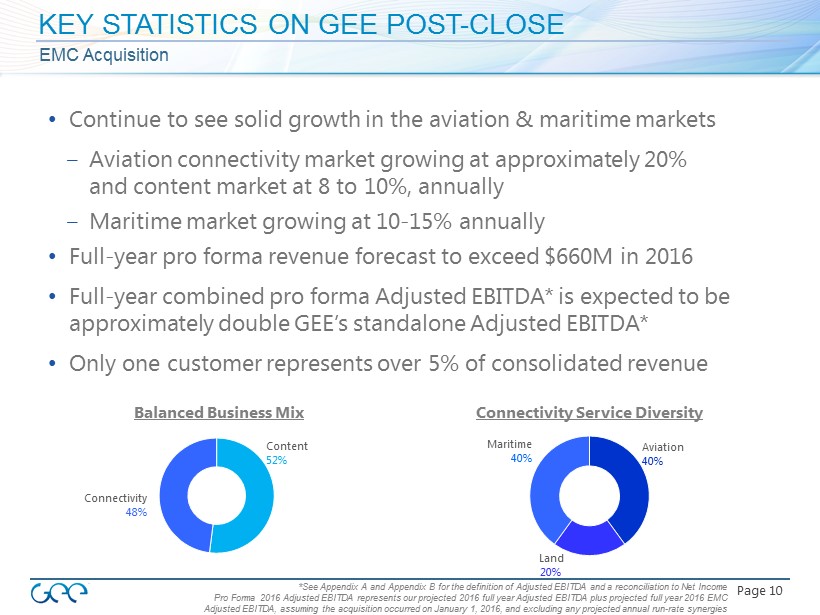
Page 10 KEY STATISTICS ON GEE POST - CLOSE EMC Acquisition • Continue to see solid growth in the aviation & maritime markets – Aviation connectivity market growing at 20 - 25% and content market at 8 to 10 %, annually – Maritime market growing at 10 - 15% annually • Full - year pro forma revenue forecast to exceed $ 660M in 2016 • Full - year combined pro forma Adjusted EBITDA* is expected to be approximately double GEE’s standalone Adjusted EBITDA* • Only one customer represents over 5% of consolidated revenue Balanced Business Mix Connectivity 48% Content 52% Connectivity Service Diversity Maritime 4 0% Land 20% Aviation 40% *See Appendix A and Appendix B for the definition of Adjusted EBITDA and a reconciliation to Net Income Pro Forma 2016 Adjusted EBITDA represents our projected 2016 full year Adjusted EBITDA plus projected full year 2016 EMC Adjusted EBITDA, assuming the acquisition occurred on January 1, 2016, and excluding any projected annual run - rate synergies

Page 11 ORGANIZATIONAL STRUCTURE CHANGES EMC Acquisition

Page 12 INTEGRATION AND SYNERGY REALIZATION EMC Acquisition • Majority of savings from network efficiencies – Optimizing bandwidth costs through a consolidation of existing network assets, space segment and ground infrastructure – Better capacity utilization • Further savings through reductions in SG&A spending • Revenue synergies through driving more content to the maritime industry – Today, maritime content represents less than 5% of GEE’s Content segment revenue Expected cost - synergies of $15M in 2017, and $40M in 2018 and thereafter
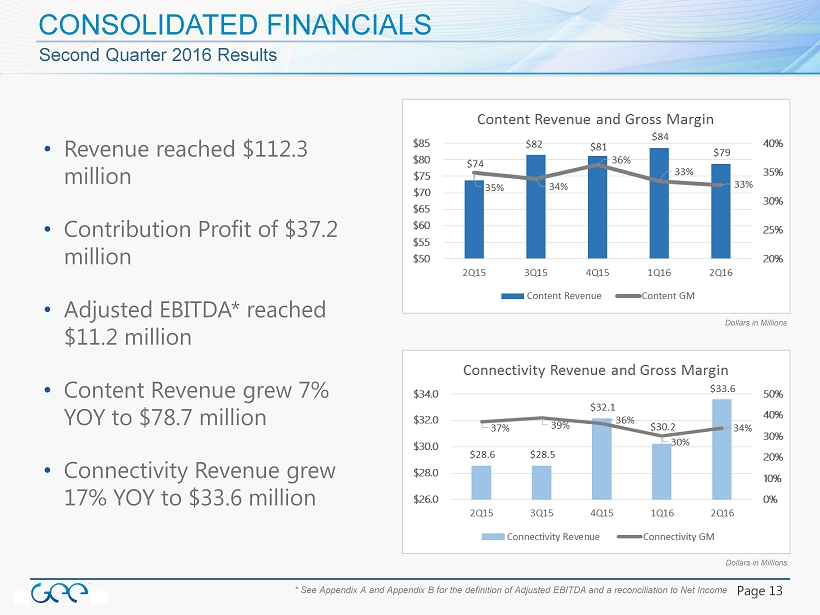
Page 13 CONSOLIDATED FINANCIALS Second Quarter 2016 Results • Revenue reached $112.3 million • Contribution Profit of $ 37.2 million • Adjusted EBITDA* reached $11.2 million • Content Revenue grew 7% YOY to $78.7 million • Connectivity Revenue grew 17% YOY to $33.6 million * See Appendix A and Appendix B for the definition of Adjusted EBITDA and a reconciliation to Net Income Dollars in Millions Dollars in Millions

Page 14 BALANCE SHEET AND CAPITAL STRUCTURE Global Eagle Entertainment ( 1) Represents unvested equity under GEE’s 2013 Equity Incentive Plan. (2) Represents unvested equity under 2016 Inducement and Retention Stock Plan for EMC Employees. Post Transaction Equity (shares in millions) GEE As of 6/30/16 Issued for EMC Transaction Post Transaction Vested Unvested Vested Unvested Vested Unvested Common Stock 78.1 - 5.6 - 83.7 - Options 3.2 3.1 - 0.5 3.2 3.6 RSUs 0.0 0.6 - 0.3 0.0 0.9 Public SPAC Warrants 6.2 - - - 6.2 - Legacy Row 44 Warrants 1.2 - - - 1.2 - (1) (1) (2) (2) Post Transaction Debt (dollars in millions) Principal Amt Available Current Outstanding at 7/27/16 Interest Rate New Revolver $29 $47 L + 5.75% 1st Lien Term 265 - L + 5.75% 2nd Lien Term 92 - L + 9.625% Convertible Note 83 - 2.75% Total Debt $469 Approx. Cash at Closing $100 Net Debt $369

Page 15 BUSINESS OUTLOOK Global Eagle Entertainment Including the impact of the EMC acquisition on the last 5 months of 2016, we are updating our full year 2016 guidance as follows: • Had GEE not closed the EMC acquisition prior to releasing earnings, it would have reiterated its prior 2016 guidance • New 2016 Full Year Revenue of $545 - $575 million • New 2016 Full Year Adjusted EBITDA* of $80 - $92 million • New 2016 Full Year Capex range from $40 to $45 million * See Appendix A and Appendix B for the definition of Adjusted EBITDA and a reconciliation to Net Income
Page 16 Q&A Global Eagle Entertainment +

Page 17 DEFINITION OF ADJUSTED EBITDA Appendix A To supplement our consolidated financial statements, which are prepared and presented in accordance with generally accepted accounting principles, or GAAP, we present Adjusted EBITDA, which is a non - GAAP financial measure, as a measure of our performance . The presentation of Adjusted EBITDA is not intended to be considered in isolation from, or as a substitute for, or superior to, net income (loss) or any other performance measures derived in accordance with GAAP or as an alternative to net cash provided by operating activities or any other measures of our cash flows or liquidity . For more information on this non - GAAP financial measure, please see the table entitled “Reconciliation of Non - GAAP Measure to GAAP Measure” at the end of this presentation . Adjusted EBITDA is one of the primary measures used by our management and board of directors to understand and evaluate our financial performance and operating trends, including period to period comparisons, to prepare and approve our annual budget and to develop short and long term operational plans . Additionally, Adjusted EBITDA is one of the primary measures used by the compensation committee of our board of directors to establish the funding targets for our annual bonus pool for our employees and executives . We believe our presentation of Adjusted EBITDA is useful to investors both because it allows for greater transparency with respect to key metrics used by management in its financial and operational decision - making and our management frequently uses it in discussions with investors, commercial bankers, securities analysts and other users of our financial statements . We define Adjusted EBITDA as net income (loss) attributable to common stockholders before, when applicable, net income (loss) attributable to non - controlling interests, income tax expense (benefit), other (income) expense, depreciation and amortization, as further adjusted to eliminate the impact of, when applicable, stock - based compensation, acquisition and realignment costs, restructuring charges, foreign exchange gain (loss) on intercompany loans and any gains or losses on certain asset sales or dispositions . Other income (expense), acquisition and realignment costs and restructuring charges include such items, when applicable, as (a) non - cash GAAP purchase accounting adjustments for certain deferred revenue and costs, (b) legal, accounting and other professional fees directly attributable to acquisition activity, (c) employee severance payments and third party professional fees directly attributable to acquisition or corporate realignment activities, (d) legal settlements or reserves for legal settlements in the period that pertain to matters existing at acquired companies, (e) changes in the fair value of our derivative financial instruments, (f) interest expense associated with our debt and (g) any restructuring charges in the period pursuant to our integration plan announced on September 23 , 2014 . Management does not consider these costs to be indicative of our core operating results . EMC Adjusted EBITDA is defined as the consolidated net income (loss) of EMC plus ( i ) total interest expense, (ii) amortization of financing fees, (iii) provision (benefit) for taxes based on income, profits or capital gains, (iv) depreciation and amortization, (v) unusual or non - recurring charges, expenses or losses, (vi) non - cash charges, expenses or losses including any non - cash expense related to the accretion of preferred stock or vesting of warrants, (vii) retention and severance expenses, (viii) any restructuring costs, integration costs, transition costs, or costs incurred in non - recurring strategic initiatives, (ix) other accruals and amortization thereof, (x) proceeds of business interruption insurance, (xi) any non - cash increase in expenses resulting from the revaluation of inventory or due to purchase accounting, (xi) letter of credit fees, (xii) the amount of management fees or sponsor reimbursement expenses, (xiii) any equity funded employee plan costs, (xiv) any net loss from discontinued operations, (xv) EMC’s proportional share of Wireless Maritime Services’ EBITDA for the same period and (xvi) any non - cash loss related to foreign currency translation that were not included in consolidated net income . With respect to projected full year 2016 Adjusted EBITDA, a quantitative reconciliation is not available without unreasonable efforts due to the high variability, complexity and low visibility with respect to taxes, purchase accounting adjustments, acquisition - related charges and legal settlement reserves excluded from Adjusted EBITDA . We expect that the variability of these items t o have a potentially unpredictable, and potentially significant, impact on our future GAAP financial results .

Page 18 NET INCOME TO ADJUSTED EBITDA RECONCILIATION Appendix B 1Q15 2Q15 3Q15 4Q15 1Q16 2Q16 Net Income (3.4) 13.0 (6.9) (4.8) (2.4) (38.2) NI Attributable to Non - Controlling Interests - - - - - - Income Tax (0.7) 1.3 0.2 0.7 3.2 0.7 Other Income (Expense) 0.1 (13.8) 3.3 2.1 (5.7) (4.4) Depreciation and Amortization 8.2 8.2 9.5 10.7 10.5 11.0 Stock - based Compensation 2.6 1.6 2.1 2.0 2.1 2.2 Acquisition and Realignment Costs 1.2 2.0 5.8 4.7 2.6 39.8 Restructuring Charges 0.3 - 0.1 0.1 - - F/X Gain (Loss) on Intercompany Loan - - - - - - Adjusted EBITDA $8.2 $12.2 $14.1 $15.5 $10.3 $11.2 Dollars in Millions