Attached files
| file | filename |
|---|---|
| 8-K - FORM 8-K - DPL INC | dp67825_8k.htm |

1 Sources, U ses and Pro forma Capitalization 1 Pro forma equity reflects impacts of estimated adjustments required as part of generation s eparation ² EBITDA references in this section reflect adjusted EBITDA guidance following anticipated rate case outcome, see slide 25 an d A ppendix for further information 3 Reflects post refinancing and pro forma rate case adjusted EBITDA see page 25 for additional detail 4 Adjusted EBITDA is a non - GAAP measure, refer to Appendix for additional information 5 The pro forma capitalization statistics represent only those of The Dayton Power and Light Company (the Borrower) and do not in clude other DPL Inc. subsidiaries as shown on slide 11 Exhibit 99.1 xEBITDA 3 xEBITDA 3 Cash $45 - - ($11) $34 - - ($13) $21 - - - New Senior Secured Term Loan B - - - 445 445 29.6% 2.2x 445 46.9% 3.7x 3.0x $175 million unsecured RCF, maturing 2020 - - - - - - - - - - 1.875% First mortgage bonds due 2016 445 29.6% 2.2x (445) - - - - - - - 4.800% pollution control series due 2036 100 6.7% 0.5x 100 6.7% 0.5x 100 10.5% 0.8x 0.7x Variable rate pollution control series due 2020 200 13.3% 1.0x 200 13.3% 1.0x (13) 187 19.7% 1.6x 1.2x 4.2% US government note due 2061 18 1.2% 0.1x 18 1.2% 0.1x 18 1.9% 0.2x 0.1x Total consolidated debt $763 50.8% 3.7x $763 50.8% 3.7x $750 79.0% 6.3x 5.0x Net consolidated debt $718 47.8% 3.5x $729 48.5% 3.5x $729 76.7% 6.1x 4.9x Book value of shareholder's equity¹ $717 47.7% 3.5x $717 47.7% 3.5x (540) $177 18.6% 1.5x 1.2x Preferred shares 23 1.5% 0.1x 23 1.5% 0.1x 23 2.4% 0.2x 0.2x Total book capitalization $1,502 100.0% 7.3x $1,502 100.0% 7.3x $949 100.0% 8.0x 6.3x DP&L 2015 Adj. EBITDA (excluding SSR) 4 $206 $206 NA NA DP&L 2015 Adj. EBITDA T&D only (excluding SSR) 4 $119 $150 Pro forma Capitalization 5 Estimated generation separation adjustments Adjustment for new TLB PF amount ($M) Percent book capPF amount ($M) Percent book cap Percent book capxEBITDA 3 Current Pro forma for TLB Amount ($M) as of 6/30/2016 Pro forma for TLB & Separation xRate Case EBITDA 3 2 Sources ($M) Uses ($M) New Senior Secured Term Loan B ("TLB") $445 Repay existing First Mortgage Bonds due 2016 $445 Cash from balance sheet 11 Estimated fees, expenses and OID 10 Redemption costs 1 Total Sources $456 Total Uses $456 Sources and Uses

2 Key Regulatory Updates – Distribution Rate Case • 11/30/15 DP&L filed application at PUCO to increase base distribution rates • First DP&L Distribution Rate Case filed for almost 25 years • Ensure DP&L is earning appropriate return of & on regulated asset base post separation • Requests $65M rate increase (4% change in customer bills) o Equates to ~$31M increase in Adjusted EBITDA (T&D only) 2 • Hearing expected in Q3/Q4, new rates expected by January 1, 2017 Date Certain : September 30, 2015 Test Year: June 2015 – May 2016 Filing Date: November 30, 2015 Targeted date of new rates: Q1 2017 Distribution rate base: $683M Capital structure : 50/50 R oE and CoD ¹ : 10.50% and 5.29% ¹ Return on Equity (“ RoE ”) and Cost of Debt (“ CoD ”) are used to help determine a utility’s revenue requirement, impacting how much it is permitted to charge for its services. Allowed RoE and CoD is established during the rate case process 2 Adjusted EBITDA is a non - GAAP measure, see Appendix for additional information

3 o Required to separate generation no later than 1/1/17 o Allowed to collect a 3 year, $110M/year Service Stability Rider (“SSR ”) o Required to procure 100% generation through competitive auctions by January 2016 o UPDATE : 6/20/16 the Ohio Supreme Court (“OSC”) over - turned ESP 2 • 7/27/16 DP&L filed motion to withdraw 2012 ESP and to revert to rates consistent with ESP 1 • Expect PUCO order by mid - August to implement modified rates • Removed standing requirement to separate generation, but maintaining current plan to separate • No material impact expected on 2016 financial results Key Regulatory Updates – Electric Security Plan (“ESP”) ESP 2 - 9/4/13 PUCO approved ESP 2 (2014 - 2017 ): 1 ESP 3 - 2/22/16 DP&L filed for new ESP 3, provisions included: 2 DP&L supplies generation under SSO tariff which is approved by the PUCO and set through an ESP o 10 year “Reliable Electricity Rider” (“RER”) OR if RER is unavailable, 10 year NBC at $130M/ yr o UPDATE : 4/27/16 FERC ruled First Energy’s PPA (similar to DP&L RER) is subject to review AND 6/20/16 OSC decision questions viability of NBC option • DP&L in discussion with PUCO staff & intervenors; working towards a stipulation for ESP 3 • E xpect Distribution Modernization Rider filed in the FE Case will be focus of discussions • New ESP is expected to be in place by January 2017 and no later than May 2017 • Expect rate support despite FERC and OSC actions

4 • Bottom - up analysis suggests DP&L is under earning on its Rate Base ( the asset base over which a regulated utility can earn a regulated return) o Distribution Rate Case is designed to bridge that gap o Expect ~$31M of incremental Adjusted EBITDA (T&D only) post Distribution Rate Case Fair Regulatory Outcomes: Distribution Rate Case (a) T&D Rate Base $800 (b) Target Capital Structure 50/50 (c ) Approximate RoE 2 10.00% (d) Allowed CoD 3 5.25% (e) Return on Equity (a*b*c) $40 (f) Recovery of Interest (a*b*d) $21 (g) Expected Allowed Depreciation $69 (h) Approximate T axes $20 Bottom - up Adjusted EBITDA (T&D only) ~$150 $119 ~$31 ~ $150 2015 FY Adj. EBITDA (T&D ONLY) Approx. Rate Case Contribution Approx. Forward Adj. EBITDA Guidance ( T&D ONLY) Illustrative EBITDA Buildup ($M) 1 1 Adjusted EBITDA is a non - GAAP measure, see Appendix for additional information 2 Midpoint of illustrative average industry convention of 9.50% - 10.50% 3 DP&L as filed cost of debt in distribution rate case was 5.29%

5 Financing case • Separate generation on 1/1/17 • No SSR or equivalent • FY 2015 Financials (T&D only) o Adjusted EBITDA 1 : $119M o Net PP&E 2 : $1,283M o Capex: $109M o Total Long - term Debt : $763M 1 ‘15 T&D EBITDA only (excluding SSR). Adjusted EBITDA is a non - GAAP measure, see Appendix for additional information. 2 Asset figures represent YE 2015 minus generation assets • Constructive relationship with PUCO • Regulatory construct in Ohio is rapidly evolving • PUCO desires financially stable Ohio utilities to promote (a) economic growth (b) safe and reliable electricity service and; (c) electric grid modernization • Actively working with the PUCO to identify alternatives within ESP 3 to ensure DP&L’s financial stability o Expected to involve additional financial support via a non - bypassable charge (e.g. RER/NBC/ modernization rider) » $130M/ yr of incremental cash flow » Enables de - leveraging (target 50% debt/capital) o Delay of generation separation » Gen assets contribute ~$80 - $120M of Adj. EBITDA/yr 1 in 2017 - 18 & BV 2 of ~$580M » Reduces pressure to deleverage DP&L (current = 51% debt to total capital) Regulatory outcomes mentioned above would provide upside to the financing case presented Fair Regulatory Outcomes : ESP 3 1 Adjusted EBITDA is a non - GAAP measure, see Appendix for additional information 2 Book Value represent YE 2015 generation PPE minus impairment recorded quarter ending Jun 2016
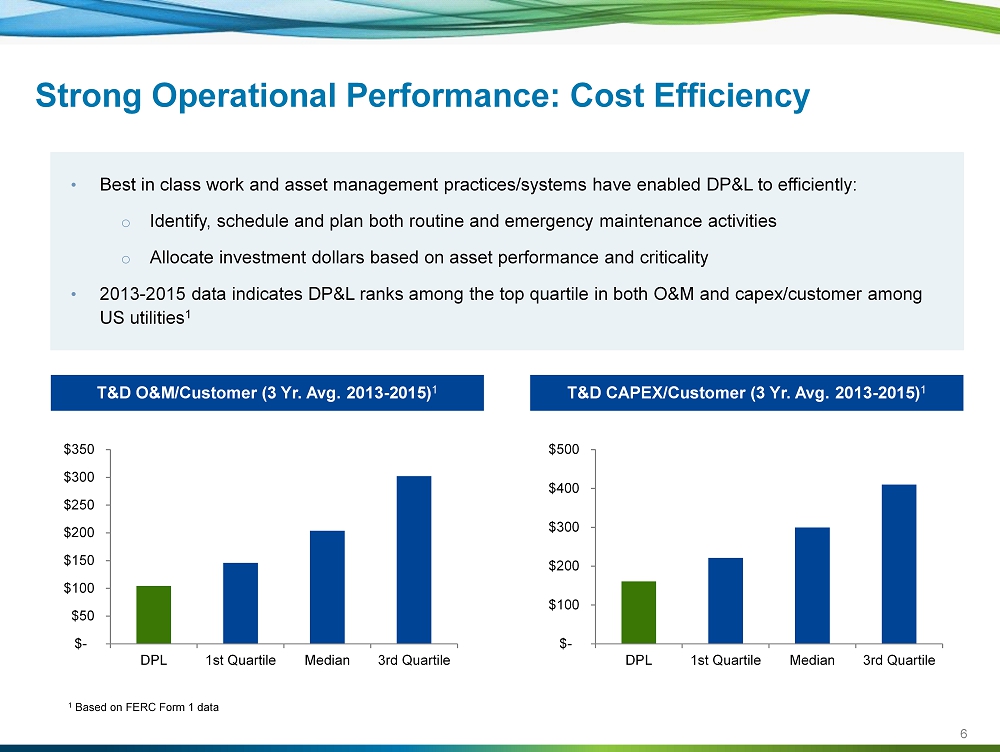
6 T&D O&M/Customer (3 Yr. Avg. 2013 - 2015) 1 T&D CAPEX/Customer (3 Yr. Avg. 2013 - 2015) 1 • Best in class work and asset management practices/systems have enabled DP&L to efficiently: o Identify , schedule and plan both routine and emergency maintenance activities o Allocate investment dollars based on asset performance and criticality • 2013 - 2015 data indicates DP&L ranks among the top quartile in both O&M and capex/customer among US utilities 1 Strong Operational Performance: Cost Efficiency 1 Based on FERC Form 1 data $- $50 $100 $150 $200 $250 $300 $350 DPL 1st Quartile Median 3rd Quartile $- $100 $200 $300 $400 $500 DPL 1st Quartile Median 3rd Quartile

7 YE 2015 Total Debt DP&L $763M Prior to Sep Total Debt DP&L $750M $13M Current liquidity Pro - forma liquidity Commitments $175M $175M ( - ) Funded $0M $0M ( - ) Letters of credit $1.4M $1.4M Total available RCF $173.6M $173.6M (+) Cash $24.8M $13.8M Total Liquidity $198.4M $187.4M Balance Sheet Opt: Debt Levels & Liquidity Achieving Target LT Debt balance requires extension of NBC or an equivalent Sep 2013 Total Debt DP&L $903M LT Target Total Debt DP&L $500M PUCO Minimum Required to separate = $13M • DP&L Revolvers will remain in place to manage any unexpected variation in cash flows • Between cash on hand and availability on the RCF, DP&L has ample liquidity to manage its operations

8 $109 $89 $42 2015 2017+ Guidance 1H 2016 2 DP&L (*T&D Only*) Key Financial Data Net PP&E ($M) Adjusted EBITDA 1 ($ M ) Cap Ex ($ M ) 1 Adjusted EBITDA is a non - GAAP measure, see Appendix for reconciliation of Adjusted EBITDA to Net Income/(Loss) 2 Guidance provided on a per year basis $119 $150 $57 2015¹ 2017+ Guidance 1H 2016¹ $1,283 $1,300 $1,290 2015 2017+ Guidance 1H 2016 2 2
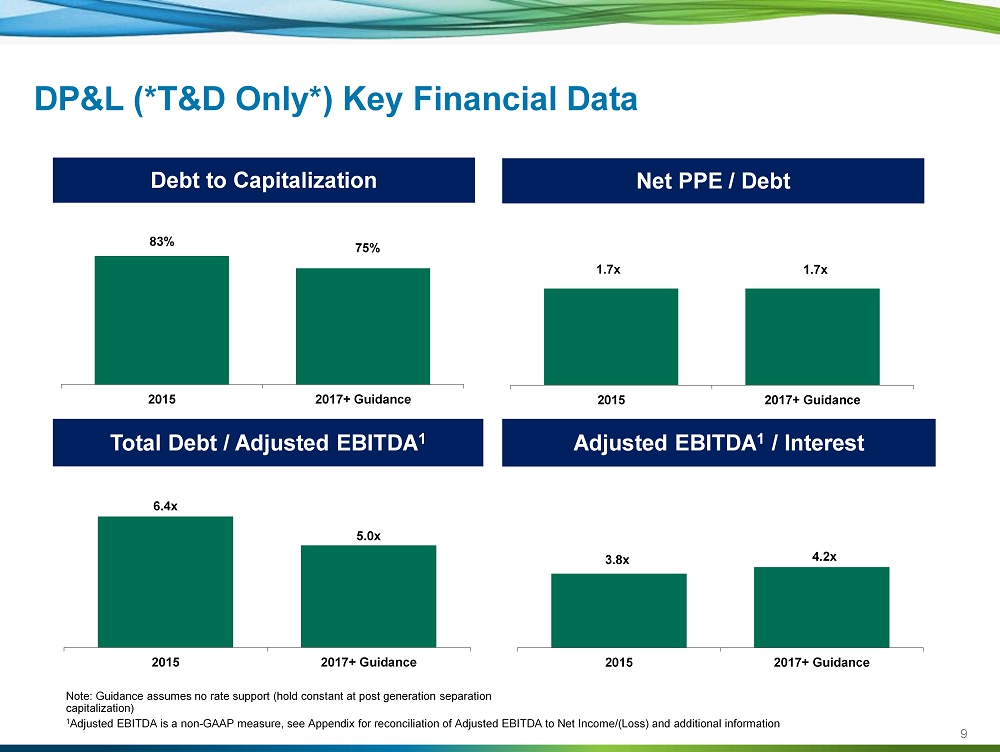
9 Total Debt / Adjusted EBITDA 1 Adjusted EBITDA 1 / Interest Debt to Capitalization DP&L (*T&D Only*) Key Financial Data Note: Guidance assumes no rate support (hold constant at post generation separation capitalization) 1 Adjusted EBITDA is a non - GAAP measure, see Appendix for reconciliation of Adjusted EBITDA to Net Income/(Loss) and additional in formation (2) 83% 75% 2015 2017+ Guidance 6.4x 5.0x 2015 2017+ Guidance 3.8x 4.2x 2015 2017+ Guidance Net PPE / Debt 1.7x 1.7x 2015 2017+ Guidance

10 Appendix

11 Key Terms Term Definition AES Ohio Gen AES Ohio Generation, LLC (formerly DPLE), a wholly - owned subsidiary of DPL that owns and operates peaking generation facilities from which it makes wholesale sales BRA Base Residual Auctions CAIDI Customer Average Interruption Duration Index DPL DPL Inc. DP&L The Dayton Power and Light Company ESP The Electric Security Plan is a cost - based plan that a utility may file with the PUCO to establish SSO rates pursuant to Ohio law FERC Federal Energy Regulatory Commission FGD Flue - gas Desulfurization MVIC Miami Valley Insurance Company, a wholly - owned insurance subsidiary of DPL that provides insurance services to DPL and its subsidiaries and, in some cases, insurance services to partner companies relative to jointly - owned facilities operated by DP&L NBC Non - bypassable Charge PJM PJM Interconnection LLC (PJM) is a regional transmission organization (RTO) in the United States PUCO Public Utilities Commission of Ohio RER Reliable Electricity Rider SAIDI System Average Interruption Duration Index SAIFI System Average Interruption Frequency Index SCR Selective Catalytic Reduction SSO Standard Service Offer represents the retail transmission, distribution and generation services offered by the utility through regulated rates, authorized by the PUCO SSR Service Stability Rider T&D Transmission & Distribution

12 Adjusted EBITDA Reconciliation 12 months ended 6 months ended $ in Millions 12/31/2015 6/30/2016 Consolidated Net Income 106 ( 498) Consolidated Interest Charges 31 11 Charge for Early Redemption of Debt 5 - Provision for Income Taxes 36 ( 291) Depreciation and Amortization 138 71 Goodwill Impairment - - Fixed - asset Impairment - 857 Other Non - operating Income and Expenses - - DP&L Adjusted EBITDA $316 $150 SSR 110 54 DP&L Adjusted EBITDA (excluding SSR) $206 $96 Non - T&D Adjusted EBITDA $87 $39 T&D Adjusted EBITDA $119 $57 Net Property, Plant and Equipment $1,283 1,290 Total Assets $1,687 1,679 Capital Expenditures $109 42 A reconciliation of Adjusted EBITDA guidance to the most directly comparable GAAP financial measure is omitted from the recon cil iations included in this Appendix, as we are unable to provide such a reconciliation without unreasonable efforts. At this time, we do not have sufficient information to calculate certain forward - looking differences between expected earnings and Adjusted EBITDA that are required for such reconciliation, including deferred income tax expens es, early retirement of debt, and fixed asset impairments. Accordingly, DP&L is not able to provide a corresponding GAAP equivalent for its Adjusted EBITDA guidance. We expect that the s e forward - looking differences could have a potentially significant impact on DP&L’s future financial results. This presentation includes references to Adjusted EBITDA, which is a financial measure that is not presented in accordance wi th generally accepted accounting principles in the United States (“GAAP”). DP&L believes Adjusted EBITDA is a measure commonly used by analysts and investors to evaluate the performance of companies in its industry. DP&L’s use of the term Adjusted EBITDA may differ from that of others in its industry. Adjusted EB ITD A should not be considered as an alternative to net income (loss), operating income or any other performance measures derived in accordance with GAAP, as meas ure s of operating performance or operating cash flows or as measures of liquidity. Adjusted EBITDA has important limitations as an analytical tool and should be considered in conjunction with, and not as a substitute for, results as reported under GAAP. This slide includes a reconciliation of Adjusted EBITDA to net income (los s) for the historical periods presented.