Attached files
| file | filename |
|---|---|
| EX-32.1 - EX-32.1 - ALERE INC. | d78820dex321.htm |
| EX-31.2 - EX-31.2 - ALERE INC. | d78820dex312.htm |
| EX-31.1 - EX-31.1 - ALERE INC. | d78820dex311.htm |
| EX-23.1 - EX-23.1 - ALERE INC. | d78820dex231.htm |
| EX-21.1 - EX-21.1 - ALERE INC. | d78820dex211.htm |
| EX-10.14 - EX-10.14 - ALERE INC. | d78820dex1014.htm |
| EX-4.14 - EX-4.14 - ALERE INC. | d78820dex414.htm |
| EX-4.8 - EX-4.8 - ALERE INC. | d78820dex48.htm |
| EX-4.6 - EX-4.6 - ALERE INC. | d78820dex46.htm |
Table of Contents
UNITED STATES
SECURITIES AND EXCHANGE COMMISSION
WASHINGTON, D.C. 20549
FORM 10-K
ANNUAL REPORT PURSUANT TO SECTIONS 13 OR 15(d)
OF THE SECURITIES EXCHANGE ACT OF 1934
For the fiscal year ended December 31, 2015
Commission file number 000-16789

ALERE INC.
(Exact Name of Registrant as Specified in Its Charter)
| Delaware | 04-3565120 | |
| (State or other jurisdiction of incorporation or organization) | (I.R.S. Employer Identification No.) | |
| 51 Sawyer Road, Suite 200, Waltham, Massachusetts | 02453 | |
| (Address of principal executive offices) | (Zip Code) | |
(781) 647-3900
(Registrant’s telephone number, including area code)
Securities registered pursuant to Section 12(b) of the Securities Exchange Act of 1934 (the “Exchange Act”):
| Title of Each Class |
Name of Each Exchange on Which Registered | |
| Common Stock, $0.001 per share par value | New York Stock Exchange | |
| Series B Convertible Perpetual Preferred Stock, $0.001 per share par value |
New York Stock Exchange |
Securities registered pursuant to Section 12(g) of the Exchange Act: None
Indicate by check mark if the registrant is a well-known seasoned issuer, as defined in Rule 405 of the Securities Act of 1933. Yes ¨ No þ
Indicate by check mark if the registrant is not required to file reports pursuant to Section 13 or Section 15(d) of the Exchange Act. Yes ¨ No þ
Indicate by check mark whether the registrant (1) has filed all reports required to be filed by Section 13 or 15(d) of the Exchange Act during the preceding 12 months (or for such shorter period that the registrant was required to file such reports), and (2) has been subject to such filing requirements for the past 90 days. Yes ¨ No þ
Indicate by check mark whether the registrant has submitted electronically and posted on its corporate Web site, if any, every Interactive Data File required to be submitted and posted pursuant to Rule 405 of Regulation S-T during the preceding 12 months (or for such shorter period that the registrant was required to submit and post such files). Yes ¨ No þ
Indicate by check mark if disclosure of delinquent filers pursuant to Item 405 of Regulation S-K is not contained herein, and will not be contained, to the best of registrant’s knowledge, in definitive proxy or information statements incorporated by reference in Part III of this Form 10-K or any amendment to this Form 10-K. ¨
Indicate by check mark whether the registrant is a large accelerated filer, an accelerated filer, a non-accelerated filer, or a smaller reporting company. See the definitions of “large accelerated filer,” “accelerated filer” and “smaller reporting company” in Rule 12b-2 of the Exchange Act. (Check one):
| Large accelerated filer þ | Accelerated filer ¨ | Non-accelerated filer ¨ | Smaller reporting company ¨ | |||
| (Do not check if a smaller reporting company) | ||||||
Indicate by check mark whether the registrant is a shell company (as defined in Rule 12b-2 of the Exchange Act). Yes ¨ No þ
The aggregate market value of the common stock held by non-affiliates of the registrant based on the closing price of the registrant’s common stock on the New York Stock Exchange on June 30, 2015 (the last business day of the registrant’s second fiscal quarter of 2015) was $4,486,967,750.
As of August 4, 2016, the registrant had 86,734,565 shares of common stock, par value $0.001 per share, outstanding.
Table of Contents
Explanatory Note
This Annual Report on Form 10-K for the year ended December 31, 2015 includes consolidated financial statements at December 31, 2014 and December 31, 2015 and for the years ended December 31, 2013, 2014 and 2015. As discussed in Note 2 to our consolidated financial statements, the audited consolidated financial statements for the years 2013 and 2014 and the unaudited financial statements for the interim periods in 2014 and 2015 have been revised.
Revision Background
In late February 2016, senior members of our executive management became aware of several issues in Africa and China that had the potential to significantly impact the revenue reported in our 2015 financial statements. Members of finance management engaged in an initial review of certain 2015 transactions and, with the concurrence of the Audit Committee, made the determination that a more extensive assessment, or the Assessment, of our revenue recognition practices within Africa and China would be prudent. As a result, we were unable to file this Annual Report on Form 10-K in a timely manner. We ultimately expanded the Assessment to include Latin America, Asia/Pacific, Europe and North America.
Revenue Recognition Assessment Procedures and Findings
Under the direction of the Audit Committee, who was advised and supported by independent outside counsel, the Assessment was led by our Chief Financial Officer, Chief Accounting Officer and General Counsel and was conducted with the assistance of outside counsel and consultants. As part of the Assessment, we searched millions of emails (with the assistance of our outside counsel), reviewed hundreds of customer contracts and tested thousands of individual revenue transactions globally to determine whether revenue related to these contracts and transactions had been recognized in accordance with U.S. generally accepted accounting principles (“U.S. GAAP”).
Based on our review, we determined that, in 2013 and 2014 and the first three quarters of 2015, we had incorrectly recorded certain revenue transactions for such periods. Specifically, the errors in the application of U.S. GAAP rules regarding the timing of revenue recognition primarily relate to: (i) transactions, principally in Africa, in which we recognized revenue when the product shipped to the distributor, but we contractually retained title in the products until the distributor paid for the products in full or the distributor was not obligated to pay us until the products were sold through to the end-user; (ii) “bill and hold” transactions, principally in China, which did not meet the criteria for revenue recognition under U.S. GAAP; and (iii) other transactions, in which we recognized revenue prior to full satisfaction of all contractual criteria for title and risk of loss passing to the customer.
Impact of the Revision
The errors identified in the Assessment did not impact the total amount of revenue reported related to any transaction, other than in connection with establishing a returns allowance for our Indian subsidiary that is not material in amount. However, the errors did require adjustments to the period in which certain revenues were recognized so that such revenues are recognized in the period in which: physical delivery occurred as defined by the contractual relationship; title and risk of loss had transferred to the buyer; or the buyer had the contractual obligation to pay the amounts invoiced, as required by U.S. GAAP revenue recognition rules and our accounting policy related to revenue recognition. As part of this revision, we also reflected other, previously recorded, out-of-period adjustments in the periods in which such adjustments originated. In total, these revisions resulted in decreases in revenue of $13 million in 2014 and $8 million in 2013. Total revisions to diluted (loss) earnings per share, as reported, were $0.05 in 2014 and $(0.03) in 2013. As noted above, these earnings per share revisions also include the impact of reflecting other previously recorded out-of-period adjustments in the period in which they originated. Most notably, these included correcting adjustments to our income tax provisions of $7.9 million that were originally recorded in the nine months ended September 30, 2015 by recording them primarily in 2014, as well as other periods in
Table of Contents
which they originated. We will also be revising our interim financial statements for 2014 and 2015. The impact of the revisions on our revenue, gross profit, income (loss) from continuing operations and earnings per share for each of the quarters in 2014 and 2015 are shown in our table of quarterly data in Item 8 “Financial Statements and Supplementary Data” of this Annual Report on Form 10-K. The revisions have been reflected in our balance sheet as of December 31, 2014. The revisions to the consolidated statements of cash flows did not impact previously reported net cash flows from operating activities, investing activities, or financing activities and, as a result, there was no impact to net change in cash and cash equivalents for any previously reported periods.
The revisions to our interim financial statements for 2015 will be shown in our Quarterly Reports on Form 10-Q for 2016. We have concluded that none of the revisions to our consolidated financial statements for the interim periods in 2014 and 2015 was material, individually or in the aggregate, to any of our previously issued financial statements for such individual interim periods.
Internal Controls Over Financial Reporting and Disclosure Controls and Procedures
As a result of the Assessment, we also concluded that we had material weaknesses in internal controls over revenue recognition as further described in Item 9A “Controls and Procedures” in this Annual Report on Form 10-K. We also concluded that the material weakness in internal controls over accounting for income taxes that existed at December 31, 2014 had not been remediated as of December 31, 2015 and, therefore, continued to be a material weakness as of that date.
For further information regarding management’s assessment of internal control over financial reporting and disclosure controls and procedures, as well as the related remediation actions, refer to Item 9A “Controls and Procedures” in this Annual Report on Form 10-K.
Table of Contents
FORM 10-K
For The Fiscal Year Ended December 31, 2015
Table of Contents
PART I
This Annual Report on Form 10-K contains forward-looking statements within the meaning of Section 27A of the Securities Act of 1933, as amended, and Section 21E of the Securities Exchange Act of 1934, as amended. Readers can identify these statements by forward-looking words such as “may,” “could,” “should,” “would,” “intend,” “will,” “expect,” “anticipate,” “believe,” “estimate,” “continue” or similar words. Readers should carefully review statements that contain these words because they discuss our future expectations, contain projections of our future results of operations or of our financial condition or state other “forward-looking” information. We caution investors that all such forward-looking statements involve risks and uncertainties that could cause our actual results to differ materially from any projected results or expectations that we discuss in this report. You should therefore carefully review the risk factors and uncertainties discussed in Item 1A entitled “Risk Factors,” which begins on page 16 of this report, as well as those factors identified from time to time in our periodic filings with the Securities and Exchange Commission. We undertake no obligation to update any forward-looking statements.
Unless the context requires otherwise, references in this Annual Report on Form 10-K to “we,” “us,” “our,” or “our company” refer to Alere Inc. and its subsidiaries.
| ITEM 1. BUSINESS |
General
Alere delivers reliable and actionable health information through rapid diagnostic tests, resulting in better clinical and economic healthcare outcomes globally. Our high-performance diagnostics for infectious disease, cardiometabolic disease and toxicology are designed to meet the growing global demand for accurate, easy-to-use and cost-effective near-patient tests. Our goal is to make Alere products accessible to more people around the world, even those located in remote and resource-limited areas, by making them affordable and usable in any setting. By making critical clinical diagnostic information available to doctors and patients in an actionable timeframe, Alere products help streamline healthcare delivery and improve patient outcomes.
Our company, formerly known as Inverness Medical Innovations, Inc., is a Delaware corporation that was formed in 2001. Our common stock is listed on the New York Stock Exchange under the symbol “ALR.” Our Series B Convertible Perpetual Preferred Stock is listed on the New York Stock Exchange under the symbol “ALR-B.”
Our principal executive offices are located at 51 Sawyer Road, Suite 200, Waltham, Massachusetts 02453 and our telephone number is (781) 647-3900. Our website is www.alere.com, and we make available through the investor center of this site, free of charge, our Annual Reports on Form 10-K, Quarterly Reports on Form 10-Q, Current Reports on Form 8-K, and amendments to those reports, filed or furnished pursuant to Section 13(a) or 15(d) of the Securities Exchange Act of 1934, as amended, or the Exchange Act, as soon as reasonably practicable after such reports are electronically filed with, or furnished to, the Securities and Exchange Commission, or the SEC. We also make our code of ethics and certain other governance documents and policies available through our website. Information on our website, or information that may be accessed through links on our website, is not (and shall not be deemed) incorporated by reference into this Annual Report. We intend to make required disclosures of amendments to our code of ethics, or waivers of a provision of our code of ethics, if any, on the “Corporate Governance” page of our website’s investor center.
Our reportable operating segments are professional diagnostics, consumer diagnostics, and corporate and other. Financial information about our reportable segments is provided in Note 18 of the notes to consolidated financial statements which are included elsewhere in this Annual Report on Form 10-K.
2
Table of Contents
Recent Developments
Merger Agreement with Abbott Laboratories
On January 30, 2016, we entered into an Agreement and Plan of Merger, or the Merger Agreement, with Abbott Laboratories, or Abbott. The Merger Agreement provides for the merger of a newly formed, wholly owned subsidiary of Abbott with and into Alere, or the merger, with Alere surviving the merger as a wholly owned subsidiary of Abbott, or the surviving corporation. Under the terms of the Merger Agreement, holders of shares of our common stock will receive $56.00 in cash, without interest, in exchange for each share of common stock. Each share of our Series B Convertible Perpetual Preferred Stock, par value $0.001 per share, or Series B Preferred Stock, issued and outstanding immediately prior to the effective time of the merger will remain issued and outstanding immediately following the consummation of the merger as one share of Series B Convertible Preferred Stock, par value $0.001 per share, of the surviving corporation. The Merger Agreement was approved by our board of directors. Completion of the merger is subject to customary closing conditions, including (1) the adoption of the Merger Agreement by the affirmative vote of the holders of at least a majority of all outstanding shares of our common stock, (2) there being no judgment or law enjoining or otherwise prohibiting the consummation of the merger and (3) the expiration of the waiting period applicable to the merger under the Hart-Scott-Rodino Antitrust Improvements Act of 1976, as amended, or the HSR Act, and receipt of other required antitrust approvals. The obligation of each of the parties to consummate the merger is also conditioned on the other party’s representations and warranties being true and correct (subject to certain materiality exceptions) and the other party having performed in all material respects its obligations under the Merger Agreement. The Merger Agreement contains certain termination rights and provides that, upon termination of the Merger Agreement under certain circumstances, Alere would be required to pay Abbott a termination fee equal to $177.0 million. We currently expect that the transaction will close by the end of 2016.
On May 2, 2016, Abbott and Alere received a request for additional information, or a “second request,” from the United States Federal Trade Commission, or the FTC, relating to Abbott’s potential acquisition of Alere. The second request was issued under the HSR Act. In addition, Abbott has agreed voluntarily to provide the FTC at least 60 days advance notice before certifying substantial compliance with the second request and to extend the waiting period imposed by the HSR Act until 60 days after Abbott and Alere have substantially complied with the second request, unless the period is further extended voluntarily by the parties or terminated sooner by the FTC. On June 23, 2016, Abbott and Alere received a request for additional information, or a “supplemental information request,” from the Canadian Competition Bureau, or the Bureau, relating to Abbott’s potential acquisition of Alere. The supplemental information request was issued under the Competition Act of Canada, or the Competition Act. The effect of the supplemental information request is to extend the waiting period imposed by the Competition Act until 30 days after Abbott and Alere have each complied with the supplemental information request, unless the period is extended voluntarily by the parties or terminated sooner by the Bureau. Under the terms of the Merger Agreement, Abbott has agreed to make certain divestitures if necessary to obtain the consent of the antitrust authorities to the transaction contemplated by the Merger Agreement, subject to certain materiality exceptions provided for in the Merger Agreement.
In addition, after entering into the Merger Agreement, Abbott informed us that it had serious concerns about, among other things, the accuracy of various representations, warranties and covenants made by us in the Merger Agreement. Abbott indicated that these concerns relate to the delay in filing this Annual Report on Form 10-K for the fiscal year ended December 31, 2015 as well as governmental investigations previously announced by us. Abbott has since requested information from us about these and other matters, citing contractual rights to receive information under the Merger Agreement. In the initial meeting in which Abbott expressed its concerns to us, as part of a discussion about potential paths forward, Abbott requested that we agree to terminate the Merger Agreement in return for a payment by Abbott to us in the range of between $30 and $50 million in respect of our transaction expenses. Our Board of Directors promptly rejected that request. In these discussions, Abbott affirmed its commitment to abide by its obligations under the Merger Agreement.
3
Table of Contents
Divestitures and Acquisitions in 2015
Divestiture of the BBI Business
On November 17, 2015, we completed the sale of our BBI business, which was achieved through the sale of our subsidiary BBI Diagnostic Group Ltd., for a purchase price of approximately $106.4 million, net of a final working capital adjustment. We are eligible to receive up to an additional $46.6 million in contingent cash consideration. The BBI business provided products and services for the diagnostic, healthcare, research, defense and food industries globally. The BBI business was formerly included in our professional diagnostics reporting unit and business segment. We used $115.0 million of the net cash proceeds from the closing of the sale of the BBI business (which represented all of the net proceeds from the closing of the sale prior to giving effect to the final working capital adjustment) to repay $115.0 million in aggregate principal amount of outstanding indebtedness under our secured credit facility.
Acquisition of US Diagnostics
On July 10, 2015, we acquired substantially all of the assets of US Diagnostics, Inc., or USD, located in Huntsville, Alabama, a provider of instant on-site drug testing products designed for quick and accurate drug test results. The aggregate purchase price was approximately $60.1 million and was paid in cash. The operating results of the acquired business are included in our professional diagnostics reporting unit and business segment.
Divestiture of the Health Management Business
On January 9, 2015, we completed the sale of our condition management, case management, wellbeing, wellness, and women’s and children’s health businesses, which we refer to collectively as our health management business, to OptumHealth Care Solutions for a purchase price of $599.9 million. We used the net cash proceeds of the sale to repay $575.0 million in aggregate principal amount of outstanding indebtedness under our prior credit facility.
As a result of the sale of our health management business in January 2015, which was the largest component of our patient self-testing reporting segment, we no longer provide segment information for our patient-self testing business, which now forms part of our professional diagnostics reporting unit and business segment. We reclassified the assets and liabilities of the health management business as held for sale within the accompanying consolidated balance sheet as of December 31, 2014, and the results of the operations of the health management business are reported as income (loss) from discontinued operations, net of tax, for all periods presented in our accompanying consolidated statements of operations. See Note 3 to our accompanying consolidated financial statements for more information about this divestiture and discontinued operations.
Products and Services
Professional Diagnostics
Our professional diagnostic solutions allow patients and their healthcare providers to work together to better manage patients’ conditions over the continuum of care, from the hospital to home. Professional diagnostics solutions are generally designed to assist medical professionals in both preventative and interventional medicine, and include testing and monitoring performed in hospitals, laboratories and doctors’ offices and patient self-testing, which we define as testing or monitoring performed at home under the supervision of a medical professional. Professional diagnostic products provide for qualitative or quantitative analysis of patient samples for evidence of a specific medical condition, disease state or toxicological state or to measure response to therapy. Within professional diagnostics, we focus on point-of-care, rapid diagnostic testing and the patient self-testing and patient self-management markets where we believe that we can improve patient health outcomes. We distinguish these markets from clinical diagnostic markets consisting of large, centralized laboratories
4
Table of Contents
offering a wide range of highly-automated laboratory services in hospital or related settings. The point-of-care market for rapid diagnostic products includes all areas where a patient is assessed or diagnosed, including hospitals, laboratories, physician offices, specialized mobile clinics, emergency rooms, rapid-response laboratories and patient health screening locations.
In the market for rapid diagnostic products, the ability to deliver faster, accurate results at competitive prices generally drives demand. As the speed and accuracy of these products improve, we believe that they will play an important role in achieving earlier diagnosis, timely intervention and therapy monitoring outside acute medical environments. Our current professional diagnostic products include point-of-care and laboratory tests within the infectious disease, cardiometabolic disease and toxicology markets, as well as patient self-testing services.
Infectious Disease. Our infectious disease diagnostic products are designed to detect certain diseases or groups of diseases and allow medical professionals to make informed health decisions. Disease areas covered include viral hepatitis, respiratory syncytial virus (RSV), influenza, streptococcus, pneumonia, tuberculosis, human immunodeficiency virus (HIV) / acquired immunodeficiency syndrome (AIDS), gastrointestinal disease, vector-borne diseases such as malaria and dengue, syphilis and other sexually-transmitted diseases. In addition, antimicrobial resistance continues to be a major global health issue requiring healthcare professionals to quickly and accurately identify the nature of a pathogen in order to define the appropriate treatment strategy. Healthcare institutions around the world are actively seeking antimicrobial stewardship programs and solutions in order to improve their use of antibiotics. Our Test Target Treat™ initiative is designed to drive education and awareness among healthcare professionals regarding how they can use rapid diagnostics to make more targeted treatment decisions sooner than would otherwise be possible with conventional diagnostics, thereby reducing inappropriate antimicrobial use and the spread of resistance.
In 2014, after receiving clearance from the U.S. Food and Drug Administration, or FDA, the Alere™ i Influenza A & B test was made available for sale in the United States and placements in the U.S. expanded in 2015. Alere i is a rapid point-of-care molecular platform for the qualitative detection of infectious diseases. Our Alere i isothermal nucleic acid amplification technology provides molecular results in just minutes, allowing healthcare providers to make quick and effective clinical decisions. In January 2015, the Alere i Influenza A & B test was granted the first ever CLIA waiver for a nucleic acid-based influenza diagnostic test by the FDA. A CLIA waiver means that the FDA has waived the more stringent requirements for laboratory testing applicable to moderate or high complexity laboratories based on a test’s ease of use and accuracy. As a result, the Alere i™ Influenza A & B test may be used in physician offices, clinics and other public health settings, where influenza patients are frequently examined and treated. In April 2015, we received clearance from the FDA for the Alere i™ Strep A test, and in July 2015 that test was granted a CLIA waiver by the FDA. Alere i™ tests for C. difficile, RSV, and chlamydia/gonorrhea are currently in development.
We have continued to expand our product offerings to broaden our suite of infectious disease diagnostics, including tests based on advanced technologies that enable rapid and accurate diagnosis and monitoring of some of the most prevalent infectious diseases. We develop and market a wide variety of point-of-care tests for influenza A & B, RSV, strep A, pneumococcal pneumonia, C. difficile, HIV, hepatitis C (HCV), hepatitis B (HBV), malaria, chlamydia, H. pylori and other infectious diseases. Our tests for infectious disease are currently sold under brand names that include Alere, Alere i, Alere™ q, Alere Determine™, Acceava®, BinaxNOW®, Clearview®, Panbio®, Pima™, SD, TECHLAB® and Alere TestPack.
Our offerings for the diagnosis and management of HIV infection include the Alere Determine™ HIV-1/2 Ag/Ab Combo, the first FDA-approved and CLIA-waived rapid, point-of-care test that detects both HIV-1/2 antibodies and free HIV-1 p24 antigen. Due to its capability to detect unbound p24 antigen, this fourth generation test may detect HIV infection earlier in the course of the disease. By enabling healthcare providers to diagnose HIV infection earlier, individuals can receive appropriate
5
Table of Contents
medical care sooner. The Alere Determine HIV-1/2 Ag/Ab Combo received CLIA-waived status in December 2014, allowing healthcare providers in settings such as physician’s offices, clinics and other public health settings to improve clinical outcomes through earlier diagnosis and treatment of patients who test positive for HIV.
Our Alere Pima™ Analyzer, also known as the Alere CD4 Analyzer, continues to help HIV-infected patients in Africa and Asia monitor their immune function to determine the urgency of their need for drug therapy. The Alere Pima Analyzer provides CD4 results in 20 minutes or less, using disposable, single-use fingerstick cartridges. CD4 results delivered quickly and accurately at the point of care can improve both patient retention and access to treatment. Program data from the Alere Pima Analyzer can be transmitted and managed using our Alere Data Point connectivity solution, which is designed to enable data transmission from analyzers in the field to a web portal in order to assist in the management of local HIV treatment programs.
During 2015, Alere’s SD BIOLINE HIV/Syphilis Duo test was awarded World Health Organization, or WHO, prequalification, making it the first dual HIV/syphilis point-of-care test available for public sector procurement in resource-limited countries.
Finally, during 2015 we continued to advance the development and commercialization of our Alere™ q Analyzer, which utilizes a versatile, single-use test cartridge to automatically extract, amplify and detect multiple molecular targets from a single patient sample. Alere™ q HIV 1/2 Detect is the first assay on the Alere™ q platform, and received IVD CE marking approval in March 2015. This is the first molecular diagnostic at the point of care that identifies HIV-1 and HIV-2 in less than 60 minutes. The Alere™ q HIV 1/2 Detect is not approved for sale in the U.S., but, as noted above, the Alere Determine HIV-1/2 Ag/Ab Combo is CLIA-waived and available in the U.S.
These products are examples of our deployment of leading technologies to enable rapid and accurate diagnosis and monitoring of some of the most prevalent infectious diseases around the world.
In addition to point-of-care products, we also offer a line of indirect fluorescent antibody, or IFA, assays for 17 viral, bacterial and autoimmune diseases, a line of serology diagnostic products covering a broad range of disease categories and 40 enzyme-linked immunosorbent assay, or ELISA, tests for a wide variety of infectious and autoimmune diseases, as well as a full line of automated instrumentation for processing ELISA tests.
Demand for certain infectious disease tests, such as influenza A & B, or flu, is significantly affected by the seasonal nature of the cold and flu season. As a result, we typically experience higher sales of our flu tests in the first and fourth quarters. Sales of our flu products also vary widely from year to year based in large part on the severity, duration and timing of the onset of the cold and flu season.
Cardiometabolic Disease. Cardiometabolic disease encompasses a spectrum of conditions and illnesses, including both cardiovascular conditions and diabetes. Cardiovascular diseases include high blood pressure, high cholesterol, metabolic syndrome, coronary artery disease, heart attack, heart failure and stroke. Our Alere Triage®, Alere Cholestech LDX®, Alere Afinion™ products, and our epoc® Blood Analysis System, we believe, have established us as a leader in this market.
The Alere Triage System is our rapid diagnostic test system comprised of the Alere Triage® MeterPro, a high-performance portable testing platform, and a menu of test devices that enable physicians to promote improved health outcomes through the rapid diagnosis of critical diseases and health conditions, as well as the detection of certain drugs of abuse. This system is designed to aid in the diagnosis, assessment and risk stratification of patients having critical care issues, including congestive heart failure, acute coronary syndromes, acute myocardial infarction, or AMI, and acute kidney injury, and is designed to play an important part in reducing hospital admissions and improving clinical and economic outcomes. Alere Triage cardiovascular rapid tests include immunoassays for
6
Table of Contents
B-type Natriuretic Peptide (BNP), creatine kinase-MB (CK-MB), D-dimer, myoglobin, troponin I and N-terminal pro-Brain Natriuretic Peptide (NT-proBNP). Alere Triage tests for troponin I and NT-proBNP, as well as certain test panels which include a combination of immunoassays, are not available for sale in the U.S. We also offer a version of the Alere Triage BNP Test for use on Beckman Coulter lab analyzers.
Our Alere Cholestech LDX System is a small, portable point-of-care analyzer and test cassette system for testing blood glucose, cholesterol and related lipids. The Alere Cholestech LDX System makes it possible to provide a complete lipid profile with tests for total cholesterol, high-density lipoprotein cholesterol (HDL) and low-density lipoprotein cholesterol (LDL), triglycerides, and glucose. The Alere Cholestech LDX System provides results in five minutes per test cassette and is CLIA-waived. This waiver allows the Alere Cholestech LDX System to be marketed to physician offices and clinics and to be used in health screening by medical professionals.
In addition, we sell our First Check® brand of over-the-counter tests for cholesterol monitoring.
We also offer the epoc Blood Analysis System for blood gas, electrolyte and metabolite testing. The epoc (enterprise point-of-care) platform is a point-of-care analysis system that provides wireless bedside blood gas, electrolyte and metabolite measurement testing solutions and complements our Alere Triage products in emergency room and intensive care unit settings. Utilizing easy-to-use, low-cost disposable Smart-Cards™, the epoc Blood Analysis System produces laboratory-quality results in critical and acute care settings in about 30 seconds.
We also offer point-of-care diabetes products, including our Afinion™ Test System and our NycoCard™ Test System, which are designed to easily and rapidly determine the level of glycated hemoglobin, or HbA1c, in a patient’s blood at the point of care. HbA1c results provide information regarding the patient’s average blood sugar levels over a period of time. These systems are designed to simplify monitoring of any type of diabetes, facilitating treatment management and prevention of complications. By providing timely information regarding a patient’s blood sugar levels over time, it may also increase a patient’s motivation to comply with treatment and lifestyle changes and thereby improve their prognosis. Our CE-marked Lipid Panel is an important tool in our Afinion™ Test System for cardiovascular disease risk assessment. The Afinion™ Test System can also measure a patient’s Albumin Creatinine Ratio, which aids in the early detection of kidney disease often present in diabetic patients, and C-reactive protein, or CRP. Physicians test for elevated levels of CRP in connection with the diagnosis, therapy and monitoring of inflammatory diseases. Information regarding the level of CRP in a patient’s bloodstream can help physicians discriminate between a serious inflammatory illness, such as pneumonia, and less severe conditions, such as acute bronchitis and other respiratory tract infections. The NycoCard Test System, which is a low-cost product suited to countries with developing healthcare systems, includes tests for D-dimer and HbA1c.
Through our subsidiary Arriva Medical, we are a national mail-order supplier of diabetic testing supplies, including blood glucose monitors, test strips, lancets, lancing devices, and control solutions, as well as other related medical supplies in the U.S. These products are, in some cases, covered by Medicare, Medicaid and other third-party payers.
We sell disposable, lateral flow rapid diagnostic tests for D-dimer and troponin I under our Clearview brand. These tests offer efficiency, as well as ease of use and accuracy, to clinics, hospitals and laboratories around the world.
Our Alere Home Monitoring business offers patient self-testing services. These services support anticoagulation management through frequent self-testing by patients (using various PT/INR coagulation monitors) who take warfarin to control their risk for stroke and clotting disorders. These services are designed to provide physicians with actionable data that allow them to make more effective decisions in real time, deliver quality care, and put the individuals they treat on a pathway to
7
Table of Contents
better health. Alere Home Monitoring assists patients in acquiring home INR monitors and with insurance coverage determinations and provides physicians with a model that allows them to incorporate patient self-testing into their practices. Our program has been developed to identify candidates who we believe will benefit from self-testing protocols. The program is built around an advanced, web-based application that is intended to deliver patient results and other information to healthcare providers on a real-time basis, thereby facilitating immediate therapy adjustments where appropriate and reducing the risk of serious events. In addition, the Alere Home Monitoring business operates the Alere VADCare program to help manage VAD, or ventricular assist device, patients and remotely monitor their health after discharge to reduce the risk of possible hospital readmission. Through the Alere VADCare program, VAD patients receive equipment and supplies to power and control their implanted VADs. The program is designed to enable patients to be discharged from the hospital and monitor their conditions from their homes rather than remain in the hospital, which is intended to save costs to patients, hospitals, and payers and improve the quality of life for patients.
In July 2016, we announced that we will be initiating a voluntary withdrawal of the Alere INRatio®/INRatio®2 PT/INR Monitoring Systems. Our Alere INRatio and INRatio®2 PT/INR Monitoring Systems are used for the quantitative measurement of prothrombin time in fresh, capillary whole blood. The Alere INRatio®/INRatio® 2 PT/INR Monitoring Systems are intended for use outside the body (in vitro diagnostic use) and are intended for professional and home use by people taking warfarin who need to monitor the clotting time of their blood. See below “—Government Regulation,” for additional information on our plan to voluntarily withdraw the INRatio Systems from the market. We expect Alere Home Monitoring to continue to distribute other PT/INR coagulation monitors following the withdrawal of the INRatio and INRatio2 PT/INR Monitoring Systems from the market.
Toxicology. Drug abuse is a major global health problem, as well as a social and economic burden. In addition to being a cause of lost workforce productivity, family conflict and drug-related crime, abuse of illicit and prescription drugs is linked globally to the spread of HIV/AIDS, hepatitis and other blood-borne pathogens through the use of contaminated needles. This misuse of drugs and drug addiction are among the costliest health problems in the U.S. and abroad. Accordingly, employers, law enforcement officials, healthcare professionals and others expend considerable effort to ensure that their employees, patients and other constituents are free of substance abuse and misuse. As a result, there is demand for simple and reliable laboratory-based, point-of-care and rapid toxicology tests to detect the most commonly abused substances and an evolving set of newly-formulated, synthetic toxins. Additionally, physicians and treatment centers are also utilizing drug testing to identify and address signs of prescription drug misuse, whether illicit or by prescription, and more broadly, to improve outcomes in addiction medicine. Finally, both domestically and abroad, employers and governments require services for workforce compliance with drug, alcohol and/or related fitness-for-duty health policies.
Urine and saliva-based screening and confirmation tests for drugs of abuse range from simple immunoassay tests to complex analytical procedures. The speed and sensitivity of immunoassays have made them the most widely accepted method for toxicology screening at the point of care.
We offer a line of drugs-of-abuse tests, reagent systems and laboratory testing options. Our toxicology business also provides employers with fully managed drug testing programs. We offer various device platforms for the detection of the following illicit and prescription drugs of abuse: amphetamines/methamphetamines, cocaine, opiates, phencyclidine, tetrahydrocannabinol, acetaminophen, barbiturates, benzodiazepines, methadone, propoxyphene and tricyclic antidepressants, and a range of designer drugs of abuse. In addition, our toxicology products include tests to detect alcohol. Our products and solutions test using urine or, for certain applications, saliva, hair or other body fluids. We believe that early detection can lead to improved health outcomes through early intervention, treatment and recovery, and can also help employers to reduce unnecessary employee injuries and related medical expenses.
Our rapid toxicology tests are sold primarily under the brands Alere Toxicology, Alere Triage, Alere iCup® and SureStep™. The Alere Triage TOX Drug Screen panel sold for use with our Alere Triage®
8
Table of Contents
MeterPro system detects the presence of many of the illicit and prescription drugs listed above at the point of care in approximately 15 minutes. It is used in hospital and clinical testing as a laboratory instrument to aid in the detection of drug abuse. Our Alere DDS®2 Mobile Test System is an on-site, saliva-based drug detection system utilized in roadside testing which displays results for the presence of two drugs in less than 90 seconds and six different drugs in less than five minutes. We currently sell this product only in markets outside of the United States, but we have begun multiple trials for roadside use by law enforcement agencies in the United States. We believe that a significant market for this product will develop in the United States if the trend towards the decriminalization of marijuana accelerates, and if federal and state regulators develop impairment policies, as these trends would be expected, we believe, to drive an increased need for roadside and evidentiary tests for impaired driving.
We also offer comprehensive laboratory-based testing services throughout the U.S. and in the United Kingdom. Three of Alere’s toxicology laboratories are certified to the highest standard by the U.S. Substance Abuse and Mental Health Services Administration, or SAMHSA. In addition, we provide laboratory-based testing services for pain management and rehabilitation providers that monitor and document adherence to prescription drug treatment or drug abstinence plans. We offer a broad set of low-cost laboratory testing services to multiple domestic clients, including law enforcement agencies, penal systems, insurers and employers in the U.S.
We also provide automated and efficient workplace drug testing services through our eScreen business. The services offered by eScreen form part of our core set of toxicology products and solutions and help to position us as a full-service solution provider to a broad range of domestic and foreign employers in the transport, oil and gas, mining, retail and related industries that follow rigorous drug testing policies. We believe that the combination of products, laboratory testing and services that we offer for drugs of abuse enhances our ability to compete in this market.
In addition, we market and sell consumer drug testing products that test for the presence of prescription drugs, illicit drugs, or both. Results using these First Check products are provided within five minutes.
Consumer Diagnostics
In 2007, we and affiliates of The Procter & Gamble Company, or P&G, commenced a 50/50 joint venture for the development, manufacturing, marketing and sale of existing and to-be-developed consumer diagnostic products, outside the cardiology, diabetes and oral care fields. As part of this arrangement, we transferred essentially all of the assets of our consumer diagnostics business, other than our manufacturing and core intellectual property assets, to the joint venture, and P&G acquired its interest in the joint venture. Accordingly, substantially all of the consumer diagnostics product sales conducted by us prior to the formation of the joint venture, including sales of all of our products targeting the worldwide over-the-counter pregnancy and fertility/ovulation test market, are now conducted by the joint venture, which consists of unconsolidated entities operating primarily under the name SPD Swiss Precision Diagnostics GmbH, or SPD.
As part of the SPD joint venture, we entered into a finished product purchase agreement, pursuant to which we currently manufacture and sell to SPD substantially all of the consumer diagnostic products which it sells. We also entered into certain transition and long-term services agreements with SPD, pursuant to which we provide certain operational support services to the joint venture. Our consumer diagnostics segment recognizes the revenue and costs arising from these arrangements. SPD, in many cases, sells its products to P&G (or an affiliate of P&G) for sale in certain jurisdictions, including the U.S.
Methods of Distribution and Customers
We distribute our professional diagnostic products to hospitals, reference laboratories, physician offices and other point-of-care settings through an extensive worldwide distribution network. We have
9
Table of Contents
our own sales force in many countries, including most major markets. We also utilize third-party distributors to sell our products. Our diabetes testing supplies business provides its products via mail- order to patients in the U.S. Our Alere Home Monitoring business facilitated the distribution of our Alere INRatio and INRatio2 PT/INR coagulation monitors (prior to our voluntary withdrawal of these monitors from the market) and other PT/INR coagulation monitors in the U.S. by contacting patients who have expressed an interest or have prescriptions from their physicians and facilitating the Medicare reimbursement process for physicians and for patients monitoring at home. As described further below under “—Government Regulation,” we plan to voluntarily withdraw the INRatio and INRatio2 Systems from the market, but we expect Alere Home Monitoring to continue to distribute other PT/INR coagulation monitors.
We market and sell our First Check consumer drug testing products and cholesterol monitoring products in the U.S. through retail drug stores, retail food stores, drug wholesalers, and mass merchandisers. These products compete with other brand name drug testing products and cholesterol monitoring products based on price, performance and brand awareness.
Manufacturing
Our primary manufacturing facilities are located in San Diego, California; Scarborough, Maine; Ottawa, Canada; Hangzhou and Shanghai, China; Jena, Germany; Matsudo, Japan; Oslo, Norway; Dundee, United Kingdom; and Yongin, South Korea. We also manufacture products at a number of other facilities in the United States, India, Israel and the United Kingdom.
Our primary manufacturing facilities are registered with FDA and/or ISO certified, as required under applicable law. We manufacture substantially all of our consumable diagnostic products at these facilities. We also manufacture the consumable diagnostic devices containing the diagnostic chemistry or other proprietary diagnostic technology, which are used in conjunction with our diagnostic or monitoring systems, and the digital tests and monitors that we supply to SPD. We contract with third parties to supply the electronic reader portion of these diagnostic or monitoring systems and to supply various other products that we sell, including our Alere Triage BNP Test for use on Beckman Coulter systems, a majority of our IFA tests and our TECHLAB products.
Research and Development
Our primary research and development centers are in San Diego, California; Scarborough, Maine; Jena, Germany; Oslo, Norway; and Dundee, United Kingdom. We also conduct research and development at some of our other facilities, including facilities in the U.S., the United Kingdom, China, Japan and South Korea. Our research and development programs focus on the development of diagnostic products for cardiometabolic disease, infectious disease and toxicology. Information about research and development expenses for the last three fiscal years is provided on page F-4 of the consolidated financial statements included elsewhere in this Annual Report on Form 10-K.
Global Operations
We are a global company with major manufacturing facilities in the U.S., Canada, China, Germany, Japan, Norway, South Korea and the United Kingdom and significant research and development operations in the United States and Europe. Our distribution network supporting our professional diagnostics business includes offices in 32 countries.
Our professional diagnostic products are sold throughout the world. Our patient self-testing services are provided almost exclusively in the U.S. During 2015 and 2014, respectively, we generated approximately 56% and 53% of our net revenue from continuing operations from the U.S., approximately 18% and 21% from Europe and approximately 26% and 26% from other locations.
10
Table of Contents
For further financial information by geographic areas, see Note 18 of the notes to consolidated financial statements which are included elsewhere in this Annual Report on Form 10-K.
Competition
Professional Diagnostics. Our professional diagnostics products are primarily point-of-care rapid diagnostic testing products sold within the areas of infectious disease, cardiometabolic disease and toxicology. Competition for rapid diagnostic products is intense and is primarily based on price, quality, technology, speed of results, breadth of product line and distribution capabilities. Some competitors in the market for professional rapid diagnostic products, such as Becton Dickinson, are large companies with substantial resources, while numerous smaller, yet aggressive companies also compete with us, particularly where barriers to entry are low. As a result of the breadth of our product portfolio, no single competitor competes with us in every professional diagnostic product category, and our competitors differ significantly within each of our product areas of focus. Automated immunoassay systems also compete with our products, depending on government regulations or when labor shortages force laboratories to automate or when the unit costs of such systems are lower and other indirect costs are not taken into account. Such systems are provided by Abbott, Danaher, Ortho-Clinical Diagnostics, Roche, Siemens and other large diagnostic companies.
Our rapid diagnostic tests targeted at infectious disease compete primarily with products offered by Becton Dickinson, Meridian Bioscience and Quidel. Our products, particularly our HIV products, also compete with tests offered by OraSure Technologies. Our Alere i, Alere q and Alere Pima point-of-care analyzers compete with larger, laboratory-based analyzers from companies including Abbott, Becton Dickinson, Cepheid, Hologic and Roche, which also offer molecular technologies for amplifying DNA and RNA.
We also sell ELISA immunoassay diagnostic testing products, as well as serology, IFA and microbiology tests, primarily targeted at infectious and autoimmune diseases. Our ELISA tests compete against large diagnostics companies similar to those named above, and these companies manufacture and/or sell automated immunoassay systems and a wide array of diagnostic products designed for processing on those systems. Other competitors, including INOVA Diagnostics, DiaSorin and Diamedix, are smaller companies that compete based on quality and service. In the U.S. and Canada, we focus on matching the instrumentation and product testing requirements of our customers by offering a wide selection of diagnostic products and test equipment. The markets for our serology, IFA and microbiology products are mature and competition is based primarily on price and customer service. Our main competitors in serology and microbiology testing include Remel and Biokit. Our main competitors in IFA testing are Bio-Rad Laboratories, INOVA Diagnostics and Immuno Concepts. However, products in these categories also compete to a large extent against rapid membrane and ELISA products, whose tests are often easier to perform and read and can be more precise.
In cardiometabolic disease, the majority of diagnostic immunoassays utilized by physicians and other healthcare providers are performed by independent clinical reference laboratories and hospital-based laboratories using automated analyzers for batch testing. As a result, the primary competitors for our Alere Triage and Alere Cholestech LDX point-of-care testing systems, which consist of rapid diagnostic devices interpreted by portable electronic readers, are the large diagnostics companies identified above that produce automated immunoassay systems. We expect these large companies to continue to compete vigorously to maintain their significant market share of the cardiovascular testing market. Although we offer our Alere Triage BNP test for use on Beckman Coulter Immunoassay Systems, our other primary cardiovascular products are not currently designed for automated batch testing. Our Alere Triage products and our epoc Blood Analysis System face competition from a number of systems, including Abbott’s i-Stat hand-held system, in addition to the laboratory analyzers produced by the large diagnostic companies identified above and, for our epoc Blood Analysis System, near-patient systems produced by, among others, Instrumentation Laboratories, Nova Medical, Radiometer and Siemens. Our Alere Cholestech LDX system also faces direct competition from Abaxis
11
Table of Contents
Medical Diagnostics, which markets its point-of-care blood laboratory systems to physician office laboratories, and from Polymer Technology Systems’ CardioChek test. The primary competitor for our Alere INRatio PT/INR monitoring system was Roche Diagnostics. As described further below under “—Government Regulation,” we plan to voluntarily withdraw the INRatio and INRatio2 Systems from the market.
The primary competitors for our PT/INR patient self-testing business operated by Alere Home Monitoring are mdINR and Roche Diagnostics. Roche currently accounts for more than a majority of our domestic placements of PT/INR point-of-care and patient self-testing devices by Alere Home Monitoring. Our monitoring service is primarily marketed through a direct, dedicated sales force to clinicians who prescribe warfarin. Customer service and support levels are an important differentiator for us in this business. We do expect Alere Home Monitoring will continue to distribute other PT/INR coagulation monitors following the withdrawal of the INRatio and INRatio2 Systems from the market.
Competitors for our drugs-of-abuse tests include many of the large diagnostics companies named above, which manufacture instrumented drug tests, reagents or instruments sold in a variety of formats to customers in the worldwide employment, transportation, government and clinical sectors, among others. Additionally, in many markets in which the barriers to entry are low, we compete with dozens of privately-held, small and emerging low-cost manufacturers of lateral flow point-of-care drug tests. Our worldwide drug testing laboratory services compete with hundreds of multi-national and regional clinical, toxicology and forensic laboratories.
In the field of diabetes, the competitors for the Afinion™ Test System and NycoCard Test System include Siemens Healthcare, Bio-Rad Laboratories, Roche Diagnostics, EKF and Samsung. Arriva Medical, which is our mail-order diabetes testing product supply business, primarily sells products which are covered by Medicare, Medicaid and other third-party payers. Our major competitors for the sale of these products are large retail pharmacies, such as Walmart, Walgreens and CVS, independent pharmacies and a small number of mail-order suppliers. Competition for reimbursed diabetes testing supplies, which represent the majority of our business in this field, changed significantly in 2013 as a result of the decision by the Centers for Medicare & Medicaid Services, or CMS, to utilize a competitive bidding process. Based on the most recent bidding process, CMS will reimburse only nine selected suppliers willing to accept a fixed lowered reimbursement rate for the period from July 2016 to December 2018. As a result of the most recent competitive bidding process, Arriva Medical was awarded a national mail-order contract.
Our First Check tests compete against over-the-counter diagnostic tests sold primarily by Phamatech, but also by other smaller competitors.
Generally, the competitive positions of our professional diagnostic products may be based on, among other things, being first to market with a novel product, product performance, accuracy, convenience, cost-effectiveness, the strength of our intellectual property and price, as well as on the effectiveness of our sales force and our marketing and distribution partners. Where we face competition from large diagnostics companies, these competitors have greater resources than we do. In addition, certain competitors may have more favorable competitive positions than we do, particularly in markets outside the U.S.
Consumer Diagnostics. Substantially all of our consumer diagnostic products are sold to SPD, our joint venture. These products are sold by SPD for sale in retail markets where competition is intense and based primarily on brand recognition and price. Our revenues, as well as our share of the profits from the sale of these SPD products, are dependent upon SPD’s ability to effectively compete in these markets. Competitors for SPD’s products include Church & Dwights’ First Response brand, Perrigo’s Predictor brand, Prestige Brands’ EPT brand, and other private label suppliers.
12
Table of Contents
Patents and Proprietary Technology; Trademarks
We believe we have built a strong intellectual property portfolio including patents, patent applications, copyrights, trade secrets and other intellectual property, which are intended to protect our ownership of our present and future technologies, products and services. Our intellectual property portfolio includes patents and other intellectual property that we own and, in some cases, patents or other intellectual property that we license from third parties, which may be limited with respect to term and in terms of field of use or transferability and may require royalty payments. We generate these patent and other intellectual property rights covering significant inventions and other innovations in order to create a competitive advantage. While we believe that our licenses, patents and other intellectual property rights are of material importance to our business in the aggregate, we do not believe that any single license, patent, copyright, trade secret, trademark or other intellectual property right is in itself material to our business.
The medical device industry, including the diagnostic testing industry, historically has been characterized by extensive litigation regarding patents, licenses and other intellectual property rights.
We believe that our history of successfully enforcing our intellectual property rights in the U.S. and abroad demonstrates our resolve in enforcing our intellectual property rights, the strength of our intellectual property portfolio and the competitive advantage that we believe we have in this area. From time to time in the past, we have incurred substantial costs, both in asserting infringement claims against others and in defending ourselves against patent and other intellectual property infringement claims and we expect that we may incur substantial litigation costs as we continue to aggressively protect our technology, defend our proprietary rights and defend against infringement claims. We may not, however, continue to be successful in enforcing these rights in the future and our existing intellectual property rights may be challenged in the future and we may not be successful in defending against claims initiated against us.
We believe that certain of our trademarks are valuable assets that are important to the marketing of both our products and services. We have applied for or obtained registration for many of these trademarks with the United States Patent and Trademark Office or comparable foreign agencies.
We also seek to maintain our trade secrets and confidential information by nondisclosure policies and through the use of confidentiality agreements. These agreements, however, may not be enforceable in all jurisdictions and may not provide adequate protection to prevent disclosure or prevent future use by another entity.
The medical device industry and the market for patient self-testing services place considerable importance on obtaining and enforcing patent, trade secret, trademark and other intellectual property protection for new technologies, products, services and processes. Our success therefore depends, in part, on our ability to obtain and enforce the patents, trademark registrations and other intellectual property rights necessary to protect our products, to obtain and preserve our trade secrets and other confidential intellectual property and to avoid or neutralize intellectual property threats from third parties. We cannot, however, guarantee our success in enforcing or maintaining our patent, trademark, trade secret and other intellectual property rights; in obtaining (including by license) future patents, trademarks, trade secrets or other intellectual property rights in a timely manner or at all; or as to the breadth or degree of protection that our patents, trade secrets, trademark registrations or other intellectual property rights might afford us. For more information regarding the risks associated with our reliance on intellectual property rights, see the discussion in Item 1A entitled “Risk Factors” elsewhere in this Annual Report on Form 10-K.
Government Regulation
Our businesses are subject to extensive and frequently changing federal, state, local and foreign laws and regulations. Changes in applicable laws, changes in the interpretation or application of such
13
Table of Contents
laws, or any failure to comply with existing or future laws, regulations or standards could have a material adverse effect on our results of operations, financial condition, business and prospects. From time to time, we have been subject to inquiries, investigations and enforcement actions by governmental authorities alleging that we have not fully complied with our legal and regulatory obligations, some of which have not yet been resolved. While we take significant steps designed to ensure that our current operations, arrangements and practices are in material compliance with applicable laws and regulations, there can be no assurance that we are in compliance with all applicable laws and regulations or that we will be able to comply with new laws or regulations.
Our research, development and clinical programs, as well as our manufacturing and marketing operations, are subject to extensive regulation in the U.S. and other countries. Most notably, all of our diagnostic products sold in the U.S. are subject to the Federal Food, Drug and Cosmetic Act, or the FDCA, as implemented and enforced by the FDA. Our diagnostic products sold in the U.S., including any imbedded or stand-alone software which has been classified by the FDA as a Class II medical device, generally require either FDA clearance to market under Section 510(k) of the FDCA, or approval of a Premarket Application, or PMA, which may require pre-clinical and clinical trials. Foreign countries may require similar or more onerous approvals to manufacture or market these products. The marketing of our consumer diagnostic products is also subject to regulation by the FTC. In addition, we are required to comply with regulatory requirements in countries outside the U.S., which can change rapidly with relatively short notice. We must also demonstrate to the FDA that our diagnostic tests intended for home use or for use by laboratories holding a Certificate of Waiver under the Clinical Laboratory Improvement Act of 1967 and the Clinical Laboratory Amendments of 1988, or CLIA, including most physician office laboratories, are simple to use with a low risk of error. Foreign countries may require similar or more onerous approvals to manufacture or market our products or to allow the use of our products in certain settings.
CLIA extends federal oversight to many clinical laboratories for clinical testing, including certain of our drug testing laboratories in the U.S., by requiring that they be certified to meet quality assurance, quality control and personnel standards. Laboratories also must undergo proficiency testing and are subject to inspections. Certain of our drug testing laboratories perform forensic drug testing on employees of the federal government and private employers covered under the Department of Transportation guidelines and therefore the laboratories must be SAMSHA certified. SAMHSA certification includes oversight for testing Federal employees and private employers covered under DOT guidelines for forensic (non-clinical) purposes.
Certain of the clinicians who provide services in our patient self-testing business, such as nurses, must comply with individual licensing requirements. We believe that all of our clinicians who are subject to licensing requirements are licensed in the jurisdiction in which they are physically present and, if applicable, states in which they visit or interact with patients, to the extent such licensure is required.
Under Section 6002 of The Patient Protection and Affordable Care Act of 2010 (as amended by the Health Care and Education Reconciliation Act of 2010), or the ACA, which is commonly referred to as the Physician Payment Sunshine Act, or the Sunshine Act, and analogous state laws, we are required to collect data on and annually report to CMS and state regulatory agencies certain payments or other transfers of value to physicians and teaching hospitals and annually report certain ownership and investment interests held by physicians or their immediate family members.
Many areas of our business, including but not limited to our diabetes supply and patient self-testing services, are subject to unique licensing or permit requirements by state and local health and regulatory agencies. In addition, these and other areas of our business, including certain of our entities acting as a business associate, are subject to rules and regulations issued by the Department of Health and Human Services and the Office of Civil Rights, under laws such as the Health Insurance Portability and Accountability Act, or HIPAA, and the Health Information Technology for Economic and Clinical Health Act, or HITECH, and each state and certain foreign regulators have established their own additional rules, including with respect to privacy matters. We are also required to obtain
14
Table of Contents
certification to participate in certain governmental payment programs, such as various state or federal Medicare/Medicaid programs. Some states have established Certificate of Need/Determination of Need, or CON/DON, programs regulating the expansion of healthcare operations. Certain aspects of our business also require that we maintain supplier numbers that are authorized by government agencies to allow us to bill or be reimbursed by government agencies, such as CMS. The failure to obtain, renew or maintain any of the required licenses, certifications, supplier numbers or CON/DONs could adversely affect our business. We are also subject to laws regulating fraud, waste and abuse in the healthcare industry, including anti-kickback and false claim laws.
We are also subject to a number of legal requirements relating to our international operations, including the U.S. Foreign Corrupt Practices Act and the U.K. Bribery Act, which generally prohibit engaging in certain activities to obtain or retain business or to influence a person working in an official capacity. We are also subject to the customs, export, trade sanctions and anti-boycott laws of the U.S., including those administered by the U.S. Customs and Border Protection, the Bureau of Industry and Security, the Department of Commerce and the Office of Foreign Assets Control of the Treasury Department, as well as those of other nations in which we do business. These laws may prohibit us from doing business with nationals of designated countries, including, without limitation, Iran, Syria and Cuba, or importing or exporting certain of our products and technologies, without first obtaining a license or confirming a general license.
In addition, we are required to comply with domestic and foreign laws and regulations regarding data privacy. The regulation of data privacy and security, and maintaining the confidentiality of certain patient health information, is increasing and is becoming more complex. For example, in October 2015, the European Court of Justice invalidated a safe harbor on which we and other companies relied in order to transfer to the United States certain personal information subject to protections under European Union law. In February 2016, the European Commission and the United States reached a political agreement on the EU-US Privacy Shield, a new framework for data flows between the two jurisdictions. The EU-US Privacy Shield, if implemented, will impose more significant obligations on U.S. companies, including us, to protect the personal information of European citizens and will also require stronger monitoring and enforcement of personal privacy by the U.S. Department of Commerce and FTC. We also expect the European Union to adopt a Data Protection Regulation, which will replace the existing European Union Data Protection Directive. Similarly, the U.S. Department of Health and Human Services has issued rules governing the use, disclosure, and security of protected health information, and the U.S. Food and Drug Administration has issued further guidance concerning data security for medical devices. Failure to comply with data privacy and security regulations can result in enforcement actions, which could include civil or criminal penalties. Properly managing the use and transfer of protected health information and other confidential information is, and will continue to be, important for our business and for complying with applicable regulations.
INRatio®2 PT/INR Monitoring System Voluntary Withdrawal
Following a collaborative process with the FDA, in July 2016 we announced that we will be initiating a voluntary withdrawal of the Alere INRatio and INRatio2 PT/INR Monitoring System. We are currently working with the FDA on implementing the product withdrawal and eventual product discontinuation.
In December 2014, we initiated a voluntary correction to inform users of the Alere INRatio and INRatio2 PT/INR Monitoring Systems that patients with certain medical conditions should not be tested with the systems. We proactively reported these device concerns to the FDA and began conducting a thorough investigation into these events.
Over the course of the past two years, Alere invested in the research and development of software enhancements intended to address the potential, in certain cases, of the system to deliver a result that differs from that of another measurement method.
15
Table of Contents
We submitted the software enhancements to the FDA at the end of 2015. The FDA notified us that it believes the company’s studies do not adequately demonstrate the effectiveness of the software modification and advised us to submit a proposed plan to voluntarily remove the INRatio® device from the market.
In light of this input from the FDA and our business considerations, in July 2016 we determined to voluntarily remove the INRatio systems from the market.
For more information about the governmental regulations to which our business is subject and the risk associated with non-compliance with those regulations, see Item 1A “Risk Factors” of this Annual Report on Form 10-K. In addition, see Item 3 “Legal Proceedings” of this Annual Report on Form 10-K for information regarding certain actions or investigations being conducted by governmental agencies.
Employees
As of January 31, 2016, we had approximately 9,200 employees, of which approximately 3,700 are located in the U.S.
The risks described below may materially impact your investment in our company or may in the future, and, in some cases already do, materially affect us and our business, financial condition and results of operations. You should carefully consider these factors with respect to your investment in our securities.
Risks Related to the Merger
The proposed acquisition of Alere by Abbott may cause disruption in our business.
On January 30, 2016, we entered into the Merger Agreement, pursuant to which a newly formed, wholly owned subsidiary of Abbott will merge with and into Alere, with Alere surviving the merger as a wholly owned subsidiary of Abbott. The terms and conditions of the Merger Agreement, whether or not consummated, may have an impact on our financial condition, results of operations and cash flows. The Merger Agreement generally requires us to operate our business in the ordinary course pending consummation of the proposed merger and restricts us, without Abbott’s consent, from taking certain specified actions until the merger is completed. These restrictions may affect our ability to execute on our business strategies and attain our financial and other goals, including continuing efforts to transform our business in accordance with strategic goals established by our management. For example, we are prohibited from offering securities or issuing additional indebtedness and there may be circumstances in the future where it would be necessary or desirable to obtain additional funding in order to fund working capital, refinance existing indebtedness, fund operations or acquire businesses or technologies and we may be unable to do so without Abbott’s approval, and the failure to obtain such approval may harm our business. Additionally, the announcement of the proposed merger, whether or not consummated, may impact our relationships with employees, suppliers, customers, regulators and other third parties.
Failure to complete the merger in a timely manner or at all could negatively impact the market prices of our common stock and Series B Preferred Stock, as well as our future business and our financial condition, results of operations and cash flows.
We currently anticipate that the merger will close by the end of 2016, but we cannot be certain when or if the conditions to the proposed merger will be satisfied or (if permissible under applicable law) waived. The merger cannot be completed until the conditions to closing are satisfied or (if
16
Table of Contents
permissible under applicable law) waived, including the adoption of the Merger Agreement by the holders of our common stock and the receipt of required antitrust approvals. The obligation of each of the parties to the Merger Agreement to consummate the proposed merger is also conditioned on the other party’s representations and warranties being true and correct (subject to certain materiality exceptions) and the performance in all material respects by the other party of its obligations imposed under the Merger Agreement. In the event that the merger is not completed for any reason, the holders of our common stock will not receive any payment for their shares of our common stock in connection with the proposed merger. Instead, Alere will remain an independent public company and holders of our common stock will continue to own their shares of our common stock.
After entering into the Merger Agreement, Abbott informed us that it had serious concerns about, among other things, the accuracy of various representations, warranties and covenants made by us in the Merger Agreement. Abbott indicated that these concerns relate to the delay in filing this Annual Report on Form 10-K for the fiscal year ended December 31, 2015 as well as governmental investigations previously announced by us. Abbott has since requested information from us about these and other matters, citing contractual rights to receive information under the Merger Agreement. In the initial meeting in which Abbott expressed its concerns to us, as part of a discussion about potential paths forward, Abbott requested that we agree to terminate the Merger Agreement in return for a payment by Abbott to us in the range of $30 to $50 million in respect of our transaction expenses. Our Board of Directors promptly rejected that request. In these discussions, Abbott affirmed its commitment to abide by its obligations under the Merger Agreement. There can be no guarantee that the transactions contemplated by the Merger Agreement will close, and we may be required to engage in expensive and time-consuming litigation in connection with any actions or alleged breach of the Merger Agreement. The outcome of any such litigation cannot be predicted or guaranteed.
Additionally, if the merger is not consummated in a timely manner or at all, our ongoing business may be adversely affected as follows:
| • | we may experience negative reactions from the financial markets, including negative impacts on the market prices of our common stock and Series B Preferred Stock; |
| • | the manner in which customers, suppliers and other third parties perceive us may be negatively impacted, which in turn may affect our ability to compete for business; |
| • | we may experience negative reactions from employees; |
| • | we will have expended significant time and resources that could otherwise have been spent on our existing business; |
| • | we may be required, in certain circumstances, including if we terminate the Merger Agreement to accept an alternative takeover proposal from a third-party or if our board of directors changes its recommendation that our common stockholders vote to adopt the Merger Agreement, to pay Abbott a termination fee of $177.0 million; and |
| • | we may be subject to additional litigation in relation to the proposed merger, including any failure to complete the merger. |
In addition, if the proposed merger does not occur, we will nonetheless remain liable for expenses that we have incurred related to the proposed merger. The payment of such transaction expenses and the payment of the termination fee described above would have an adverse effect on our financial condition, results of operations and cash flows. In addition, we could be subject to litigation in relation to the proposed merger or in the event the merger is not consummated, which could subject us to liability for damages and result in the incurrence of significant legal fees.
We may be unable to obtain the approvals required to complete the proposed merger.
The consummation of the proposed merger is subject to the satisfaction or waiver of certain closing conditions, including the approval of the holders of our common stock and receipt of certain
17
Table of Contents
domestic and foreign antitrust approvals. If we are unable to obtain these approvals, we may be unable to consummate the proposed merger. We cannot predict whether the closing conditions to the proposed merger set forth in the Merger Agreement will be satisfied or whether the required antitrust approvals will be received. As a result, we cannot assure you that the proposed merger will be completed. On May 2, 2016, Abbott and Alere received a request for additional information, or a “second request,” from the FTC relating to Abbott’s potential acquisition of Alere. The second request was issued under the HSR Act. In addition, Abbott has agreed voluntarily to provide the FTC at least 60 days advance notice before certifying substantial compliance with the second request and to extend the waiting period imposed by the HSR Act until 60 days after Abbott and Alere have substantially complied with the second request, unless the period is further extended voluntarily by the parties or terminated sooner by the FTC. On June 23, 2016, Abbott and Alere received a request for additional information, or a “supplemental information request,” from the Canadian Competition Bureau, or the Bureau, relating to Abbott’s potential acquisition of Alere. The supplemental information request was issued under the Competition Act of Canada, or the Competition Act. The effect of the supplemental information request is to extend the waiting period imposed by the Competition Act until 30 days after Abbott and Alere have each complied with the supplemental information request, unless the period is extended voluntarily by the parties or terminated sooner by the Bureau. If the closing conditions, including the receipt of required antitrust approvals, for the proposed merger set forth in the Merger Agreement are not satisfied or (if permissible under applicable law) waived pursuant to the Merger Agreement, or if the proposed merger is not completed for any other reason, the market prices of our common stock and Series B Preferred Stock would likely decline.
We may lose management personnel and other key employees and be unable to attract and retain such personnel and employees.
Uncertainties about the effect of the proposed merger on management personnel and other employees may impair our ability to attract, retain and motivate key personnel until the proposed merger is completed and for a period of time thereafter, which could adversely affect our financial condition, results of operations and cash flows.
Risks Related to Business Operations
We face intense competition and our failure to compete effectively may negatively affect sales of our products and services.
Competition in the medical diagnostics product and other markets in which we operate is intense and expected to increase as new products, services and technologies become available and new competitors enter the market. Our competitors in the U.S. and abroad are numerous and include, among others, diagnostic testing and medical products companies, universities and other research institutions. Many of our existing or potential competitors have substantially greater research and development capabilities, clinical, manufacturing, regulatory and marketing experience and financial and managerial resources than we do. Our sales and results of operations may be adversely affected by:
| • | customers’ perceptions of the comparative quality of our competitors’ products or services; |
| • | our ability to manufacture, in a cost-effective way, sufficient quantities of our products to meet customer demand; |
| • | the ability of our competitors to develop products, services and technologies that are more effective than ours or that render ours obsolete; |
| • | our competitors’ ability to obtain patent protection or other intellectual property rights that would prevent us from offering competing products or services; |
| • | the ability of our competitors to obtain regulatory approval for the commercialization of products or services more rapidly or effectively than we do; and |
18
Table of Contents
| • | competitive pricing by our competitors, particularly in emerging markets. |
In addition, as the number of competing products increases in the markets we serve, including the increased competition for our meter-based Alere Triage BNP test, the sales unit volume and average selling prices for our products may decline, which may adversely impact our product sales, gross margins and overall financial results. This may occur even if we are able to successfully introduce new products in these markets, and achieve market acceptance of those products, in a timely manner.
We face risks and uncertainties relating to the FDA warning letter and OIG subpoena.
On October 9, 2012, we received a warning letter from the FDA referencing inspectional observations set forth in a Form FDA 483 received in June 2012. The observations were the result of an inspection of our San Diego facility conducted earlier during 2012 relating to our Alere Triage products, which resulted in two recalls of certain Alere Triage products and revised release specifications for our Alere Triage meter-based products. In September 2014, as a follow up to a further inspection of our San Diego facility, the FDA notified us that this inspection was classified “voluntary action indicated,” meaning that the objectionable conditions or practices found in the inspection did not meet the threshold of significance requiring regulatory action, but that formal close-out of the October 2012 warning letter could not occur until after a future inspection.
In May 2012, we also received a subpoena from the Office of Inspector General of the Department of Health and Human Services, or the OIG, seeking documents relating primarily to the quality control testing and performance characteristics of Alere Triage products. We are cooperating with the OIG and are responding to the investigation, which is ongoing.
We cannot assure you that the government will find our efforts to resolve the FDA warning letter or the investigation initiated by the OIG subpoena to be satisfactory. We may be unable to implement corrective actions within a timeframe or in a manner satisfactory to the FDA. Previous potential violations relating to the matters under review by the FDA and/or OIG, as well as failure to timely implement corrective actions can result in enforcement proceedings by the government, which may include potential civil or criminal fines and penalties, including disgorgement of amounts earned on any legally-adulterated products (the amount of such fines and/or penalties may be significant;) injunctive relief, which could limit, modify or constrain our ability to manufacture, market and sell our products; and exclusion from participation in government healthcare programs, such as Medicare and Medicaid. We have received inquiries from regulatory authorities outside the U.S. regarding the Alere Triage recalls in the U.S. and, in at least one case, remedial or corrective action was required. We cannot predict whether other governments’ regulatory authorities will require additional remedial or corrective actions in the future. The investigation initiated by the OIG subpoena can also result in civil or criminal fines or penalties (the amount of such fines and/or penalties may be significant), increased supervision of our business operations by the OIG, or exclusion from participation in government healthcare programs, such as Medicare and Medicaid. We are unable to predict when these matters will be resolved or what action, if any, the government will take in connection with these matters. The issues arising out of the FDA inspection and OIG subpoena may be expanded to cover other matters. We can also face product liability, third-party payer, shareholder, or other litigation. Any of these risks and uncertainties can adversely affect our revenues, results of operations, cash flows and financial condition.
We face risks related to ongoing SEC and Department of Justice investigations.
On August 28, 2015, we received a subpoena from the SEC which indicated that it is conducting a formal investigation of Alere. The SEC’s subpoena relates to, among other things, (i) our previously filed restatement and revision to our financial statements, including the accounting for deferred taxes for discontinued operations, as well as our tax strategies and policies, and (ii) our sales practices and dealings with third parties (including distributors and foreign government officials) in Africa relating to sales to government entities. On January 14, 2016, we received a second subpoena from the SEC in connection with this formal investigation seeking, among other things, additional information related to
19
Table of Contents
sales of products and services to end-users in Africa, as well as revenue recognition relating to sales of products and services to end-users in Africa. We have also received, from time to time, requests in connection with the investigation to voluntarily produce additional information to the SEC, including information pertaining to certain other countries in Asia and Latin America. In addition, on March 11, 2016, we received a grand jury subpoena from the United States Department of Justice requiring the production of documents relating to, among other things, sales, sales practices and dealings with third parties (including distributors and foreign governmental officials) in Africa, Asia and Latin America and other matters related to the U.S. Foreign Corrupt Practices Act. We are in the process of responding to these subpoenas and requests for information and are cooperating with the SEC and Department of Justice investigations.
These investigations have resulted and are expected to continue to result in considerable legal expenses and diversion of management’s attention from other business concerns. The amount of time needed to resolve the investigations is uncertain, and we cannot predict the outcome of these investigations, whether we will face additional government inquiries or other actions or whether the scope of these investigations will expand. If the SEC were to file an action, we could be required to pay significant penalties and/or other amounts and could become subject to either an injunction or an administrative cease-and-desist order, which could have an adverse effect on our operations, financial condition, business, results of operations, and cash flow. In addition, the investigation initiated by the Department of Justice could result in civil or criminal penalties, including fines or other penalties that may be material to our business. Subject to certain limitations, we are obligated to indemnify our current and former directors, officers and employees in connection with the ongoing investigations and any future government inquiries, investigations, or actions. We are currently unable to predict the outcome of any of these matters.
We may experience difficulties that delay or prevent our development, introduction or marketing of new or enhanced products or services.
Our success depends on our ability to effectively introduce new and competitive products and services. The development of new or enhanced products or services is a complex, costly and uncertain process and is becoming increasingly complex and uncertain in the U.S. We have, in recent quarters, reduced our research and development expenses, and there is no guarantee that our more focused research and development efforts will allow us to continue to introduce new products or improve our existing products as we had in the past, or at all. Furthermore, developing and manufacturing new products and services require us to anticipate customers’ and patients’ needs and emerging technology trends accurately. We may experience research and development, manufacturing, regulatory, marketing and other difficulties that could delay or prevent our introduction of new or enhanced products and services. The research and development process in the healthcare industry generally takes a significant amount of time from design stage to product launch. This process is conducted in various stages, and each stage presents the risk that we will not achieve our goals. We may have to abandon a product in which we have invested substantial resources. We cannot be certain that:
| • | any of our products or services under development will prove to be safe and effective in clinical trials; |
| • | we will be able to obtain, in a timely manner or at all, necessary regulatory approvals; |
| • | the products and services we develop can be manufactured or provided at acceptable cost and with appropriate quality; or |
| • | these products and services, if and when approved, can be successfully marketed. |
These factors, as well as manufacturing or distribution problems or other factors beyond our control, could delay the launch of new or enhanced products or services. Any delay in the development, approval, production, marketing or distribution of a new product or service could materially and adversely affect our competitive position, our branding and our results of operations.
20
Table of Contents
Our financial condition and results of operations may be adversely affected by international business risks.
We generate a significant percentage of our net revenue from outside the U.S., and a significant number of our employees, including manufacturing, sales, support, and research and development personnel, are located outside the U.S., including in Africa, Australia, Brazil, China, Germany, India, Ireland, Israel, Japan, Norway, the Philippines, South Korea and the United Kingdom. Conducting business outside the U.S. subjects us to numerous risks, including:
| • | the negative impact of foreign exchange rates, which had a significant negative impact on our results of operations in 2015; |
| • | lost revenues as a result of macroeconomic developments, such as the recent European budgetary issues, debt crisis and related European financial restructuring efforts, which caused European governments to reduce spending and cause the value of the Euro to further deteriorate, thus reducing the purchasing power of European customers and the dollar value of European sales; |
| • | decreased liquidity resulting from longer accounts receivable collection cycles typical of foreign countries; |
| • | lower productivity resulting from difficulties we encounter in staffing and managing sales, support, and research and development operations across many countries; |
| • | lost revenues or unexpected expenses resulting from difficulties associated with enforcing agreements and collecting receivables through foreign legal systems; |
| • | lost revenues or unexpected expenses resulting from disputes with third-party distributors of our products or from third parties claiming distribution rights to our products under foreign laws or legal systems; |
| • | lost revenues or unexpected expenses resulting from the imposition by foreign governments of trade barriers such as tariffs, quotas, preferential bidding, and import restrictions; |
| • | higher cost of sales resulting from import or export licensing requirements; |
| • | lost revenues or other adverse effects resulting from acts of war, terrorism, theft or other lawless conduct or otherwise resulting from economic, social or political instability in or affecting foreign countries in which we sell our products or operate; |
| • | lost revenues or other adverse effects resulting from international sanctions regimes; |
| • | adverse effects resulting from changes in foreign regulatory or other laws affecting sales of our products or our foreign operations; |
| • | greater tax liability resulting from international tax laws, including U.S. taxes on foreign subsidiaries; |
| • | increased financial accounting and reporting burdens and complexities; |
| • | increased costs to comply with changes in legislative or regulatory requirements; |
| • | lost revenues or increased expenses resulting from the failure of laws to protect our intellectual property rights; and |
| • | lost revenues resulting from delays in obtaining import or export licenses, transportation difficulties and delays resulting from inadequate local infrastructure. |
Our international operations subject us to varied and complex domestic, foreign and international laws and regulations, as further discussed below. Compliance with these laws and regulations often involves significant costs or requires changes in our business practices that may reduce revenues and profitability.
In addition, on June 23, 2016, voters in the U.K. approved an advisory vote calling for that country’s exit from the E.U., commonly referred to as “Brexit”. As a result of the referendum, it is
21
Table of Contents
expected that the British government will begin negotiating the terms of the U.K.’s future relationship with the E.U. Although it is unknown what those terms will be, the effects of Brexit will depend on any agreements the U.K. makes to retain access to E.U. markets either during a transitional period or more permanently. The measures could potentially disrupt the markets we serve and the jurisdictions in which we operate and adversely change tax benefits or liabilities in these or other jurisdictions, and may cause us to lose customers, suppliers, and employees. In addition, Brexit could lead to legal uncertainty and potentially divergent national laws and regulations, including with respect to medical devices, as the U.K. determines which E.U. laws to replace or replicate.
The announcement of Brexit may also create global economic uncertainty, which may cause our customers to closely monitor their costs and reduce their spending budget on our products and services. Any of these effects of Brexit, among others, could adversely affect our business, business opportunities, results of operations, financial condition and cash flows.
We could incur additional legal and compliance costs associated with our global operations and could become subject to legal penalties if we do not comply with certain regulations.
As a result of our international operations, we are subject to a number of legal requirements relating to our international operations, including the U.S. Foreign Corrupt Practices Act, the U.K. Bribery Act and the customs, export, trade sanctions and anti-boycott laws of the U.S., including those administered by the U.S. Customs and Border Protection, the Bureau of Industry and Security, the Department of Commerce and the Office of Foreign Assets Control of the Treasury Department, as well as similar agencies in other nations in which we do business. Compliance with these laws and regulations is complex and involves significant costs. In addition, our training and compliance programs and our other internal control policies may not always prevent or detect acts committed by our employees, distributors or agents that may violate these laws. Any violation of these legal requirements by us, our employees or our agents and distributors could potentially subject us to civil liability or criminal liability and result in restrictions on our operations.
Because our business relies heavily on foreign operations and revenues, changes in foreign currency exchange rates and our need to convert currencies may negatively affect our financial condition and results of operations.
Our business relies heavily on our foreign operations. We have significant manufacturing operations in Canada, China, Germany, Japan, Norway, South Korea and the United Kingdom, and we also have additional manufacturing operations in other countries. We have significant research and development operations in Germany, Norway and the United Kingdom, and we conduct additional research and development activities in China, Japan, South Korea and other locations in the United Kingdom. In 2015, approximately 44% of our net revenue was derived from sales outside the U.S. Because of the scope of our foreign operations and foreign sales, we face significant exposure to movements in foreign currency exchange rates. These exposures may change over time as our business practices evolve and could result in increased costs or reduced revenue and could affect our cash flow. Changes in the relative values of currencies occur regularly and, in some instances, may have a significant impact on our operating results. For 2015, the decrease in total revenue as compared to 2014 was partially attributable to a $119.4 million negative impact due to movements in foreign currency exchange rates. Recent events, including the announcement of Brexit, have led to significant volatility in foreign currency exchange rates. We cannot predict with any certainty changes in foreign currency exchange rates or the degree to which we can cost-effectively mitigate these risks.
The revision of our previously issued financial statements has been time-consuming and expensive and could expose us to additional risks that could adversely affect our business, results of operations, cash flows and financial condition, including additional stockholder litigation and loss of investor confidence.
22
Table of Contents
As discussed herein, we have revised our previously issued audited financial statements for the years ended December 31, 2013 and December 31, 2014, and our interim financial statements for 2014 and 2015. These revisions (including the review of the errors that necessitated revisions of our financial statements) have been time consuming and expensive. In addition, in 2015, we determined that we should restate our previously issued audited financial statements for 2014 and our unaudited condensed consolidated financial statements for the three and nine months ended September 30, 2014 (and revise our financial statements for certain earlier periods) as a result of errors that resulted from a material weakness relating to the accounting for income taxes. We have incurred unanticipated expenses and costs, including audit, legal, consulting and other professional fees, in connection with the restatement and revision of our previously issued financial statements and the ongoing remediation of material weaknesses in our internal control over financial reporting and any further revision or restatement of our financial statements would likely cause us to incur significant additional accounting, legal, consulting and other professional fees and expenses, which would adversely affect our results of operations and financial condition, and could expose us to potential claims and additional risks that could adversely affect our business, results of operations, cash flows and financial condition. Certain remediation actions have been recommended and we are in the process of implementing them (see Item 9A “Controls and Procedures” of this Annual Report on Form 10-K for a description of these remediation measures). To the extent these steps are not successful, we could be exposed to additional risks that could adversely affect our business, results of operations, cash flows and financial condition.
In addition, any additional revisions or restatements of our financial statements may lead to a loss of investor confidence and have a negative impact on the trading prices of our securities. Any of these matters could adversely affect on our business, reputation, revenues, results of operations and financial condition.
We have identified material weaknesses in our internal control over financial reporting as of December 31, 2014 and 2015, which have not been remediated, and these or other material weaknesses could impair our ability to report accurate financial information in a timely manner and/or increase the risk of future errors, which could adversely affect our business, results of operations, cash flows and financial condition.
A material weakness is a deficiency, or a combination of deficiencies, in internal control over financial reporting, such that there is a reasonable possibility that a material misstatement of our annual or interim financial statements will not be prevented or detected on a timely basis.
In connection with the preparation and filing of our Annual Report on Form 10-K for 2014, our management concluded that we had a material weakness as of December 31, 2014 related to the failure to design controls to assess the accounting for deferred taxes related to dispositions. During the course of preparing our consolidated financial statements and other financial data for the three months ended March 31, 2015, we identified errors in our consolidated financial statements for 2014 and all interim periods therein relating primarily to the accounting for income taxes for our discontinued operations. Following the completion of our review of those errors and related matters, our audit committee determined that we should restate our consolidated financial statements for 2014 and the three and nine months ended September 30, 2014. As a result of the restatement, we were unable to timely file our Quarterly Report on Form 10-Q for the three months ended March 31, 2015. Subsequently, during the course of preparing our consolidated financial statements and other financial data for the three months ended September 30, 2015, management identified and corrected errors in our financial statements for the quarter ended September 30, 2015 relating to U.S. taxes on foreign earnings for 2014. Management concluded that these errors were the result of a material weakness in that we did not maintain a sufficient complement of resources with adequate experience and expertise in accounting for income taxes. In November 2015, we amended our Annual Report on Form 10-K for 2014 to revise both management’s annual report on internal control over financial reporting and the related report of our independent registered public accounting firm. This material weakness related to accounting for income taxes had not been remediated as of December 31, 2015.
23
Table of Contents
As described in Item 9A, in connection with the preparation of this Annual Report on Form 10-K, management concluded that we had the following material weaknesses related to revenue recognition: (i) we did not maintain a sufficient complement of resources at our subsidiaries with appropriate knowledge, experience and training to ensure proper application of US GAAP in determining revenue recognition, (ii) we also did not maintain effective controls over information and communications as it relates to revenue recognition at our subsidiaries (specifically, we did not implement and reinforce an adequate process for internally communicating nonstandard terms and conditions between our subsidiaries’ commercial operations and finance groups and between our subsidiaries’ finance groups and our corporate accounting group), (iii) we did not design effective controls over the review of terms of purchase orders and customer contracts, including amendments to contracts, to ensure proper application of US GAAP in determining revenue recognition and (iv) we did not design effective controls to ensure that revenue would not be recognized until title and risk of loss had passed to our customers.
In connection with the evaluation required by Rule 13a-15(c) under the Exchange Act, our management concluded that the material weaknesses identified in Item 9A existed and had not been remediated as of December 31, 2015, and, therefore, that we did not maintain effective internal control over financial reporting or effective disclosure controls and procedures as of that date. While we are continuing to take steps to remediate these material weaknesses, our remedial measures may not be adequate to prevent additional errors or avoid other control deficiencies or material weaknesses with respect to taxes, revenue recognition or any other matters. The effectiveness of our internal control over financial reporting is subject to various inherent limitations, including judgments used in decision making, the nature and complexity of the transactions we undertake, assumptions about the likelihood of future events, the soundness of our systems, the adequacy of training and experience, the possibility of human error, the existence and sufficiency of any appropriate compensating controls, cost limitations and the risk of fraud. Moreover, projections of any evaluation of effectiveness to future periods are subject to the risk that controls may become inadequate because of changes in conditions and the risk that the degree of compliance with policies or procedures may deteriorate over time. Because of these limitations, there can be no assurance that any system of internal control over financial reporting will be successful in providing reasonable assurance regarding the reliability of financial reporting and the preparation of financial statements for external purposes in accordance with generally accepted accounting principles. As a result, our financial statements may contain one or more material misstatements and may not be available on a timely basis or we may discover additional material weaknesses related to taxes, revenue recognition or other matters, any of which could cause investors to lose confidence in us and lead to, among other things, additional legal, accounting and other expenses, delays in filing required financial disclosures, events of default under the credit agreement governing our senior secured credit facility or the indentures governing our notes (or significant payments to amend such agreements), additional or expanded investigations or enforcement actions by government authorities, fines, penalties, the delisting of our securities, a decline in the prices of our securities and liabilities arising from stockholder litigation.
Delays in the filing of future Exchange Act reports, the related financial statements and other required securities reporting obligations may result in a default under our secured credit facility and/or one or more of the indentures governing our outstanding notes and has caused us to delay issuances of shares under our equity plans, all of which could adversely affect our business, results of operations, cash flows and financial condition.
If we discover additional errors in our financial statements, whether or not those errors require a revision or restatement of our financial statements, or if our internal control over financial reporting or our disclosure controls and procedures are not effective in the future, we may be unable to comply with our reporting obligations under the Exchange Act and other securities laws in a timely manner.
Due to the material weakness with respect to revenue recognition, we were unable to file this Annual Report on Form 10-K or our Quarterly Report on Form 10-Q for the three months ended
24
Table of Contents
March 31, 2016, or the First Quarter 2016 Form 10-Q, on a timely basis. As a result of this delay, we entered into an amendment to the credit agreement for our secured credit facility, or the April 2016 Amendment, and solicited consents from the requisite holders of our senior notes and senior subordinated notes, or the Consent Solicitations, to waive certain defaults and extend the deadline dates for the filing and delivery, as applicable, of this Annual Report on Form 10-K, the First Quarter 2016 Form 10-Q and certain related deliverables in order to avoid events of default under the credit agreement governing our secured credit facility, or the Credit Agreement, and the indentures governing our notes. Through July 20, 2016, we have paid an aggregate of $25.9 million (including fees incurred in connection therewith) in connection with the April 2016 Amendment and the Consent Solicitations. The April 2016 Amendment also increases the applicable interest rate margins for all loans outstanding under our secured credit facility by 0.25% per annum for the period from July 1, 2016 to the date of delivery of such financial reports and related deliverables under our secured credit facility.
If the First Quarter 2016 Form 10-Q is not filed when required under these arrangements, we may be in default due to the breach of the reporting covenants in the Credit Agreement or the indentures governing our notes. Under the terms of the April 2016 Amendment, we are required to deliver the First Quarter 2016 Form 10-Q and certain related deliverables on or before August 18, 2016, and our failure to do so could give rise to an event of default under the Credit Agreement. Such an event of default would impact our ability to draw on our revolving credit facility and could lead to an acceleration of our secured credit facility. Under the terms of the Consent Solicitations, we are required to deliver the First Quarter 2016 Form 10-Q on or before August 31, 2016, and our failure to do so could give rise to events of default under the indentures governing our notes, and such events of default could lead to an acceleration of our notes. Any acceleration of our secured credit facility or any of our notes could result in a cross-acceleration of all other such debt. If our secured credit facility or any of our notes are accelerated, we may not have sufficient funds to satisfy those debt obligations. While we may be successful in obtaining relief or further extensions of time under the Credit Agreement or the indentures governing our notes for the filing and delivery of our First Quarter 2016 Form 10-Q and related deliverables, we cannot guarantee that such relief or extension would be granted or, if granted, would provide us with a sufficient period of time to cure the reporting defaults. In addition, in order to obtain any such relief or extension, we may be required to accept terms that are adverse to us and we would likely incur significant additional fees and related costs.
In addition, during the period in which we were not in compliance with our reporting obligations under the Exchange Act, we ceased issuing shares of our common stock under our equity incentive programs. We plan to resume issuing shares under these incentive programs once we are in compliance with such reporting obligations. If holders of equity awards determine that they have been financially harmed as a result of this delay in their ability to exercise awards, it could damage the morale of our employees and they may commence litigation against us. While we believe that we are in compliance with applicable law and the terms of these equity incentive plans and individual award agreements, we may become involved in litigation that may be costly and time-consuming and an ultimate resolution in our favor cannot be guaranteed.
Healthcare reform legislation could adversely affect our revenue and financial condition.
The Patient Protection and Affordable Care Act (as amended by the Health Care and Education Reconciliation Act of 2010), or the ACA, makes comprehensive reforms at the federal and state level affecting the coverage and payment for healthcare services in the U.S. The ACA contains many provisions designed to generate the revenues necessary to fund the coverage expansions and reduce the costs of Medicare and Medicaid. While certain provisions of the ACA took effect immediately, others have delayed effective dates. Given the scope of the changes made by the ACA and the ongoing implementation efforts, we cannot predict the impact of every aspect of the new law on our operations.
25
Table of Contents
In particular, the ACA significantly alters Medicare Advantage reimbursements by setting the federal benchmark payment closer to the payments in the traditional fee-for-service Medicare program. This change has reduced our revenues from the Medicare Advantage plans for which we perform services, although the precise effect on any particular plan, much less the impact on us, going forward is impossible to predict. Effective January 1, 2013, the ACA includes a 2.3% excise tax on the sale of certain medical devices sold outside of the retail setting. For 2014 and 2015, we incurred $9.8 million and $9.9 million, respectively, in excise tax expense related to the domestic sale of our medical device products as a result of the implementation of this tax. Although a moratorium has been imposed on this excise tax for 2016 and 2017, the excise tax is currently scheduled to be restored in 2018. Also, legislative provisions impose federal reporting requirements regarding payments or relationships between manufacturers of covered drugs, devices or biological or medical supplies, and physicians, among others.
Since 2013, revenues associated with our diabetes business have been impacted by the Durable Medical Equipment, Prosthetics, Orthotics and Supplies, or the DMEPOS, Competitive Bidding Program operated by CMS. Under this program, Medicare no longer reimburses suppliers for certain products and services, including mail-order diabetes testing supplies, based on the Medicare fee schedule amount. Instead, CMS provides reimbursement for those products and services based on a competitive bidding process. There is no guarantee that we will prevail in this bidding process in the future, and a failed bid would significantly harm our cardiometabolic operations. Further, while the DMEPOS Competitive Bidding Program limits the number of potential participants in the mail-order diabetes testing supplies market, it also requires us to sell diabetes supplies subject to Medicare reimbursement at significantly lower prices, which has had, and may continue to have, a material adverse effect on the profitability of these products. Moreover, under the Clinical Laboratory Fee Schedule, or CLFS, certain laboratories and physician offices, including certain of our labs, are required to collect and report private payor rate and volume data, which CMS will use in determining new Medicare CLFS rates for 2017. The new Medicare CLFS rates may provide for lower reimbursement for our products and services, which could adversely affect our revenues and results of operations.
Changes to CMS reimbursement policies for drugs of abuse that were implemented in 2016 may also have a negative impact on our toxicology business.
Legislative and regulatory bodies, including Congress, are likely to continue to pursue healthcare reform initiatives and may continue to reduce the funding of the Medicare and Medicaid programs, including Medicare Advantage, in an effort to reduce overall healthcare spending. The ultimate impact of all of the reforms in the ACA or other health care laws, and their impact on us, is impossible to predict. If all of the reforms in the legislation are implemented, or if other reforms in the United States or elsewhere are adopted, those reforms may have a material adverse effect on our financial condition and results of operations.
If the results of clinical studies required to gain regulatory approval to sell our products are not available when expected, or do not demonstrate the safety and effectiveness of those products, we may be unable to sell those products.
Before commercializing certain of our products, we must conduct clinical studies involving human subjects or specimens exhibiting symptoms of the disease or medical condition that the product is intended to diagnose or evaluate. Results of these clinical studies, as well as other internally generated data, are used to obtain market clearance or approval from government authorities such as the FDA by establishing that the device is safe and effective for its intended use or, in the case of premarket clearance, is substantially equivalent to a similar marketed device. In order to protect the welfare of human subjects, Institutional Review Board, or IRB, approval is required before initiation of a clinical study and, in the case of studies involving significant risk devices, prior FDA approval is also required. Failure to comply with any applicable law or regulation or with any condition of approval imposed by the FDA or an IRB could result in early study termination or generation of data that cannot be used in support of a market clearance/approval application. For example, at any time during a clinical study,
26
Table of Contents
the FDA may rescind its approval (or deny approval to commence a study) if, among other things, we fail to comply with any applicable law or regulation or any condition of approval imposed by the FDA or an IRB; any of our submissions to the FDA contains an untrue statement of a material fact or omits material information required by FDA regulations; we fail to respond timely to a request for additional information by the FDA; there is reason to believe that the risks outweigh the benefits to the subjects; informed consent is inadequate; the investigation is scientifically unsound; there is reason to believe that the device as used is ineffective; or the manufacture of the clinical study product is inadequate.
Conducting clinical studies is a complex, time-consuming and expensive process, requiring months to several years to complete, and our studies are not guaranteed to generate data that demonstrates safety and effectiveness or substantial equivalence of the evaluated product. If we fail to adequately manage our clinical studies, those clinical studies and corresponding regulatory approvals may be delayed or we may fail to gain approval for our products altogether. Even if we successfully manage our clinical studies, we may not obtain favorable results and may not obtain regulatory approval. Failure to obtain regulatory approvals in the timeframe needed to execute our product strategies, or at all, whether due to inadequate management/execution of our studies or due to unfavorable results, would materially and adversely affect our business.
If we are unable to obtain required clearances or approvals for the commercialization of our products in the United States, we would not be able to sell those products in the United States.
Our future performance depends on, among other matters, the timely receipt of necessary regulatory approvals for new products. Regulatory approval can be a lengthy, expensive and uncertain process. In addition, regulatory processes are subject to change, and new or changed regulations can result in increased costs and unanticipated delays.
In the U.S., clearance or approval to commercially distribute new medical devices is received from the FDA through clearance of a Premarket Notification 510(k), or 510(k), or through approval of a Premarket Application, or PMA. The FDA may deny 510(k) clearance because, among other reasons, it determines that a product is not substantially equivalent to another U.S. legally marketed device. The FDA may deny approval of a PMA because, among other reasons, it determines that a product is not sufficiently safe or effective. As part of the clearance or approval process, if we intend to sell certain diagnostic tests for home use or for use by laboratories holding a CLIA Certificate of Waiver, including most physician office laboratories, we must generally provide data demonstrating to the FDA’s satisfaction that the criteria for our tests are simple with a low risk of error. Failure to obtain FDA clearance or approval would preclude commercialization in the U.S. and failure to obtain or maintain CLIA-waived status for any product would preclude us from selling that product to CLIA-waived laboratories, which could materially and adversely affect our future results of operations.
Modifications or enhancements to a cleared or approved device that could significantly affect safety or effectiveness, or that constitute a major change in the intended use of the device, require submission of a new 510(k) or a PMA supplement or amendment. We have made modifications to some of our products since receipt of initial 510(k) clearance or PMA approval. With respect to several of these modifications, we filed new 510(k)s describing the modifications and received FDA 510(k) clearance. We have made other modifications to some of our products that we believe do not require the submission of new 510(k)s or PMA supplements or amendments. The FDA may not agree with any of our determinations not to submit a new 510(k) or a PMA supplement or amendment for any of these modifications made to our products. If the FDA requires us to submit a new 510(k) or a PMA supplement or amendment for any device modification, we may be prohibited from marketing the modified products until the new submission is cleared or approved by the FDA. As long as our San Diego facility remains subject to the FDA warning letter that we received in October 2012, that facility may be ineligible to receive PMA approvals. While no PMA submissions are currently pending for that facility and we do not plan any new PMA submissions for that facility in 2016, if we are unable to resolve the warning letter in a timely manner, our ability to gain approval for new or enhanced products for this facility could be adversely impacted.
27
Table of Contents
We are subject to regulatory approval requirements of the foreign countries in which we sell our products, and these requirements may prevent or delay us from marketing our products in those countries.
We are subject to the regulatory approval requirements for each foreign country in which we sell our products. The process for complying with these approval requirements can be lengthy and expensive. Any changes in foreign approval requirements and processes may cause us to incur additional costs or lengthen review times of our products. We may not be able to obtain foreign regulatory approvals on a timely basis, if at all, and any failure to do so may cause us to incur additional costs or prevent us from marketing our products in foreign countries, which may have a material adverse effect on our business, financial condition and results of operations. In order for us to market our products in some foreign countries, their governments require export certificates from the FDA seeking official assurance that products exported to their countries can be legally marketed in the United States or meet specific U.S. regulations, such as current Good Manufacturing Practice (cGMP) regulations. If we are unable to obtain these certificates from the FDA, we may be unable to market our products in certain foreign countries.
Our business is subject to substantial ongoing regulatory oversight and our failure to comply with applicable regulations may result in significant costs or, in certain circumstances, the suspension or withdrawal of previously obtained clearances or approvals.
Our businesses are extensively regulated by the FDA and other federal, state and foreign regulatory agencies. These regulations impact many aspects of our operations, including development, manufacturing, labeling, packaging, storage, adverse event reporting, advertising, promotion, physician interaction and record-keeping.
The FDA and foreign regulatory agencies may require post-market testing and surveillance to monitor the performance and use of approved products or may place conditions on any product approvals that could restrict the commercial applications of those products. The discovery of problems with a product may result in restrictions on the product, including notices of correction or product recalls, such as our December 2014 voluntary urgent medical device correction initiated with respect to our Alere INRatio and Alere INRatio2 systems and our subsequent July 2016 decision to voluntarily withdraw the INRatio and INRatio2 systems from the market. For additional information on this plan to voluntarily withdraw these systems, see “Item 1 Business—Government Regulation.” This planned market withdrawal may divert management’s time and attention as well as our financial resources. We do not expect to generate further meaningful revenue from sales of INRatio and INRatio2 systems, which generated approximately $20.4 million of revenue in 2015. As a result of this withdrawal, we have incurred and expect to incur certain charges. For additional information on these charges, see Note 28 to the consolidated financial statements included elsewhere in this Annual Report on Form 10-K. These and other product corrections, recalls and withdrawals could divert management time and attention, reduce market acceptance of all of our products, harm our reputation, lead to additional charges or expenses or result in product liability claims, any of which could have a material adverse effect on our revenue, results of operations and financial condition. In addition, in some cases we may sell products or provide services which are reliant on the use or commercial availability of products of third parties, including medical devices, equipment or pharmaceuticals, and regulatory restrictions placed upon any such third-party products could have a material adverse impact on the sales or commercial viability of our related products or services. We are subject to routine inspection by the FDA and other agencies for compliance with the Quality System Regulation and Medical Device Reporting requirements in the United States and other applicable regulations worldwide. Our manufacturing facilities and those of our suppliers and distributors also are, or can be, subject to periodic regulatory inspections.
Under CLIA, some of our drug testing laboratories in the United States are required to be certified to meet quality assurance, quality control and personnel standards. Laboratories also must undergo proficiency testing and are subject to inspections. Our laboratories that perform drug testing on
28
Table of Contents
employees of federal government contractors and some other entities are regulated by the U.S. SAMHSA, which has established detailed performance and quality standards that laboratories must meet in order to perform this work.
Portions of our business are subject to unique licensing or permit requirements. For example, we may be required to obtain certification to participate in governmental payment programs, such as state or federal Medicaid/Medicare programs. Certain aspects of our business also require that we maintain supplier numbers that are authorized by government agencies to allow us to bill or be reimbursed by government agencies, such as CMS. For example, one of our subsidiaries has, in the past, had its Medicare supplier number deactivated by an enrollment contractor for CMS. While we were able to reactivate the supplier number and were reimbursed for all services we provided while the supplier number was deactivated, there can be no guarantee that one or more of our supplier numbers will not be deactivated in the future, or that we will be reimbursed for any materials or services supplied to customers during the period any number was deactivated, and such amounts may be material. In addition, we may need an operating license in some states. Failure to obtain or retain such supplier numbers, licenses or permits would negatively impact our business.
We are also subject to laws relating to matters such as safe working conditions, manufacturing practices, environmental protection, fire hazard control and disposal of hazardous or potentially hazardous substances. In addition, many areas of our business, including but not limited to our diabetes supply and patient self-testing services, are subject to unique licensing or permit requirements by state and local health agencies. In addition, these and other areas of our business are subject to privacy regulations, such as the Health Insurance Portability and Accountability Act, or HIPAA, and the Health Information Technology for Economic and Clinical Health Act, or HITECH. We are also required to obtain certification to participate in certain governmental payment programs, such as various state or federal Medicare/Medicaid programs. Some states have established Certificate of Need/Determination of Need, or CON/DON, programs regulating the expansion of healthcare operations. The failure to obtain, renew or maintain any of the required licenses, certifications or CON/DONs or to comply with regulations related to privacy, safe working conditions, manufacturing practices, environmental protection, fire hazard control and disposal of hazardous or potentially hazardous substances could adversely affect our business.
We may incur significant costs to comply with these laws and regulations. If we fail to comply with applicable regulatory requirements, we may be subject to fines, suspension or withdrawal of regulatory approvals, product recalls, seizure of products or injunctions against our distribution of products, termination of our service agreements by our customers, disgorgement of money, operating restrictions and criminal prosecution. Changes in applicable laws, changes in the interpretation or application of such laws, or any failure to comply with existing or future laws, regulations or standards could have a material adverse effect on our results of operations, financial condition, business and prospects. Moreover, new laws may be enacted, or regulatory agencies may impose new or enhanced standards, that would increase our costs, as well as expose us to risks associated with non-compliance.
We are subject to healthcare fraud and abuse regulations that could result in significant liability, require us to change our business practices and restrict our operations in the future.
We are subject to laws regulating fraud and abuse in the healthcare industry, including anti-kickback and false claims laws. The federal Anti-Kickback Statute prohibits persons from knowingly and willfully soliciting, offering, receiving or providing remuneration, directly or indirectly, in exchange for or to induce either the referral of an individual, or the furnishing or arranging for a good or service, for which payment may be made under a federal healthcare program, such as Medicare or Medicaid. Many states have also adopted laws similar to the Anti-Kickback Statute. Some of these state prohibitions apply to the referral of patients for healthcare items or services reimbursed by any payer, not only the Medicare, Medicaid and Veterans Administration programs. These laws constrain the
29
Table of Contents
sales, marketing and other promotional activities of manufacturers of medical devices by limiting the kinds of financial arrangements, including sales programs, with hospitals, physicians, laboratories and other potential purchasers of medical devices and related services.
Other laws, including the federal False Claims Act, generally prohibit individuals or entities from knowingly presenting, or causing to be presented, claims for payment from Medicare, Medicaid, or other third-party payers that are false or fraudulent, or are for items or services that were not provided as claimed. Many states have also adopted laws similar to the False Claims Act. These laws may also be triggered by failure to return identified overpayments to a payer. Anti-kickback and false claims laws prescribe civil and/or criminal penalties for noncompliance that can be substantial including, in some instances, fines, disgorgement of overpayments (which amounts may be material), imprisonment and, within the United States, exclusion from participation in government healthcare programs.
On December 5, 2014, CMS issued a final rule titled “Requirements for Medicare Incentive Reward Program and Provider Enrollment.” This rule implemented several provider enrollment requirements, including a significant regulatory provision that will permit CMS to revoke Medicare billing privileges for a provider or supplier that has a pattern or practice of submitting claims that fail to meet Medicare requirements. The provisions of the rule became effective on February 3, 2015. In determining whether a provider or suppler is subject to revocation of its billing privileges pursuant to this rule, CMS will consider the following criteria:
| • | the percentage of submitted claims that were denied; |
| • | the reason(s) for the claim denials; |
| • | whether the provider or supplier has any history of final adverse actions and the nature of any such actions; |
| • | the length of time over which the pattern continued; |
| • | how long the provider or supplier has been enrolled in Medicare; and |
| • | any other information regarding the provider or supplier’s specific circumstances that CMS deems relevant. |
Since we are reimbursed directly by federal healthcare programs for certain goods and services and, given that many of our customers rely on reimbursement from Medicare, Medicaid and other governmental programs to cover a substantial portion of their expenditures, our exclusion from such programs could have a material adverse effect on our business, results of operations, financial condition and cash flows. The interpretation and enforcement of these laws and regulations are uncertain and subject to rapid change.
Billing and payment for healthcare services are highly regulated, and the failure to comply with applicable laws and regulations can result in civil or criminal sanctions, including exclusion from federal and state healthcare programs.
A portion of our healthcare products and services are paid for by private and governmental third-party payers, such as Medicare and Medicaid. These third-party payers typically have different and complex billing and documentation requirements that we must satisfy in order to receive payment, and they carefully audit and monitor our compliance with these requirements. Governmental payers and their agents, including Medicare Administrative Contractors, Zone Program Integrity Contractors, and others, as well as the Department of Health and Human Services, the OIG, CMS and state Medicaid programs, conduct audits in the ordinary course of our operations. These audits focus on compliance with coverage and reimbursement rules and guidelines under Medicare and Medicaid. These types of audits often lead to determinations that certain claims should not have been paid by Medicare and/or Medicaid, and the programs seek to recoup or offset amounts they assert have been paid in error. We regularly receive notices of such determinations of overpayment, which vary widely in amount. These
30
Table of Contents
determinations are subject to administrative appeal rights, which we routinely pursue. For example, Alere Toxicology Services, one of our subsidiaries successfully defended approximately 95% of a ZPICs recoupment request, and the remaining recoupment at issue continues to be appealed. The timeframe for these appeals can be long and the results are often unpredictable. Depending on the nature of the audit, overpayment determinations can be substantial. While we have had successful appeals, we have also, from time to time, been required to make repayments to both private and governmental third-party payers and, while these amounts have not been material, we may become obligated to make significant payments in the future.
We must also comply with numerous other laws applicable to billing and payment for healthcare services, including privacy laws. Failure to comply with these requirements may result in non-payment, refunds, exclusion from government healthcare programs, and civil or criminal liabilities, any of which may have a material adverse effect on our revenues, earnings and cash flows. In addition, failure by third-party payers to properly process our payment claims in a timely manner could delay our receipt of payment for our products and services, which may have a material adverse effect on our cash flows.
Due to changes in the reimbursement policies and practices for pain management, our toxicology business has been adversely impacted and may continue to be negatively impacted in the future.
The pain management portion of our toxicology operations has, in the past few years, experienced a significant decrease in revenues. This decrease was the result, in part, of significant changes to reimbursement policies of third-party payors and the increasingly stringent application of standards related to the medical necessity of drug testing, which has resulted in lower pricing and test volume. We expect that these trends will continue in the future and that the pain management portion of our toxicology business will account for a smaller portion of revenue than it has in the past. In addition, since the margins on our pain management business are generally favorable compared with other portions of our business, these changes have had, and may continue to have, a disproportionately negative impact on our gross margins.
Increasing health insurance premiums and co-payments or high-deductible health plans may cause individuals to forgo health insurance and avoid medical attention, either of which may reduce demand for our products and services.
Health insurance premiums, co-payments and deductibles have generally increased in recent years. These increases may cause individuals to forgo health insurance, as well as medical attention. This behavior may reduce demand for our point-of-care diagnostic products.
Securities class action lawsuits have recently been filed against us and the outcome of these matters may adversely affect our business.
In April and May 2016, two class action lawsuits were filed against us and certain current and former officers in the U.S. District Court for the District of Massachusetts, asserting claims for violations of Section 10(b) and Section 20(a) of the Securities Exchange Act of 1934, on behalf of a proposed class of all persons who purchased or otherwise acquired our common stock during the period May 9, 2013 through April 20, 2016. Both complaints seek damages allegedly attributable to allegedly materially misleading statements and/or omissions regarding our business, financial statements and operations. On July 11, 2016, the court entered an order consolidating the two actions and appointing lead plaintiffs and lead counsel, and on July 19, 2016, the court ordered a schedule for the filing of a consolidated amended complaint and for the motion to dismiss briefing. We and our current and former officers and directors may, in the future, be subject to additional litigation relating to such matters. Subject to certain limitations, we are obligated to indemnify our current and former officers and directors in connection with such lawsuits and any related litigation or settlement amounts. Regardless of the outcome, these lawsuits, and any other litigation that may be brought against us could be time-consuming, result in significant expense and divert the attention and resources of our management.
31
Table of Contents
The claims asserted span a multi-year period and the plaintiffs’ alleged damages are not quantified. We are unable to estimate the reasonably possible loss or range of loss (if any) in this matter, at least until developments in the case have yielded additional information sufficient to support a quantitative assessment of the range of reasonably possible loss. Depending on a range of factors, it may be months or years (if ever) before an estimate of the range of reasonably possible loss can be made. The plaintiffs have not yet filed a consolidated amended complaint in this action and we have not yet answered the complaint or asserted any defenses, nor have we engaged in any discussions or negotiations with any plaintiffs.
Our ability to protect our information systems and electronic transmissions of sensitive data from data corruption, cyber-based attacks, security breaches or privacy violations is critical to the success of our business.
We are highly dependent on information technology networks and systems, including the Internet, to securely process, transmit and store electronic information, including personal information of our customers and our product end-users. A security breach of this infrastructure, including physical or electronic break-ins, computer viruses, malware attacks by hackers and similar breaches, may cause all or portions of our networks and systems to be unavailable, create system disruptions or shutdowns, and lead to erasure of critical data and software or unauthorized disclosure of confidential information. We invest in security technology to protect our data against risks of data security breaches and cyber-attacks and we have implemented solutions, processes, and procedures to help mitigate these risks at various locations, such as encryption, virus protection, security firewalls and information security and privacy policies. Nonetheless, our information technology and infrastructure are subject to attacks by hackers and may be breached due to inadequacy, employee error, malfeasance or other disruptions. The age of our information technology systems, as well as the level of our protection and business continuity or disaster recovery capability, varies from site to site, and there can be no guarantee that any such measures, to the extent they are in place, will be effective. In addition, a security breach or privacy violation that leads to disclosure of consumer information (including personally identifiable information or protected health information) could harm our reputation, compel us to comply with disparate state breach notification laws and otherwise subject us to liability under laws that protect personal data, resulting in increased costs or loss of revenue. For example, we were a defendant in a class action lawsuit, which was ultimately settled, in connection with the theft in 2012 of a laptop that contained personally identifiable information of approximately 116,000 patients. If we are unable to prevent security breaches or privacy violations or implement satisfactory remedial measures, our operations could be disrupted, we may be subject to additional legal claims or proceedings, or we may suffer loss of reputation, financial loss and other regulatory penalties, which could have a material adverse impact on our business, financial condition and results of operations. While we currently expend resources to protect against cyber-attacks and security breaches, hackers and other cyber criminals are using increasingly sophisticated and constantly evolving techniques, and we may need to expend substantial additional resources to continue to protect against potential security breaches or to address problems caused by such attacks or any breach of our safeguards. In addition, a data security breach could distract management or other key personnel from performing their primary operational duties.
In addition, the interpretation and application of consumer and data protection laws in the United States, Europe and elsewhere are often uncertain, contradictory and in flux. For example, in October 2015, the European Court of Justice invalidated a safe harbor on which we and other companies relied in order to transfer to the United States certain personal information subject to protections under European Union law. In February 2016, the European Commission and the United States reached a political agreement on the EU-US Privacy Shield, a new framework for data flows between the two jurisdictions. The EU-US Privacy Shield, if implemented, will impose more significant obligations on U.S. companies, including us, to protect the personal information of European citizens and also will require stronger monitoring and enforcement of personal privacy by the U.S. Department of Commerce and FTC. We also expect the European Union to adopt a Data Protection Regulation, which will
32
Table of Contents
replace the existing European Union Data Protection Directive. It is possible that these laws may be interpreted and applied in a manner that is inconsistent with our data practices or that our practices prior to implementation of the EU-US Privacy Shield will be found to be non-compliant with these laws. If so, this could result in government-imposed fines or orders requiring that we change our data practices, which could have a material adverse effect on our business. Complying with these various laws could cause us to incur substantial costs or require us to change our business practices in a manner adverse to our business.
Our growth is subject to global economic and political conditions, and operational disruptions at our facilities.
Our business is affected by global economic conditions and the state of the financial markets. There can be no assurance that global economic conditions and financial markets will not worsen or that we will not experience any adverse effects that may be material to our consolidated cash flows, results of operations, financial positions or our ability to access capital, such as the adverse effects that may result from a prolonged shutdown in government operations in the United States or elsewhere. Our business is also affected by local economic conditions in the countries in which we operate, including inflation, recession, financial liquidity and currency volatility or devaluation. Political changes, such as the impact of Brexit, some of which may be disruptive, could interfere with our supply chain, our customers and our activities in a particular location.
Poor economic conditions may negatively impact our toxicology business.
The high rates of unemployment in certain areas where we do business negatively impact the demand for pre-employment drug testing. Additionally, reduced government funding for drug screening programs negatively impacts the market for our toxicology tests. Finally, some of our domestic laboratory testing services are reimbursed by Medicare and private payers and are subject to continued downward price pressure. If any, or all, of these trends continue or accelerate, they may have a material adverse impact on the results of our toxicology business operations.
If we deliver products with alleged defects, we may be subject to product recalls or negative publicity, our credibility may be harmed, market acceptance of our products may decrease and we may be exposed to liability.
The manufacturing and marketing of professional and consumer diagnostics involve an inherent risk of product liability claims. For example, an alleged defect in one of our diagnostic products could lead to a false positive or false negative result, affecting the eventual diagnosis or treatment. Our product development and production are extremely complex and could expose our products to claims of defectiveness. Alleged manufacturing and design defects could lead to recalls (either voluntary or required by the FDA or other government authorities), could result in the removal of a product from the market and may require the payment of significant amounts in damages in connection with lawsuits. For example, in July 2016 we announced that we will be initiating a voluntary withdrawal of the Alere INRatio and INRatio2 PT/INR Monitoring Systems. This planned withdrawal may lead to additional product liability claims or other claims relating to those products. For additional information on this matter, please see “Item 1. Business – Government Regulation” elsewhere in this Annual Report on Form 10-K. Alleged defects in our products could also harm our reputation, lead to negative publicity and decrease sales of our products.
In addition, our marketing of monitoring services may cause us to be subjected to various product liability or other claims, including, among others, claims that inaccurate monitoring results lead to injury or death, or, in the case of our toxicology monitoring services, the imposition of criminal sanctions. For example, we have been subject to several individual lawsuits alleging that our INRatio products resulted in personal injury to certain users and class action lawsuits have been filed against us in the United States District Court for the Southern District of California and the United States District Court
33
Table of Contents
for the District of Massachusetts alleging, among other things, fraud, breach of warranty, unjust enrichment and violation of unfair competition/business practice statutes in connection with the manufacturing, marketing and sale of our INRatio products. For additional information on legal proceedings in connection with the INRatio and INRatio2 PT/INR Monitoring Systems, see Item 3. “Legal Proceedings” elsewhere in this Annual Report on Form 10-K. Any product liability or other claim brought against us, regardless of merit, could be costly to defend and could result in an increase to our insurance premiums. If we are held liable for a claim, that claim could materially damage our business and financial condition. In addition, any publicity relating to the product defects or failures could negatively impact our reputation, result in decreased demand for our products and negatively impact our results of operations.
We may experience manufacturing problems or delays due to, among other reasons, our volume and specialized processes, which could result in decreased revenue or increased costs.
The global supply of our products depends on the uninterrupted efficient operation of our manufacturing facilities. Many of our manufacturing processes are complex and involve sensitive scientific processes, including unique and often proprietary antibodies which cannot be replicated or acquired through alternative sources without undue delay or expense. Other processes present difficult technical challenges to obtain the manufacturing yields necessary to operate profitably. In addition, our manufacturing processes may require complex and specialized equipment which can be expensive to repair or replace with required lead times of up to a year.
The manufacturing of certain of our products is concentrated in one or more of our plants, with limited alternate facilities. Any event that negatively impacts our manufacturing facilities, our manufacturing systems or equipment, or our contract manufacturers or suppliers, such as a natural disaster or other event, could delay or suspend shipments of products or the release of new products or could result in the delivery of inferior products. Our revenues from the affected products would decline and we could incur losses until such time as we or our contract manufacturers are able to restore our or their production processes or we are able to put in place alternative contract manufacturers or suppliers.
We rely on suppliers for raw materials and other products and services, and fluctuations in the availability and price of such products and services may adversely affect our business or results of operations.
We rely on numerous third parties to supply raw materials and other components for our manufacturing processes. In some cases, these raw materials and components are available only from a sole supplier. We also rely on a number of significant third-party manufacturers to produce some of our professional diagnostics products. Stringent requirements of the FDA and other regulatory authorities regarding the manufacture of our products may prevent us from quickly establishing additional or replacement sources for the raw materials, components or manufacturing services that we use or from doing so without excessive cost. As a result, a reduction or interruption in supply or an inability to secure alternative sources of raw materials, components or manufacturing services could have a material adverse effect on our business, result of operations, financial condition and cash flows.
Compliance with the SEC’s conflict minerals rules will continue to increase our costs and adversely affect our results of operations.
We are subject to the SEC’s disclosure requirements for public companies that manufacture, or contract to manufacture, products for which certain minerals and their derivatives, namely tin, tantalum, tungsten and gold, known as “conflict minerals,” are necessary to the functionality or production of those products. These regulations require us to determine which of our products contain conflict minerals and, if so, to perform an extensive inquiry into our supply chain in an effort to determine whether or not such conflict minerals originate from the Democratic Republic of Congo, or DRC, or an
34
Table of Contents
adjoining country. We have incurred and expect to incur further additional costs to comply with these disclosure requirements, including costs related to determining the source of any of the relevant minerals used in our products. Because our supply chain is complex, the country of origin inquiry and due diligence procedures that we have implemented have not enabled and may not enable us to ascertain the origins of all of conflict minerals that we use or determine that these minerals did not originate from the DRC or an adjoining country, which may harm our reputation. We may also face difficulties in satisfying customers who may require that our products be certified as DRC conflict-free, which could harm our relationships with these customers and lead to a loss of revenue. These requirements could also have the effect of limiting the pool of suppliers from which we source these minerals, and we may be unable to obtain conflict-free minerals at competitive prices, which could increase our costs and adversely affect our manufacturing operations and our profitability.
We could suffer monetary damages, incur substantial costs or be prevented from using technologies important to our products as a result of pending legal proceedings.
We are involved in various legal proceedings arising out of our business. Because of the nature of our business, we may be subject at any particular time to commercial disputes, product liability and personal injury claims, negligence claims or various other lawsuits arising in the ordinary course of our business, including infringement and other licensing and intellectual property claims, distributor disputes, privacy claims, employment matters or investor matters. The lawsuits we face generally seek damages, sometimes in substantial amounts, for commercial or personal injuries allegedly suffered and can include claims for punitive or other special damages. An adverse ruling or rulings in one or more such lawsuits could, individually or in the aggregate, substantially harm our sales, results of operations and financial performance.
The rights we rely upon to protect the intellectual property underlying our products may not be adequate to prevent third parties from using our technology, which would reduce a competitive advantage provided by our proprietary technology.
Our success depends in part on our ability to develop or acquire commercially valuable intellectual property rights and to enforce those rights. The degree of present and future protection for our intellectual property is uncertain and may change. The risks and uncertainties that we face with respect to our patents and other proprietary rights include the following:
| • | pending patent applications we have filed, or to which we have exclusive rights, may not result in issued patents or may take longer than we expect to result in issued patents; |
| • | patents licensed or issued to us or our customers may not provide a competitive advantage; |
| • | other parties may challenge patents or patent applications licensed or issued to us or our customers; |
| • | other companies may design around technologies we have patented, licensed or developed; and |
| • | all patents have a limited life, meaning at some point valuable patents will expire and we will lose the competitive advantage they provide. For example, certain patents related to our lateral flow technology expired in 2015. |
In addition to patents, we rely on a combination of trade secrets, non-disclosure agreements and other contractual provisions and technical measures to protect our intellectual property rights. Nevertheless, these measures may not be adequate to safeguard the technology underlying our products. If these measures do not protect our rights, third parties could access our technology and our competitive advantage in the market would be reduced or eliminated. In addition, employees, consultants and others who participate in the development of our products may breach their agreements with us regarding our intellectual property, and we may not have adequate remedies for
35
Table of Contents
the breach. We also may not be able to effectively protect our intellectual property rights in some foreign countries. For a variety of reasons, we may decide not to file for patent, copyright or trademark protection or prosecute potential infringements of our patents. Technology that we deem not to provide a commercial advantage when developed, and for which we elect not to file for patent or other formal protection, may become important to us in the future, at which time we may not be able to secure the same level of protection. Our trade secrets may also become known through other means not currently foreseen by us. Despite our efforts to protect our intellectual property, our competitors or customers may independently develop similar or alternative technologies or products that are equal or superior to our technology and products without infringing any of our intellectual property rights, or design around our proprietary technologies.
Claims by others that our products infringe their proprietary rights could adversely affect our ability to sell our products and services and could increase our costs.
Substantial litigation over intellectual property rights exists in the professional and consumer diagnostics industries. Third-party infringement claims against us could increase as the number and functionality of our products grow and as we enter new and different industries and markets. Third parties may have or obtain patents which our products and services or technology may actually or allegedly infringe. Any of these third parties might assert infringement claims against us. Any litigation could result in the expenditure of significant financial resources and the diversion of management’s time and resources. In addition, litigation in which we are accused of infringement may result in negative publicity, have an impact on current and prospective customers, cause product delays, or require us to develop alternative technologies, make substantial payments to third parties or enter into royalty or license agreements, which may not be available on acceptable terms, or at all. Competitors may also have access to the licensed technology. If a successful claim of infringement were made against us and we could not develop non-infringing technology or license rights to the infringed or similar technology on a timely and cost-effective basis, we may be forced to stop selling current products or abandon new products under development and we could be exposed to legal actions by our customers.
We may need to initiate lawsuits to protect or enforce our patents and other intellectual property rights, which could be expensive and, if we lose, could cause us to lose some of our intellectual property rights, which would reduce our ability to compete.
In order to protect or enforce our patent and other intellectual property rights, we may initiate litigation or other proceedings against, or enter into negotiations or settlement discussions with, third parties. Litigation may be necessary to:
| • | assert claims of infringement; |
| • | enforce licensing terms and conditions; |
| • | protect our trade secrets or know-how; or |
| • | determine the enforceability, scope and validity of the proprietary rights of ourselves or others. |
From time to time in the past we have initiated lawsuits and other claims against competitors whom we believed to have infringed our proprietary rights. Any lawsuits or claims that we initiate or assert could be expensive, take significant time and divert management’s attention from other business concerns. Litigation can also put our patents at risk of being invalidated or interpreted narrowly and our patent applications at risk of not issuing. Additionally, any lawsuit or claim may provoke third parties to assert claims against us.
Intellectual property law relating to the fields in which we operate is still evolving and, consequently, patent and other intellectual property positions in our industry are subject to change and often uncertain. We may not prevail in any lawsuit or other effort to protect our technology, and the damages or other remedies awarded, if any, may not be commercially valuable. During the course of
36
Table of Contents
any lawsuit, there may be public announcements of the results of hearings, motions and other interim proceedings or developments in the litigation. If securities analysts or investors perceive any of these results to be negative, the trading prices of our securities may decline.
Our business could be adversely affected as a result of the risks associated with acquisitions and divestitures.
Since our inception, we acquired numerous businesses. Our business strategy no longer focuses primarily on acquisitions, but we may acquire other businesses from time to time in the future. The ultimate success of our acquisitions depends, in part, on our ability to realize the anticipated synergies, cost savings and growth opportunities from integrating acquired businesses or assets into our existing businesses. However, the acquisition and successful integration of independent businesses or assets is a complex, costly and time-consuming process, and the benefits we realize may not exceed the costs of the acquisition. We have also disposed of certain businesses that we had previously acquired, including our health management business, our BBI business and Alere Accountable Care Solutions, LLC, or ACS. The risk and difficulties associated with acquiring and integrating companies and other assets include, among others:
| • | the impact of the acquisition on our financial and strategic position and reputation, including the potential discovery of undisclosed or unanticipated liabilities or obligations; |
| • | consolidating manufacturing, research and development operations and quality systems, where appropriate; |
| • | integrating newly-acquired businesses or product lines into our financial reporting system; |
| • | coordinating sales, distribution and marketing functions and strategies; |
| • | establishing or expanding manufacturing, sales, distribution and marketing functions in order to accommodate newly-acquired businesses or product lines or rationalizing these functions to take advantage of synergies; |
| • | preserving the important licensing, research and development, manufacturing and supply, distribution, marketing, customer and other relationships of acquired businesses; |
| • | minimizing the diversion of management’s attention from ongoing business concerns; |
| • | the potential loss of key employees of the acquired business; |
| • | potential restructuring or other charges associated with the integration of operations; |
| • | coordinating geographically separate operations; and |
| • | regulatory and legal issues relating to the integration of legacy and newly-acquired businesses. |
These factors could have an adverse effect on our business, results of operations or financial condition, and managing multiple acquisitions, investments or divestitures at the same time could exacerbate these risks. To the extent that we issue equity securities in connection with any acquisition or investment, existing shareholders may experience dilution. Our acquisitions have often provided for future contingent payments, or earn-outs, based on the achievement of performance targets or milestones, some of which are still outstanding. These arrangements can impact or restrict integration of acquired businesses and can result in disputes, including litigation. Additionally, regardless of the form of consideration we pay, acquisitions and investments could negatively impact our net income and earnings per share.
Similarly, in 2015, we divested ourselves of certain non-core assets, including the sales of our health management business and the BBI business. We intend to continue to divest certain non-core assets, but if we are unable to do so, our operations will continue to include those businesses, which may negatively impact our business and our results of operations.
37
Table of Contents
If goodwill or other intangible assets that we have recorded in connection with our acquisitions of other businesses become impaired, we could have to take significant charges against earnings.
As a result of our acquisitions, we have recorded, and may continue to record, a significant amount of goodwill and other intangible assets. Under current accounting guidelines, we must assess, at least annually and potentially more frequently, whether the value of goodwill and other intangible assets has been impaired. In 2015, we recorded impairment charges of $27.8 million related to certain intangible assets. Any further reduction or impairment of the value of goodwill or other intangible assets will result in additional charges against earnings, which could materially reduce our reported results of operations in future periods.
Our business could be adversely affected as a result of the risks associated with divestitures.
Since our inception, we have, from time to time, disposed of various assets or business units, including our BBI business in November 2015, our health management business in January 2015 and ACS in October 2014, and we may continue to pursue potential dispositions of other non-core assets. We may encounter difficulty in finding buyers or exit opportunities on advantageous terms and in a timely manner. If we are unable to dispose of any such assets, we may shut down the related operations, which could lead to additional expenses, accounting charges, write-offs and payments to resolve outstanding contractual obligations and other claims. Further, any disposition we do undertake may be subject to pre-closing conditions and approvals, which, if not satisfied or obtained, may prevent us from completing the transaction. Any consummated disposition may also have an adverse effect on our operations or financial results that is more significant than we expect.
Divestitures may also involve continued financial obligations with respect to the divested assets or business, including through continuing equity ownership, guarantees, indemnities or other financial obligations, any of which may be material. In some circumstances, some of our indemnification obligations in connection with divestitures may be unlimited in duration or amount. In addition, dispositions that provide for future contingent payments, or earn-outs, based on the achievement of performance targets or milestones can result in disputes, including litigation, and may not generate proceeds we expect to receive. The purchasers of our assets may also require that we agree not to compete with them in defined geographies or fields, which may limit our ability to conduct operations in the future, even if those operations would produce favorable results for our business.
We may be required under the agreements governing our indebtedness to obtain the consent of our lenders to certain dispositions or to apply all or a portion of the proceeds from a disposition to the repayment of our outstanding indebtedness. If we make any future dispositions or enter into any alternative transactions, such as strategic alliances, joint ventures or other business combinations, we may be unable to structure them in a way that will enhance our creditworthiness, meet our strategic alternatives or otherwise be successful.
We do not have complete control over the operations of SPD, our 50/50 joint venture with P&G and our financial results may be negatively impacted by litigation to which SPD is party.
Because SPD is a 50/50 joint venture, we do not have complete control over its operations, including business decisions, which may impact SPD’s profitability. As a joint venture, SPD involves special risks, as SPD or P&G may, at any time, have economic, business or legal interests or goals that are inconsistent with our interests and may take actions that are detrimental to us.
Additionally, certain subsidiaries of P&G have the right, at any time upon certain material breaches by us or our subsidiaries of our obligations under the joint venture documents, to acquire all of our interest in SPD at fair market value less any applicable damages.
38
Table of Contents
As previously disclosed, SPD is currently involved in civil litigation brought by a competitor in the United States with respect to the advertising of one of SPD’s products in the United States. During 2015, SPD appealed the district court’s injunction with respect to sales and advertising of such product, which was based on a finding that SPD violated certain laws with respect to the advertising of such product. The appellate court has issued a stay of the injunction, pending the outcome of the appeal. A ruling on the appeal is expected in the near future. In addition, a class action lawsuit has been initiated against SPD in United States District Court for the Central District of California alleging violations of certain laws in connection with the sales and advertising of one of SPD’s products, which claims are based on similar grounds as those at issue in the litigation described above in this paragraph. SPD has moved to dismiss the class action lawsuit on the ground, among others, that the claims pleaded are preempted by federal law. A decision on the motion is expected shortly. In addition, there may be additional lawsuits against SPD or us relating to this matter in the future. The ultimate resolution of these matters is not known at this time, nor is the potential impact they may have on SPD or us, including whether any such resolution or any damages imposed by either court would have a material adverse impact on SPD and, ultimately, by virtue of our 50% interest in SPD, on our financial position or results of operations. The distributions we receive from SPD may decline in the future as a result of the outcomes of these matters, and we may be required to take reserves for potential liabilities arising from these actions (even if we are not a named party to lawsuits).
Our business has substantial indebtedness.
We currently have, and will likely continue to have, a substantial amount of indebtedness. Our indebtedness could, among other things, make it more difficult for us to satisfy our debt obligations, require us to use a large portion of our cash flow from operations to repay and service our debt or otherwise create liquidity problems, limit our flexibility to adjust to market conditions, place us at a competitive disadvantage and expose us to interest rate fluctuations. As of June 30, 2016, we had total debt outstanding of $3.0 billion, which included $1.5 billion in aggregate principal amount of indebtedness outstanding under our secured credit facility, consisting of “A” term loans in the aggregate principal amount of $572.9 million and “B” term loans in the aggregate principal amount of $966.5 million (in addition, we have drawn $125 million under the revolving credit facility). Our secured credit facility has various final maturity dates occurring in 2020 and 2022. As of June 30, 2016, we also had $1.3 billion in aggregate principal amount of indebtedness outstanding under our 7.25% senior notes, which mature in 2018, our 6.5% senior subordinated notes, which mature in 2020, and our 6.375% senior subordinated notes, which mature in 2023. If we are required to use our cash to satisfy any of our indebtedness, our liquidity will be negatively impacted, which could limit our ability to otherwise invest in our business through acquisitions, capital expenditures or research and development investments and negatively impact our business in the future.
We expect to obtain the money to pay our expenses and pay the principal and interest on our indebtedness from cash flow from our operations, dispositions of non-core assets, and potentially from debt or equity offerings. Accordingly, our ability to meet our obligations depends on our future performance and capital-raising activities, which will be affected by financial, business, economic and other factors, many of which are beyond our control. If our cash flow and capital resources prove inadequate to allow us to pay the principal and interest on our debt and meet our other obligations, we could face substantial liquidity problems and might be required to dispose of material assets or operations, restructure or refinance our debt, which we may be unable to do on acceptable terms, and forego attractive business opportunities. In addition, the terms of our Merger Agreement with Abbott Laboratories and existing or future debt agreements may restrict us from pursuing any of these alternatives without first obtaining consents, which we may not be able to obtain on acceptable terms, or at all.
39
Table of Contents
The agreements governing our indebtedness subject us to various restrictions that may limit our ability to pursue business opportunities.
The agreements governing our indebtedness subject us to various restrictions on our ability to engage in certain activities, including, among other things, our ability to:
| • | acquire other businesses or make investments; |
| • | raise additional capital; |
| • | incur additional debt or create liens on our assets; |
| • | pay dividends or make distributions on our stock; |
| • | repurchase or redeem our stock or senior or subordinated debt; |
| • | prepay indebtedness; |
| • | dispose of assets; and |
| • | consolidate, merge or sell all or substantially all of our assets. |
These restrictions may limit or restrict our cash flow and our ability to pursue business opportunities or strategies that we would otherwise consider to be in our best interests.
Our secured credit facility and the indentures governing our outstanding notes contain certain restrictive covenants that we may not satisfy, and that, if not satisfied, could result in the acceleration of the amounts due under our secured credit facility and such indentures and the limitation of our ability to borrow additional funds in the future.
The agreements governing our secured credit facility subject us to various financial and other restrictive covenants with which we must comply on an ongoing or periodic basis. The primary financial covenant under the secured credit facility is a maximum consolidated secured net leverage ratio. In addition, the indentures governing our 6.5% senior subordinated notes, our 6.375% senior subordinated notes and our 7.25% senior notes also contain restrictive covenants with which we must comply on an ongoing or periodic basis. If we violate any of these covenants, we may suffer a material adverse effect. Most notably, our outstanding debt under our secured credit facility or our notes could become immediately due and payable, our lenders thereunder could proceed against any collateral securing such indebtedness (in the case of our secured credit facility), and our ability to borrow additional funds in the future could be limited or terminated. Alternatively, we could be forced to refinance or renegotiate the terms and conditions of our secured credit facility, including the interest rates, financial and restrictive covenants and security requirements of the secured credit facility, on terms that may be significantly less favorable to us.
We were delayed in filing this Annual Report on Form 10-K and our First Quarter 2016 Form 10-Q in connection with the review of certain aspects of the timing of revenue recognition. In order to avoid events of default under our Credit Agreement and the indentures governing our 7.25% senior notes, our 6.5% senior subordinated notes and our 6.375% senior subordinated notes, we entered into an amendment to our Credit Agreement and obtained consents from the holders of such notes to permit an extension for filing of this Annual Report on Form 10-K and our First Quarter 2016 Form 10-Q. We have not secured an extension of the deadline for filing of our First Quarter 2016 Form 10-Q beyond, in the case of the Credit Agreement, August 18, 2016, or, in the case of the indentures governing our notes, August 31, 2016, and we could be required to seek another amendment or consents to such an extension, and we will likely be required to pay significant amounts in connection with such amendment or consents. If we were unable to timely file future annual reports or quarterly reports on time due to similar or other reasons and are unable to obtain an amendment or consent, we could be in default under these credit obligations, which could result in the acceleration of all amounts owing under our secured credit facility and our notes.
40
Table of Contents
A default under any of the agreements governing our indebtedness could result in a default and acceleration of indebtedness under other agreements.
The agreements governing our indebtedness contain cross-default provisions whereby a default under one agreement could result in a default and acceleration of our repayment obligations under other agreements. If a cross-default were to occur, we may not be able to pay our debts or borrow sufficient funds to refinance them. Even if new financing were available, it may not be available on acceptable terms. If some or all of our indebtedness is in default for any reason, our business, financial condition and results of operations could be materially and adversely affected and we may not have sufficient cash resources to pay all of such indebtedness when it becomes due as a result of a default.
We may not be able to satisfy our debt obligations upon a change of control, which could limit our opportunity to enter into a change of control transaction.
If we undergo a change of control, as provided in our secured credit facility, our 7.25% senior notes, our 6.5% senior subordinated notes or our 6.375% senior subordinated notes, we may be required to repay or repurchase some or all of such indebtedness. We may not have sufficient financial resources to satisfy all of our repayment and repurchase obligations. Our failure to satisfy our repayment and repurchase obligations would constitute a default under the relevant indentures and under our secured credit facility and could have material adverse consequences for us and our stakeholders.
Our operating results may fluctuate for various reasons and, as a result, period-to-period comparisons of our results of operations will not necessarily be meaningful.
Many factors relating to our business, such as those described elsewhere in this section, make our future operating results uncertain and may cause them to fluctuate from period to period. Because our revenue and operating results are difficult to predict, we believe that period-to-period comparisons of our results of operations are not a good indicator of our future performance. If revenue declines in a quarter, our results of operations will be harmed because many of our expenses are relatively fixed. In particular, research and development, sales and marketing and general and administrative expenses are not significantly affected by variations in revenue. If our quarterly operating results fail to meet or exceed the expectations of securities analysts or investors, or fail to meet the guidance that we have previously provided to our investors, our stock price could drop suddenly and significantly.
Our effective tax rate may fluctuate, and we may incur obligations in tax jurisdictions in excess of amounts that have been accrued.
We are subject to income taxes in both the United States and various foreign jurisdictions, and we may take certain income tax positions on our tax returns that tax authorities may disagree with. We provide reserves for potential payments of tax to various tax authorities related to uncertain tax positions. However, the calculation of our tax liabilities involves the application of complex tax regulations to our global operations in many jurisdictions. Therefore, a dispute with a tax authority may result in a payment that is materially different from our current estimate of the tax liabilities associated with our returns.
Changes in tax laws or tax rulings could materially impact our effective tax rate. There are several proposals to reform U.S. tax rules being considered by U.S. law makers, including proposals that may reduce or eliminate the deferral of U.S. income tax on our unrepatriated earnings, potentially requiring those earnings to be taxed at the U.S. federal income tax rate, reduce or eliminate our ability to claim foreign tax credits, and eliminate various tax deductions until foreign earnings are repatriated to the U.S. In addition, as part of its base erosion and profit shifting initiative, the Organization for Economic Co-operation and Development, or OECD, has begun to implement this initiative resulting in changes to the tax codes of its member states (and there may be additional changes in the future) that are
41
Table of Contents
designed to address perceived tax avoidance by multinational organizations. Our future reported financial results may be adversely affected by tax rule changes which restrict or eliminate our ability to claim foreign tax credits or deduct expenses attributable to foreign earnings, or otherwise affect the treatment of our unrepatriated earnings.
The election of a new president and the change in the administration in 2017 may result in significant changes to the regulation of healthcare and medical device industries and our business may be adversely impacted.
A new presidential administration will take office in January 2017. Along with the change of administration, there are likely to be changes in the administration of federal regulatory agencies. Healthcare costs and regulations are likely to be an area of focus for any future administration. Any proposed changes in regulations, including regulations related to the cost of healthcare, use of medical devices, Medicare and Medicaid billing practices and the taxation of medical devices could have a material and adverse impact on our business. In addition, changes in philosophy and personnel at the U.S. Food and Drug Administration may make it more difficult to introduce new products and continue the use of existing products and/or it may increase the costs and requirements of getting approvals for new products or modifying existing products. Such regulatory changes, or legislative changes, may change our operating environment in substantial and unpredictable ways. Such legislation and regulations could increase our cost of doing business, impose additional requirements on product development efforts, make government and third-party reimbursement more difficult (and reductions in the amount of reimbursement), among others, which may have an adverse impact on our business.
We may incur losses in excess of our insurance coverage.
Our insurance coverage includes, among other policies, product liability, property, healthcare professional, directors and officers’ liability and business interruption policies. Our insurance coverage contains policy limits, specifications and exclusions. We believe that our insurance coverage is consistent with general practices within our industry. Nonetheless, we may incur losses of a type for which we are not covered by insurance or which exceed the limits of liability of our insurance policies. In that event, we could experience a significant loss which could have a material negative impact on our financial condition.
Our future success depends on our ability to recruit and retain key personnel.
Our future success depends on our continued ability to attract, hire and retain highly-qualified personnel, including our executive officers and scientific, technical, sales and marketing employees, and their ability to manage our operations successfully. Experienced personnel in our industry are in high demand and competition for their talents is intense. If we are unable to attract and retain key personnel, our business may be harmed. In addition, the loss of any of our key personnel, particularly key research and development personnel, could harm our business and prospects and could impede the achievement of our research and development, operation or strategic objectives.
Future sales of our common stock, including shares issuable upon conversion of our Series B Preferred Stock, may adversely affect the market price of our common stock.
Sales of a substantial number of shares of our common stock or other equity securities in the public market could depress the price of our common stock and impair our ability to raise capital through the sale of additional equity securities. The price of our common stock could be affected by issuances of substantial numbers of shares of our common stock potentially issuable upon conversion of our Series B Preferred Stock or by hedging or arbitrage trading activity that may develop involving our common stock or other securities. If the conditions applicable to the conversion of our Series B Preferred Stock were satisfied, then subject to adjustment, each of the 1.8 million shares of Series B Preferred Stock outstanding as of December 31, 2015 could convert into 5.7703 shares of our common
42
Table of Contents
stock, or a total of 10.2 million shares of our common stock. Upon certain extraordinary transactions, depending on the market price of our common stock at that time, the conversion rate could increase such that significantly more shares of common stock could be issued.
The holders of our Series B Preferred Stock are entitled to receive liquidation payments in preference to the holders of our common stock.
As of December 31, 2015, the outstanding shares of our Series B Preferred Stock had an aggregate stated liquidation preference of $709.8 million. Dividends accrue on the shares of Series B Preferred Stock at a rate of 3% per annum, and we have the option to pay these dividends in cash or in shares of common stock or additional shares of Series B Preferred Stock. If we pay these dividends in shares of common stock or additional shares of Series B Preferred Stock, the number of shares of common stock or Series B Preferred Stock issued will be based upon market prices at the time of such payment. Upon a liquidation of our company, the holders of shares of Series B Preferred Stock will be entitled to receive a liquidation payment prior to the payment of any amount with respect to the shares of our common stock. The amount of this preferential liquidation payment is the aggregate stated liquidation preference plus any accrued and unpaid dividends. Because of the substantial liquidation preference to which the holders of the Series B Preferred Stock are entitled, the amount available to be distributed to the holders of our common stock upon a liquidation of our company could be substantially limited or reduced to zero.
The terms of the Series B Preferred Stock may limit our ability to raise additional capital through subsequent issuances of preferred stock.
For so long as any shares of Series B Preferred Stock remain outstanding, we are not permitted, without the affirmative vote or written consent of the holders of at least two-thirds of the Series B Preferred Stock then outstanding, to authorize or designate any class or series of capital stock having rights on liquidation or as to distributions (including dividends) senior to the Series B Preferred Stock. This restriction could limit our ability to plan for or react to market conditions or meet extraordinary capital needs, which could have a material adverse impact on our business.
| ITEM 1B. | UNRESOLVED STAFF COMMENTS |
None.
| ITEM 2. | PROPERTIES |
Our corporate headquarters, together with the administrative office for our United States consumer operations, is located at 51 Sawyer Road, Suite 200, Waltham, Massachusetts. From our office in Galway, Ireland, we oversee and conduct much of our professional diagnostic products business in Europe. We also operate a shared service center in Orlando, Florida, which houses certain critical back-office and sales operations supporting our U.S. professional diagnostics operations, and a call center in Taguig City, Philippines. These key administrative facilities are leased from third parties.
We own approximately 18.8 acres of land in San Diego, California which houses one of our ten primary manufacturing operations, as well as significant administrative and research and development operations for our professional diagnostics business. Our buildings on this property total approximately 330,000 square feet and include 167,000 square feet of manufacturing space for professional diagnostic products.
Our other primary manufacturing operations are in Scarborough, Maine; Hangzhou and Shanghai, China; Jena, Germany; Matsudo, Japan; Oslo, Norway; Dundee, United Kingdom; Ottawa, Canada; and Yongin, South Korea. We manufacture some of our consumer and professional diagnostic products in a manufacturing facility of approximately 498,000 square feet in Hangzhou, China, which we own. The majority of our consumer diagnostic products are manufactured in a facility of
43
Table of Contents
approximately 133,000 square feet in Shanghai, China, which we lease. We manufacture our Alere Pima Analyzer in a facility of approximately 159,000 square feet in Jena, Germany, which we own. We manufacture our Determine products in a leased space of approximately 34,700 square feet in Matsudo, Japan. Standard Diagnostics manufactures most of its professional diagnostic products in three facilities in Yongin, South Korea: a 64,000 square foot facility and a 112,000 square foot facility, both of which we own, and an 84,000 square foot facility, which we lease. Axis-Shield, which we acquired in 2011, manufactures the majority of our point-of-care products for patients with diabetes in a leased space of approximately 135,000 square feet in Oslo, Norway and a leased space of approximately 54,000 square feet in Dundee, Scotland. We also manufacture point-of-care products in a leased space of approximately 30,000 square feet in Ottawa, Canada. We manufacture certain professional diagnostic products in a 118,000 square foot facility that we lease in Scarborough, Maine.
We rely on our global network of toxicology laboratories to provide reliable drugs-of-abuse test results to customers in the employer, government, forensic, and clinical market segments. We own toxicology laboratories in Gretna, Louisiana; Richmond, Virginia; Clearwater, Florida; and lease toxicology laboratories in Santa Rosa, California; London and Abingdon, England, and an accredited forensic laboratory in Malvern, England. Three of the US toxicology laboratories are SAMSHA-certified and are located in Santa Rosa, California; Gretna, Louisiana; and Richmond, Virginia. The Clearwater, Florida laboratory is pending closure.
Additionally, we have facilities, which are generally leased, in various locations worldwide, including smaller manufacturing operations and laboratories, as well as research and development operations, administrative or sales offices, call centers and warehouses. We believe that adequate space for our manufacturing, testing and other operations will be available as needed.
The property that we own in San Diego, California, which is described above, is subject to a mortgage in favor of our lenders pursuant to the terms of our secured credit facility.
U.S. Securities and Exchange Commission Subpoena
On August 28, 2015, we received a subpoena from the SEC which indicated that it is conducting a formal investigation of Alere. The SEC’s subpoena relates to, among other things, (i) our previously filed restatement and revision to our financial statements, including the accounting for deferred taxes for discontinued operations, as well as our tax strategies and policies and (ii) our sales practices and dealings with third parties (including distributors and foreign government officials) in Africa relating to sales to government entities. On January 14, 2016, we received a second subpoena from the SEC in connection with this formal investigation seeking, among other things, additional information related to sales of products and services to end-users in Africa, as well as revenue recognition relating to sales of products and services to end-users in Africa. We have also received, from time to time, requests in connection with the investigation to voluntarily produce additional information to the SEC, including information pertaining to certain other countries in Asia and Latin America.
We are cooperating with the SEC and have provided documents in response to the subpoenas and voluntary requests. We are unable to predict when this matter will be resolved or what further action, if any, the SEC may take in connection with it.
Department of Justice Grand Jury Subpoena
On March 11, 2016, we received a grand jury subpoena from the United States Department of Justice requiring the production of documents relating to, among other things, sales, sales practices and dealings with third parties (including distributors and foreign governmental officials) in Africa, Asia and Latin America and other matters related to the U.S. Foreign Corrupt Practices Act.
44
Table of Contents
We are cooperating with the Department of Justice and have provided information in response to the subpoena. We are unable to predict when this matter will be resolved or what further action, if any, the Department of Justice may take in connection with it.
Securities Class Actions
On April 21, 2016, a class action lawsuit captioned Godinez v. Alere Inc., was filed against us in the United States District Court for the District of Massachusetts. On May 4, 2016, a second class action lawsuit captioned Breton v. Alere Inc., was filed against us in the United States District Court for the District of Massachusetts. Both of these class actions purport to assert claims against us and certain current and former officers for alleged violations of Section 10(b) and Section 20(a) of the Exchange Act and Rule 10b-5 under the Exchange Act. Each plaintiff seeks to represent a proposed class of all persons who purchased or otherwise acquired our common stock during the period May 9, 2013 through April 20, 2016. Each complaint seeks damages allegedly caused by alleged materially misleading statements and/or material omissions by us and the officers regarding our business, prospects and operations, each plaintiff claims, which allegedly operated to inflate artificially the price paid for our common stock during the class period. Each complaint seeks unspecified compensatory damages, attorneys’ fees and costs. On July 11, 2016, the court entered an order consolidating the two actions and appointing lead plaintiffs and lead counsel, and on July 19, 2016 the court ordered a schedule for the filing of a consolidated amended complaint and for the motion to dismiss briefing.
We are unable at this time to determine the outcome of this class action lawsuit or our potential liability, if any.
Matters Relating to our San Diego Facility
On October 9, 2012, we received a warning letter from the FDA referencing inspectional observations set forth in a Form FDA 483 received in June 2012. The observations were the result of an inspection of our San Diego facility conducted earlier during 2012 relating to our Alere Triage products, which resulted in two recalls of certain Alere Triage products and revised release specifications for our Alere Triage meter-based products. In September 2014, as follow up to a further inspection of our San Diego facility, the FDA notified us that this inspection was classified “voluntary action indicated,” meaning that the objectionable conditions or practices found in the inspection did not meet the threshold of significance requiring regulatory action, but that formal close-out of the October 2012 Warning Letter could not occur until after a future inspection.
In May 2012, we also received a subpoena from the Office of Inspector General of the Department of Health and Human Services, or the OIG, seeking documents relating primarily to the quality control testing and performance characteristics of Alere Triage products. We are cooperating with the OIG and are responding to the investigation, which is ongoing.
We are unable to predict when these matters will be resolved or what further action, if any, the government will take in connection with them.
INRatio Class Actions
On May 26, 2016, a class action lawsuit captioned Dina Andren and Sidney Bludman v. Alere Inc., et al., was filed against us in the United States District Court for the Southern District of California. In addition, on July 22, 2016, a class action lawsuit captioned J.E, J.D., and all others similarly situated v. Alere Inc., Alere San Diego, Inc. and Alere Home Monitoring, Inc., was filed against us in the United States District Court for the District of Massachusetts. These class actions purport to assert claims against us under several legal theories, including fraud, breach of warranty, unjust enrichment and violation of applicable unfair competition/business practice statutes in connection with the manufacturing, marketing and sale of our INRatio products. The plaintiffs in the Dina Andren and Sidney Bludman class action seek to represent a proposed class of all persons who purchased, rented
45
Table of Contents
or otherwise paid for the INRatio system during the period January 1, 2009 to May 26, 2016 in the United States, or alternatively, California, Maryland and/or New York. The plaintiffs in the J.E, J.D., and all others similarly situated class action seek to represent a proposed class of all persons who purchased, rented or otherwise paid for the INRatio system during the period April 1, 2008 to present. Both class action complaints seek restitution and damages allegedly resulting from inaccurate PT/INR readings and from the purchase of devices that claimants say they would not have purchased had they known of the alleged propensity of these devices to yield inaccurate PT/INR results. Among other things, plaintiffs in these class action lawsuits seek a refund of money spent on INRatio products. Each complaint also seeks unspecified compensatory damages, injunctive relief, attorneys’ fees and costs. The Andren action also appears to seek damages for personal injury.
We are unable, at this time, to determine the outcome of these class action lawsuits or our potential liability, if any.
Claims in the Ordinary Course and Other Matters
We are also party to certain other legal proceedings and other governmental investigations, or are requested to provide information in connection with such proceedings or investigations. For example, in December 2014, we and our subsidiary, Avee Laboratories Inc., or Avee, received subpoenas from the United States Attorney for the District of New Jersey seeking marketing materials and other documents relating primarily to billing and marketing practices related to toxicology testing. In addition, we received a U.S. Department of Justice criminal subpoena addressed to Alere Toxicology Services, Inc. on July 1, 2016 which seeks records related to Medicare, Medicaid and Tricare billings dating back to 2010 for specific patient samples tested at our Austin, Texas pain management laboratory and payments made to physicians. We are cooperating with these investigations and are providing documents in response to both subpoenas. We and our subsidiary, Arriva Medical, LLC, are also in the process of responding to Civil Investigative Demands, or CIDs, the most recent CID which was received in July 2016, from the United States Attorney for the Middle District of Tennessee in connection with an investigation of possible improper claims submitted to Medicare and Medicaid. The CIDs request patient and billing records and records related to interactions with third parties. We are cooperating with the investigation of the United States Attorney for the Middle District of Tennessee and are providing documents responsive to the CIDs. We cannot predict what effect, if any, these investigations, or any resulting claims, could have on Alere or its subsidiaries.
We have received, from time to time, additional subpoenas and requests for information from the United States Department of Justice, other federal government agencies and state attorneys general, and we have, in each of these cases, cooperated with the applicable governmental entity in responding to the applicable subpoena or request for information. For example, in May 2016, we received a subpoena from the U.S. Attorney for the District of New Jersey, which seeks various documents related to the accuracy, reliability and performance of the INRatio system, including documents relating to prior interactions with the FDA and others regarding the system.
Our diabetes, toxicology and patient self-testing businesses are subject to audit and claims for reimbursement brought in the ordinary course by private third-party payers, including health insurers, Zone Program Integrity Contractors, or ZPICs, and Medicare Administrative Contractors, or MACs, to monitor compliance with coverage and reimbursement rules and guidelines. These types of audits and claims can include, but are not limited to, claims relating to proper documentation and support or claims relating to the medical necessity of certain testing and can lead to assertions or determinations that certain claims should not have been, or will no longer be, paid by the private third-party payer or by Medicare or Medicaid. In such cases, the payer or program may seek to recoup or offset amounts they assert have been paid in error.
Our businesses may also be subject at any time to other commercial disputes, product liability claims, personal injury claims, including claims arising from or relating to product recalls, negligence
46
Table of Contents
claims, third-party subpoenas or various other lawsuits arising in the ordinary course of business, including infringement, employment or investor matters, and we expect that this will continue to be the case in the future. For example, several individuals have filed suits against us alleging personal injury claims in connection with the use of our INRatio products (which are in addition to the class action suits described above).
Such lawsuits or claims generally seek damages or reimbursement, sometimes in substantial amounts. There are possible unfavorable outcomes related to litigation or governmental investigations that could materially impact our business, results of operations, financial condition, and cash flows.
ITEM 4. MINE SAFETY DISCLOSURES
Not applicable.
47
Table of Contents
PART II
| ITEM 5. | MARKET FOR REGISTRANT’S COMMON EQUITY, RELATED STOCKHOLDER MATTERS AND ISSUER PURCHASES OF EQUITY SECURITIES |
Unregistered Sales of Equity Securities and Use of Proceeds
During the three months ended June 30, 2015, we issued an aggregate of 25,305 shares of our common stock to two of our directors, one current employee and one former employee pursuant to exercises of options granted under our 2001 Stock Option and Incentive Plan at exercise prices ranging from $28.03 to $48.14 per share.
The sales of the above securities were exempt from registration under the Securities Act of 1933, as amended, or the Securities Act, in reliance upon Section 4(a)(2) of the Securities Act as transactions by an issuer not involving any public offering.
Market Information
Our common stock trades on the New York Stock Exchange, or the NYSE, under the symbol “ALR.” The following table sets forth the high and low sales prices of our common stock for each quarter during fiscal 2015 and 2014:
| High | Low | |||||||
| Fiscal 2015 |
||||||||
| Fourth Quarter |
$ | 51.48 | $ | 38.21 | ||||
| Third Quarter |
$ | 55.99 | $ | 45.34 | ||||
| Second Quarter |
$ | 53.09 | $ | 47.29 | ||||
| First Quarter |
$ | 49.47 | $ | 36.37 | ||||
| Fiscal 2014 |
||||||||
| Fourth Quarter |
$ | 40.50 | $ | 35.62 | ||||
| Third Quarter |
$ | 43.00 | $ | 33.76 | ||||
| Second Quarter |
$ | 37.88 | $ | 31.94 | ||||
| First Quarter |
$ | 39.90 | $ | 32.98 | ||||
On July 27, 2016, there were 968 holders of record of our common stock.
Dividend Policy
We have never declared or paid any cash dividends on our common stock. We currently intend to retain earnings to support our growth strategy and do not anticipate paying cash dividends on our common stock in the foreseeable future. Payment of future dividends, if any, on our common stock will be at the discretion of our board of directors after taking into account various factors, including our financial condition, operating results, current and anticipated cash needs and plans for expansion. In addition, restrictive covenants under our secured credit facility and the indentures governing the terms of our senior notes and our senior subordinated notes, as well as the merger agreement that we entered into with Abbott on January 30, 2016, currently prohibit or limit the payment of cash or stock dividends.
Stock Performance Graph
The following line graph compares the cumulative total stockholder return on our common stock from December 31, 2010 through December 31, 2015 with the cumulative total return of a broad equity market index and a published industry index. This graph assumes an investment of $100.00 on December 31, 2010 in our common stock, and compares its performance with the NYSE Composite
48
Table of Contents
Index and the Dow Jones U.S. Health Care Index (the “Current Indices”). We paid no dividends on our common stock during the period covered by the graph. The Current Indices reflect a cumulative total return based upon the reinvestment of dividends of the stocks included in those indices. Measurement points are December 31, 2010 and the last trading day of each subsequent year end through December 31, 2015.
The comparisons shown in the graph below are based upon historical data. We caution that the stock price performance shown in the graph below is not necessarily indicative of, nor is it intended to forecast, the potential future performance of our common stock.
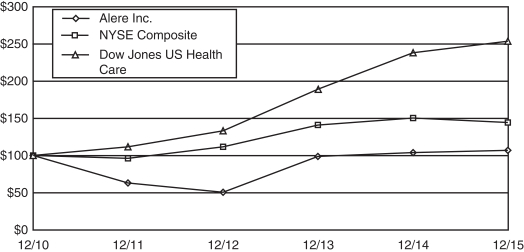
Current Indices
| Date |
ALR | NYSE Composite Index |
Dow Jones U.S. Healthcare Index |
|||||||||
| 12/31/10 |
$ | 100.00 | $ | 100.00 | $ | 100.00 | ||||||
| 12/30/11 |
$ | 63.09 | $ | 96.12 | $ | 111.75 | ||||||
| 12/31/12 |
$ | 50.55 | $ | 111.53 | $ | 133.27 | ||||||
| 12/31/13 |
$ | 98.91 | $ | 140.85 | $ | 189.21 | ||||||
| 12/31/14 |
$ | 103.83 | $ | 150.35 | $ | 237.95 | ||||||
| 12/31/15 |
$106.80 | $ | 144.21 | $ | 253.62 | |||||||
The performance graph above shall not be deemed “filed” for purposes of Section 18 of the Exchange Act or otherwise subject to the liabilities of that section. This graph will not be deemed incorporated by reference into any filing under the Securities Act, whether made before or after the date hereof, regardless of any general incorporation language in such filing.
| ITEM 6. | SELECTED CONSOLIDATED FINANCIAL DATA |
The following tables set forth selected consolidated financial data of our company as of and for each of the years in the five-year period ended December 31, 2015 and should be read in conjunction with “Management’s Discussion and Analysis of Financial Condition and Results of Operations” and our consolidated financial statements and notes thereto included elsewhere in this Annual Report on Form 10-K.
On October 10, 2014, we completed the sale of ACS, our health information exchange business, to ACS Acquisition, LLC for a purchase price consisting primarily of contingent consideration. In connection with the sale of ACS, in June 2015 we also sold our subsidiary Wellogic ME FZ – LLC, or Wellogic, which we refer to collectively with ACS, as the ACS Companies, to the same purchaser.
49
Table of Contents
On January 9, 2015, we completed the sale of our health management business to OptumHealth Care Solutions for a purchase price of $599.9 million. We used the net cash proceeds of the sale to repay $575.0 million in aggregate principal amount of outstanding indebtedness under our prior credit facility.
The results of the health management business are included in income (loss) from discontinued operations, net of tax, for all periods presented in the statement of operations data below, given our January 9, 2015 divestiture of this business. The results of ACS are included in income (loss) from discontinued operations, net of tax, for 2014, 2013, 2012, and 2011, given our October 10, 2014 divestiture of this business. The assets and liabilities associated with the health management business have been reclassified to current classifications as assets held for sale and liabilities related to assets held for sale and, as such, have impacted working capital amounts, which are reflected in the balance sheet data below, except as of December 31, 2015.
For a discussion of certain factors, such as acquisitions and dispositions, that materially affect the comparability of the selected consolidated financial data or cause the data reflected herein not to be indicative of our future results of operations or financial condition, see Item 1A “Risk Factors,” Item 7 “Management’s Discussion and Analysis of Financial Condition and Results of Operation” and Notes 2, 3(w) and 5 of our consolidated financial statements included elsewhere in this Annual Report on Form 10-K.
In connection with the preparation of our consolidated financial statements for the fiscal year
ended December 31, 2015, we determined that, in fiscal years 2013 and 2014 each of the interim periods of 2014 and the first three fiscal quarters of 2015, we had incorrectly recorded certain revenue transactions in such periods. In addition, we corrected out-of-period adjustments related to the correction of a specific bonus accrual, the measurement of a certain royalty obligation and adjustments related to the accounting for income taxes. As a result, we are revising our consolidated financial information as of December 31, 2014 and for the years ended December 31, 2014 and 2013 and the interim periods in 2014 and 2015. For more information on these revisions, see Note 2 to the consolidated financial statements “Revision of Previously Reported Consolidated Financial Statements” included elsewhere in this Annual Report on Form 10-K.”
In addition, we corrected out-of-period adjustments related to the revenue assessment findings, the measurement of a certain royalty obligation, the release of a liability due to the statute of limitations and adjustments related to the accounting for income taxes for the years ended December 31, 2011 and 2012. These revisions resulted in a reduction of net revenue of $2.0 million and $1.0 million for the years ended December 31, 2011 and 2012, respectively. Income (loss) from continuing operations declined $1 million and $0.5 million for the years ended December 31, 2011 and 2012, respectively. Basic and diluted net income (loss) per common share declined $0.01 per share in both years ended December 31, 2011 and 2012. Total assets declined $0.4 million as of December 31, 2011 and decreased $1.0 million as of December 31, 2012. We evaluated the cumulative impact of these items on our previously-issued annual financial statements for 2011 and 2012, under the guidance in Accounting Standards Codification 250 Accounting Changes and Error Corrections (ASC 250) relating to SEC Staff Accounting Bulletin (SAB) No. 99, Materiality, and concluded that the revisions were not material, individually or in the aggregate, to any of our previously-issued annual financial statements.
50
Table of Contents
| Year Ended December 31, | ||||||||||||||||||||
| 2015 | 2014 | 2013 | 2012 | 2011 | ||||||||||||||||
| (in thousands, except per share data) | ||||||||||||||||||||
| Statement of Operations Data: |
||||||||||||||||||||
| Net product sales |
$ | 1,954,031 | $ | 2,022,240 | $ | 2,048,789 | $ | 1,898,726 | $ | 1,665,291 | ||||||||||
| Services revenue |
492,308 | 531,988 | 532,618 | 465,882 | 254,971 | |||||||||||||||
|
|
|
|
|
|
|
|
|
|
|
|||||||||||
| Net product sales and services revenue |
2,446,339 | 2,554,228 | 2,581,407 | 2,364,608 | 1,920,262 | |||||||||||||||
| License and royalty revenue |
16,977 | 21,050 | 27,229 | 28,576 | 23,473 | |||||||||||||||
|
|
|
|
|
|
|
|
|
|
|
|||||||||||
| Net revenue |
2,463,316 | 2,575,278 | 2,608,636 | 2,393,184 | 1,943,735 | |||||||||||||||
|
|
|
|
|
|
|
|
|
|
|
|||||||||||
| Cost of net product sales |
1,042,603 | 1,062,499 | 1,014,531 | 920,185 | 781,676 | |||||||||||||||
| Cost of services revenue |
304,388 | 294,949 | 274,229 | 220,510 | 106,068 | |||||||||||||||
|
|
|
|
|
|
|
|
|
|
|
|||||||||||
| Cost of net product sales and services revenue |
1,346,991 | 1,357,448 | 1,288,760 | 1,140,695 | 887,744 | |||||||||||||||
| Cost of license and royalty revenue |
3,781 | 5,592 | 7,763 | 7,354 | 7,036 | |||||||||||||||
|
|
|
|
|
|
|
|
|
|
|
|||||||||||
| Cost of net revenue |
1,350,772 | 1,363,040 | 1,296,523 | 1,148,049 | 894,780 | |||||||||||||||
|
|
|
|
|
|
|
|
|
|
|
|||||||||||
| Gross profit |
1,112,544 | 1,212,238 | 1,312,113 | 1,245,135 | 1,048,955 | |||||||||||||||
| Operating expenses: |
||||||||||||||||||||
| Research and development |
119,453 | 144,828 | 159,053 | 181,735 | 150,165 | |||||||||||||||
| Sales and marketing |
435,131 | 512,961 | 566,137 | 556,594 | 470,572 | |||||||||||||||
| General and administrative |
369,570 | 453,628 | 435,199 | 347,379 | 252,617 | |||||||||||||||
| Goodwill impairment charge |
— | — | — | — | 8,027 | |||||||||||||||
| Impairment and (gain) loss on dispositions, net |
50,540 | 7,742 | 5,124 | — | — | |||||||||||||||
|
|
|
|
|
|
|
|
|
|
|
|||||||||||
| Operating income |
137,850 | 93,079 | 146,600 | 159,427 | 167,574 | |||||||||||||||
| Interest expense, including amortization of original issue discounts and write-off of deferred financing costs, and other income (expense), net |
(218,840 | ) | (211,412 | ) | (266,606 | ) | (229,260 | ) | 86,352 | |||||||||||
|
|
|
|
|
|
|
|
|
|
|
|||||||||||
| Income (loss) from continuing operations before provision (benefit) for income taxes |
(80,990 | ) | (118,333 | ) | (120,006 | ) | (69,833 | ) | 253,926 | |||||||||||
| Provision (benefit) for income taxes |
(52,704 | ) | 70,930 | (44,707 | ) | (11,005 | ) | (4,743 | ) | |||||||||||
|
|
|
|
|
|
|
|
|
|
|
|||||||||||
| Income (loss) from continuing operations before equity earnings of unconsolidated entities, net of tax |
(28,286 | ) | (189,263 | ) | (75,299 | ) | (58,828 | ) | 258,669 | |||||||||||
| Equity earnings of unconsolidated entities, net of tax |
15,530 | 17,509 | 17,443 | 13,245 | 8,524 | |||||||||||||||
|
|
|
|
|
|
|
|
|
|
|
|||||||||||
| Income (loss) from continuing operations |
(12,756 | ) | (171,754 | ) | (57,856 | ) | (45,583 | ) | 267,193 | |||||||||||
| Income (loss) from discontinued operations, net of tax |
219,513 | 138,318 | (16,126 | ) | (33,126 | ) | (402,806 | ) | ||||||||||||
|
|
|
|
|
|
|
|
|
|
|
|||||||||||
| Net income (loss) |
206,757 | (33,436 | ) | (73,982 | ) | (78,709 | ) | (135,613 | ) | |||||||||||
| Less: Net income attributable to non-controlling interests |
381 | 30 | 976 | 275 | 233 | |||||||||||||||
|
|
|
|
|
|
|
|
|
|
|
|||||||||||
| Net income (loss) attributable to Alere Inc. and Subsidiaries |
206,376 | (33,466 | ) | (74,958 | ) | (78,984 | ) | (135,846 | ) | |||||||||||
| Preferred stock dividends |
(21,293 | ) | (21,293 | ) | (21,293 | ) | (21,293 | ) | (22,049 | ) | ||||||||||
| Preferred stock repurchase |
— | — | — | — | 23,936 | |||||||||||||||
|
|
|
|
|
|
|
|
|
|
|
|||||||||||
| Net income (loss) available to common stockholders(1) |
$ | 185,083 | $ | (54,759 | ) | $ | (96,251 | ) | $ | (100,277 | ) | $ | (133,959 | ) | ||||||
|
|
|
|
|
|
|
|
|
|
|
|||||||||||
51
Table of Contents
| Year Ended December 31, | ||||||||||||||||||||
| 2015 | 2014 | 2013 | 2012 | 2011 | ||||||||||||||||
| (in thousands, except per share data) | ||||||||||||||||||||
| Basic net income (loss) per common share attributable to Alere Inc. and Subsidiaries: |
||||||||||||||||||||
| Income (loss) per common share from continuing operations |
$ | (0.40) | $ | (2.33 | ) | $ | (0.98 | ) | $ | (0.83 | ) | $ | 3.24 | |||||||
| Income (loss) per common share from discontinued operations |
2.57 | 1.67 | (0.20 | ) | (0.41 | ) | (4.85 | ) | ||||||||||||
|
|
|
|
|
|
|
|
|
|
|
|||||||||||
| Net income (loss) per common share(1)(2) |
$ | 2.17 | $ | (0.66 | ) | $ | (1.18 | ) | $ | (1.24 | ) | $ | (1.61 | ) | ||||||
|
|
|
|
|
|
|
|
|
|
|
|||||||||||
| December 31, | ||||||||||||||||||||
| 2015 | 2014 | 2013 | 2012 | 2011 | ||||||||||||||||
| (In thousands) | ||||||||||||||||||||
| Balance Sheet Data: |
||||||||||||||||||||
| Cash and cash equivalents |
$ | 502,200 | $ | 378,461 | $ | 355,431 | $ | 316,479 | $ | 287,541 | ||||||||||
| Working capital |
$ | 732,756 | $ | 1,059,106 | $ | 989,314 | $ | 1,036,016 | $ | 960,624 | ||||||||||
| Total assets |
$ | 5,957,171 | $ | 6,699,879 | $ | 7,058,515 | $ | 7,062,746 | $ | 6,665,598 | ||||||||||
| Total debt |
$ | 3,076,351 | $ | 3,726,094 | $ | 3,842,078 | $ | 3,708,011 | $ | 3,353,335 | ||||||||||
| Other long-term obligations |
$ | 301,811 | $ | 378,883 | $ | 430,110 | $ | 538,526 | $ | 452,183 | ||||||||||
| Total stockholders’ equity |
$ | 2,054,165 | $ | 1,912,394 | $ | 2,075,777 | $ | 2,181,937 | $ | 2,235,146 | ||||||||||
| (1) | Net income (loss) available to common stockholders and basic and diluted net income (loss) per common share are computed consistent with annual per share calculations described in Notes 4(o) and 13 of our consolidated financial statements included elsewhere in this Annual Report on Form 10-K. |
| (2) | For the year ended December 31, 2011, diluted net loss per common share of $(1.11) includes income from continuing operations of $3.00 and loss from discontinued operations of $(4.11). Basic and diluted net loss per common share is consistent for all other years presented. |
| ITEM 7. | MANAGEMENT’S DISCUSSION AND ANALYSIS OF FINANCIAL CONDITION AND RESULTS OF OPERATIONS |
Forward-Looking Statements
This Annual Report on Form 10-K, including this Item 7, contains forward-looking statements within the meaning of Section 27A of the Securities Act of 1933, as amended, and Section 21E of the Exchange Act. You can identify these statements by forward-looking words such as “may,” “could,” “should,” “would,” “intend,” “will,” “expect,” “anticipate,” “believe,” “estimate,” “continue” or similar words. You should read statements that contain these words carefully because they discuss our future expectations, contain projections of our future results of operations or of our financial condition or state other “forward-looking” information. Forward-looking statements include, without limitation, statements regarding the expected closing date of the transactions contemplated by the Merger Agreement with Abbott Laboratories, the benefits of our improved products, the ability to commercialize products under development, expected product distribution by Alere Home Monitoring, future market acceptance in the United States of our Alere DDS2 Mobile Test System, our plans to voluntarily withdraw the INRatio and INRatio2 PT/INR Monitoring Systems from the market, future benefits of our intellectual property, future competition in our markets, the implementation and effectiveness of efforts to remediate our material weaknesses, the outcome of certain tax examinations, the timing of decisions and the outcome in connection with certain legal proceedings to which we and other parties are subject, the sources of funds the pay the principal and interest on our indebtedness and certain expenses, intention to retain earnings to support our growth strategy (and that we do not anticipate paying dividends on common stock), PMA submissions to be made in the future, future compensation policies and practices that are expected to be implemented and continued, future trends with respect to license and royalty revenues, future trends with respect to amortization expense, the source of funds and the expected ability to fund short and long-term working capital needs, the anticipated use of proceeds from divestitures, future plans with respect to the repatriation of cash held by foreign entities, availability of sufficient space to
52
Table of Contents
contain our operations, future litigation being brought against us and the impact of such litigation, future litigation strategies related to intellectual property matters, impact of the Merger Agreement on our change of control and severance agreements, expected tax treatment of certain compensation payments to our named executive officers, the expected impact of recently announced and adopted accounting standards and other accounting standards on our financial statements, future contributions by us to certain benefit plans, anticipated increases or decreases to certain tax benefits, future changes in tax positions due to audits, expected future expenses in connection with the voluntary withdrawal of INRatio products from the market, the accounting treatment of future funding under arrangements with the Gates Foundation, anticipated expenses and costs in connection with certain restructuring plans, future charges in connection with a withdrawal of a product from the market, the impact of our research and development activities, potential new product and technology achievements and the potential for selective divestitures of non-core assets. Actual results or developments could differ materially from those projected in such statements as a result of numerous factors, including, without limitation, those risks and uncertainties set forth in Item 1A entitled “Risk Factors,” which begins on page 16 of this report, as well as those factors identified from time to time in our filings with the Securities and Exchange Commission. We do not undertake any obligation to update any forward-looking statements. This report and, in particular, the following discussion and analysis of our financial condition and results of operations, should be read in light of those risks and uncertainties and in conjunction with our accompanying consolidated financial statements and notes thereto.
Overview
We deliver reliable and actionable health information through rapid diagnostic tests, resulting in better clinical and economic healthcare outcomes globally. Our high-performance diagnostics for infectious disease, cardiometabolic disease and toxicology are designed to meet the growing global demand for accurate, easy-to-use and cost-effective near-patient tests. Our goal is to make our products accessible to more people around the world, even those located in remote and resource-limited areas, by making them affordable and usable in any setting. By making critical clinical diagnostic information available to doctors and patients in an actionable timeframe, our products help streamline healthcare delivery and improve patient outcomes.
Change in Reporting Segments
In January 2015, we sold our condition management, case management, wellbeing, wellness, and women’s and children’s health businesses, which we refer to collectively as our health management business. As a result of the sale of our health management business, which was the largest component of our former patient self-testing reporting segment, we no longer report our financial information in four operating segments. Our current reportable operating segments are professional diagnostics, consumer diagnostics, and corporate and other. The information below for the fiscal years ended December 31, 2013 and 2014 has been retroactively adjusted to reflect this change in reporting segments.
Recent Developments
Merger Agreement with Abbott Laboratories
On January 30, 2016, we entered into the Merger Agreement with Abbott. For more information regarding the Merger Agreement and the transactions contemplated thereby and related matters, please see Item 1 “Business – Recent Developments – Merger Agreement with Abbott Laboratories” and Item 1A “Risk Factors – Risks Related to the Merger.”
INRatio and INRatio2 PT/INR Monitoring System Voluntary Withdrawal
In July 2016, we announced that we will be initiating a voluntary withdrawal of the Alere INRatio®/ INRatio®2 PT/INR Monitoring Systems. See “Business—Government Regulation” for additional
53
Table of Contents
information on our plan to voluntarily withdraw the INRatio Systems from the market. Due to the fact that the circumstances giving rise to the voluntary withdrawal in the United States and related action outside the U.S. existed as of December 31, 2015, certain charges incurred in connection with the withdrawal have been recorded in 2015. Specifically, we recorded a charge of approximately $38 million in the year ending December 31, 2015, of which, approximately $18 million is attributable to the impairment of certain inventory of our INRatio and INRatio2 products; approximately $3 million is related to the impairment of production equipment; and, approximately $16 million is related to the estimated costs of removing our INRatio and INRatio2 from the market, including: notifications to users, return and disposals costs and other related amounts. Additionally, our decision to withdraw the INRatio and INRatio2 PT/INR Monitoring Systems impacted the useful life assumptions of certain tangible and intangible assets. As a result of this change in estimates, we recorded approximately $4 million of accelerated amortization of intangible assets and approximately $1 million of accelerated depreciation of tangible assets in the year ending December 31, 2015. Finally, during fiscal year 2016 we expect to incur approximately $16 million of accelerated amortization, approximately $3 million of accelerated depreciation, and $2 million of other one-time cash expenditures related to this matter.
Divestiture of the BBI Business
On November 17, 2015, we completed the sale of our BBI business, which was achieved through the sale of our subsidiary BBI Diagnostic Group Ltd., for a purchase price of approximately $106.4 million, net of a final working capital adjustment. We are eligible to receive up to an additional $46.6 million in contingent cash consideration. The BBI business provided products and services for the diagnostic, healthcare, research, defense and food industries globally. The BBI business was formerly included in our professional diagnostics reporting unit and business segment. We used $115.0 million of the net cash proceeds from the closing of the sale of the BBI business (which represented all of the net proceeds from the closing of the sale prior to giving effect to the final working capital adjustment) to repay $115.0 million in aggregate principal amount of outstanding indebtedness under our secured credit facility.
Acquisition of USD
On July 10, 2015, we acquired substantially all of the assets of USD, located in Huntsville, Alabama, a provider of instant on-site drug testing products designed for quick and accurate drug test results. The aggregate purchase price was approximately $60.1 million and was paid in cash. The operating results of the acquired business are included in our professional diagnostics reporting unit and business segment.
Divestiture of the Health Management Business
On January 9, 2015, we completed the sale of our health management business. We completed the sale of ACS in October 2014 and the sale of Wellogic in June 2015.
We reclassified the assets and liabilities of the health management business as held for sale within the accompanying consolidated balance sheet as of December 31, 2014, and the results of the operations of the health management business and the ACS Companies are reported as income (loss) from discontinued operations, net of tax, for all periods presented in our accompanying consolidated statements of operations. See Note 3 to our consolidated financial statements included elsewhere in this Annual Report on Form 10-K for more information about these divestitures and discontinued operations.
Refinancing of Senior Secured Credit Facility
On June 18, 2015, we closed our new senior secured credit facility, or secured credit facility, totaling $1.95 billion and used a portion of the proceeds thereof to repay in full and terminate our prior
54
Table of Contents
credit facility. The new secured credit facility initially consisted of term loan facilities totaling $1.7 billion and a $250.0 million revolving credit facility. The term loans, all of which were drawn at closing, initially consisted of $650.0 million of “A” term loans and $1.05 billion of “B” term loans. As of December 31, 2015, the aggregate outstanding principal amounts of the “A” term loans and “B” term loans were $587.7 million and $971.2 million, respectively.
We used approximately $1.68 billion of the proceeds of the new term loans drawn at closing to repay in full and terminate our prior credit facility and to pay various fees and expenses associated with the transaction. For additional information about the secured credit facility, see Note 8 to the consolidated financial statements included elsewhere in this Annual Report on Form 10-K.
Refinancing of Senior Subordinated Notes
On June 24, 2015, we completed an offering of $425.0 million of our 6.375% senior subordinated notes due 2023. We used the net proceeds from the offering, as well as other cash resources, to redeem, on October 1, 2015, all of our outstanding $400.0 million aggregate principal amount of 8.625% senior subordinated notes due 2018 and to pay related redemption fees, premiums, costs and expenses and accrued interest on such notes. The redemption price was equal to 102.156% of the principal amount of such 8.625% notes plus accrued and unpaid interest from April 1, 2015 to (but excluding) October 1, 2015. Upon settlement of the redemption on October 1, 2015, we satisfied and discharged all of our obligations with respect to such notes.
3% Convertible Senior Subordinated Notes
Our 3% convertible senior subordinated notes matured on May 15, 2016. Based on the price of our common stock on the date of maturity, we paid all outstanding principal and accrued interest owing under such notes in cash. The aggregate amount paid to the noteholders at maturity was approximately $152.0 million, consisting of $125.0 million in cash drawn under our revolving credit facility plus $27.0 million of cash available on such date.
2015 Financial Highlights
| • | Net revenue decreased by $112.0 million, or 4%, to $2.46 billion in 2015, from $2.57 billion in 2014. |
| • | Gross profit decreased by $99.7 million, or 8%, to $1.11 billion in 2015, from $1.21 billion in 2014. |
| • | In 2015, we generated a loss from continuing operations available to common stockholders of $34.4 million, or $0.40 per basic and diluted common share. In 2014, we generated a loss from continuing operations available to common stockholders of $193.1 million, or $2.33 per basic and diluted common share. |
| • | In 2015, we generated net income available to common stockholders of $185.1 million, or $2.17 per basic and diluted common share. In 2014, we generated a net loss available to common stockholders of $54.8 million, or $0.66 per basic and diluted common share. |
Results of Operations
Where discussed, results excluding the impact of foreign currency translation are calculated on the basis of local currency results, using foreign currency exchange rates applicable to the earlier comparative period. We believe presenting information using the same foreign currency exchange rates helps investors isolate the impact of changes in those rates from other factors.
In connection with the preparation of our consolidated financial statements for the year ended December 31, 2015, we determined that, in 2013 and 2014, we had incorrectly recorded the timing of
55
Table of Contents
recognition of certain revenue transactions for such periods. In addition, we made several out-of-period adjustments related to the correction of a specific bonus accrual, the measurement of a certain royalty obligation and adjustments related to the accounting for income taxes. As a result, we are revising our consolidated financial information as of December 31, 2014 and for the years ended December 31, 2014 and 2013. The following information set forth in this Item 7 reflects these revisions to the timing of recognition of certain revenue transactions and such out-of-period adjustments. For more information on these revisions, see Note 2 to the consolidated financial statements “Revision of Previously Reported Consolidated Financial Statements” included elsewhere in this Annual Report on Form 10-K.
Year Ended December 31, 2015 Compared to Year Ended December 31, 2014
Net Product Sales and Services Revenue. Net product sales and services revenue decreased by $107.9 million, or 4%, to $2.5 billion in 2015, from $2.6 billion in 2014. Excluding the impact of foreign currency translation, net product sales and services revenue in 2015 increased by $11.5 million over 2014.
Net Product Sales and Services Revenue by Business Segment. Net product sales and services revenue by business segment for 2015 and 2014 is as follows (in thousands):
| 2015 | 2014 | % Decrease |
||||||||||
| Professional diagnostics |
$ | 2,361,211 | $ | 2,465,140 | 4 | % | ||||||
| Consumer diagnostics |
85,128 | 89,088 | 4 | % | ||||||||
|
|
|
|
|
|||||||||
| Net product sales and services revenue |
$ | 2,446,339 | $ | 2,554,228 | 4 | % | ||||||
|
|
|
|
|
|||||||||
Professional Diagnostics
The following table summarizes our net product sales and services revenue from our professional diagnostics business segment by groups of similar products and services for 2015 and 2014 (in thousands):
| 2015 | 2014 | % Decrease |
||||||||||
| Cardiometabolic disease |
$ | 832,402 | $ | 841,905 | 1 | % | ||||||
| Infectious disease |
717,812 | 721,803 | 1 | % | ||||||||
| Toxicology |
618,360 | 644,620 | 4 | % | ||||||||
| Other |
192,637 | 256,812 | 25 | % | ||||||||
|
|
|
|
|
|||||||||
| Professional diagnostics net product sales and services revenue |
$ | 2,361,211 | $ | 2,465,140 | 4 | % | ||||||
|
|
|
|
|
|||||||||
Net product sales and services revenue from our professional diagnostics business segment decreased by $103.9 million, or 4%, to $2.36 billion for 2015 from $2.46 billion for 2014.
We experienced revenue decreases principally in international markets, where revenue decreased $101.8 million, or 9%, to $1.05 billion during 2015 from $1.15 billion in 2014. Lower sales in international markets were driven primarily by a $17.6 million decrease in sales of infectious disease products, a $26.4 million decrease in other revenue, primarily related to non-core third-party product sales, principally in Europe, Asia and Latin America, a $12.5 million decrease in cardiometabolic sales, a $9.8 million decrease in toxicology sales, and a $35.5 million decrease in revenue primarily as a result of the dispositions of our Bionote business in 2014 and DGP and BBI businesses in 2015.
Net product sales and services revenue from our professional diagnostics business segment in the U.S. were relatively flat year over year at $1.31 billion in 2015 and in 2014, decreasing by $2.1 million.
56
Table of Contents
Revenues in the U.S. decreased primarily due to a $45.4 million decrease in toxicology pain management revenues resulting from continued pricing pressure and customer insourcing and a $12.5 million decrease in revenue attributable to the dispositions, principally as the result of the sales of our Bionote business in 2014 and BBI and Alere Analytics businesses in 2015, which were partially offset by a $28.9 million increase in toxicology revenues, other than pain management, including a $10.7 million increase related to revenue associated with our acquisition of USD, a $13.8 million increase in infectious disease revenues, driven primarily by a $10.5 million increase in influenza sales, a $6.4 million increase in cardiometabolic sales, as well as a $6.7 million increase in other revenue.
Within our professional diagnostics business segment, our cardiometabolic net product sales and services revenue decreased by $9.5 million, or 1%, to $832.4 million for 2015 from $841.9 million for 2014, primarily as a result of an $18.1 million decrease in global sales of INRatio products and an $11.0 million decrease in cholesterol products, partially offset by an $11.1 million increase in patient self-testing revenues and an $11.0 million increase in our U.S. mail order diabetes business. Infectious disease net product sales and services revenue decreased by $4.0 million, or 1%, to $717.8 million for 2015 from $721.8 million for 2014. The decrease was principally due to a $9.6 million decrease in global sales of CRP, RSV and Legionella products, an $8.2 million decrease in global CD4 sales and a $7.2 million decrease in global malaria sales, which were partially offset by a $20.2 million increase in global Influenza and HIV sales. Toxicology net product sales and services revenue decreased by $26.3 million, or 4%, to $618.4 million for 2015 from $644.6 million for 2014, primarily as a result of a $45.4 million decrease in pain management revenues resulting from continued pricing pressure and customer insourcing, partially offset by a $10.5 million increase in employer services from our eScreen business and $10.7 million of revenues associated with our acquisition of USD. Other revenue within our professional diagnostics business segment decreased $64.2 million, or 25.0%, to $192.6 million for 2015 from $256.8 million for 2014, primarily due to a $44.5 million decrease in revenue as a result of dispositions of our Bionote business in 2014, DGP, BBI and Alere Analytics businesses in 2015, and the closure of our Alere Connect LLC facility in 2015, as well as a $20.7 million decrease in revenues from non-core third-party product sales, principally from international markets.
Excluding the impacts of currency translation, acquisitions and dispositions, net product sales and services revenue from our professional diagnostics business segment increased by $41.3 million, or 2%, comparing 2015 to 2014.
Consumer Diagnostics
Net product sales and services revenue from our consumer diagnostics business segment decreased by $4.0 million, or 4%, to $85.1 million for 2015 from $89.1 million for 2014. Most of our consumer diagnostics revenue was attributable to sales to SPD under our long-term manufacturing service agreement, and the decrease in revenue is largely attributable to a decrease in sales to SPD. Consumer diagnostics revenue in the U.S. was flat in 2015 and 2014, at approximately $52.0 million in both periods, and decreased by $4.2 million in international markets to $33.3 million in 2015 as compared to $37.5 million in 2014.
License and Royalty Revenue. License and royalty revenue represents license and royalty fees from intellectual property license agreements with third parties. License and royalty revenue decreased by $4.1 million, or 19%, to $17.0 million for 2015, from $21.1 million for 2014. The decrease in royalty revenue for 2015, compared to 2014, is primarily a result of lower royalties earned under existing licensing agreements, as certain patents related to our lateral flow technology expired in 2015. Based on our license and royalty agreements in effect as of December 31, 2015, we expect this trend in lower license and royalty revenues to continue in 2016 as compared to 2015.
57
Table of Contents
Net Revenue by Geographic Location. Net revenue by geographic location for 2015 and 2014 is as follows (in thousands):
| 2015 | 2014 | % Increase/ (Decrease) |
||||||||||
| United States |
$ | 1,372,039 | $ | 1,366,739 | — | % | ||||||
| Europe |
437,653 | 533,116 | (18 | )% | ||||||||
| Elsewhere |
653,624 | 675,423 | (3 | )% | ||||||||
|
|
|
|
|
|||||||||
| $ | 2,463,316 | $ | 2,575,278 | (4 | )% | |||||||
|
|
|
|
|
|||||||||
Net revenue of $1.4 billion and $1.4 billion generated in the U.S. was approximately 56% and 53% of total net revenue for 2015 and 2014, respectively. The decrease in total net revenue in 2015 was principally the result of the decrease in revenue from the professional diagnostics business segment outside the U.S., as described above.
Gross Profit and Margin Percentage. Gross profit decreased by $99.7 million, or 8%, to $1.11 billion for 2015, from $1.21 billion for 2014. The decrease in gross profit during 2015, compared to 2014, was largely attributed a $39.1 million cost of goods charge in connection with our July 2016 announcement of a voluntary withdrawal of our Alere INRatio and Alere INRatio2 products from the market. The decrease in gross profit in 2015 was also attributable to the decrease in net product sales and services revenue, principally resulting from lower revenues from higher margin INRatio and pain management toxicology revenues, an unfavorable product mix, and a challenging foreign exchange environment in international markets. In addition, the decrease in net product sales and services revenue resulted in a decrease in gross profit as fixed costs were spread over a lower volume of net product sales.
Cost of net revenue included amortization expense of $56.3 million and $64.5 million for 2015 and 2014, respectively. Based on remaining amortization at December 31, 2015, amortization expense is expected to trend lower as acquired intangibles become fully amortized. Cost of net revenue also included restructuring charges of $3.8 million and $11.8 million for 2015 and 2014, respectively.
Overall gross margin was 45% and 47% in 2015 and 2014, respectively.
Gross Profit from Net Product Sales and Services Revenue, Total and by Business Segment. Gross profit from net product sales and services revenue decreased by $97.4 million, or 8%, to $1.1 billion in 2015, from $1.2 billion in 2014. Gross profit from net product sales and services revenue by business segment for 2015 and 2014 is as follows (in thousands):
| 2015 | 2014 | % Decrease |
||||||||||
| Professional diagnostics |
$ | 1,092,226 | $ | 1,185,551 | 8 | % | ||||||
| Consumer diagnostics |
7,121 | 11,229 | 37 | % | ||||||||
|
|
|
|
|
|||||||||
| Gross profit from net product sales and services revenue |
$ | 1,099,347 | $ | 1,196,780 | 8 | % | ||||||
|
|
|
|
|
|||||||||
Professional Diagnostics
Gross profit from our professional diagnostics net product sales and services revenue decreased by $93.3 million, or 8%, to $1.1 billion for 2015, compared to $1.2 billion for 2014. With respect to our cardiometabolic products, lower revenue and higher costs in 2015 associated with the two product recalls in 2014 of our INRatio products, along with lower revenues from sales of our higher margin cholesterol and meter-based Triage products, contributed to the decrease in gross profit. In addition, professional diagnostics gross profits decreased due to a $39.1 million in cost of goods charges in
58
Table of Contents
costs in connection with our July 2016 announcement of a voluntary withdrawal of our Alere INRatio and Alere INRatio2 products from the market. With respect to our infectious disease products, despite relatively flat year-over-year respiratory product revenues, mainly due to a below-average respiratory season, gross profit decreased due to the increased revenue contribution of our molecular offerings, which have lower margins due to higher manufacturing costs, and increased competitive pressure on our lateral flow respiratory products. Additionally, a decrease in malaria sales in Africa contributed to the decrease in gross profit, primarily driven by increased pricing pressure, partially offset by increased contribution from our higher margin HIV sales in the region. Lower pain management toxicology revenue, as discussed above, further contributed to the decrease in gross profit, driven by pricing pressure and an increase in customer insourcing. During 2015, the challenging foreign currency environment in international markets also impacted our gross profit. Gross profit during 2015 and 2014 reflected $3.8 million and $11.8 million, respectively, in restructuring charges.
Cost of professional diagnostics net product sales and services revenue included amortization expense of $56.3 million and $64.3 million for 2015 and 2014, respectively. Based on remaining amortization at December 31, 2015, amortization expense is expected to trend lower as acquired intangibles become fully amortized.
As a percentage of our professional diagnostics net product sales and services revenue, gross profit was 46% and 48% for 2015 and 2014, respectively.
Consumer Diagnostics
Gross profit from our consumer diagnostics net product sales and services revenue decreased $4.1 million, or 37%, to $7.1 million during 2015, from $11.2 million in 2014. The decrease in gross profit was primarily the result of lower contract manufacturing revenue associated with our long-term manufacturing services agreement with SPD.
As a percentage of our consumer diagnostics net product sales and services revenue, gross profit from our consumer diagnostics business was 8% for 2015, compared to 13% in 2014. The decrease in gross profit was primarily the result of lower contract manufacturing revenue associated with our long-term manufacturing services agreement with SPD.
Research and Development Expense. Research and development expense decreased by $25.3 million, or 17%, to $119.5 million in 2015, from $144.8 million in 2014. The decrease was primarily attributable to an $8.8 million reduction in workforce-related costs and an $8.1 million reduction in supplies expense, both as a result of our cost reduction initiatives, a $7.8 million favorable impact of foreign exchange rates and a $7.0 million reduction in restructuring expense, partially offset by a $6.5 million increase in amortization expense.
Research and development expense during 2015 and 2014 is reported net of grant funding of $3.9 million and $9.5 million, respectively, arising from the research and development funding relationship with the Bill and Melinda Gates Foundation, or the Gates Foundation, that we entered into in February 2013, and $3.4 million and $0.4 million, respectively, of funding related to our contract with the U.S. Department of Health and Human Services’ Biomedical Advanced Research and Development Authority, or BARDA, that we entered into in September 2014. For additional information on the agreements with BARDA and the Gates Foundation, including the April 2016 mutual agreement to terminate the February 2013 grant and the February 2013 loan agreement with the Gates Foundation, see Note 19 to the consolidated financial statements elsewhere in this Annual Report on Form 10-K.
Amortization expense of $11.1 million and $6.5 million was included in research and development expense for 2015 and 2014, respectively. Restructuring charges associated with our various restructuring plans to integrate our businesses totaling $2.8 million and $9.8 million were included in research and development expense during 2015 and 2014, respectively.
59
Table of Contents
Research and development expense as a percentage of net revenue was 5% and 6% for 2015 and 2014, respectively.
Sales and Marketing Expense. Sales and marketing expense decreased by $77.8 million, or 15%, to $435.1 million for 2015, from $513.0 million for 2014, as a result of our cost reduction initiatives, which were driven by a $24.3 million reduction in workforce-related costs, as well as a $24.8 million favorable impact of foreign exchange rates. In addition, $18.3 million of the decrease in sales and marketing expense was driven by lower amortization expense related to customer relationship intangibles during 2015, compared to 2014, as the underlying economic benefit of the intangibles declined. Amortization expense of $131.8 million and $154.4 million was included in sales and marketing expense for 2015 and 2014, respectively. Restructuring charges associated with our various restructuring plans to reduce expenses and further integrate our businesses totaling $3.0 million and $11.4 million were included in sales and marketing expense for 2015 and 2014, respectively, which reflects a decrease of $8.4 million.
Sales and marketing expense as a percentage of net revenue was 18% and 20% for 2015 and 2014, respectively.
General and Administrative Expense. General and administrative expense decreased by $84.0 million, or 19%, to $369.6 million for 2015, from $453.6 million for 2014. The decrease was primarily attributable to a $69.8 million benefit from a net decrease in the fair value of acquisition-related contingent consideration, a $19.4 million decrease in restructuring expense, a $16.7 million favorable impact of foreign currency exchange rates and a $19.7 million reduction in workforce-related costs as a result of our cost reduction initiatives. These decreases were partially offset by an $11.8 million increase in stock compensation expense, a $20.4 million increase in information technology expenses, including costs for software, telecommunications and other information technology expenses, a $2.9 million increase in bad debt expense and a $2.2 million increase in professional fees and other outside services.
General and administrative expense as a percentage of net revenue was 15% and 18% for 2015 and 2014, respectively.
Impairment and (Gain) Loss on Dispositions, Net. In 2015, we generated an aggregate of $50.5 million impairment and loss on dispositions, net, in connection with the sale of certain businesses or assets as described below. In November 2015, we completed the sale of the BBI business. The BBI business was a component of our professional diagnostics reporting unit and business segment. We received cash consideration of approximately $106.4 million, net of a final working capital adjustment, and we are eligible to receive contingent consideration payments of up to $46.6 million upon the achievement of a certain milestone. The net assets disposed of in connection with the disposition of the BBI business were valued at an aggregate of $66.5 million and the value of the allocated goodwill was $49.2 million. Because the aggregate value of the net assets and goodwill disposed of in the transaction exceeded the cash consideration received, we recorded a $9.3 million loss in 2015 on the disposition of the BBI business.
In July 2015, we sold certain assets of our Inverness Medical Innovations Australia Pty Ltd business, which was part of our professional diagnostics reporting unit and business segment, for AUD 0.2 million (approximately $0.1 million as of the date of disposition) in cash proceeds and, as a result of this transaction, we recorded a loss of $1.2 million during 2015. We recorded additional charges of approximately $0.8 million in connection with certain other business closures or divestitures during 2015.
In May 2015, we sold our Alere Analytics business, which was part of our professional diagnostics reporting unit and business segment. Under the terms of the sale we received nominal consideration and agreed to contribute working capital of $2.7 million to Alere Analytics, of which $2.4 million was contributed in cash immediately prior to the closing of the sale and the remaining $0.3 million of which
60
Table of Contents
was deposited in escrow pending the performance by the buyers under certain contracts. As a result of this transaction we recorded a loss of $3.6 million during 2015. During 2015, before identifying a buyer for Alere Analytics, our management decided to close the business, and in connection with this decision we recorded an impairment charge of $26.7 million during 2015, including the write off of $26.2 million of acquisition-related intangible assets and $0.5 million of fixed assets.
In March 2015, we sold certain assets of our AdnaGen GmbH business, which was part of our professional diagnostics reporting unit and business segment, for approximately $4.6 million in cash proceeds and, as a result of this transaction, we recorded a loss of $0.3 million during 2015.
In March 2015, we sold our Gesellschaft fur Patientenhilfe DGP GmbH subsidiary, which was part of our professional diagnostics reporting unit and business segment, for €7.6 million (approximately $8.2 million at March 31, 2015) and, as a result of this transaction, we recorded a loss on disposition of $7.5 million during 2015.
In December 2014, our management decided to close our Alere Connect, LLC subsidiary located in Scottsdale, Arizona. In connection with this decision, we recorded an impairment charge of $10.8 million, which was offset by a net gain of approximately $3.1 million related to various immaterial business dispositions, resulting in a net $7.7 million impairment loss in 2014. During 2015, in connection with this decision, we recorded impairment charges of $1.1 million, consisting primarily of severance costs, inventory write-offs and other closure-related expenses. See also Note 25 of our consolidated financial statements included elsewhere in this Annual Report on Form 10-K for information on impairment and (gain) loss on dispositions, net.
Interest Expense. Interest expense includes interest charges and the amortization of deferred financing costs and original issue discounts associated with certain debt issuances. Interest expense increased by $7.8 million, or 4%, to $217.0 million for 2015, from $209.2 million for 2014. The increase is principally due to a $19.9 million loss on extinguishment of debt associated with our prior credit facility and 8.625% senior subordinated notes, partially offset by a $11.7 million reduction of interest expense related to our debt refinancing activities during 2015.
Other Income (Expense), Net. Other income (expense), net includes interest income, realized and unrealized foreign exchange gains and losses, and other income and expense. The components and the respective amounts of other income (expense), net are summarized as follows (in thousands):
| 2015 | 2014 | Increase/ (Decrease) |
||||||||||
| Interest income |
$ | 4,446 | $ | 2,391 | $ | 2,055 | ||||||
| Foreign exchange gains (losses), net |
(4,181 | ) | (2,193 | ) | (1,988 | ) | ||||||
| Other, net |
(2,108 | ) | (2,419 | ) | 311 | |||||||
|
|
|
|
|
|
|
|||||||
| Total other income (expense), net |
$ | (1,843 | ) | $ | (2,221 | ) | $ | 378 | ||||
|
|
|
|
|
|
|
|||||||
Interest income is related principally to our cash deposits, including restricted cash. The increase in interest income is largely due to higher cash balances.
Foreign exchange gains (losses), net during 2015 were $(4.2) million compared to $(2.2) million in 2014. The change in foreign exchange gains (losses), net from 2014 to 2015 primarily resulted from the impact of foreign currency translation on intercompany balances.
Other, net of $(2.1) million for 2015 primarily reflected $5.0 million paid in connection with a legal settlement and a $1.2 million loss on disposal of fixed assets, offset in part by $4.1 million in other income. Other, net of $(2.4) million for 2014 primarily reflected a $2.4 million write-off of an investment as a result of the dissolution of the investee.
61
Table of Contents
Provision (Benefit) for Income Taxes. The provision for income taxes decreased by $123.6 million to a $52.7 million benefit in 2015, from a $70.9 million provision in 2014. The effective tax rate in 2015 was 68% compared to a tax rate of (60%) in 2014. The decrease in the provision for income taxes and our tax rates from 2014 to 2015 is primarily related to changes in our jurisdictional mix of income, the tax impact of contingent consideration income, the decrease in pre-tax loss and return-to-provision adjustments.
The primary components of the 2015 benefit for income taxes related to U.S. federal and state income tax benefits from operating losses, the tax impact of contingent consideration income not recognized for tax purposes and certain return-to-provision adjustments. These benefits are partially offset by increased provisions for changes in valuation allowances, U.S. inclusion of foreign earnings and increases in reserves for uncertain tax positions. The primary components of the 2014 provision for income taxes related to our jurisdictional mix of income (loss) and an increase in valuation allowance against U.S. foreign tax credit carryforwards.
In December 2015, Congress signed into law the Protecting Americans from Tax Hikes Act which retroactively extended the U.S. federal research and development credit from January 1, 2015 through December 31, 2015 and permanently extended the credit going forward. As a result, we recognized the retroactive benefit of the 2015 U.S. federal research and development credit of approximately $2.1 million as a discrete item in the fourth quarter of 2015, the period in which the legislation was enacted.
In December 2014, Congress signed into law the Tax Increase Prevention Act of 2014, which retroactively extended the U.S. federal research and development credit from January 1, 2014 through December 31, 2014. As a result, we recognized the retroactive benefit of the 2014 U.S. federal research and development credit of approximately $1.4 million as a discrete item in the fourth quarter of 2014, the period in which the legislation was enacted.
Equity Earnings of Unconsolidated Entities, Net of Tax. Equity earnings of unconsolidated entities are reported net of tax and includes our share of earnings in entities that we account for under the equity method of accounting. Equity earnings of unconsolidated entities, net of tax, for 2015 primarily reflect the following: (i) our 50% interest in SPD in the amount of $14.3 million, and (ii) our 49% interest in TechLab, Inc., or TechLab, in the amount of $1.5 million. Equity earnings of unconsolidated entities, net of tax, for 2014 primarily reflect the following: (i) our 50% interest in SPD in the amount of $16.2 million, and (ii) our 49% interest in TechLab in the amount of $1.6 million. In 2014, we also recognized a $0.4 million loss in connection with the sale of our 40% interest Vedalab S.A. For additional information on SPD and TechLab, see note 20 of our consolidated financial statements included elsewhere in this Annual Report on Form 10-K.
Income from Discontinued Operations, Net of Tax. The results of the health management business are included in income from discontinued operations, net of tax, for all periods presented, given our January 9, 2015 divestiture of this business. The results of ACS are included in income from discontinued operations, net of tax, for 2014, given our October 10, 2014 divestiture of this business. For 2015, discontinued operations generated income, net of tax, of $219.5 million, as compared to income, net of tax, of $138.3 million, for 2014. The income from discontinued operations in 2015 was largely attributable to a $364.9 million pre-tax gain ($222.4 million, net of tax) on the sale of our health management business. The $138.3 million of income, net of tax, for 2014 reflects a $144.8 million tax benefit to record a deferred tax asset relating to the outside basis difference of our health management business, offset by the write down of $18.0 million ($11.2 million, net of tax) of finite-lived intangible assets and $1.1 million ($0.7 million, net of tax) of fixed assets to fair value. Also included in the $138.3 million of income from discontinued operations, net of tax, for 2014 is a gain resulting from the elimination of a $26.3 million ($16.3 million, net of tax) contingent consideration obligation associated with our original purchase of ACS. See Note 3 of our consolidated financial statements included elsewhere in this Annual Report on Form 10-K.
Year Ended December 31, 2014 Compared to Year Ended December 31, 2013
Net Product Sales and Services Revenue. Net product sales and services revenue decreased by $27.2 million, or 1%, to $2.56 billion in 2014, from $2.58 billion in 2013. Excluding the impact of
62
Table of Contents
foreign currency translation, net product sales and services revenue in 2014 decreased by $17.6 million, or 1%, over 2013.
Net Product Sales and Services Revenue by Business Segment. Net product sales and services revenue by business segment for 2014 and 2013 is as follows (in thousands):
| 2014 | 2013 | % Increase (Decrease) |
||||||||||
| Professional diagnostics |
$ | 2,465,140 | $ | 2,495,957 | (1 | )% | ||||||
| Consumer diagnostics |
89,088 | 85,450 | 4 | % | ||||||||
|
|
|
|
|
|||||||||
| Net product sales and services revenue |
$ | 2,554,228 | $ | 2,581,407 | (1 | )% | ||||||
|
|
|
|
|
|||||||||
Professional Diagnostics
The following table summarizes our net product sales and services revenue from our professional diagnostics business segment by groups of similar products and services for 2014 and 2013 (in thousands):
| 2014 | 2013 | % Decrease |
||||||||||
| Cardiometabolic |
$ | 841,905 | $ | 858,781 | (2 | )% | ||||||
| Infectious disease |
721,803 | 729,836 | (1 | )% | ||||||||
| Toxicology |
644,620 | 644,527 | — | % | ||||||||
| Other |
256,812 | 262,814 | (2 | )% | ||||||||
|
|
|
|
|
|||||||||
| Professional diagnostics net product sales and services revenue |
$ | 2,465,140 | $ | 2,495,958 | (1 | )% | ||||||
|
|
|
|
|
|||||||||
Net product sales and services revenue from our professional diagnostics business segment decreased by $30.8 million, or 1%, to $2.46 billion in 2014, from $2.50 billion in 2013. Excluding the impact of foreign currency translation, net product sales and services revenue from our professional diagnostics business segment decreased by $21.3 million, or 1%, comparing 2014 to 2013.
We experienced revenue declines principally in the U.S., where revenue decreased by $64.3 million, or 5%, to $1.31 billion from $1.38 billion. U.S. revenue decreased primarily as a result of a $26.1 million decrease in our U.S. flu-related net product sales, which decreased from $79.1 million during 2013 to $53.0 million during 2014, a $15.5 million, or 10%, decrease in U.S revenues from our mail order diabetes sales, which decreased from $153.0 million during 2013 to $137.5 million during 2014, primarily as a result of a reduction in CMS’s reimbursement rates for those products, which became effective on July 1, 2013, partially offset by a $34.5 million increase from acquisitions of the Liberty and Simplex businesses which are components of our mail order diabetes business, a $13.5 million decrease in INRatio sales, a $3.6 million decrease in Alere Triage meter-based product sales, which decreased to $72.6 million during 2014 from $76.2 million during 2013, and a $37.6 million decrease in toxicology pain management revenue, which were partially offset by a $16.7 million increase in toxicology employer services sales, as well as a $13.7 million increase in patient self-testing revenues. U.S. revenues were further negatively impacted by a $0.3 million decrease in revenue primarily as a result of our 2014 and 2013 dispositions of our Bionote business and Spinreact operations, respectively.
Net product sales and services revenue from international markets for our professional diagnostic business segment increased by $33.5 million, or 3%, to $1.15 billion in 2014 from $1.12 billion in 2013. Higher sales in international markets were driven primarily by a $16.9 million increase in sales of cardiometabolic products, a $16.2 million increase in sales of infectious disease products, principally in Africa, India, and China, including a $7.8 million increase in CD4 sales, which increased from $21.5 million during 2013 to $29.3 million during 2014, an $8.2 million increase in other revenue, primarily related to non-core third-party product sales in Europe and Asia, and a $5.0 million increase in toxicology sales, which were partially offset by a $13.0 million decrease in revenue as a result of 2014 and 2013 dispositions of our Bionote business and our Spinreact operations, respectively.
63
Table of Contents
Within our professional diagnostics business segment, our cardiometabolic net product sales and services revenue decreased by $16.9 million, or 2%, to $841.9 million for 2014, from $858.8 million for 2013, primarily as a result of a $15.5 million decline in our U.S. mail order diabetes business, driven primarily by the reduction in CMS’ reimbursement rates described above which was partially offset by a $34.5 million increase in revenue due to acquisitions of the Liberty and Simplex businesses which are components of our mail order diabetes business and a $13.5 million decline in sales of our Alere INRatio2 PT/INR professional test strip in the U.S. due to a 2014 voluntary recall, which were partially offset by a $13.7 million increase in patient self-testing revenues, principally driven by an increase in our home coagulation monitoring programs resulting from a larger patient population and a simultaneous reduction in customer attrition rates, and a $4.2 million increase from Epoc sales, which increased from $22.7 million during 2013 to $26.8 million during 2014. Infectious disease net product sales and services revenue decreased by $8.0 million, or 1%, to $721.8 million for 2014, from $729.8 million for 2013. The decrease was primarily due to a $26.1 million decrease in our U.S. flu-related net product sales from $79.1 million during 2013 to $53.0 million during 2014, partially offset by an overall increase in our international sales, as discussed above. Toxicology net product sales and services revenue was relatively flat year over year at $644.6 million in 2014 and $644.5 million in 2013, increasing $0.1 million. We experienced a $37.6 million decrease in pain management revenue due to increased pricing pressure and customer insourcing, which was offset by a $16.8 million increase in employer services revenue, a $10.0 million increase in toxicology reagent sales, and an increase in revenue from our government lab services division.
Excluding the impacts of currency translation, acquisitions and dispositions, net product sales and services revenue from our professional diagnostics business segment decreased by $49.3 million, or 2%, comparing 2014 to 2013.
Consumer Diagnostics
Net product sales and services from our consumer diagnostics business segment increased by $3.6 million, or 4%, to $89.1 million for 2014 from $85.5 million for 2013. Most of our consumer diagnostics revenue was attributable to sales to SPD under our long-term manufacturing service agreement, and the increase in revenue is largely attributable to the increase in sales to SPD. Consumer diagnostics revenue in the United States was flat in 2014 and 2013, at approximately $51.0 million in both periods, and increased by $3.0 million in international markets to $37.5 million in 2014 as compared to $34.5 million in 2013.
License and Royalty Revenue. License and royalty revenue represents license and royalty fees from intellectual property license agreements with third parties. License and royalty revenue decreased by $6.2 million, or 23%, to $21.1 million for 2014, from $27.2 million for 2013. The decrease in royalty revenue for 2014, compared to 2013, is primarily a result of lower royalties earned under existing licensing agreements. Included in royalty revenue in 2013 was an $8.5 million one-time, upfront issuance fee associated with the license of certain of our molecular intellectual property.
Net Revenue by Geographic Location. Net revenue by geographic location for 2014 and 2013 is as follows (in thousands):
| 2014 | 2013 | % Increase (Decrease) |
||||||||||
| United States |
$ | 1,366,739 | $ | 1,446,411 | (6 | )% | ||||||
| Europe |
533,116 | 506,760 | 5 | % | ||||||||
| Elsewhere |
675,423 | 655,465 | 3 | % | ||||||||
|
|
|
|
|
|||||||||
| $ | 2,575,278 | $ | 2,608,636 | (1 | )% | |||||||
|
|
|
|
|
|||||||||
Net revenue of $1.4 billion and $1.4 billion generated in the U.S. was approximately 53% and 55% of total revenue for each of 2014 and 2013, respectively. The decrease in total net revenue in 2014 was principally the result of the decrease in revenue from the professional diagnostics business segment in the U.S., as described above.
64
Table of Contents
Gross Profit and Margin Percentage. Gross profit decreased by $99.9 million, or 8%, to $1.2 billion for 2014, from $1.3 billion for 2013. The decrease in gross profit during 2014, compared to 2013, was largely attributed to the decrease in net product sales and services revenue principally resulting from lower toxicology pain management revenues, as discussed above, weak U.S. flu-related sales, a continued weakness in U.S. healthcare utilization, which impacted our U.S. infectious disease revenue, lower revenues from INRatio sales (which includes decreased sales of INRatio monitors and INRatio2 test strips, the latter of which was due to two recalls), a decline in U.S. mail order diabetes revenue attributable to the reduction in CMS’ reimbursement rates described above, coupled with the impact of a recall of certain Triage BNP Calibrators during 2014. These recalls of INRatio2 test strips and Triage BNP Calibrators included revenue and cost of sales charges totaling $7.5 million during 2014.
Cost of net revenue included amortization expense of $64.5 million and $68.1 million for 2014 and 2013, respectively, and $2.5 million of non-cash charges relating to the write-up of inventory to fair value in connection with certain acquisitions during 2013. Reducing gross profit for 2014 and 2013 was $11.8 million and $6.1 million, respectively, in restructuring charges, which included $7.0 million in fixed asset and inventory impairments, $3.3 million of severance-related costs and $1.5 million in facility and transition costs for 2014, and $2.5 million of severance-related costs, $2.3 million in facility and transition costs and $1.3 million in fixed asset, intangible asset and inventory impairments for 2013.
Overall gross margin for 2014 was 47%, as compared to 50% for 2013. The lower gross margin in 2014 principally reflects decreased toxicology pain management revenues, weak U.S. flu related sales, the impact of the reduced mail order diabetes reimbursement rates noted above, lower revenues from INRatio sales (which includes decreased sales of INRatio monitors and INRatio2 test strips, the latter of which was due to two recalls), as well as revenue and cost of sales charges of $7.5 million incurred in the second quarter of 2014 in connection with our two recalls of INRatio2 test strips and our recall of certain Triage BNP Calibrators.
Gross Profit from Net Product Sales and Services Revenue, Total and by Business Segment. Gross profit from net product sales and services revenue decreased by $101.9 million, or 8%, to $1.2 billion in 2014, from $1.3 billion in 2013. Gross profit from net product sales and services revenue by business segment for 2014 and 2013 is as follows (in thousands):
| 2014 | 2013 | % Increase (Decrease) |
||||||||||
| Professional diagnostics |
$ | 1,185,551 | $ | 1,282,599 | (8 | )% | ||||||
| Consumer diagnostics |
11,229 | 10,048 | 12 | % | ||||||||
|
|
|
|
|
|||||||||
| Gross profit from net product sales and services revenue |
$ | 1,196,780 | $ | 1,292,647 | (7 | )% | ||||||
|
|
|
|
|
|||||||||
Professional Diagnostics
Gross profit from our professional diagnostics net product sales and services revenue decreased by $97.0 million, or 8%, to $1.2 billion for 2014, compared to $1.3 billion for 2013. The lower gross profit for 2014 principally reflects lower revenues from INRatio sales during 2014 compared to 2013 (which includes decreased sales of INRatio monitors and INRatio2 test strips, the latter of which was due to two recalls), lower toxicology pain management revenues, lower U.S. flu-related sales and reduced mail order diabetes reimbursement rates. Cost of professional diagnostics net product sales and services revenue during 2013 included a non-cash charge of $2.5 million relating to the write-up of inventory to fair value in connection with certain acquisitions. Reducing gross profit during 2014 and 2013 was $11.8 million and $6.1 million, respectively, in restructuring charges.
Cost of professional diagnostics net product sales and services revenue included amortization expense of $64.3 million and $67.2 million for 2014 and 2013, respectively.
65
Table of Contents
As a percentage of our professional diagnostics net product sales and services revenue, gross profit from our professional diagnostics business for 2014 was 48%, as compared to 52% for 2013. The lower gross margin in 2014 principally reflects decreased toxicology pain management revenues, lower U.S. flu related sales, reduced mail order diabetes reimbursement rates, lower revenues from INRatio sales (which includes decreased sales of INRatio monitors and INRatio2 test strips, the latter was due to two recalls), a continued weakness in U.S. healthcare utilization, coupled with the impact of our recall of certain Triage BNP Calibrators, as compared to 2013.
Consumer Diagnostics
Gross profit from our consumer diagnostics net product sales and services revenue increased $1.2 million, or 12%, to $11.2 million during 2014, from $10.0 million in 2013. The increase in gross profit was primarily the result of an increase in manufacturing revenue associated with SPD, as discussed above.
Cost of consumer diagnostics net product sales and services revenue included amortization expense of $0.2 million and $0.9 million for 2014 and 2013, respectively.
As a percentage of our consumer diagnostics net product sales and services revenue, gross profit from our consumer diagnostics business was 13% for 2014, as compared to 12% in 2013.
Research and Development Expense. Research and development expense decreased by $14.2 million, or 9%, to $144.8 million in 2014, from $159.1 million in 2013. Research and development expense during 2014 is reported net of grant funding of $9.5 million arising from the research and development funding relationship with the Bill and Melinda Gates Foundation that we entered into in February 2013 and $0.4 million of funding related to our contract with BARDA that we entered into in September 2014. For additional information on the agreements with BARDA and the Gates Foundation, including the April 2016 agreement to mutually terminate the February 2013 grant and the February 2013 loan agreement with the Gates Foundation, see Note 19 to the consolidated financial statements elsewhere in this Annual Report on Form 10-K. Restructuring charges associated with our various restructuring plans to integrate our acquired businesses totaling $9.8 million and $1.8 million were included in research and development expense during 2014 and 2013, respectively. Amortization expense of $6.5 million and $4.9 million was included in research and development expense for 2014 and 2013, respectively.
Research and development expense as a percentage of net revenue was 6% for each of 2014 and 2013.
Sales and Marketing Expense. Sales and marketing expense decreased by $53.2 million, or 9%, to $513.0 million for 2014, from $566.1 million for 2013. The decrease in sales and marketing expense was primarily driven by lower amortization expense related to customer relationship intangibles during 2014, compared to 2013, as the underlying economic benefit of the intangibles is declining. Amortization expense of $154.4 million and $197.1 million was included in sales and marketing expense for 2014 and 2013, respectively. Restructuring charges associated with our cost reduction plans totaling $11.4 million and $1.6 million were included in sales and marketing expense for 2014 and 2013, respectively.
Sales and marketing expense as a percentage of net revenue was 20% and 22% for 2014 and 2013, respectively.
General and Administrative Expense. General and administrative expense increased by $18.4 million, or 4%, to $453.6 million for 2014, from $435.2 million for 2013. The increase was primarily attributable to the inclusion in general and administrative expense for 2014 of $26.6 million of costs associated with potential business dispositions, which primarily related to an initial public offering in the United Kingdom proposed in early 2014 and subsequently abandoned and the divestiture of our
66
Table of Contents
health management business, as compared to $6.1 million during 2013, and a $20.8 million increase in charges associated with our restructuring plans. These increased expenses were partially offset by a $1.8 million decrease in expense recorded for fair value adjustments to acquisition-related contingent consideration, $5.6 million of costs associated with our 2013 proxy contest, an $8.8 million decrease in stock-based compensation expense, and a $2.2 million decrease in acquisition-related costs.
General and administrative expense as a percentage of net revenue was 18% and 17% for 2014 and 2013, respectively.
Impairment and (Gain) Loss on Dispositions, Net. In December 2014, our management decided to close our Alere Connect, LLC subsidiary located in Scottsdale, Arizona. In connection with this decision, we recorded an impairment charge of $10.8 million, which was offset by a net gain of approximately $3.1 million related to various immaterial business dispositions, resulting in a net $7.7 million impairment loss in 2014.
In July 2013, we sold our Spinreact operations located in Spain for $33.4 million in proceeds and, as a result of this transaction, we recorded a loss on disposition of $5.1 million during 2013. The financial results for our Spinreact operations are immaterial to our consolidated financial results.
See Note 25 of our consolidated financial statements included elsewhere in this Annual Report on Form 10-K for information on impairment and (gain) loss on dispositions, net.
Interest Expense. Interest expense includes interest charges and the amortization of deferred financing costs and original issue discounts associated with certain debt issuances. Interest expense decreased by $46.2 million, or 18%, to $209.2 million for 2014, from $255.3 million for 2013. The decrease is principally due to a $35.6 million loss recorded in connection with the repurchase of our 9% senior subordinated notes during 2013. Also contributing to the decrease was the lower interest rate associated with our 6.5% senior subordinated notes issued in May 2013, compared to the interest rate associated with our 9% senior subordinated notes which we redeemed in the second quarter of 2013.
Other Income (Expense), Net. Other income (expense), net includes interest income, realized and unrealized foreign exchange gains and losses, and other income and expense. The components and the respective amounts of other income (expense), net are summarized as follows (in thousands):
| 2014 | 2013 | Increase/ (Decrease) |
||||||||||
| Interest income |
$ | 2,391 | $ | 3,168 | $ | (777 | ) | |||||
| Foreign exchange gains (losses), net |
(2,193 | ) | (4,010 | ) | 1,817 | |||||||
| Other, net |
(2,419 | ) | (10,418 | ) | 7,999 | |||||||
|
|
|
|
|
|
|
|||||||
| Total other income (expense), net |
$ | (2,221 | ) | $ | (11,260 | ) | $ | 9,039 | ||||
|
|
|
|
|
|
|
|||||||
Interest income is related principally to our cash deposits, including restricted cash. The decease in interest income is largely due to lower cash balances.
Other expense of $2.4 million for 2014 primarily reflected a $2.4 million write-off of an investment as a result of the dissolution of the investee.
Other expense of $10.4 million for 2013 is primarily comprised of $11.8 million of expense associated with various legal settlements, which includes a provision of $9.5 million to reflect our estimate of the settlement and litigation costs we expected to incur in connection with a dispute with a customer in our U.S. toxicology business, a $5.1 million write-off of an investment and $3.3 million in losses on disposals of fixed assets, with an offsetting $8.0 million bargain purchase gain relating to our acquisition of the Liberty business. The legal settlement associated with the $9.5 million provision was settled in 2014 for $8.0 million.
67
Table of Contents
Provision (Benefit) for Income Taxes. The provision for income taxes increased by $115.6 million to a $70.9 million provision in 2014 from a $44.7 million benefit in 2013. In 2014 we had an effective tax rate of (60%), compared to a tax rate of 37% in 2013. The increase in the provision for income taxes from 2013 to 2014 is primarily related to our jurisdictional mix of income and loss and an increase in valuation allowance against U.S. foreign tax credit carryforwards.
The primary components of the 2014 provision for income taxes related to U.S. federal and foreign income taxes, including a $44.4 million increase in valuation allowance against U.S. foreign tax credit carryforwards. The primary components of the 2013 benefit for income taxes related to U.S. federal and foreign income tax benefits, including tax rate changes in foreign jurisdictions, U.S. research credits for 2012 and 2013, the U.S. manufacturing deduction, and the impact of the bargain purchase gain. These benefits are more than offset by increased provisions for changes in valuation allowances, contingent consideration losses not deductible for tax purposes, U.S. tax on foreign income from distributions during 2013 and increases in reserves for uncertain tax positions.
In December 2014, Congress signed into law the Tax Increase Prevention Act of 2014, which retroactively extended the U.S. federal research and development credit from January 1, 2014 through December 31, 2014. As a result, we recognized the retroactive benefit of the 2014 U.S. federal research and development credit of approximately $1.4 million as a discrete item in the fourth quarter of 2014, the period in which the legislation was enacted.
Equity Earnings of Unconsolidated Entities, Net of Tax. Equity earnings of unconsolidated entities are reported net of tax and includes our share of earnings in entities that we account for under the equity method of accounting. Equity earnings of unconsolidated entities, net of tax, for 2014 primarily reflect the following: (i) our 50% interest in SPD in the amount of $16.2 million, and (ii) our 49% interest in TechLab in the amount of $1.6 million. Loss on sale of our 40% interest in Vedalab S.A., or Vedalab, in 2014 was in the amount of $0.4 million. Equity earnings of unconsolidated entities, net of tax, for 2013 primarily reflect the following: (i) our 50% interest in SPD in the amount of $15.0 million, (ii) our 49% interest in TechLab in the amount of $2.0 million and (iii) our 40% interest in Vedalab in the amount of $0.6 million.
For additional information on SPD and TechLab, see note 20 of our consolidated financial statements included elsewhere in this Annual Report on Form 10-K.
Income (Loss) from Discontinued Operations, Net of Tax. The results of the health management business are included in income from discontinued operations, net of tax, for all periods presented, given our January 9, 2015 divestiture of this business. The results of ACS are included in income from discontinued operations, net of tax, for 2014, given our October 10, 2014 divestiture of this business. For 2014, the discontinued operations generated income, net of tax, of $138.3 million, as compared to a loss, net of tax, of $16.1 million for 2013. The $138.3 million of income, net of tax, for 2014 reflects a $144.8 million tax benefit to record a deferred tax asset relating to the outside basis difference of our health management business, offset by the write down of $18.0 million ($11.2 million, net of tax) of finite-lived intangible assets and $1.1 million ($0.7 million, net of tax) of fixed assets to fair value. Also included in the $138.3 million of income from discontinued operations, net of tax, is a gain resulting from the elimination of a $26.3 million ($16.3 million, net of tax) contingent consideration obligation associated with our original purchase of ACS. See Note 3 of our consolidated financial statements included elsewhere in this Annual Report on Form 10-K.
Liquidity and Capital Resources
Based upon our current working capital position, current operating plans and expected business conditions, we expect to fund our short and long-term working capital needs primarily using existing cash and our operating cash flow. As of May 31, 2016 and June 30, 2016, we had approximately $3.0 billion of indebtedness outstanding. As our various debt instruments mature over the next several years, we may need or want to re-finance some or all this indebtedness with new debt, including
68
Table of Contents
potential borrowings under our revolving credit facility, in order to preserve our existing cash for other uses, including to continue to fund our operations. During 2015, we generated net cash proceeds of $675.8 million from divestitures, net of cash divested, and used $690.0 million of our cash to reduce our outstanding indebtedness under our current and prior credit facilities. In May 2016, we paid approximately $152.0 million in cash to satisfy the principal and interest due under our 3% convertible senior subordinated notes, which matured on May 15, 2016 (of which amount $125.0 million was drawn under our revolving credit facility and $27.0 million was paid using available cash). Additionally, we may divest one or more of our businesses in accordance with the covenants under the Merger Agreement with Abbott and we expect that, if and when completed, we will use all or a portion of the net proceeds of such divestitures to fund our working capital, operations, research and development or to reduce our outstanding debt, among other purposes, in each case to the extent permitted under the Merger Agreement and in accordance with our secured credit facility and the indentures governing our notes. As of December 31, 2015, we had $502.2 million of cash and cash equivalents, of which $166.6 million was held by domestic subsidiaries and $335.6 million was held by foreign entities. We do not currently plan to repatriate cash held by most of our foreign entities if there are adverse tax implications, including incremental U.S. tax liabilities and potential foreign withholding tax liabilities. If circumstances were to change, however, we may be required to repatriate all or a portion of the cash held by foreign entities, which could result in the payment of significant tax liabilities. As of June 30, 2016, we had $506.2 million of cash and cash equivalents, of which $60.0 million was held by domestic subsidiaries and $446.1 million was held by foreign entities.
We may also utilize amounts available under our secured credit facility, as described below, or other new sources of financing to fund a portion of our capital expenditures, contractual contingent consideration obligations, other commitments, the refinancing of existing indebtedness and future acquisitions. New sources of financing may not be available on acceptable terms, or at all, and we may be required to obtain certain consents in connection with completing such financings, which we may not be able to obtain on acceptable terms or at all.
On June 18, 2015, we entered into a new secured credit facility, which initially provided for term loan facilities totaling $1.7 billion (consisting of $650 million of “A” term loans and $1.05 billion of “B” term loans), all of which were drawn at closing, and, subject to our continued compliance with the secured credit facility, a $250.0 million revolving credit facility (which includes a $50.0 million sublimit for the issuance of letters of credit). No amount was drawn under the revolving credit facility as of December 31, 2015 (and $125.0 million was drawn under the revolving credit facility in May 2016).
We used approximately $1.68 billion of the proceeds of the term loans drawn at closing to repay in full all indebtedness outstanding under our prior credit facility, whereupon that facility was terminated, and to pay various fees and expenses associated with the transactions contemplated by the new secured credit facility.
In November 2015 we used $115.0 million of the net cash proceeds from our sale of the BBI business (which represented all of the net proceeds from the closing of the sale prior to giving effect to the final working capital adjustment) to repay $115.0 million in aggregate principal amount of outstanding “A” term loans and “B” term loans under the secured credit facility.
We must repay the “A” term loans in nineteen consecutive quarterly installments, which began on September 30, 2015 and continue through March 31, 2020, followed by a final installment on June 18, 2020; the principal amount of the installment we paid on September 30, 2015 was $8,125,000, and, giving effect to the prepayment of a portion of the “A” term loans in connection with our sale of the BBI business, the principal amount of each subsequent installment through March 31, 2020 is approximately $7,572,000, and the principal amount of the final installment is approximately $461,882,000. We must repay the “B” term loans in twenty-seven consecutive quarterly installments, which began on September 30, 2015 and continue through March 31, 2022, followed by a final installment on June 18, 2022; the principal amount of the installment we paid on September 30, 2015
69
Table of Contents
was $2,625,000, and, giving effect to the prepayment of a portion of the “B” term loans in connection with our sale of the BBI business, the principal amount of each subsequent installment through March 31, 2022 is approximately $2,446,000, and the principal amount of the final installment is approximately $912,471,000. We may repay any borrowings under the revolving credit facility at any time (without any premium or penalty, other than customary LIBOR breakage costs, if applicable), but in no event later than June 18, 2020.
On June 24, 2015, we issued $425.0 million aggregate principal amount of our 6.375% senior subordinated notes due 2023, which we refer to as our 6.375% senior subordinated notes. Interest on the 6.375% senior subordinated notes is payable semi-annually on January 1 and July 1 of each year, beginning on January 1, 2016, and the 6.375% senior subordinated notes will mature on July 1, 2023 unless earlier redeemed. We received net proceeds from the sale of our 6.375% senior subordinated notes, after the initial purchasers’ discount and offering expenses, of approximately $417.3 million.
On June 24, 2015, we issued a notice of optional redemption to the holders of our 8.625% senior subordinated notes, or the 8.625% senior subordinated notes, and, on October 1, 2015, the redemption date, we redeemed the entire principal amount of the 8.625% senior subordinated notes then outstanding at a redemption price equal to 102.156% of the principal amount of the 8.625% senior subordinated notes to be redeemed plus accrued and unpaid interest from April 1, 2015 to (but excluding) the redemption date. An amount equal to the net proceeds received from the 6.375% senior subordinated notes of $417.3 million plus additional cash of $8.6 million, or a total of $425.9 million, was used to fund the redemption of the 8.625% senior subordinated notes on the redemption date. Upon settlement of the redemption on the redemption date, we satisfied and discharged all of our obligations with respect to the 8.625% senior subordinated notes.
As of December 31, 2015, we had $3.1 billion in aggregate principal amount of outstanding indebtedness, including $1.6 billion in aggregate principal amount outstanding under our secured credit facility, $450.0 million in aggregate outstanding principal amount of our 7.25% senior notes due 2018, $425.0 million in aggregate outstanding principal amount of our 6.5% senior subordinated notes due 2020, $425.0 million in aggregate outstanding principal amount of our 6.375% senior subordinated notes due 2023 and $150.0 million in aggregate outstanding principal amount of our 3% convertible senior subordinated notes due 2016. As noted above, the 3% convertible senior subordinated notes matured on May 15, 2016, and we used $125.0 million of cash drawn under our revolving credit facility plus $27.0 million of available cash to pay the $152.0 million of outstanding principal and accrued interest due under the notes. The terms and conditions of our outstanding debt instruments contain covenants that expressly restrict our ability to incur additional indebtedness and conduct other financings, subject to certain exceptions. In addition, the Merger Agreement with Abbott contains restrictions on our ability to incur additional indebtedness and conduct other financings, subject to certain exceptions.
We were delayed in filing this Annual Report on Form 10-K and our Quarterly Report on Form 10-Q for the quarter ended March 31, 2016 in connection with our previously announced review of revenue recognition, for the years ended December 31, 2013, 2014 and 2015 (and each of the interim periods in 2014 and the first three quarters of 2015). In order to avoid events of default under our secured credit facility and the indentures governing our 7.25% senior notes, our 6.5% senior subordinated notes and our 6.375% senior subordinated notes, we entered into an amendment to our Credit Agreement and obtained consents from the requisite holders of such notes to obtain an extension for filing of this Annual Report on Form 10-K and our Quarterly Report on Form 10-Q for the quarter ended March 31, 2016 with the SEC and furnishing such financial information and certain related deliverables to the holders of such debt.
On April 22, 2016, we and the requisite lenders under the Credit Agreement entered into an amendment to the Credit Agreement, or the April 2016 Amendment. Pursuant to the April 2016 Amendment, these lenders agreed to (i) waive certain Defaults and Events of Defaults (each as defined in the Credit Agreement) that may have occurred, are occurring or will occur, resulting from, among other things, (x) our failure to deliver to the Administrative Agents (as defined in the Credit
70
Table of Contents
Agreement) the financial statements and certain related deliverables for 2015 by the applicable deadline under the Credit Agreement, (y) any restatement of certain financial statements as a result of our incorrect application of revenue recognition principles for 2013, 2014 and 2015, or (z) any breach of any representation or affirmative covenant as a result of certain deliverables being incorrect when delivered, which breach is discovered as part of the audit of our financial statements for 2015, to the extent that such breach is due to our incorrect application of revenue recognition principles for 2013, 2014 and 2015, and (ii) extend the deadlines for delivery of the financial statements for 2015, the financial statements for the quarter ended March 31, 2016 and certain related deliverables. Under the terms of this amendment, we are required to deliver our unaudited financial statements for the three months ended March 31, 2016 and certain related deliverables on or before August 18, 2016, and our failure to do so could give rise to an Event of Default under the Credit Agreement. In connection with this amendment, we paid, among other fees and expenses, to each consenting lender aggregate consent fees of 0.250% of the sum of (i) the aggregate principal amount of such lender’s Term Loans outstanding on the effective date of the amendment and (ii) such lender’s Revolving Credit Commitment (each as defined in the Credit Agreement) outstanding on the effective date of the amendment, or approximately $4.5 million in the aggregate for all consenting lenders. The amendment also increases the applicable interest rate margins for all loans outstanding under our secured credit facility by 0.25% per annum for the period from July 1, 2016 to the date of delivery of such financial reports and related deliverables under our secured credit facility.
In addition, on April 29, 2016, we commenced consent solicitations relating to our 6.5% senior subordinated notes, 6.375% senior subordinated notes and 7.25% senior notes, which we refer to collectively as the Notes. The consent solicitations were made to holders of record of the Notes as of April 28, 2016, and such solicitations were completed on May 9, 2016. Pursuant to the consent solicitations, the requisite holders of each series of Notes agreed to extend the deadline for delivery of certain financial information and to waive, through and until 5:00 p.m., New York City time, on August 31, 2016, any default or event of default that occurred, is continuing or may occur under the indentures under which the Notes were issued (and its consequences) in connection with any failure to timely file with the SEC or to timely furnish to the relevant trustees pursuant to the indentures, this Annual Report on Form 10-K and our subsequent Quarterly Reports on Form 10-Q, or the Failures to File. In connection with the Failures to File, we paid, in May and July 2016, to each holder of Notes who validly delivered a consent aggregate cash payments equal to $15.00 for each $1,000 aggregate principal amount of such holder’s Notes, or an aggregate of $19.2 million.
Our indebtedness outstanding at June 30, 2016 matures at various times between 2018 and 2023. As noted above, in May 2016, we paid approximately $152.0 million in cash to satisfy the principal and interest due under our 3% convertible senior subordinated notes, which matured on May 15, 2016. We may not have sufficient cash resources at the time of maturity of our remaining indebtedness to pay the aggregate principal and accrued interest under such indebtedness. If the capital and credit markets experience volatility or the availability of funds is limited, we may be unable to re-finance this debt on commercially reasonable terms, including because of increased costs associated with issuing debt instruments, or at all. In addition, it is possible that our ability to access the capital and credit markets could be limited by the amount of our indebtedness or other factors at a time when we would like, or need, to do so, which could have an adverse impact on our ability to refinance maturing debt and/or react to changing economic and business conditions.
Our funding plans for our working capital needs and other commitments may be adversely impacted if our underlying assumed revenues and expenses are not realized. In particular, we could experience decreased product sales or lower average selling prices, unexpected costs associated with our potential divestitures, operational integration efforts, core research and development projects, cost- saving initiatives and existing or unforeseen lawsuits, regulatory actions, governmental investigations, or other claims against us. We may also choose to make significant investment to pursue legal remedies against potential infringers of our intellectual property rights. If we decide to engage in such
71
Table of Contents
activities, or if our operating results fail to meet our expectations, we could be required to seek additional funding through public or private financings or other arrangements. In such event, adequate funds may not be available when needed or may be available only on terms which could have a negative impact on our business and results of operations. In addition, if we raise additional funds by issuing equity or convertible securities, dilution to then-existing stockholders may result. In connection with any such financing, we may be required to obtain consents from the requisite lenders under our secured credit facility and/or the requisite holders of our outstanding notes or from Abbott pursuant to the Merger Agreement, and there is no guarantee we will be able to obtain those consents.
Cash Flow Summary (in thousands)
| Year Ended December 31, | ||||||||||||
| 2015 | 2014 | 2013 | ||||||||||
| Net cash flows from operating activities: |
||||||||||||
| Continuing operations |
$ | 206,964 | $ | 188,055 | $ | 174,668 | ||||||
| Discontinued operations |
318 | 43,468 | 69,232 | |||||||||
|
|
|
|
|
|
|
|||||||
| Net cash provided by operating activities |
207,282 | 231,523 | 243,900 | |||||||||
|
|
|
|
|
|
|
|||||||
| Net cash flows from investing activities: |
||||||||||||
| Continuing operations |
537,728 | (48,231 | ) | (230,483 | ) | |||||||
| Discontinued operations |
(209 | ) | (8,972 | ) | (26,963 | ) | ||||||
|
|
|
|
|
|
|
|||||||
| Net cash provided by (used in) investing activities |
537,519 | (57,203 | ) | (257,446 | ) | |||||||
|
|
|
|
|
|
|
|||||||
| Net cash flows from financing activities: |
||||||||||||
| Continuing operations |
(632,907 | ) | (116,684 | ) | 51,824 | |||||||
| Discontinued operations |
(76 | ) | (1,471 | ) | (2,833 | ) | ||||||
|
|
|
|
|
|
|
|||||||
| Net cash provided by (used in) financing activities |
(632,983 | ) | (118,155 | ) | 48,991 | |||||||
|
|
|
|
|
|
|
|||||||
| Foreign exchange effect on cash and cash equivalents |
(11,379 | ) | (16,312 | ) | (1,871 | ) | ||||||
|
|
|
|
|
|
|
|||||||
| Net increase in cash and cash equivalents |
100,439 | 39,853 | 33,574 | |||||||||
| Cash and cash equivalents, beginning of period — continuing operations |
378,461 | 355,431 | 316,479 | |||||||||
| Cash and cash equivalents, beginning of period — discontinued operations |
23,300 | 6,477 | 11,855 | |||||||||
|
|
|
|
|
|
|
|||||||
| Cash and cash equivalents, end of period |
502,200 | 401,761 | 361,908 | |||||||||
| Less: Cash and cash equivalents of discontinued operations, end of period |
— | 23,300 | 6,477 | |||||||||
|
|
|
|
|
|
|
|||||||
| Cash and cash equivalents of continuing operations, end of period |
$ | 502,200 | $ | 378,461 | $ | 355,431 | ||||||
|
|
|
|
|
|
|
|||||||
72
Table of Contents
Summary of Changes in Cash Position
As of December 31, 2015, we had cash and cash equivalents of continuing operations of $502.2 million, a $123.7 million increase from December 31, 2014. Our primary sources of cash for continuing operations during 2015 included $2.2 billion from the issuance of long-term debt (which included amounts received under the secured credit facility entered into in June 2015 and $425.0 million of gross proceeds received in connection with the issuance of our 6.375% senior subordinated notes), $675.8 million received from dispositions, net of cash divested, $207.0 million generated by our continuing operating activities, $79.2 million of cash received from common stock issuances under employee stock option and stock purchase plans, $26.1 million received from equity method investments, $2.1 million in proceeds from the sale of property and equipment and $1.5 million in proceeds from the issuance of short-term debt. Our primary uses of cash for our continuing operations during 2015 were $2.7 billion related to the repayment of long-term debt obligations (which included $1.68 billion to repay our prior credit facility, $425.9 million to redeem our 8.625% senior subordinated notes, and additional amounts to prepay a portion of the term loans under our existing credit facility), $127.5 million related to net payments under revolving credit facilities, $90.8 million of capital expenditures, $60.1 million paid for an acquisition, $25.6 million related to the repayment of short-term debt obligations, $21.3 million for cash dividends paid on our Series B preferred stock, $16.2 million paid for financing costs, $14.2 million related to payments of acquisition-related contingent consideration obligations, a $13.7 million increase in restricted cash, $8.6 million related to a call premium incurred in connection with our redemption of our 8.625% senior subordinated notes, $5.6 million for principal payments on our capital lease obligations, and $1.8 million from an increase in other assets. Fluctuations in foreign currencies unfavorably impacted our cash balance by $11.4 million during 2015.
As of December 31, 2014, we had cash and cash equivalents of continuing operations of $378.5 million, a $23.0 million increase from December 31, 2013. Our primary sources of cash for continuing operations during 2014 included $188.1 million generated by our continuing operating activities, $51.6 million of cash received from common stock issuances under employee stock option and stock purchase plans, $45.1 million received from dispositions, net of cash divested, $9.5 million received from investments, of which $9.7 million is from the sale of our 40% equity investment in Vedalab, $1.5 million in proceeds from the sale of property and equipment and $1.0 million from a decrease in other assets. Our primary uses of cash for our continuing operations during 2014 were $100.6 million of capital expenditures, $65.1 million related to the repayment of long-term debt obligations, $42.5 million related to net payments under revolving credit facilities, $32.9 million related to payments of acquisition-related contingent consideration obligations, $21.3 million for cash dividends paid on our Series B Preferred Stock, a $5.4 million increase in our restricted cash balance, $6.1 million for principal payments on our capital lease obligations and $1.5 million paid for financing costs. Fluctuations in foreign currencies unfavorably impacted our cash balance by $16.3 million during 2014. Our discontinued operations contributed $33.0 million of cash during 2014.
As of December 31, 2013, we had cash and cash equivalents of continuing operations of $355.4 million, an increase of $38.9 million from December 31, 2012. Our primary sources of cash for our continuing operations during 2013 included $174.7 million generated by our continuing operating activities, $459.0 million of net proceeds received in connection with long-term debt issuances, which included $425.0 million of gross proceeds received in connection with the issuance of our 6.5% senior subordinated notes, $139.0 million of net proceeds under various revolving credit facilities, which included $190.0 million borrowed against our secured credit facility revolving line-of-credit, $29.0 million received from the disposition of our Spinreact operations, $14.7 million related to a decrease in other assets, $20.9 million of cash received from common stock issuances under employee stock option and stock purchase plans, $29.3 million return of capital related to an equity investment and $3.6 million in proceeds from the sale of property and equipment. Our primary uses of cash for our continuing operations during 2013 were $470.6 million of cash payments on long-term debt, which included $400.0 million of cash payments related to the repurchase of our 9% senior
73
Table of Contents
subordinated notes, $176.1 million net cash paid for acquisitions, $99.9 million of capital expenditures, $31.2 million related to an increase in restricted cash, $40.1 million related to payments of acquisition-related contingent consideration obligations, $19.0 million related to tender offer consideration and call premium incurred in connection with the repurchase of our 9% senior subordinated notes, $21.3 million for cash dividends paid on our Series B preferred stock, $9.8 million related to the payment of debt- related financing costs and $6.5 million for payment of capital lease obligations. Fluctuations in foreign currencies unfavorably impacted our cash balance by $1.9 million during 2013. Our discontinued operations contributed $39.4 million of cash during 2013.
Cash Flows from Operating Activities
Net cash provided by continuing operations during 2015 was $207.0 million, which resulted from $296.1 million of non-cash items and investing and financing-related items included in net income, offset by $76.4 million of cash used to meet working capital needs during the period and a loss from continuing operations of $12.8 million. The $296.1 million of non-cash items and investing and financing-related items included in net income included $309.3 million related to depreciation and amortization, a $50.5 million loss related to impairment and net loss on dispositions, which reflects both a $27.8 million impairment charge associated with a closed business and a $22.7 million net loss from business dispositions, $26.4 million related to non-cash stock-based compensation, a $19.9 million loss on the extinguishment of debt, a $15.6 million inventory impairment, of which $15.3 million is related to the July 2016 announcement of our voluntary withdrawal of the INRatio and INRatio2 products from the market, $12.8 million of non-cash interest expense related to the amortization of deferred financing costs and original issue discounts, $28.8 million related to other non-cash items, including $19.6 million related to the July 2016 announcement of our voluntary withdrawal of the INRatio and INRatio2 products from the market, a $3.9 million loss on the disposition of fixed assets, a $3.7 million fixed asset impairment of which $2.9 million is related to the July 2016 announcement of our voluntary withdrawal of the INRatio and INRatio2 products from the market, partially offset by a $99.4 million gain related to changes in our deferred income taxes, which resulted in part from amortization of intangible assets, a $59.9 million non-cash change in fair value of contingent purchase price consideration, and $15.5 million in equity earnings of unconsolidated entities, net of tax. In addition, $0.3 million of net cash was provided by discontinued operations for operating activities.
Net cash provided by continuing operating activities during 2014 was $188.1 million, which resulted from a loss from continuing operations of $171.8 million, and $46.6 million of cash used to meet working capital needs during the period, offset by an aggregate of $406.4 million of non-cash items and investing and financing-related items included in net income. The $406.4 million of non-cash items and investing and financing-related items included in net income included $336.0 million related to depreciation and amortization, $16.2 million of interest expense related to the amortization of deferred financing costs and original issue discounts, $12.5 million related to non-cash stock-based compensation, $12.3 million related to changes in deferred income taxes, which resulted in part from amortization of intangible assets, $9.8 million of tax benefit related to discontinued operations retained by us, a $7.7 million non-cash change in fair value of contingent purchase price consideration, a $7.7 million loss related to impairment and net loss on dispositions, which reflects both a $10.7 million impairment charge associated with a closed business and a $3.0 million net gain from business dispositions, $7.0 million of impairment of long-lived assets, a $6.5 million loss on the disposition of fixed assets, and a $3.1 million loss on inventory disposal and $5.0 million related to other non-cash items, partially offset by $17.5 million in equity earnings of unconsolidated entities, net of tax. In addition, $43.5 million of net cash was provided by discontinued operations for operating activities.
Net cash provided by continuing operating activities during 2013 was $174.7 million, which resulted from a loss from continuing operations of $57.9 million and $122.3 million of cash used to meet net working capital requirements during the year, offset by $354.9 million of non-cash items and investing and financing-related amounts included in net income. The $354.9 million of non-cash items and investing and financing related amounts included in net income included, among other items,
74
Table of Contents
$374.6 million related to depreciation and amortization, $35.6 million related to a loss on extinguishment of debt, $21.2 million related to non-cash stock-based compensation, a $19.3 million non-cash change in fair value of contingent purchase price consideration, $17.8 million of interest expense related to the amortization of deferred financing costs and original issue discounts, $10.5 million related to other non-cash items, $7.9 million of tax benefit related to discontinued operations retained by us, $6.5 million related to the impairment of long-lived assets, $5.1 million loss from the disposition of our Spinreact operations, which includes a $0.7 million charge related to the impairment of intangible assets, a $1.5 million loss on the sale of fixed assets and a $2.5 million non-cash charge related to the write up of inventory to fair value in connection with the acquisition of Epocal, partially offset by a $122.5 million decrease related to changes in our deferred income taxes, which resulted in part from amortization of intangible assets, $17.4 million in equity earnings of unconsolidated entities, net of tax, and $8.0 million relating to a bargain purchase gain in connection with our acquisition of the Liberty business. In addition, $69.2 million of net cash was provided by discontinued operations for operating activities.
Cash Flows from Investing Activities
Our investing activities for continuing operations during 2015 provided $537.7 million of cash, including $675.8 million of cash received from the disposition of our health management business, the BBI business and other divestitures, net of cash divested, $26.1 million of cash received from equity method investments and $2.1 million of proceeds from the sale of property, plant and equipment, partially offset by $90.8 million of capital expenditures, $60.1 million paid for the acquisition of USD, a $13.7 million increase in restricted cash, and a $1.8 million increase in other assets. In addition, discontinued operations used $0.2 million of net cash for investing activities.
Our investing activities for continuing operations during 2014 utilized $48.2 million of cash, including, among other items, $100.6 million of capital expenditures and a $5.4 million increase in our restricted cash balance, partially offset by $45.1 million of cash received from dispositions, $9.5 million from investments, of which $9.7 million is from the sale of our 40% equity investment in Vedalab, $1.5 million of proceeds from the sale of property, plant and equipment and a $1.0 million decrease in other assets. In addition, discontinued operations used $9.0 million of net cash for investing activities.
Our investing activities for continuing operations during 2013 utilized $230.5 million of cash, including $176.1 million net cash paid for acquisitions, $99.9 million of capital expenditures and an increase in our restricted cash balance of $31.2 million, which was principally driven by a $29.4 million deposit in connection with a foreign bank loan arrangement and $7.9 million of cash received from the Bill and Melinda Gates Foundation, of which $5.7 million was used to fund qualified expenditures, partially offset by a $29.3 million return of capital related to equity investments, $29.0 million in proceeds relating to the disposition of our Spinreact operations, a $14.7 million decrease in other assets and $3.6 million of proceeds from the sale of property and equipment. In addition, discontinued operations used $27.0 million of net cash for investing activities.
Cash Flows from Financing Activities
Net cash used in financing activities for continuing operations during 2015 was $632.9 million. Financing activities during 2015 included, among other items, $2.7 billion for the payment of long-term debt obligations (which included $1.65 billion to repay our prior credit facility, $425.9 million to redeem our 8.625% notes, and additional amounts to prepay a portion of the term loans under our existing credit facility), $127.5 million for net payments for revolving credit facilities, $25.6 million for the payment of short-term debt obligations, $21.3 million for dividend payments related to our Series B preferred stock, $16.2 million for financing costs, $14.2 million for payments of acquisition-related contingent consideration obligations, $8.6 million related to a call premium incurred in connection with our redemption of the 8.625% senior subordinated notes, and $5.6 million for payment of capital lease obligations. We received $2.2 billion of proceeds from the issuance of long-term debt (which included
75
Table of Contents
amounts received under the secured credit facility entered into in June 2015 and $425.0 million of gross proceeds received in connection with the issuance of our 6.375% senior subordinated notes), $79.2 million of cash from common stock issuances under employee stock option and stock purchase plans, and $1.5 million of proceeds from the issuance of short-term debt. In addition, discontinued operations used less than $0.1 million of net cash for financing activities.
Net cash used in financing activities for continuing operations during 2014 was $116.7 million. Financing activities during 2014 included, among other items, $65.1 million for the payment of long-term debt obligations, $42.5 million for net payments for revolving credit facilities, $32.9 million for payments of acquisition-related contingent consideration obligations, $21.3 million for dividend payments related to our Series B preferred stock, $6.1 million for payment of capital lease obligations and $1.5 million related to financing costs. We received $51.6 million of cash from common stock issuances under employee stock option and stock purchase plans and had a $1.0 million excess tax benefit associated with exercised stock options. In addition, discontinued operations used $1.5 million of net cash for financing activities.
Net cash provided by financing activities for continuing operations during 2013 was $51.8 million. Financing activities during 2013 primarily included $459.0 million of net proceeds received in connection with long-term debt issuances, which included $425.0 million of gross proceeds received in connection with the issuance of our 6.5% senior subordinated notes, $139.0 million of net proceeds under various revolving credit facilities, which included $190.0 million borrowed, net of $42.5 million paid, against our secured credit facility revolving line-of-credit, and $20.9 million of cash received from common stock issuances under employee stock option and stock purchase plans. In addition, we utilized $470.6 million of cash payments on long-term debt, which included $400.0 million of cash payments related to the repurchase of our 9% senior subordinated notes, $40.1 million for payments of acquisition-related contingent consideration obligations, $21.3 million for dividend payments related to our Series B preferred stock, $19.0 million related to tender offer consideration and call premium incurred in connection with the repurchase of our 9% senior subordinated notes, $9.8 million related to the payment of debt-related financing costs and $6.6 million for payment of capital lease obligations. In addition, discontinued operations used $2.8 million of net cash for financing activities.
As of December 31, 2015, we had an aggregate of $11.1 million in outstanding capital lease obligations which are payable through 2021.
Income Taxes
As of December 31, 2015, our federal, state and foreign net operating loss, or NOL, carryforwards for income tax purposes were approximately $30.6 million, $876.5 million, and $234.6 million, respectively. If not utilized, a portion of the federal, state and foreign NOL carryforwards will begin to expire in 2020, 2016 and 2017, respectively. Certain foreign NOL carryforwards can be carried forward indefinitely. As of December 31, 2015, our federal and foreign capital loss carryforwards for income tax purposes were approximately $256.1 million and $62.1 million, respectively. If not utilized, a portion of the federal capital loss carryforwards will begin to expire in 2016. The foreign capital loss carryforwards can be carried forward indefinitely. As of December 31, 2015, we had $22.9 million of U.S. federal and state research and development credit carryforwards, $4.4 million of U.S. federal alternative minimum tax, or AMT, credit carryforwards, $79.2 million of U.S. foreign tax credit carryforwards and $1.2 million of other foreign tax credit carryforwards. If not utilized, a portion of the research and development credit and foreign tax credit carryforwards will begin to expire in 2026 and 2018, respectively. The AMT credit can be carried forward indefinitely. All U.S. federal loss carryforwards and credits are subject to the limitations imposed by Sections 382 and 383 of the Internal Revenue Code, and may be limited in the event of certain cumulative changes in ownership interests of significant shareholders over a three-year period in excess of 50%. Sections 382 and 383 impose an annual limitation on the use of these loss carryforwards or credits to an amount equal to the value of the company at the time of certain ownership changes multiplied by the long-term tax exempt rate. Additionally, certain state and foreign
76
Table of Contents
losses and credits may be subject to similar limitations based on local provisions. These loss and tax credit carryforwards may be available to reduce future U.S. federal, state and foreign taxable income and taxes, if any, and are subject to review and possible adjustment by the appropriate tax authorities when utilized. During 2014, the provision for income taxes of $70.9 million primarily related to the establishment of a valuation allowance of $44.4 million against deferred tax assets associated with our U.S. foreign tax credit carryforwards. This valuation allowance was established as it was more likely than not that these deferred tax assets would not be realized. This decision was based on the weight of all available positive and negative evidence that existed at December 31, 2014.
We have recorded a valuation allowance against a portion of the deferred tax assets related to our U.S. foreign tax credits and certain other NOL, capital loss and credit carryforwards, as well as certain of our other deferred tax assets to reflect uncertainties that might affect the realization of those deferred tax assets.
Off-Balance Sheet Arrangements
We had no material off-balance sheet arrangements as of December 31, 2015.
Contractual Obligations
The following table summarizes our principal contractual obligations as of December 31, 2015 (in thousands):
| Payments Due by Period | ||||||||||||||||||||
| Contractual Obligations |
Total | 2016 | 2017-2018 | 2019-2020 | Thereafter | |||||||||||||||
| Long-term debt obligations(1) |
$ | 3,069,100 | $ | 198,504 | $ | 572,727 | $ | 946,746 | $ | 1,351,123 | ||||||||||
| Short-term debt obligations |
1,488 | 1,488 | — | — | — | |||||||||||||||
| Capital lease obligations(2) |
11,143 | 3,962 | 3,541 | 3,001 | 639 | |||||||||||||||
| Operating lease obligations(3) |
131,719 | 33,436 | 50,598 | 27,551 | 20,134 | |||||||||||||||
| Pension obligations |
5,401 | 1,684 | 2,923 | 794 | — | |||||||||||||||
| Minimum royalty obligations |
9,379 | 1,791 | 3,317 | 2,899 | 1,372 | |||||||||||||||
| Acquisition-related obligations(4) |
6,329 | 6,147 | 182 | — | — | |||||||||||||||
| Purchase obligations — capital expenditure |
10,119 | 10,061 | 58 | — | — | |||||||||||||||
| Purchase obligations — other(5) |
68,186 | 64,381 | 3,805 | — | — | |||||||||||||||
| Interest on debt(6) |
427,994 | 90,705 | 160,112 | 95,826 | 81,351 | |||||||||||||||
| Contingent consideration obligations(7) |
57,744 | 2,594 | 20,055 | 25,499 | 9,596 | |||||||||||||||
|
|
|
|
|
|
|
|
|
|
|
|||||||||||
| Total |
$ | 3,798,602 | $ | 414,753 | $ | 817,318 | $ | 1,102,316 | $ | 1,464,215 | ||||||||||
|
|
|
|
|
|
|
|
|
|
|
|||||||||||
| (1) | See the description of various financing arrangements in Note 8 of our consolidated financial statements included elsewhere in this Annual Report on Form 10-K. |
| (2) | See Note 10 of our consolidated financial statements included elsewhere in this Annual Report on Form 10-K. |
| (3) | See Note 12(a) of our consolidated financial statements included elsewhere in this Annual Report on Form 10-K. |
| (4) | Includes $3.0 million of deferred purchase price payments and $3.3 million of management incentive payments related to our acquisition of Epocal. |
| (5) | Other purchase obligations relate to inventory purchases and other operating expense commitments. |
77
Table of Contents
| (6) | Includes our non-variable interest-bearing debt. See the description of various financing arrangements in Note 8 of our consolidated financial statements included elsewhere in this Annual Report on Form 10-K. |
| (7) | In connection with certain of our acquisitions, additional contingent consideration may become payable to the sellers upon the satisfaction of certain performance milestones. Amounts represent the estimated fair value of these obligations. For further information pertaining to our contingent consideration arrangements see Note 12(b) of our consolidated financial statements included elsewhere in this Annual Report on Form 10-K. |
Critical Accounting Policies
The consolidated financial statements included elsewhere in this report are prepared in accordance with accounting principles generally accepted in the United States of America, or GAAP. The accounting policies discussed below are considered by our management and our audit committee to be critical to an understanding of our financial statements because their application depends on management’s judgment, with financial reporting results relying on estimates and assumptions about the effect of matters that are inherently uncertain. Specific risks for these critical accounting policies are described in the following paragraphs. For all of these policies, management cautions that future events rarely develop exactly as forecast and the best estimates routinely require adjustment. In addition, the notes to our audited consolidated financial statements for the year ended December 31, 2015, included elsewhere in this Annual Report on Form 10-K, include a comprehensive summary of the significant accounting policies and methods used in the preparation of our consolidated financial statements.
Revenue Recognition
We primarily recognize revenue when the following four basic criteria have been met: (1) persuasive evidence of an arrangement exists, (2) delivery has occurred or services have been rendered, (3) the fee is fixed or determinable and (4) collection is reasonably assured.
The majority of our revenue is derived from product sales. We recognize revenue upon the transfer of title and risk of loss to our customers, less a reserve for estimated product returns and allowances. Determination of the reserve for estimated product returns and allowances is based on our management’s analyses and judgments regarding certain conditions. Should future changes in conditions prove management’s conclusions and judgments on previous analyses to be incorrect, revenue recognized for any reporting period could be adversely affected.
For products that include installation, if the installation meets the criteria to be considered a separate element, product revenue is recognized upon delivery, and installation revenue is recognized when the installation is complete. For sales that include customer-specified acceptance criteria, revenue is recognized after the acceptance criteria have been met. Certain of our products require specialized installation. Revenue for these products is deferred until installation is completed. Revenue from services is deferred and recognized over the contractual period, or as services are rendered and accepted by the customer. When arrangements include multiple elements, we use objective evidence of fair value to allocate revenue to the elements, and recognize revenue when the criteria for revenue recognition have been met for each element, in accordance with authoritative guidance on multiple-element arrangements.
Additionally, with respect to our health management business which is included in discontinued operations, we generated services revenue in connection with contracts with health plans (both commercial and governmental) and self-insured employers, whereby we provided clinical expertise through fee-based arrangements. Revenue for fee-based arrangements was recognized over the period in which the services were provided. Some contracts provided that a portion of our fees were at
78
Table of Contents
risk if our customers did not achieve certain financial cost savings or we did not achieve certain other clinical and operational metrics, over a period of time, typically one year. Revenue subject to refund was not recognized if (i) sufficient information was not available to calculate performance measurements or (ii) interim performance measurements indicate that we were not meeting performance targets. If either of these two conditions existed, we recorded the amounts as other current liabilities in the consolidated balance sheet, deferring recognition of the revenue until we established that we were meeting the performance criteria. However, revenue recognized for fees subject to refund before the end of the contract period was realizable under the termination provisions or other provisions of the contract. If we did not meet the performance targets at the end of the contractual period we were obligated under the contract to refund some or all of the at-risk fees.
We also receive license and royalty revenue from agreements with third-party licensees. Revenue from fixed-fee license and royalty agreements is recognized on a straight-line basis over the obligation period of the related license agreements. License and royalty fees that the licensees calculate based on their sales, which we have the right to audit under most of our agreements, are generally recognized upon receipt of the license or royalty payments, unless we are able to reasonably estimate the fees as they are earned. License and royalty fees that are determinable prior to the receipt thereof are recognized in the period they are earned.
In connection with the preparation of our consolidated financial statements for 2015, we determined that, in 2013 and 2014 and the first three quarters of 2015, we had incorrectly recorded revenue for such periods. As a result of this incorrect timing of recognition of certain revenue transactions, as well as certain other out-of period adjustments, we are revising our consolidated financial information as of December 31, 2014 and for 2014 and 2013. For more information on the revisions related to recognition of certain revenue transactions, see Note 2 to the consolidated financial statements included elsewhere in this Annual Report on Form 10-K.
Use of Estimates for Sales Returns and Other Allowances and Allowance for Doubtful Accounts
Certain sales arrangements require us to accept product returns. From time to time, we also enter into sales incentive arrangements with our retail customers and distributors, which generally reduce the net selling prices of our products or provide rebates to the customers. As a result, we must establish allowances for potential future product returns and claims resulting from our sales incentive arrangements against product revenue recognized in any reporting period. Calculation of these allowances requires significant judgments and estimates. When evaluating the adequacy of the sales returns and other allowances, our management analyzes historical returns, current economic trends and changes in customer and consumer demand and acceptance of our products. When such analysis is not available and a right of return exists, we record revenue when the right of return is no longer applicable. Material differences in the amount and timing of our product revenue for any reporting period may result if changes in conditions arise that would require management to make different judgments or utilize different estimates.
Our total provision for sales returns and other allowances related to sales incentive arrangements amounted to $117.9 million, $91.3 million and $98.6 million, or 6%, 5% and 5%, respectively, of net product sales in 2015, 2014 and 2013, respectively, which have been recorded against product sales to derive our net product sales. Of these amounts, $45.3 million, $42.5 million and $70.3 million for 2015, 2014 and 2013, respectively, represent allowances for future deductions which have been provided against our related accruals for such charges with the balance charged directly against net sales. Similarly, our management must make estimates regarding uncollectible accounts receivable balances. When evaluating the adequacy of the allowance for doubtful accounts, management analyzes specific accounts receivable balances, historical bad debts, customer concentrations, customer credit-worthiness, current economic trends and changes in our customer payment terms and patterns. Our accounts receivable balance was $445.8 million and $461.1 million, net of allowances for doubtful accounts of $89.7 million and $76.2 million, as of December 31, 2015 and 2014, respectively.
79
Table of Contents
Inventory
We state our inventories at the lower of the actual cost to purchase or manufacture the inventory or the estimated current market value of the inventory, less cost to sell. In addition, we periodically review the inventory quantities on hand and record a provision for excess and obsolete inventory. This provision reduces the carrying value of our inventory and is calculated based primarily upon factors such as forecasts of our customers’ demands, shelf lives of our products in inventory, loss of customers and manufacturing lead times. Evaluating these factors, particularly forecasting our customers’ demands, requires management to make assumptions and estimates. Actual product and services revenue may prove our forecasts to be inaccurate, in which case we may have underestimated or overestimated the provision required for excess and obsolete inventory. If, in future periods, our inventory is determined to be overvalued, we would be required to recognize the excess value as a charge to our cost of sales at the time of such determination. Likewise, if, in future periods, our inventory is determined to be undervalued, we would have over-reported our cost of sales, or understated our earnings, at the time we recorded the excess and obsolete provision. Our inventory balance was $347.0 million and $377.3 million, net of a reserve for excess and obsolete inventory of $37.8 million and $27.3 million, as of December 31, 2015 and 2014, respectively.
Goodwill and Other Long-lived and Intangible Assets
Our long-lived assets include property, plant and equipment, net; goodwill; other intangible assets with indefinite lives; and finite-lived intangible assets, net. As of December 31, 2015 and 2014, respectively, we had property, plant and equipment, net of $446.0 million and $454.2 million; goodwill of $2.8 billion and $2.9 billion; other intangible assets with indefinite lives of $28.1 million and $43.7 million; and finite-lived intangible assets, net of $997.3 million and $1.3 billion.
Goodwill relates to amounts that arose in connection with our various business combinations and represents the difference between the purchase price and the fair value of the identifiable tangible and intangible net assets when accounted for using the acquisition method of accounting. Goodwill is not amortized, but is subject to periodic review for impairment.
We test goodwill and other intangible assets with indefinite lives at the reporting unit level for impairment on an annual basis and between annual tests, if events and circumstances indicate it is more likely than not that the fair value of a reporting unit is less than its carrying value. Events that would indicate impairment and trigger an interim impairment assessment include, but are not limited to, current economic and market conditions, including a decline in market capitalization, a significant adverse change in legal factors, business climate or operational performance of the business and an adverse action or assessment by a regulator.
In performing the impairment test, we utilize the two-step approach. The first step, or Step 1, requires a comparison of the carrying value of each reporting unit to its estimated fair value. To estimate the fair value of our reporting units for Step 1, we use a combination of the income approach, the market comparable approach and the market transaction approach. The income approach is based on a discounted cash flow analysis, or DCF approach, and calculates the fair value by estimating the after-tax cash flows attributable to a reporting unit and then discounting the after-tax cash flows to a present value, using a risk-adjusted discount rate. Assumptions used in the DCF approach require the exercise of significant judgment, including judgment about appropriate discount rates and terminal values, growth rates and the amount and timing of expected future cash flows. The forecasted cash flows are based on our most recent budget and for years beyond the budget, our estimates are based on assumed growth rates. We believe our assumptions are consistent with the plans and estimates used to manage the underlying businesses. The discount rates, which are intended to reflect the risks inherent in future cash flow projections, used in the DCF approach are based on estimates of the weighted-average cost of capital, or WACC, of market participants relative to each respective reporting unit. The market approaches consider comparable and transactional market data based on multiples of revenue or earnings before interest, taxes, depreciation and amortization, or EBITDA, based on trading multiples of selected guideline companies and deal multiples of selected target companies.
80
Table of Contents
If the carrying value of a reporting unit exceeds its estimated fair value, we are required to perform the second step, or Step 2, of the goodwill impairment test to measure the amount of impairment loss, if any. Step 2 of the goodwill impairment test compares the implied fair value of a reporting unit’s goodwill to its carrying value. The implied fair value of goodwill is calculated as the difference between the fair value of the reporting unit and the estimated fair value of its assets and liabilities. To the extent this amount is below the carrying value of goodwill, an impairment charge is recorded to write down the carrying value to its implied value.
Impairment charges related to goodwill have no impact on our cash balances or compliance with financial covenants under our Credit Agreement.
As a result of the sale in January 2015 of our health management business, which was the largest component of our former patient self-testing reporting segment, we ceased to report our financial information in four operating segments. Beginning in 2015, our reporting units are professional diagnostics and consumer diagnostics.
2015 Annual Goodwill Impairment Test
We conducted our 2015 annual impairment test for our reporting units during the fourth quarter of 2015. Key assumptions (which vary by reporting unit) used in determining fair value under the DCF approach included discount rates ranging from 9.0% to 14.0%, projected compound average revenue growth rates of 3.4% to 5.6%, and terminal value growth rates of 3.0% to 4.0%. In determining the appropriate discount rate, we considered the WACC for each reporting unit, which among other factors considers the cost of common equity capital and the marginal cost of debt of market participants. Key assumptions (which again vary by reporting unit) used in determining fair value under the market approaches were based on observed market multiples of enterprise value to revenue and EBITDA for both comparable publicly-traded companies and recent merger and acquisition transactions involving similar companies to estimate appropriate controlling basis multiples to apply to each of the reporting units. Based on the multiples implied by this market data, we selected multiples of revenue of 0.7 to 2.9 times and multiples of EBITDA of 7.3 to 11.8 times. In assessing the reasonableness of our estimated fair values of the reporting units, management compared the results of the valuation analyses against our then-current market capitalization to imply a control premium. Based on this analysis, the implied control premium was within the range of comparable industry transactions.
The Step 1 impairment test indicated the estimated fair value of the professional diagnostics and consumer diagnostics reporting units exceeded the carrying value of their reporting unit’s net assets by $3.1 billion and $44.9 million, respectively, or 58.1% and 18.2%, respectively.
The estimate of fair value requires significant judgment. We based our fair value estimates on assumptions that we believe to be reasonable but that are unpredictable and inherently uncertain, including estimates of future growth rates and operating margins and assumptions about the overall economic climate and the competitive environment for our business units. There can be no assurance that our estimates and assumptions made for purposes of our goodwill and identifiable intangible asset testing as of the time of testing will prove to be accurate predictions of the future. If our assumptions regarding business plans, competitive environments or anticipated growth rates are not correct, we may be required to record goodwill and/or intangible asset impairment charges in future periods, whether in connection with our next annual impairment testing or earlier, if an indicator of an impairment is present before our next annual evaluation.
Valuation of Other Long-lived Tangible and Intangible Assets
Factors we generally consider important which could trigger an impairment review on the carrying value of other long-lived tangible and intangible assets include the following: (1) significant
81
Table of Contents
underperformance relative to expected historical or projected future operating results, (2) significant changes in the manner of our use of acquired assets or the strategy for our overall business, (3) underutilization of our tangible assets, (4) discontinuance of product lines by ourselves or our customers, (5) significant negative industry or economic trends, (6) significant decline in our stock price for a sustained period, (7) significant decline in our market capitalization relative to net book value and (8) goodwill impairment identified during an impairment review.
Stock-based Compensation
Stock-based compensation expense is measured at the grant date based on the fair value of the award and is recognized as expense over the vesting period. Determining the fair value of stock-based awards at the grant date requires judgment, including estimating our stock price volatility and employee stock option exercise behaviors. If actual results differ significantly from these estimates, stock-based compensation expense and our results of operations could be materially impacted.
Our expected volatility is based upon the historical volatility of our stock. The expected term is based on the assumption that all outstanding options will be exercised at the midpoint of the vesting date and the full contractual term, including data on experience to date. As stock-based compensation expense is recognized in our consolidated statements of operations based on awards ultimately expected to vest, the amount of expense has been reduced for estimated forfeitures. Forfeitures are estimated at the time of grant and revised, if necessary, in subsequent periods if actual forfeitures differ from those estimates. Forfeitures were estimated based on historical experience. If factors change and we employ different assumptions, the compensation expense that we record in future periods may differ significantly from what we have recorded in the current or prior periods.
Accounting for Income Taxes
As part of the process of preparing our consolidated financial statements, we are required to estimate our income taxes in each of the jurisdictions in which we operate. This process involves estimating our actual current tax exposure and assessing temporary differences resulting from differing treatment of items, such as reserves and accruals and lives assigned to long-lived and intangible assets, for tax and accounting purposes. These differences result in deferred tax assets and liabilities. We must then assess the likelihood that our deferred tax assets will be recovered through future taxable income and, to the extent we believe that recovery is not more likely than not, we must establish a valuation allowance. To the extent we establish a valuation allowance or increase this allowance in a period, we must include an expense within our tax provision.
We recorded a valuation allowance of $262.2 million as of December 31, 2015 due to uncertainties related to the future benefits and realization of our deferred tax assets related primarily to U.S. foreign tax credits and certain state and foreign attribute carryforwards. This is an increase of $33.6 million from the valuation allowance of $228.6 million as of December 31, 2014. The increase is primarily related to our assessment of realizability related to U.S. foreign tax credits as well as certain state and foreign net operating losses and capital loss generated during 2015. The valuation allowance is based on the weight of available positive and negative evidence, including our estimates of future income by the jurisdictions in which we operate and the period over which our deferred tax assets will be recoverable. In the event that actual results differ from these estimates, or we adjust these estimates in future periods, we may need to establish an additional valuation allowance or reduce our current valuation allowance, which could materially impact our tax provision.
We establish reserves for tax uncertainties that reflect the use of the comprehensive model for the recognition and measurement of uncertain tax positions. We are currently undergoing routine tax examinations by the IRS and various state and foreign jurisdictions. Tax authorities periodically challenge certain transactions and deductions we reported on our income tax returns. We do not expect the outcome of these examinations, either individually or in the aggregate, to have a material adverse effect on our financial position, results of operations or cash flows.
82
Table of Contents
During November 2015, the Financial Accounting Standards Board, or FASB, issued Accounting Standards Update, or ASU, No. 2015-17, Balance Sheet Classification of Deferred Taxes, which simplifies the presentation of deferred income taxes. This ASU requires that deferred tax assets and liabilities be classified as non-current in a statement of financial position. We adopted this ASU effective December 31, 2015 on a prospective basis. Adoption of this ASU resulted in a reclassification of our net current deferred tax asset to the net non-current deferred tax asset in our consolidated balance sheet as of December 31, 2015. No prior periods were retrospectively adjusted.
Loss Contingencies
In the section of this report entitled Part I, Item 3, “Legal Proceedings,” we have reported on material legal proceedings. Because of the nature of our business, we may be subject at any particular time to lawsuits or other claims arising in the ordinary course of our business, and we expect that this will continue to be the case in the future.
We do not accrue for potential losses on legal proceedings where we are the defendant when we do not believe it is probable that we will have a liability or if we are not able to reasonably estimate our potential liability, if any, due to uncertainty as to the nature, extent and validity of the claims against us, uncertainty as to the nature and extent of the damages or other relief sought by the plaintiff and the complexity of the issues involved. Our potential liability, if any, in a particular case may become reasonably estimable and probable as the case progresses, in which case we will begin accruing for the expected loss.
Our businesses may also be subject at any time to other commercial disputes, product liability claims, personal injury claims, including claims arising from or relating to product recalls, negligence claims or various other lawsuits arising in the ordinary course of business, including infringement, employment or investor matters, and we expect that this will continue to be the case in the future. Such lawsuits or claims generally seek damages or reimbursement, sometimes in substantial amounts. There are possible unfavorable outcomes related to litigation or governmental investigations that could materially impact our business, results of operations, financial condition, and cash flows.
Recent Accounting Pronouncements
See Note 4(w) to our consolidated financial statements included elsewhere in this Annual Report on Form 10-K regarding the impact of certain recent accounting pronouncements on our consolidated financial statements.
ITEM 7A. QUANTITATIVE AND QUALITATIVE DISCLOSURES ABOUT MARKET RISK
The following discussion about our market risk disclosures involves forward-looking statements. Actual results could differ materially from those discussed in the forward-looking statements. As of December 31, 2015, we were exposed to market risks related to changes in interest rates and foreign currency exchange rates. Historically through December 31, 2015, we did not use derivative financial instruments for speculative or trading purposes.
Interest Rate Risk
We are exposed to market risk from changes in interest rates primarily through our investing and financing activities. In addition, our ability to finance future acquisition transactions or fund working capital requirements may be impacted if we are not able to obtain appropriate financing at acceptable rates. To manage our interest rate exposure, our strategy is to invest in short-term, highly-liquid investments. Our investment policy also requires investment in approved instruments with an initial maximum allowable maturity of eighteen months and an average maturity of our portfolio that should not exceed six months, with at least $500,000 cash available at all times. At December 31, 2015, our short-term investments consisted of money market funds with original maturities of 90 days or less. At December 31, 2015, our short-term investments approximated market value.
83
Table of Contents
At December 31, 2015, under the credit agreement for our secured credit facility we had (i) term loans in an aggregate outstanding principal amount of $1.6 billion (consisting of “A” term loans in the aggregate principal amount of $587.7 million and “B” term loans in the aggregate principal amount of $971.2 million), (ii) no amounts outstanding under our revolving line of credit and (iii) subject to our continued compliance with the credit agreement, the ability to borrow a maximum of up to an additional $250.0 million under our revolving line of credit, which includes a $50.0 million sublimit for the issuance of letters of credit. Loans can be either Base Rate Loans or Eurodollar Rate Loans at our election, and, as of December 31, 2015, interest accrues on loans and our other payment obligations under the terms of the credit agreement as follows (with the terms referenced above and below in this paragraph having the meanings given to them in the credit agreement): (i) in the case of loans that are Base Rate Loans, at a rate per annum equal to the sum of the Base Rate and the Applicable Margin, each as in effect from time to time, (ii) in the case of loans that are Eurodollar Rate Loans, at a rate per annum equal to the sum of the Eurodollar Rate and the Applicable Margin, each as in effect for the applicable Interest Period, and (iii) in the case of other payment obligations, at a rate per annum equal to the sum of the Base Rate and the Applicable Margin for Revolving Loans that are Base Rate Loans, each as in effect from time to time. The Base Rate is a floating rate which approximates the U.S. prime rate as in effect from time to time. The Eurodollar Rate is equal to the LIBOR rate and is set for a period of one, two, three or six months at our election. The Applicable Margins for our “A” term loans and revolving line of credit loans are (i) with respect to such loans that are Base Rate Loans, 2.00% and (ii) with respect to such loans that are Eurodollar Rate Loans, 3.00%. The Applicable Margins for our “B” term loans are (i) with respect to such loans that are Base Rate Loans, 2.00% or 2.25% and (ii) with respect to such loans that are Eurodollar Rate Loans, 3.00% or 3.25%, in each case, depending upon our consolidated secured net leverage ratio. The base Eurodollar Rate is subject to a 1.00% floor with respect to “B” term loans based on such rate.
Assuming no changes in our consolidated secured leverage ratio, the effect of interest rate fluctuations on outstanding borrowings as of December 31, 2015 over the next twelve months is quantified and summarized as follows (in thousands):
| Interest Expense Increase |
||||
| Interest rates payable by us increase by 100 basis points |
$ | 15,589 | ||
| Interest rates payable by us increase by 200 basis points |
$ | 31,177 | ||
Foreign Currency Risk
We face exposure to movements in foreign currency exchange rates whenever we, or any of our subsidiaries, enter into transactions with third parties that are denominated in currencies other than our, or its, functional currency. Intercompany transactions between entities that use different functional currencies also expose us to foreign currency risk. During 2015, the net impact of foreign currency changes on transactions was a loss of $4.8 million.
Gross margins of products we manufacture at our foreign plants and sell in U.S. dollars or manufacture in our U.S. plants and sell in currencies other than the U.S. dollar are also affected by foreign currency exchange rate movements. Our gross margin on total net product sales was 46.6% in 2015. If the U.S. dollar had been stronger by 1%, 5% or 10%, compared to the actual rates during 2015, our gross margin on total net product sales would have been 46.7%, 46.8% and 46.9%, respectively.
In addition, because a substantial portion of our earnings is generated by our foreign subsidiaries, whose functional currencies are other than the U.S. dollar (in which we report our consolidated financial results), our earnings could be materially impacted by movements in foreign currency exchange rates upon the translation of the earnings of such subsidiaries into the U.S. dollar.
84
Table of Contents
If the U.S. dollar had been uniformly stronger by 1%, 5% or 10%, compared to the actual average exchange rates used to translate the financial results of our foreign subsidiaries, our net revenue and net income would have been impacted by the following amounts (in thousands):
| Approximate Decrease in Net Revenue |
Approximate Decrease in Net Income |
|||||||
| If, during 2015, the U.S. dollar was stronger by: |
||||||||
| 1% |
$ | (9,270 | ) | $ | (1,453 | ) | ||
| 5% |
$ | (46,349 | ) | $ | (7,263 | ) | ||
| 10% |
$ | (92,699 | ) | $ | (14,527 | ) | ||
ITEM 8. FINANCIAL STATEMENTS AND SUPPLEMENTARY DATA
The financial statements and supplementary data, except for selected quarterly financial data which are summarized below, are listed under Item 15(1) and have been filed as part of this Annual Report on Form 10-K on the pages indicated.
On October 10, 2014, we completed the sale of ACS, and on January 9, 2015, we completed the sale of our health management business. The results of the health management business are included in income (loss) from discontinued operations, net of tax, for all periods presented in the selected quarterly financial data below except for the second, third and fourth quarters in 2015, given our January 9, 2015 divestiture of this business. The results of ACS are included in income (loss) from discontinued operations, net of tax, for all quarters in 2014, given our October 10, 2014 divestiture of this business. See Note 3 to our accompanying consolidated financial statements for more information about these divestitures and discontinued operations.
In connection with the preparation of our consolidated financial statements for 2015, we determined that, in 2013 and 2014, each of the interim periods in 2014, and the first three quarters of fiscal 2015, we had incorrectly reported the revenue for such periods. In addition, we made several out-of-period adjustments related the correction of a specific bonus accrual, the measurement of a certain royalty obligation and adjustments related to the accounting for income taxes. As a result, we are revising our consolidated financial information as of December 31, 2014 and for the fiscal years ended December 31, 2014 and 2013 and each of the interim periods in 2014 and each of the first three quarters of fiscal year 2015. These revisions also apply to each of 2014 and the first three quarters of 2015, and the selected consolidated financial information presented below reflects these revisions. We evaluated the cumulative impact of these items on our previously-issued quarterly and annual financial statements and concluded that the revisions were not material, individually or in the aggregate, to any of our previously-issued quarterly and annual financial statements. For more information on the revisions, see Note 2 to the consolidated financial statements included elsewhere in this Annual Report on Form 10-K.
The following schedules reconcile the amounts as previously reported in the applicable financial statement to the corresponding revised amounts:
| Three Months Ended September 30, 2015 | ||||||||||||
| Revised Selected Quarterly Financial Data (in thousands) |
As Previously Reported |
Revision Adjustment |
As Revised |
|||||||||
| Net revenue |
$ | 602,044 | $ | 1,724 | $ | 603,768 | ||||||
| Gross profit |
$ | 275,049 | $ | 1,917 | $ | 276,966 | ||||||
| Income (loss) from continuing operations |
$ | 5,501 | $ | (7,884 | ) | $ | (2,383 | ) | ||||
| Net lncome (loss) available to common stockholders |
$ | 195 | $ | (7,884 | ) | $ | (7,689 | ) | ||||
| Basic and diluted net income (loss) per common share: Loss from continuing operations |
$ | — | $ | (0.09 | ) | $ | (0.09 | ) | ||||
| Basic and diluted net income (loss) per common share: Net loss per common share |
$ | — | $ | (0.09 | ) | $ | (0.09 | ) | ||||
85
Table of Contents
| Three Months Ended June 30, 2015 | ||||||||||||
| Revised Selected Quarterly Financial Data (in thousands) |
As Previously Reported |
Revision Adjustment |
As Revised |
|||||||||
| Net revenue |
$ | 629,156 | $ | (5,785 | ) | $ | 623,371 | |||||
| Gross profit |
$ | 292,574 | $ | (5,240 | ) | $ | 287,334 | |||||
| Income from continuing operations |
$ | 20,263 | $ | (5,493 | ) | $ | 14,770 | |||||
| Net income available to common stockholders |
$ | 14,595 | $ | (5,493 | ) | $ | 9,102 | |||||
| Basic and diluted net income per common share: Income from continuing operations |
$ | 0.17 | $ | (0.06 | ) | $ | 0.11 | |||||
| Basic and diluted net income (loss) per common share: Net income per common share |
$ | 0.17 | $ | (0.06 | ) | $ | 0.11 | |||||
| Three Months Ended March 31, 2015 | ||||||||||||
| Revised Selected Quarterly Financial Data (in thousands) |
As Previously Reported |
Revision Adjustment |
As Revised |
|||||||||
| Net revenue |
$ | 608,153 | $ | 4,739 | $ | 612,892 | ||||||
| Gross profit |
$ | 291,985 | $ | 3,230 | $ | 295,215 | ||||||
| Loss from continuing operations |
$ | (7,549 | ) | $ | 1,200 | $ | (6,349 | ) | ||||
| Net income available to common stockholders |
$ | 203,890 | $ | 1,200 | $ | 205,090 | ||||||
| Basic and diluted net income (loss) per common share: Loss from continuing operations |
$ | (0.15 | ) | $ | 0.01 | $ | (0.14 | ) | ||||
| Basic and diluted net income (loss) per common share: Net income per common share |
$ | 2.42 | $ | 0.01 | $ | 2.43 | ||||||
| Three Months Ended December, 2014 | ||||||||||||
| Revised Selected Quarterly Financial Data (in thousands) |
As Previously Reported |
Revision Adjustment |
As Revised |
|||||||||
| Net revenue |
$ | 666,857 | $ | 232 | $ | 667,089 | ||||||
| Gross profit |
$ | 308,264 | $ | 116 | $ | 308,380 | ||||||
| Loss from continuing operations |
$ | (30,948 | ) | $ | (18 | ) | $ | (30,966 | ) | |||
| Net income available to common stockholders |
$ | 105,919 | $ | (18 | ) | $ | 105,901 | |||||
| Basic and diluted net income (loss) per common share: Loss from continuing operations |
$ | (0.44 | ) | $ | 0.01 | $ | (0.43 | ) | ||||
| Basic and diluted net income (loss) per common share: Net income per common share |
$ | 1.27 | $ | 0.01 | $ | 1.28 | ||||||
| Three Months Ended September 30, 2014 | ||||||||||||
| Revised Selected Quarterly Financial Data (in thousands) |
As Previously Reported |
Revision Adjustment |
As Revised |
|||||||||
| Net revenue |
$ | 649,210 | $ | (4,954 | ) | $ | 644,256 | |||||
| Gross profit |
$ | 301,622 | $ | (2,712 | ) | $ | 298,910 | |||||
| Income (loss) from continuing operations |
$ | (84,289 | ) | $ | 4,366 | $ | (79,923 | ) | ||||
| Net loss available to common stockholders |
$ | (103,751 | ) | $ | 4,366 | $ | (99,385 | ) | ||||
| Basic and diluted net income (loss) per common share: Loss from continuing operations |
$ | (1.08 | ) | $ | 0.05 | $ | (1.03 | ) | ||||
| Basic and diluted net income (loss) per common share: Net loss per common share |
$ | (1.25 | ) | $ | 0.05 | $ | (1.20 | ) | ||||
86
Table of Contents
| Three Months Ended June 30, 2014 | ||||||||||||
| Revised Selected Quarterly Financial Data (in thousands) |
As Previously Reported |
Revision Adjustment |
As Revised |
|||||||||
| Net revenue |
$ | 647,398 | $ | (7,288 | ) | $ | 640,110 | |||||
| Gross profit |
$ | 298,693 | $ | (5,204 | ) | $ | 293,489 | |||||
| Loss from continuing operations |
$ | (57,941 | ) | $ | (2,368 | ) | $ | (60,309 | ) | |||
| Net loss available to common stockholders |
$ | (50,397 | ) | $ | (2,368 | ) | $ | (52,765 | ) | |||
| Basic and diluted net income (loss) per common share: Loss from continuing operations |
$ | (0.77 | ) | $ | (0.03 | ) | $ | (0.80 | ) | |||
| Basic and diluted net income (loss) per common share: Net loss per common share |
$ | (0.61 | ) | $ | (0.03 | ) | $ | (0.64 | ) | |||
| Three Months Ended March 31, 2014 | ||||||||||||
| Revised Selected Quarterly Financial Data (in thousands) |
As Previously Reported |
Revision Adjustment |
As Revised |
|||||||||
| Net revenue |
$ | 625,239 | $ | (1,416 | ) | $ | 623,823 | |||||
| Gross profit |
$ | 310,358 | $ | (1,101 | ) | $ | 311,459 | |||||
| Loss from continuing operations |
$ | (2,850 | ) | $ | 2,294 | $ | (556 | ) | ||||
| Net loss available to common stockholders |
$ | (10,804 | ) | $ | 2,294 | $ | (8,510 | ) | ||||
| Basic and diluted net income (loss) per common share: Loss from continuing operations |
$ | (0.10 | ) | $ | 0.03 | $ | (0.07 | ) | ||||
| Basic and diluted net income (loss) per common share: Net loss per common share |
$ | (0.13 | ) | $ | 0.03 | $ | (0.10 | ) | ||||
The following table presents selected quarterly financial data for each of the quarters in the years ended December 31, 2015 and 2014 (in thousands, except per share data):
| 2015 | ||||||||||||||||
| First Quarter(2) |
Second Quarter(3) |
Third Quarter(4) |
Fourth Quarter(5) |
|||||||||||||
| Net revenue |
$ | 612,892 | $ | 623,371 | $ | 603,768 | $ | 623,285 | ||||||||
| Gross profit |
$ | 295,215 | $ | 287,334 | $ | 276,966 | $ | 253,029 | ||||||||
| Income (loss) from continuing operations |
$ | (6,349 | ) | $ | 14,770 | $ | (2,383 | ) | $ | (18,797 | ) | |||||
| Income from discontinued operations, net of tax |
$ | 216,777 | $ | — | $ | — | $ | 2,736 | ||||||||
| Net income (loss) available to common stockholders(1) |
$ | 205,090 | $ | 9,102 | $ | (7,689 | ) | $ | (21,421 | ) | ||||||
| Basic and diluted net income (loss) per common share attributable to Alere Inc. and Subsidiaries: |
||||||||||||||||
| Income (loss) per common share from continuing operations |
$ | (0.14 | ) | $ | 0.11 | $ | (0.09 | ) | $ | (0.28 | ) | |||||
| Income per common share from discontinued operations |
$ | 2.57 | $ | — | $ | — | $ | — | ||||||||
| Net income (loss) per common share(1) |
$ | 2.43 | $ | 0.11 | $ | (0.09 | ) | $ | (0.28 | ) | ||||||
87
Table of Contents
| 2014 | ||||||||||||||||
| First Quarter(6) |
Second Quarter(7) |
Third Quarter(8) |
Fourth Quarter(9) |
|||||||||||||
| Net revenue |
$ | 623,823 | $ | 640,110 | $ | 644,256 | $ | 667,089 | ||||||||
| Gross profit |
$ | 311,459 | $ | 293,489 | $ | 298,910 | $ | 308,380 | ||||||||
| Loss from continuing operations |
$ | (556 | ) | $ | (60,309 | ) | $ | (79,923 | ) | $ | (30,966 | ) | ||||
| Income (loss) from discontinued operations, net of tax |
$ | (2,596 | ) | $ | 12,915 | $ | (14,401 | ) | $ | 142,400 | ||||||
| Net income (loss) available to common stockholders(1) |
$ | (8,510 | ) | $ | (52,765 | ) | $ | (99,385 | ) | $ | 105,901 | |||||
| Basic and diluted net income (loss) per common share attributable to Alere Inc. and Subsidiaries: |
||||||||||||||||
| Loss per common share from continuing operations |
$ | (0.07 | ) | $ | (0.80 | ) | $ | (1.03 | ) | $ | (0.43 | ) | ||||
| Income (loss) per common share from discontinued operations |
$ | (0.03 | ) | $ | 0.16 | $ | (0.17 | ) | $ | 1.71 | ||||||
| Net income (loss) per common share(1) |
$ | (0.10 | ) | $ | (0.64 | ) | $ | (1.20 | ) | $ | 1.28 | |||||
| (1) | Net income (loss) available to common stockholders and basic and diluted net income (loss) per common share are computed consistent with the annual per share calculations described in Notes 4(o) and 13 of our consolidated financial statements included elsewhere in this Annual Report on Form 10-K. |
| (2) | Included in net loss from continuing operations for the first quarter of 2015 is $4.3 million of restructuring charges, $3.7 million of costs associated with potential business dispositions, and $34.8 million in impairment and (gain) loss on dispositions, net, offset by $11.8 million net benefit from the net decrease in expense recorded for fair value adjustments to acquisition-related contingent consideration. |
| (3) | Included in net income from continuing operations for the second quarter of 2015 is $4.9 million of restructuring charges, $5.5 million in impairment and (gain) loss on dispositions, net, $3.5 million of costs related to extinguishment of debt, and $10.2 million financing costs expensed in connection with the debt refinancing, offset by $41.1 million net benefit from the net decrease in the fair value to acquisition-related contingent consideration. |
| (4) | Included in net loss from continuing operations for the third quarter of 2015 is $2.3 million of restructuring charges, $1.9 million of costs associated with potential business dispositions, $2.1 million in impairment and (gain) loss on dispositions, net, $8.9 million of incremental interest expense and amortization of deferred financing costs related to the debt refinancing. |
| (5) | Included in net income from continuing operations for the fourth quarter of 2015 is $4.2 million of restructuring charges, $2.8 million of costs associated with potential business dispositions and $8.2 million in impairment and (gain) loss on dispositions, net and $16.4 million of costs related to extinguishment of debt, offset by a $5.7 million benefit from a net decrease in the fair value of acquisition-related contingent consideration. |
| (6) | Included in net loss from continuing operations for the first quarter of 2014 is $4.4 million of restructuring charges, $1.4 million of expense recorded for fair value adjustments to acquisition-related contingent consideration, $3.0 million of costs associated with potential business dispositions. |
| (7) | Included in net loss from continuing operations for the second quarter of 2014 is $15.4 million of restructuring charges, $16.7 million of expense recorded for fair value adjustments to acquisition-related contingent consideration, $11.6 million of costs associated with potential business dispositions. |
| (8) | Included in net loss from continuing operations for the third quarter of 2014 is $79.4 million of valuation allowance establishment against deferred tax assets associated with our U.S. foreign tax credit carryforwards, $17.3 million of restructuring charges, $6.2 million of costs associated with potential business disposition, offset by the reversal of $5.5 million of expense recorded for fair value adjustments to acquisition-related contingent consideration. |
88
Table of Contents
| (9) | Included in net loss from continuing operations for the fourth quarter of 2014 is $60.8 million of amortization, $21.6 million of restructuring charges, $5.8 million of costs associated with potential business dispositions, and $7.1 million in impairment and (gain) loss on dispositions, net, offset by the reversal of $4.8 million of expense recorded for fair value adjustments to acquisition-related contingent consideration. |
| ITEM 9. | CHANGES IN AND DISAGREEMENTS WITH ACCOUNTANTS ON ACCOUNTING AND FINANCIAL DISCLOSURE |
Not applicable.
| ITEM 9A. | CONTROLS AND PROCEDURES |
| (i) | Management’s Conclusions Regarding the Effectiveness of Our Disclosure Controls and Procedures |
Our management evaluated, with the participation of our Chief Executive Officer (CEO) and our Chief Financial Officer (CFO), the effectiveness of the design and operation of our disclosure controls and procedures (as defined in Rule 13a-15(e) under the Exchange Act) as of December 31, 2015, the end of the period covered by this report. Based on that evaluation, our CEO and CFO concluded that, because of the material weaknesses described below, our disclosure controls and procedures were not effective to provide reasonable assurance that information required to be disclosed by us in reports that we file or submit under the Exchange Act is recorded, processed, summarized and reported within the time periods specified in the SEC’s rules and forms, and that such information is accumulated and communicated to our management, including our CEO and CFO, as appropriate to allow timely decisions regarding required disclosure.
| (ii) | Management’s Annual Report on Internal Control over Financial Reporting |
Our management is responsible for establishing and maintaining adequate internal control over financial reporting as defined in Rule 13a-15(f) under the Exchange Act. Our internal control over financial reporting is a process designed under the supervision of our CEO and CFO, and effected by our board of directors, management and other personnel, to provide reasonable assurance regarding the reliability of financial reporting and the preparation of financial statements for external purposes in accordance with U.S. generally accepted accounting principles (“U.S. GAAP”). Our internal control over financial reporting includes those policies and procedures that: (i) pertain to the maintenance of records that, in reasonable detail, accurately and fairly reflect the transactions and dispositions of our assets; (ii) provide reasonable assurance that transactions are recorded as necessary to permit preparation of financial statements in accordance with U.S. GAAP, and that our receipts and expenditures are being made only in accordance with authorization of our management and directors; and (iii) provide reasonable assurance regarding prevention or timely detection of unauthorized acquisition, use or disposition of assets that could have a material effect on our financial statements.
Management assessed the effectiveness of our internal control over financial reporting as of December 31, 2015. In making this assessment, management used the criteria established in Internal Control — Integrated Framework (2013) issued by the Committee of Sponsoring Organizations of the Treadway Commission (“COSO”). Based on this assessment, management has concluded that we did not maintain effective internal control over financial reporting as of December 31, 2015 due to the fact that the material weaknesses described below existed at that date
Material Weakness Related to Accounting for Income Taxes
We did not maintain a sufficient complement of resources with adequate experience and expertise in accounting for income taxes, as a result of which our controls did not operate at a level of precision
89
Table of Contents
to identify errors in the calculation of tax balances resulting from dispositions and U.S. taxes on foreign earnings. The material weakness resulted in the previous restatements to our consolidated financial statements for the year ended December 31, 2014 and our interim financial information for the three and nine months ended September 30, 2014. This material weakness could result in a material misstatement of the consolidated financial statements that would not be prevented or detected.
Material Weaknesses Related to Revenue Recognition
We did not maintain a sufficient complement of resources at our subsidiaries with appropriate knowledge, experience and training to ensure proper application of US GAAP in determining revenue recognition.
We also did not maintain effective controls over information and communications as it relates to revenue recognition at our subsidiaries. Specifically, we did not implement and reinforce an adequate process for internally communicating nonstandard terms and conditions between our subsidiaries’ commercial operations and finance groups and between our subsidiaries’ finance groups and our corporate accounting group. These material weaknesses contributed to the following material weaknesses.
We did not design effective controls over the review of terms of purchase orders and customer contracts, including amendments to contracts, to ensure proper application of US GAAP in determining revenue recognition.
We did not design effective controls to ensure that revenue would not be recognized until title and risk of loss had passed to our customers.
These material weaknesses resulted in a revision to our financial statements for the years ended December 31, 2013 and 2014 and each of the interim periods in 2014 and 2015. Although the adjustments resulting in the revision to our financial statements were not material, we concluded that these material weaknesses could result in a material misstatement of the consolidated financial statements that would not be prevented or detected.
The effectiveness of our internal control over financial reporting as of December 31, 2015 has been audited by PricewaterhouseCoopers LLP, an independent registered public accounting firm, as stated in their report, which appears in this Annual Report on Form 10-K.
| (iii) | Plan for Remediation of Material Weaknesses in Internal Control Over Financial Reporting |
With the oversight of senior management, including our Chief Executive Officer, our Chief Financial Officer and our Chief Accounting Officer, and the audit committee of our board of directors, we have implemented, and will continue to identify and implement, steps to remediate the material weaknesses described above. The specific actions taken and planned additional actions are described below.
Material Weakness Related to Accounting for Income Taxes
| • | supplementing our accounting and tax professionals with additional personnel with the appropriate experience, certification, education, training and expertise in accounting for the income tax effects of dispositions and other complex transactions. Between May 1, 2015 and June 30, 2016, we hired a Corporate Controller and Chief Accounting Officer, Vice President, Global Tax, a Senior Director, International Tax, a Director, Global Tax Accounting, a Senior Manager, Global Tax Accounting, and a Senior Manager, Domestic Tax, all of whom have experience working on tax provisions of multinational companies; |
90
Table of Contents
| • | enhancing our income tax controls to include specific activities to assess the accounting for deductible outside basis differences that could reverse as a result of transactions to dispose of components of the company. Between May 1, 2015 and June 30, 2016, Company tax department personnel have attended internal and external trainings related to income tax accounting; and |
| • | enhancing our controls over the income tax provision process to include specific controls over the determination of U.S. taxes on foreign earnings. |
Material Weakness Related to Revenue Recognition
| • | hiring additional Finance personnel to support our commercial subsidiaries who have experience working in global finance organizations and have expertise in revenue recognition and US GAAP. Specifically, in 2015 and 2016, we hired new finance directors in Latin America and Africa and plan to hire additional resources at some of our foreign subsidiaries; |
| • | reorganizing Finance and commercial operations to facilitate global communication to enhance compliance with the corporate revenue recognition policy and US GAAP; |
| • | enhancing the formal contract and purchase order review process at our commercial subsidiaries to ensure appropriate application of US GAAP, including approvals at appropriate levels ; |
| • | creating and implementing formal global processes that require revenue recognition subject matter experts to review and approve any nonstandard arrangements, including significant transactions, significant promotional programs, sales incentives or other deviations from standard order fulfillment processes; |
| • | formalizing periodic revenue recognition training for all finance, order fulfillment and customer-facing employees; |
| • | expanding the scope of internal audit testing of controls over the order-to-cash cycles at subsidiaries as well as, implementing more precise entity level controls related to revenue transactions to ensure strict adherence to Company policy and procedures |
These actions are subject to ongoing review by our senior management, as well as oversight by the audit committee of our board of directors. Although we plan to complete this remediation process as quickly as possible, we cannot, at this time, estimate when such remediation may occur, and our initiatives may not prove successful in remediating these material weaknesses. Management may determine to enhance other existing controls and/or implement additional controls as the implementation progresses. It will take time to determine whether the additional controls we are implementing will be sufficient to accomplish their intended purpose; accordingly, these material weaknesses may continue for a period of time. While the audit committee of our board of directors and senior management are closely monitoring this implementation, until the remediation efforts discussed in this section, including any additional remediation efforts that our senior management identifies as necessary, are completed, tested and determined effective, we will not be able to conclude that these material weaknesses have been remediated.
| (iv) | Changes in Internal Control over Financial Reporting |
There were no changes in our internal control over financial reporting that occurred during our fourth fiscal quarter of 2015 that has materially affected, or is reasonably likely to materially affect, our internal control over financial reporting.
| ITEM 9B. | OTHER INFORMATION |
None.
91
Table of Contents
PART III
| ITEM 10. | DIRECTORS, EXECUTIVE OFFICERS AND CORPORATE GOVERNANCE |
Directors and Executive Officers
The following biographical descriptions provide information regarding our directors and our executive officers who are not directors.
| Name |
Age | Position | ||||
| Namal Nawana |
45 | Director, Chief Executive Officer and President | ||||
| James Hinrichs |
49 | Chief Financial Officer, Executive Vice President | ||||
| John Bridgen, Ph.D. |
69 | Senior Vice President, Business Development | ||||
| Ellen Chiniara |
57 | Senior Vice President, General Counsel, Chief Ethics and Compliance Officer and Secretary | ||||
| Daniella Cramp |
42 | Global President, Cardiometabolic | ||||
| Mark Gladwell |
41 | Senior Vice President, Global Operations | ||||
| Melissa Guerdan |
42 | Senior Vice President, Global Quality and Regulatory Assurance | ||||
| Robert Hargadon |
59 | Senior Vice President, Global Human Resources | ||||
| Sanjay Malkani |
46 | Global President, Toxicology | ||||
| Avi Pelossof |
53 | Global President, Infectious Disease | ||||
| Renuka Uppaluri, Ph.D. |
45 | Senior Vice President, Global Research and Development | ||||
| Jonathan Wygant |
45 | Chief Accounting Officer, Controller and Vice President of Finance | ||||
| Gregg J. Powers |
53 | Chairman of the Board | ||||
| Håkan Björklund, Ph.D. |
60 | Director | ||||
| Geoffrey S. Ginsburg, M.D., Ph.D. |
59 | Director | ||||
| Carol R. Goldberg |
85 | Director | ||||
| John F. Levy |
69 | Director | ||||
| Brian A. Markison |
56 | Director | ||||
| Thomas McKillop, Ph.D. |
73 | Director | ||||
| John A. Quelch, D.B.A. |
64 | Director | ||||
| James Roosevelt, Jr. |
70 | Director | ||||
Namal Nawana has served as a member of our Board and Chief Executive Officer and President since October 2014. Mr. Nawana joined us as Chief Operating Officer in December 2012 before being named Interim Chief Executive Officer in July 2014. Before coming to Alere, Mr. Nawana spent 15 years at Johnson & Johnson in various leadership roles. Most recently, he served as the Worldwide President of DePuy Synthes Spine, a Johnson & Johnson company, from February 2011 to November 2012. Prior to that, Mr. Nawana served as Area Vice President for Johnson & Johnson Medical in Australia and New Zealand from January 2009 to February 2011, Chairman of the DePuy Asia Pacific Franchise Council, General Manager for DePuy Australia from 2007 to December 2008 and General Manager for DePuy Canada from 2004 to 2007. Mr. Nawana holds an Honors Degree in Mechanical Engineering and a Master’s degree in Medical Science from the University of Adelaide, South Australia, and an MBA from Henley Management College. He is a member of the Board of Directors of Advamed Dx, a diagnostics industry organization, and the Board of Directors of Malaria No More.
Jim Hinrichs joined us as Executive Vice President and Chief Financial Officer in April 2015. Before joining us, Mr. Hinrichs served as Chief Financial Officer at CareFusion Corp., a global medical technology corporation, from December 2010 until Becton Dickinson acquired CareFusion in March 2015. Prior to that role, Mr. Hinrichs served in various roles at CareFusion, including Senior Vice President of Global Customer Support and Corporate Controller from January 2009 to December 2010. Mr. Hinrichs joined Cardinal Health, a global health services and products company, in 2004 and
92
Table of Contents
served in a variety of roles, including Executive Vice President and Controller, and Chief Financial Officer of the Clinical and Medical Products segment and Healthcare Supply Chain Services segment prior to the spin-off of CareFusion from Cardinal Health in August 2009. Before joining Cardinal Health in 2004, Mr. Hinrichs compiled 12 years of finance and marketing experience at Merck & Co. and SangStat Medical Corporation. Since April 2014, Mr. Hinrichs has served as a director of Orthofix International N.V., a global medical device company, where he is the Chair of the Audit and Finance Committee.
John Bridgen, Ph.D. has served as Senior Vice President, Business Development since July 2010, after serving as our Vice President, Business Development from June 2006 to July 2010. He served as our Vice President, Strategy from September 2005 to June 2006. Dr. Bridgen joined our Company in September 2002, upon our acquisition of Wampole Laboratories, LLC. Dr. Bridgen served as President of Wampole from August 1984 until September 2005. Prior to joining Wampole, Dr. Bridgen had global sales and marketing responsibility for the hematology and immunology business units of Ortho Diagnostic Systems Inc., a Johnson & Johnson company.
Ellen Chiniara serves as Senior Vice President, General Counsel, Chief Ethics and Compliance Officer and Secretary and is responsible for managing legal, compliance and government affairs for our Company. Ms. Chiniara joined us in October 2006 as General Counsel, Professional Diagnostics and Assistant Secretary and became our Vice President and General Counsel in May 2007, Secretary in May 2010 and our Senior Vice President and Chief Ethics and Compliance Officer in July 2014. From 2002 to 2006, Ms. Chiniara was Associate General Counsel, Neurology of Serono, Inc., a biopharmaceutical company. Previously, she served as General Counsel to a healthcare venture capital fund and a healthcare management services organization, where she also was Chief Operating Officer of its clinical trial site management division. From 1994 to 1997, Ms. Chiniara was Assistant General Counsel at Value Health, a specialty managed healthcare company, where she focused on disease management and healthcare information technology. Prior to 1994, Ms. Chiniara was a partner with Hale and Dorr (now WilmerHale). Ms. Chiniara received her J.D. from Stanford Law School.
Daniella Cramp has served as Global President of our cardiometabolic business unit since January 2014. In this role she focuses on diagnostic products primarily marketed into hospitals and our cardiovascular and diabetes diagnostics and health management solutions. Previously, Ms. Cramp served as Global President of our chronic care business unit from March 2013 to January 2014 and as the Vice President of our cardiovascular business unit from September 2007 to March 2013. Ms. Cramp joined our Company in June 2007 upon our acquisition of Biosite Incorporated. Ms. Cramp served as the director of marketing for Biosite from 2004 to 2007. Prior to that, Ms. Cramp was the director of Biosite’s physician office segment where she initiated Biosite’s entry into the outpatient setting with its diagnostic platform, Triage. Ms. Cramp also served as the product director for the launch of the Triage BNP Test, the world’s first blood test for heart failure diagnosis. Prior to joining Biosite, Ms. Cramp worked in the pharmaceutical industry for Astra Merck and later AstraZeneca from 1994 to 2000 in various sales and marketing roles supporting cardiovascular and gastrointestinal pharmaceutical products.
Mark Gladwell was appointed Senior Vice President, Global Operations in January 2015. Previously, he served as Vice President of Operations for North America, Europe, Middle East and Africa since January 2014. Mr. Gladwell joined Alere in 2001 and has served in various roles since, including Vice President of Operations for North America from September 2011 to December 2013, and Vice President of Quality and Technical Service from 2007 to 2010. Before joining Alere, Mr. Gladwell held operations, quality and project leadership positions with Johnson & Johnson, Agfa Gavert and DuPont, culminating in more than 18 years of experience in manufacturing high-volume, high-technology in-vitro diagnostics and medical devices.
Melissa Guerdan has served as Senior Vice President, Global Quality and Regulatory since July 2014. She joined Alere in August 2012 as Vice President, Global Quality Assurance and became Vice President, Global Quality and Regulatory in October 2013. Prior to coming to Alere, Ms. Guerdan was Vice President of Quality Operations for Covidien’s pharmaceuticals business from March 2008 to
93
Table of Contents
August 2012. In this capacity, she was responsible for leading quality and compliance across 11 global manufacturing facilities producing and distributing products ranging from urological imaging systems, contrast media/delivery systems, nuclear medicine products, and specialty generic pharmaceuticals. Prior to that, Ms. Guerdan served as Director of Quality for Baxter’s Renal and Medication Delivery businesses from 2004 to 2008. In addition to these key leadership roles, Ms. Guerdan also held various quality positions at Pfizer and Aventis Behring.
Robert Hargadon joined us as Vice President, Global Human Resources, formerly referred to as Global Culture and Performance, in October 2010 and was promoted to Senior Vice President, Global Human Resources in July 2014. He has over 30 years of experience in human resources, leadership and organization development. Mr. Hargadon served as Vice President, Human Resources at drugstore.com, an online pharmacy, from November 2006 through October 2010. Prior to that, Mr. Hargadon was General Manager, Corporate Learning and Development at Microsoft from September 2005 to April 2006 and held various human resources leadership positions at Boston Scientific Corporation, a medical device manufacturer, from 1997 to 2005, including Vice President of International Human Resources and Vice President, Leadership Development from September 1997 to June 2005. Mr. Hargadon served as Vice President, Learning and Development at Fidelity Investments from 1993 to 1997. Mr. Hargadon also had 15 years of experience with the consulting firms Novations Group, Inc. and Harbridge House, which was acquired by PricewaterhouseCoopers LLP.
Sanjay Malkani has served as Global President, Toxicology since February 2013. Previously, he led our Global Toxicology unit as Vice President and has been directly responsible for that unit’s primary US and European operations since January 2011. Mr. Malkani joined our Company as Vice President of the Toxicology Strategic Business Unit in February 2008, with responsibility for the Global Toxicology growth strategy and direct management of the US Toxicology operations. Mr. Malkani joined us from Roche Diagnostics, Inc., where he served as Vice President of Marketing for US Point-of-Care Diagnostics from 2006 to 2007, Vice President of Marketing for US Diabetes Care Hospital in 2005, and held various successive sales and marketing roles in the U.S. Diabetes Care business between 2001 and 2005. Prior to 2001, Mr. Malkani held various commercial positions at The Cambridge Group, Inc. and several start-up technology companies. Prior to completing his MBA at the Kellogg Graduate School of Management, Mr. Malkani held several sales positions at The Dow Chemical Company, Inc., where he started his career in 1991.
Avi Pelossof was appointed Global President of our infectious disease business unit in March 2013, after serving as Vice President of our infectious disease business unit from February 2008 to February 2013. Mr. Pelossof joined Alere as Vice President, Blood-Borne Pathogens in January 2007 and served in that role until January 2008. Mr. Pelossof has more than 20 years of experience in diagnostics, global health and international finance, including senior roles at Chembio Diagnostic Systems, Inc., a manufacturer of diagnostic tests for infectious diseases, and Citigroup.
Renuka Uppaluri, Ph.D. joined us as Senior Vice President, Global R&D in February 2015. Dr. Uppaluri brings with her a wealth of experience in leading research and development organizations, most recently serving as Vice President, Global R&D at Covidien, from September 2009 to February 2015, where she led the respiratory and monitoring solutions R&D team to several substantive product launches. Before Covidien, Dr. Uppaluri spent ten years at GE Healthcare, starting as a systems engineer and ending as the General Manager of the Global Diagnostics X-Ray Imaging division. Since April 2016, Dr. Uppaluri has served as a director of Altran Technologies SA, a French innovation and engineering consulting firm. Dr. Uppaluri received a BE degree from the University of Mumbai and her Ph.D. from the University of Iowa.
Jonathan Wygant has served as our Chief Accounting Officer and Controller since April 2016 and as our Vice President of Finance since January 2016. From August 2013 until he joined us, Mr. Wygant was the Senior Vice President, Controller and Chief Accounting Officer of CareFusion Corporation. From May 2010 to August 2013, Mr. Wygant was CareFusion’s Vice President, Finance
94
Table of Contents
and Assistant Controller, and from August 2009 to May 2010, he was CareFusion’s Director, Finance. Before CareFusion’s spinoff from Cardinal Health in August 2009, he served as Cardinal Health’s Director, Finance—Clinical and Medical Products. Mr. Wygant previously held various other accounting positions, including as a senior auditor with the accounting firm of PricewaterhouseCoopers LLP.
Gregg J. Powers joined our Board in August 2013 and became Chairman of the Board in May 2014. Mr. Powers has served as the Chairman of Private Capital Management, an institutional investment management firm, since 2009 and as that firm’s Chief Executive Officer since 2008. Mr. Powers joined Private Capital Management in 1988 and served in a number of roles with that firm, including as its President, before assuming his current positions. In addition to his duties as Chairman and Chief Executive Officer of Private Capital Management, Mr. Powers also serves as a portfolio manager for that firm and oversees all aspects of the investment of client portfolios. Since August 2013, Mr. Powers has served as a director of Quantum Corporation, a data protection and management company, where he serves as the Chair of the Corporate Governance and Nominating Committee. Mr. Powers is a member of our Board’s Nominating and Corporate Governance Committee. Mr. Powers’ appointment to our Board was in response to stockholder feedback regarding the importance of direct stockholder representation, and his substantial experience in the investment management field provides our Board with valuable insights into the concerns of stockholders.
Håkan Björklund, Ph.D. joined our Board in August 2013. Dr. Björklund has been a healthcare industry executive at Avista Capital Partners, L.P., a private equity firm, since October 2011. Before joining Avista Capital Partners, Dr. Björklund was the Chief Executive Officer of Nycomed Luxco SA, a Swiss pharmaceuticals company, from May 1999 until its sale to Takeda Pharmaceuticals in September 2011. Before his tenure at Nycomed, Dr. Björklund held various positions at companies that now form a part of the pharmaceuticals company AstraZeneca plc, including President of Astra Pain Control from 1989 to 1991, President of Astra Draco AB, a research and development unit, from 1991 to 1996 and Regional Director of Astra AB from 1996 to 1999. Dr. Björklund has served as a member of the board of directors of Coloplast A/S, a Danish medical device company, since December 2006, as the Chairman of the Board of Trimb Healthcare AB, a Swedish pharmaceuticals company, since July 2015, as a member of the board of directors of Atos Medical AB, a Swedish medical device company, since April 2005, and as a member of the board of directors of Acino Pharma AG, a Swiss pharmaceutical company, since December 2013. Since May 24, 2016, Dr. Bjorklund has served as Chairman of the Board of Swedish Orphan Biovitrum (Sobi), a Swedish pharmaceutical company. He was also a director at Danisco A/S, a Danish food ingredients company, from April 2004 until its acquisition by Dupont in June 2011. Dr. Björklund is a member of our Board’s Compensation Committee. Through his operating experience as Chief Executive Officer of a European healthcare company, Dr. Björklund brings to our Board industry and global operations expertise.
Geoffrey S. Ginsburg, M.D., Ph.D. joined our Board in July 2015. Dr. Ginsburg has served as the founding director for the Center for Applied Genomics & Precision Medicine at the Duke University Medical Center since July 2014 and has also served at Duke University as a professor of Medicine since September 2004, Pathology since September 2004 and Biomedical Engineering since September 2013. Dr. Ginsburg has served as a professor in the School of Nursing at Duke University since January 2016. His work spans oncology, infectious disease, cardiovascular disease and metabolic disorders, and his research addresses the challenges for translating genomic information into medicine practice using new and innovative paradigms, and the integration of precision medicine into healthcare. Dr. Ginsburg currently serves as an expert panel member for Genome Canada, as a member of the Board of External Experts for the National Heart, Lung and Blood Institute, as co-Chair of the Institute of Medicine’s Roundtable on Genomic and Precision Health, as a member of the advisory council for the National Center for Accelerating Translational Science, as co-Chair of the Cures Acceleration Network, co-Chair of the IOM/NIH Global Genomic Medicine Collaborative, and as a member of the World Economic Forum’s Global Agenda Council on the Future of the Health Sector. Prior to Duke, Dr. Ginsburg worked at Millennium Pharmaceuticals, Inc. from 1997 to 2004, serving as
95
Table of Contents
senior program director for cardiovascular diseases and later as Vice President of Molecular and Personalized Medicine, where he was responsible for developing pharmacogenomics and biomarker strategies for therapeutics. Dr. Ginsburg is a member of our Board’s Nominating and Corporate Governance Committee. Dr. Ginsburg is an internationally recognized expert in genomics and personalized medicine. Dr. Ginsburg’s substantial technical experience in the fields in which we operate brings useful insight to our Board with respect to our operations, our products and our product development programs.
Carol R. Goldberg has served on our Board since May 2001. Ms. Goldberg served as a director of our predecessor company, Inverness Medical Technology, from August 1992 through November 2001, when that company was acquired by Johnson & Johnson. Since December 1989, she has served as President of The AVCAR Group, Ltd., an investment and management consulting firm in Boston, Massachusetts. Ms. Goldberg is a member of our Board’s Compensation Committee. As the former President and Chief Operating Officer of Stop & Shop Companies, Inc., Ms. Goldberg brings a wealth of financial, marketing and consumer expertise to our Board.
John F. Levy has served on our Board since May 2001 and served as our lead independent director from October 2013 to May 2014. Mr. Levy served as a director of Inverness Medical Technology from August 1996 through November 2001, when that company was acquired by Johnson & Johnson. Since 1993, he has been an independent consultant. Mr. Levy served as President and Chief Executive Officer of Waban, Inc., a warehouse merchandising company, from 1989 to 1993. Mr. Levy is Chairperson of our Board’s Audit Committee. A former chief executive officer, Mr. Levy brings to our Board financial expertise, investment experience and knowledge of distribution systems.
Brian A. Markison joined our Board in August 2013. Mr. Markison has been a healthcare industry executive at Avista Capital Partners, L.P., a private equity firm, since September 2012. Before joining Avista Capital Partners, Mr. Markison served as the President and Chief Executive Officer and a member of the board of directors of Fougera Pharmaceuticals Inc., a specialty dermatology company, from July 2011 until its sale to Sandoz, a division of Novartis, in July 2012. Prior to that, Mr. Markison was the President and Chief Executive Officer of King Pharmaceuticals, Inc., a manufacturer of pharmaceuticals and medical devices, from July 2004 through the closing of its sale to Pfizer in March 2011. Mr. Markison joined King Pharmaceuticals as Chief Operating Officer in March 2004 and served in that role until his promotion to Chief Executive Officer. From July 2007 to February 2011, Mr. Markison also served as the Chairman of the board of directors of King Pharmaceuticals. Before joining King Pharmaceuticals, Mr. Markison held various positions at Bristol-Myers Squibb from 1982 to 2004, including President of Neuroscience/Infectious Disease and Dermatology and President of Oncology, Virology and Oncology Therapeutics Network. Mr. Markison has served as the Lead Outside Director on the board of directors of Immunomedics, Inc., a biopharmaceutical therapeutics company, since December 2004, the Chairman of the board of directors of Rosetta Genomics Ltd., a leading developer of microRNA-based molecular diagnostics, since April 2011, the Chairman of the board of directors of Lantheus Medical Imaging, Inc., a developer, manufacturer and distributor of diagnostic imaging agents, since January 2013, where he has served as a director since September 2012. He served as a member of the board of directors of PharmAthene, Inc., a developer of medical countermeasures against biological and chemical threats, from September 2011 to March 2015. In December 2013, Mr. Markison became Executive Chairman of Vertical Pharmaceuticals, a privately-held specialty pharma company. Mr. Markison is on the compensation committees of Immunomedics, Inc. and Rosetta Genomics Ltd. He also serves on the board of trustees for the College of New Jersey. Mr. Markison is a member of our Board’s Compensation Committee and Audit Committee. Mr. Markison’s long tenure and experience as an operating executive in the healthcare industry, including as Chief Executive Officer of King Pharmaceuticals, which completed several acquisitions before being sold to Pfizer in 2011, is of substantial value to our Board.
Sir Thomas Fulton Wilson McKillop, Ph.D. joined our Board in August 2013. Dr. McKillop has been the Chairman of Evolva Holdings SA, a biosynthetic technologies company listed on the Swiss
96
Table of Contents
Stock Exchange that produces sustainable ingredients for health nutrition and wellness, since May 2012, having served as a non-executive director since June 2010. In 1994, Dr. McKillop was appointed the Chief Executive Officer of Zeneca Pharmaceuticals, which was formed as a result of the separation by Imperial Chemical Industries of its pharmaceuticals, agrochemicals and specialties businesses. In April 1999, following the merger of Zeneca plc and Astra AB, Dr. McKillop was appointed the Chief Executive Officer of AstraZeneca plc, a position he held until his retirement in 2005. Dr. McKillop served as the Chairman of the Royal Bank of Scotland Group from April 2006 through February 2009, the President of the Science Council in the United Kingdom from February 2007 through September 2011, and a non-executive director of BP plc, from 2004 to 2009, Lloyds TSB Group plc, from 1999 to 2004, and Nycomed Amersham plc and its predecessor companies, from 1992 to 2001. Dr. McKillop is also currently a non-executive director of UCB SA, a Euronext-listed biopharmaceuticals manufacturer, and a member of its governance, nomination and compensation committee; and Almirall, S.A., a pharmaceuticals company listed on the Madrid, Barcelona, Bilbao and Valencia stock exchanges, for which he is also President of its appointments and remuneration committee. In addition, Dr. McKillop has held varying roles in industry groups, including tenures as the Chairman of the British Pharma Group, President of the European Federation of Pharmaceuticals Industries and Associations, Chairman of the Pharmaceutical Industry Task Force and as a member of the European Round Table of Industrialists and the European Financial Services Round Table. In 2002, Dr. McKillop was knighted in recognition of his services to the pharmaceuticals industry, and he is a Fellow of the Royal Society of London, a Fellow of the Royal Society of Edinburgh and a Fellow of the United Kingdom Academy of Medical Sciences. Dr. McKillop is a member of our Board’s Audit Committee. Dr. McKillop’s operating experience as Chief Executive Officer of Zeneca plc, and his leadership of AstraZeneca plc, a global pharmaceutical company with a particular emphasis on European and emerging markets, is of substantial value to our Board.
John A. Quelch, C.B.E., D.B.A. joined our Board in March 2003. Dr. Quelch has been the Charles Edward Wilson Professor of Business Administration at Harvard Business School and professor in Health Policy and Management at Harvard School of Public Health since January 2013. Between February 2011 and January 2013, Dr. Quelch served as Dean, Vice President and Distinguished Professor of International Management at the China Europe International Business School in Shanghai. From July 2001 through January 2011, he was professor and Senior Associate Dean at the Harvard Business School. From July 1998 through June 2001, he was Dean of the London Business School. Dr. Quelch also serves as a director of Aramark, a food service, facilities management and uniforms company, and Luvo Inc., a privately held retail food products company. Dr. Quelch served as a director of WPP plc from 1988 to 2013, Pepsi Bottling Group from 2005 to 2010 and Gentiva Health Services, Inc. from 2006 to 2009. He is Chairperson of our Board’s Nominating and Corporate Governance Committee. Through his international business experience and academic credentials, Dr. Quelch brings to our Board both industry and academic expertise in marketing and organizational management.
James Roosevelt, Jr. joined our Board in February 2009. Mr. Roosevelt served as the Chief Executive Officer of Tufts Health Plan from 2005 until January 2016 and served as the President of Tufts Health Plan from 2005 until September 2013. He now serves as an advisor to the board and the CEO of Tufts Health Plan. From 1999 to 2005, Mr. Roosevelt was Senior Vice President and General Counsel of Tufts Health Plan. Mr. Roosevelt also serves as Co-Chair of the Rules and By-laws Committee of the Democratic National Committee, Co-Chair of the board of directors for the Tufts Health Care Institute, and a member of the board of directors of America’s Health Insurance Plans. Mr. Roosevelt is Chairperson of our Board’s Compensation Committee and a member of our Board’s Nominating and Corporate Governance Committee. Mr. Roosevelt brings to our Board extensive senior management, policy-making and financial experience within the health insurance industry, which includes important customers of our Company and is a driving force behind the demand for control of healthcare costs, which is reshaping the diagnostic and health management industries in which we operate.
97
Table of Contents
Corporate Governance
The Audit Committee
Our Board has a standing Audit Committee consisting of Mr. Levy, its Chairperson, Mr. Markison and Dr. McKillop. Among other things, the Audit Committee oversees our accounting and financial reporting processes, including the selection, retention and oversight of our independent registered public accounting firm and the pre-approval of all auditing and non-auditing services provided by our independent registered public accounting firm. In addition, the Audit Committee’s duties include assisting with the oversight of our compliance with legal and regulatory requirements. The Board has determined that Mr. Levy is an “audit committee financial expert,” as defined by SEC rules adopted pursuant to the Sarbanes-Oxley Act. A copy of our Audit Committee charter is posted in the Corporate Governance section of the Investors section of our website at www.alere.com.
Code of Ethics
Our Board has adopted a code of ethics that applies to all of our employees and agents worldwide, including our chief executive officer, our chief financial officer, our chief accounting officer, our other executive officers and the members of the Board. Known as the Alere Inc. Code of Conduct, the code of ethics is posted in its entirety in the Corporate Governance section of the Investors page of our website at www.alere.com. We intend to make required disclosures of amendments to our code of ethics, or waivers of a provision of our code of ethics, on the Corporate Governance page of our website.
Section 16(a) Beneficial Ownership Reporting Compliance
Section 16(a) of the Securities Exchange Act of 1934, as amended, or the Exchange Act, requires our officers and directors and persons who beneficially own more than 10% of our outstanding shares of common stock or Series B preferred stock to file reports of ownership and changes in ownership with the Securities and Exchange Commission and the New York Stock Exchange. Such persons are required by applicable regulations to furnish us with copies of all reports filed pursuant to Section 16(a).
To our knowledge, based solely on a review of the copies of such reports received by us, we believe that for the fiscal year ended December 31, 2015, all of our officers, directors and 10% beneficial owners complied with the requirements of Section 16(a), except for one Form 3 for Mark Gladwell, due in January 2015, which was filed late.
| ITEM 11. | EXECUTIVE COMPENSATION |
Compensation Discussion and Analysis
This Compensation Discussion and Analysis discusses the compensation paid to our “named executive officers.” Based on 2015 total compensation, our named executive officers are:
| • | Namal Nawana, our President and Chief Executive Officer, or our CEO; |
| • | James Hinrichs, our Executive Vice President and Chief Financial Officer, or our CFO; |
| • | Sanjay Malkani, our Global President, Toxicology; |
| • | Daniella Cramp, our Global President, Cardiometabolic; |
| • | Renuka Uppaluri, our Senior Vice President, Research and Development; and |
| • | David Teitel, our former Chief Financial Officer, Vice President and Treasurer. |
Philosophy and Objectives
In February 2015, the Compensation Committee approved an updated pay philosophy for our company. The objective of our executive compensation program for 2015 was to attract, retain and
98
Table of Contents
motivate the talented and dedicated executives who were critical to our goals of continued growth, innovation, increasing profitability and, ultimately, maximizing stockholder value. Specifically, we sought to attract and reward executives who displayed certain fundamental leadership characteristics that we had identified as consistent with our corporate goals and culture. We sought to provide our named executive officers, as well as a broad group of executives whom we believed to be critical to achievement of our strategic goals, with what we believed to be a competitive total compensation package, consisting primarily of base salary, performance-based cash compensation in the form of a short-term incentive plan, annual long-term incentives in the form of equity compensation and a broad-based benefits program. Base salary and benefits are intended to provide a competitive level of fixed compensation, our new short-term incentive plan is designed to provide a prompt reward for achievement of annual operational goals, and equity compensation awards are designed to reward executives, at competitive levels, for their role in helping to achieve increases in the value of our common stock.
Under our updated pay philosophy, we sought to shift the target compensation of our named executive officers toward a greater emphasis on variable compensation, including equity compensation. The Compensation Committee determined that it would be our goal to target the market 50th percentile for base salary, the market 50th percentile for short-term incentive cash compensation (as a percentage of base salary) and the market 50th to 75th percentile for annual long-term equity incentive awards, with the latter two variable compensation components to be subject to increases or decreases based on performance. The Compensation Committee determined that implementation of the updated pay philosophy may require a multi-year effort before the elements of compensation would be at the desired levels identified in our updated pay philosophy. Given that the 2014 base salaries of our named executive officers exceeded the market 50th percentile, the Compensation Committee decided not to increase the base salaries of our named executive officers for 2015. In part to mitigate the impact of above-market salaries for 2015, the Compensation Committee determined that the short-term incentive cash compensation for our named executive officers for 2015 should generally target levels closer to the market 25th percentile, rather than the 50th percentile, but should be recalibrated for 2016 and subsequent years with the goal of having a short-term incentive cash compensation target at the market 50th percentile. Lastly, the Compensation Committee determined that our equity compensation should be structured through a process of regular annual grants for continuing employees and initial grants for new employees at the time of hiring.
Our 2015 executive compensation program aimed to provide a risk-balanced compensation package that was both competitive in our market sector and relevant to the individual executive. Our 2015 compensation program sought to reward each executive’s individual performance by considering generally their past and potential contributions to our achievement of key strategic goals, such as revenue generation, organic growth, margin improvement and the establishment and maintenance of key strategic relationships. These factors were considered, along with other factors, in determining the amount of performance-based incentive compensation to be awarded to each executive. Our Compensation Committee believed that our 2015 executive compensation program would appropriately focus our executives’ attention on both achievement of our stated corporate objectives and long-term stock price appreciation.
In accordance with the Dodd-Frank Wall Street Reform and Consumer Protection Act, at our 2014 annual meeting of stockholders (the most recent meeting before the Compensation Committee updated our compensation philosophy in February 2015), we submitted a non-binding, advisory proposal to our stockholders to approve the compensation paid to our named executive officers for 2013. Ninety-nine percent of the votes cast on that proposal supported our executive compensation practices for 2013, as set forth in our 2014 proxy statement. Our Compensation Committee interpreted the results of this advisory vote as a strong affirmation of our overall executive compensation practices. Our Compensation Committee considered this very high level of support from stockholders when, in February 2015, it implemented our executive compensation program for 2015, which the Compensation Committee believed would be more attractive to our stockholders because of its greater emphasis on variable compensation.
99
Table of Contents
At our annual meeting of stockholders in July 2015, we submitted a similar non-binding advisory proposal to our stockholders to approve the compensation paid to our named executive officers for 2014. Seventy-three percent of the votes cast on that proposal supported our executive compensation practices for 2014, as set forth in our 2015 proxy statement. Our Compensation Committee believes that support for our executive compensation practices declined primarily as a result of our decisions in the fall of 2014, in the midst of fundamental strategic changes that included the resignations of our CEO and two other co-founders, to grant retention awards to certain executive officers and enter into change of control severance agreements with them, which agreements contained, among other things, excise tax gross-up protections. Institutional Shareholder Services, a prominent proxy advisory firm, expressly identified these excise tax gross-up provisions as the basis for its recommendation that our stockholders vote against the approval of our executive compensation practices at our 2015 annual meeting of stockholders. In June 2015, based on this input and feedback from shareholders, our Compensation Committee determined that it was no longer appropriate to include excise tax gross-up protections in change of control severance agreements provided to our officers and stated that it did not intend to approve inclusion of such protections in future agreements with our officers. From that time through the date of this Annual Report on Form 10-K, we have not provided any additional excise tax gross-up protections to any of our officers. The Compensation Committee was aware of the results of this advisory vote at the time it assessed achievement of the performance goals established as part of our 2015 Short-Term Incentive Plan, or 2015 STIP, which are described in more detail below.
Executive Compensation Process
The compensation of our named executive officers, as well as our other executive officers, has been reviewed by our Compensation Committee at least annually for consistency with our compensation philosophy and objectives. Our CEO, our former CFO and, after he joined us, our current CFO, participated in this review by making their own recommendations as to the base cash compensation and performance-based compensation of our executive officers to the Compensation Committee. The Compensation Committee has considered the recommendations of management in assessing executive compensation, but from time to time it has also gathered and relied on other data and resources, and from time to time has utilized the services of a compensation consultant in reviewing and determining executive compensation. In 2015, the Compensation Committee engaged a compensation consultant, Radford, an Aon Hewitt company, to assist the committee in evaluating the compensation of our executive officers for that year.
In reviewing executive compensation for 2015, the Compensation Committee and management sought to evaluate the competitiveness of our executive compensation program by considering the practices of a peer group of companies of similar size and market focus as well as survey data from the 2014 Radford Global Survey Suite with respect to (a) a group of public medical device and diagnostic companies with revenue between $1 billion and $10 billion and (b) a group of named peer group companies that participated in the Radford Global Life Sciences and Global Technology Surveys. We refer to this survey data as the Radford Survey Data. The Radford Survey Data was weighted equally between these two groups. Radford then compiled a competitive market composite of compensation information that was weighted equally between the peer group data, drawn from public SEC filings, and the Radford Survey Data. The composite provided comprehensive baseline compensation data on positions at the executive, management and professional levels, including base cash compensation, total cash compensation, options and other equity compensation, for 782 life sciences companies. While benchmarking may not always be appropriate as a stand-alone tool for setting compensation due to the aspects of our business and objectives that may be unique to us, the Compensation Committee believed that gathering this compensation information was an important part of our executive compensation decision-making process.
In 2014 and early 2015, we disposed of a number of businesses, including our health management business, and the Compensation Committee believed that the peer group of companies to be used to evaluate the competitiveness of the compensation of our named executive officers in
100
Table of Contents
2015 should be reevaluated in light of these dispositions. As part of its engagement, Radford assisted the Compensation Committee in performing this reevaluation. With Radford’s assistance, the Compensation Committee sought to identify a peer group of diagnostic, medical device and healthcare companies with similar revenue, market capitalization and employee headcount, with particular consideration given to competitors. The Compensation Committee also sought to eliminate health management companies from the peer group. The peer group previously used by the Compensation Committee for purposes of evaluating the competitiveness of the compensation of our named executive officers consisted of eighteen publicly traded companies in a similar industry space and with similar revenues and market capitalizations. Of the previous peer group companies, 22% were health management companies and 78% were diagnostics/medical equipment companies. Specifically, the peer group consisted of the following companies for purposes of establishing executive compensation in 2013, and no changes were made to the peer group for purposes of determining executive compensation in 2014:
For 2015, the Compensation Committee selected the following nineteen companies for our peer group:
In determining each component of an executive’s compensation under our processes, the Compensation Committee considered the relevant benchmark data as well as numerous factors particular to each executive, including:
| • | The executive’s particular background, including prior relevant work experience; |
| • | The demand for individuals with the executive’s specific expertise and experience; |
| • | The executive’s role with us; |
101
Table of Contents
| • | The executive’s performance and contribution to our achievement of corporate goals and objectives; and |
| • | Comparison to our other executives. |
The Compensation Committee considered these factors when deciding whether a named executive officer merited compensation at, above or below the benchmark level for his or her position.
In awarding compensation to certain of our named executive officers for 2015, the Compensation Committee also took into account contractual commitments we made at the time of their hiring or promotion. The relevant material terms of these commitments are described in more detail below. The contractual commitments we made to Mr. Hinrichs and Dr. Uppaluri at the time of their hiring in 2015 were not based on consideration of any particular benchmark but instead were based primarily on considerations of our overall executive compensation structure, the total compensation packages they received from their previous employers, our desire to offer them compensation packages that they would regard as competitive, the results of our negotiations to hire them, internal pay equity, affordability and our broad familiarity with compensation terms in the external marketplace.
As previously disclosed, on January 30, 2016 we entered into an agreement and plan of merger with Abbott Laboratories, or the merger agreement. We expect that, for purposes of the change of control severance agreements and similar contractual rights described below, the transactions contemplated by the merger agreement will constitute a change of control. For more information regarding the anticipated value of the payments that our named executive officers will or may be entitled to receive either upon the consummation of the change of control or upon termination of employment for specified reasons within a specified period of time following the change of control, see “Compensation of Executive Officers and Directors—Severance Agreements and Potential Payments upon Termination or Change of Control” below.
Promotion of Namal Nawana to President and CEO
In connection with his promotion to full-time President and CEO and appointment to our Board of Directors in October 2014, the Compensation Committee and Mr. Nawana agreed, among other things, that he would receive a cash bonus of $500,000, payable in January 2015, for his service as Interim CEO and Chief Operating Officer during the partial year 2014 and that his target bonus opportunity for 2015 would be equal to 100% of his annual base salary, with a threshold payout of 50% of his annual base salary and a maximum payout of 150%. The Compensation Committee and Mr. Nawana agreed that this bonus opportunity would be in lieu of any other annual incentive compensation plan to be implemented for executives for 2015.
Also in October 2014, the Compensation Committee agreed to grant Mr. Nawana, among other equity awards, 150,000 performance stock units, or PSUs, subject to determination of applicable performance targets. The Compensation Committee established the performance targets in February 2015 and, accordingly, we have included in Mr. Nawana’s compensation for 2015, as reported in the Summary Compensation Table, the February 2015 grant date fair value of the PSUs, based on our assessment, as of the date of grant, of the probable outcome of the performance conditions. The PSUs vest over three years in equal installments if various stock-price targets are met on or before specified dates, provided Mr. Nawana remains employed by us on the applicable vesting date. The PSUs provide that one-third of the PSUs vest on the first anniversary of the date of grant if the average closing price of our common stock over any consecutive 30 trading day period ending on or before December 31, 2015 exceeds $42.50 per share; one-third of the PSUs vest on the second anniversary of the date of grant if the average closing price of our common stock over any consecutive 30 trading day period ending on or before December 31, 2016 exceeds $47.50 per share; and one-third of the PSUs vest on the third anniversary of the date of grant if the average closing price of our common stock over any consecutive 30 trading day period ending on or before December 31, 2017 exceeds $52.50 per share. We met all three of these performance targets during 2015, and one-third of the PSUs vested in February 2016.
102
Table of Contents
Hiring of James Hinrichs as CFO
In March 2015, we extended an offer letter to James Hinrichs to serve as our Executive Vice President and Chief Financial Officer effective April 6, 2015 with global responsibility for finance, procurement, information technology and shared services. His offer letter provided that his annual salary would be $650,000 and that he would first be eligible for a salary review in April 2016. The offer letter further provided that Mr. Hinrichs would be eligible to participate in our 2015 STIP, which is described in more detail below, under which he would be eligible to receive cash bonuses targeted at 60% of his base salary, and that he would be eligible to participate in our equity plan and receive annual equity grants targeted at $2 million in grant date fair market value per award. Under the terms of the offer letter, he is entitled to participate in other benefits and programs available to our other officers.
As an inducement to join us, we agreed to grant Mr. Hinrichs options to purchase 250,000 shares of our common stock and 50,000 restricted stock units, or RSUs, where one RSU represents the right to receive one share of our common stock. The options have an exercise price equal to the closing price of our common stock on the date of grant, have a term of ten years and vest in four equal installments on each of the first four anniversaries of his start date. The RSUs vest in three equal installments on each of the first three anniversaries of his start date. Pursuant to the terms of the offer letter, Mr. Hinrichs entered into a change of control severance agreement in the form made available to our other executives, which is described in more detail below.
Mr. Hinrichs’ offer letter provides that, if his employment is terminated by us without cause (as defined in the letter) or by him for good reason (as defined in the letter) and he does not receive severance benefits under the change of control severance agreement, he will receive a cash payment in an amount equal to his annual base salary plus his annual target bonus, payment of any unpaid bonus for a prior completed performance period, a pro-rated bonus for the year of termination based upon actual performance, 12 months of paid medical group plan coverage, and accelerated vesting of his unvested equity compensation awards as if his termination date had occurred one year later.
Mr. Hinrichs’ offer letter also stated that, if the price of our common stock increased between the time of the announcement of his engagement and his start date of April 6, 2015, he would receive a bonus, payable in three equal annual installments commencing on May 1, 2015 and contingent on his continued employment through the payment date, equal to the aggregate amount by which the exercise price of his stock options increased during that period. Our stock price did increase during that period, entitling Mr. Hinrichs to an aggregate bonus of $407,500, one-third of which was paid in May 2015.
Hiring of Renuka Uppaluri as Senior Vice President of Research and Development
In February 2015, we hired Renuka Uppaluri as our Senior Vice President of Research and Development. In order to induce Dr. Uppaluri to accept our offer of employment, we agreed to pay her an annual salary of $400,000, subject to annual review commencing in April 2016, and a signing bonus of $100,000, payable in March 2015. The offer letter provided that Dr. Uppaluri would be eligible to participate in our 2015 STIP with a target bonus opportunity equal to 45% of her base salary, with a maximum payout of 65% of base salary and a minimum guaranteed payout of 35% of base salary. We agreed that target levels for Dr. Uppaluri under our bonus programs in subsequent years would be at the same level as other direct reports to the CEO.
We agreed to recommend an initial grant of equity awards consisting of options to purchase 40,000 shares of our common stock and 20,000 RSUs. The options have an exercise price equal to the closing price of our common stock on the date of grant, have a term of ten years and vest in four equal installments on each of the first four anniversaries of the date of grant. The RSUs vest in three equal installments on each of the first three anniversaries of the date of grant. We also agreed that Dr. Uppaluri would be eligible to participate in our annual long-term equity incentive program and would be targeted to earn a minimum of $250,000 in annual long-term equity incentive value.
103
Table of Contents
We and Dr. Uppaluri entered into a change of control severance agreement in the form made available to our other executives. We also agreed that, if Dr. Uppaluri’s position is eliminated or her duties are significantly diminished due to an internal restructuring or an internal, non-cause related reason and she leaves us, the vesting of her initial grant of equity awards would be accelerated and she would receive severance equal to 12 months’ base salary.
We agreed to pay Dr. Uppaluri cost-of-living adjustments arising from her relocation at our request to San Diego, California in the amounts of $70,000, $60,000 and $50,000, payable on July 1, 2015, July 1, 2016 and July 1, 2017, respectively, in each case contingent on her continued employment. We also agreed to pay or reimburse Dr. Uppaluri for her relocation-related expenses, which amounted to $45,186 in 2015.
Severance Arrangement with David Teitel
In September 2015, David Teitel, then our Senior Vice President of Finance, our former Chief Financial Officer, and a named executive officer, resigned from his employment and entered into a severance agreement with us. Under the severance agreement, and in recognition of his years of service to us, Mr. Teitel received a lump-sum cash payment equal to twelve months of base salary and acceleration of the vesting of 10,000 RSUs. We agreed to pay Mr. Teitel 75% of his target 2015 STIP payment (reflecting his employment for 75% of calendar 2015) in a lump-sum in 2016, based on our 2015 performance. We also provided him with continued eligibility to participate in our health and dental insurance plans for 30 days at our expense and outplacement services. Mr. Teitel provided a release of claims for our benefit.
The severance agreement included non-disclosure, non-competition and non-disparagement covenants from Mr. Teitel. The non-competition and non-solicitation covenants are in effect for a period of one year, and the non-disclosure obligation continues indefinitely.
We determined Mr. Teitel’s severance package based on considerations of his particular contributions to us, our understanding of severance terms that are typical in the industry for a senior executive officer, previous severance packages that we had provided to certain departing executives and the results of our discussions with Mr. Teitel.
Change of Control Severance Agreements
In October 2014, we entered into change of control severance agreements with the named executive officers employed at that time in order to provide them with incentives to remain with us through the consummation of any change of control rather than to seek alternative employment. The agreements were provided in the context of the fundamental strategic and management changes referred to above but also in response to certain public statements made by our former CEO in September 2014, and the terms of the agreements were deemed necessary and advisable and in the best interest of shareholders under those circumstances. These agreements provide for severance payments and other benefits in the event of a “qualifying termination” (as defined in the change in control severance agreement) in connection with a change in control of the Company. In the event of a qualifying termination, a named executive officer will be entitled to receive:
| • | an amount equal to 18 months of the executive officer’s annual base salary at the highest rate in effect at any time during the 12 months immediately preceding the time of such qualifying termination, payable in equal installments over the 18 month period following the date of the qualifying termination; |
| • | if not already paid, an amount equal to any cash component of any award granted under any executive incentive plan prior to the qualifying termination, payable promptly following the date of the qualifying termination (which will be equal to the target annual bonus for the year of such termination); |
104
Table of Contents
| • | an amount equal to the executive’s full monthly COBRA premium minus the active employee cost of coverage, payable in monthly installments for a period of 18 months after the date of the qualifying termination; |
| • | accelerated vesting of all outstanding unvested equity awards held by the named executive officer; |
| • | a release from any non-competition agreement such named executive officer may have in effect with us; and |
| • | outplacement support services for three months following the date of the qualifying termination. |
The change in control severance agreements also provide for an excise-tax gross-up payment in the event the severance benefits payable under the change in control severance agreement, combined with any other payments and benefits such named executive officer may become entitled to receive in the event of a change in control or qualifying termination following a change in control, cause such executive officer to be subject to excise tax under Section 4999 of the Internal Revenue Code of 1986, as amended.
Receipt of the payments and benefits under the change in control severance agreements is conditioned upon the applicable executive officer executing, and not revoking, a release of claims in our favor.
The executive will be entitled to the foregoing benefits, without any termination of employment, if we fail to obtain a written agreement from any successor to assume and perform our obligations under the agreement and to deliver such agreement to the executive prior to the succession. The agreement further provides that we will indemnify the executive to the fullest extent permitted by law, including the payment of expenses incurred by or on behalf of the executive in connection with any threatened, pending or completed action, suit, investigation or other proceeding, whether or not by us or in our right.
As noted above, we subsequently entered into such change of control severance agreements with Mr. Hinrichs and Dr. Uppaluri in connection with their hiring in early 2015. Also as noted above, in June 2015, the Compensation Committee discontinued the practice of granting excise tax gross-up protection to any of our officers.
Elements of Standard Compensation
For 2015, executive compensation consisted of the following elements:
Base Salary. The Compensation Committee believed that competitive base salaries were necessary to attract and retain a management team with the requisite skills to lead our company. As noted above, in February 2015, the Compensation Committee determined that it would be our goal to target the market 50th percentile for the base salaries of our named executive officers. In determining a market competitive salary for each position, the Committee considered each individual’s background, expertise and experience, as well as individual performance and past contributions to our overall goals and objectives. While many of these factors are subjective measures, and were not based on any stated quantified objectives, they played an important role in the Compensation Committee’s decision-making process. These subjective factors were considered in the aggregate and, accordingly, no specific factor played a determinative role in establishing a market competitive salary. The Compensation Committee concluded that, because the 2014 base salaries of our named executive officers exceeded the relevant benchmarks for their respective positions for 2015, the Committee would not increase those base salaries for 2015. The Committee believed that any effort to reduce base salaries to benchmark levels would be contrary to our goals of retaining and motivating our named executive officers and that, instead, we should seek to achieve the target 50th percentile
105
Table of Contents
through a strategy of maintaining the named executive officers’ base salaries at their 2014 levels until the market 50th percentile increases to equal or exceed them. As noted below, short-term incentive cash compensation for 2015 was generally set below the 50th percentile so that, despite the above-target salaries, overall cash compensation (base salary and short-term cash incentive compensation) would be at or near the 50th percentile. The Committee recognized that, in the case of certain named executive officers, the process of attaining the 50th percentile for base salaries might take one or more years.
Short-Term Incentive Plan. In February 2015, the Compensation Committee adopted the 2015 STIP for our named executive officers and certain other senior employees. The primary objective of the plan was to assist in the attraction, retention and motivation of the senior talent critical to deliver on our strategic imperatives for 2015. Participation in the 2015 STIP precluded participation in any local incentive plan that we operated. Under the 2015 STIP, participants were eligible to earn cash payments based on our performance.
The 2015 STIP generally provided that it would be funded based upon our degree of achievement of two performance-based goals: a non-GAAP measure of earnings per share and a non-GAAP measure of organic growth, in each case for the fiscal year ended December 31, 2015. The plan gave equal weight to each performance-based goal. The plan established minimum, target and maximum amounts for each performance-based goal and provided that it would fund at 50%, 100% and 150%, respectively, of the targeted amount based upon the degree of achievement of those goals. The targets correlating to 50%, 100% and 150% achievement were, in the case of the non-GAAP measure of earnings per share, $2.25, $2.45 and $2.65, respectively, and, in the case of the non-GAAP measure of organic growth, 1%, 3% and 5%, respectively. In the case of targets correlating to measures of earning per share, these figures were calculated by starting with GAAP measures of our earnings per share and then excluding the following elements: (i) certain non-cash charges, including restructuring costs, amortization expense and stock-based compensation expense, (ii) certain non-recurring charges and income, and (iii) certain other charges and income that have a significant positive or negative impact on results yet do not occur on a consistent or regular basis in our business. In the case of targets correlating to measures of organic growth, these figures were calculated by starting with GAAP measures of revenue and then excluding the following elements: (i) the impact of acquisitions and divestitures; and (ii) the impact of foreign exchange. With regard to our earnings per share and organic growth, the Compensation Committee retained the discretion to make further adjustments to our GAAP figures relating to these measurements, as it deemed appropriate, for the purpose of fixing our STIP performance-based goals. If we achieved the minimum amount of only one of these performance-based goals, the 2015 STIP would fund at 50% of the targeted amount. If we did not achieve the minimum amount of either performance based-goal, the plan would fund at 25% of the targeted amount to allow for discretionary recognition of individuals who excelled in their contributions during 2015, but no named executive officer or other member of the executive team would be eligible to receive any incentive payment under the plan. Dr. Uppaluri’s agreement provided that her payment would be based on 35%, 45% and 65% of her annual base salary for 2015, rather than 50%, 100% and 150% of her target bonus of 45% of base salary.
Target incentive payments under the 2015 STIP were based on percentages of base salaries as in effect for the first pay period in April 2015. The percentages were 100% for our CEO, 60% for our current CFO, 45% for our other named executive officers and other members of our executive team, and lower percentages for other participants. These percentages approximated the 25th percentile of the market composite data for the CEO (as of October 2014, when the target was established as a percentage of base salary), the average of the 25th and 50th percentiles of that data for our current CFO and the 25th percentile of that data for our other named executive officers. These targets were set at these lower levels in 2015 because base salaries for our named executive officers were generally above the 50th percentile. Incentive payments for our CEO, current CFO, Senior Vice President of Research and Development and former CFO were based 50% on achievement of our goal for the non-GAAP measure of earnings per share and 50% on achievement of our goal for the non-
106
Table of Contents
GAAP measure of organic growth. For determining payment under the plan, non-GAAP earnings per share and non-GAAP organic growth are calculated in the same manner as calculated for funding the 2015 STIP. Incentive payments for our other named executive officers were based 50% on achievement of our goal for the non-GAAP measure of earnings per share (calculated in the same manner as above), 25% on achievement of a non-GAAP measure of applicable global business unit revenue and 25% on achievement of a non-GAAP measure of applicable global business unit margin. In the case of the target correlating to revenue, the figure was calculated by starting with the GAAP revenue for the applicable business unit and then adding revenue related to acquired software license contracts. In the case of the target correlating to margins, the figure was calculated by starting with the GAAP gross margin for the applicable business unit and then excluding the following elements: (i) certain non-cash charges, including restructuring costs, amortization expense and stock-based compensation expense, (ii) certain non-recurring charges and income, and (iii) certain other charges and income that have a significant positive or negative impact on results yet do not occur on a consistent or regular basis in the applicable business unit. If the 2015 STIP is funded, but the applicable targets are not met all at the minimum level, the plan specifically provides for discretion to allocate the funds available under the plan. In order to receive an incentive payment, participants (other than Mr. Teitel, whose payment became governed by the terms of his separation agreement) were required to be employed and in good standing on the date of payment. Participants hired or entering the plan after April 1, 2015, including our current CFO, were eligible for prorated incentive payments; those hired after October 1, 2015 were not eligible to participate.
Based on our performance during 2015, the Compensation Committee determined that our 2015 STIP would be funded at 50% because we achieved one of the two performance-based goals established under the plan. In early 2015, the Compensation Committee established a threshold organic growth rate for 2015 of 1.0%, which was to be measured against organic revenue for 2014 based on our originally reported 2014 net revenue of $2.587 billion. Our 2015 organic revenue was $2.577 billion. On the basis of our originally reported 2014 revenue, our 2015 organic revenue represented an organic growth rate of 1.1%. We subsequently revised our 2014 net revenue to $2.575 billion, which altered our calculation of organic growth. On the basis of our revised 2014 revenue, our 2015 organic revenue represented an organic growth rate of 1.6%. Similarly, in early 2015, the Compensation Committee established a threshold for our 2015 non-GAAP earnings per share, calculated as described above, of $2.25, which was based in part on our originally reported 2014 statement of operations. Although we subsequently revised our 2014 statement of operations, our 2015 non-GAAP earnings per share was $2.08, which fell below the threshold amount of $2.25. Because we did not achieve the threshold amount for non-GAAP earnings per share, the Compensation Committee did not consider the impact of revisions to our 2014 statement of operations. As a result, as provided pursuant to the 2015 STIP, Mr. Nawana and Mr. Hinrichs received bonuses equal to 50% of the target established for each. We did not achieve our performance-based goals for non-GAAP revenue and non-GAAP margin for the cardiometabolic and toxicology global business units. The bonus payments for two of our named executive officers, Ms. Cramp as Global President, Cardiometabolic and Mr. Malkani as Global President, Toxicology, were tied to these global business unit metrics for our cardiometabolic and toxicology global business units, respectively. After considering the revision of our 2014 statement of operations, the Compensation Committee determined that no modifications to the previously established business unit goals for non-GAAP revenue and non-GAAP margin were necessary. Non-GAAP revenue for our cardiometabolic and toxicology business units was between 1% and 6% below the threshold amounts of $881.2 million and $627.7 million, respectively. Non-GAAP margin for our cardiometabolic and toxicology business units was between 9% and 10% below the threshold amounts of $472.4 million and $299.8 million, respectively. Nonetheless, the Compensation Committee, exercising its discretion, determined to award incentive payments to Ms. Cramp and Mr. Malkani at the same level as our other named executive officers. The Compensation Committee, after consultation with Mr. Nawana, determined that it was appropriate to award Ms. Cramp and Mr. Malkani a payout in an amount equal to 50% of the target because both had delivered solid financial results despite the headwinds experienced in both the toxicology and cardiometabolic businesses, the critical role both played in bringing efficiencies to their
107
Table of Contents
business units and in assisting in the integration of all of our business operations during 2015, and their successful management of personnel, including improving business unit coordination and employee stability. In addition, the Compensation Committee determined that it was important to send a signal to our management team that success of our business depends on the valued input of each member and that the success of the business enterprise as a whole is based on the combined contributions of all of the executive team and that it was appropriate to compensate the executives based on overall company performance, with each to be paid the same target amount. As a result of the foregoing, each of the named executive officers (other than Dr. Uppaluri) received a payout of 50% of his or her target incentive payment under the 2015 STIP.
The following table set forth the payments made to the named executive officers pursuant to the 2015 STIP:
| Named Executive Officer |
2015 STIP Bonus Payment |
|||
| Mr. Nawana |
$ | 525,000 | ||
| Mr. Hinrichs |
$ | 146,250 | ||
| Ms. Cramp |
$ | 123,750 | ||
| Mr. Malkani |
$ | 146,250 | ||
| Dr. Uppaluri |
$ | 140,000 | ||
| Mr. Teitel |
$ | 72,563 | ||
Dr. Uppaluri’s payment was equal to her guaranteed minimum payment of 35% of her base salary, or $140,000, which exceeds the amount she otherwise would have received. In accordance with the terms of his severance agreement, Mr. Teitel’s 2015 target payment was equal to 45% of his 2015 base salary of $430,000, prorated to 75%, representing the portion of the year during which he served as an employee. Because the plan was funded at 50% of target, Mr. Teitel received a payment of $72,563.
Stock Options and Stock-based Awards. Our stock option and equity incentive plans, or our Equity Plans, were established to provide certain of our employees, including our named executive officers, with incentives to help align those employees’ interests with the interests of our stockholders and with our long-term success. Our Equity Plans allow our Compensation Committee to grant several different types of stock-based awards, but we have historically relied primarily on stock options and RSUs to provide equity incentive compensation to our named executive officers. For 2015, our Compensation Committee generally believed that stock options would continue to offer the best approach to achieving our long-term compensation goals. Consistent with that belief, in 2015, the Compensation Committee granted only stock options to our named executive officers, other than the RSUs granted to Mr. Hinrichs and Dr. Uppaluri pursuant to the terms of their respective offer letters and the PSUs granted to Mr. Nawana pursuant to the commitments we made to him in October 2014 in connection with his promotion to President and CEO. The Compensation Committee granted these stock options in February 2015 in connection with its annual review of our executive compensation program, other than the stock options for Mr. Hinrichs, which awards were granted in April 2015 upon the commencement of his employment. The Compensation Committee specifically selected stock options as the principal type of award for 2015 because it ties the executives’ long-term compensation to increasing share value over the market price at the date of grant and, much like shareholders who buy in the open market, the financial reward is tied to increasing the value of the company from the shareholder perspective between the time of grant and the time of exercise of the award (unlike certain types of equity awards which provide compensation to executives even in those cases where shareholder value is not increased).
As noted above, for 2015 the Compensation Committee determined that it would be its goal to target the 50th to 75th percentile of the market composite data for annual long-term equity incentive awards for executives in similar positions with similar responsibilities, subject to adjustment for factors
108
Table of Contents
such as individual performance, criticality of role, scope of responsibilities, experience and internal pay equity. In connection with its annual review of our executive compensation program, the Compensation Committee considered the recommendations of management, including our CEO and former CFO, regarding the number of stock options to be granted to each named executive officer, other than the CEO. The Compensation Committee also considered the number of shares available under our Equity Plans and the impact of the proposed grants, including the implied burn rate, implied issued stock overhang, implied total stock overhang and the number of shares that would be available for future grant. The Compensation Committee considered the relative value of other elements of compensation, including the named executive officers’ base salaries for 2015, which were generally above the market 50th percentile, as well as the value of retention awards granted in August 2014. In determining the number of stock options to be granted to our named executive officers during 2015, the Compensation Committee considered the estimated Black-Scholes valuation of each proposed stock option grant and a comparison of that valuation to the market 50th percentile for the relevant position. The Black-Scholes value of stock options actually awarded to our named executive officers as part of the annual review of our executive compensation program (which occurred before Mr. Hinrichs joined us) were (a) in the case of our CEO, approximately 24% below the 50th percentile for his position, (b) in the case of our former CFO, approximately 68% below the 50th percentile for his position and (c) in the case of our other named executive officers (other than Dr. Uppaluri), approximately 4% below the 50th percentile for their respective positions. The number of stock options awarded to Dr. Uppaluri as part of our annual process, which was equal to that of certain other senior executives (and which excludes inducement equity awards received in connection with her hiring), was approximately 27% above the 50th percentile for her position.
Stock options granted to our named executive officers in 2015 have an exercise price equal to the fair market value of our common stock on the grant date. Consistent with our typical practice in prior years, stock options granted to our named executive officers in 2015 vest 25% per annum based upon continued employment over a four-year period and have terms expiring ten years after the date of grant.
The Merger Agreement with Abbott Laboratories places certain limitations on our ability to continue to grant equity awards. The Compensation Committee expects to continue to grant equity awards to our named executive officers principally as part of its annual review of our executive compensation program, which generally occurs during the first quarter of each fiscal year. In accordance with its standard equity granting process, we issued annual equity awards to the named executive officers in February 2016. The Compensation Committee anticipates that it may also grant equity awards to our named executive officers on an ad hoc basis as circumstances warrant (consistent with the granting policy described below), such as in connection with the commencement of employment, following a significant change in job responsibilities or to meet other special retention or performance objectives.
Stock-based awards to named executive officers have generally been granted in conjunction with meetings of our Board of Directors and, with respect to stock options, in accordance with our previously adopted stock option granting policy, which includes the following elements:
| • | Until 2016, options to purchase shares of our common stock were granted effective as of the last calendar day of the following months: February, April, June, August, October and December; beginning in 2016, equity awards to acquire shares of our common stock are granted effective as of the 15th day of each month and annual incentive equity grants are awarded on February 15 of each year (each such date, a “Grant Date”). |
| • | For each employee (or prospective employee) that is not (or, upon hire, will not be) subject to Section 16 of the Exchange Act, the CEO has the authority to grant, in his sole discretion, an option or options to purchase up to an aggregate of 5,000 shares of common stock (on an annual basis); provided, however, that the total number of shares of common stock underlying such option grants may not exceed 150,000 per calendar year. |
109
Table of Contents
| • | Grants of options to existing employees are effective as of, and the grant date thereof is for all purposes deemed to be, the Grant Date following the date of approval (except that any grants subject to stockholder approval are effective as of the date of stockholder approval). |
| • | Options approved for new hires, including those hired through acquisitions, are effective as of, and the grant date thereof is for all purposes deemed to be, the Grant Date following the later of (i) the date of such approval or (ii) the date on which the new hire’s employment commences. |
Acceleration Upon a Change of Control. In addition to acceleration of vesting under the change of control agreements described above, under the terms of our Equity Plans, the vesting of all awards granted before April 22, 2015 accelerate in full upon a change of control of Alere (as defined in the Equity Plans). On April 23, 2015, we amended our 2010 Plan to provide for “double trigger” acceleration for awards granted on or after that date to employees and directors, unless otherwise provided in an award agreement or another agreement with the recipient. Under the amended terms of the 2010 Plan, an employee’s or director’s stock options and stock appreciation rights will automatically become fully exercisable, and conditions and restrictions on restricted stock awards, restricted stock units and performance share awards will be removed, upon the termination of employment by us without cause (as defined in the 2010 Plan) or by the employee with good reason (as defined in the 2010 Plan) (or, in the case of a director, the termination of his or her service as a director for any reason) within one year after a change of control of Alere (as defined in the 2010 Plan). However, if no provision is made for the assumption, continuation or substitution of awards under the 2010 Plan upon a change of control, then such awards will accelerate upon the change of control. Our outstanding RSUs generally provide for full vesting in the event of the involuntarily termination of the holder’s employment without cause (as defined in the RSU), or the holder’s resignation for good reason (as defined in the RSU), within one year after a change of control of Alere (as defined in the RSU).
In connection with Mr. Nawana’s promotion to President and CEO in October 2014, Mr. Nawana received 50,000 RSUs, 100,000 nonqualified stock options and 150,000 PSUs. The RSUs and PSUs provide that, in the event of a change of control (as defined in the relevant award), the award will vest in full if Mr. Nawana’s employment is terminated by us without cause (as defined in the relevant award) or by Mr. Nawana with good reason (as defined in the relevant award) during the 12 months following such change of control. The Compensation Committee believed that these change of control arrangements, which were negotiated with Mr. Nawana as part of our effort to induce him to accept the position of President and CEO, would help to ensure the continued availability of his services in the event of a potential change of control, which the Compensation Committee believed would help to preserve value in the event of such a transaction.
As described above under the heading “Hiring of James Hinrichs as CFO,” if Mr. Hinrichs does not receive acceleration of vesting pursuant to his change of control severance agreement, he may be entitled to acceleration under the terms of his offer letter. As described above under the heading “Hiring of Renuka Uppaluri as Senior Vice President of Research and Development,” if Dr. Uppaluri’s position is eliminated or her duties are significantly diminished due to an internal non-cause related reason and she leaves us, the vesting of her initial grant of equity awards would be accelerated (among other benefits).
Other Compensation. Our named executive officers’ service with our company is at will. The named executive officers were not eligible to participate in, and did not have any accrued benefits under, any company-sponsored defined benefit pension plan in 2015. They were eligible to, and in some cases did, participate in defined contribution plans, such as a 401(k) plan, on the same terms as other employees. The terms of these defined contribution plans varied depending on the jurisdiction of employment of the executive. In addition, consistent with our compensation philosophy, the Compensation Committee maintained in 2015 generally the same benefits and perquisites for our executive officers as in prior years, which generally consisted of certain matching contributions under our defined contribution plans and payment of life insurance premiums. The Committee also provided
110
Table of Contents
Dr. Uppaluri certain temporary cost-of-living adjustments, reimbursement of relocation expenses and other benefits deemed necessary to secure her employment. The Compensation Committee believes that the benefits and perquisites provided to our named executive officers in 2015 were similar to median competitive levels for companies in our peer group. Finally, all of our named executive officers were eligible to participate in our other employee benefit plans, including medical, dental, life and disability insurance.
Compensation Recovery Policy
In May 2014, we adopted a compensation recovery (or “claw-back”) policy that permits us to recover incentive-based cash and equity compensation from the members of our executive team, including our named executive officers. Under the policy, we have the right to recover all or any portion of the value of such compensation granted after adoption of the policy to the extent that (a) the amount paid was based on the achievement of financial results that were subsequently the subject of a restatement, the basis for which was discovered or otherwise known to us within 12 months of the payment, (b) the executive had engaged in theft, dishonesty or intentional falsification of documents or records that resulted in the obligation to restate our financial statements and (c) a lower amount of compensation would have been paid based upon the restated financial results. The board of directors has the discretion to require repayment, cancel some or all equity-based performance compensation awards granted with respect to the restated periods and require the executive to reimburse us for certain profits realized upon the sale of equity securities after public issuance of the financial statements that are subsequently restated.
Executive Stock Ownership Guidelines
The Compensation Committee believes that significant stock ownership by certain executive officers is important to align the interests of our named executive officers with those of our stockholders. Under the stock ownership guidelines established in 2013, as updated in 2015, our CEO, CFO and other named executive officers must beneficially own a number of shares of our common stock with an aggregate value, measured as of the later of December 11, 2013 and the date the executive first becomes subject to the stock ownership guidelines, equal to or in excess of a specified multiple of the individual’s base salary within five years of the later of the adoption of the policy and the date the executive first becomes subject to the stock ownership guidelines, as follows:
| • | for our CEO, five times base salary; and |
| • | for our CFO and other named executive officers, one times base salary. |
These multiples were determined in part based upon practices of peer group companies and the Compensation Committee’s understanding of competitive market practices.
In 2015, the Compensation Committee updated our stock ownership guidelines to add a retention requirement until the executive achieves his or her targeted stock ownership. Until such time, named executive officers are required to retain fifty percent of any shares received as a result of any stock-based awards granted to them by us, net of any shares sold or netted to pay the exercise price of stock options and withholding taxes. Shares of common stock underlying stock options, shares of restricted stock and unvested stock units do not count toward satisfaction of the ownership requirements under the guidelines.
Policy Prohibiting Hedging and Pledging of Stock
Under our insider trading policy and procedures, our named executive officers are prohibited from hedging Alere stock through short selling or through the purchase or sale of puts, calls or options on such stock. Our insider trading policy and procedures also prohibit our named executive officers from holding company securities in a margin account or pledging company securities as collateral for a loan.
111
Table of Contents
Tax Implications
Section 162(m) of the Internal Revenue Code of 1986, as amended, limits the deductibility on our tax return of compensation over $1,000,000 to certain of the named executive officers unless, in general, the compensation is paid pursuant to a plan which is performance-related, non-discretionary and has been approved by our stockholders. We have periodically reviewed the potential consequences of Section 162(m) and on occasion have sought to structure the performance-based portion of our executive compensation to comply with the exemptions available under Section 162(m). However, not all compensation will so qualify. For example, we do not believe that payments under the 2015 STIP or the RSUs granted to our named executive officers qualify as performance-based compensation and, accordingly, we may be unable to deduct some or all of the compensation expense associated with the 2015 STIP payments or any RSUs that vest.
Compensation Committee Report
We, the Compensation Committee, have reviewed and discussed the Compensation Discussion and Analysis beginning on page 98 of this Annual Report with management.
Based on this review and discussion, we recommended to the Board of Directors that the Compensation Discussion and Analysis be included in this Annual Report.
THE COMPENSATION COMMITTEE
James Roosevelt, Jr., Chairperson
Håkan Björklund, Member
Carol R. Goldberg, Member
Brian A. Markison, Member
Compensation Committee Interlocks and Insider Participation
During 2015, the members of the Compensation Committee were Mr. Roosevelt, Mr. Björklund, Ms. Goldberg and Mr. Markison. In addition, prior to the end of his term as a director at our 2015 Annual Meeting of Stockholders, Stephen MacMillan served as the Chairperson of the Compensation Committee. No member of the Compensation Committee who served during 2015 has ever been an officer or employee of ours or any of our subsidiaries. None of our executive officers serves as a director or member of the compensation committee of another entity in a case where an executive officer of such other entity serves as a director of ours or a member of our Compensation Committee.
112
Table of Contents
Compensation of Executive Officers and Directors
The following paragraphs provide information regarding the compensation of our named executive officers.
Summary Compensation Table. The following table provides information regarding the compensation of our named executive officers for 2015, 2014 and 2013. For our named executive officers, the amount of salary and bonus represented between 7.0% and 50.6% of the named executive officers’ total compensation for 2015.
Summary Compensation Table for 2015
| Name and Principal |
Year | Salary ($)(1) |
Bonus ($)(2) |
Stock Awards ($)(3) |
Option Awards ($)(4) |
Non-Equity Incentive Plan Compensation ($)(5) |
All Other Compensation ($)(6) |
Total Compensation ($) |
||||||||||||||||||||||||
| Namal Nawana |
2015 | $ | 1,090,384 | $ | 500,000 | $ | 4,412,662 | $ | 4,410,135 | $ | 726,139 | $ | 4,259 | $ | 11,143,579 | |||||||||||||||||
| Chief Executive Officer, |
2014 | 882,115 | — | 1,998,500 | 1,798,886 | (7) | 201,139 | 4,440 | 4,885,080 | |||||||||||||||||||||||
| President and Director |
2013 | 784,615 | 275,000 | — | 247,637 | (7) | — | 540 | 1,307,792 | |||||||||||||||||||||||
| James Hinrichs |
2015 | 487,500 | 135,833 | 2,506,000 | 5,650,867 | 146,250 | 5,311 | 8,931,761 | ||||||||||||||||||||||||
| Executive Vice President and Chief Financial Officer |
||||||||||||||||||||||||||||||||
| Sanjay Malkani |
2015 | 675,000 | 146,250 | — | 661,520 | 133,778 | 7,592 | 1,624,140 | ||||||||||||||||||||||||
| Global President, Toxicology |
2014 | 650,000 | — | 709,000 | 210,360 | (7) | 130,740 | 7,290 | 1,707,390 | |||||||||||||||||||||||
| Daniella Cramp |
2015 | 581,731 | 123,750 | — | 661,520 | 135,240 | 7,202 | 1,509,443 | ||||||||||||||||||||||||
| Global President, Cardiometabolic |
2014 | 548,077 | — | 709,000 | 280,481 | (7) | 130,740 | 5,944 | 1,674,242 | |||||||||||||||||||||||
| Renuka Uppaluri |
2015 | 361,538 | 240,000 | 909,400 | 1,102,534 | — | 117,286 | 2,730,758 | ||||||||||||||||||||||||
| Senior Vice President, Research and Development |
||||||||||||||||||||||||||||||||
| David Teitel |
2015 | 335,731 | — | — | 514,515 | 171,624 | 488,215 | 1,510,085 | ||||||||||||||||||||||||
| Former Chief Financial Officer |
2014 | 425,085 | — | 531,750 | 210,360 | (7) | 98,386 | 8,306 | 1,273,887 | |||||||||||||||||||||||
| 2013 | 408,770 | — | — | 123,819 | (7) | — | 8,190 | 540,779 | ||||||||||||||||||||||||
| (1) | These amounts are affected by the number and timing of payroll periods in each year. |
| (2) | These amounts represent (a) in the case of Mr. Nawana, (i) a cash bonus paid in January 2015 for his service as Interim Chief Executive Officer and Chief Operating Officer during the partial year 2014 and (ii) a sign-on bonus paid in February 2013, (b) in the case of Mr. Hinrichs, a bonus equal to one-third of the aggregate amount by which the exercise price of his stock options increased between the date of the announcement of his engagement in March 2015 and his start date in April 2015, (c) in the cases of Mr. Malkani and Ms. Cramp, bonuses of $146,250 and $123,750, respectively, under our 2015 STIP, which were awarded in the discretion of the Compensation Committee, and (d) in the case of Dr. Uppaluri, a signing bonus of $100,000 and a guaranteed minimum payout under our 2015 STIP of $140,000. |
| (3) | These amounts represent the aggregate grant date fair value of PSUs and RSUs awarded in 2015 calculated in accordance with Financial Accounting Standards Board Accounting Standards Codification Topic 718, Compensation—Stock Compensation (FASB ASC Topic 718), excluding estimated forfeitures. Under FASB ASC Topic 718, the grant date fair value of Mr. Nawana’s PSUs awarded in 2015 is based on the closing price of our common stock on the grant date, or $41.29 per share, and our estimate, as of the date of grant, of the probable outcome of the performance conditions. Assuming the highest possible level of achievement of the performance conditions, the grant date fair value would have been $6,193,500. Under FASB ASC Topic 718, the grant date fair value of each RSU is equal to the closing price of our common stock on the grant date, or $39.97 for Mr. Nawana’s 2014 award, $50.12 for Mr. Hinrichs’ 2015 award, $45.47 for Dr. Uppaluri’s 2015 award, and $35.45 for the 2014 awards for Mr. Malkani, Ms. Cramp and Mr. Teitel. |
| (4) | These amounts represent the aggregate grant date fair value of stock option awards made during 2015, 2014 and 2013, respectively, calculated in accordance with FASB ASC Topic 718, excluding estimated forfeitures. See Note 4 of the notes to our consolidated financial statements included in this Annual Report on Form 10-K for a discussion of the relevant assumptions used in calculating these amounts. |
| (5) | These amounts represent the amount of cash awards under our 2015 STIP, our 2014 annual incentive plan and our 2013 annual incentive plan. Amounts for 2015 for Mr. Hinrichs and Mr. Teitel are prorated to reflect the fact that they were not employed for the entire year. Because the amount paid to Dr. Uppaluri under the 2015 STIP was the amount she was guaranteed to receive, it is reported in the “Bonus” column. Awards under our 2014 and 2013 annual incentive plans were each payable in two equal installments in the two succeeding years, subject to the recipient’s continued employment by us. The aggregate amount of each cash award under the 2014 and 2013 annual incentive plans is equal to the appreciation, if any, of our stock price during the applicable year multiplied by the number of shares subject to the performance options granted to the recipient for which the applicable performance criteria were achieved. No amount is shown with respect to Mr. Nawana’s participation in the 2014 annual incentive plan. Before the Compensation Committee met to determine the amount to be awarded to participants in the 2014 annual incentive plan, Mr. Nawana decided to forfeit any award under the plan. Accordingly, no determination was ever made regarding the amount that Mr. Nawana would have otherwise received under the plan. The amount of the award for 2014 for Mr. Nawana represents amounts earned under the 2013 annual incentive plan that vested and were paid in 2014. |
113
Table of Contents
| (6) | The amounts in this column include for 2015: (a) matching contributions we made to our defined contribution plans in the amounts of $3,792, $7,125, $6,885, $1,846 and $7,950 on behalf of Mr. Nawana, Mr. Malkani, Ms. Cramp, Dr. Uppaluri and Mr. Teitel, respectively; (b) life insurance premiums paid in the amounts of $467, $311, $467, $317, $254 and $650 on behalf of Mr. Nawana, Mr. Hinrichs, Mr. Malkani, Ms. Cramp, Dr. Uppaluri and Mr. Teitel, respectively; (c) Mr. Hinrichs’ accrued right to receive reimbursement of legal expenses in the amount of $5,000 pursuant to the terms of his offer letter; (d) a payment to Dr. Uppaluri in the amount of $70,000 for a cost-of-living adjustment relating to her relocation at our request to San Diego, California, (e) payment or reimbursement of relocation-related expenses incurred by Dr. Uppaluri in the amount of $45,186; (f) a lump-sum severance payment made to Mr. Teitel in the amount of $430,000; and (g) a payment to Mr. Teitel in the amount of $49,615 for unused vacation time. The amount shown in this column for Mr. Teitel for 2015 does not include any value attributable to the acceleration of 10,000 RSUs upon the termination of his employment on September 30, 2015, the grant date fair value of which is already reported in the “Stock Awards” column for 2014. On September 30, 2015, the closing price of our common stock was $48.15, at which price the RSUs had a value of $481,500. The amounts in this column include for 2014: (a) matching contributions we made to our defined contribution plans in the amounts of $3,900, $6,750, $5,404 and $7,766 on behalf of Mr. Nawana, Mr. Malkani, Ms. Cramp and Mr. Teitel, respectively; and (b) life insurance premiums paid in the amounts of $540 on behalf of each named executive officer. The amounts in this column include for 2013: (a) a matching contribution we made to our defined contribution plans in the amount of $7,650 on behalf of Mr. Teitel; and (b) life insurance premiums paid in the amounts of $540 on behalf of each named executive officer. |
| (7) | The grant date fair value of these stock options is based on our assessment, as of the grant date, of the probable outcome of applicable performance conditions. Assuming the highest possible level of achievement of the performance conditions, the grant date fair value would have been $1,807,473 and $252,690 for Mr. Nawana in 2014 and 2013, respectively; $214,653 for Mr. Malkani in 2014; $286,205 for Ms. Cramp in 2014; and $214,653 and $126,346 for Mr. Teitel in 2014 and 2013, respectively. |
Grants of Plan-Based Awards. The following table provides information regarding the grant of plan-based awards to our named executive officers in 2015.
Grants of Plan-Based Awards for 2015
| Name |
Grant Date(1) |
Compensation Committee Approval Date(1) |
Estimated Future Payouts under |
All Other Stock Awards: Number of Shares of Stock or Units (#)(3) |
All Other Option Awards: Number of Securities Underlying Options (#)(4) |
Exercise or Base Price of Option Awards ($/Share) (5) |
Grant Date Fair Value of Stock and Option Awards ($)(6) |
|||||||||||||||||||||||||||||
| Threshold($) | Target($) | Maximum($) | ||||||||||||||||||||||||||||||||||
| Namal Nawana |
2/3/15 | 2/3/15 | $ | — | $ | — | $ | — | 150,000 | (7) | — | $ | — | $ | 4,412,662 | |||||||||||||||||||||
| 2/28/15 | 2/25/15 | 525,000 | 1,050,000 | 1,575,000 | — | — | — | — | ||||||||||||||||||||||||||||
| 2/28/15 | 2/25/15 | — | — | — | — | 300,000 | 45.47 | 4,410,135 | ||||||||||||||||||||||||||||
| James Hinrichs |
4/6/15 | 3/18/15 | 195,000 | 390,000 | 585,000 | — | — | — | — | |||||||||||||||||||||||||||
| 4/6/15 | 3/18/15 | — | — | — | — | 250,000 | 50.08 | 4,007,652 | ||||||||||||||||||||||||||||
| 4/10/15 | 3/18/15 | — | — | — | 50,000 | — | — | 2,506,000 | ||||||||||||||||||||||||||||
| 4/30/15 | 4/23/15 | — | — | — | — | 108,118 | 47.48 | 1,643,215 | ||||||||||||||||||||||||||||
| Sanjay Malkani |
2/28/15 | 2/25/15 | 146,250 | 292,500 | 438,750 | — | — | — | — | |||||||||||||||||||||||||||
| 2/28/15 | 2/25/15 | — | — | — | — | 45,000 | 45.47 | 661,520 | ||||||||||||||||||||||||||||
| Daniella Cramp |
2/28/15 | 2/25/15 | 123,750 | 247,500 | 371,250 | — | — | — | — | |||||||||||||||||||||||||||
| 2/28/15 | 2/25/15 | — | — | — | — | 45,000 | 45.47 | 661,520 | ||||||||||||||||||||||||||||
| Renuka Uppaluri |
2/28/15 | 2/25/15 | 140,000 | 180,000 | 260,000 | — | — | — | — | |||||||||||||||||||||||||||
| 2/28/15 | 2/25/15 | — | — | — | — | 40,000 | 45.47 | 588,018 | ||||||||||||||||||||||||||||
| 2/28/15 | 2/25/15 | — | — | — | 20,000 | — | — | 909,400 | ||||||||||||||||||||||||||||
| 2/28/15 | 2/25/15 | — | — | — | — | 35,000 | 45.47 | 514,516 | ||||||||||||||||||||||||||||
| David Teitel |
2/28/15 | 2/25/15 | 96,750 | 193,500 | 290,250 | — | — | — | — | |||||||||||||||||||||||||||
| 2/28/15 | 2/25/15 | — | — | — | — | 35,000 | 45.47 | 514,516 | ||||||||||||||||||||||||||||
| (1) | The grant dates of the stock options for the named executive officers are in accordance with our equity granting policy that was in effect at the time of the grant of the stock option. Under this policy, grants of stock options approved by the Compensation Committee for existing employees are effective as of the next applicable “Grant Date” (except that any grants subject to stockholder approval are effective as of the date of stockholder approval). Under this policy, “Grant Date” means the last day of the following months: February, April, June, August, October and December. The grant dates of other awards are in accordance with the terms of the relevant resolution of the Compensation Committee. As noted above, the equity granting policy was revised effective the beginning of January 2016. |
| (2) | The amounts shown in these columns represent the executives’ annual incentive opportunity under our 2015 STIP, which funded cash bonuses based upon the degree of achievement of performance goals for a non-GAAP measure of earnings per share, a non-GAAP measure of organic growth and non-GAAP measures of business unit revenue and non-GAAP measures of business unit margin, in each case, as certified by the Compensation Committee. Amounts shown in the threshold, target and maximum columns represent 50%, 100% and 150%, respectively, of the targeted bonus amount, except that the amounts for Ms. Uppaluri represent 35% (the minimum amount guaranteed to Ms. Uppaluri), 45% and 65% of her annual base salary for 2015. See “Compensation Discussion and Analysis—Elements of Standard Compensation—Short-Term Incentive Plan” above for more information regarding this plan and the determination of payment under the plan. The amounts awarded pursuant to our 2015 STIP, including discretionary awards to Mr. Malkani and Ms. Cramp, are reflected in the Summary Compensation Table under the ”Bonus” and “Non-Equity Incentive Plan Compensation” columns above. |
114
Table of Contents
| (3) | These amounts represent PSUs and RSUs. See note (7) below for information regarding the PSUs awarded to Mr. Nawana. All awards (other than the RSUs granted to Mr. Hinrichs) were made under, or were subject to, our 2010 Stock Option and Incentive Plan and were granted for no consideration. The RSUs granted to Mr. Hinrichs were inducement awards and were not granted under any plan. The terms of the RSUs provide for vesting and release in three equal annual installments, commencing on the first anniversary of the date of grant and conditioned upon the recipient’s continued employment with us on the applicable vesting date. |
| (4) | All stock option awards (other than the awards granted to Mr. Hinrichs) were made under our 2010 Stock Option and Incentive Plan. The stock option awards granted to Mr. Hinrichs were inducement awards and were not granted under any plan. The terms of the options provide for vesting in four equal annual installments, commencing on the first anniversary of the date of grant and conditioned upon the recipient’s continued employment with us on the applicable vesting date. The options generally expire on the tenth anniversary of the grant date or, if earlier, three months after the recipient’s employment terminates. |
| (5) | The exercise price of the stock option awards is equal to the closing price of our common stock on the applicable date of grant. |
| (6) | These amounts represent the aggregate grant date fair value of PSUs, RSUs and stock option awards granted during 2015, calculated in accordance with FASB ASC Topic 718, excluding estimated forfeitures. See Note 4 of the notes to our consolidated financial statements included in this Annual Report on Form 10-K for a discussion of the relevant assumptions used in calculating these amounts. The grant date fair value of the PSUs is based on our assessment, as of the date of grant, of the probable outcome of the performance conditions. |
| (7) | This amount represents PSUs granted to Mr. Nawana pursuant to commitments made to him in October 2014. The PSUs vest over three years in equal installments if various stock-price targets are met on or before specified dates, provided Mr. Nawana remains employed by us on the applicable vesting date. See “Compensation Discussion and Analysis—Promotion of Namal Nawana to President and CEO” above for more information about these PSUs. |
115
Table of Contents
Outstanding Equity Awards at Fiscal Year-End. The following table provides information regarding outstanding options and stock awards held by our named executive officers at the end of 2015.
Outstanding Equity Awards at Fiscal Year-End for 2015
| Option Awards | Stock Awards | |||||||||||||||||||||||
| Name |
Number of Securities Underlying Unexercised Options (#) Exercisable |
Number of Securities Underlying Unexercised Options (#)(1) Unexercisable |
Option Exercise Price($) |
Option Expiration Date(2) |
Number of Shares or Units of Stock That Have Not Vested (#) |
Market Value
of Shares or Units of Stock That Have Not Vested ($)(3) |
||||||||||||||||||
| Namal Nawana |
150,000 | 50,000 | $ | 18.50 | 12/31/2022 | — | $ | — | ||||||||||||||||
| 11,538 | 11,539 | 25.68 | 4/30/2023 | — | — | |||||||||||||||||||
| 25,000 | 75,000 | 39.97 | 10/31/2024 | — | — | |||||||||||||||||||
| — | 300,000 | 45.47 | 2/28/2025 | |||||||||||||||||||||
| — | — | — | — | 33,334 | (4) | 1,303,026 | ||||||||||||||||||
| — | — | — | — | 150,000 | (5) | 5,863,500 | ||||||||||||||||||
| James Hinrichs |
— | 250,000 | 50.08 | 04/06/2025 | — | — | ||||||||||||||||||
| — | 108,118 | 47.48 | 04/30/2025 | — | — | |||||||||||||||||||
| — | — | — | — | 50,000 | (6) | 1,954,500 | ||||||||||||||||||
| Daniella Cramp |
10,000 | — | 48.14 | 8/31/2017 | — | — | ||||||||||||||||||
| 15,000 | — | 60.09 | 10/31/2017 | — | — | |||||||||||||||||||
| 10,000 | — | 19.15 | 10/31/2018 | — | — | |||||||||||||||||||
| 2,500 | — | 18.91 | 12/31/2018 | — | — | |||||||||||||||||||
| 14,709 | — | 35.58 | 6/30/2019 | — | — | |||||||||||||||||||
| 15,000 | — | 38.01 | 10/30/2019 | — | — | |||||||||||||||||||
| 5,000 | — | 38.64 | 2/28/2021 | — | — | |||||||||||||||||||
| 40,000 | — | 26.06 | 10/31/2021 | — | — | |||||||||||||||||||
| 1,125 | 375 | 25.43 | 2/28/2022 | — | — | |||||||||||||||||||
| 37,500 | 12,500 | 19.20 | 10/31/2022 | — | — | |||||||||||||||||||
| 7,500 | 7,500 | 25.68 | 4/30/2023 | — | — | |||||||||||||||||||
| 12,500 | 12,500 | 33.73 | 10/31/2023 | — | — | |||||||||||||||||||
| 1,250 | 3,750 | 36.74 | 2/28/2024 | — | — | |||||||||||||||||||
| — | 45,000 | 45.47 | 02/28/2025 | — | — | |||||||||||||||||||
| — | — | — | — | 13,334 | (7) | 521,226 | ||||||||||||||||||
| Sanjay Malkani |
16,040 | — | 44.64 | 2/12/2018 | — | — | ||||||||||||||||||
| 2,500 | — | 18.91 | 12/31/2018 | — | — | |||||||||||||||||||
| 6,133 | — | 35.58 | 6/30/2019 | — | — | |||||||||||||||||||
| 10,000 | — | 38.01 | 10/30/2019 | — | — | |||||||||||||||||||
| 5,000 | — | 38.64 | 2/28/2021 | — | — | |||||||||||||||||||
| 10,000 | — | 37.14 | 4/30/2021 | — | — | |||||||||||||||||||
| 7,500 | — | 26.06 | 10/31/2021 | — | — | |||||||||||||||||||
| 2,925 | 975 | 25.43 | 2/28/2022 | — | — | |||||||||||||||||||
| 12,500 | 12,500 | 19.20 | 10/31/2022 | — | — | |||||||||||||||||||
| 7,500 | 7,500 | 25.68 | 4/30/2023 | — | — | |||||||||||||||||||
| 12,500 | 12,500 | 33.73 | 10/31/2023 | — | — | |||||||||||||||||||
| 844 | 2,531 | 36.74 | 2/28/2024 | — | — | |||||||||||||||||||
| — | 45,000 | 45.47 | 2/28/2025 | — | — | |||||||||||||||||||
| — | — | — | — | 13,334 | (7) | 521,226 | ||||||||||||||||||
| Renuka Uppaluri |
— | 40,000 | 45.47 | 2/28/2025 | — | — | ||||||||||||||||||
| — | 35,000 | 45.47 | 2/28/2025 | — | — | |||||||||||||||||||
| — | — | — | — | 20,000 | (8) | 781,800 | ||||||||||||||||||
| Dave Teitel |
— | — | — | — | — | — | ||||||||||||||||||
| (1) | Options become exercisable in four equal annual installments beginning on the first anniversary of the date of grant. |
116
Table of Contents
| (2) | Unless otherwise noted, the expiration date of each option occurs ten years after the date of grant of such option. |
| (3) | The value attributable to the restricted stock units equals the closing price of our common stock as reported by the New York Stock Exchange on December 31, 2015, which was $39.09, multiplied by the number of unvested units underlying the award. |
| (4) | This amount represents RSUs granted on October 31, 2014 that vest in equal annual installments on the second and third anniversaries of the date of grant. |
| (5) | This amount represents PSUs granted pursuant to commitments made to Mr. Nawana in October 2014. The vesting of the PSUs was subject to the attainment of various stock-price targets on or before specified dates, all of which were achieved in 2015, and as a result, the PSUs will vest in three equal installments on February 3, 2016, January 15, 2017 and January 16, 2018, subject to Mr. Nawana’s continued employment by us on the applicable vesting date. See “Compensation Discussion and Analysis — Promotion of Namal Nawana to President and CEO” above for more information about these PSUs. |
| (6) | This amount represents RSUs granted on April 10, 2015 that vest in three equal annual installments beginning on the first anniversary of the date of grant. |
| (7) | These amounts represent RSUs granted on August 31, 2014 that vest in equal annual installments on the second and third anniversaries of the date of grant. |
| (8) | This amount represents RSUs granted on February 28, 2015 that vest in three equal annual installments beginning on the first anniversary of the date of grant. |
Option Exercises and Stock Vested. The following table provides information regarding options exercised by our named executive officers and stock vested in 2015.
Option Exercises and Stock Vested for 2015
| Option Awards | Stock Awards | |||||||||||||||
| Name |
Number of Shares Acquired on Exercise (#) |
Value Realized on Exercise ($)(1) |
Number of Shares Acquired on Vesting (#) |
Value Realized on Vesting ($)(2) |
||||||||||||
| Namal Nawana |
— | $ | — | 116,666 | $ | 4,733,636 | ||||||||||
| James Hinrichs |
— | — | — | — | ||||||||||||
| Daniella Cramp |
— | — | 6,666 | 346,432 | ||||||||||||
| Sanjay Malkani |
71,460 | 1,764,274 | 6,666 | 346,432 | ||||||||||||
| Renuka Uppaluri |
— | — | — | — | ||||||||||||
| David Teitel |
72,195 | 1,317,092 | 15,000 | 732,750 | ||||||||||||
| (1) | These amounts represent the difference between the aggregate exercise price and the aggregate fair market value of the common stock on the date of exercise. |
| (2) | These amounts represent the closing price of one share of our common stock on the date of vesting multiplied by the number of shares acquired on vesting. |
Non-qualified Deferred Compensation Plans. During 2015, our named executive officers did not participate in any non-qualified defined contribution or other non-qualified deferred compensation plans.
Pension Benefits. During 2015, our named executive officers did not participate in any plan that provides for specified retirement benefits, or payments and benefits that will be provided primarily following retirement, other than defined contribution plans, such as our 401(k) savings plan.
Severance Agreements and Potential Payments upon Termination or Change of Control. The equity awards held by our named executive officers are subject to acceleration upon a change of control pursuant to their terms, and we have also entered into severance and other change of control agreements with our named executive officers.
117
Table of Contents
As noted above, we expect that the transactions contemplated by our merger agreement with Abbott Laboratories will, if consummated, constitute a change of control of Alere under the terms of our Equity Plans and the change of control severance agreements with our named executive officers. In accordance with SEC rules, the following disclosures regarding potential payments upon a change of control are not based on the terms of the merger agreement but instead assume that a hypothetical change of control occurred at the end of our most recently completed fiscal year, or December 31, 2015, and that our common stock would have a value in the hypothetical change of control equal to the closing price of our common stock on that date, which was $39.09 per share. The merger agreement contemplates a purchase price of $56.00 per share of our common stock, which is substantially higher than the closing price of our common stock on December 31, 2015. Accordingly, if the merger contemplated by the merger agreement is consummated, the value of the change of control benefits described below that are based on the price of our common stock would be substantially higher. Moreover, the following disclosures do not reflect (i) a 3% increase in the annual base salaries of our named executive officers, which occurred in 2016, (ii) the establishment of our short-term incentive plan for 2016, (iii) the increase in the target bonus opportunities for our named executive officers under that plan arising from the increase in annual base salaries for 2016, (iv) the grant of annual equity awards to each of the named executive officers (other than Mr. Teitel) in 2016 in the form of RSUs, (v) the grant of additional retention awards to Mr. Malkani, Ms. Cramp and Dr. Uppaluri in 2016 in the form of RSUs or (vi) changes in the cost of other benefits occurring after December 31, 2015. We anticipate that the proxy statement that we will use in connection with the solicitation of proxies for a special meeting of stockholders to consider and vote upon the approval of the merger agreement will contain more current disclosures regarding our estimates of the change of control benefits to which our named executive officers may become entitled upon or following the consummation of the merger.
Acceleration under Equity Plans. All of the outstanding stock options, RSUs and PSUs that were held by our named executive officers as of December 31, 2015 (other than Mr. Teitel, who was not an employee on that date and, other than Mr. Hinrichs, as discussed below) and that were reported above under “Outstanding Equity Awards at Fiscal Year-End for 2015” were issued under, or are subject to the terms of, our Equity Plans, and were issued before April 23, 2015, the date we amended our 2010 Stock Option and Incentive Plan to provide that awards issued after that date would be subject to “double trigger” acceleration rather than “single trigger” acceleration upon a change of control. All of the equity awards held by Mr. Hinrichs as of December 31, 2015 were either: (i) not issued pursuant to our Equity Plans or (ii) were issued after April 23, 2015 and, pursuant to the terms of such awards, did not contain a change of control provision or did not contain a provision for “single trigger” acceleration. Accordingly, other than with respect to Mr. Hinrichs, all of these awards are subject to accelerated vesting and exercisability upon a change of control. In addition, all of the outstanding stock options, RSUs and PSUs held by our named executive officers as of December 31, 2015 (other than Mr. Teitel) provide that vesting will accelerate in full upon termination of the named executive officer’s employment with us due to his or her death or disability. The following table provides the value attributable to such an acceleration of vesting and exercisability of options and an acceleration of vesting of RSUs and PSUs. The following table does not reflect (i) any equity awards granted after December 31, 2015 or (ii) any reduction for taxes or other deductions.
| Name |
Value Attributable to Acceleration
of Exercisability of Stock Options and Vesting of RSUs and PSUs Upon a Change of Control(1) |
Value Attributable to Acceleration
of Exercisability of Stock Options and Vesting of RSUs and PSUs Upon Termination of Employment due to Death or Disability(1) |
||||||
| Namal Nawana |
$ | 8,350,764 | $ | 8,350,764 | ||||
| James Hinrichs(2) |
651,474 | 1,954,500 | ||||||
| Sanjay Malkani |
956,692 | 956,692 | ||||||
| Daniella Cramp |
951,361 | 951,361 | ||||||
| Renuka Uppaluri |
781,800 | 781,800 | ||||||
| (1) | Assumes the occurrence of a change of control or termination of employment due to death or disability on December 31, 2015. The value attributable to the acceleration of in-the-money stock |
118
Table of Contents
| options equals the difference between the applicable option exercise prices and the closing sale price of our common stock as reported by the New York Stock Exchange on December 31, 2015, which was $39.09 per share, multiplied by the number of shares underlying the options. The value attributable to the acceleration of vesting of RSUs and PSUs equals the closing sale price of our common stock as reported by the New York Stock Exchange on December 31, 2015 multiplied by the number of units underlying the award. |
| (2) | The equity awards for Mr. Hinrichs do not permit “single-trigger” acceleration of vesting on a change of control. |
Change of Control Severance Agreements. Between October 2014 and April 2015, we entered into change of control severance agreements with our named executive officers. These agreements provide for severance payments and other benefits in the event of a “qualifying termination” (as defined in the change in control severance agreement) in connection with a change in control of the Company. In the event of a qualifying termination, a named executive officer will be entitled to receive:
| • | an amount equal to 18 months of the executive officer’s annual base salary at the highest rate in effect at any time during the 12 months immediately preceding the time of such qualifying termination, payable in equal installments over the 18 month period following the date of the qualifying termination; |
| • | if not already paid, an amount equal to any cash component of any award granted under any executive incentive plan prior to the qualifying termination, payable promptly following the date of the qualifying termination (which will be equal to the target annual bonus for the year of such termination); |
| • | an amount equal to the full monthly COBRA premium minus the active employee cost of coverage, payable in monthly installments for a period of 18 months after the date of the qualifying termination; |
| • | accelerated vesting of all outstanding unvested equity awards held by the named executive officer; |
| • | a release from any non-competition agreement such executive officer may have in effect with us; and |
| • | outplacement support services for three months following the date of the qualifying termination. |
The change in control severance agreements also provide for an excise-tax gross-up payment in the event the severance benefits payable under the change in control severance agreement, combined with any other payments and benefits such named executive officer may become entitled to receive in the event of a change in control or qualifying termination following a change in control, cause such executive officer to be subject to excise tax under Section 4999 of the Internal Revenue Code of 1986, as amended.
Receipt of the payments and benefits under the change in control severance agreements is conditioned upon the applicable executive officer executing, and not revoking, a release of claims in our favor.
As noted above, in June 2015, our Compensation Committee determined that it was no longer appropriate to include excise tax gross-up provisions in change of control severance agreements provided to our officers and stated that it did not intend to approve inclusion of such protections in future agreements with our officers. In addition, the executive will be entitled to the foregoing benefits, without any termination of employment, if we fail to obtain a written agreement from any successor to assume and perform our obligations under the agreement and to deliver such agreement to the executive prior to the succession. The agreement further provides that we will indemnify the executive to the fullest extent permitted by law, including the payment of expenses incurred by or on behalf of the executive in connection with any threatened, pending or completed action, suit, investigation or other
119
Table of Contents
proceeding, whether or not by us or in our right. The excutive is required to deliver a release of claims in order to receive any benefits under the change of control severance agreement.
Each of our named executive officers (other than Mr. Teitel, who was not an employee on December 31, 2015) would be entitled to the benefits presented in the following table if his or her employment were to be terminated by us without cause (as defined in the change of control severance agreement) or by him or her with good reason (as defined in the change of control severance agreement) within 12 months following a change in control of Alere, assuming the occurrence of a change of control and the termination of employment on December 31, 2015. As noted above, the named executive officers are entitled to the acceleration of vesting of outstanding equity awards immediately upon a change of control without regard to termination of employment. All amounts are estimates based on (i) the named executive officers’ salaries in effect during 2015, (ii) the cash component of awards outstanding on December 31, 2015, (iii) health insurance premiums in effect on December 31, 2015, and (iv) the estimated value of three months of outplacement support services as of December 31, 2015. The following table does not reflect (i) any increase in salary after December 31, 2015, (ii) any equity awards granted after December 31, 2015, (iii) any non-equity incentive compensation plan awards granted after December 31, 2015 or (iv) any reduction for taxes or other deductions.
| Name |
Salary Continuation ($)(1) |
Cash Component of Awards ($)(2) |
Health Insurance Premiums ($)(3) |
Outplacement Support Services ($) |
Acceleration of Vesting ($)(4) |
280G Gross- Up Payments ($)(5) |
Total ($) |
|||||||||||||||||||||
| Namal Nawana |
$ | 1,575,000 | $ | 525,000 | $ | 36,000 | $ | 8,500 | $ | 8,350,764 | $ | — | $ | 10,495,264 | ||||||||||||||
| James Hinrichs |
975,000 | 146,250 | 36,000 | 8,500 | 1,954,500 | — | 3,120,250 | |||||||||||||||||||||
| Sanjay Malkani |
975,000 | 149,288 | 36,000 | 8,500 | 956,692 | — | 2,125,480 | |||||||||||||||||||||
| Daniella Cramp |
825,000 | 128,250 | 36,000 | 8,500 | 951,361 | — | 1,949,111 | |||||||||||||||||||||
| Renuka Uppaluri |
600,000 | 140,000 | 36,000 | 8,500 | 781,800 | — | 1,566,300 | |||||||||||||||||||||
| (1) | Salary is payable in accordance with our regular payroll practices for a period of 18 months. |
| (2) | Represents (i) the amount of cash awards granted under our 2014 annual incentive process that remain unvested as of December 31, 2015 plus (ii) the cash awards granted under our 2015 annual incentive process, based on our actual performance in 2015. |
| (3) | Each named executive officer is entitled to continued payment of health insurance premiums (less the active employee cost of such coverage) for a period of 18 months. |
| (4) | The value of acceleration of vesting and exercisability is calculated in the same manner as described in the preceding table. |
| (5) | In accordance with the terms of the change of control severance agreements, for purposes of estimating the amount of the Section 280G gross-up payment, each named executive officer was assumed to pay federal income taxes in 2015 at the highest marginal rate of federal income taxation in that calendar year and state and local income taxes at the highest marginal rates of taxation in the state and locality of such named executive officer’s residence on December 31, 2015, net of the maximum reduction in federal income taxes which could be obtained from the deduction of such state and local taxes. |
None of the payments that would have been made to our named executive officers as a result of a change of control and termination of employment occurring on December 31, 2015 would have constituted an “excess parachute payment” under Section 280G of the Internal Revenue Code.
Agreement with James Hinrichs. In March 2015, we extended an offer letter to James Hinrichs to serve as our Executive Vice President and Chief Financial Officer effective April 6, 2015. We agreed that Mr. Hinrichs would be eligible to participate in our 2015 STIP, under which he would be eligible to receive cash bonuses targeted at 60% of his base salary, and that he would receive certain annual
120
Table of Contents
equity grants. Pursuant to the offer letter, we granted Mr. Hinrichs options to purchase 250,000 shares of our common stock at an exercise price of $50.08 and 50,000 RSUs. The options vest in four equal installments on each of the first four anniversaries of his start date. The RSUs vest in three equal installments on each of the first three anniversaries of his start date. We agreed that if his employment is terminated by us without cause (as defined in the letter) or by him for good reason (as defined in the letter) and he does not receive severance benefits under the change of control severance agreement, Mr. Hinrichs will receive a cash payment in an amount equal to his annual base salary plus his annual target bonus, payment of any unpaid bonus for a prior completed performance period, a pro-rated bonus for the year of termination based upon actual performance, 12 months of paid medical group plan coverage, and accelerated vesting of his unvested equity compensation awards as if his termination date had occurred one year later. Based on Mr. Hinrichs’ salary, bonus structure, health plan and unvested awards outstanding on December 31, 2015 and assuming termination of his employment in any of the scenarios described above on December 31, 2015, we estimate that the benefit to Mr. Hinrichs would have equaled $2,251,724, consisting of the sum of his annual base salary in the amount of $650,000, an annual target bonus equal to $390,000 (equal to 60% of his annual base salary), his actual bonus of $146,250 earned in 2015, an assumed actual 2016 bonus equal to $390,000 (which assumes that actual 2016 performance equals target performance), his health plan premiums of $24,000 and acceleration of vesting and exercisability of his stock options and RSUs in the amount of $651,474 (calculated in the manner described in the preceding tables). The foregoing amounts do not reflect any reduction for taxes or other deductions. In addition, as noted above, we have also entered into a change of control severance agreement with Mr. Hinrichs.
Agreement with Sanjay Malkani. In April 2015, we entered into an arrangement with Sanjay Malkani in his role as Global President, Toxicology in which we confirmed a prior agreement that, if we terminate Mr. Malkani’s employment without cause (as defined in the letter agreement memorializing the arrangement), we will pay him separation pay in an amount equal to 12 months of his then-current annualized base salary (less required taxes and deductions), contingent on his execution of a binding standard separation agreement containing a release of claims. Based on Mr. Malkani’s salary in effect on December 31, 2015 and assuming termination of his employment without cause on December 31, 2015, we estimate that we would have paid Mr. Malkani an aggregate of $650,000, which would be paid bi-weekly in accordance with our regular payroll practices. This amount does not reflect any reduction for taxes or other deductions. In addition, as noted above, we have also entered into a change of control severance agreement with Mr. Malkani.
Agreement with Daniella Cramp. In March 2013, we entered into an at-will employment arrangement with Daniella Cramp in her role as Global President, Cardiometabolic. We agreed that, if we terminate her employment for any reason other than cause or disability (each as defined in the letter agreement memorializing the arrangement), we would pay her 12 months of her then-current annualized base salary (less required taxes and deductions), contingent on her execution of a binding standard separation agreement containing a release of claims. We also agreed to pay her the same separation pay if she voluntarily terminates her employment before March 1, 2018, subject to the same contingency. The letter agreement provides that payments under it are intended to comply with Section 409A of the Internal Revenue Code of 1986, as amended, and contains provisions for the potential deferral of payments as well as make-whole payments to Ms. Cramp for any penalties and taxes she may incur if we make payments that do not comply with Section 409A. Based on Ms. Cramp’s salary in effect on December 31, 2015 and assuming termination of her employment in any of the scenarios described above on December 31, 2015, we estimate that we would have paid Ms. Cramp an aggregate of $550,000, which would be paid bi-weekly in accordance with our regular payroll practices. This amount does not reflect any reduction for taxes or other deductions. In addition, as noted above, we have also entered into a change of control severance agreement with Ms. Cramp.
Agreement with Renuka Uppaluri. In January 2015, we entered into an at-will employment arrangement with Renuka Uppaluri in her role as Senior Vice President of Research and Development, and she joined us in February 2015. Pursuant to that arrangement, on February 28, 2015, we granted
121
Table of Contents
to Dr. Uppaluri options to purchase 40,000 shares of our common stock at an exercise price of $45.47 per share and 20,000 RSUs. The options vest in four equal installments on each of the first four anniversaries of the date of grant. The RSUs vest in three equal installments on each of the first three anniversaries of the date of grant. We agreed that, if Dr. Uppaluri’s position is eliminated or her duties are significantly diminished due to an internal restructuring or an internal, non-cause related reason and she leaves us, the vesting of these initial equity awards would be accelerated in full and we would pay her severance equal to 12 months of her base salary. Based on Dr. Uppaluri’s salary and unvested initial equity awards in effect on December 31, 2015 and assuming termination of her employment in any of the scenarios described above on December 31, 2015, we estimate that the benefit to Ms. Uppaluri would equal $1,181,800, consisting of base salary in the amount of $400,000 and acceleration of vesting and exercisability of her stock options and RSUs in the amount of $781,800 (calculated in the manner described in the preceding tables). This amount does not reflect any reduction for taxes or other deductions. In addition, as noted above, we also entered into a change of control severance agreement with Dr. Uppaluri.
Risk Related to Compensation Policies
Our compensation policies and practices for our employees, including our executive compensation program described in our Compensation Discussion and Analysis, aim to provide a risk-balanced compensation package which is competitive in our market sectors and relevant to the individual executive. In particular, we believe the following factors help to mitigate any components of our compensation programs that would encourage excessive risk taking:
| • | The increased weighting in 2015 towards long-term incentive compensation discourages short-term risk-taking; |
| • | Performance goals are intended to establish targets that we believe will benefit our stockholders, be challenging for the named executive officers to achieve and yet not be so difficult as to make them likely to result in a large percentage loss of compensation; |
| • | Cash incentive awards for our named executive officers are capped by the Compensation Committee; |
| • | Stock ownership requirements align the interests of management with those of our stockholders; |
| • | Our executives are granted a mix of different types of compensation awards; and |
| • | Our controls and procedures are designed to provide checks and balances to ensure that one individual or a small group of individuals cannot engage in activities that expose us to excessive risks without having received approvals from other areas of the business or senior management. |
We do not believe that risks arising from these practices, or our compensation policies and practices considered as a whole, are reasonably likely to have a material adverse effect on us.
Compensation of Directors
The following table provides information regarding the compensation of our directors for 2015.
122
Table of Contents
Director Compensation for 2015
| Name(1) |
Fees Earned or Paid in Cash ($)(2) |
Option Awards ($)(3) |
Total (4) |
|||||||||
| Gregg Powers |
$ | 85,000 | $ | — | $ | 85,000 | ||||||
| Håkan Björklund, Ph.D. |
13,500 | — | 13,500 | |||||||||
| Geoffrey S. Ginsburg, M.D. |
39,809 | 183,333 | (5) | 223,142 | ||||||||
| Carol R. Goldberg |
85,000 | — | 85,000 | |||||||||
| John F. Levy |
29,500 | — | 29,500 | |||||||||
| Brian A. Markison |
30,000 | — | 30,000 | |||||||||
| Thomas F. McKillop, Ph.D. |
19,063 | — | 19,063 | |||||||||
| John A. Quelch, D.B.A. |
24,000 | — | 24,000 | |||||||||
| James Roosevelt, Jr. |
93,798 | — | 93,798 | |||||||||
| Regina Benjamin, M.D.(6) |
35,615 | — | 35,615 | |||||||||
| Stephen P. MacMillan(6) |
10,803 | — | 10,803 | |||||||||
| (1) | Mr. Nawana is not included in this table because he is one of our employees and receives no compensation for his services as director. We show his compensation as an employee in the Summary Compensation Table above. |
| (2) | Mr. Powers received cash payments of $20,000 each in April 2015 and July 2015, received a cash payment of $22,500 in October 2015 and earned fees of $22,500 as of December 31, 2015, which amount was paid in January 2016. Dr. Björklund received cash payments of $2,500 each in April 2015 and July 2015, received a cash payment of $4,250 in October 2015 and earned fees of $4,250 as of December 31, 2015, which amount was paid in January 2016. Dr. Ginsburg received a cash payment of $17,309 in October 2015 and earned fees of $22,500 as of December 31, 2015, which amount was paid in January 2016. Ms. Goldberg received cash payments of $20,000 each in April 2015 and July 2015, received a cash payment of $22,500 in October 2015 and earned fees of $22,500 as of December 31, 2015, which amount was paid in January 2016. Mr. Levy received cash payments of $6,000 each in April 2015, and July 2015, received a cash payment of $8,750 in October 2015 and earned fees of $8,750 as of December 31, 2015, which amount was paid in January 2016. Mr. Markison received cash payments of $6,250 each in April 2015 and July 2015, received a cash payment of $8,750 in October 2015 and earned fees of $8,750 as of December 31, 2015, which amount was paid in January 2016. Dr. McKillop received a cash payment of $3,750 in April 2015, received a cash payment of $3,563 in July 2015, received a cash payment of $5,875 in October 2015 and earned fees of $5,875 as of December 31, 2015, which amount was paid in January 2016. Dr. Quelch received cash payments of $4,500 each in April 2015 and July 2015, received a cash payment of $7,500 in October 2015 and earned fees of $7,500 as of December 31, 2015, which amount was paid in January 2016. Mr. Roosevelt received cash payments of $20,000 each in April 2015 and July 2015, received a cash payment of $26,298 in October 2015 and earned fees of $27,500 as of December 31, 2015, which amount was paid in January 2016. Dr. Benjamin received cash payments of $15,628 each in April 2015 and July 2015 and received a cash payment of 4,359 in August 2015. Mr. MacMillan received cash payments of $4,500 each in April 2015 and July 2015 and received a cash payment of $1,803 in October 2015. The cash compensation paid to directors is described in more detail below. |
| (3) | This amount represents the aggregate grant date fair value of the stock option award made during 2015, calculated in accordance with FASB ASC Topic 718, excluding estimated forfeitures. See Note 4 of the notes to our consolidated financial statements included in this Annual Report on Form 10-K for a discussion of the relevant assumptions used in calculating this amount. |
| (4) | As of December 31, 2015, each director had the following number of options outstanding: Mr. Powers: 39,820; Dr. Björklund: 53,756; Dr. Ginsburg: 10,443; Ms. Goldberg: 91,553; Mr. Levy: 132,280; Mr. Markison: 53,756; Dr. McKillop: 53,756; Dr. Quelch: 121,814; Mr. Roosevelt: 98,841; Dr. Benjamin: 20,807; and Mr. MacMillan: 0. |
123
Table of Contents
| (5) | On July 23, 2015, we granted Dr. Ginsburg stock options to purchase 10,443 shares of our common stock as equity compensation for the 11-month period ending June 30, 2016. |
| (6) | Dr. Benjamin’s and Mr. MacMillan’s terms ended at our 2015 Annual Meeting of Stockholders. |
On June 29, 2015, the Compensation Committee approved an increase, beginning July 1, 2015, in the annual cash compensation payable to members of the Board from $70,000 to $80,000, plus additional cash compensation for service as a committee chair as described in the table below, payable quarterly in arrears and subject to their continued service on our Board and any applicable committees. In June 2015, the Compensation Committee did not modify the cash compensation for committee members other than the chair. The Compensation Committee determined that, starting June 2016, the Committee should establish a practice of assessing director compensation, and making equity awards to directors, where appropriate, on an annual basis.
| Committee Chair (Total Additional Cash Compensation) |
||||
| — Audit |
$ | 25,000 | ||
| — Compensation |
20,000 | |||
| — Nominating and Corporate Governance |
20,000 | |||
| Committee Members other than Chair (Total Additional Cash Compensation) |
||||
| — Audit |
15,000 | |||
| — Compensation |
10,000 | |||
| — Nominating and Corporate Governance |
10,000 |
In addition to the cash compensation described above, on October 31, 2013, each of the then-serving non-employee directors received stock options to purchase a number of shares of our common stock calculated using a Black-Scholes model based on (i) an assumed aggregate value on the grant date equal to the sum of (a) $600,000, or $200,000 annually for the period June 30, 2013 through June 30, 2016 (pro-rated for newly-appointed directors to their appointment date), and (b) the total amount of any cash compensation foregone for that period at the election of the director, if any, (ii) the closing price of our common stock on the New York Stock Exchange on the date of grant and (iii) management estimates of other Black-Scholes variables, including estimated life and volatility. These options have an exercise price equal to $33.73 per share, expire ten years after the date of grant and vest in three equal annual installments, beginning June 30, 2014. Mr. MacMillan’s term as a director ended at our 2015 Annual Meeting of Stockholders held on July 22, 2015, at which time further vesting under his option ceased.
On December 31, 2013, Dr. Benjamin received stock options to purchase a number of shares of our common stock calculated using a Black-Scholes model based on (i) an assumed aggregate value on the grant date equal to the sum of (a) $510,662, equal to $200,000 annually for the period June 30, 2013 through June 30, 2016 (pro-rated to her appointment date of December 11, 2013), and (b) $44,684.93 of cash compensation foregone by Dr. Benjamin, (ii) $36.20, the closing price of our common stock on the New York Stock Exchange on the date of grant of the stock option, and (iii) management estimates of other Black-Scholes variables, including estimated life and volatility. These options have an exercise price equal to $36.20 per share, expire ten years after the date of grant and vest in three equal annual installments, beginning June 30, 2014. Dr. Benjamin’s term as a director ended at our 2015 Annual Meeting of Stockholders held on July 22, 2015, at which time further vesting under her option ceased.
On August 31, 2015, Dr. Ginsburg received stock options to purchase 10,443 shares of our common stock calculated using a Black-Scholes model based on (i) an assumed aggregate value on the grant date equal to the sum of $183,333 for 11 months for the period from July 30, 2015 through June 30, 2016 ($200,000 annually pro-rated to his appointment date of July 22, 2015), (ii) $51.97, the closing price of our common stock on the New York Stock Exchange on the date of grant of the stock option, and (iii) management estimates of other Black-Scholes variables, including estimated life and
124
Table of Contents
volatility. These options have an exercise price equal to $51.97 per share, expire ten years after the date of grant and vest over 11 months beginning July 30, 2015.
Employee directors do not receive compensation for their services as directors.
| ITEM 12. | SECURITY OWNERSHIP OF CERTAIN BENEFICIAL OWNERS AND MANAGEMENT AND RELATED STOCKHOLDER MATTERS |
The following table furnishes information as to shares of our common stock beneficially owned by:
| • | each person or entity known by us to beneficially own more than five percent of our common stock; |
| • | each of our directors; |
| • | each of our “named executive officers” (as defined in “Compensation Discussion and Analysis” above); and |
| • | all of our current directors and executive officers as a group. |
Unless otherwise stated, beneficial ownership is calculated as of July 1, 2016. For the purpose of this table, a person, group or entity is deemed to have “beneficial ownership” of any shares that such person, group or entity has the right to acquire within 60 days after such date through the exercise of options or warrants.
Security Ownership of Certain Beneficial Owners and Management
| Common Stock | ||||||||
| Name and Address of Beneficial Owner (1) |
Amount and Nature of Beneficial Ownership (2) |
Percent of Class (3) |
||||||
| FMR LLC (4) |
9,504,227 | 10.74 | % | |||||
| Invesco Ltd. (5) |
7,250,709 | 8.19 | % | |||||
| EdgePoint Investment Group Inc. (6) |
7,189,916 | 8.13 | % | |||||
| The Vanguard Group (7) |
5,789,159 | 6.54 | % | |||||
| Gregg Powers (8) |
931,983 | 1.05 | % | |||||
| Håkan Björklund, Ph.D (9) |
53,756 | * | ||||||
| Geoffrey Ginsburg (10) |
10,443 | * | ||||||
| Carol R. Goldberg (11) |
194,047 | * | ||||||
| John F. Levy (12) |
299,980 | * | ||||||
| Brian Markison (13) |
53,756 | * | ||||||
| Thomas McKillop, Ph.D. (14). |
53,756 | * | ||||||
| John A. Quelch, D.B.A.(15) |
142,935 | * | ||||||
| James Roosevelt, Jr. (16) |
103,285 | * | ||||||
| Namal Nawana (17) |
377,532 | * | ||||||
| James Hinrichs (18) |
136,196 | * | ||||||
| Sanjay Malkani (19) |
121,263 | * | ||||||
| Daniella Cramp (20) |
199,885 | * | ||||||
| Renuka Uppaluri, Ph.D. (21) |
22,861 | * | ||||||
| David Teitel (22) |
9,721 | * | ||||||
| All current executive officers and directors (22 persons) (23) |
3,808,307 | 4.30 | % | |||||
| * | Represents less than 1% |
| (1) | The address of each director or executive officer (and any related persons or entities) is c/o Alere at its principal office. |
| (2) | Unless otherwise indicated, to our knowledge, the stockholders identified in this table have sole voting and dispositive power with respect to the shares beneficially owned by them. |
125
Table of Contents
| (3) | The number of shares outstanding used in calculating the percentage ownership for each person, group or entity listed includes the number of shares underlying options, warrants and convertible securities held by such person, group or entity that were exercisable within 60 days after July 1, 2016, but excludes shares of stock underlying options, warrants and convertible securities held by any other person, group or entity. |
| (4) | This information is based on information contained in a Schedule 13G/A filed with the SEC on April 11, 2016 by FMR LLC and Abigail P. Johnson. Each of FMR LLC and Mrs. Johnson reported that it or she has (i) in the case of FMR LLC only, sole voting power with respect to 5,294,410 shares and (ii) sole dispositive power with respect to 9,504,227 shares. The address provided therein for FMR LLC and Mrs. Johnson is 245 Summer Street, Boston, MA 02210. |
| (5) | This information is based on information contained in a Schedule 13G/A filed with the SEC on February 3, 2016 by Invesco Ltd. Invesco Ltd. reported that it has sole voting and dispositive power with respect to 7,250,709 shares. The address provided therein for Invesco Ltd. is 1555 Peachtree Street NE, Suite 1800, Atlanta, GA 30309. |
| (6) | This information is based on information contained in a Schedule 13G/A filed with the SEC on February 16, 2016 by EdgePoint Investment Group Inc. EdgePoint Investment Group Inc. reported that it has shared voting and dispositive power with respect to 7,189,916 shares. The address provided therein for EdgePoint Investment Group Inc. is 150 Bloor Street West, Suite 500, Toronto, Ontario M5S 2X9, Canada. |
| (7) | This information is based on information contained in a Schedule 13G/A filed with the SEC on February 10, 2016 by The Vanguard Group. The Vanguard Group reported that it has (i) sole voting power with respect to 62,137 shares, (ii) shared voting power with respect to 4,600 shares, (iii) sole dispositive power with respect to 5,727,322 shares and (iv) shared dispositive power with respect to 61,837 shares. The address provided therein for The Vanguard Group is 100 Vanguard Blvd, Malvern, PA 19355. |
| (8) | Consists of 46,000 shares of common stock owned directly by Mr. Powers all of which Mr. Powers acquired through open market purchases as opposed to as part of his compensation as a director, 654,363 shares of common stock owned by clients of Private Capital Management, L.P. (“PCM”), of which Mr. Powers is Chairman and Chief Executive Officer and has trading authority, 190,125 shares of common stock owned primarily through pooled investment vehicles for which PCM serves as investment advisor and exercises exclusive investment control, 1,675 shares of common stock owned in a PCM proprietary account for which PCM exercises exclusive investment control and 39,820 shares of common stock underlying options exercisable within 60 days from July 1, 2016. The foregoing options were issued to Mr. Powers for his service as a director and were transferred to Pelican Bay Holdings, PCM’s general partner, by Mr. Powers. Mr. Powers is the sole owner, indirectly, of Pelican Bay Holdings. Mr. Powers disclaims beneficial ownership of the common shares owned by the clients of PCM. |
| (9) | Consists of 53,756 shares of common stock underlying options exercisable within 60 days from July 1, 2016. |
| (10) | Consists of 10,443 shares of common stock underlying options exercisable within 60 days from July 1, 2016. |
| (11) | Consists of 102,494 shares of common stock and 91,553 shares of common stock underlying options exercisable within 60 days from July 1, 2016. |
| (12) | Consists of 167,700 shares of common stock and 132,280 shares of common stock underlying options exercisable within 60 days from July 1, 2016. Includes 1,007 shares of common stock owned by a charitable remainder unitrust of which Mr. Levy disclaims beneficial ownership. |
| (13) | Consists of 53,756 shares of common stock underlying options exercisable within 60 days from July 1, 2016. |
126
Table of Contents
| (14) | Consists of 53,756 shares of common stock underlying options exercisable within 60 days from July 1, 2016. |
| (15) | Consists of 21,121 shares of common stock and 121,814 shares of common stock underlying options exercisable within 60 days from July 1, 2016. |
| (16) | Consists of 4,444 shares of common stock and 98,841 shares of common stock underlying options exercisable within 60 days from July 1, 2016. |
| (17) | Consists of 110,225 shares of common stock and 267,307 shares of common stock underlying options exercisable within 60 days from July 1, 2016. |
| (18) | Consists of 30,000 shares of common stock, 89,530 shares of common stock underlying options exercisable within 60 days from July 1, 2016 and 16,666 shares of common stock issuable in connection with the vesting of RSUs as of July 1, 2016. |
| (19) | Consists of 11,002 shares of common stock and 110,261 shares of common stock underlying options exercisable within 60 days from July 1, 2016. Includes 565 shares of common stock owned indirectly by Mr. Malkani’s spouse of which Mr. Malkani disclaims beneficial ownership. |
| (20) | Consists of 11,176 shares of common stock and 188,709 shares of common stock underlying options exercisable within 60 days from July 1, 2016. Includes 275 shares of common stock owned by the Cramp Family Trust for which Ms. Cramp is a trustee. |
| (21) | Consists of 4,111 shares of common stock and 18,750 shares of common stock underlying options exercisable within 60 days from July 1, 2016. |
| (22) | Consists of 9,721 shares of common stock. |
| (23) | Consists of 1,093,082 shares of common stock and 1,778,169 shares of common stock underlying options exercisable within 60 days from July 1, 2016. |
In addition, as of July 1, 2016, Mr. Powers directly owns 18,608 shares of convertible preferred stock (all of which Mr. Powers acquired through open market purchases as opposed to as part of his compensation as a director). Additionally, as of July 1, 2016, 1,486 shares of convertible preferred stock are owned by clients of PCM and Mr. Powers exercises trading authority with respect to such shares and 3,257 shares of convertible preferred stock are owned through pooled investment vehicles for which PCM serves as investment advisor and exercises exclusive investment control. Mr. Powers disclaims beneficial ownership of the convertible preferred stock owned by the clients of PCM. We are not aware that any of our other directors or executive officers beneficially owns any other shares of convertible preferred stock.
Equity Compensation Plan Information
The following table provides information regarding compensation plans under which we are authorized to issue equity securities as of December 31, 2015.
| Plan Category |
Number of Securities to be Issued upon Exercise of Outstanding Options, Warrants and Rights(1) |
Weighted-average Exercise Price of Outstanding Options, Warrants and Rights |
Number of
Securities Remaining Available for Future Issuance under Equity Compensation Plans (excluding securities reflected in column (a))(2) |
|||||||||
| (a) | (b) | (c) | ||||||||||
| Equity compensation plans approved by security holders |
6,289,711 | (3) | $ | 37.71 | 9,723,385 | (4) | ||||||
| Equity compensation plans not approved by security holders |
300,000 | (5) | 50.08 | — | ||||||||
| Total |
6,589,711 | 34.75 | 9,723,385 | (4) | ||||||||
127
Table of Contents
| (1) | This table excludes an aggregate of 152,303 shares issuable upon exercise of outstanding options assumed by us in connection with various acquisition transactions. The weighted average exercise price of the excluded acquired options is $46.04 per share. |
| (2) | In addition to being available for future issuance upon exercise of options that may be granted after December 31, 2015, 7,927,835 shares under our 2010 Stock Option and Incentive Plan may instead be issued in the form of restricted stock, RSUs, unrestricted stock, performance share awards or other equity-based awards. |
| (3) | Includes 5,740,034 shares issuable upon exercise of outstanding options with a weighted average exercise of $37.71 and 549,677 shares issuable upon vesting of RSUs and PSUs. |
| (4) | Includes 1,795,550 shares issuable under our 2001 Employee Stock Purchase Plan. |
| (5) | Represents 250,000 shares issuable upon exercise of stock options and 50,000 shares issuable upon vesting of RSUs issued as inducement grants to James Hinrichs in connection with his hiring as Chief Financial Officer and Executive Vice President in April 2015. For further information about the terms of these stock options and RSUs, see “Compensation Discussion and Analysis — Hiring of James Hinrichs as CFO” above. |
| ITEM 13. | CERTAIN RELATIONSHIPS AND RELATED TRANSACTIONS, AND DIRECTOR INDEPENDENCE |
Director Independence
The Board of Directors has determined that the following directors are independent under the rules of the New York Stock Exchange: Dr. Björklund, Dr. Ginsburg, Ms. Goldberg, Mr. Levy, Mr. Markison, Dr. McKillop, Mr. Powers, Dr. Quelch and Mr. Roosevelt. The Board has an Audit Committee, a Compensation Committee and a Nominating and Corporate Governance Committee, each composed solely of directors who satisfy the applicable independence requirements of the New York Stock Exchange’s listing standards for such committees.
Policies and Procedures with Respect to Related Party Transactions
Our Audit Committee Charter requires that the Audit Committee, which is composed solely of independent directors, conduct an appropriate review of, and be responsible for the oversight of, all related party transactions on an ongoing basis. We do not have written policies or procedures governing the Audit Committee’s review of related party transactions but rely on the Audit Committee’s exercise of business judgment in reviewing such transactions.
| ITEM 14. | PRINCIPAL ACCOUNTANT FEES AND SERVICES |
Our Audit Committee engaged PricewaterhouseCoopers LLP, or PwC, to serve as our independent registered public accounting firm for the fiscal year ending December 31, 2015. The selection of PwC was approved by our stockholders at the 2015 annual meeting of stockholders. Our Audit Committee has also engaged PwC to serve as our independent registered public accounting firm for the fiscal year ending December 31, 2016.
Audit Fees
Aggregate audit fees billed by PwC for 2015 were $14,811,710. Audit fees include fees billed for professional services rendered in connection with PwC’s integrated audit of our consolidated annual financial statements and internal control over financial reporting and review of our quarterly financial statements, and audit services normally provided by the principal independent registered public accounting firm in connection with other statutory or regulatory filings. Aggregate audit fees billed by PwC for 2014 were $8,058,522.
128
Table of Contents
Audit-related Fees
Aggregate audit-related fees billed in 2015 and 2014 by PwC were $659,923 and $3,836,372, respectively. Audit-related fees for 2015 and 2014 consist of fees billed for professional services rendered by the firm for accounting consultations and services related to potential divestiture transactions and financings.
Tax Fees
Aggregate tax fees billed in 2015 and 2014 for tax-related services performed by PwC were $1,393,112 and $112,092, respectively. Tax fees include fees billed for professional services rendered by PwC for tax compliance, tax advice and tax planning.
All Other Fees
No other fees were billed by PwC for 2015 or 2014.
Pre-approval Policies and Procedures
The Audit Committee pre-approves all audit and non-audit services provided by the independent registered public accounting firm other than permitted non-audit services estimated in good faith by the independent registered public accounting firm and management to entail fees payable of $25,000 or less on a project-by-project basis and which would also qualify for exemption from the pre-approval requirements of the Securities Exchange Act of 1934, as amended. No services were provided for 2015 or 2014 in reliance on this exemption. The authority to pre-approve non-audit services may be delegated to one or more members of the Audit Committee, who shall present any services so pre-approved to the full Audit Committee at its next meeting.
129
Table of Contents
PART IV
| ITEM 15. | EXHIBITS AND FINANCIAL STATEMENT SCHEDULES |
1. Financial Statements.
The financial statements listed below have been filed as part of this report on the pages indicated:
2. Exhibits.
Some of the agreements filed as exhibits to this report contain representations and warranties that were made solely for the benefit of the parties to the agreement. These representations and warranties:
| • | may have been qualified by disclosures that were made to the other party or parties in connection with the negotiation of the agreements, which disclosures are not necessarily reflected in the agreements; |
| • | may apply standards of materiality that differ from those of investors; |
| • | may have constituted an allocation of risk and responsibility among the parties rather than statements of fact; and |
| • | were made only as of specified dates contained in the agreements and are subject to subsequent developments and changed circumstances. |
Accordingly, these representations and warranties may not describe the actual state of affairs as of the date that these representations and warranties were made or at any other time. Investors should not rely on them as statements of fact.
| Exhibit No. |
Description | |
| *2.1 | Membership Interest Purchase Agreement dated October 27, 2014, by and among Alere Inc., Alere Health, LLC and OptumHealth Care Solutions, Inc. (incorporated by reference to Exhibit 2.1 to the Company’s Current Report on Form 8-K, event date October 27, 2014, filed October 28, 2014) | |
| *2.2 | Agreement and Plan of Merger dated as of January 30, 2016, among Alere Inc. and Abbott Laboratories (incorporated by reference to Exhibit 2.1 to the Company’s Current Report on Form 8-K, event date January 30, 2016, filed February 1, 2016) | |
| 3.1 | Amended and Restated Certificate of Incorporation of the Company (incorporated by reference to Exhibit 3.1 to the Company’s Quarterly Report on Form 10-Q for the quarter ended September 30, 2014) | |
| 3.2 | Amended and Restated By-laws of the Company (incorporated by reference to Exhibit 3.2 to the Company’s Current Report on Form 8-K, event date August 21, 2014, filed with the SEC on August 26, 2014) | |
| 3.3 | Amendment to the Amended and Restated By-laws of the Company (incorporated by reference to Exhibit 3.1 to the Company’s Current Report on Form 8-K, current date January 30, 2016, filed with the SEC on February 1, 2016) | |
130
Table of Contents
| Exhibit No. |
Description | |
| 4.1 | Indenture dated as of May 14, 2007 between the Company, as issuer, and U.S. Bank National Association, as trustee (incorporated by reference to Exhibit 4.1 to the Company’s Current Report on Form 8-K, event date May 9, 2007, filed on May 15, 2007) | |
| 4.2 | Indenture dated as of May 12, 2009 between the Company, as issuer, and U.S. Bank National Association, as trustee (incorporated by reference to Exhibit 4.1 to the Company’s Current Report on Form 8-K, event date May 12, 2009, filed on May 12, 2009) | |
| 4.3 | Sixteenth Supplemental Indenture dated as of May 24, 2013 to Indenture dated as of May 12, 2009 among the Company, as issuer, the subsidiary guarantors named therein, as guarantors, and U.S. Bank National Association, as trustee (incorporated by reference to Exhibit 4.1 to the Company’s Current Report on Form 8-K, event date May 23, 2013, filed on May 30, 2013) | |
| 4.4 | Eighteenth Supplemental Indenture dated as of June 5, 2014 to Indenture dated as of May 12, 2009 (relating to the BBI Transaction) among the Company, as issuer, the subsidiary guarantors party thereto, as guarantors, and U.S. Bank National Association, as trustee (incorporated by reference to Exhibit 4.3 to the Company’s Current Report on Form 8-K, event date May 30, 2014, filed on June 5, 2014) | |
| 4.5 | Twentieth Supplemental Indenture dated as of October 30, 2014 to Indenture dated as of May 12, 2009 (to add the guarantees of NewCo SS, LLC, Newco AA, Inc., Newco RD, LLC, Newco RD2, LLC, and Alere Holdco, Inc.) among NewCo SS, LLC, Newco AA, Inc., Newco RD, LLC, Newco RD2, LLC, and Alere Holdco, Inc., as guarantors, the Company, as issuer, the other guarantor subsidiaries named therein, as guarantors, and U.S. Bank National Association, as trustee (incorporated by reference to Exhibit 4.11 to the Company’s Annual Report on Form 10-K for the year ended December 31, 2014) | |
| **4.6 | Twenty-Third Supplemental Indenture dated as of September 15, 2015 to Indenture dated as of May 12, 2009 (to add the guarantee of Instant Tech Subsidiary Acquisition Inc.) among Instant Tech Subsidiary Acquisition Inc., as guarantor, the Company, as issuer, the other guarantor subsidiaries named therein, as guarantors, and U.S. Bank National Association, as trustee | |
| 4.7 | Twenty-First Supplemental Indenture dated as of June 24, 2015 to Indenture dated as of May 12, 2009 among the Company, as issuer, the subsidiary guarantors named therein, as guarantors, and U.S. Bank National Association, as trustee (incorporated by reference to Exhibit 4.1 to the Company’s Current Report on Form 8-K, event date June 18, 2015, filed on June 24, 2015) | |
| **4.8 | Twenty-Second Supplemental Indenture dated as of September 15, 2015 to Indenture dated as of May 12, 2009 (to add the guarantee of Instant Tech Subsidiary Acquisition Inc.) among Instant Tech Subsidiary Acquisition Inc., as guarantor, the Company, as issuer, the other guarantor subsidiaries named therein, as guarantors, and U.S. Bank National Association, as trustee | |
| 4.9 | Indenture dated as of August 11, 2009 between the Company, as issuer, and The Bank of New York Mellon Trust Company, N.A., as trustee (incorporated by reference to Exhibit 4.1 to the Company’s Current Report on Form 8-K, event date August 11, 2009, filed on August 11, 2009) | |
| 4.10 | Fifteenth Supplemental Indenture dated as of December 11, 2012 to Indenture dated as of August 11, 2009 among the Company, as issuer, the subsidiary guarantors named therein, as guarantors, and The Bank of New York Mellon Trust Company, N.A., as trustee (incorporated by reference to Exhibit 4.2 to the Company’s Current Report on Form 8-K, event date December 11, 2012, filed on December 14, 2012) | |
131
Table of Contents
| Exhibit No. |
Description | |
| 4.11 | Sixteenth Supplemental Indenture dated as of April 3, 2013 to Indenture dated as of August 11, 2009 (to add the guarantees of Alere Informatics, Inc., Alere Wellogic, LLC, ATS Laboratories, Inc., Avee Laboratories Inc., eScreen, Inc., Global Analytical Development LLC, Ionian Technologies Inc., Pembrooke Occupational Health, Inc., Screen Tox, Inc., and Standing Stone, Inc.) among Alere Informatics, Inc., Alere Wellogic, LLC, ATS Laboratories, Inc., Avee Laboratories Inc., eScreen, Inc., Global Analytical Development LLC, Ionian Technologies Inc., Pembrooke Occupational Health, Inc., Screen Tox, Inc., and Standing Stone, Inc., as guarantors, the Company, as issuer, the other guarantor subsidiaries named therein, as guarantors, and The Bank of New York Mellon Trust Company, N.A., as trustee (incorporated by reference to Exhibit 4.6 of the Company’s Registration Statement on Form S-4 (File No. 333-187776)) | |
| 4.12 | Seventeenth Supplemental Indenture dated as of June 5, 2014 to Indenture dated as of August 11, 2009 (relating to the BBI Transaction) among the Company, as issuer, the subsidiary guarantors party thereto, as guarantors, and The Bank of New York Mellon Trust Company, N.A., as trustee (incorporated by reference to Exhibit 4.1 to the Company’s Current Report on Form 8-K, event date May 30, 2014, filed on June 5, 2014) | |
| 4.13 | Eighteenth Supplemental Indenture dated as of October 30, 2014 to Indenture dated as of August 11, 2009 (to add the guarantees of NewCo SS, LLC, Newco AA, Inc., Newco RD, LLC, Newco RD2, LLC, and Alere Holdco, Inc.) among NewCo SS, LLC, Newco AA, Inc., Newco RD, LLC, Newco RD2, LLC, and Alere Holdco, Inc., as guarantors, the Company, as issuer, the other guarantor subsidiaries named therein, as guarantors, and The Bank of New York Mellon Trust Company, N.A., as trustee (incorporated by reference to Exhibit 4.16 to the Company’s Annual Report on Form 10-K for the year ended December 31, 2014) | |
| **4.14 | Nineteenth Supplemental Indenture dated as of September 15, 2015 to Indenture dated as of August 11, 2009 (to add the guarantee of Instant Tech Subsidiary Acquisition Inc.) among Instant Tech Subsidiary Acquisition Inc., as guarantor, the Company, as issuer, the other guarantor subsidiaries named therein, as guarantors, and The Bank of New York Mellon Trust Company, N.A., as trustee | |
| 4.15 | Registration Rights Agreement dated as of December 11, 2012 among the Company, the guarantors named therein and Jefferies & Company, Inc., Goldman, Sachs & Co., and Credit Suisse Securities (USA) LLC, as representatives of the Initial Purchasers (incorporated by reference to Exhibit 4.4 to the Company’s Current Report on Form 8-K, event date December 11, 2012, filed on December 14, 2012) | |
| 4.16 | Registration Rights Agreement dated as of May 24, 2013 among the Company, the guarantors named therein and Goldman, Sachs & Co., Jefferies LLC and Credit Suisse Securities (USA) LLC, as representatives of the Initial Purchasers (incorporated by reference to Exhibit 4.3 to the Company’s Current Report on Form 8-K, event date May 23, 2013, filed on May 30, 2013) | |
| +10.1 | BNP Assay Development, Manufacture and Supply Agreement between Biosite Incorporated and Beckman Coulter, Inc. effective June 24, 2003 (incorporated by reference to Exhibit 10.22 to Annual Report of Biosite Incorporated on Form 10-K, filed on March 12, 2007) | |
| +10.2 | Shareholder Agreement dated as of May 17, 2007 among Inverness Medical Switzerland GmbH, Procter & Gamble International Operations, SA and SPD Swiss Precision Diagnostics GmbH (incorporated by reference to Exhibit 10.12 to Company’s Quarterly Report on Form 10-Q for the period ended June 30, 2007) | |
| ‡10.3 | Alere Inc. 2001 Stock Option and Incentive Plan, as amended (incorporated by reference to Appendix A to the Company’s Proxy Statement filed on Schedule 14A as filed with the SEC on April 30, 2009) | |
132
Table of Contents
| Exhibit No. |
Description | |
| ‡10.4 | Alere Inc. 2010 Stock Option and Incentive Plan, as amended (incorporated by reference to Appendix A to the Company’s Proxy Statement filed on Schedule 14A as filed with the SEC on June 12, 2015) | |
| ‡10.5 | Rules of Alere Inc. HM Revenue and Customs Approved Share Option Plan (2007), as amended (authorized for use under the Alere Inc. 2001 Stock Option and Incentive Plan and the Alere Inc. 2010 Stock Option and Incentive Plan) (incorporated by reference to Exhibit 10.5 to the Company’s Quarterly Report on Form 10-Q for the period ended June 30, 2010) | |
| ‡10.6 | Summary of Terms of Award Agreements under Alere Inc. Stock Option Plans (incorporated by reference to Exhibit 10.4 to the Company’s Quarterly Report on Form 10-Q, for the period ended September 30, 2014) | |
| ‡10.7 | Alere Inc. 2001 Employee Stock Purchase Plan, as amended (incorporated by reference to Appendix B to the Company’s Proxy Statement filed on Schedule 14A as filed with the SEC on July 17, 2014) | |
| ‡10.8 | Summary of Non-Employee Director Compensation (incorporated by reference to Exhibit 10.8 to the Company’s Quarterly Report on Form 10-Q for the period ended September 30, 2010) | |
| ‡10.9 | Form of Change of Control Severance Agreement between the Company and certain of its executive officers (incorporated by reference to Exhibit 10.1 to the Company’s Current Report on Form 8-K, event date October 25, 2014, filed on October 28, 2014) | |
| ‡10.10 | Restricted Stock Unit Agreement dated as of December 30, 2012 between Alere Inc. and Namal Nawana (incorporated by reference to Exhibit 10.9 to the Company’s Annual Report on Form 10-K for the year ended December 31, 2012) | |
| ‡10.11 | Letter Agreement dated as of March 8, 2013 between Alere Inc. and Daniella Cramp (incorporated by reference to Exhibit 10.23 to the Company’s Annual Report on Form 10-K for the year ended December 31, 2014) | |
| ‡10.12 | Summary of Arrangement with Chairman of the Board Regarding Expense Reimbursement (incorporated by reference to Exhibit 10.2 to the Company’s Quarterly Report on Form 10-Q for the quarter ended June 30, 2014) | |
| ‡10.13 | Letter Agreement dated as of October 24, 2014 between Alere Inc. and Namal Nawana (incorporated by reference to Exhibit 10.22 to the Company’s Annual Report on Form 10-K for the year ended December 31, 2014) | |
| **‡10.14 | Letter Agreement dated as of December 31, 2014 between Alere Inc. and Renuka Uppaluri | |
| ‡10.15 | Alere Inc. 2015 Short-Term Incentive Plan (incorporated by reference to Exhibit 10.1 to the Company’s Current Report on Form 8-K, event date February 25, 2015, filed on March 3, 2015) | |
| ‡10.16 | Letter Agreement dated as of March 19, 2015 between Alere Inc. and James F. Hinrichs (incorporated by reference to Exhibit 4.1 to the Company’s Registration Statement on Form S-8, filed on April 9, 2015) | |
| ‡10.17 | Severance Agreement and Release dated as of September 30, 2015 between Alere Inc. and David Teitel (incorporated by reference to Exhibit 10.1 to the Company’s Current Report on Form 8-K, event date September 30, 2015, filed on October 6, 2015) | |
| ‡10.18 | Purchase Agreement dated as of November 28, 2012 among Alere Inc., the subsidiary guarantors named therein and Jefferies & Company, Inc., Goldman, Sachs & Co. and Credit Suisse Securities (USA) LLC, as representatives of the Initial Purchasers (incorporated by reference to Exhibit 10.1 to the Company’s Current Report on Form 8-K, event date November 28, 2012, filed on November 30, 2012) | |
133
Table of Contents
| Exhibit No. |
Description | |
| 10.19 | Purchase Agreement dated as of May 13, 2013 among Alere Inc., the subsidiary guarantors named therein and Goldman, Sachs & Co., Jefferies LLC and Credit Suisse Securities (USA) LLC, as representatives of the Initial Purchasers (incorporated by reference to Exhibit 10.1 to the Company’s Current Report on Form 8-K, event date May 10, 2013, filed on May 16, 2013) | |
| 10.20 | Purchase Agreement dated as of June 11, 2015 among Alere Inc., the subsidiary guarantors named therein and J.P. Morgan Securities LLC, as representative of the Initial Purchasers (incorporated by reference to Exhibit 10.1 to the Company’s Current Report on Form 8-K, event date June 10, 2015, filed on June 16, 2015) | |
| 10.21 | Credit Agreement dated as of June 18, 2015 among Alere Inc., as Borrower, the Lenders and L/C Issuers party thereto, Goldman Sachs Bank USA, as B Term Loan Administrative Agent, General Electric Capital Corporation, as Collateral Agent, Pro Rata Administrative Agent and Syndication Agent, Citizens Bank, N.A. and DNB Bank ASA, New York Branch, as Co-Documentation Agents, and Goldman Sachs Bank USA, GE Capital Markets, Inc., J.P. Morgan Securities LLC, DNB Markets, Inc., RBC Capital Markets, HSBC Securities (USA) Inc. and Citizens Bank, N.A., as Joint Lead Arrangers and Bookrunners (incorporated by reference to Exhibit 10.1 to the Company’s Current Report on Form 8-K, event date June 18, 2015, filed on June 24, 2015) | |
| 10.22 | Guaranty and Security Agreement dated as of June 18, 2015 among Alere Inc., as Borrower, each other Grantor party thereto and General Electric Capital Corporation, as Collateral Agent (incorporated by reference to Exhibit 10.2 to the Company’s Current Report on Form 8-K, event date June 18, 2015, filed on June 24, 2015) | |
| **21.1 | List of Subsidiaries of the Company as of August 8, 2016 | |
| **23.1 | Consent of PricewaterhouseCoopers LLP, Independent Registered Public Accounting Firm | |
| **31.1 | Certification by Chief Executive Officer Pursuant to Section 302 of the Sarbanes-Oxley Act | |
| **31.2 | Certification by Chief Financial Officer Pursuant to Section 302 of the Sarbanes-Oxley Act | |
| **32.1 | Certification Pursuant to 18 U.S.C. Section 1350, as Adopted Pursuant to Section 906 of the Sarbanes-Oxley Act | |
| **101 | Interactive Data Files regarding (a) our Consolidated Statements of Operations for the Years Ended December 31, 2015, 2014 and 2013, (b) our Consolidated Statements of Comprehensive Income (Loss) for the Years Ended December 31, 2015, 2014 and 2013, (c) our Consolidated Balance Sheets as of December 31, 2015 and 2014, (d) our Consolidated Statements of Equity for the Years Ended December 31, 2015, 2014 and 2013, (e) our Consolidated Statements of Cash Flows for the Years Ended December 31, 2015, 2014 and 2013 and (f) the Notes to such consolidated financial statements. | |
| * | The Company agrees to furnish supplementally to the Securities and Exchange Commission (the “Commission”) a copy of any omitted schedule or exhibit to this agreement upon request by the Commission. |
| ** | Filed herewith. |
| + | We have omitted portions of this exhibit which have been granted confidential treatment. |
| ‡ | Management contract or compensatory plan or arrangement, or amendment thereto. |
134
Table of Contents
Pursuant to the requirements of Section 13 or 15(d) of the Securities Exchange Act of 1934, the registrant has duly caused this report to be signed on its behalf by the undersigned, thereunto duly authorized.
| ALERE INC. | ||||||
| Date: August 8, 2016 | By: | /s/ Namal Nawana | ||||
| Namal Nawana | ||||||
| Chief Executive Officer and President | ||||||
Pursuant to the requirements of the Securities Exchange Act of 1934, this report has been signed below by the following persons on behalf of the Registrant and in the capacities and on the dates indicated.
| Signature |
Title |
Date | ||
| /s/ Namal Nawana Namal Nawana |
Chief Executive Officer, President and Director (Principal Executive Officer) |
August 8, 2016 | ||
| /s/ James F. Hinrichs James F. Hinrichs |
Chief Financial Officer (Principal Financial Officer) |
August 8, 2016 | ||
| /s/ Jonathan Wygant Jonathan Wygant |
Chief Accounting Officer (Principal Accounting Officer) |
August 8, 2016 | ||
| /s/ Håkan Björklund Håkan Björklund |
Director | August 8, 2016 | ||
| /s/ Geoffrey Ginsburg Geoffrey Ginsburg |
Director | August 8, 2016 | ||
| /s/ Carol R. Goldberg Carol R. Goldberg |
Director | August 8, 2016 | ||
| /s/ John F. Levy John F. Levy |
Director | August 8, 2016 | ||
| /s/ Brian Markison Brian Markison |
Director | August 8, 2016 | ||
| /s/ Thomas McKillop Thomas McKillop |
Director | August 8, 2016 | ||
| /s/ Gregg J. Powers Gregg J. Powers |
Chairman, Director | August 8, 2016 | ||
| /s/ John A. Quelch John A. Quelch |
Director | August 8, 2016 | ||
| /s/ James Roosevelt, Jr. James Roosevelt, Jr. |
Director | August 8, 2016 | ||
135
Table of Contents
CONSOLIDATED FINANCIAL STATEMENTS
F-1
Table of Contents
Report of Independent Registered Public Accounting Firm
To the Board of Directors and Stockholders of Alere Inc.
In our opinion, the accompanying consolidated balance sheets and the related consolidated statements of operations, of comprehensive income (loss), of equity and of cash flows present fairly, in all material respects, the financial position of Alere Inc. and its subsidiaries as of December 31, 2015 and 2014, and the results of their operations and their cash flows for each of the three years in the period ended December 31, 2015 in conformity with accounting principles generally accepted in the United States of America. Also in our opinion, the Company did not maintain, in all material respects, effective internal control over financial reporting as of December 31, 2015, based on criteria established in Internal Control—Integrated Framework (2013) issued by the Committee of Sponsoring Organizations of the Treadway Commission (COSO) because material weaknesses in internal control over financial reporting related to 1) an insufficient complement of resources with adequate experience and expertise in accounting for income taxes related to dispositions and U.S. taxes on foreign earnings; 2) an insufficient complement of resources at the Company’s subsidiaries with appropriate knowledge, experience and training in accounting for revenue recognition, 3) ineffective controls over information and communication as it relates to revenue recognition at the Company’s subsidiaries, 4) ineffectively designed controls over the review of terms of purchase orders and customer contracts related to revenue recognition and 5) ineffectively designed controls to ensure that revenue would not be recognized until title and risk of loss had passed existed as of that date. A material weakness is a deficiency, or a combination of deficiencies, in internal control over financial reporting, such that there is a reasonable possibility that a material misstatement of the annual or interim financial statements will not be prevented or detected on a timely basis. The material weaknesses referred to above are described in Management’s Annual Report on Internal Control over Financial Reporting appearing under Item 9A. We considered these material weaknesses in determining the nature, timing, and extent of audit tests applied in our audit of the December 31, 2015 consolidated financial statements, and our opinion regarding the effectiveness of the Company’s internal control over financial reporting does not affect our opinion on those consolidated financial statements. The Company’s management is responsible for these financial statements, for maintaining effective internal control over financial reporting and for its assessment of the effectiveness of internal control over financial reporting included in management’s report referred to above. Our responsibility is to express opinions on these financial statements and on the Company’s internal control over financial reporting based on our integrated audits. We conducted our audits in accordance with the standards of the Public Company Accounting Oversight Board (United States). Those standards require that we plan and perform the audits to obtain reasonable assurance about whether the financial statements are free of material misstatement and whether effective internal control over financial reporting was maintained in all material respects. Our audits of the financial statements included examining, on a test basis, evidence supporting the amounts and disclosures in the financial statements, assessing the accounting principles used and significant estimates made by management, and evaluating the overall financial statement presentation. Our audit of internal control over financial reporting included obtaining an understanding of internal control over financial reporting, assessing the risk that a material weakness exists, and testing and evaluating the design and operating effectiveness of internal control based on the assessed risk. Our audits also included performing such other procedures as we considered necessary in the circumstances. We believe that our audits provide a reasonable basis for our opinions.
As discussed in Note 4 and 17 to the consolidated financial statements, the Company changed the manner in which it classifies deferred taxes in 2015.
A company’s internal control over financial reporting is a process designed to provide reasonable assurance regarding the reliability of financial reporting and the preparation of financial statements for external purposes in accordance with generally accepted accounting principles. A company’s internal control over financial reporting includes those policies and procedures that (i) pertain to the maintenance of records that, in reasonable detail, accurately and fairly reflect the transactions and dispositions of the assets of the company; (ii) provide reasonable assurance that transactions are
F-2
Table of Contents
recorded as necessary to permit preparation of financial statements in accordance with generally accepted accounting principles, and that receipts and expenditures of the company are being made only in accordance with authorizations of management and directors of the company; and (iii) provide reasonable assurance regarding prevention or timely detection of unauthorized acquisition, use, or disposition of the company’s assets that could have a material effect on the financial statements.
Because of its inherent limitations, internal control over financial reporting may not prevent or detect misstatements. Also, projections of any evaluation of effectiveness to future periods are subject to the risk that controls may become inadequate because of changes in conditions, or that the degree of compliance with the policies or procedures may deteriorate.
/s/ PricewaterhouseCoopers LLP
Boston, Massachusetts
August 8, 2016
F-3
Table of Contents
CONSOLIDATED STATEMENTS OF OPERATIONS
(in thousands, except per share amounts)
| Year Ended December 31, | ||||||||||||
| 2015 | 2014 | 2013 | ||||||||||
| Net product sales |
$ | 1,954,031 | $ | 2,022,240 | $ | 2,048,789 | ||||||
| Services revenue |
492,308 | 531,988 | 532,618 | |||||||||
|
|
|
|
|
|
|
|||||||
| Net product sales and services revenue |
2,446,339 | 2,554,228 | 2,581,407 | |||||||||
| License and royalty revenue |
16,977 | 21,050 | 27,229 | |||||||||
|
|
|
|
|
|
|
|||||||
| Net revenue |
2,463,316 | 2,575,278 | 2,608,636 | |||||||||
|
|
|
|
|
|
|
|||||||
| Cost of net product sales |
1,042,603 | 1,062,499 | 1,014,531 | |||||||||
| Cost of services revenue |
304,388 | 294,949 | 274,229 | |||||||||
|
|
|
|
|
|
|
|||||||
| Cost of net product sales and services revenue |
1,346,991 | 1,357,448 | 1,288,760 | |||||||||
| Cost of license and royalty revenue |
3,781 | 5,592 | 7,763 | |||||||||
|
|
|
|
|
|
|
|||||||
| Cost of net revenue |
1,350,772 | 1,363,040 | 1,296,523 | |||||||||
|
|
|
|
|
|
|
|||||||
| Gross profit |
1,112,544 | 1,212,238 | 1,312,113 | |||||||||
| Operating expenses: |
||||||||||||
| Research and development |
119,453 | 144,828 | 159,053 | |||||||||
| Sales and marketing |
435,131 | 512,961 | 566,137 | |||||||||
| General and administrative |
369,570 | 453,628 | 435,199 | |||||||||
| Impairment and loss on dispositions, net |
50,540 | 7,742 | 5,124 | |||||||||
|
|
|
|
|
|
|
|||||||
| Operating income |
137,850 | 93,079 | 146,600 | |||||||||
| Interest expense, including amortization of original issue discounts and deferred financing costs |
(216,997 | ) | (209,191 | ) | (255,346 | ) | ||||||
| Other income (expense), net |
(1,843 | ) | (2,221 | ) | (11,260 | ) | ||||||
|
|
|
|
|
|
|
|||||||
| Loss from continuing operations before provision (benefit) for income taxes |
(80,990 | ) | (118,333 | ) | (120,006 | ) | ||||||
| Provision (benefit) for income taxes |
(52,704 | ) | 70,930 | (44,707 | ) | |||||||
|
|
|
|
|
|
|
|||||||
| Income (loss) from continuing operations before equity earnings of unconsolidated entities, net of tax |
(28,286 | ) | (189,263 | ) | (75,299 | ) | ||||||
| Equity earnings of unconsolidated entities, net of tax |
15,530 | 17,509 | 17,443 | |||||||||
|
|
|
|
|
|
|
|||||||
| Income (loss) from continuing operations |
(12,756 | ) | (171,754 | ) | (57,856 | ) | ||||||
| Income (loss) from discontinued operations, net of tax |
219,513 | 138,318 | (16,126 | ) | ||||||||
|
|
|
|
|
|
|
|||||||
| Net income (loss) |
206,757 | (33,436 | ) | (73,982 | ) | |||||||
| Less: Net income attributable to non-controlling interests |
381 | 30 | 976 | |||||||||
|
|
|
|
|
|
|
|||||||
| Net income (loss) attributable to Alere Inc. and Subsidiaries |
206,376 | (33,466 | ) | (74,958 | ) | |||||||
| Preferred stock dividends |
(21,293 | ) | (21,293 | ) | (21,293 | ) | ||||||
|
|
|
|
|
|
|
|||||||
| Net income (loss) available to common stockholders |
$ | 185,083 | $ | (54,759 | ) | $ | (96,251 | ) | ||||
|
|
|
|
|
|
|
|||||||
| Basic and Diluted net income (loss) per common share: |
||||||||||||
| Loss from continuing operations |
$ | (0.40 | ) | $ | (2.33 | ) | $ | (0.98 | ) | |||
| Income (loss) from discontinued operations |
2.57 | 1.67 | (0.20 | ) | ||||||||
|
|
|
|
|
|
|
|||||||
| Net income (loss) per common share |
$ | 2.17 | $ | (0.66 | ) | $ | (1.18 | ) | ||||
|
|
|
|
|
|
|
|||||||
| Weighted-average shares —basic and diluted |
85,420 | 82,938 | 81,542 | |||||||||
|
|
|
|
|
|
|
|||||||
The accompanying notes are an integral part of these consolidated financial statements.
F-4
Table of Contents
CONSOLIDATED STATEMENTS OF COMPREHENSIVE INCOME (LOSS)
(in thousands)
| Year Ended December 31, | ||||||||||||
| 2015 | 2014 | 2013 | ||||||||||
| Net income (loss) |
$ | 206,757 | $ | (33,436 | ) | $ | (73,982 | ) | ||||
|
|
|
|
|
|
|
|||||||
| Other comprehensive loss, before tax: |
||||||||||||
| Changes in cumulative translation adjustment |
(146,438 | ) | (166,448 | ) | (50,166 | ) | ||||||
| Unrealized losses on available for sale securities |
— | (17 | ) | — | ||||||||
| Unrealized gains on hedging instruments |
— | 38 | 39 | |||||||||
| Minimum pension liability adjustment |
(1,173 | ) | (169 | ) | (415 | ) | ||||||
|
|
|
|
|
|
|
|||||||
| Other comprehensive loss, before tax |
(147,611 | ) | (166,596 | ) | (50,542 | ) | ||||||
| Income tax provision (benefit) related to items of other comprehensive loss |
56 | (173 | ) | (106 | ) | |||||||
|
|
|
|
|
|
|
|||||||
| Other comprehensive loss, net of tax |
(147,667 | ) | (166,423 | ) | (50,436 | ) | ||||||
|
|
|
|
|
|
|
|||||||
| Comprehensive income (loss) |
59,090 | (199,859 | ) | (124,418 | ) | |||||||
| Less: Comprehensive income attributable to non-controlling interests |
381 | 30 | 976 | |||||||||
|
|
|
|
|
|
|
|||||||
| Comprehensive income (loss) attributable to Alere Inc. and Subsidiaries |
$ | 58,709 | $ | (199,889 | ) | $ | (125,394 | ) | ||||
|
|
|
|
|
|
|
|||||||
The accompanying notes are an integral part of these consolidated financial statements.
F-5
Table of Contents
CONSOLIDATED BALANCE SHEETS
(in thousands, except par value)
| As of December 31, | ||||||||
| 2015 | 2014 | |||||||
| ASSETS | ||||||||
| Current assets: |
||||||||
| Cash and cash equivalents |
$ | 502,200 | $ | 378,461 | ||||
| Restricted cash |
5,694 | 37,571 | ||||||
| Marketable securities |
164 | 259 | ||||||
| Accounts receivable, net of allowances of $89,701 and $76,163 at December 31, 2015 and December 31, 2014, respectively |
445,833 | 461,096 | ||||||
| Inventories, net |
347,001 | 377,349 | ||||||
| Deferred tax assets |
— | 127,920 | ||||||
| Prepaid expenses and other current assets |
152,233 | 132,413 | ||||||
| Assets held for sale – current |
4,165 | 315,515 | ||||||
|
|
|
|
|
|||||
| Total current assets |
1,457,290 | 1,830,584 | ||||||
| Property, plant and equipment, net |
446,039 | 454,223 | ||||||
| Goodwill |
2,836,915 | 2,926,666 | ||||||
| Other intangible assets with indefinite lives |
28,110 | 43,651 | ||||||
| Finite-lived intangible assets, net |
997,281 | 1,276,444 | ||||||
| Restricted cash |
43,228 | — | ||||||
| Deferred financing costs, net, and other non-current assets |
52,128 | 67,832 | ||||||
| Investments in unconsolidated entities |
65,333 | 91,693 | ||||||
| Deferred tax assets |
13,993 | 6,318 | ||||||
| Non-current income tax receivable |
3,517 | 2,468 | ||||||
| Assets held for sale – non-current |
13,337 | — | ||||||
|
|
|
|
|
|||||
| Total assets |
$ | 5,957,171 | $ | 6,699,879 | ||||
|
|
|
|
|
|||||
| LIABILITIES AND EQUITY | ||||||||
| Current liabilities: |
||||||||
| Short-term debt and current portion of long-term debt |
$ | 199,992 | $ | 88,875 | ||||
| Current portion of capital lease obligations |
3,962 | 4,241 | ||||||
| Accounts payable |
195,752 | 213,592 | ||||||
| Accrued expenses and other current liabilities |
324,465 | 385,927 | ||||||
| Liabilities related to assets held for sale – current |
363 | 78,843 | ||||||
|
|
|
|
|
|||||
| Total current liabilities |
724,534 | 771,478 | ||||||
|
|
|
|
|
|||||
| Long-term liabilities: |
||||||||
| Long-term debt, net of current portion |
2,865,216 | 3,621,385 | ||||||
| Capital lease obligations, net of current portion |
7,181 | 11,593 | ||||||
| Deferred tax liabilities |
147,618 | 231,963 | ||||||
| Other long-term liabilities |
154,193 | 146,920 | ||||||
|
|
|
|
|
|||||
| Total long-term liabilities |
3,174,208 | 4,011,861 | ||||||
|
|
|
|
|
|||||
| Commitments and contingencies |
||||||||
| Stockholders’ equity: |
||||||||
| Series B preferred stock, $0.001 par value (liquidation preference: $709,763 at December 31, 2015 and 2014); Authorized: 2,300 shares; Issued: 2,065 shares at December 31, 2015 and 2014; Outstanding: 1,774 shares at December 31, 2015 and 2014 |
606,468 | 606,468 | ||||||
| Common stock, $0.001 par value; Authorized: 200,000 shares; Issued: 94,043 shares and 91,532 shares at December 31, 2015 and 2014, respectively; Outstanding: 86,364 shares and 83,853 shares at December 31, 2015 and 2014, respectively |
94 | 92 | ||||||
| Additional paid-in capital |
3,438,732 | 3,355,672 | ||||||
| Accumulated deficit |
(1,466,381 | ) | (1,672,757 | ) | ||||
| Treasury stock, at cost, 7,679 shares at December 31, 2015 and 2014 |
(184,971 | ) | (184,971 | ) | ||||
| Accumulated other comprehensive loss |
(339,777 | ) | (192,110 | ) | ||||
|
|
|
|
|
|||||
| Total stockholders’ equity |
2,054,165 | 1,912,394 | ||||||
| Non-controlling interests |
4,264 | 4,146 | ||||||
|
|
|
|
|
|||||
| Total equity |
2,058,429 | 1,916,540 | ||||||
|
|
|
|
|
|||||
| Total liabilities and equity |
$ | 5,957,171 | $ | 6,699,879 | ||||
|
|
|
|
|
|||||
The accompanying notes are an integral part of these consolidated financial statements.
F-6
Table of Contents
CONSOLIDATED STATEMENTS OF EQUITY
(in thousands)
| Preferred Stock |
Common Stock |
Additional Paid-in Capital |
Accumulated Deficit |
Treasury Stock, |
Accumulated Other Compre- hensive Income (Loss) |
Total Stockholders’ Equity |
Non- controlling Interest |
Total Equity |
||||||||||||||||||||||||||||||||||||||||
| Number of Shares |
$0.001 Par Value |
|||||||||||||||||||||||||||||||||||||||||||||||
| Number of Shares |
Amount | Number of Shares |
Value | |||||||||||||||||||||||||||||||||||||||||||||
| BALANCE, DECEMBER 31, 2012 |
1,774 | $ | 606,468 | 88,576 | $ | 89 | $ | 3,299,935 | $ | (1,564,333 | ) | 7,679 | $ | (184,971 | ) | $ | 24,749 | $ | 2,181,937 | $ | 2,282 | $ | 2,184,219 | |||||||||||||||||||||||||
| Issuance of common stock under employee compensation plans |
— | — | 1,090 | 1 | 20,714 | — | — | — | — | 20,715 | — | 20,715 | ||||||||||||||||||||||||||||||||||||
| Preferred stock dividends |
— | — | — | — | (21,293 | ) | — | — | — | — | (21,293 | ) | — | (21,293 | ) | |||||||||||||||||||||||||||||||||
| Stock-based compensation expense |
— | — | — | — | 21,210 | — | — | — | — | 21,210 | — | 21,210 | ||||||||||||||||||||||||||||||||||||
| Excess tax benefits on exercised stock options |
— | — | — | — | (1,398 | ) | — | — | — | — | (1,398 | ) | — | (1,398 | ) | |||||||||||||||||||||||||||||||||
| Minimum pension liability adjustment, net of tax |
— | — | — | — | — | — | — | — | (309 | ) | (309 | ) | — | (309 | ) | |||||||||||||||||||||||||||||||||
| Changes in cumulative translation adjustment, net of tax |
— | — | — | — | — | — | — | — | (50,166 | ) | (50,166 | ) | — | (50,166 | ) | |||||||||||||||||||||||||||||||||
| Unrealized gain on hedging instruments, net of tax |
— | — | — | — | — | — | — | — | 39 | 39 | — | 39 | ||||||||||||||||||||||||||||||||||||
| Non-controlling interest from acquisition |
— | — | — | — | — | — | — | — | — | — | 1,788 | 1,788 | ||||||||||||||||||||||||||||||||||||
| Non-controlling interest dividend |
— | — | — | — | — | — | — | — | — | — | (164 | ) | (164 | ) | ||||||||||||||||||||||||||||||||||
| Net income (loss) |
— | — | — | — | — | (74,958 | ) | — | — | — | (74,958 | ) | 976 | (73,982 | ) | |||||||||||||||||||||||||||||||||
|
|
|
|
|
|
|
|
|
|
|
|
|
|
|
|
|
|
|
|
|
|
|
|
|
|||||||||||||||||||||||||
| BALANCE, DECEMBER 31, 2013 |
1,774 | $ | 606,468 | 89,666 | $ | 90 | $ | 3,319,168 | $ | (1,639,291 | ) | 7,679 | $ | (184,971 | ) | $ | (25,687 | ) | $ | 2,075,777 | $ | 4,882 | $ | 2,080,659 | ||||||||||||||||||||||||
|
|
|
|
|
|
|
|
|
|
|
|
|
|
|
|
|
|
|
|
|
|
|
|
|
|||||||||||||||||||||||||
F-7
Table of Contents
ALERE INC. AND SUBSIDIARIES
CONSOLIDATED STATEMENTS OF EQUITY (Continued)
(in thousands)
| Preferred Stock |
Common Stock |
Additional Paid-in Capital |
Accumulated Deficit |
Treasury Stock, |
Accumulated Other Compre- hensive Income (Loss) |
Total Stockholders’ Equity |
Non- controlling Interest |
Total Equity |
||||||||||||||||||||||||||||||||||||||||
| Number of Shares |
$0.001 Par Value |
|||||||||||||||||||||||||||||||||||||||||||||||
| Number of Shares |
Amount | Number of Shares |
Value | |||||||||||||||||||||||||||||||||||||||||||||
| BALANCE, DECEMBER 31, 2013 |
1,774 | $ | 606,468 | 89,666 | $ | 90 | $ | 3,319,168 | $ | (1,639,291 | ) | 7,679 | $ | (184,971 | ) | $ | (25,687 | ) | $ | 2,075,777 | $ | 4,882 | $ | 2,080,659 | ||||||||||||||||||||||||
| Issuance of common stock under employee compensation plans |
— | — | 1,866 | 2 | 51,553 | — | — | — | — | 51,555 | — | 51,555 | ||||||||||||||||||||||||||||||||||||
| Preferred stock dividends |
— | — | — | — | (21,293 | ) | — | — | — | — | (21,293 | ) | — | (21,293 | ) | |||||||||||||||||||||||||||||||||
| Stock-based compensation expense |
— | — | — | — | 12,452 | — | — | — | — | 12,452 | — | 12,452 | ||||||||||||||||||||||||||||||||||||
| Excess tax benefits on exercised stock options |
— | — | — | — | (6,208 | ) | — | — | — | — | (6,208 | ) | — | (6,208 | ) | |||||||||||||||||||||||||||||||||
| Minimum pension liability adjustment, net of tax |
— | — | — | — | — | — | — | — | 4 | 4 | — | 4 | ||||||||||||||||||||||||||||||||||||
| Changes in cumulative translation adjustment, net of tax |
— | — | — | — | — | — | — | — | (166,448 | ) | (166,448 | ) | — | (166,448 | ) | |||||||||||||||||||||||||||||||||
| Unrealized gain on hedging instruments and marketable securities, net of tax |
— | — | — | — | — | — | — | — | 21 | 21 | — | 21 | ||||||||||||||||||||||||||||||||||||
| Non-controlling interest share purchase |
— | — | — | — | — | — | — | — | — | — | (766 | ) | (766 | ) | ||||||||||||||||||||||||||||||||||
| Net income (loss) |
— | — | — | — | — | (33,466 | ) | — | — | — | (33,466 | ) | 30 | (33,436 | ) | |||||||||||||||||||||||||||||||||
|
|
|
|
|
|
|
|
|
|
|
|
|
|
|
|
|
|
|
|
|
|
|
|
|
|||||||||||||||||||||||||
| BALANCE, DECEMBER 31, 2014 |
1,774 | $ | 606,468 | 91,532 | $ | 92 | $ | 3,355,672 | $ | (1,672,757 | ) | 7,679 | $ | (184,971 | ) | $ | (192,110 | ) | $ | 1,912,394 | $ | 4,146 | $ | 1,916,540 | ||||||||||||||||||||||||
|
|
|
|
|
|
|
|
|
|
|
|
|
|
|
|
|
|
|
|
|
|
|
|
|
|||||||||||||||||||||||||
F-8
Table of Contents
ALERE INC. AND SUBSIDIARIES
CONSOLIDATED STATEMENTS OF EQUITY (Continued)
(in thousands)
| Preferred Stock |
Common Stock |
Additional Paid-in Capital |
Accumulated Deficit |
Treasury Stock, at Cost |
Accumulated Other Compre- hensive Income (Loss) |
Total Stockholders’ Equity |
Non- controlling Interest |
Total Equity |
||||||||||||||||||||||||||||||||||||||||
| Number of Shares |
$0.001 Par Value |
|||||||||||||||||||||||||||||||||||||||||||||||
| Number of Shares |
Amount | Number of Shares |
Value | |||||||||||||||||||||||||||||||||||||||||||||
| BALANCE, DECEMBER 31, 2014 |
1,774 | $ | 606,468 | 91,532 | $ | 92 | $ | 3,355,672 | $ | (1,672,757 | ) | 7,679 | $ | (184,971 | ) | $ | (192,110 | ) | $ | 1,912,394 | $ | 4,146 | $ | 1,916,540 | ||||||||||||||||||||||||
| Issuance of common stock under employee compensation plans |
— | — | 2,600 | 2 | 79,183 | — | — | — | — | 79,185 | — | 79,185 | ||||||||||||||||||||||||||||||||||||
| Net issuance of common stock to settle taxes on restricted stock units |
— | — | (89 | ) | — | (4,168 | ) | — | — | — | — | (4,168 | ) | — | (4,168 | ) | ||||||||||||||||||||||||||||||||
| Preferred stock dividends |
— | — | — | — | (21,293 | ) | — | — | — | — | (21,293 | ) | — | (21,293 | ) | |||||||||||||||||||||||||||||||||
| Stock-based compensation expense |
— | — | — | — | 26,391 | — | — | — | — | 26,391 | — | 26,391 | ||||||||||||||||||||||||||||||||||||
| Excess tax benefits on exercised stock options |
— | — | — | — | 2,947 | — | — | — | — | 2,947 | — | 2,947 | ||||||||||||||||||||||||||||||||||||
| Minimum pension liability adjustment, net of tax |
— | — | — | — | — | — | — | — | (1,229 | ) | (1,229 | ) | — | (1,229 | ) | |||||||||||||||||||||||||||||||||
| Changes in cumulative translation adjustment, net of tax |
— | — | — | — | — | — | — | — | (146,438 | ) | (146,438 | ) | — | (146,438 | ) | |||||||||||||||||||||||||||||||||
| Non-controlling interest capital contribution |
— | — | — | — | — | — | — | — | — | — | 50 | 50 | ||||||||||||||||||||||||||||||||||||
| Non-controlling interest dividend |
— | — | — | — | — | — | — | — | — | — | (313 | ) | (313 | ) | ||||||||||||||||||||||||||||||||||
| Net income |
— | — | — | — | — | 206,376 | — | — | — | 206,376 | 381 | 206,757 | ||||||||||||||||||||||||||||||||||||
|
|
|
|
|
|
|
|
|
|
|
|
|
|
|
|
|
|
|
|
|
|
|
|
|
|||||||||||||||||||||||||
| BALANCE, DECEMBER 31, 2015 |
1,774 | $ | 606,468 | 94,043 | $ | 94 | $ | 3,438,732 | $ | (1,466,381) | 7,679 | $ | (184,971 | ) | $ | (339,777 | ) | $ | 2,054,165 | $ | 4,264 | $ | 2,058,429 | |||||||||||||||||||||||||
|
|
|
|
|
|
|
|
|
|
|
|
|
|
|
|
|
|
|
|
|
|
|
|
|
|||||||||||||||||||||||||
The accompanying notes are an integral part of these consolidated financial statements.
F-9
Table of Contents
CONSOLIDATED STATEMENTS OF CASH FLOWS
(in thousands)
| For The Year Ended December 31, | ||||||||||||
| 2015 | 2014 | 2013 | ||||||||||
| Cash Flows from Operating Activities: |
||||||||||||
| Net income (loss) |
$ | 206,757 | $ | (33,436 | ) | $ | (73,982 | ) | ||||
| Income (loss) from discontinued operations, net of tax |
219,513 | 138,318 | (16,126 | ) | ||||||||
|
|
|
|
|
|
|
|||||||
| Income (loss) from continuing operations |
(12,756 | ) | (171,754 | ) | (57,856 | ) | ||||||
| Adjustments to reconcile net income (loss) from continuing operations to net cash provided by operating activities: |
||||||||||||
| Non-cash interest expense, including amortization of original issue discounts and deferred financing costs |
12,831 | 16,233 | 17,839 | |||||||||
| Depreciation and amortization |
309,264 | 336,029 | 374,657 | |||||||||
| Non-cash charges for sale of inventories revalued at the date of acquisition |
— | — | 2,504 | |||||||||
| Non-cash stock-based compensation expense |
26,391 | 12,452 | 21,210 | |||||||||
| Tax benefit related to discontinued operations retained by Alere Inc. |
— | 9,845 | 7,882 | |||||||||
| Impairment of inventory |
15,597 | 3,124 | 337 | |||||||||
| Impairment of intangible and long-lived assets |
3,708 | 7,019 | 6,504 | |||||||||
| Loss on sale of fixed assets |
3,925 | 6,545 | 1,471 | |||||||||
| Equity earnings of unconsolidated entities, net of tax |
(15,530 | ) | (17,509 | ) | (17,443 | ) | ||||||
| Deferred income taxes |
(99,389 | ) | 12,254 | (122,495 | ) | |||||||
| Loss on extinguishment of debt |
19,886 | — | 35,603 | |||||||||
| Loss related to impairment and net loss on disposition |
50,540 | 7,742 | 5,124 | |||||||||
| Bargain purchase gain |
— | — | (8,023 | ) | ||||||||
| Other non-cash items |
28,782 | 4,965 | 10,450 | |||||||||
| Non-cash change in fair value of contingent purchase price consideration |
(59,871 | ) | 7,677 | 19,250 | ||||||||
| Changes in assets and liabilities, net of acquisitions: |
||||||||||||
| Accounts receivable, net |
(14,380 | ) | (3,262 | ) | (41,309 | ) | ||||||
| Inventories, net |
(60,478 | ) | (68,033 | ) | (85,680 | ) | ||||||
| Prepaid expenses and other current assets |
(43,014 | ) | (51,998 | ) | (11,310 | ) | ||||||
| Accounts payable |
(10,783 | ) | 47,851 | 17,750 | ||||||||
| Accrued expenses and other current liabilities |
24,194 | 37,698 | 22,737 | |||||||||
| Other non-current liabilities |
34,362 | 13,254 | (12,874 | ) | ||||||||
| Cash paid for contingent consideration |
(6,315 | ) | (22,077 | ) | (11,660 | ) | ||||||
|
|
|
|
|
|
|
|||||||
| Net cash provided by continuing operations |
206,964 | 188,055 | 174,668 | |||||||||
| Net cash provided by discontinued operations |
318 | 43,468 | 69,232 | |||||||||
|
|
|
|
|
|
|
|||||||
| Net cash provided by operating activities |
207,282 | 231,523 | 243,900 | |||||||||
|
|
|
|
|
|
|
|||||||
| Cash Flows from Investing Activities: |
||||||||||||
| Increase in restricted cash |
(13,715 | ) | (5,446 | ) | (31,164 | ) | ||||||
| Purchases of property, plant and equipment |
(90,778 | ) | (100,562 | ) | (99,908 | ) | ||||||
| Proceeds from sale of property, plant and equipment |
2,099 | 1,486 | 3,618 | |||||||||
| Cash received from business dispositions, net of cash divested |
675,823 | 45,076 | 29,000 | |||||||||
| Cash paid for business acquisitions, net of cash acquired |
(60,135 | ) | (75 | ) | (176,131 | ) | ||||||
| Cash received from investments |
— | 198 | — | |||||||||
| Proceeds from sale of equity investment |
— | 8,546 | — | |||||||||
| Cash received from sales of marketable securities |
92 | 580 | 41 | |||||||||
| Cash received from equity method investments |
26,136 | 980 | 29,338 | |||||||||
| (Increase) decrease in other assets |
(1,794 | ) | 986 | 14,723 | ||||||||
|
|
|
|
|
|
|
|||||||
| Net cash provided by (used in) continuing operations |
537,728 | (48,231 | ) | (230,483 | ) | |||||||
| Net cash used in discontinued operations |
(209 | ) | (8,972 | ) | (26,963 | ) | ||||||
|
|
|
|
|
|
|
|||||||
| Net cash provided by (used in) investing activities |
537,519 | (57,203 | ) | (257,446 | ) | |||||||
|
|
|
|
|
|
|
|||||||
| Cash Flows from Financing Activities: |
||||||||||||
| Cash paid for financing costs |
(16,188 | ) | (1,528 | ) | (9,845 | ) | ||||||
| Cash paid for contingent purchase price consideration |
(14,223 | ) | (32,902 | ) | (40,079 | ) | ||||||
| Cash paid for dividends |
(21,293 | ) | (21,293 | ) | (21,293 | ) | ||||||
| Proceeds from issuance of common stock, net of issuance costs |
79,185 | 51,555 | 20,863 | |||||||||
| Proceeds from issuance of short-term debt |
1,511 | 806 | — | |||||||||
| Proceeds from issuance of long-term debt |
2,162,162 | 58 | 458,962 | |||||||||
| Payments on short-term debt |
(25,584 | ) | — | — | ||||||||
| Payments on long-term debt |
(2,656,386 | ) | (65,122 | ) | (470,557 | ) | ||||||
| Net (payments) proceeds under revolving credit facilities |
(127,536 | ) | (42,522 | ) | 138,963 | |||||||
| Excess tax benefits on exercised stock options |
— | 972 | 461 | |||||||||
| Principal payments on capital lease obligations |
(5,618 | ) | (6,085 | ) | (6,533 | ) | ||||||
| Purchase of non-controlling interest |
— | (623 | ) | (165 | ) | |||||||
| Other |
(8,937 | ) | — | (18,953 | ) | |||||||
|
|
|
|
|
|
|
|||||||
| Net cash provided by (used in) continuing operations |
(632,907 | ) | (116,684 | ) | 51,824 | |||||||
| Net cash used in discontinued operations |
(76 | ) | (1,471 | ) | (2,833 | ) | ||||||
|
|
|
|
|
|
|
|||||||
| Net cash provided by (used in) financing activities |
(632,983 | ) | (118,155 | ) | 48,991 | |||||||
|
|
|
|
|
|
|
|||||||
| Foreign exchange effect on cash and cash equivalents |
(11,379 | ) | (16,312 | ) | (1,871 | ) | ||||||
|
|
|
|
|
|
|
|||||||
| Net increase in cash and cash equivalents |
100,439 | 39,853 | 33,574 | |||||||||
| Cash and cash equivalents, beginning of period – continuing operations |
378,461 | 355,431 | 316,479 | |||||||||
| Cash and cash equivalents, beginning of period – discontinued operations |
23,300 | 6,477 | 11,855 | |||||||||
|
|
|
|
|
|
|
|||||||
| Cash and cash equivalents, end of period |
502,200 | 401,761 | 361,908 | |||||||||
| Less: Cash and cash equivalents of discontinued operations, end of period |
— | 23,300 | 6,477 | |||||||||
|
|
|
|
|
|
|
|||||||
| Cash and cash equivalents of continuing operations, end of period |
$ | 502,200 | $ | 378,461 | $ | 355,431 | ||||||
|
|
|
|
|
|
|
|||||||
The accompanying notes are an integral part of these consolidated financial statements.
F-10
Table of Contents
ALERE INC. AND SUBSIDIARIES
NOTES TO CONSOLIDATED FINANCIAL STATEMENTS
(1) Description of Business and Basis of Presentation of Financial Information
Alere Inc. delivers reliable and actionable health information through rapid diagnostic tests, resulting in better clinical and economic healthcare outcomes globally. Our high-performance diagnostics for infectious disease, cardiometabolic disease and toxicology are designed to meet the growing global demand for accurate, easy-to-use and cost-effective near-patient tests.
Our business is organized into three operating segments: (i) professional diagnostics, (ii) consumer diagnostics and (iii) corporate and other. The professional diagnostics segment includes an array of innovative rapid diagnostic test products and other in vitro diagnostic tests marketed to medical professionals and laboratories for the detection of diseases and conditions within our areas of focus identified above. The consumer diagnostics segment consists primarily of manufacturing operations related to our role as the exclusive manufacturer of products for SPD Swiss Precision Diagnostics, or SPD, our 50/50 joint venture with The Procter & Gamble Company, or P&G. SPD has significant operations in the worldwide over-the-counter pregnancy and fertility/ovulation test market. As a result of the sale in January 2015 of our health management business, which was the largest component of our former patient self-testing reporting segment, we no longer report separate financial information for that segment, which now forms part of our professional diagnostics segment. Financial information by segment for 2014 has been retroactively adjusted to reflect this change in reporting segments.
The consolidated financial statements include the accounts of Alere Inc. and its subsidiaries. Intercompany transactions and balances are eliminated and net earnings are reduced by the portion of the net earnings of subsidiaries applicable to non-controlling interests. Equity investments in which we exercise significant influence but do not control and are not the primary beneficiary are accounted for using the equity method. Investments in which we are not able to exercise significant influence over the investee and which do not have readily determinable fair values are accounted for under the cost method.
Certain reclassifications of prior period amounts have been made in order to retrospectively present discontinued operations and non-cash changes in fair value of contingent purchase price consideration. These reclassifications have no effect on net income or equity.
Certain amounts presented may not recalculate directly, due to rounding.
(2) Revision of Previously Reported Consolidated Financial Statements
In connection with the preparation of our consolidated financial statements for the fiscal year ended December 31, 2015, we determined that, in fiscal years 2013 and 2014, each of the interim periods of 2014 and the first three quarters of fiscal year 2015, we had incorrectly reported the timing of recognition of certain revenue transactions for such periods. As a result, we are revising our consolidated financial statements as of December 31, 2014 and for the fiscal years ended December 31, 2014 and 2013 and each of the interim periods of 2014 and the first three quarters of fiscal year 2015.
Specifically, the errors in the application of generally accepted accounting principles in the U.S., or U.S. GAAP, rules regarding the timing of revenue recognition primarily relate to: (i) transactions, principally in Africa, in which we recognized revenue when the product shipped to the distributor, but we contractually retained title in the products until the distributor paid for the products in full or the distributor was not obligated to pay us until the products were sold through to the end-user; (ii) “bill and
F-11
Table of Contents
ALERE INC. AND SUBSIDIARIES
NOTES TO CONSOLIDATED FINANCIAL STATEMENTS (Continued)
(2) Revision of Previously Reported Consolidated Financial Statements (Continued)
hold” transactions, principally in China, which did not meet the criteria for revenue recognition under U.S. GAAP; and (iii) other transactions, in which we recognized revenue prior to full satisfaction of all contractual criteria for title and risk of loss passing to the customer.
The errors did not impact the total amount of revenue recorded related to any transaction, other than in connection with establishing a returns allowance for our Indian subsidiary that is not material in amount. However, these misstatements would require adjustments to the period in which certain revenues were recognized so that such revenues are recognized in the period in which: physical delivery occurred as defined by the contractual relationship; title and risk of loss had transferred to the buyer; or the buyer had the contractual obligation to pay the amounts invoiced, as required by U.S. GAAP revenue recognition rules and our accounting policy relating to revenue recognition.
We evaluated the cumulative impact of these items on our previously-issued annual financial statements for 2013 and 2014, the interim financial statements for 2014 and 2015 under the guidance in Accounting Standards Codification 250 Accounting Changes and Error Corrections (ASC 250) relating to SEC Staff Accounting Bulletin (SAB) No. 99, Materiality, and concluded that the revisions were not material, individually or in the aggregate, to any of our previously-issued interim or annual financial statements.
We also evaluated the impact of revising these items through an adjustment to our financial statements for the year ended December 31, 2015 and concluded, based on the guidance within ASC 250 relating to SAB No. 108, Considering the Effects of Prior Year Misstatements when Quantifying Misstatements in Current Year Financial Statements, that it was appropriate to revise our previously-issued financial statements to reflect the impact of these revisions because the cumulative effect of reflecting these revisions in the current year would have been material to the financial statements for the year ended December 31, 2015.
Additionally, we have reflected several out-of-period adjustments in the periods in which such adjustments originated. These adjustments were identified during the financial closing process in 2015. The adjustments identified in the periods ended June 30 and September 30, 2015 were previously recorded in the financial statements in the periods identified and we had previously concluded that the correction of these errors was not material, individually or in the aggregate, to our previously issued financial statements. The financial statements included in this Annual Report on Form 10-K have been adjusted to include the adjustments in the period in which they originated. Because these out-of-period adjustments are treated as corrections to our prior period financial results, the revised financial information included in this Annual Report on Form 10-K has been identified as such. These adjustments were related to (i) a correction to a specific bonus accrual recorded in sales and marketing and general and administrative expenses; (ii) errors in the measurement of a royalty obligation recorded in other income (expense), net; and (iii) $6.7 million and $1 million net tax benefit for the years ended December 31, 2014 and 2013, respectively, that is primarily related to $9.7 million of tax benefit associated with an adjustment to U.S. foreign earnings offset by a $1.5 million tax expense associated with an adjustment to the section 199 deduction.
The revisions had the impact of increasing accumulated deficit on the consolidated statement of stockholders’ equity as of December 31, 2012 by $4.8 million. The revisions to the consolidated statements of cash flows did not impact previously reported net cash flows from operating activities, investing activities, or financing activities and as a result, there was no net impact to net change in cash and cash equivalents for any previously reported periods.
F-12
Table of Contents
ALERE INC. AND SUBSIDIARIES
NOTES TO CONSOLIDATED FINANCIAL STATEMENTS (Continued)
(2) Revision of Previously Reported Consolidated Financial Statements (Continued)
As a result of the foregoing review, in our future quarterly reports, there will also be revisions to the comparative interim quarterly financial statements within the fiscal year ended December 31, 2015. We have concluded that none of the revisions to our consolidated financial statements for the interim periods in 2014 and 2015 was material, individually or in the aggregate, to any of our previously issued financial statements for such individual interim periods.
The following schedules reconcile the amounts as previously reported in the applicable financial statement to the corresponding revised amounts:
| Year Ended December 31, 2014 | ||||||||||||
| Revised Consolidated Statement of Operations (in thousands) |
As Previously Reported |
Revision Adjustment |
As Revised | |||||||||
| Net product sales |
$ | 2,035,666 | $ | (13,426 | ) | $ | 2,022,240 | |||||
| Net product sales and services revenue |
$ | 2,567,654 | $ | (13,426 | ) | $ | 2,554,228 | |||||
| Net revenue |
$ | 2,588,704 | $ | (13,426 | ) | $ | 2,575,278 | |||||
| Cost of net product sales |
$ | 1,069,422 | $ | (6,923 | ) | $ | 1,062,499 | |||||
| Cost of services revenue |
$ | 294,753 | $ | 196 | $ | 294,949 | ||||||
| Cost of net product sales and services revenue |
$ | 1,364,175 | $ | (6,727 | ) | $ | 1,357,448 | |||||
| Cost of net revenue |
$ | 1,369,767 | $ | (6,727 | ) | $ | 1,363,040 | |||||
| Gross profit |
$ | 1,218,937 | $ | (6,699 | ) | $ | 1,212,238 | |||||
| Sales and marketing |
$ | 513,801 | $ | (840 | ) | $ | 512,961 | |||||
| General and administrative |
$ | 453,988 | $ | (360 | ) | $ | 453,628 | |||||
| Operating income (loss) |
$ | 98,578 | $ | (5,499 | ) | $ | 93,079 | |||||
| Other income (expense), net |
$ | (731 | ) | $ | (1,490 | ) | $ | (2,221 | ) | |||
| Loss from continuing operations before benefit for income taxes |
$ | (111,344 | ) | $ | (6,989 | ) | $ | (118,333 | ) | |||
| Benefit (provision) for income taxes |
$ | 82,193 | $ | (11,263 | ) | $ | 70,930 | |||||
| Loss from continuing operations before equity earnings of unconsolidated entities, net of tax |
$ | (193,537 | ) | $ | 4,274 | $ | (189,263 | ) | ||||
| Loss from continuing operations |
$ | (176,028 | ) | $ | 4,274 | $ | (171,754 | ) | ||||
| Net loss |
$ | (37,710 | ) | $ | 4,274 | $ | (33,436 | ) | ||||
| Net loss attributable to Alere Inc. and Subsidiaries |
$ | (37,740 | ) | $ | 4,274 | $ | (33,466 | ) | ||||
| Net loss available to common stockholders |
$ | (59,033 | ) | $ | 4,274 | $ | (54,759 | ) | ||||
| Basic and diluted net loss per common share: Loss from continuing operations |
$ | (2.38 | ) | $ | 0.05 | $ | (2.33 | ) | ||||
| Basic and diluted net loss per common share: Net loss per common share |
$ | (0.71 | ) | $ | 0.05 | $ | (0.66 | ) | ||||
F-13
Table of Contents
ALERE INC. AND SUBSIDIARIES
NOTES TO CONSOLIDATED FINANCIAL STATEMENTS (Continued)
(2) Revision of Previously Reported Consolidated Financial Statements (Continued)
| Year Ended December 31, 2013 | ||||||||||||
| Revised Consolidated Statement of Operations (in thousands) |
As Previously Reported |
Revision Adjustment |
As Revised | |||||||||
| Net product sales |
$ | 2,056,519 | $ | (7,730 | ) | $ | 2,048,789 | |||||
| Services revenue |
$ | 532,616 | $ | 2 | $ | 532,618 | ||||||
| Net product sales and services revenue |
$ | 2,589,135 | $ | (7,728 | ) | $ | 2,581,407 | |||||
| Net revenue |
$ | 2,616,364 | $ | (7,728 | ) | $ | 2,608,636 | |||||
| Cost of net product sales |
$ | 1,017,501 | $ | (2,970 | ) | $ | 1,014,531 | |||||
| Cost of service revenue |
$ | 274,045 | $ | 184 | $ | 274,229 | ||||||
| Cost of net product sales and services revenue |
$ | 1,291,546 | $ | (2,786 | ) | $ | 1,288,760 | |||||
| Cost of net revenue |
$ | 1,299,309 | $ | (2,786 | ) | $ | 1,296,523 | |||||
| Gross profit |
$ | 1,317,055 | $ | (4,942 | ) | $ | 1,312,113 | |||||
| Operating income |
$ | 151,542 | $ | (4,942 | ) | $ | 146,600 | |||||
| Loss from continuing operations before benefit for income taxes |
$ | (115,064 | ) | $ | (4,942 | ) | $ | (120,006 | ) | |||
| Benefit for income taxes |
$ | (42,014 | ) | $ | (2,693 | ) | $ | (44,707 | ) | |||
| Loss from continuing operations before equity earnings of unconsolidated entities, net of tax |
$ | (73,050 | ) | $ | (2,249 | ) | $ | (75,299 | ) | |||
| Loss from continuing operations |
$ | (55,607 | ) | $ | (2,249 | ) | $ | (57,856 | ) | |||
| Net loss |
$ | (71,733 | ) | $ | (2,249 | ) | $ | (73,982 | ) | |||
| Net loss attributable to Alere Inc. and Subsidiaries |
$ | (72,709 | ) | $ | (2,249 | ) | $ | (74,958 | ) | |||
| Net loss available to common stockholders |
$ | (94,002 | ) | $ | (2,249 | ) | $ | (96,251 | ) | |||
| Basic and diluted loss per common share: Loss from continuing operations |
$ | (0.95 | ) | $ | (0.03 | ) | $ | (0.98 | ) | |||
| Basic and diluted loss per common share: Net loss per common share |
$ | (1.15 | ) | $ | (0.03 | ) | $ | (1.18 | ) | |||
| Year Ended December 31, 2014 | ||||||||||||
| Revised Consolidated Statement of Comprehensive Loss (in thousands) |
As Previously Reported |
Revision Adjustment |
As Revised | |||||||||
| Net loss |
$ | (37,710 | ) | $ | 4,274 | $ | (33,436 | ) | ||||
| Comprehensive loss |
$ | (204,133 | ) | $ | 4,274 | $ | (199,859 | ) | ||||
| Comprehensive loss attributable to Alere Inc. and Subsidiaries |
$ | (204,163 | ) | $ | 4,274 | $ | (199,889 | ) | ||||
| Year Ended December 31, 2013 | ||||||||||||
| Revised Consolidated Statement of Comprehensive Loss (in thousands) |
As Previously Reported |
Revision Adjustment |
As Revised | |||||||||
| Net loss |
$ | (71,733 | ) | $ | (2,249 | ) | $ | (73,982 | ) | |||
| Comprehensive loss |
$ | (122,169 | ) | $ | (2,249 | ) | $ | (124,418 | ) | |||
| Comprehensive loss attributable to Alere Inc. and Subsidiaries |
$ | (123,145 | ) | $ | (2,249 | ) | $ | (125,394 | ) | |||
F-14
Table of Contents
ALERE INC. AND SUBSIDIARIES
NOTES TO CONSOLIDATED FINANCIAL STATEMENTS (Continued)
(2) Revision of Previously Reported Consolidated Financial Statements (Continued)
| As of December 31, 2014 | ||||||||||||
| Revised Consolidated Balance Sheet (in thousands) |
As Previously Reported |
Revision Adjustment |
As Revised | |||||||||
| Accounts receivable, net of allowances |
$ | 466,106 | $ | (5,010 | ) | $ | 461,096 | |||||
| Inventories, net |
$ | 365,165 | $ | 12,184 | $ | 377,349 | ||||||
| Deferred tax assets — current |
$ | 112,573 | $ | 15,347 | $ | 127,920 | ||||||
| Total current assets |
$ | 1,808,063 | $ | 22,521 | $ | 1,830,584 | ||||||
| Property, plant and equipment |
$ | 453,570 | $ | 653 | $ | 454,223 | ||||||
| Deferred tax assets |
$ | 8,569 | $ | (2,251 | ) | $ | 6,318 | |||||
| Total assets |
$ | 6,678,956 | $ | 20,923 | $ | 6,699,879 | ||||||
| Accrued expenses and other current liabilities |
$ | 375,494 | $ | 10,433 | $ | 385,927 | ||||||
| Total current liabilities |
$ | 761,045 | $ | 10,433 | $ | 771,478 | ||||||
| Capital lease obligations, net of current portion |
$ | 10,560 | $ | 1,033 | $ | 11,593 | ||||||
| Deferred tax liabilities |
$ | 214,639 | $ | 17,324 | $ | 231,963 | ||||||
| Other long-term liabilities |
$ | 161,582 | $ | (14,662 | ) | $ | 146,920 | |||||
| Total long-term liabilities |
$ | 4,008,166 | $ | 3,695 | $ | 4,011,861 | ||||||
| Accumulated deficit |
$ | (1,679,552 | ) | $ | 6,795 | $ | (1,672,757 | ) | ||||
| Total stockholders’ equity |
$ | 1,905,599 | $ | 6,795 | $ | 1,912,394 | ||||||
| Total equity |
$ | 1,909,745 | $ | 6,795 | $ | 1,916,540 | ||||||
| Total liabilities and equity |
$ | 6,678,956 | $ | 20,923 | $ | 6,699,879 | ||||||
| Revised Consolidated Statement of Equity (in thousands) |
As Previously Reported |
Revision Adjustment |
As Revised | |||||||||
| Accumulated deficit, Balance at December 31, 2012 |
$ | (1,569,103 | ) | $ | 4,770 | $ | (1,564,333 | ) | ||||
| Net loss |
$ | (72,709 | ) | $ | (2,249 | ) | $ | (74,958 | ) | |||
| Accumulated deficit, Balance at December 31, 2013 |
$ | (1,641,812 | ) | $ | 2,521 | $ | (1,639,291 | ) | ||||
| Total stockholders’ equity, Balance at December 31, 2012 |
$ | 2,177,167 | $ | 4,770 | $ | 2,181,937 | ||||||
| Net loss |
$ | (72,709 | ) | $ | (2,249 | ) | $ | (74,958 | ) | |||
| Total stockholders’ equity, Balance at December 31, 2013 |
$ | 2,073,256 | $ | 2,521 | $ | 2,075,777 | ||||||
| Total equity, Balance at December 31, 2012 |
$ | 2,179,449 | $ | 4,770 | $ | 2,184,219 | ||||||
| Net loss |
$ | (71,733 | ) | $ | (2,249 | ) | $ | (73,982 | ) | |||
| Total equity, Balance at December 31, 2013 |
$ | 2,078,138 | $ | 2,521 | $ | 2,080,659 | ||||||
F-15
Table of Contents
ALERE INC. AND SUBSIDIARIES
NOTES TO CONSOLIDATED FINANCIAL STATEMENTS (Continued)
(2) Revision of Previously Reported Consolidated Financial Statements (Continued)
| Revised Consolidated Statement of Equity (in thousands) |
As Previously Reported |
Revision Adjustment |
As Revised | |||||||||
| Accumulated deficit, Balance at December 31, 2013 |
$ | (1,641,812 | ) | $ | 2,521 | $ | (1,639,291 | ) | ||||
| Net loss |
$ | (37,740 | ) | $ | 4,274 | $ | (33,466 | ) | ||||
| Accumulated deficit, Balance at December 31, 2014 |
$ | (1,679,552 | ) | $ | 6,795 | $ | (1,672,757 | ) | ||||
| Total stockholders’ equity, Balance at December 31, 2013 |
$ | 2,073,256 | $ | 2,521 | $ | 2,075,777 | ||||||
| Net loss |
$ | (37,740 | ) | $ | 4,274 | $ | (33,466 | ) | ||||
| Total stockholders’ equity, Balance at December 31, 2014 |
$ | 1,905,599 | $ | 6,795 | $ | 1,912,394 | ||||||
| Total equity, Balance at December 31, 2013 |
$ | 2,078,138 | $ | 2,521 | $ | 2,080,659 | ||||||
| Net loss |
$ | (37,710 | ) | $ | 4,274 | $ | (33,436 | ) | ||||
| Total equity, Balance at December 31, 2014 |
$ | 1,909,745 | $ | 6,795 | $ | 1,916,540 | ||||||
| Year Ended December 31, 2014 | ||||||||||||
| Revised Consolidated Statement of Cash Flows (in thousands) |
As Previously Reported |
Revision Adjustment |
As Revised | |||||||||
| Net loss |
$ | (37,710 | ) | $ | 4,274 | $ | (33,436 | ) | ||||
| Loss from continuing operations |
$ | (176,028 | ) | $ | 4,274 | $ | (171,754 | ) | ||||
| Depreciation and amortization |
$ | 335,833 | $ | 196 | $ | 336,029 | ||||||
| Deferred income taxes |
$ | (6,982 | ) | $ | 19,236 | $ | 12,254 | |||||
| Accounts receivable, net |
$ | (689 | ) | $ | (2,573 | ) | $ | (3,262 | ) | |||
| Inventories, net |
$ | (61,110 | ) | $ | (6,923 | ) | $ | (68,033 | ) | |||
| Accrued expenses and other current liabilities |
$ | 36,155 | $ | 1,543 | $ | 37,698 | ||||||
| Other non-current liabilities |
$ | 29,007 | $ | (15,753 | ) | $ | 13,254 | |||||
| Year Ended December 31, 2013 | ||||||||||||
| Revised Consolidated Statement of Cash Flows (in thousands) |
As Previously Reported |
Revision Adjustment |
As Revised | |||||||||
| Net loss |
$ | (71,733 | ) | $ | (2,249 | ) | $ | (73,982 | ) | |||
| Loss from continuing operations |
$ | (55,607 | ) | $ | (2,249 | ) | $ | (57,856 | ) | |||
| Depreciation and amortization |
$ | 374,473 | $ | 184 | $ | 374,657 | ||||||
| Deferred income taxes |
$ | (129,687 | ) | $ | 7,192 | $ | (122,495 | ) | ||||
| Accounts receivable, net |
$ | (46,672 | ) | $ | 5,363 | $ | (41,309 | ) | ||||
| Inventories, net |
$ | (82,710 | ) | $ | (2,970 | ) | $ | (85,680 | ) | |||
| Accrued expenses and other current liabilities |
$ | 12,027 | $ | 10,710 | $ | 22,737 | ||||||
| Other non-current liabilities |
$ | 5,356 | $ | (18,230 | ) | $ | (12,874 | ) | ||||
We have also reflected these corrections as applicable in our consolidated financial statements and the related notes thereto, and also in the consolidating financial statements presented in Note 27 Guarantor Financial Information.
F-16
Table of Contents
ALERE INC. AND SUBSIDIARIES
NOTES TO CONSOLIDATED FINANCIAL STATEMENTS (Continued)
(3) Discontinued Operations
On January 9, 2015, we completed the sale of our health management business to OptumHealth Care Solutions for a purchase price of $599.9 million. We used the net cash proceeds of the sale to repay $575.0 million in aggregate principal amount of outstanding indebtedness under our prior credit facility.
We accounted for our divestiture of the health management business in accordance with Accounting Standards Update, or ASU, No. 2014-08. The following assets and liabilities associated with the health management business have been segregated and classified as assets held for sale and liabilities related to assets held for sale, as appropriate, in the consolidated balance sheet as of December 31, 2014 (in thousands):
| December 31, 2014 | ||||
| Assets |
||||
| Cash and cash equivalents |
$ | 23,300 | ||
| Restricted cash |
361 | |||
| Accounts receivable, net of allowances of $5,882 at December 31, 2014 |
50,902 | |||
| Inventories, net |
1,656 | |||
| Deferred tax assets – current |
6,939 | |||
| Prepaid expenses and other current assets |
3,857 | |||
| Property, plant and equipment, net |
57,595 | |||
| Goodwill |
82,665 | |||
| Finite-lived intangible assets, net |
82,428 | |||
| Deferred tax assets – non-current |
3,347 | |||
| Other non-current assets |
2,465 | |||
|
|
|
|||
| Total assets held for sale |
$ | 315,515 | ||
|
|
|
|||
| Liabilities |
||||
| Current portion of capital lease obligations |
$ | 799 | ||
| Accounts payable |
5,654 | |||
| Accrued expenses and other current liabilities |
32,822 | |||
| Capital lease obligations, net of current portion |
365 | |||
| Deferred tax liabilities – non-current |
27,453 | |||
| Other long-term liabilities |
11,750 | |||
|
|
|
|||
| Total liabilities related to assets held for sale |
$ | 78,843 | ||
|
|
|
|||
On October 10, 2014, we completed the sale of our ACS subsidiary, or ACS, to ACS Acquisition, LLC (the “Purchaser”), pursuant to the terms of a Membership Interest Purchase Agreement with the Purchaser and Sumit Nagpal. In connection with the sale of ACS, we also agreed to sell our subsidiary Wellogic ME FZ – LLC (“Wellogic,” together with ACS, the “ACS Companies”) to the Purchaser, which we completed in June 2015. The ACS Companies were included in our former patient self-testing segment prior to the sale. The purchase price for the ACS Companies consisted of cash proceeds of $2.00 at closing and contingent consideration of up to an aggregate of $7.0 million, consisting of (i) payments based on the gross revenues of the ACS Companies, (ii) payments to be made in connection with financing transactions by the Purchaser or the ACS Companies and (iii) payments to be made in connection with a sale by the Purchaser of the ACS Companies. In connection with the sale, we agreed to reimburse the Purchaser for up to $750,000 of the Purchaser’s and the ACS Companies’ transitional expenses. We accounted for our divestiture of the ACS Companies in accordance with Accounting Standards Codification, or ASC, 205, Presentation of Financial Statements.
F-17
Table of Contents
ALERE INC. AND SUBSIDIARIES
NOTES TO CONSOLIDATED FINANCIAL STATEMENTS (Continued)
(3) Discontinued Operations (Continued)
The following summarized financial information related to the businesses of the ACS Companies and the health management business has been segregated from continuing operations and has been reported as discontinued operations in our consolidated statements of operations. The results of the health management business are included in all the periods presented, given our January 9, 2015 divestiture of this business. The results of the ACS Companies, other than Wellogic, are included in 2014 and 2013, given our October 31, 2014 divestiture of this business. The results are as follows (in thousands):
| For The Years Ended December 31, | ||||||||||||
| 2015 | 2014 | 2013 | ||||||||||
| Net revenue |
$ | 7,373 | $ | 359,496 | $ | 409,579 | ||||||
| Cost of net revenue |
(4,413 | ) | (203,115 | ) | (229,310 | ) | ||||||
| Research and development |
— | — | (1,750 | ) | ||||||||
| Sales and marketing |
(996 | ) | (56,808 | ) | (73,700 | ) | ||||||
| General and administrative |
(5,001 | ) | (99,383 | ) | (129,565 | ) | ||||||
| Interest expense |
(9 | ) | (506 | ) | (310 | ) | ||||||
| Other income (expense), net |
160 | (1,799 | ) | (1,860 | ) | |||||||
| Gain on disposal |
364,850 | — | — | |||||||||
|
|
|
|
|
|
|
|||||||
| Income (loss) from discontinued operations before provision (benefit) for income taxes |
361,964 | (2,115 | ) | (26,916 | ) | |||||||
| Provision (benefit) for income taxes |
142,451 | (140,433 | ) | (10,790 | ) | |||||||
|
|
|
|
|
|
|
|||||||
| Income (loss) from discontinued operations, net of tax |
$ | 219,513 | $ | 138,318 | $ | (16,126 | ) | |||||
|
|
|
|
|
|
|
|||||||
(4) Summary of Significant Accounting Policies
(a) Use of Estimates
To prepare our financial statements in conformity with accounting principles generally accepted in the United States of America, our management must make estimates, judgments and assumptions that may affect the reported amounts of assets and liabilities, disclosure of contingent assets and liabilities at the date of the financial statements and the reported amounts of revenue and expenses during the reporting period. Actual results could differ significantly from such estimates under different assumptions or conditions.
(b) Foreign Currencies
In general, the functional currencies of our foreign subsidiaries are the local currencies. For the purpose of consolidating the financial statements of our foreign subsidiaries, all assets and liabilities of the foreign subsidiaries are translated into U.S. dollars using the exchange rate at each balance sheet date, while the stockholders’ equity accounts are translated at historical exchange rates. Translation gains and losses that result from the conversion of the balance sheets of the foreign subsidiaries into U.S. dollars are recorded to cumulative translation adjustment, which is a component of accumulated other comprehensive income (loss) (Note 16) within stockholders’ equity. The revenue and expenses of our foreign subsidiaries are translated using the average of the rates of exchange in effect during each fiscal month.
Net realized and unrealized foreign currency exchange transaction losses of $4.8 million, $2.2 million and $4.0 million during 2015, 2014 and 2013, respectively, are included as a component of other income (expense), net in the consolidated statements of operations.
F-18
Table of Contents
ALERE INC. AND SUBSIDIARIES
NOTES TO CONSOLIDATED FINANCIAL STATEMENTS (Continued)
(4) Summary of Significant Accounting Policies (Continued)
(c) Cash and Cash Equivalents
We consider all highly-liquid investments purchased with original maturities of three months or less at the date of acquisition to be cash equivalents. Cash equivalents consisted of money market funds at December 31, 2015 and 2014.
(d) Restricted Cash
We had restricted cash of $48.9 million and $37.6 million as of December 31, 2015 and 2014, respectively. Of the $48.9 million restricted cash as of December 31, 2015, $43.2 million was classified as non-current on our consolidated balance sheet, as it secures a foreign bank loan arrangement that we entered into during the third quarter of 2015 and, under the terms of the loan agreement, is required to remain on deposit for two years unless the loan is terminated prior to maturity.
(e) Marketable Securities
Securities classified as available-for-sale or trading are carried at fair value, as determined by quoted market prices at the balance sheet date. Realized gains and losses on securities are included in other income (expense), net, on a specific identification basis. Unrealized holding gains and losses (except for other than temporary impairments) on securities classified as available-for-sale, are reported in accumulated other comprehensive income (loss), net of related tax effects.
(f) Inventories
Inventories are stated at the lower of cost (first-in, first-out) or market and are made up of raw material, work-in-process and finished goods. The cost elements of work-in-process and finished goods inventory consist of raw material, direct labor and manufacturing overhead. Where finished goods inventory is purchased from third-party manufacturers, the costs of finished goods inventory recorded in the financial statements represent the costs to acquire such inventory.
(g) Property, Plant and Equipment
We record property, plant and equipment at historical cost or, in the case of a business combination, at fair value on the date of the business combination. Depreciation is computed using the straight-line method based on the following estimated useful lives of the related assets: machinery, laboratory equipment and tooling, 1-15 years; buildings, 7- 61 years; leasehold improvements, lesser of the remaining term of the lease or estimated useful life of the asset; computer software and equipment, 1-10 years and furniture and fixtures, 2-16 years. Land is not depreciated. Depreciation expense related to property, plant and equipment amounted to $98.7 million, $97.6 million and $94.3 million in 2015, 2014 and 2013, respectively. Fully-depreciated property, plant and equipment that are still in use remain on the books until disposal or retirement. When property, plant and equipment are retired or disposed of, the cost and respective accumulated depreciation are removed from the books. Any gain or loss on disposal is recorded in the income statement. Expenditures for repairs and maintenance are expensed as incurred.
(h) Goodwill and Other Intangible Assets with Indefinite Lives
Goodwill relates to amounts that arose in connection with our various business combinations and represents the difference between the purchase price and the fair value of the identifiable tangible and intangible net assets when accounted for using the acquisition method of accounting. Goodwill is not amortized, but is subject to periodic review for impairment.
F-19
Table of Contents
ALERE INC. AND SUBSIDIARIES
NOTES TO CONSOLIDATED FINANCIAL STATEMENTS (Continued)
(4) Summary of Significant Accounting Policies (Continued)
We test goodwill and other intangible assets with indefinite lives at the reporting unit level for impairment on an annual basis and between annual tests, if events and circumstances indicate it is more likely than not that the fair value of a reporting unit is less than its carrying value. Events that would indicate impairment and trigger an interim impairment assessment include, but are not limited to, current economic and market conditions, including a decline in market capitalization, a significant adverse change in legal factors, business climate or operational performance of the business and an adverse action or assessment by a regulator.
In performing the annual goodwill impairment test, we utilize the two-step approach. The first step, or Step 1, requires a comparison of the carrying value of each reporting unit to its estimated fair value. To estimate the fair value of our reporting units for Step 1, we use a combination of the income approach, the market comparable approach and the market transaction approach. The income approach is based on a discounted cash flow analysis, or DCF approach, and calculates the fair value by estimating the after-tax cash flows attributable to a reporting unit and then discounting the after-tax cash flows to a present value, using a risk-adjusted discount rate. Assumptions used in the DCF approach require the exercise of significant judgment, including judgment about appropriate discount rates and terminal values, growth rates and the amount and timing of expected future cash flows. The forecasted cash flows are based on our most recent budget and for years beyond the budget, our estimates are based on assumed growth rates. We believe our assumptions are consistent with the plans and estimates used to manage the underlying businesses. The discount rates, which are intended to reflect the risks inherent in future cash flow projections, used in the DCF approach are based on estimates of the weighted-average cost of capital, or WACC, of market participants relative to each respective reporting unit. The market approaches consider comparable and transactional market data based on multiples of revenue or earnings before interest, taxes, depreciation and amortization, or EBITDA, based on trading multiples of selected guidelines companies and deal multiples of selected target companies.
If the carrying value of a reporting unit exceeds its estimated fair value, we are required to perform the second step, or Step 2, of the annual goodwill impairment test to measure the amount of impairment loss, if any. Step 2 of the goodwill impairment test compares the implied fair value of a reporting unit’s goodwill to its carrying value. The implied fair value of goodwill is calculated as the difference between the fair value of the reporting unit and the estimated fair value of its assets and liabilities. To the extent this amount is below the carrying value of goodwill, an impairment charge is recorded to write down the carrying value to its implied value.
Impairment charges related to goodwill have no impact on our cash balances or on compliance with financial covenants under our Amended and Restated Credit Agreement.
As a result of the sale of our health management business in January 2015, which was the largest component of our former patient self-testing reporting segment, we ceased to report our financial information in four operating segments. Beginning in 2015, our reporting units are professional diagnostics and consumer diagnostics.
2015 Annual Goodwill Impairment Test
We conducted our 2015 annual impairment test for our reporting units during the fourth quarter of 2015. Key assumptions (which vary by reporting unit) used in determining fair value under the DCF approach included discount rates ranging from 9.0% to 14.0%, projected compound average revenue growth rates of 3.4% to 5.6%, and terminal value growth rates of 3.0% to 4.0%. In determining the
F-20
Table of Contents
ALERE INC. AND SUBSIDIARIES
NOTES TO CONSOLIDATED FINANCIAL STATEMENTS (Continued)
(4) Summary of Significant Accounting Policies (Continued)
appropriate discount rate, we considered the WACC for each reporting unit, which among other factors considers the cost of common equity capital and the marginal cost of debt of market participants. Key assumptions (which again vary by reporting unit) used in determining fair value under the market approaches were based on observed market multiples of enterprise value to revenue and EBITDA for both comparable publicly-traded companies and recent merger and acquisition transactions involving similar companies to estimate appropriate controlling basis multiples to apply to each of the reporting units. Based on the multiples implied by this market data, we selected multiples of revenue of 0.7 to 2.9 times and multiples of EBITDA of 7.3 to 11.8 times. In assessing the reasonableness of our estimated fair values of the reporting units, management compared the results of the valuation analyses against our then-current market capitalization to imply a control premium. Based on this analysis, the implied control premium was within the range of comparable industry transactions.
The Step 1 impairment test indicated the estimated fair value of the professional diagnostics and consumer diagnostics reporting units exceeded the carrying value of their reporting unit’s net assets as follows: by $3.1 billion and $44.9 million, respectively, or 58.1% and 18.2%, respectively.
The estimate of fair value requires significant judgment. We based our fair value estimates on assumptions that we believe to be reasonable but that are unpredictable and inherently uncertain, including estimates of future growth rates and operating margins and assumptions about the overall economic climate and the competitive environment for our business units. There can be no assurance that our estimates and assumptions made for purposes of our goodwill and identifiable intangible asset testing as of the time of testing will prove to be accurate predictions of the future. If our assumptions regarding business plans, competitive environments or anticipated growth rates are not correct, we may be required to record goodwill and/or intangible asset impairment charges in future periods, whether in connection with our next annual impairment testing or earlier, if an indicator of an impairment is present before our next annual evaluation.
2014 Annual Goodwill Impairment Test
We conducted our 2014 annual goodwill impairment test for our reporting units during the fourth quarter of 2014. For our patient self-testing reporting unit, we utilized the purchase price for the sale of our health management business as the estimated fair value of the health management business and combined that with the estimated fair value of the remaining patient self-testing reporting unit which was determined using a combination of the income approach, the market comparable approach and the market transaction approach to arrive at the total estimated fair value of the patient self-testing business. Key assumptions (which vary by reporting unit) used in determining fair value under the DCF approach included discount rates ranging from 10.5% to 15.5%, projected compound average revenue growth rates of 3.0% to 11.0% and terminal value growth rates of 3.0% to 4.0%. In determining the appropriate discount rate, we considered the WACC for each reporting unit, which among other factors considers the cost of common equity capital and the marginal cost of debt of market participants. Key assumptions (which again vary by reporting unit) used in determining fair value under the market approaches were based on observed market multiples of enterprise value to revenue and EBITDA for both comparable publicly-traded companies and recent merger and acquisition transactions involving similar companies to estimate appropriate controlling basis multiples to apply to each of the reporting units. Based on the multiples implied by this market data, we selected multiples of revenue of 1.2 to 2.9 times and multiples of EBITDA of 7.1 to 11.8 times. In assessing the reasonableness of our estimated fair values of the reporting units, management compared the results of the valuation analyses against our then-current market capitalization to imply a control premium. Based on this analysis, the implied control premium was within the range of comparable industry transactions.
F-21
Table of Contents
ALERE INC. AND SUBSIDIARIES
NOTES TO CONSOLIDATED FINANCIAL STATEMENTS (Continued)
(4) Summary of Significant Accounting Policies (Continued)
The Step 1 impairment test indicated the estimated fair value of the professional diagnostics, patient self-testing and consumer diagnostics reporting units exceeded the carrying value of their reporting unit’s net assets as follows: by $2.2 billion, $515.6 million and $86.8 million, respectively, or 42.4%, 162.1% and 38.0%, respectively.
As discussed in Note 3, our health management business met the criteria for assets held for sale as of December 31, 2014 and the sale was subsequently completed on January 9, 2015. Accordingly, we performed a Step 1 impairment test on the goodwill remaining in the patient self-testing reporting unit at December 31, 2014. The Step 1 impairment test indicated that the estimated fair value of the remaining patient self-testing reporting unit exceeded the carrying value of the reporting unit’s net assets by 67%.
2013 Annual Goodwill Impairment Test
We conducted our 2013 annual goodwill impairment test for our reporting units during the fourth quarter of 2013. Key assumptions (which vary by reporting unit) used in determining fair value under the DCF approach included discount rates ranging from 11.0% to 14.0%, projected compound average revenue growth rates of 4.0% to 11.4% and terminal value growth rates of 3.0% to 4.0%. The factors considered in determining the appropriate discount rate and the key assumptions were the same as those in the 2014 annual goodwill impairment test described above. Based on the multiples implied by this market data, we selected multiples of revenue of 0.8 to 2.9 times and multiples of EBITDA of 6.4 to 10.6 times. In assessing the reasonableness of our estimated fair values of the reporting units, management compared the results of the valuation analyses against our then-current market capitalization to imply a control premium. Based on this analysis, the implied control premium was within the range of comparable industry transactions.
The Step 1 impairment test indicated the estimated fair value of the professional diagnostics, patient self-testing and consumer diagnostics reporting units exceeded the carrying value of their reporting unit’s net assets as follows: by $1.6 billion, $34.7 million and $92.7 million, respectively, or 30.3%, 8.5% and 45.5%, respectively.
(i) Impairment of Other Long-lived Tangible and Intangible Assets
Our intangible assets consist primarily of core technology, in-process research and development, patents, trademarks, trade names, customer relationships, distribution rights and non-competition agreements. The majority of our intangible assets were recorded in connection with our various business combinations. Our intangible assets are recorded at fair value at the time of their acquisition. We amortize intangible assets over their estimated useful lives.
The estimated useful lives of the individual categories of intangible assets were based on the nature of the applicable intangible asset and the expected future cash flows to be derived from the intangible asset. Amortization of intangible assets with finite lives is recognized over the shorter of the respective lives of the agreement or the period of time the intangible assets are expected to contribute to future cash flows. We amortize our finite-lived intangible assets based on patterns on which the respective economic benefits are expected to be realized. We amortize the majority of our intangible assets on a straight-line basis, as this methodology most closely approximates the pattern of economic benefits for these assets.
F-22
Table of Contents
ALERE INC. AND SUBSIDIARIES
NOTES TO CONSOLIDATED FINANCIAL STATEMENTS (Continued)
(4) Summary of Significant Accounting Policies (Continued)
We evaluate long-lived tangible and intangible assets whenever events or changes in circumstances indicate that the carrying amount of an asset may not be recoverable. If indicators of impairment are present with respect to long-lived tangible and intangible assets used in operations and undiscounted future cash flows are not expected to be sufficient to recover the assets’ carrying amount, additional analysis is performed as appropriate and the carrying value of the long-lived assets is reduced to the estimated fair value, if this is lower, and an impairment loss is charged to expense in the period the impairment is identified.
(j) Acquired In-process Research and Development (IPR&D)
Acquired IPR&D represents the fair value assigned to research and development assets that we acquire as part of business combinations, and which have not been completed at the date of acquisition. The acquired IPR&D is capitalized as an intangible asset and tested for impairment at least annually until commercialization, after which time the IPR&D is amortized over its estimated useful life. We utilize a discounted probable future cash flow model on a project-by-project basis to value acquired IPR&D. Significant assumptions used in the model include the period in which material net cash inflows from significant projects are expected to commence, anticipated material changes from historical pricing, margins and expense levels and an appropriate risk adjusted discount rate applied to the project’s cash flows.
(k) Business Acquisitions
Our business acquisitions have historically been made at prices above the fair value of the assets acquired and liabilities assumed, resulting in goodwill, based on our expectations of synergies and other benefits of combining the businesses. These synergies and benefits include elimination of redundant facilities, functions and staffing; use of our existing commercial infrastructure to expand sales of the products of the acquired businesses; and use of the commercial infrastructure of the acquired businesses to expand product sales in a cost-efficient manner.
Significant judgment is required in estimating the fair value of intangible assets and in assigning their respective useful lives. The fair value estimates are based on available historical information and on future expectations and assumptions deemed reasonable by management, but are inherently uncertain.
We generally employ the income method to estimate the fair value of intangible assets, which is based on forecasts of the expected future cash flows attributable to the respective assets. Significant estimates and assumptions inherent in the valuations reflect a consideration of other marketplace participants, and include the amount and timing of future cash flows (including expected growth rates and profitability), the underlying product life cycles, economic barriers to entry, a brand’s relative market position and the discount rate applied to the cash flows. Unanticipated market or macroeconomic events and circumstances may occur, which could affect the accuracy or validity of the estimates and assumptions.
Net assets acquired are recorded at their fair value and are subject to adjustment upon finalization of the fair value analysis.
During 2015, 2014 and 2013, we expensed acquisition-related costs of $0.5 million, $0.9 million and $3.1 million, respectively, in general and administrative expense.
F-23
Table of Contents
ALERE INC. AND SUBSIDIARIES
NOTES TO CONSOLIDATED FINANCIAL STATEMENTS (Continued)
(4) Summary of Significant Accounting Policies (Continued)
(l) Income Taxes
Deferred tax assets and liabilities are recognized for the future tax consequences attributable to differences between the financial statement carrying amounts of existing assets and liabilities and their respective tax bases. Deferred tax assets and liabilities are measured using enacted tax rates expected to apply to taxable income in the year in which those temporary differences are expected to be recovered or settled. The effect on deferred tax assets and liabilities of a change in tax rates is recognized in income in the period that includes the enactment date. Valuation allowances are established when necessary to reduce deferred tax assets to the amounts that are more likely than not to be realized in the future.
We account for uncertain tax positions using a “more-likely-than-not” threshold for recognizing and resolving uncertain tax positions. We evaluate uncertain tax positions on a quarterly basis and consider various factors, including, but not limited to, changes in tax law, the measurement of tax positions taken or expected to be taken in tax returns, the effective settlement of matters subject to audit, new audit activity and changes in facts or circumstances related to a tax position.
During November 2015, the FASB issued Accounting Standards Update No. 2015-17, ASU 2015-17, Balance Sheet Classification of Deferred Taxes, which simplifies the presentation of deferred income taxes. This ASU requires that deferred tax assets and liabilities be classified as non-current in a statement of financial position. We adopted this ASU effective December 31, 2015 on a prospective basis. Adoption of this ASU resulted in a reclassification of our net current deferred tax asset to the net non-current deferred tax asset in our consolidated balance sheet as of December 31, 2015. No prior periods were retrospectively adjusted.
(m) Revenue Recognition
We primarily recognize revenue when the following four basic criteria have been met: (1) persuasive evidence of an arrangement exists, (2) delivery has occurred or services have been rendered, (3) the fee is fixed or determinable and (4) collection is reasonably assured.
The majority of our revenue is derived from product sales. We recognize revenue upon transfer of the title and risk of loss of the products to third-party customers, less a reserve for estimated product returns and allowances. Determination of the reserve for estimated product returns and allowances is based on our management’s analyses and judgments regarding certain conditions. Should future changes in conditions prove management’s conclusions and judgments on previous analyses to be incorrect, revenue recognized for any reporting period could be adversely affected.
For products that include installation, and if the installation meets the criteria to be considered a separate element, product revenue is recognized upon delivery, and installation revenue is recognized when the installation is complete. For sales that include customer-specified acceptance criteria, revenue is recognized after the acceptance criteria have been met. Certain of our products require specialized installation. Revenue for these products is deferred until installation is completed. Revenue from services is deferred and recognized over the contractual period, or as services are rendered and accepted by the customer. When arrangements include multiple elements, we use objective evidence of fair value to allocate revenue to the elements, and recognize revenue when the criteria for revenue recognition have been met for each element, in accordance with authoritative guidance on multiple-element arrangements.
Additionally, with respect to our health management business which is included in discontinued operations, we generated services revenue in connection with contracts with health plans (both
F-24
Table of Contents
ALERE INC. AND SUBSIDIARIES
NOTES TO CONSOLIDATED FINANCIAL STATEMENTS (Continued)
(4) Summary of Significant Accounting Policies (Continued)
commercial and governmental) and self-insured employers, whereby we provided clinical expertise through fee-based arrangements. Revenue for fee-based arrangements was recognized over the period in which the services were provided. Some contracts provided that a portion of our fees were at risk if our customers did not achieve certain financial cost savings or we did not achieve certain other clinical and operational metrics, over a period of time, typically one year. Revenue subject to refund was not recognized if (i) sufficient information was not available to calculate performance measurements or (ii) interim performance measurements indicate that we were not meeting performance targets. If either of these two conditions existed, we recorded the amounts as other current liabilities in the consolidated balance sheet, deferring recognition of the revenue until we established that we were meeting the performance criteria. However, revenue recognized for fees subject to refund before the end of the contract period was realizable under the termination provisions or other provisions of the contract. If we did not meet the performance targets at the end of the contractual period we were obligated under the contract to refund some or all of the at-risk fees.
We also receive license and royalty revenue from agreements with third-party licensees. Revenue from license and royalty agreements is recognized on a straight-line basis over the obligation period of the related license agreements, or at the time when we have no further obligations. License and royalty fees that the licensees calculate based on their sales, which we have the right to audit under most of our agreements, are generally recognized upon receipt of the license or royalty payments unless we are able to reasonably estimate the fees as they are earned. License and royalty fees that are determinable prior to the receipt thereof are recognized in the period they are earned.
In connection with the preparation of our consolidated financial statements for the fiscal year ended December 31, 2015, we determined that, in 2013 and 2014 and the first three quarters of 2015, we had incorrectly recognized revenue transactions for such periods. As a result of these errors related to the timing of certain revenue transactions, as well as certain other out-of-period adjustments, we are revising our consolidated financial information as of December 31, 2014 and for the years ended December 31, 2014 and 2013 and the interim periods of 2014 and the first three quarters of 2015. For more information on the revisions related to recognition of certain revenue transactions, see Note 2.
(n) Employee Stock-based Compensation Arrangements
We account for share-based payments in accordance with ASC 718, Compensation — Stock Compensation. Compensation expense associated with stock options includes amortization based on the grant-date fair value estimated in accordance with the provisions of ASC 718. In addition, we record expense over the offering period in connection with shares issued under our employee stock purchase plan. Compensation expense for stock-based compensation awards includes an estimate for forfeitures and is recognized over the vesting period of the options using the straight-line method. It is our policy to recognize, through additional paid in capital, the excess or windfall tax benefits on stock option deductions, as those deductions are recognized on tax returns.
Our stock option plans provide for grants of options to employees to purchase common stock at or above the fair market value of such shares on the grant date of the award. The options generally vest over a four-year period, beginning on the date of grant, with a graded vesting schedule of 25% at the end of each of the four years. The fair value of each option grant is estimated on the date of grant primarily using a Black-Scholes option-pricing method. We use historical data to estimate the expected price volatility and the expected forfeiture rate. The contractual term of our stock option awards is ten
F-25
Table of Contents
ALERE INC. AND SUBSIDIARIES
NOTES TO CONSOLIDATED FINANCIAL STATEMENTS (Continued)
(4) Summary of Significant Accounting Policies (Continued)
years. The risk-free rate is based on the U.S. Treasury yield curve in effect at the time of grant with a remaining term equal to the expected term of the option. We have not made any dividend payments to common shareholders nor do we have plans to pay dividends in the foreseeable future.
(o) Net Income (Loss) per Common Share
Net income (loss) per common share is based upon the weighted-average number of outstanding common shares and the dilutive effect of common share equivalents, such as options and warrants to purchase common stock, convertible preferred stock and convertible notes, if applicable, that are outstanding each year (Note 13).
(p) Other Operating Expenses
We expense advertising costs, other than for direct response advertising, as incurred. In 2015, 2014 and 2013, advertising costs amounted to $9.0 million, $8.0 million and $10.6 million, respectively, and are included in sales and marketing expenses in the accompanying consolidated statements of operations.
Shipping and handling costs are included in cost of net revenue in the accompanying consolidated statements of operations. When we charge our customers for shipping and handling costs, these costs are recorded along with product revenues.
Legal fees incurred by us are included in general and administrative expenses and are expensed in the period such costs are incurred. Payments to third parties in connection with the resolution of legal disputes, investigations or other contingencies are included in general and administrative expenses and are expensed when an unfavourable outcome is probable and the amount of loss can be reasonably estimated in accordance with Statement of Financial Accounting Standards No. 5, Accounting for Contingencies.
(q) Direct-response Advertising
In connection with our mail order diabetes business, we incurred direct-response advertising and associated costs in connection with the placement of advertisements. Direct-response advertising and associated costs payable to third parties for the period presented are capitalized and amortized to selling, general and administrative expenses on an accelerated basis in the month following the broadcast month. Management assesses the realizability of the amounts of direct-response advertising costs reported as assets at each balance sheet date by comparing the net carrying value of capitalized advertising to the net present value of estimated future orders expected to result directly from such advertising. Advertising that does not meet the capitalization requirements is expensed in the current period.
Any change in existing accounting rules or a business change that impacts expected future orders or that shortens the period over which such net future benefits are estimated to be realized could result in accelerated charges against our earnings. In addition, new or different marketing initiatives that may not qualify for direct-response advertising could result in accelerated charges against our earnings. Whether there is an impairment loss or not is determined by comparing the net carrying value of direct-response advertising costs capitalized as assets at each balance sheet date to the probable remaining future orders expected to result directly from such advertising. If the net carrying value of the assets exceeds the probable remaining future orders expected to result directly from such assets, an impairment loss is recognized in an amount equal to that excess. Future benefits are determined by
F-26
Table of Contents
ALERE INC. AND SUBSIDIARIES
NOTES TO CONSOLIDATED FINANCIAL STATEMENTS (Continued)
(4) Summary of Significant Accounting Policies (Continued)
calculating the net present value of estimated future orders per cost pool. Net present value is calculated based upon the value of an order multiplied by the estimated future orders. Estimate of future orders is determined based on historical customer reorder rates. We perform the impairment test of our direct-response advertising asset in the quarter following the advertising broadcast quarter.
(r) Concentration of Credit Risk, Off-Balance Sheet Risks and Other Risks and Uncertainties
Financial instruments that potentially subject us to concentration of credit risk primarily consist of cash and cash equivalents and accounts receivable. We invest our excess cash primarily in high quality securities and limit the amount of our credit exposure to any one financial institution. We do not require collateral or other securities to support customer receivables; however, we perform on-going credit evaluations of our customers and maintain allowances for potential credit losses.
At December 31, 2015 and 2014, no individual customer’s accounts receivable balance was more than 10% of our aggregate accounts receivable. During 2015, 2014 and 2013, no one customer represented more than 10% of our net revenue.
(s) Financial Instruments and Fair Value of Financial Instruments
Our primary financial instruments at December 31, 2015 and 2014 consisted of cash equivalents, restricted cash, marketable securities, accounts receivable, accounts payable and debt. We apply fair value measurement accounting to value our financial assets and liabilities. Fair value is defined as the exchange price that would be received for an asset or paid to transfer a liability (an exit price) in the principal or most advantageous market for the asset or liability in an orderly transaction between market participants on the measurement date. A fair value hierarchy requires an entity to maximize the use of observable inputs, where available, and minimize the use of unobservable inputs when measuring fair value.
Described below are the three levels of inputs that may be used to measure fair value:
Level 1 Quoted prices in active markets for identical assets or liabilities.
Level 2 Observable inputs other than Level 1 prices, such as quoted prices for similar assets or liabilities; quoted prices in markets that are not active; or other inputs that are observable or can be corroborated by observable market data for substantially the full term of the assets or liabilities.
Level 3 Unobservable inputs that are supported by little or no market activity and that are significant to the fair value of the assets or liabilities.
(t) Software for Internal Use and for Resale
We may capitalize certain costs associated with the development of internal-use software, including direct materials and services. Capitalized software is amortized on a straight-line basis over its estimated useful life and is included in computer software and equipment within property, plant and equipment.
We also develop software for resale or lease to external parties and expense the costs of developing software for resale or lease incurred before establishment of technological feasibility of the
F-27
Table of Contents
ALERE INC. AND SUBSIDIARIES
NOTES TO CONSOLIDATED FINANCIAL STATEMENTS (Continued)
(4) Summary of Significant Accounting Policies (Continued)
underlying software. The costs incurred from establishment of technological feasibility until general release of the software are capitalized, and the capitalized software is amortized over its estimated useful life. Capitalized software for resale or lease is included in computer software and equipment within property, plant and equipment.
(u) Research and Development
Our research and development programs focus on the development of cardiometabolic, infectious disease and toxicology products. Research and development costs are expensed as incurred. Payments received from external parties to fund our research and development activities reduce the recorded research and development expenses.
(v) Leases
We lease certain facilities and equipment from external parties under operating leases. Rent expense related to operating leases is recorded in the income statement as incurred or on a straight-line basis if there are material escalation clauses. We also lease machinery, laboratory equipment, tooling and other equipment under capital leases. In determining whether a lease is a capital or an operating lease, we estimate the expected term of the lease, which includes certain renewable options as required by lease accounting guidance. Rent deferrals, landlord incentives and rent escalations are included in calculation of minimum lease payments when performing the capital lease tests and when calculating the rent expense for operating leases.
Leased property, plant and equipment that meet the capital lease criteria are capitalized at the lower of the present value of the minimum lease payments or the fair value of the underlying asset at the inception date of the lease. Assets under capital leases are depreciated on a straight-line basis over the lease term.
Leasehold improvements are capitalized and amortized over the shorter of their estimated useful lives or the remainder of the expected term of the lease.
(w) Recent Accounting Pronouncements
Recently Issued Standards
In March 2016, the Financial Accounting Standards Board, or the FASB, issued ASU No. 2016-09, Compensation—Stock Compensation (Topic 718): Improvements to Employee Share-Based Payment Accounting, or ASU 2016-09. ASU 2016-09 simplifies several aspects of the accounting for share-based payment award transactions including income tax consequences, classification of awards as either equity or liabilities, and classification on the statement of cash flows. ASU 2016-09 is effective for fiscal years beginning after December 15, 2016, including interim periods within those fiscal years, with early adoption permitted. We do not expect the adoption of ASU 2016-09 to have a significant impact on our consolidated financial statements.
In September 2015, the FASB issued ASU No. 2015-16, Business Combinations (Topic 805): Simplifying the Accounting for Measurement-Period Adjustments, or ASU 2015-16. ASU 2015-16 requires that an acquirer recognize adjustments to estimated amounts that are identified during the measurement period in the reporting period in which the adjustment amounts are determined. ASU 2015-16 is effective for fiscal years beginning after December 15, 2015, including interim periods within
F-28
Table of Contents
ALERE INC. AND SUBSIDIARIES
NOTES TO CONSOLIDATED FINANCIAL STATEMENTS (Continued)
(4) Summary of Significant Accounting Policies (Continued)
those fiscal years. The amendments should be applied prospectively to adjustments to provisional amounts that occur after the effective date with earlier application permitted for financial statements that have not been issued. We do not expect the adoption of ASU 2015-16 to have a significant impact on our consolidated financial statements.
In July 2015, the FASB issued ASU No. 2015-11, Inventory (Topic 330): Simplifying the Measurement of Inventory, or ASU 2015-11. ASU 2015-11 requires an entity to measure in-scope inventory at the lower of cost and net realizable value. ASU 2015-11 is effective for fiscal years beginning after December 15, 2016, and for interim periods within those fiscal years. A reporting entity should apply ASU 2015-11 prospectively with earlier application permitted as of the beginning of an interim or annual reporting period. We do not expect the adoption of ASU 2015-11 to have a significant impact on our consolidated financial statements.
In April 2015, the FASB issued ASU No. 2015-03, Interest—Imputation of Interest (Subtopic 835-30): Simplifying the Presentation of Debt Issuance Costs, or ASU 2015-03. ASU 2015-03 is intended to simplify the presentation of debt issuance costs. It requires that debt issuance costs related to a recognized debt liability be presented in the balance sheet as a direct deduction from the carrying amount of that debt liability, consistent with debt discounts. ASU 2015-03 is effective for fiscal years beginning after December 15, 2015, and for interim periods within those fiscal years. Early adoption is permitted. We are currently evaluating the impact of the adoption of ASU 2015-03 on our consolidated financial statements and, upon adoption, we will revise our current presentation of debt issuance costs on our consolidated balance sheet. In August 2015, the FASB issued ASU No. 2015-15, Interest — Imputation of Interest (Subtopic 835-30) — Presentation and Subsequent Measurement of Debt Issuance Costs Associated with Line-of-Credit Arrangements (Amendments to SEC Paragraphs Pursuant to Staff Announcement at June 18, 2015 EITF Meeting), or ASU 2015-15. ASU 2015-15 adds the authoritative guidance on presentation or subsequent measurement of debt issuance costs related to line-of-credit arrangements to ASU 2015-03. We do not expect the adoption of ASU 2015-03 and ASU 2015-15 to have a significant impact on our consolidated financial statements.
In August 2014, the FASB issued ASU No. 2014-15, Presentation of Financial Statements — Going Concern (Subtopic 205-40): Disclosure of Uncertainties about an Entity’s Ability to Continue as a Going Concern, or ASU 2014-15. ASU 2014-15 is intended to define management’s responsibility to evaluate whether there is substantial doubt about an organization’s ability to continue as a going concern and to provide related footnote disclosures. ASU 2014-15 is effective for fiscal years ending after December 15, 2016, and for interim periods within fiscal years beginning after December 15, 2016. Early adoption is permitted. We do not expect the adoption of ASU 2014-15 to have a significant impact on our consolidated financial statements.
In June 2014, the FASB issued ASU No. 2014-12, Compensation — Stock Compensation (Topic 718) — Accounting for Share-Based Payments When the Terms of an Award Provide That a Performance Target Could Be Achieved after the Requisite Service Period, or ASU 2014-12. ASU 2014-12 requires that a performance target which affects vesting and which could be achieved after the requisite service period be treated as a performance condition. ASU 2014-12 is effective for fiscal years beginning after December 15, 2015, and for interim periods within those fiscal years. Early adoption is permitted. We do not expect the adoption of ASU 2014-12 to have a significant impact on our consolidated financial statements.
In May 2014, the FASB issued ASU No. 2014-09, Revenue from Contracts with Customers, or ASU 2014-09, as a new Topic, Accounting Standards Codification Topic 606. ASU 2014-09 sets forth a
F-29
Table of Contents
ALERE INC. AND SUBSIDIARIES
NOTES TO CONSOLIDATED FINANCIAL STATEMENTS (Continued)
(4) Summary of Significant Accounting Policies (Continued)
new revenue recognition standard that provides for a five-step analysis of transactions to determine when and how revenue is recognized. The core principle is that a company should recognize revenue to depict the transfer of promised goods or services to customers in an amount that reflects the consideration to which the entity expects to be entitled in exchange for those goods or services. In August 2015, the FASB finalized a one-year delay in the effective date of this standard, which will now be effective for us on January 1, 2018; however, early adoption is permitted any time after the original effective date, which for us is January 1, 2017. We have not yet selected a transition method and are currently evaluating the impact of ASU 2014-09 on our consolidated financial statements.
We believe that there were no other accounting standards recently issued that had or are expected to have a material impact on our consolidated financial statements.
Recently Adopted Standards
During November 2015, the FASB issued ASU No. 2015-17, Balance Sheet Classification of Deferred Taxes, which simplifies the presentation of deferred income taxes. This ASU requires that deferred tax assets and liabilities be classified as non-current in a statement of financial position. We adopted this ASU effective December 31, 2015 on a prospective basis. Adoption of this ASU resulted in a reclassification of our net current deferred tax asset to the net non-current deferred tax asset in our consolidated balance sheet as of December 31, 2015. No prior periods were retrospectively adjusted.
In April 2014, the FASB issued ASU No. 2014-08, Presentation of Financial Statements (Topic 205) and Property, Plant, and Equipment (Topic 360) — Reporting Discontinued Operations and Disclosures of Disposals of Components of an Entity, or ASU 2014-08. ASU 2014-08 requires that only disposals representing a strategic shift in operations which has a major effect on the organization’s operations and financial results, such as a disposal of a major geographic area, a major line of business, or a major equity method investment, should be presented as discontinued operations. In addition, the new guidance requires expanded disclosures about discontinued operations that will provide financial statement users with more information about the assets, liabilities, income, and expenses of discontinued operations. ASU 2014-08 is effective in the first quarter of 2015 with early adoption permitted. Effective October 1, 2014, we adopted ASU 2014-08. As a result of our early adoption of this standard, we reported our divestiture of BioNote, Inc., or BioNote, as a gain on disposition within operating income from continuing operations. See Note 3 and Note 25.
F-30
Table of Contents
ALERE INC. AND SUBSIDIARIES
NOTES TO CONSOLIDATED FINANCIAL STATEMENTS (Continued)
(5) Other Balance Sheet Information
Components of selected captions in the consolidated balance sheets consist of (in thousands):
| December 31, | ||||||||
| 2015 | 2014 | |||||||
| Inventories, net: |
||||||||
| Raw materials |
$ | 130,171 | $ | 122,886 | ||||
| Work-in-process |
69,178 | 82,724 | ||||||
| Finished goods |
147,652 | 171,739 | ||||||
|
|
|
|
|
|||||
| $ | 347,001 | $ | 377,349 | |||||
|
|
|
|
|
|||||
| Prepaid expenses and other current assets: |
||||||||
| Prepaid expenses |
$ | 28,041 | $ | 49,065 | ||||
| Prepaid income tax |
50,201 | 11,309 | ||||||
| Income taxes receivable |
199 | 2,273 | ||||||
| Royalty receivable |
7,757 | 8,143 | ||||||
| Other taxes receivable |
15,333 | 20,695 | ||||||
| Cash advances |
3,902 | 6,221 | ||||||
| Pension receivable |
1,373 | 1,430 | ||||||
| Grant receivable |
651 | 1,534 | ||||||
| Employee loans |
123 | 62 | ||||||
| Security deposits |
7,014 | 5,411 | ||||||
| Other receivable |
15,938 | — | ||||||
| Other |
21,701 | 26,270 | ||||||
|
|
|
|
|
|||||
| $ | 152,233 | $ | 132,413 | |||||
|
|
|
|
|
|||||
| Property, plant and equipment, net: |
||||||||
| Machinery, laboratory equipment and tooling |
$ | 469,413 | $ | 431,255 | ||||
| Land and buildings |
169,226 | 172,773 | ||||||
| Leasehold improvements |
55,999 | 56,709 | ||||||
| Computer software and equipment |
161,192 | 154,566 | ||||||
| Furniture and fixtures |
27,325 | 35,656 | ||||||
|
|
|
|
|
|||||
| 883,155 | 850,959 | |||||||
| Less: Accumulated depreciation |
(437,116 | ) | (396,736 | ) | ||||
|
|
|
|
|
|||||
| $ | 446,039 | $ | 454,223 | |||||
|
|
|
|
|
|||||
| Accrued expenses and other current liabilities: |
||||||||
| Compensation and compensation-related |
$ | 80,468 | $ | 88,546 | ||||
| Royalty obligations |
18,912 | 23,072 | ||||||
| Deferred revenue |
40,998 | 45,577 | ||||||
| Income taxes payable and deferred tax liabilities |
15,245 | 25,478 | ||||||
| Other taxes payable |
28,320 | 31,491 | ||||||
| Acquisition-related obligations |
5,705 | 69,779 | ||||||
| Other |
134,817 | 101,984 | ||||||
|
|
|
|
|
|||||
| $ | 324,465 | $ | 385,927 | |||||
|
|
|
|
|
|||||
(6) Business Combinations
Acquisitions are accounted for using the acquisition method and the acquired companies’ results have been included in the accompanying consolidated financial statements from their respective dates of acquisition. During 2015, 2014 and 2013, we recorded acquisition-related costs of $0.5 million, $0.9 million and $3.1 million, respectively, in general and administrative expense.
F-31
Table of Contents
ALERE INC. AND SUBSIDIARIES
NOTES TO CONSOLIDATED FINANCIAL STATEMENTS (Continued)
(6) Business Combinations (Continued)
Net assets acquired are recorded at their fair value and are subject to adjustment upon finalization of the fair value analysis. The estimated useful lives of the individual categories of intangible assets were based on the nature of the applicable intangible asset and the expected future cash flows to be derived from the intangible asset. Amortization of intangible assets with finite lives is recognized over the shorter of the respective lives of the agreement or the period of time the intangible assets are expected to contribute to future cash flows. We amortize our finite-lived intangible assets based on patterns on which the respective economic benefits are expected to be realized. We amortize the majority of our intangible assets on a straight-line basis, as this methodology most closely approximates the pattern of economic benefits for these assets.
(a) Acquisitions in 2015
USD
On July 10, 2015, we acquired substantially all of the assets of US Diagnostics, Inc., or USD, located in Huntsville, Alabama, a provider of instant on-site drug testing products designed for quick and accurate drug test results. The aggregate purchase price was approximately $60.1 million and was paid in cash. The operating results of USD are included in our professional diagnostics reporting unit and business segment.
Our consolidated statements of operations for 2015 included revenue totaling approximately $10.7 million related to this business. Goodwill has been recognized in the acquisition and amounted to approximately $29.4 million, which is deductible for tax purposes.
A summary of the preliminary fair values of the net assets acquired from USD is as follows (in thousands):
| Total | ||||
| Current assets |
$ | 4,698 | ||
| Property, plant and equipment |
182 | |||
| Goodwill |
29,365 | |||
| Intangible assets |
27,100 | |||
|
|
|
|||
| Total assets acquired |
$ | 61,345 | ||
|
|
|
|||
| Current liabilities |
$ | 1,210 | ||
|
|
|
|||
| Total liabilities assumed |
$ | 1,210 | ||
|
|
|
|||
| Net assets acquired |
$ | 60,135 | ||
|
|
|
|||
| Cash paid |
$ | 60,135 | ||
|
|
|
|||
The following are the intangible assets acquired in connection with the USD acquisition and their respective preliminary fair values and weighted-average useful lives (dollars in thousands):
| Total | Weighted- average Useful Life |
|||||||
| Trademarks |
$ | 1,600 | 10.0 years | |||||
| Customer relationships |
24,800 | 13.0 years | ||||||
| Non-compete agreements |
700 | 2.0 years | ||||||
|
|
|
|||||||
| Total intangible assets |
$ | 27,100 | ||||||
|
|
|
|||||||
F-32
Table of Contents
ALERE INC. AND SUBSIDIARIES
NOTES TO CONSOLIDATED FINANCIAL STATEMENTS (Continued)
(6) Business Combinations (Continued)
(b) Acquisitions in 2013
(i) Epocal
On February 1, 2013, we acquired Epocal, Inc., or Epocal, located in Ottawa, Canada, a provider of technologies that support blood gas and electrolyte testing at the point of care. The aggregate purchase price was approximately $248.5 million, which consisted of $151.4 million in cash, a $22.1 million settlement of a pre-existing arrangement and a contingent consideration obligation with an aggregate acquisition date fair value of $75.0 million. The operating results of Epocal are included in our professional diagnostics reporting unit and business segment. The amount allocated to goodwill from this acquisition is not deductible for tax purposes.
(ii) Other acquisitions in 2013
During the year ended December 31, 2013, we acquired the following businesses for an aggregate purchase price of $57.6 million, which included cash payments totaling $28.2 million, a $17.5 million settlement of a pre-existing arrangement, contingent consideration obligations with an aggregate acquisition date fair value of $1.3 million, deferred purchase price consideration with an acquisition date fair value of $0.8 million and an $8.0 million bargain purchase gain.
| • | certain assets of PT Mega Medika Mandiri, or Mega Medika, located in South Jakarta, Indonesia, a distributor of infectious disease products to the Indonesian marketplace as well as materials for vaccines to a pharmaceutical customer (Acquired January 2013) |
| • | Discount Diabetic, LLC, or Discount Diabetic, located in Phoenix, Arizona, a provider of blood glucose monitoring products, including diabetes testing systems and test strips and other products (Acquired April 2013) |
| • | the Medicare fee-for-service assets of Liberty Medical, or the Liberty business, located in Port St. Lucie, Florida, a leading mail order provider of diabetes testing supplies serving the needs of both Type 1 and Type 2 diabetic patients (Acquired April 2013) |
| • | 51% share in Cardio Selfcare B.V., subsequently renamed Alere Health Services B.V., or Alere Health Services, located in Ede, the Netherlands, a developer of innovative software for the healthcare industry that develops and licenses software and sells medical devices to enable patients to perform medical self-care, including thrombosis self-care (Acquired May 2013) |
| • | 74.9% interest in Pantech Proprietary Limited, or Pantech, located in Durban, South Africa, a supplier of rapid diagnostic test kits, including HIV, malaria, syphilis, drugs of abuse, 10 parameter urine sticks, glucometers and glucose sticks (Acquired July 2013) |
| • | certain assets of Simplex Healthcare, Inc. and its subsidiaries, or Simplex, located in Tennessee, a provider of home delivery of diabetes-related medical supplies and products (Acquired November 2013) |
The operating results of Mega Medika, Discount Diabetic, the Liberty business, Alere Health Services, Pantech, and Simplex are included in our professional diagnostics reporting unit and business segment.
Our consolidated statement of operations for the year ended December 31, 2013 included revenue totaling approximately $83.0 million related to these businesses. Goodwill has been recognized in the Mega Medika, Alere Health Services, Pantech, and Simplex acquisitions and amounted to approximately $2.4 million. The goodwill related to the Mega Medika and Simplex acquisitions is deductible for tax purposes, but the goodwill related to the Pantech and Alere Health Services acquisitions is not.
F-33
Table of Contents
ALERE INC. AND SUBSIDIARIES
NOTES TO CONSOLIDATED FINANCIAL STATEMENTS (Continued)
(6) Business Combinations (Continued)
With respect to our acquisition of the Liberty business, the purchase price of the acquisition has been allocated to the net tangible and intangible assets acquired, with the excess of the fair value of assets acquired over the purchase price recorded as a bargain purchase gain. The $8.0 million bargain purchase gain has been recorded in other income (expense), net in our consolidated statement of operations and is not recognized for tax purposes. The bargain purchase gain resulted from our operating cost structure which we believe will allow us to operate this business more cost effectively than the sellers.
A summary of the fair values of the net assets acquired for the acquisitions consummated in 2013 is as follows (in thousands):
| Epocal | Other | Total | ||||||||||
| Current assets(1) |
$ | 12,535 | $ | 13,623 | $ | 26,158 | ||||||
| Property, plant and equipment |
1,267 | 1,731 | 2,998 | |||||||||
| Goodwill |
100,419 | 2,447 | 102,866 | |||||||||
| Intangible assets |
164,400 | 51,180 | 215,580 | |||||||||
| Other non-current assets |
18,158 | 29 | 18,187 | |||||||||
|
|
|
|
|
|
|
|||||||
| Total assets acquired |
296,779 | 69,010 | 365,789 | |||||||||
|
|
|
|
|
|
|
|||||||
| Current liabilities |
2,701 | 5,398 | 8,099 | |||||||||
| Non-current liabilities |
45,542 | 6,062 | 51,604 | |||||||||
|
|
|
|
|
|
|
|||||||
| Total liabilities assumed |
48,243 | 11,460 | 59,703 | |||||||||
|
|
|
|
|
|
|
|||||||
| Net assets acquired |
248,536 | 57,550 | 306,086 | |||||||||
| Less: |
||||||||||||
| Contingent consideration |
75,000 | 1,264 | 76,264 | |||||||||
| Settlement of pre-existing arrangements |
22,088 | 17,500 | 39,588 | |||||||||
| Non-controlling interest |
— | 1,774 | 1,774 | |||||||||
| Bargain purchase gain |
— | 8,023 | 8,023 | |||||||||
| Deferred purchase price consideration |
— | 768 | 768 | |||||||||
|
|
|
|
|
|
|
|||||||
| Cash paid |
$ | 151,448 | $ | 28,221 | $ | 179,669 | ||||||
|
|
|
|
|
|
|
|||||||
| (1) | Includes approximately $3.3 million of acquired cash. |
The following are the intangible assets acquired in 2013 and their respective fair values and weighted-average useful lives (dollars in thousands):
| Epocal | Other | Total | Weighted- average Useful Life |
|||||||||||||
| Core technology and patents |
$ | 119,700 | $ | — | $ | 119,700 | 20.0 years | |||||||||
| Software |
— | 2,154 | 2,154 | 5.7 years | ||||||||||||
| Trademarks and trade names |
20,500 | 80 | 20,580 | 19.1 years | ||||||||||||
| License agreements |
— | 620 | 620 | 1.5 years | ||||||||||||
| Customer relationships |
— | 42,510 | 42,510 | 11.5 years | ||||||||||||
| Other |
— | 5,816 | 5,816 | 3.0 years | ||||||||||||
| In-process research and development |
24,200 | — | 24,200 | N/A | ||||||||||||
|
|
|
|
|
|
|
|||||||||||
| Total intangible assets |
$ | 164,400 | $ | 51,180 | $ | 215,580 | ||||||||||
|
|
|
|
|
|
|
|||||||||||
F-34
Table of Contents
ALERE INC. AND SUBSIDIARIES
NOTES TO CONSOLIDATED FINANCIAL STATEMENTS (Continued)
(7) Goodwill and Other Intangible Assets
The following is a summary of goodwill and other intangible assets as of December 31, 2015 (dollars in thousands):
| Gross Carrying Amount |
Accumulated Amortization and Impairment Losses |
Net Carrying Value |
Weighted- average Useful Life |
|||||||||||||
| Amortized intangible assets: |
||||||||||||||||
| Core technology and patents |
$ | 907,629 | $ | 468,497 | $ | 439,132 | 15.1 years | |||||||||
|
|
|
|
|
|
|
|||||||||||
| Other intangible assets: |
||||||||||||||||
| Supplier relationships |
17,599 | 16,218 | 1,381 | 9.2 years | ||||||||||||
| Trademarks and trade names |
242,473 | 176,325 | 66,148 | 10.7 years | ||||||||||||
| License agreements |
10,963 | 10,944 | 19 | 7.0 years | ||||||||||||
| Customer relationships |
1,441,386 | 985,844 | 455,542 | 16.6 years | ||||||||||||
| Manufacturing know-how |
19,181 | 16,744 | 2,437 | 7.7 years | ||||||||||||
| Other |
108,217 | 75,595 | 32,622 | 7.7 years | ||||||||||||
|
|
|
|
|
|
|
|||||||||||
| Total other intangible assets |
1,839,819 | 1,281,670 | 558,149 | |||||||||||||
|
|
|
|
|
|
|
|||||||||||
| Total intangible assets with finite lives |
$ | 2,747,448 | $ | 1,750,167 | $ | 997,281 | ||||||||||
|
|
|
|
|
|
|
|||||||||||
| Intangible assets with indefinite lives: |
||||||||||||||||
| Goodwill |
$ | 2,836,915 | ||||||||||||||
| Other intangible assets(1) |
28,110 | |||||||||||||||
|
|
|
|||||||||||||||
| Total intangible assets with indefinite lives |
$ | 2,865,025 | ||||||||||||||
|
|
|
|||||||||||||||
| (1) | Primarily includes in-process research and development assets recorded in connection with certain acquisitions. |
The following is a summary of goodwill and other intangible assets as of December 31, 2014 (dollars in thousands):
| Gross Carrying Amount |
Accumulated Amortization and Impairment Losses |
Net Carrying Value |
Weighted- average Useful Life |
|||||||||||||
| Amortized intangible assets: |
||||||||||||||||
| Core technology and patents |
$ | 969,993 | $ | 417,119 | $ | 552,874 | 15.2 years | |||||||||
|
|
|
|
|
|
|
|||||||||||
| Other intangible assets: |
||||||||||||||||
| Supplier relationships |
17,975 | 16,188 | 1,787 | 9.2 years | ||||||||||||
| Trademarks and trade names |
256,014 | 161,945 | 94,069 | 11.0 years | ||||||||||||
| License agreements |
11,670 | 11,511 | 159 | 6.8 years | ||||||||||||
| Customer relationships |
1,504,078 | 930,533 | 573,545 | 16.6 years | ||||||||||||
| Manufacturing know-how |
21,540 | 11,595 | 9,945 | 8.9 years | ||||||||||||
| Other |
108,792 | 64,727 | 44,065 | 8.7 years | ||||||||||||
|
|
|
|
|
|
|
|||||||||||
| Total other intangible assets |
1,920,069 | 1,196,499 | 723,570 | |||||||||||||
|
|
|
|
|
|
|
|||||||||||
| Total intangible assets with finite lives |
$ | 2,890,062 | $ | 1,613,618 | $ | 1,276,444 | ||||||||||
|
|
|
|
|
|
|
|||||||||||
| Intangible assets with indefinite lives: |
||||||||||||||||
| Goodwill |
$ | 2,926,666 | ||||||||||||||
| Other intangible assets(1) |
43,651 | |||||||||||||||
|
|
|
|||||||||||||||
| Total intangible assets with indefinite lives |
$ | 2,970,317 | ||||||||||||||
|
|
|
|||||||||||||||
| (1) | Primarily includes in-process research and development assets recorded in connection with certain acquisitions. |
F-35
Table of Contents
ALERE INC. AND SUBSIDIARIES
NOTES TO CONSOLIDATED FINANCIAL STATEMENTS (Continued)
(7) Goodwill and Other Intangible Assets (Continued)
During 2015 and 2014, we performed our annual impairment test of our in-process research and development assets, and in certain cases found them to be impaired, due to a combination of suspending certain projects to allow for resource allocation to other projects considered by our management to be more strategically valuable and delays in completing other projects, which resulted in a decrease in estimated future revenues expected to be achieved upon completion. During 2015 and 2014, we recorded impairment charges totaling $7.4 million and $1.6 million, respectively, to reduce the carrying values of these assets to zero, which was the estimated fair value of each such asset.
The estimated useful lives of the individual categories of intangible assets were based on the nature of the applicable intangible assets and the expected future cash flows to be derived from those intangible assets. Amortization of intangible assets with finite lives is recognized over the shorter of the respective lives of the underlying license agreements, if applicable, or the period of time the assets are expected to contribute to future cash flows. We amortize our finite-lived intangible assets on patterns in which the economic benefits are expected to be realized. We amortize the majority of our intangible assets on a straight-line basis, as this methodology most closely approximates the pattern of economic benefits for these assets. Amortization expense of intangible assets, which in the aggregate amounted to $210.5 million, $237.2 million and $280.0 million in 2015, 2014 and 2013, respectively, is included in cost of net revenue, research and development, sales and marketing and general and administrative expenses in the accompanying consolidated statements of operations. The allocation of amortization expense to the expense categories is based on the intended usage and the expected benefits of the intangible assets in relation to the expense categories.
The following is a summary of estimated aggregate amortization expense of intangible assets for each of the five succeeding fiscal years as of December 31, 2015 (in thousands):
| 2016 |
$ | 203,556 | ||
| 2017 |
$ | 136,600 | ||
| 2018 |
$ | 133,464 | ||
| 2019 |
$ | 99,552 | ||
| 2020 |
$ | 97,345 |
During the fourth quarter, we perform our annual impairment tests of the carrying value of our goodwill by reporting unit. For further discussion see Note 4(h).
Goodwill amounts for our professional diagnostics and consumer diagnostics reporting units, along with our former patient self-testing reporting unit, which rolled into our professional diagnostics reporting unit on January 1, 2015, are summarized as follows (in thousands):
| Professional Diagnostics |
Patient Self- testing |
Consumer Diagnostics |
Total | |||||||||||||
| Goodwill at December 31, 2013 |
$ | 2,915,417 | $ | 33,545 | $ | 58,035 | $ | 3,006,997 | ||||||||
| Acquisitions(1) |
(546 | ) | (25 | ) | — | (571 | ) | |||||||||
| Dispositions(2) |
(16,517 | ) | — | — | (16,517 | ) | ||||||||||
| Other(3) |
(59,549 | ) | (650 | ) | (3,044 | ) | (63,243 | ) | ||||||||
|
|
|
|
|
|
|
|
|
|||||||||
| Goodwill at December 31, 2014 |
$ | 2,838,805 | $ | 32,870 | $ | 54,991 | $ | 2,926,666 | ||||||||
| Balance transfer at January 1, 2015(4) |
32,870 | (32,870 | ) | — | — | |||||||||||
| Acquisitions(1) |
32,970 | — | — | 32,970 | ||||||||||||
| Dispositions(2) |
(58,611 | ) | — | — | (58,611 | ) | ||||||||||
| Other(3) |
(53,081 | ) | — | (11,029 | ) | (64,110 | ) | |||||||||
|
|
|
|
|
|
|
|
|
|||||||||
| Goodwill at December 31, 2015 |
$ | 2,792,953 | $ | — | $ | 43,962 | $ | 2,836,915 | ||||||||
|
|
|
|
|
|
|
|
|
|||||||||
F-36
Table of Contents
ALERE INC. AND SUBSIDIARIES
NOTES TO CONSOLIDATED FINANCIAL STATEMENTS (Continued)
(7) Goodwill and Other Intangible Assets (Continued)
| (1) | Includes initial purchase price allocation, purchase accounting adjustments recorded to the acquired entities’ opening balance sheet and additional payments made for earn-outs and milestones achieved. |
| (2) | Reflects write-off related to the dispositions of BioNote in 2014 and the BBI business and Alere Analytics in 2015. |
| (3) | These amounts relate primarily to adjustments resulting from fluctuations in foreign currency exchange rates. |
| (4) | As a result of the sale of our health management business in January 2015, which was the largest component of our former patient self-testing reporting segment, we ceased to report our financial information in four operating segments and, beginning on January 1, 2015 our reporting units included professional diagnostics and consumer diagnostics. |
We generally expense costs incurred for the internal development of intangible assets, except for costs that are incurred to establish patents and trademarks, such as legal fees for initiating, filing and obtaining the patents and trademarks. As of December 31, 2015 and 2014, we had approximately $8.9 million and $9.5 million, respectively, of costs capitalized, net of amortization, in connection with establishing patents and trademarks which are included in other intangible assets, net, in the accompanying consolidated balance sheets. Upon the initial filing of the patents and trademarks, we commence amortization of such intangible assets over their estimated useful lives. Costs incurred to maintain the patents and trademarks are expensed as incurred.
(8) Long-term Debt
We had the following long-term debt balances outstanding (in thousands) as of December 31, 2015 and 2014, respectively:
| December 31, 2015 |
December 31, 2014 |
|||||||
| A term loans(1) |
$ | 587,671 | $ | — | ||||
| B term loans(1) |
971,180 | — | ||||||
| Prior credit facility—A term loans(2) |
— | 785,938 | ||||||
| Prior credit facility—B term loans(3) |
— | 1,330,810 | ||||||
| Prior credit facility—Revolving loans |
— | 127,000 | ||||||
| 7.25% Senior notes |
450,000 | 450,000 | ||||||
| 6.5% Senior subordinated notes |
425,000 | 425,000 | ||||||
| 6.375% Senior subordinated notes |
425,000 | — | ||||||
| 8.625% Senior subordinated notes |
— | 400,000 | ||||||
| 3% Convertible senior subordinated notes(4) |
150,000 | 150,000 | ||||||
| Other lines of credit |
136 | 684 | ||||||
| Other |
56,221 | 40,828 | ||||||
|
|
|
|
|
|||||
| 3,065,208 | 3,710,260 | |||||||
| Less: Short-term debt and current portion of long-term debt |
(199,992 | ) | (88,875 | ) | ||||
|
|
|
|
|
|||||
| Long-term debt |
$ | 2,865,216 | $ | 3,621,385 | ||||
|
|
|
|
|
|||||
| (1) | Incurred under our secured credit facility entered into on June 18, 2015. |
F-37
Table of Contents
ALERE INC. AND SUBSIDIARIES
NOTES TO CONSOLIDATED FINANCIAL STATEMENTS (Continued)
(8) Long-term Debt (Continued)
| (2) | Included “A” term loans and “Delayed Draw” term loans under our prior credit facility. |
| (3) | Included term loans previously referred to as “Incremental B-1” term loans and “Incremental B-2” term loans under our prior credit facility, which term loans had been converted into and consolidated with the “B” term loans under our prior credit facility. |
| (4) | The principal amount of the 3% convertible senior subordinated notes is included in the short-term debt and current portion of long-term debt on our consolidated balance sheet as of December 31, 2015, as these notes matured on May 15, 2016. |
In connection with our significant long-term debt issuances, we recorded interest expense, including amortization and write-offs of deferred financing costs and original issue discounts, in our accompanying consolidated statements of operations for 2015, 2014 and 2013, respectively, as follows (in thousands):
| 2015 | 2014 | 2013 | ||||||||||
| Secured credit facility(1) |
$ | 38,335 | $ | — | $ | — | ||||||
| Prior credit facility(2) |
49,437 | 99,399 | 104,159 | |||||||||
| 7.25% Senior notes |
34,103 | 34,098 | 33,906 | |||||||||
| 6.375% Senior subordinated notes |
14,549 | — | — | |||||||||
| 7.875% Senior notes |
— | — | 137 | (4) | ||||||||
| 6.5% Senior subordinated notes |
28,987 | 29,057 | 17,384 | |||||||||
| 8.625% Senior subordinated notes(3) |
44,219 | 37,092 | 37,093 | |||||||||
| 9% Senior subordinated notes |
— | — | 54,043 | (5) | ||||||||
| 3% Convertible senior subordinated notes |
4,984 | 4,984 | 4,984 | |||||||||
| Other |
2,383 | 4,561 | 3,640 | |||||||||
|
|
|
|
|
|
|
|||||||
| $ | 216,997 | $ | 209,191 | $ | 255,346 | |||||||
|
|
|
|
|
|
|
|||||||
| (1) | Includes “A” term loans, “B” term loans, and revolving line of credit loans. |
| (2) | Includes the following loans under our prior credit facility: “A” term loans, including the “Delayed-Draw” term loans; “B” term loans, including the term loans previously referred to as “Incremental B-1” term loans and “Incremental B-2” term loans and later converted into and consolidated into the “B” term loans; and revolving line of credit loans. For 2015, 2014 and 2013, the amounts include $1.1 million, $1.5 million and $2.6 million, respectively, related to the amortization of fees paid for certain debt modifications. |
| (3) | Includes a $19.9 million loss on extinguishment of debt associated with the redemption of our 8.625% senior subordinated notes during 2015. Included in the $19.9 million is $8.6 million related to a call premium which has been classified within cash flow from financing activities in our consolidated statements of cash flows. |
| (4) | Amount includes an approximate $0.2 million loss recorded in connection with the repurchase of our 7.875% senior notes. |
| (5) | Amount includes an approximate $35.6 million loss recorded in connection with the repurchase of our 9% senior subordinated notes. Included in the $35.6 million is $19.0 million related to tender offer consideration and call premium which has been classified within cash flow from financing activities in our consolidated statement of cash flows. |
F-38
Table of Contents
ALERE INC. AND SUBSIDIARIES
NOTES TO CONSOLIDATED FINANCIAL STATEMENTS (Continued)
(8) Long-term Debt (Continued)
The following describes each of the debt instruments listed above:
(a) Secured Credit Facility
On June 18, 2015, we entered into a Credit Agreement, or secured credit facility, with certain lenders, Goldman Sachs Bank USA, as B term loan administrative agent, General Electric Capital Corporation as pro rata administrative agent and collateral agent, and certain other agents and arrangers, and, along with certain of our subsidiaries, a related guaranty and security agreement. The secured credit facility provides for (i) term loans in the aggregate initial principal amount of $1.7 billion (consisting of “A” term loans in the aggregate initial principal amount of $650.0 million and “B” term loans in the aggregate initial principal amount of $1.05 billion), all of which were drawn at closing, and (ii) subject to our continued compliance with the terms of the secured credit facility, a $250.0 million revolving line of credit (which revolving line of credit includes a $50.0 million sublimit for the issuance of letters of credit); no amount was drawn under the revolving credit facility at closing.
We used approximately $1.68 billion of the proceeds of the term loans drawn at closing to repay in full all indebtedness outstanding under our prior credit facility, whereupon such agreement was terminated (as described below), and to pay various fees and expenses associated with the transactions contemplated by the secured credit facility. Subject to certain limits and restrictions, we may use the remaining proceeds of the term loans, the proceeds of any revolving credit loans and the proceeds of any incremental term loans (described below) or incremental revolving credit commitments (described below) to finance permitted acquisitions, to finance capital expenditures, to provide working capital and for other general corporate purposes.
In November 2015 we used the net cash proceeds from the initial closing of our sale of BBI Diagnostic Group Ltd., or the BBI business, to repay outstanding “A” term loans and “B” term loans under the secured credit facility in the aggregate principal amount of $115.0 million.
We must repay the “A” term loans in nineteen consecutive quarterly installments, which began on September 30, 2015 and continue through March 31, 2020, followed by a final installment on June 18, 2020; the principal amount of the installment we paid on September 30, 2015 was $8,125,000, and, giving effect to the prepayment of a portion of the “A” term loans in connection with our sale of the BBI business, the principal amount of each subsequent installment through March 31, 2020 is approximately $7,572,000, and the principal amount of the final installment is approximately $461,882,000. We must repay the “B” term loans in twenty-seven consecutive quarterly installments, which began on September 30, 2015 and continue through March 31, 2022, followed by a final installment on June 18, 2022; the principal amount of the installment we paid on September 30, 2015 was $2,625,000, and, giving effect to the prepayment of a portion of the “B” term loans in connection with our sale of the BBI business, the principal amount of each subsequent installment through March 31, 2022 is approximately $2,446,000, and the principal amount of the final installment is approximately $912,471,000. We may repay any borrowings under the secured credit facility revolving line of credit at any time (without premium or penalty, other than customary LIBOR breakage costs, if applicable), but in no event later than June 18, 2020.
We are required to make mandatory prepayments of the term loans and mandatory prepayments of any revolving credit loans in various amounts if we have Excess Cash Flow (as defined in the Credit Agreement, and commencing in respect of our fiscal year ending December 31, 2016), if we issue certain types of debt, if we make certain sales of assets outside the ordinary course of business above certain thresholds, or if we suffer certain property loss events above certain thresholds. We may make
F-39
Table of Contents
ALERE INC. AND SUBSIDIARIES
NOTES TO CONSOLIDATED FINANCIAL STATEMENTS (Continued)
(8) Long-term Debt (Continued)
optional prepayments of the term loans or the revolving credit loan from time to time without any premium or penalty (subject to payment of customary LIBOR breakage costs, if applicable).
The “A” term loans and any borrowings under the revolving credit facility bear interest at a rate per annum of, at our option, either (i) the Base Rate, as defined in the Credit Agreement, plus an applicable margin of 2.00%, or (ii) the Eurodollar Rate, as defined in the Credit Agreement, plus an applicable margin of 3.00%. The “B” term loans bear interest at a rate per annum of, at our option, either (i) the Base Rate plus an applicable margin of 2.00% or 2.25% depending on our consolidated secured net leverage ratio, or (ii) the Eurodollar Rate plus an applicable margin of 3.00% or 3.25% depending on our consolidated secured net leverage ratio. The base Eurodollar Rate is subject to a 1.00% floor with respect to “B” term loans based on such rate. We are required to pay a fee on the unused portion of the revolving credit facility at a rate per annum equal to 0.50%. As of December 31, 2015, the “A” term loans and the “B” term loans bore interest at 3.43% and 4.25%, respectively. As of December 31, 2015, there were no borrowings under the revolving line of credit under the secured credit facility.
Subject to our pro forma compliance with certain financial tests and certain other terms and conditions set forth in the Credit Agreement, we may request at any time that the lenders under the Credit Agreement and/or other financial institutions that become lenders thereunder make incremental term loans or provide incremental revolving credit commitments under the Credit Agreement in addition to the committed credit facilities described above, subject to our obtaining the agreement of the relevant new or existing lenders, as the case may be. The Credit Agreement also includes (i) certain provisions that allow us to add one or more new term loan facilities or new revolving credit facilities in order to refinance all or a portion of the term loans or revolving credit commitments and (ii) certain “amend and extend” provisions that allow us to extend the maturity date of any term loans or revolving credit commitments (and make related changes to the terms of the relevant loans), subject in each case to our obtaining the agreement of the relevant new or existing lenders, as the case may be.
We must comply with various financial and non-financial covenants under the terms of the secured credit facility, which are set forth in the Credit Agreement. The primary financial covenant under the security credit facility is a maximum consolidated secured net leverage ratio applicable only to the “A” term loans and the revolving credit loans. The non-financial covenants are subject to certain important exceptions and qualifications.
The lenders under the secured credit facility are entitled to accelerate repayment of the loans and terminate the revolving credit commitments thereunder upon the occurrence of any of various events of default as described in the Credit Agreement. The merger under the Merger Agreement described in Note 28 will, if consummated, constitute an event of default under the Credit Agreement.
Borrowings under the secured credit facility are guaranteed by substantially all of our domestic subsidiaries (other than unrestricted subsidiaries and domestic subsidiaries of certain of our foreign subsidiaries) and are secured by the stock of substantially all of our domestic subsidiaries (other than unrestricted subsidiaries and domestic subsidiaries of certain of our foreign subsidiaries), portions of the stock of certain of our foreign subsidiaries, and substantially all of our and our guarantor subsidiaries’ other property and assets, in each case subject to various exceptions.
As of December 31, 2015, aggregate borrowings under the secured credit facility amounted to $1.6 billion, consisting of “A” term loans in the aggregate outstanding principal amount of $587.7 million (giving effect to the installment repayment that was due on such date) and “B” term loans in the
F-40
Table of Contents
ALERE INC. AND SUBSIDIARIES
NOTES TO CONSOLIDATED FINANCIAL STATEMENTS (Continued)
(8) Long-term Debt (Continued)
aggregate outstanding principal amount of $971.2 million (giving effect to the installment repayment that was due on such date). As of December 31, 2015, we were in compliance with the maximum consolidated secured net leverage ratio under the secured credit facility.
As of December 31, 2015, accrued interest related to the secured credit facility amounted to $0.5 million.
See Note 28 for discussion of certain amendments and waivers entered into in April 2016 regarding our senior credit facility.
(b) Prior Credit Facility
In connection with our entry into the secured credit facility on June 18, 2015, we repaid in full all outstanding indebtedness under and terminated our prior senior credit agreement, or prior credit facility, dated as of June 30, 2011, as amended from time to time, with certain lenders, General Electric Capital Corporation as administrative agent and collateral agent, and certain other agents and arrangers, and certain related guaranty and security agreements. The aggregate outstanding principal amount of the loans repaid under our prior credit facility in connection with the termination thereof was approximately $1.65 billion. We assessed this repayment on a lender-by-lender basis in order to differentiate the portion constituting an extinguishment and the portion constituting a modification. Unamortized deferred financing fees relating to the extinguished portion of the prior credit facility debt were expensed, and the portion relating to modifications of the prior credit facility debt were carried forward to be amortized over the contractual life of the new secured credit facility.
(c) 6.375% Senior Subordinated Notes
On June 24, 2015, we sold a total of $425.0 million aggregate principal amount of 6.375% senior subordinated notes due 2023, or the 6.375% senior subordinated notes, in a private placement to initial purchasers, who agreed to resell the notes only to qualified institutional buyers and to persons outside the United States; we sold the 6.375% senior subordinated notes at an initial offering price of 100%. Net proceeds from this offering amounted to $417.3 million, which were net of the initial purchasers’ discount and offering expenses totaling approximately $7.7 million.
The 6.375% senior subordinated notes were issued under a supplemental indenture dated June 24, 2015, or the 6.375% Indenture. The 6.375% senior subordinated notes accrue interest at the rate of 6.375% per annum. Interest on the 6.375% senior subordinated notes is payable semi-annually on January 1 and July 1 of each year, beginning on January 1, 2016. The 6.375% senior subordinated notes mature on July 1, 2023, unless earlier redeemed.
We may, at our option, redeem the 6.375% senior subordinated notes, in whole or part, at any time (which may be more than once) on or after July 1, 2018 by paying the principal amount of the notes being redeemed plus a declining premium, plus accrued and unpaid interest to (but excluding) the redemption date. The premium declines from 4.781% during the twelve months on and after July 1, 2018, to 3.188% during the twelve months on and after July 1, 2019, to 1.594% during the twelve months on and after July 1, 2020, to zero on and after July 1, 2021. In addition, at any time (which may be more than once) prior to July 1, 2018, we may, at our option, redeem up to 35% of the aggregate principal amount of the 6.375% senior subordinated notes with money that we raise in certain qualifying equity offerings, so long as (i) we pay 106.375% of the principal amount of the notes being redeemed, plus accrued and unpaid interest to (but excluding) the redemption date; (ii) we redeem the 6.375% senior subordinated notes within 90 days of completing such equity offering; and (iii) at least
F-41
Table of Contents
ALERE INC. AND SUBSIDIARIES
NOTES TO CONSOLIDATED FINANCIAL STATEMENTS (Continued)
(8) Long-term Debt (Continued)
65% of the aggregate principal amount of the 6.375% senior subordinated notes remains outstanding afterwards. In addition, at any time (which may be more than once) prior to July 1, 2018, we may, at our option, redeem some or all of the 6.375% senior subordinated notes by paying the principal amount of the 6.375% senior subordinated notes being redeemed plus a make-whole premium, plus accrued and unpaid interest to (but excluding) the redemption date.
If a change of control occurs, subject to specified conditions, we must give holders of the 6.375% senior subordinated notes an opportunity to sell their notes to us at a purchase price of 101% of the principal amount of the notes, plus accrued and unpaid interest to (but excluding) the date of the purchase. The merger under the Merger Agreement described in Note 28 will, if consummated, constitute a change of control under the 6.375% Indenture.
If we or our restricted subsidiaries engage in asset sales, we or they generally must either invest the net cash proceeds from such sales in our or their businesses within a specified period of time, repay senior indebtedness or make an offer to purchase a principal amount of the 6.375% senior subordinated notes (on a pro rata basis with respect to the 6.375% senior subordinated notes and our 6.5% senior subordinated notes) equal to the excess net cash proceeds, subject to certain exceptions. The purchase price of the 6.375% senior subordinated notes would be 100% of their principal amount, plus accrued and unpaid interest.
The 6.375% Indenture provides that we and our restricted subsidiaries must comply with various covenants, which are subject to certain important exceptions and qualifications, which are set forth in the 6.375% Indenture. At any time the 6.375% senior subordinated notes are rated investment grade, certain covenants will be suspended with respect to them.
The 6.375% Indenture contains events of default entitling the trustee or the holders of the requisite percentage of the aggregate outstanding principal amount of the 6.375% senior subordinated notes to declare all amounts owed pursuant to the 6.375% senior subordinated notes immediately payable if any such event of default occurs.
The 6.375% senior subordinated notes are our senior subordinated unsecured obligations, are subordinated in right of payment to all of our existing and future senior debt, including our borrowings under our secured credit facility and our 7.25% senior notes, and are equal in right of payment with all of our existing and future senior subordinated debt, including our 6.5% senior subordinated notes. Our obligations under the 6.375% senior subordinated notes and the 6.375% Indenture are fully and unconditionally guaranteed, jointly and severally, on a senior subordinated unsecured basis by certain of our domestic subsidiaries, and the obligations of such domestic subsidiaries under their guarantees are subordinated in right of payment to all of their existing and future senior debt and equal in right of payment to all of their existing and future senior subordinated debt. See Note 27 for guarantor financial information.
As of December 31, 2015, accrued interest related to the 6.375% senior subordinated notes amounted to $14.1 million.
See Note 28 for discussion of certain consents and waivers that we obtained in May 2016 from holders of the 6.375% senior subordinated notes.
F-42
Table of Contents
ALERE INC. AND SUBSIDIARIES
NOTES TO CONSOLIDATED FINANCIAL STATEMENTS (Continued)
(8) Long-term Debt (Continued)
(d) 7.25% Senior Notes
On December 11, 2012, we sold a total of $450.0 million aggregate principal amount of 7.25% senior notes due 2018, or the 7.25% senior notes, in a private placement to initial purchasers, who agreed to resell the notes only to qualified institutional buyers and to persons outside the United States; we sold the 7.25% senior notes at an initial offering price of 100%. Net proceeds from this offering amounted to $443.2 million, which was net of the underwriters’ commissions and offering expenses totaling $6.8 million. These notes were subsequently exchanged for new notes having substantially the same terms in an exchange offer registered under the Securities Act. We used $267.4 million of the net proceeds to purchase $248.2 million outstanding principal amount of our former 7.875% senior notes due 2016, or the 7.875% senior notes, and $170.0 million to pay down a portion of the outstanding balance under the revolving line of credit under our prior credit facility.
The 7.25% senior notes were issued under a supplemental indenture dated as of August 11, 2009, as amended or supplemented, or the 7.25% Indenture. The 7.25% senior notes accrue interest at the rate of 7.25% per annum. Interest on the 7.25% senior notes is payable semi-annually on June 15 and December 15, beginning on June 15, 2013. The 7.25% senior notes mature on July 1, 2018, unless earlier redeemed.
We may redeem the 7.25% senior notes, in whole or part, at any time by paying the principal amount of the notes being redeemed plus a declining premium, plus accrued and unpaid interest to, but excluding, the redemption date. The premium declines from 3.625% during the twelve months on and after December 15, 2015 to 1.813% during the six months on and after December 15, 2016 to zero on and after June 15, 2017.
If a change of control occurs, subject to specified conditions, we must give holders of the 7.25% senior notes an opportunity to sell their notes to us at a purchase price of 101% of the principal amount of the notes, plus accrued and unpaid interest to (but excluding) the date of the purchase. The merger under the Merger Agreement described in Note 28 will, if consummated, constitute a change of control under the 7.25% Indenture.
If we, or our subsidiaries, engage in asset sales, we, or they, generally must either invest the net cash proceeds from such sales in our or their businesses within a specified period of time, prepay certain indebtedness or make an offer to purchase a principal amount of the 7.25% senior notes equal to the excess net cash proceeds, subject to certain exceptions. The purchase price of the notes would be 100% of their principal amount, plus accrued and unpaid interest.
The 7.25% Indenture provides that we and our subsidiaries must comply with various customary covenants, which are subject to certain important exceptions and qualifications, which are set forth in the 7.25% Indenture. At any time the 7.25% senior notes are rated investment grade, certain covenants will be suspended with respect to them.
The 7.25% Indenture contains customary events of default entitling the trustee or the holders of the requisite percentage of the aggregate outstanding principal amount of the 7.25% senior notes to declare all amounts owed pursuant to the 7.25% senior notes immediately payable if any such event of default occurs.
The 7.25% senior notes are our senior unsecured obligations, are senior in right of payment to all of our existing and future subordinated debt, including our 6.375% senior subordinated notes and our 6.5% senior subordinated notes, and are equal in right of payment to all of our existing and future senior debt, including our borrowings under our secured credit facility. Our obligations under the 7.25%
F-43
Table of Contents
ALERE INC. AND SUBSIDIARIES
NOTES TO CONSOLIDATED FINANCIAL STATEMENTS (Continued)
(8) Long-term Debt (Continued)
senior notes and the 7.25% Indenture are fully and unconditionally guaranteed, jointly and severally, on an unsecured senior basis by certain of our domestic subsidiaries, and the obligations of such domestic subsidiaries under their guarantees are equal in right of payment to all of their existing and future senior debt and senior in right of payment to all of their existing and future subordinated debt. See Note 27 for guarantor financial information.
As of December 31, 2015, accrued interest related to the 7.25% senior notes amounted to $1.4 million.
See Note 28 for discussion of certain consents and waivers that we obtained in May 2016 from holders of the 7.25% senior notes.
(e) 7.875% Senior Notes
In February 2013, we redeemed the remaining $1.8 million outstanding principal amount of the 7.875% senior notes, and we subsequently terminated the related indenture.
(f) 6.5% Senior Subordinated Notes
In May 2013, we sold a total of $425.0 million aggregate principal amount of 6.5% senior subordinated notes due 2020, or the 6.5% senior subordinated notes, in a private placement to initial purchasers, who agreed to resell the notes only to qualified institutional buyers and to persons outside the United States. We sold the 6.5% senior subordinated notes at an initial offering price of 100%. Net proceeds from this offering amounted to $417.7 million, which were net of the underwriters’ commissions and offering expenses totaling approximately $7.3 million. These notes were subsequently exchanged for new notes having substantially the same terms in an exchange offer registered under the Securities Act. In May 2013, we used $200.6 million of the net proceeds of our sale of the 6.5% senior subordinated notes to purchase $190.6 million outstanding principal amount of our former 9% senior subordinated notes, or the 9% senior subordinated notes. In June 2013, we redeemed the remaining $209.4 million outstanding principal amount of the 9% senior subordinated notes.
The 6.5% senior subordinated notes were issued under a supplemental indenture dated as of May 24, 2013, or the 6.5% Indenture. The 6.5% senior subordinated notes accrue interest at the rate of 6.5% per annum. Interest on the 6.5% senior subordinated notes is payable semi-annually on June 15 and December 15, beginning on December 15, 2013. The 6.5% senior subordinated notes mature on June 15, 2020, unless earlier redeemed.
We may, at our option, redeem the 6.5% senior subordinated notes, in whole or part, at any time (which may be more than once) on or after June 15, 2016, by paying the principal amount of the notes being redeemed plus a declining premium, plus accrued and unpaid interest to (but excluding) the redemption date. The premium declines from 3.250% during the twelve months on and after June 15, 2016 to 1.625% during the twelve months on and after June 15, 2017 to zero on and after June 15, 2018. In addition, at any time (which may be more than once) prior to June 15, 2016, we may, at our option, redeem up to 35% of the aggregate principal amount of the 6.5% senior subordinated notes with money that we raise in certain equity offerings, so long as (i) we pay 106.5% of the principal amount of the notes being redeemed, plus accrued and unpaid interest to (but excluding) the redemption date; (ii) we redeem the 6.5% senior subordinated notes within 90 days of completing such equity offering; and (iii) at least 65% of the aggregate principal amount of the 6.5% senior subordinated
F-44
Table of Contents
ALERE INC. AND SUBSIDIARIES
NOTES TO CONSOLIDATED FINANCIAL STATEMENTS (Continued)
(8) Long-term Debt (Continued)
notes remains outstanding afterwards. In addition, at any time (which may be more than once) prior to June 15, 2016, we may, at our option, redeem some or all of the 6.5% senior subordinated notes by paying the principal amount of the 6.5% senior subordinated notes being redeemed plus a make-whole premium, plus accrued and unpaid interest to (but excluding) the redemption date.
If a change of control occurs, subject to specified conditions, we must give holders of the 6.5% senior subordinated notes an opportunity to sell their notes to us at a purchase price of 101% of the principal amount of the notes, plus accrued and unpaid interest to (but excluding) the date of the purchase. The merger under the Merger Agreement described in Note 28 will, if consummated, constitute a change of control under the 6.5% Indenture.
If we or our subsidiaries engage in asset sales, we or they generally must either invest the net cash proceeds from such sales in our or their businesses within a specified period of time, repay senior indebtedness or make an offer to purchase a principal amount of the 6.5% senior subordinated notes (on a pro rata basis with respect to the 6.5% senior subordinated notes and our 6.375% senior subordinated notes) equal to the excess net cash proceeds, subject to certain exceptions. The purchase price of the 6.5% senior subordinated notes would be 100% of their principal amount, plus accrued and unpaid interest.
The 6.5% Indenture provides that we and our subsidiaries must comply with various customary covenants, which are subject to certain important exceptions and qualifications, which are set forth in the 6.5% Indenture. At any time the 6.5% senior subordinated notes are rated investment grade, certain covenants will be suspended with respect to them.
The 6.5% Indenture contains customary events of default entitling the trustee or the holders of the requisite percentage of the aggregate outstanding principal amount of the 6.5% senior subordinated notes to declare all amounts owed pursuant to the 6.5% senior subordinated notes immediately payable if any such event of default occurs.
The 6.5% senior subordinated notes are our senior subordinated unsecured obligations, are subordinated in right of payment to all of our existing and future senior debt, including our borrowings under our secured credit facility and our 7.25% senior notes, and are equal in right of payment with our 6.375% senior subordinated notes. Our obligations under the 6.5% senior subordinated notes and the 6.5% Indenture are fully and unconditionally guaranteed, jointly and severally, on a senior subordinated unsecured basis by certain of our domestic subsidiaries, and the obligations of such domestic subsidiaries under their guarantees are subordinated in right of payment to all of their existing and future senior debt and equal in right of payment to all of their existing and future senior subordinated debt. See Note 27 for guarantor financial information.
As of December 31, 2015, accrued interest related to the 6.5% senior subordinated notes amounted to $1.3 million.
See note 28 for discussion of certain consents and waivers that we obtained in May 2016 from holders of the 6.5% senior subordinated notes.
(g) 8.625% Senior Subordinated Notes
On June 24, 2015, we issued a notice of optional redemption to the holders of our 8.625% senior subordinated notes due 2018, or the 8.625% senior subordinated notes, that, on October 1, 2015 (the redemption date), we would redeem the entire principal amount of the 8.625% senior subordinated
F-45
Table of Contents
ALERE INC. AND SUBSIDIARIES
NOTES TO CONSOLIDATED FINANCIAL STATEMENTS (Continued)
(8) Long-term Debt (Continued)
notes then outstanding at a redemption price equal to 102.156% of the principal amount of the 8.625% senior subordinated notes to be redeemed plus accrued and unpaid interest from April 1, 2015 to (but excluding) the redemption date, upon the terms set forth in the notice of optional redemption. We transferred an amount equal to the net proceeds received from the 6.375% notes of $417.3 million plus additional cash of $8.6 million, or a total of $425.9 million, into an irrevocable trust, which was used to fund the redemption of the 8.625% senior subordinated notes on October 1, 2015. We redeemed the entire $400.0 million aggregate principal amount of the 8.625% senior subordinated notes on October 1, 2015 and, upon settlement of the redemption on that date, we satisfied and discharged all of our obligations with respect to the 8.625% senior subordinated notes. In connection with the redemption of these notes, we incurred extinguishment costs in the amount of $19.9 million. Included in the $19.9 million is $8.6 million related to the call premium.
(i) 3% Convertible Senior Subordinated Notes
On May 14, 2007, we sold a total of $150.0 million aggregate principal amount of 3% convertible senior subordinated notes due 2016, or the 3% convertible senior subordinated notes. The 3% convertible senior subordinated notes matured on May 15, 2016, and we paid $152.0 million in cash (consisting of $125.0 million in cash drawn under our revolving credit facility plus $27.0 million of available cash) to pay all outstanding principal and accrued interest owing under these notes, and we thereupon satisfied and discharged all of our obligations with respect to these notes. Before their repayment at maturity, interest accrued at 3% per annum on the outstanding principal amount of the 3% convertible senior subordinated notes and was payable in arrears on May 15th and November 15th of each year. Before their repayment at maturity, the 3% convertible senior subordinated notes were unsecured and were subordinated in right of payment to all of our existing and future senior debt, including borrowings under our secured credit facility and our 7.25% senior notes, and equal in right of payment to our 6.5% senior subordinated notes and our 6.375% senior subordinated notes.
As of December 31, 2015, accrued interest related to the 3% convertible senior subordinated notes amounted to $0.6 million.
(j) Lines of Credit
Some of our subsidiaries maintain local lines of credit for short-term advances. Total available credit under the local lines of credit as of December 31, 2015 is approximately $14.1 million, of which $0.1 million was borrowed and outstanding as of that date.
(k) Other Debt
In September 2015, Alere Switzerland GmbH entered into a secured credit facility with The Hong Kong and Shanghai Banking Corporation Limited, Singapore Branch, or HSBC, in a principal amount of $40.0 million. The facility is fully drawn and has a maturity of 2 years. The facility is ultimately secured by local currency cash deposited by our subsidiary Alere (Shanghai) Medical Sales Co., Ltd. with an affiliate of HSBC in China and has an interest rate equal to the applicable LIBOR rate plus a margin of 0.8%.
Included in other debt as of December 31, 2015 are borrowings by certain of our subsidiaries from various financial institutions. The borrowed funds are primarily used to fund capital expenditures and working capital requirements. Interest expense on these borrowings was $1.8 million for 2015.
F-46
Table of Contents
ALERE INC. AND SUBSIDIARIES
NOTES TO CONSOLIDATED FINANCIAL STATEMENTS (Continued)
(8) Long-term Debt (Continued)
(l) Maturities of Long-term Debt
The following is a summary of the maturities of long-term debt, including the current portions thereof, outstanding on December 31, 2015 (in thousands):
| 2016 |
$ | 199,992 | ||
| 2017 |
81,369 | |||
| 2018 |
491,358 | |||
| 2019 |
41,329 | |||
| 2020 |
905,417 | |||
| Thereafter |
1,351,123 | |||
|
|
|
|||
| 3,070,588 | ||||
| Less: Original issue discounts |
(5,380 | ) | ||
|
|
|
|||
| $ | 3,065,208 | |||
|
|
|
F-47
Table of Contents
ALERE INC. AND SUBSIDIARIES
NOTES TO CONSOLIDATED FINANCIAL STATEMENTS (Continued)
(9) Fair Value Measurements
We apply fair value measurement accounting to value our financial assets and liabilities. Fair value measurement accounting provides a framework for measuring fair value under U.S. GAAP and requires expanded disclosures regarding fair value measurements. Fair value is defined as the exchange price that would be received for an asset or paid to transfer a liability (an exit price) in the principal or most advantageous market for the asset or liability in an orderly transaction between market participants on the measurement date. A fair value hierarchy requires an entity to maximize the use of observable inputs, where available, and minimize the use of unobservable inputs when measuring fair value.
The following tables present information about our assets and liabilities that are measured at fair value on a recurring basis as of December 31, 2015 and 2014, and indicates the fair value hierarchy of the valuation techniques we utilized to determine such fair value (in thousands):
| Description |
December 31, 2015 |
Quoted Prices in Active Markets (Level 1) |
Significant Other Observable Inputs (Level 2) |
Unobservable Inputs (Level 3) |
||||||||||||
| Assets: |
||||||||||||||||
| Marketable securities |
$ | 164 | $ | 164 | $ | — | $ | — | ||||||||
|
|
|
|
|
|
|
|
|
|||||||||
| Total assets |
$ | 164 | $ | 164 | $ | — | $ | — | ||||||||
|
|
|
|
|
|
|
|
|
|||||||||
| Liabilities: |
||||||||||||||||
| Contingent consideration obligations(1) |
$ | 57,744 | $ | — | $ | — | $ | 57,744 | ||||||||
|
|
|
|
|
|
|
|
|
|||||||||
| Total liabilities |
$ | 57,744 | $ | — | $ | — | $ | 57,744 | ||||||||
|
|
|
|
|
|
|
|
|
|||||||||
| Description |
December 31, 2014 |
Quoted Prices in Active Markets (Level 1) |
Significant Other Observable Inputs (Level 2) |
Unobservable Inputs (Level 3) |
||||||||||||
| Assets: |
||||||||||||||||
| Marketable securities |
$ | 259 | $ | 259 | $ | — | $ | — | ||||||||
|
|
|
|
|
|
|
|
|
|||||||||
| Total assets |
$ | 259 | $ | 259 | $ | — | $ | — | ||||||||
|
|
|
|
|
|
|
|
|
|||||||||
| Liabilities: |
||||||||||||||||
| Contingent consideration obligations(1) |
$ | 139,671 | $ | — | $ | — | $ | 139,671 | ||||||||
|
|
|
|
|
|
|
|
|
|||||||||
| Total liabilities |
$ | 139,671 | $ | — | $ | — | $ | 139,671 | ||||||||
|
|
|
|
|
|
|
|
|
|||||||||
| (1) | We determine the fair value of the contingent consideration obligations based on a probability-weighted approach derived from earn-out criteria estimates and a probability assessment with respect to the likelihood of achieving the various earn-out criteria. The measurement is based upon significant inputs not observable in the market. Significant increases or decreases in any of these inputs could result in a significantly higher or lower fair value measurement. Changes in the fair value of these contingent consideration obligations are recorded as income or expense within operating income in our consolidated statements of operations. See Note 12 for additional information on the valuation of our contingent consideration obligations. |
F-48
Table of Contents
ALERE INC. AND SUBSIDIARIES
NOTES TO CONSOLIDATED FINANCIAL STATEMENTS (Continued)
(9) Fair Value Measurements (Continued)
Changes in the fair value of our Level 3 contingent consideration obligations during the years ended December 31, 2015 and 2014 were as follows (in thousands):
| Fair value of contingent consideration obligations, December 31, 2013 |
$ | 218,569 | ||
| Payments |
(60,019 | ) | ||
| Fair value adjustments |
7,677 | |||
| Reversal of Method Factory Inc., now known as ACS obligation(1) |
(26,321 | ) | ||
| Foreign currency adjustments |
(235 | ) | ||
|
|
|
|||
| Fair value of contingent consideration obligations, December 31, 2014 |
$ | 139,671 | ||
| Payments |
(22,073 | ) | ||
| Fair value adjustments |
(59,871 | ) | ||
| Foreign currency adjustments |
17 | |||
|
|
|
|||
| Fair value of contingent consideration obligations, December 31, 2015 |
$ | 57,744 | ||
|
|
|
| 1) | ACS was divested in October 2014 and, in connection with this transaction, the contingent consideration obligation was terminated. |
At December 31, 2015 and 2014, the carrying amounts of cash and cash equivalents, restricted cash, receivables, accounts payable and other current liabilities approximated their estimated fair values.
The carrying amount and estimated fair value of our long-term debt were $3.1 billion and $3.0 billion, respectively, at December 31, 2015. The carrying amount and estimated fair value of our long-term debt were both $3.7 billion at December 31, 2014. The estimated fair value of our long-term debt was determined using information derived from available market sources (Level 2 in the fair value hierarchy) and may not be representative of actual values that could have been or will be realized in the future.
(10) Capital Leases
The following is a schedule of the future minimum lease payments under capital leases, together with the present value of such payments as of December 31, 2015 (in thousands):
| 2016 |
$ | 3,962 | ||
| 2017 |
2,050 | |||
| 2018 |
1,491 | |||
| 2019 |
2,289 | |||
| 2020 |
712 | |||
| Thereafter |
639 | |||
|
|
|
|||
| Total future minimum lease payments |
11,143 | |||
| Less: Imputed interest |
— | |||
|
|
|
|||
| Present value of future minimum lease payments |
11,143 | |||
| Less: Current portion |
(3,962 | ) | ||
|
|
|
|||
| $ | 7,181 | |||
|
|
|
F-49
Table of Contents
ALERE INC. AND SUBSIDIARIES
NOTES TO CONSOLIDATED FINANCIAL STATEMENTS (Continued)
(10) Capital Leases (Continued)
At December 31, 2015, the capitalized amounts of the building, machinery and equipment and computer equipment under capital leases were as follows (in thousands):
| Machinery, laboratory equipment and tooling |
$ | 24,258 | ||
| Computer equipment |
888 | |||
| Furniture and fixtures |
606 | |||
| Vehicles |
197 | |||
| Leasehold improvements |
927 | |||
|
|
|
|||
| 26,876 | ||||
| Less: Accumulated amortization |
(9,214 | ) | ||
|
|
|
|||
| $ | 17,662 | |||
|
|
|
The amortization expense of assets recorded under capital leases is included in depreciation and amortization expense of property, plant and equipment.
(11) Postretirement Benefit Plans
(a) Employee Savings Plans
Our company and several of our U.S.-based subsidiaries sponsor various 401(k) savings plans, to which eligible domestic employees may voluntarily contribute a portion of their income, subject to statutory limitations. In addition to the participants’ own contributions to these 401(k) savings plans, we match such contributions up to a designated level. Total matching contributions related to employee savings plans were $5.8 million, $9.2 million and $9.4 million in 2015, 2014 and 2013, respectively.
(b) U.K. Pension Plans
Our subsidiary in England, Unipath Ltd., or Unipath, has a defined benefit pension plan established for certain of its employees.
Changes in benefit obligations, plan assets, funded status and amounts recognized on the accompanying balance sheet as of and for the years ended December 31, 2015 and 2014, for our Defined Benefit Plan were as follows (in thousands):
| 2015 | 2014 | |||||||
| Change in projected benefit obligation |
||||||||
| Benefit obligation at beginning of year |
$ | 22,560 | $ | 21,572 | ||||
| Interest cost |
784 | 938 | ||||||
| Actuarial (gain) loss |
(638 | ) | 1,830 | |||||
| Benefits paid |
(179 | ) | (300 | ) | ||||
| Foreign exchange impact |
(1,028 | ) | (1,480 | ) | ||||
|
|
|
|
|
|||||
| Benefit obligation at end of year |
$ | 21,499 | $ | 22,560 | ||||
|
|
|
|
|
|||||
| Change in plan assets |
||||||||
| Fair value of plan assets at beginning of year |
$ | 18,120 | $ | 17,226 | ||||
| Actual return on plan assets |
491 | 1,429 | ||||||
| Employer contribution |
917 | 953 | ||||||
| Benefits paid |
(179 | ) | (300 | ) | ||||
| Foreign exchange impact |
(864 | ) | (1,188 | ) | ||||
|
|
|
|
|
|||||
| Fair value of plan assets at end of year |
$ | 18,485 | $ | 18,120 | ||||
|
|
|
|
|
|||||
| Funded status |
$ | (3,014 | ) | $ | (4,440 | ) | ||
|
|
|
|
|
|||||
| Accumulated benefit obligation |
$ | 21,499 | $ | 22,560 | ||||
|
|
|
|
|
|||||
F-50
Table of Contents
ALERE INC. AND SUBSIDIARIES
NOTES TO CONSOLIDATED FINANCIAL STATEMENTS (Continued)
(11) Postretirement Benefit Plans (Continued)
The net amounts recognized in the accompanying consolidated balance sheets are shown in long-term liabilities and were $3.0 million and $4.4 million, respectively, at December 31, 2015 and 2014.
The following represents the amounts recognized in other comprehensive loss for the year ended December 31, 2015 and 2014 (in thousands):
| 2015 | 2014 | |||||||
| Amortization of net loss |
$ | (332 | ) | $ | (267 | ) | ||
| Amortization of prior service cost |
(310 | ) | (438 | ) | ||||
| New actuarial loss |
(55 | ) | (1,423 | ) | ||||
| Foreign exchange impact |
(1,134 | ) | 2,230 | |||||
|
|
|
|
|
|||||
| Total |
$ | (1,831 | ) | $ | 102 | |||
|
|
|
|
|
|||||
As of December 31, 2015, the amortization of prior service cost is expected to be approximately $0.3 million in 2016.
Amounts recognized in accumulated other comprehensive loss for the years ending December 31, 2015 and 2014 are as follows:
| 2015 | 2014 | |||||||
| Net actuarial loss |
$ | 5,109 | $ | 5,635 | ||||
| Prior service cost |
2,412 | 3,718 | ||||||
|
|
|
|
|
|||||
| Net amount recognized |
$ | 7,521 | $ | 9,353 | ||||
|
|
|
|
|
|||||
The measurement dates used to determine plan assets and benefit obligations for the Defined Benefit Plan were December 31, 2015 and 2014.
The following table provides the weighted-average actuarial assumptions:
| 2015 | 2014 | |||||||
| Assumptions used to determine benefit obligations(1): |
||||||||
| Discount rate |
3.70 | % | 3.55 | % | ||||
| Rate of compensation increase |
3.95 | % | 3.85 | % | ||||
| Assumptions used to determine net periodic benefit cost(2): |
||||||||
| Discount rate |
3.55 | % | 4.40 | % | ||||
| Expected long-term return on plan assets |
6.50 | % | 5.95 | % | ||||
| Rate of compensation increase |
3.85 | % | 4.15 | % | ||||
| (1) | The actuarial assumptions used to compute the unfunded status for the plan are based upon information available as of December 31, 2015 and 2014. |
| (2) | The actuarial assumptions used to compute the net periodic pension benefit cost are based upon the information available as of the beginning of the presented year. |
The actuarial assumptions are reviewed on an annual basis. The overall expected long-term rate of return on plan assets assumption was determined based on historical investment return rates on portfolios with a high proportion of equity securities, and was calculated using a weighted-average of the expected returns for each asset class held by the Plan. The long-term expected return on assets is net of investment expenses.
F-51
Table of Contents
ALERE INC. AND SUBSIDIARIES
NOTES TO CONSOLIDATED FINANCIAL STATEMENTS (Continued)
(11) Postretirement Benefit Plans (Continued)
The annual net periodic benefit costs of the Defined Benefit Plan are as follows (in thousands):
| 2015 | 2014 | 2013 | ||||||||||
| Service cost |
$ | — | $ | — | $ | — | ||||||
| Interest cost |
784 | 938 | 754 | |||||||||
| Expected return on plan assets |
(1,183 | ) | (1,022 | ) | (713 | ) | ||||||
| Amortization of net loss |
332 | 267 | 199 | |||||||||
| Amortization of prior service cost |
310 | 438 | 416 | |||||||||
|
|
|
|
|
|
|
|||||||
| Net periodic benefit cost |
$ | 243 | $ | 621 | $ | 656 | ||||||
|
|
|
|
|
|
|
|||||||
The plan assets of the Defined Benefit Plan comprise a mix of stocks and fixed income securities and other investments. At December 31, 2015, these stocks and fixed income securities represented 73% and 27%, respectively, of the market value of the pension assets. We expect to contribute approximately £0.6 million (or $0.9 million at December 31, 2015) to the Defined Benefit Plan in 2016. We expect that the benefits to be paid to plan participants will range between approximately $0.3 million and $0.4 million per year for each of the next five years and that benefits totaling $0.5 million will be paid annually for the five years thereafter.
Our overall investment strategy is to ensure the investments are spread across a range of investments varying by both investment class and geographical location which is achieved by investing largely in equity and fixed income funds. Spreading the investments in this manner reduces the risk of a decline in a particular market having a substantial impact on the whole fund. The target allocation for the plan assets is a 70% holding in equities (both in the U.K. and overseas), with the remaining assets invested in investment grade corporate bonds.
The fair values of our pension plan assets at December 31, 2015 and 2014 by asset category are presented in the following table (Level 2 in the fair value hierarchy).
| Plan Assets at December 31, |
||||||||
| Asset Category |
2015 | 2014 | ||||||
| Equity securities: |
||||||||
| U.K. equities |
$ | 6,096 | $ | 6,136 | ||||
| Overseas equities |
3,119 | 3,105 | ||||||
| U.S. equities |
3,781 | 3,631 | ||||||
| Debt securities — corporate bonds |
4,984 | 5,048 | ||||||
| Other — cash |
505 | 200 | ||||||
|
|
|
|
|
|||||
| Total plan assets |
$ | 18,485 | $ | 18,120 | ||||
|
|
|
|
|
|||||
The table above presents the fair value of our plan’s assets in accordance with the fair value hierarchy. The pension plan assets are measured using net asset value per share (or its equivalent) and are reported as a Level 2 investment above due to our ability to redeem the investment either at the balance sheet date or within limited time restrictions.
Unipath contributed $0.3 million in 2015, $0.4 million in 2014 and $0.3 million in 2013 to the Defined Contribution Plan, which was recognized as an expense in the accompanying consolidated statement of operations.
F-52
Table of Contents
ALERE INC. AND SUBSIDIARIES
NOTES TO CONSOLIDATED FINANCIAL STATEMENTS (Continued)
(12) Commitments and Contingencies
(a) Operating Leases
We have operating lease commitments for certain of our facilities and equipment that expire on various dates through 2028. The following schedule outlines future minimum annual rental payments under these leases at December 31, 2015 (in thousands):
| 2016 |
$ | 33,436 | ||
| 2017 |
28,590 | |||
| 2018 |
22,008 | |||
| 2019 |
15,978 | |||
| 2020 |
11,573 | |||
| Thereafter |
20,134 | |||
|
|
|
|||
| $ | 131,719 | |||
|
|
|
Rent expense relating to operating leases was approximately $41.8 million, $48.4 million and $46.0 million during 2015, 2014 and 2013, respectively. The $2.4 million increase in rent expense from 2013 to 2014 was the result of new leases entered into during the year. The primary drivers of the $6.6 million decrease in rent expense from 2014 to 2015 was the impact of currency exchange rates and divestitures.
(b) Acquisition-related Contingent Consideration Obligations
We have contractual contingent purchase price consideration obligations related to certain of our acquisitions. We determine the acquisition date fair value of the contingent consideration obligations based on a probability-weighted approach derived from the overall likelihood of achieving certain performance targets, including product development milestones or financial metrics. The fair value measurement is based on significant inputs not observable in the market and thus represents a Level 3 measurement, as defined in fair value measurement accounting. The resultant probability-weighted earn-out payments are discounted using a discount rate based upon the weighted-average cost of capital. At each reporting date, we revalue the contingent consideration obligations to the reporting date fair values and record increases and decreases in the fair values as income or expense in our consolidated statements of operations.
Increases or decreases in the fair values of the contingent consideration obligations may result from changes in discount periods and rates, changes in the timing and amount of earn-out criteria and changes in probability assumptions with respect to the likelihood of achieving the various earn-out criteria.
During 2015, we revised the fair value estimates for the milestones related to the TwistDx, Inc. contingent consideration obligation to reflect increased probabilities of success as a result of positive technological developments and regulatory approvals of certain related platforms. Accordingly, we recorded a charge associated with the resulting change in fair value of $12.1 million, which is included in general and administrative expense in our consolidated statement of operations.
During 2015, we revised the fair value estimates for certain of the milestones related to the Epocal contingent consideration obligation to reflect decreased probabilities of success and delayed cash inflows and clinical development timelines due to a strategic shift and re-allocation of research and development resources. As a result, we recorded a net reduction to expense during 2015 of $32.5 million, which is included in general and administrative expense in our consolidated statement of
F-53
Table of Contents
ALERE INC. AND SUBSIDIARIES
NOTES TO CONSOLIDATED FINANCIAL STATEMENTS (Continued)
(12) Commitments and Contingencies (Continued)
operations. Additionally, one milestone was achieved during 2015, resulting in a cash payment of $10.0 million during the year.
Furthermore, during 2015, we recorded a reduction to expense of $24.5 million associated with a change in the fair value of our Ionian contingent consideration obligation to zero, which is included in general and administrative expense in our accompanying consolidated statement of operations. The remaining product development milestones under the agreement were not achieved by the July 2015 deadline and, as such, the probability of making the related milestone payments was reduced to zero.
The following table summarizes our contractual contingent purchase price consideration obligations related to certain of our acquisitions, as follows (in thousands):
| Acquisition |
Acquisition Date | Acquisition Date Fair Value |
Maximum Remaining Earn-out Potential as of December 31, 2015 |
Remaining Earn-out Period as of December 31, 2015 |
Estimated Fair Value as of December 31, 2015 |
Estimated Fair Value as of December 31, 2014 |
Payments made during 2015 |
|||||||||||||||||||||
| TwistDx, Inc.(1) |
March 11, 2010 | $ | 35,600 | $ | 103,247 | 2016 – 2025 | (5) | $ | 47,800 | $ | 41,100 | $ | 5,377 | |||||||||||||||
| Ionian Technologies, Inc.(2) |
July 12, 2010 | $ | 24,500 | $ | — | — | — | 24,500 | — | |||||||||||||||||||
| DiagnosisOne, Inc.(3) |
July 31, 2012 | $ | 22,300 | $ | — | — | — | 21,000 | 6,000 | |||||||||||||||||||
| Epocal(4) |
February 1, 2013 | $ | 75,000 | $ | 47,950 | 2016 – 2018 | 4,700 | 47,200 | 10,000 | |||||||||||||||||||
| Other |
Various | $ | 30,373 | $ | — | (6) | 2016 | 5,244 | 5,871 | 696 | ||||||||||||||||||
|
|
|
|
|
|
|
|||||||||||||||||||||||
| $ | 57,744 | $ | 139,671 | $ | 22,073 | |||||||||||||||||||||||
|
|
|
|
|
|
|
|||||||||||||||||||||||
| (1) | The terms of the acquisition agreement require us to pay an earn-out upon successfully meeting certain revenue and product development targets through 2025. |
| (2) | The earn-out period under the terms of the acquisition agreement expired on July 12, 2015. In December 2015, we entered into an amended agreement with the former shareholders of Ionian Technologies, Inc., whereby we could be required to make milestone payments to them of up to approximately $43.8 million. Because this amendment was entered into after the earn-out period of the acquisition agreement had lapsed, it will be accounted for under ASC 450, Contingencies, and milestones will be expensed when they are deemed probable of occurring. Payments in connection with this program become due and payable upon the successful achievement of certain milestones. Because the achievement of these milestones was not probable as of December 31, 2015, we have not recorded an accrual for these contingent milestones in our financial statements. |
| (3) | On March 25, 2015, the remaining earn-out was settled for $6.0 million, of which $4.5 million was paid on March 27, 2015 and $1.5 million was paid on April 3, 2015. |
| (4) | The terms of the acquisition agreement require us to pay earn-outs and management incentive payments upon successfully meeting certain product development and United States Food and Drug Administration regulatory approval milestones from the date of acquisition through December 31, 2018. |
| (5) | The maximum earn-out period ends on the fifteenth anniversary of the acquisition date. |
| (6) | The maximum remaining earn-out potential for the other acquisitions is not determinable due to the nature of one of the earn-outs, which is tied to an unlimited revenue metric. |
F-54
Table of Contents
ALERE INC. AND SUBSIDIARIES
NOTES TO CONSOLIDATED FINANCIAL STATEMENTS (Continued)
(12) Commitments and Contingencies (Continued)
(c) Legal Proceedings
U.S. Securities and Exchange Commission Subpoena
On August 28, 2015, we received a subpoena from the SEC which indicated that it is conducting a formal investigation of Alere. The SEC’s subpoena relates to, among other things, (i) our previously filed restatement and revision to our financial statements, including the accounting for deferred taxes for discontinued operations, as well as our tax strategies and policies and (ii) our sales practices and dealings with third parties (including distributors and foreign government officials) in Africa relating to sales to government entities. On January 14, 2016, we received a second subpoena from the SEC in connection with this formal investigation seeking, among other things, additional information related to sales of products and services to end-users in Africa, as well as revenue recognition relating to sales of products and services to end-users in Africa. We have also received, from time to time, requests in connection with the investigation to voluntarily produce additional information to the SEC, including information pertaining to certain other countries in Asia and Latin America.
We are cooperating with the SEC and have provided documents in response to the subpoenas and voluntary requests. We are unable to predict when this matter will be resolved or what further action, if any, the SEC may take in connection with it.
Department of Justice Grand Jury Subpoena
On March 11, 2016, we received a grand jury subpoena from the United States Department of Justice requiring the production of documents relating to, among other things, sales, sales practices and dealings with third parties (including distributors and foreign governmental officials) in Africa, Asia and Latin America and other matters related to the U.S. Foreign Corrupt Practices Act.
We are cooperating with the Department of Justice and have provided information in response to the subpoena. We are unable to predict when this matter will be resolved or what further action, if any, the Department of Justice may take in connection with it.
Securities Class Actions
On April 21, 2016, a class action lawsuit captioned Godinez v. Alere Inc., was filed against us in the United States District Court for the District of Massachusetts. On May 4, 2016, a second class action lawsuit captioned Breton v. Alere Inc., was filed against us in the United States District Court for the District of Massachusetts. Both of these class actions purport to assert claims against us and certain current and former officers for alleged violations of Section 10(b) and Section 20(a) of the Exchange Act and Rule 10b-5 under the Exchange Act. Each plaintiff seeks to represent a proposed class of all persons who purchased or otherwise acquired our common stock during the period May 9, 2013 through April 20, 2016. Each complaint seeks damages allegedly caused by alleged materially misleading statements and/or material omissions by us and the officers regarding our business, prospects and operations, each plaintiff claims, which allegedly operated to inflate artificially the price paid for our common stock during the class period. Each complaint seeks unspecified compensatory damages, attorneys’ fees and costs. On July 11, 2016, the court entered an order consolidating the two actions and appointing lead plaintiffs and lead counsel, and on July 19, 2016, the court ordered a schedule for the filing of a consolidated amended complaint and for the motion to dismiss briefing.
We are unable at this time to determine the outcome of this class action lawsuit or our potential liability, if any.
F-55
Table of Contents
ALERE INC. AND SUBSIDIARIES
NOTES TO CONSOLIDATED FINANCIAL STATEMENTS (Continued)
(12) Commitments and Contingencies (Continued)
Matters Relating to our San Diego Facility
On October 9, 2012, we received a warning letter from the FDA referencing inspectional observations set forth in a Form FDA 483 received in June 2012. The observations were the result of an inspection of our San Diego facility conducted earlier during 2012 relating to our Alere Triage products, which resulted in two recalls of certain Alere Triage products and revised release specifications for our Alere Triage meter-based products. In September 2014, as follow up to a further inspection of our San Diego facility, the FDA notified us that this inspection was classified “voluntary action indicated,” meaning that the objectionable conditions or practices found in the inspection did not meet the threshold of significance requiring regulatory action, but that formal close-out of the October 2012 Warning Letter could not occur until after a future inspection.
In May 2012, we also received a subpoena from the Office of Inspector General of the Department of Health and Human Services, or the OIG, seeking documents relating primarily to the quality control testing and performance characteristics of Alere Triage products. We are cooperating with the OIG and are responding to the investigation, which is ongoing.
We are unable to predict when these matters will be resolved or what further action, if any, the government will take in connection with them.
INRatio Class Actions
On May 26, 2016, a class action lawsuit captioned Dina Andren and Sidney Bludman v. Alere Inc., et al., was filed against us in the United States District Court for the Southern District of California. In addition, on July 22, 2016, a class action lawsuit captioned J.E, J.D., and all others similarly situated v. Alere Inc., Alere San Diego, Inc. and Alere Home Monitoring, Inc., was filed against us in the United States District Court for the District of Massachusetts. These class actions purport to assert claims against us under several legal theories, including fraud, breach of warranty, unjust enrichment and violation of applicable unfair competition/business practice statutes in connection with the manufacturing, marketing and sale of our INRatio products. The plaintiffs in the Dina Andren and Sidney Bludman class action seek to represent a proposed class of all persons who purchased, rented or otherwise paid for the INRatio system during the period January 1, 2009 to May 26, 2016 in the United States, or alternatively, California, Maryland and/or New York. The plaintiffs in the J.E, J.D., and all others similarly situated class action seek to represent a proposed class of all persons who purchased, rented or otherwise paid for the INRatio system during the period April 1, 2008 to present. Both class action complaints seek restitution and damages allegedly resulting from inaccurate PT/INR readings and from the purchase of devices that claimants say they would not have purchased had they known of the alleged propensity of these devices to yield inaccurate PT/INR results. Among other things, plaintiffs in these class action lawsuits seek a refund of money spent on INRatio products. Each complaint also seeks unspecified compensatory damages, injunctive relief, attorneys’ fees and costs. The Audren action also appears to seek damages for personal injury.
We are unable, at this time, to determine the outcome of these class action lawsuits or our potential liability, if any.
Claims in the Ordinary Course and Other Matters
We are also party to certain other legal proceedings and other governmental investigations, or are requested to provide information in connection with such proceedings or investigations. For example, in December 2014, we and our subsidiary, Avee Laboratories Inc., or Avee, received subpoenas from
F-56
Table of Contents
ALERE INC. AND SUBSIDIARIES
NOTES TO CONSOLIDATED FINANCIAL STATEMENTS (Continued)
(12) Commitments and Contingencies (Continued)
the United States Attorney for the District of New Jersey seeking marketing materials and other documents relating primarily to billing and marketing practices related to toxicology testing. In addition, we received a U.S. Department of Justice criminal subpoena addressed to Alere Toxicology Services, Inc. on July 1, 2016 which seeks records related to Medicare, Medicaid and Tricare billings dating back to 2010 for specific patient samples tested at our Austin, Texas pain management laboratory and payments made to physicians. We are cooperating with these investigations and are providing documents in response to both subpoenas. We and our subsidiary, Arriva Medical, LLC, are also in the process of responding to Civil Investigative Demands, or CIDs, the most recent CID which was received in July 2016, from the United States Attorney for the Middle District of Tennessee in connection with an investigation of possible improper claims submitted to Medicare and Medicaid. The CIDs request patient and billing records and records related to interactions with third parties. We are cooperating with the investigation of the United States Attorney for the Middle District of Tennessee and are providing documents responsive to the CIDs. We cannot predict what effect, if any, these investigations, or any resulting claims, could have on Alere or its subsidiaries.
We have received, from time to time, additional subpoenas and requests for information from the United States Department of Justice, other federal government agencies and state attorneys general, and we have, in each of these cases, cooperated with the applicable governmental entity in responding to the applicable subpoena or request for information. For example, in May 2016, we received a subpoena from the U.S. Attorney for the District of New Jersey, which seeks various documents related to the accuracy, reliability and performance of the INRatio System, including documents relating to prior interactions with the FDA and others regarding the system.
Our diabetes, toxicology and patient self-testing businesses are subject to audit and claims for reimbursement brought in the ordinary course by private third-party payers, including health insurers, Zone Program Integrity Contractors, or ZPICs, and Medicare Administrative Contractors, or MACs, to monitor compliance with coverage and reimbursement rules and guidelines. These types of audits and claims can include, but are not limited to, claims relating to proper documentation and support or claims relating to the medical necessity of certain testing and can lead to assertions or determinations that certain claims should not have been, or will no longer be, paid by the private third-party payer or by Medicare or Medicaid. In such cases, the payer or program may seek to recoup or offset amounts they assert have been paid in error.
Our businesses may also be subject at any time to other commercial disputes, product liability claims, personal injury claims, including claims arising from or relating to product recalls, negligence claims, third-party subpoenas or various other lawsuits arising in the ordinary course of business, including infringement, employment or investor matters, and we expect that this will continue to be the case in the future. For example, several individuals have filed suits against us alleging personal injury claims in connection with the use of our INRatio products (which are in addition to the class action suits described above).
Such lawsuits or claims generally seek damages or reimbursement, sometimes in substantial amounts. There are possible unfavorable outcomes related to litigation or governmental investigations that could adversely impact our business, results of operations, financial condition, and cash flows.
F-57
Table of Contents
ALERE INC. AND SUBSIDIARIES
NOTES TO CONSOLIDATED FINANCIAL STATEMENTS (Continued)
(13) Net Income (Loss) Per Common Share
The following tables set forth the computation of basic and diluted net income (loss) per common share (in thousands, except per share amounts):
| 2015 | 2014 | 2013 | ||||||||||
| Basic and diluted net income (loss) per common share: |
||||||||||||
| Numerator: |
||||||||||||
| Income (loss) from continuing operations |
$ | (12,756) | $ | (171,754 | ) | $ | (57,856 | ) | ||||
| Preferred stock dividends |
(21,293 | ) | (21,293 | ) | (21,293 | ) | ||||||
|
|
|
|
|
|
|
|||||||
| Income (loss) from continuing operations attributable to common shares |
(34,049 | ) | (193,047 | ) | (79,149 | ) | ||||||
| Less: Net income attributable to non-controlling interest |
381 | 30 | 976 | |||||||||
|
|
|
|
|
|
|
|||||||
| Income (loss) from continuing operations attributable to Alere Inc. and Subsidiaries |
(34,430 | ) | (193,077 | ) | (80,125 | ) | ||||||
| Income (loss) from discontinued operations |
219,513 | 138,318 | (16,126 | ) | ||||||||
|
|
|
|
|
|
|
|||||||
| Net income (loss) available to common stockholders |
$ | 185,083 | $ | (54,759 | ) | $ | (96,251 | ) | ||||
|
|
|
|
|
|
|
|||||||
| Denominator: |
||||||||||||
| Weighted-average common shares outstanding — basic and diluted |
85,420 | 82,938 | 81,542 | |||||||||
|
|
|
|
|
|
|
|||||||
| Basic and diluted net income (loss) per common share: |
||||||||||||
| Income (loss) from continuing operations attributable to Alere Inc. and Subsidiaries |
$ | (0.40 | ) | $ | (2.33 | ) | $ | (0.98 | ) | |||
| Income (loss) from discontinued operations |
2.57 | 1.67 | (0.20 | ) | ||||||||
|
|
|
|
|
|
|
|||||||
| Basic net income (loss) per common share attributable to Alere Inc. and Subsidiaries |
$ | 2.17 | $ | (0.66 | ) | $ | (1.18 | ) | ||||
|
|
|
|
|
|
|
|||||||
F-58
Table of Contents
ALERE INC. AND SUBSIDIARIES
NOTES TO CONSOLIDATED FINANCIAL STATEMENTS (Continued)
(13) Net Income (Loss) Per Common Share (Continued)
The following potential dilutive securities were not included in the calculation of diluted net income (loss) per common share for our continuing operations because the inclusion thereof would be antidilutive (in thousands):
| 2015 | 2014 | 2013 | ||||||||||
| Denominator: |
||||||||||||
| Options to purchase shares of common stock |
6,793 | 7,140 | 10,879 | |||||||||
| Warrants |
4 | 4 | 4 | |||||||||
| Conversion shares related to 3% convertible senior subordinated notes |
3,411 | 3,411 | 3,411 | |||||||||
| Conversion shares related to subordinated convertible promissory notes |
— | 27 | 27 | |||||||||
| Conversion shares related to Series B convertible preferred stock |
10,239 | 10,239 | 10,239 | |||||||||
| Common stock equivalents related to the settlement of a contingent consideration obligation |
14 | — | 451 | |||||||||
|
|
|
|
|
|
|
|||||||
| Total number of antidilutive potentially issuable shares of common stock excluded from diluted common shares outstanding |
20,461 | 20,821 | 25,011 | |||||||||
|
|
|
|
|
|
|
|||||||
(14) Stockholders’ Equity
(a) Common Stock
As of December 31, 2015, we had 200.0 million shares of common stock, $0.001 par value, authorized, of which 7.7 million shares were held in treasury and 86.3 million shares were outstanding, 14.1 million shares were reserved for issuance upon grant and exercise of equity awards under current equity compensation plans, 1.8 million shares were reserved for issuance under our employee stock purchase plan and 4,000 shares were reserved for issuance upon exercise of outstanding warrants. We also had shares of common stock reserved for issuance upon conversion of the following securities outstanding on December 31, 2015: $150.0 million in the aggregate principal amount of 3% convertible senior subordinated notes, convertible at $43.98 per share into 3.4 million shares of our common stock, and 1.8 million shares of our Series B convertible preferred stock, with an aggregate liquidation preference of approximately $709.8 million, convertible under certain circumstances at $69.32 per share into 10.2 million shares of our common stock.
(b) Preferred Stock
As of December 31, 2015, we had 5.0 million shares of preferred stock, $0.001 par value, authorized, of which 2.3 million shares were designated as Series B Convertible Perpetual Preferred Stock, or Series B preferred stock. In connection with our acquisition of Matria, we issued shares of the Series B preferred stock and through June 30, 2011 paid all dividends on outstanding shares of Series B preferred stock in additional shares of Series B preferred stock. Subsequent to June 30, 2011 all dividends on outstanding shares of Series B preferred stock were paid in cash. At December 31, 2015, there were 1.8 million shares of Series B preferred stock outstanding with a fair value of approximately $498.9 million.
Each share of Series B preferred stock, which has a liquidation preference of $400.00 per share, is convertible, at the option of the holder and only upon certain circumstances, into 5.7703 shares of
F-59
Table of Contents
ALERE INC. AND SUBSIDIARIES
NOTES TO CONSOLIDATED FINANCIAL STATEMENTS (Continued)
(14) Stockholders’ Equity (Continued)
our common stock, plus cash in lieu of fractional shares. The initial conversion price is $69.32 per share, subject to adjustment upon the occurrence of certain events, but will not be adjusted for accumulated and unpaid dividends. Upon a conversion of shares of the Series B preferred stock, we may, at our option, satisfy the entire conversion obligation in cash or through a combination of cash and common stock. Series B preferred stock outstanding at December 31, 2015 would convert into 10.2 million shares of our common stock, which are reserved. There were no conversions as of December 31, 2015.
Generally, the shares of Series B preferred stock are convertible, at the option of the holder, if during any calendar quarter beginning with the second calendar quarter after the issuance date of the Series B preferred stock, the closing sale price of our common stock for each of 20 or more trading days within any period of 30 consecutive trading days ending on the last trading day of the immediately preceding calendar quarter exceeds 130% of the conversion price per share of common stock in effect on the last trading day of the immediately preceding calendar quarter. In addition, the shares of Series B preferred stock are convertible, at the option of the holder, in certain other circumstances, including those relating to the trading price of the Series B preferred stock and upon the occurrence of certain fundamental changes or major corporate transactions. We also have the right, under certain circumstances relating to the trading price of our common stock, to force conversion of the Series B preferred stock. Depending on the timing of any such forced conversion, we may have to make certain payments relating to foregone dividends, which payments we can make, at our option, in the form of cash, shares of our common stock, or a combination of cash and shares of our common stock.
Each share of Series B preferred stock accrues dividends at $12.00, or 3%, per annum, payable quarterly on January 15, April 15, July 15 and October 15 of each year, commencing following the first full calendar quarter after the issuance date. Dividends on the Series B preferred stock are cumulative from the date of issuance. For the years ended December 31, 2015, 2014 and 2013, Series B preferred stock dividends amounted to $21.3 million, $21.3 million and $21.3 million respectively, which reduced earnings available to common stockholders for purposes of calculating net loss per common share in each of 2015, 2014 and 2013 (Note 13). Accrued dividends are payable only if declared by our board of directors and, upon conversion by the Series B preferred stockholder, holders will not receive any cash payment representing accumulated dividends. If our board of directors declares a dividend payable, we have the right to pay the dividends in cash, shares of common stock, additional shares of Series B preferred stock or a similar convertible preferred stock or any combination thereof.
The holders of Series B preferred stock have liquidation preferences over the holders of our common stock and other classes of stock, if any, outstanding at the time of liquidation. Upon liquidation, the holders of outstanding Series B preferred stock would receive an amount equal to $400.00 per share of Series B preferred stock, plus any accumulated and unpaid dividends. As of December 31, 2015, the liquidation preference of the outstanding Series B preferred stock was $709.8 million. The holders of the Series B preferred stock have no voting rights, except with respect to matters affecting the Series B preferred stock (including the creation of a senior preferred stock).
We evaluated the terms and provisions of our Series B preferred stock to determine if it qualified for derivative accounting treatment. Based on our evaluation, these securities do not qualify for derivative accounting.
(c) Stock Options and Awards
In 2010, we adopted the Alere Inc. 2010 Stock Option and Incentive Plan, or the 2010 Plan, which replaced our 2001 Stock Option and Incentive Plan, or the 2001 Plan. The 2010 Plan currently allows
F-60
Table of Contents
ALERE INC. AND SUBSIDIARIES
NOTES TO CONSOLIDATED FINANCIAL STATEMENTS (Continued)
(14) Stockholders’ Equity (Continued)
for the issuance of up to 16.1 million shares of common stock and other awards. The 2010 Plan is administered by the Compensation Committee of the Board of Directors, which selects the individuals eligible to receive awards, determines or modifies the terms and conditions of the awards granted, accelerates the vesting schedule of any award and generally administers and interprets the 2010 Plan. The 2010 Plan permits the granting of incentive and nonqualified stock options with terms of up to ten years and the granting of stock appreciation rights, restricted stock awards, restricted stock units, unrestricted stock awards, performance share awards and dividend equivalent rights. For awards granted before April 23, 2015, the 2010 Plan generally provides for automatic vesting acceleration of all options, and automatic removal of conditions and restrictions on all restricted stock awards, restricted stock units and performance share awards upon a change in control, as defined in the 2010 Plan. For awards granted on or after April 23, 2015, the 2010 Plan generally provides for such acceleration if either (i) no provision is made for the assumption, continuation or substitution of awards upon such a change of control or (ii) provision is made for the assumption, continuation or substitution of such awards upon such a change of control and, within one year of such change of control, we terminate the award recipient’s employment without cause, as defined in the 2010 Plan, or the award recipient terminates his or her employment for good reason, as defined in the 2010 Plan (or, in the case of a director, his or her service as a director is terminated for any reason). As of December 31, 2015 and 2014, there were 7.9 million and 2.8 million shares, respectively, available for future grant under the 2010 Plan.
In 2001, we adopted our 2001 Employee Stock Purchase Plan, or our ESPP, under which eligible employees are allowed to purchase shares of our common stock at a discount through periodic payroll deductions. Purchases may occur at the end of every six-month offering period at a purchase price equal to 85% of the market value of our common stock at either the beginning or end of the offering period, whichever is lower. We may issue up to 5.0 million shares of common stock under this plan. At December 31, 2015, 3.2 million shares had been issued under this plan.
The following summarizes all stock option activity during the year ended December 31, 2015 (in thousands, except exercise price):
| Stock Options |
Weighted- average Exercise Price |
|||||||
| Outstanding at January 1, 2015 |
7,364 | $ | 34.68 | |||||
| Granted |
2,399 | $ | 46.47 | |||||
| Exercised |
(2,168 | ) | $ | 34.26 | ||||
| Canceled/expired/forfeited |
(1,454 | ) | $ | 38.91 | ||||
|
|
|
|||||||
| Outstanding at December 31, 2015 |
6,141 | $ | 38.43 | |||||
|
|
|
|||||||
| Exercisable at December 31, 2015 |
2,829 | $ | 34.65 | |||||
|
|
|
|||||||
The aggregate intrinsic value of the options outstanding at December 31, 2015 was $29.5 million and the weighted-average remaining contractual term is 6.70 years. The aggregate intrinsic value of the options exercisable at December 31, 2015 was $20.9 million and the weighted-average remaining contractual term is 4.47 years. The aggregate intrinsic value of stock options exercised during 2015, 2014 and 2013 was $31.4 million, $14.9 million and $4.5 million, respectively.
As of December 31, 2015, there was $55.0 million of unrecognized compensation cost related to stock options. Such costs are expected to be recognized over a weighted-average period of 1.53 years.
F-61
Table of Contents
ALERE INC. AND SUBSIDIARIES
NOTES TO CONSOLIDATED FINANCIAL STATEMENTS (Continued)
(14) Stockholders’ Equity (Continued)
The following summarizes all restricted stock unit activity during the year ended December 31, 2015 (in thousands, except grant date fair value):
| Restricted Stock Units |
Weighted- average Grant Date Fair Value |
|||||||
| Nonvested at January 1, 2015 |
539 | $ | 32.72 | |||||
| Granted |
403 | $ | 28.04 | |||||
| Vested |
(248 | ) | $ | 28.89 | ||||
| Forfeited |
(44 | ) | $ | 36.95 | ||||
|
|
|
|||||||
| Nonvested at December 31, 2015 |
650 | $ | 31.00 | |||||
|
|
|
|||||||
The fair values of our restricted stock units, or RSUs, are based on the market value of our stock on the date of grant. The weighted-average grant date fair value of RSUs granted during 2015 and 2014 was $28.04 and $35.99 respectively. There were no RSUs granted in 2013. The aggregate intrinsic value of the RSUs as of December 31, 2015 was $25.4 million and the weighted-average remaining contractual term is 1.34 years. The aggregate intrinsic value of the RSUs expected to vest as of December 31, 2015 was $23.1 million and the weighted-average remaining contractual term is 1.32 years.
As of December 31, 2015, there was $19.9 million of unrecognized compensation cost related to RSUs, which is expected to be recognized over a weighted-average period of 1.34 years.
The following summarizes all stock appreciation rights, or SARs, activity during the year ended December 31, 2015 (in thousands):
| Stock Appreciation Rights |
||||
| Nonvested at January 1, 2015 |
246 | |||
| Granted |
56 | |||
| Exercised |
(67 | ) | ||
| Forfeited. |
(47 | ) | ||
|
|
|
|||
| Nonvested at December 31, 2015 |
188 | |||
|
|
|
|||
The total cash paid in settlement of SARs exercised in 2015, 2014 and 2013 was $1.1 million, $0.9 million and $0.0 million, respectively, which was recorded under liability accounting. As of December 31, 2015 and 2014, the accrual related to SARs was $2.0 million and $2.4 million, respectively.
(15) Stock-based Compensation
We recorded stock-based compensation expense in our consolidated statements of operations for the years ended December 31, 2015, 2014 and 2013, respectively, as follows (in thousands):
| 2015 | 2014 | 2013 | ||||||||||
| Cost of net revenue |
$ | 1,198 | $ | 1,180 | $ | 1,126 | ||||||
| Research and development |
1,195 | (41 | ) | 4,053 | ||||||||
| Sales and marketing |
4,794 | 3,940 | 3,698 | |||||||||
| General and administrative |
19,204 | 7,373 | 12,333 | |||||||||
|
|
|
|
|
|
|
|||||||
| 26,391 | 12,452 | 21,210 | ||||||||||
| Benefit for income taxes |
(8,815 | ) | (2,891 | ) | (4,190 | ) | ||||||
|
|
|
|
|
|
|
|||||||
| Stock-based compensation, net of tax |
$ | 17,576 | $ | 9,561 | $ | 17,020 | ||||||
|
|
|
|
|
|
|
|||||||
F-62
Table of Contents
ALERE INC. AND SUBSIDIARIES
NOTES TO CONSOLIDATED FINANCIAL STATEMENTS (Continued)
(15) Stock-based Compensation (Continued)
In connection with the departure of three of our senior executives in June 2014, we recorded a reversal of stock-based compensation expense in the amount of $5.6 million during the second quarter of 2014 relating to the termination of their stock option awards following their resignations. Of the $5.6 million reversal, $2.2 million was recorded through research and development and $3.4 million through general and administrative.
The excess tax benefits from the exercise of stock options are reported as financing cash flows in our consolidated statements of cash flows. For the years ended December 31, 2015, 2014 and 2013, excess tax benefits generated from option exercises amounted to $0.0 million, $1.0 million and $0.5 million, respectively.
The following assumptions were used to estimate the fair value of options granted during the years ended December 31, 2015, 2014 and 2013, using a Black-Scholes option-pricing model:
| 2015 | 2014 | 2013 | ||||||||||
| Risk-free interest rate |
1.62 | % | 1.77 | % | 1.47 | % | ||||||
| Expected dividend yield |
— | — | — | |||||||||
| Expected life |
5.59 years | 5.78 years | 5.74 years | |||||||||
| Expected volatility |
33 | % | 36 | % | 42 | % | ||||||
The weighted-average fair value under a Black-Scholes option pricing model of options granted to employees during 2015, 2014 and 2013 was $18.51, $19.55 and $15.22 per share, respectively. All options granted during these periods were granted at or above the fair market value on the date of grant.
For the year ended December 31, 2015, we recorded compensation expense of $1.9 million related to our ESPP, which is included in the table above. The fair value of the option component of the ESPP shares was estimated at the date of grant using a Black-Scholes option pricing model and assumed an expected volatility of 30% and 29%, a risk-free interest rate of 0.11% and 0.13% and an expected life of 181 days and 184 days, for each of the two respective offering periods. The 2015 charge is included in the employee’s respective cost classification in the table above.
For the year ended December 31, 2014, we recorded compensation expense of $2.6 million related to our ESPP, which is included in the table above. The fair value of the option component of the ESPP shares was estimated at the date of grant using a Black-Scholes option pricing model and assumed an expected volatility of 35% and 32%, a risk-free interest rate of 0.09% and 0.06% and an expected life of 181 days and 184 days, for each of the two respective offering periods. The 2014 charge is included in the employee’s respective cost classification in the table above.
For the year ended December 31, 2013, we recorded compensation expense of $2.6 million related to our ESPP, which is included in the table above. The fair value of the option component of the ESPP shares was estimated at the date of grant using a Black-Scholes option pricing model and assumed an expected volatility of 41% and 40%, a risk-free interest rate of 0.12% and 0.09% and an expected life of 181 days and 184 days, for each of the two respective offering periods. The 2013 charge is included in the employee’s respective cost classification in the table above.
F-63
Table of Contents
ALERE INC. AND SUBSIDIARIES
NOTES TO CONSOLIDATED FINANCIAL STATEMENTS (Continued)
(16) Accumulated Other Comprehensive Income (Loss)
Accumulated other comprehensive income (loss) consisted of the following (in thousands):
| Cumulative Translation Adjustment |
Pension Liability Adjustment |
Other(1) | Accumulated Other Comprehensive Income (Loss) |
|||||||||||||
| Balance at December 31, 2012 |
$ | 31,517 | $ | (6,708 | ) | $ | (60 | ) | $ | 24,749 | ||||||
| Period change |
(50,166 | ) | (309 | ) | 39 | (50,436 | ) | |||||||||
|
|
|
|
|
|
|
|
|
|||||||||
| Balance at December 31, 2013 |
(18,649 | ) | (7,017 | ) | (21 | ) | (25,687 | ) | ||||||||
| Period change |
(166,448 | ) | 4 | 21 | (166,423 | ) | ||||||||||
|
|
|
|
|
|
|
|
|
|||||||||
| Balance at December 31, 2014 |
(185,097 | ) | (7,013 | ) | — | (192,110 | ) | |||||||||
| Period change |
(146,438 | ) | (1,229 | ) | — | (147,667 | ) | |||||||||
|
|
|
|
|
|
|
|
|
|||||||||
| Balance at December 31, 2015 |
$ | (331,535 | ) | $ | (8,242 | ) | $ | — | $ | (339,777 | ) | |||||
|
|
|
|
|
|
|
|
|
|||||||||
| (1) | Other represents unrealized gains (losses) on available-for-sale securities and hedging instruments. |
(17) Income Taxes
Income (loss) before provision (benefit) for income taxes consists of the following (in thousands):
Continuing Operations:
| 2015 | 2014 | 2013 | ||||||||||
| United States |
$ | (226,051 | ) | $ | (184,936 | ) | $ | (195,244 | ) | |||
| Foreign |
145,061 | 66,603 | 75,238 | |||||||||
|
|
|
|
|
|
|
|||||||
| $ | (80,990 | ) | $ | (118,333 | ) | $ | (120,006 | ) | ||||
|
|
|
|
|
|
|
|||||||
During November 2015, the FASB issued Accounting Standards Update No. 2015-17, ASU 2015-17, “Balance Sheet Classification of Deferred Taxes”, which simplifies the presentation of deferred income taxes. This ASU requires that deferred tax assets and liabilities be classified as non-current in a statement of financial position. We early adopted this ASU effective December 31, 2015 on a prospective basis. Adoption of this ASU resulted in a reclassification of our net current deferred tax asset to the net non-current deferred tax asset in our consolidated balance sheet as of December 31, 2015. No prior periods were retrospectively adjusted.
F-64
Table of Contents
ALERE INC. AND SUBSIDIARIES
NOTES TO CONSOLIDATED FINANCIAL STATEMENTS (Continued)
(17) Income Taxes (Continued)
Our primary temporary differences that give rise to deferred tax assets and liabilities are net operating losses, capital loss carryforwards, tax credit carryforwards, nondeductible reserves and accruals, outside basis differences, and differences in basis of the tangible and intangible assets. The income tax effects of these temporary differences, are as follows (in thousands):
| 2015 | 2014 | |||||||
| Deferred tax assets: |
||||||||
| NOL and capital loss carryforwards |
$ | 221,728 | $ | 119,142 | ||||
| Outside basis differences |
— | 211,880 | ||||||
| Tax credit carryforwards |
107,750 | 93,057 | ||||||
| Nondeductible reserves |
45,053 | 43,393 | ||||||
| Nondeductible accruals |
26,490 | 34,284 | ||||||
| Difference between book and tax bases of tangible assets |
1,735 | 881 | ||||||
| Difference between book and tax bases of intangible assets |
19,678 | 31,010 | ||||||
| Deferred revenue |
7,426 | 6,483 | ||||||
| All other |
16,477 | 18,950 | ||||||
|
|
|
|
|
|||||
| Gross deferred tax assets |
446,337 | 559,080 | ||||||
| Less: Valuation allowance |
(262,223 | ) | (228,633 | ) | ||||
|
|
|
|
|
|||||
| Total deferred tax assets |
184,114 | 330,447 | ||||||
|
|
|
|
|
|||||
| Deferred tax liabilities: |
||||||||
| Difference between book and tax bases of tangible assets |
20,990 | 30,919 | ||||||
| Difference between book and tax bases of intangible assets |
277,871 | 364,815 | ||||||
| Debt |
2,344 | 12,895 | ||||||
| Other |
16,534 | 19,560 | ||||||
|
|
|
|
|
|||||
| Total deferred tax liabilities |
317,739 | 428,189 | ||||||
|
|
|
|
|
|||||
| Net deferred tax liabilities |
$ | (133,625 | ) | $ | (97,742 | ) | ||
|
|
|
|
|
|||||
| Reported as: |
||||||||
| Deferred tax assets, current portion |
$ | — | $ | 127,920 | ||||
| Net non-current deferred tax assets |
13,993 | 6,318 | ||||||
| Deferred tax liabilities, current portion |
— | (17 | ) | |||||
| Net non-current deferred tax liabilities |
(147,618 | ) | (231,963 | ) | ||||
|
|
|
|
|
|||||
| Net deferred tax liabilities |
$ | (133,625 | ) | $ | (97,742 | ) | ||
|
|
|
|
|
|||||
As of December 31, 2014, we recorded a deferred tax asset for tax over book outside basis differences related to our health management business due to the anticipated realization of this deferred tax asset in the foreseeable future. A portion of this deferred tax asset was expected to be capital in nature and, therefore, a valuation allowance was recorded against this portion of the deferred tax asset as it was not more likely than not that these deferred tax assets would be realized. The recognition of this deferred tax asset resulted in recording tax benefit of $144.8 million that has been reflected in income from discontinued operations, net of tax in 2014. On January 9, 2015 we divested our health management business which resulted in the reversal of this deferred tax asset.
As of December 31, 2015, our federal, state and foreign net operating loss carryforwards for income tax purposes were approximately $30.6 million, $876.5 million, and $234.6 million, respectively. If not utilized, a portion of the federal, state and foreign net operating loss carryforwards will begin to
F-65
Table of Contents
ALERE INC. AND SUBSIDIARIES
NOTES TO CONSOLIDATED FINANCIAL STATEMENTS (Continued)
(17) Income Taxes (Continued)
expire in 2020, 2016 and 2017, respectively. Certain foreign net operating loss carryforwards can be carried forward indefinitely. As of December 31, 2015, our federal and foreign capital loss carryforwards for income tax purposes were approximately $256.1 million and $62.1 million, respectively. If not utilized, a portion of the federal capital loss carryforwards will begin to expire in 2016. The foreign capital loss carryforwards can be carried forward indefinitely. As of December 31, 2015, we had $22.9 million of U.S. federal and state research and development credit carryforwards, $4.4 million of U.S. federal Alternative Minimum Tax (“AMT”) credit carryforwards, $79.2 million of U.S. foreign tax credit carryforwards and $1.2 million of other foreign tax credit carryforwards. If not utilized, a portion of the research and development credit and foreign tax credit will begin to expire in 2026 and 2018, respectively. The AMT credit can be carried forward indefinitely. All U.S. federal loss carryforwards and credits are subject to the limitations imposed by Section 382 and 383 of the Internal Revenue Code, and may be limited in the event of certain cumulative changes in ownership interests of significant shareholders over a three-year period in excess of 50%. Sections 382 and 383 impose an annual limitation on the use of these loss carryforwards or credits to an amount equal to the value of the company at the time of certain ownership changes multiplied by the long-term tax exempt rate. Additionally, certain state and foreign losses and credits may be subject to similar limitations based on local provisions. These loss and tax credit carryforwards may be available to reduce future U.S. federal, state and foreign taxable income and taxes, if any, and are subject to review and possible adjustment by the appropriate tax authorities when utilized. During the year ended December 31, 2014, the provision for income taxes of $70.9 million primarily related to the establishment of a valuation allowance of $44.4 million against deferred tax assets associated with our U.S. foreign tax credit carryforwards. This valuation allowance was established as it is more likely than not that these deferred tax assets will not be realized. This decision was based on the weight of all available positive and negative evidence that existed at December 31, 2014.
We recorded a valuation allowance of $262.2 million as of December 31, 2015 due to uncertainties related to the future benefits and realization of our deferred tax assets related primarily to U.S. foreign tax credits and certain state and foreign attribute carryforwards. This is an increase of $33.6 million from the valuation allowance of $228.6 million as of December 31, 2014. The increase is primarily related to our assessment of realizability related to U.S. foreign tax credits as well as certain state and foreign net operating losses and capital loss generated during the current period. The valuation allowance is based on the weight of available positive and negative evidence, including our estimates of future income by the jurisdictions in which we operate and the period over which our deferred tax assets will be recoverable. In the event that actual results differ from these estimates, or we adjust these estimates in future periods, we may need to establish an additional valuation allowance or reduce our current valuation allowance, which could materially impact our tax provision.
The estimated amount of undistributed earnings of our foreign subsidiaries is $320.2 million at December 31, 2015. We have provided $2.8 million of foreign withholding taxes on certain undistributed earnings. No amount for U.S. income tax has been provided on undistributed earnings of our foreign subsidiaries because we consider such earnings to be indefinitely reinvested. In the event of distribution of those earnings we would be subject to both U.S. income and foreign withholding taxes, which potentially would be offset by U.S. foreign tax credits. Determination of the amount of tax liability that would be incurred is not practicable because of the complexities associated with this hypothetical calculation.
F-66
Table of Contents
ALERE INC. AND SUBSIDIARIES
NOTES TO CONSOLIDATED FINANCIAL STATEMENTS (Continued)
(17) Income Taxes (Continued)
The following table presents the components of our provision (benefit) for income taxes (in thousands) for continuing operations:
| 2015 | 2014 | 2013 | ||||||||||
| Current: |
||||||||||||
| Federal |
$ | (10,569 | ) | $ | 6,857 | $ | 19,948 | |||||
| State |
2,331 | 487 | (12 | ) | ||||||||
| Foreign |
54,921 | 51,332 | 57,852 | |||||||||
|
|
|
|
|
|
|
|||||||
| 46,683 | 58,676 | 77,788 | ||||||||||
|
|
|
|
|
|
|
|||||||
| Deferred: |
||||||||||||
| Federal |
(71,748 | ) | 25,629 | (86,254 | ) | |||||||
| State |
(8,572 | ) | (4,142 | ) | (6,513 | ) | ||||||
| Foreign |
(19,067 | ) | (9,233 | ) | (29,728 | ) | ||||||
|
|
|
|
|
|
|
|||||||
| (99,387 | ) | 12,254 | (122,495 | ) | ||||||||
|
|
|
|
|
|
|
|||||||
| Total provision (benefit) for income taxes |
$ | (52,704 | ) | $ | 70,930 | $ | (44,707 | ) | ||||
|
|
|
|
|
|
|
|||||||
The following table presents a reconciliation from the U.S. statutory tax rate to our effective tax rate:
| 2015 | 2014 | 2013 | ||||||||||
| Statutory rate |
35 | % | 35 | % | 35 | % | ||||||
| Stock-based compensation |
(1 | ) | (1 | ) | (3 | ) | ||||||
| Rate differential on foreign earnings |
20 | 3 | 4 | |||||||||
| Impact of foreign inclusion |
— | (2 | ) | (3 | ) | |||||||
| U.S. federal research and development credit |
3 | 1 | 3 | |||||||||
| State income taxes, net of federal benefit |
7 | 3 | (2 | ) | ||||||||
| Contingent consideration |
27 | (3 | ) | (3 | ) | |||||||
| Rate changes |
1 | (3 | ) | 7 | ||||||||
| Return to provision |
4 | 19 | (3 | ) | ||||||||
| Other permanent items |
(1 | ) | 3 | 1 | ||||||||
| Section 199 deduction |
— | — | 2 | |||||||||
| Bargain purchase |
— | — | 3 | |||||||||
| Change in valuation allowance |
(8 | ) | (72 | ) | 6 | |||||||
| Foreign dividends, net |
(13 | ) | (19 | ) | (9 | ) | ||||||
| Uncertain tax positions |
(6 | ) | (18 | ) | (1 | ) | ||||||
| Withholding Taxes |
(2 | ) | (6 | ) | — | |||||||
|
|
|
|
|
|
|
|||||||
| Effective tax rate |
66 | % | (60 | )% | 37 | % | ||||||
|
|
|
|
|
|
|
|||||||
The impact on the rate in 2013 through 2015 relating to contingent consideration is due to fair value accounting used for contingent consideration on stock acquisitions with no corresponding basis for tax purposes.
Change in valuation allowances primarily relates to an increase in the valuation allowance attributable to U.S. foreign tax credits, as well as state and foreign losses where it is not more likely than not that these will be realized.
F-67
Table of Contents
ALERE INC. AND SUBSIDIARIES
NOTES TO CONSOLIDATED FINANCIAL STATEMENTS (Continued)
(17) Income Taxes (Continued)
During the year ended December 31, 2015, we increased the gross liability for income taxes associated with uncertain tax positions by $70.8 million to a total of $120.7 million at December 31, 2015. The primary reason for the increase relates to the valuation of certain assets.
A reconciliation of the beginning and ending amount of gross unrecognized tax benefits for uncertain tax positions excluding interest and penalties is as follows (in thousands):
| Amount | ||||
| Balance as of January 1, 2013 |
$ | 23,640 | ||
| Additions for tax positions related to prior years |
— | |||
| Additions for tax positions related to current year |
7,654 | |||
| Reductions for tax positions related to prior years |
(900 | ) | ||
|
|
|
|||
| Balance as of December 31, 2013 |
30,394 | |||
| Additions for tax positions related to prior years |
20,797 | |||
| Additions for tax positions related to current year |
3,217 | |||
| Reductions for tax positions related to prior years |
(4,477 | ) | ||
|
|
|
|||
| Balance as of December 31, 2014 |
49,931 | |||
| Additions for tax positions related to prior years |
823 | |||
| Additions for tax positions related to current year |
71,505 | |||
| Reductions for tax positions and of lapse of statute of limitations related to prior years |
(1,552 | ) | ||
|
|
|
|||
| Balance as of December 31, 2015 |
$ | 120,707 | ||
|
|
|
|||
Included in the balance of unrecognized tax benefits as of December 31, 2015 is $86.2 million of tax benefits that, if recognized, would affect the effective tax rate. We do not anticipate material increases or decreases to our unrecognized tax benefits during 2016.
Interest and penalties related to income tax liabilities are included in income tax expense. The total net amount of interest and penalties recorded in 2015, 2014 and 2013 was $1.4 million, $1.1 million and $1.3 million, respectively. The total net amount of accrued interest and penalties recorded on the consolidated balance sheet at December 31, 2015, 2014 and 2013 was $3.7 million, $2.3 million and $1.9 million, respectively.
We are subject to U.S. federal, state and foreign income tax audits by tax authorities for our open years which include 2010 through present. We are currently under income tax examination by the IRS and a number of state and foreign tax authorities. We cannot currently estimate the impact of these audits due to the uncertainties associated with the tax examinations. Management does not expect material changes in tax position as a result of these ongoing audits.
In December 2015, Congress signed into law the Protecting Americans from Tax Hikes Act which retroactively extended the U.S. federal research and development credit from January 1, 2015 through December 31, 2015 and permanently extended the credit going forward. As a result, we recognized the retroactive benefit of the 2015 U.S. federal research and development credit of approximately $2.1 million as a discrete item in the fourth quarter of 2015, the period in which the legislation was enacted.
F-68
Table of Contents
ALERE INC. AND SUBSIDIARIES
NOTES TO CONSOLIDATED FINANCIAL STATEMENTS (Continued)
(18) Financial Information by Segment
Operating segments are defined as components of an enterprise about which separate financial information is available that is evaluated regularly by the chief operating decision maker, or decision-making group, in deciding how to allocate resources and in assessing performance. Our chief operating decision-making group is composed of the chief executive officer and members of senior management. As a result of the sale of our health management business in January 2015, which was the largest component of our patient self-testing reporting segment, we no longer report our financial information in four operating segments. Our current reportable operating segments are professional diagnostics, consumer diagnostics, and corporate and other. The information below for 2015, 2014 and 2013 has been retroactively adjusted to reflect this change in reporting segments. Our operating results include license and royalty revenue which are allocated to professional diagnostics and consumer diagnostics on the basis of the original license or royalty agreement. We evaluate performance of our operating segments based on revenue and operating income (loss). Segment information for 2015, 2014 and 2013 and as of December 31, 2015 and 2014 is as follows (in thousands):
| 2015 |
Professional Diagnostics |
Consumer Diagnostics |
Corporate and Other |
Total | ||||||||||||
| Net revenue |
$ | 2,378,188 | $ | 85,128 | $ | — | $ | 2,463,316 | ||||||||
| Operating income (loss) |
$ | 348,527 | $ | 2,871 | $ | (213,548 | ) | $ | 137,850 | |||||||
| Depreciation and amortization |
$ | 299,323 | $ | 2,836 | $ | 7,105 | $ | 309,264 | ||||||||
| Restructuring charge |
$ | 14,281 | $ | — | $ | 1,362 | $ | 15,643 | ||||||||
| Stock-based compensation |
$ | — | $ | — | $ | 26,391 | $ | 26,391 | ||||||||
| Assets |
$ | 5,620,085 | $ | 172,551 | $ | 164,535 | $ | 5,957,171 | ||||||||
| Expenditures for property, plant and equipment |
$ | 76,665 | $ | 1,403 | $ | 12,710 | $ | 90,778 | ||||||||
| 2014 |
Professional Diagnostics |
Consumer Diagnostics |
Corporate and Other |
Total | ||||||||||||
| Net revenue |
$ | 2,486,190 | $ | 89,088 | $ | — | $ | 2,575,278 | ||||||||
| Operating income (loss) |
$ | 174,082 | $ | 11,922 | $ | (92,925 | ) | $ | 93,079 | |||||||
| Depreciation and amortization |
$ | 331,882 | $ | 692 | $ | 3,455 | $ | 336,029 | ||||||||
| Restructuring charge |
$ | 44,461 | $ | — | $ | 14,235 | $ | 58,696 | ||||||||
| Stock-based compensation |
$ | — | $ | — | $ | 12,452 | $ | 12,452 | ||||||||
| Assets |
$ | 6,344,867 | $ | 216,451 | $ | 138,561 | $ | 6,699,879 | ||||||||
| Expenditures for property, plant and equipment |
$ | 79,134 | $ | 3,360 | $ | 18,068 | $ | 100,562 | ||||||||
| 2013 |
Professional Diagnostics |
Consumer Diagnostics |
Corporate and Other |
Total | ||||||||||||
| Net revenue |
$ | 2,523,186 | $ | 85,450 | $ | — | $ | 2,608,636 | ||||||||
| Operating income (loss) |
$ | 233,481 | $ | 4,464 | $ | (91,345 | ) | $ | 146,600 | |||||||
| Depreciation and amortization |
$ | 369,193 | $ | 4,330 | $ | 1,134 | $ | 374,657 | ||||||||
| Restructuring charge |
$ | 14,443 | $ | — | $ | — | $ | 14,443 | ||||||||
| Stock-based compensation |
$ | — | $ | — | $ | 21,210 | $ | 21,210 | ||||||||
| Assets |
$ | 6,244,124 | $ | 197,458 | $ | 616,933 | $ | 7,058,515 | ||||||||
| Expenditures for property, plant and equipment |
$ | 88,357 | $ | 1,645 | $ | 9,906 | $ | 99,908 | ||||||||
F-69
Table of Contents
ALERE INC. AND SUBSIDIARIES
NOTES TO CONSOLIDATED FINANCIAL STATEMENTS (Continued)
(18) Financial Information by Segment (Continued)
The following tables summarize our net revenue from the professional diagnostics reporting segment by groups of similar products and services for 2015, 2014 and 2013 (in thousands):
| 2015 | 2014 | 2013 | ||||||||||
| Cardiometabolic |
$ | 832,402 | $ | 841,905 | $ | 858,781 | ||||||
| Infectious disease |
717,812 | 721,803 | 729,836 | |||||||||
| Toxicology |
618,360 | 644,620 | 644,527 | |||||||||
| Other |
192,637 | 256,812 | 262,814 | |||||||||
|
|
|
|
|
|
|
|||||||
| Professional diagnostics net product sales and services revenue |
2,361,211 | 2,465,140 | 2,495,958 | |||||||||
| License and royalty revenue |
16,977 | 21,050 | 27,229 | |||||||||
|
|
|
|
|
|
|
|||||||
| Professional diagnostics net revenue |
$ | 2,378,188 | $ | 2,486,190 | $ | 2,523,187 | ||||||
|
|
|
|
|
|
|
|||||||
The following tables summarize our net revenue for all segments by geographic area for 2015, 2014 and 2013, respectively, and our long-lived tangible assets by geographic area as of December 31, 2015 and 2014, respectively (in thousands):
| 2015 | 2014 | 2013 | ||||||||||
| Revenue by Geographic Area: |
||||||||||||
| United States |
$ | 1,372,039 | $ | 1,366,739 | $ | 1,446,411 | ||||||
| Europe |
437,653 | 533,116 | 506,760 | |||||||||
| Elsewhere(1) |
653,624 | 675,423 | 655,465 | |||||||||
|
|
|
|
|
|
|
|||||||
| $ | 2,463,316 | $ | 2,575,278 | $ | 2,608,636 | |||||||
|
|
|
|
|
|
|
|||||||
| (1) | Includes, among many others, the following countries: China, India, Japan, South Korea, Brazil, Canada, Uganda and Nigeria. |
| December 31, | ||||||||
| 2015 | 2014 | |||||||
| Long-lived Tangible Assets by Geographic Area: |
||||||||
| United States |
$ | 261,385 | $ | 251,731 | ||||
| United Kingdom |
26,512 | 28,745 | ||||||
| China |
28,705 | 29,505 | ||||||
| Elsewhere(1) |
129,437 | 144,242 | ||||||
|
|
|
|
|
|||||
| $ | 446,039 | $ | 454,223 | |||||
|
|
|
|
|
|||||
| (1) | Includes, among many others, the following countries: South Korea, Germany, Norway, Canada and Brazil. |
(19) Other Arrangements
In September 2014, we entered into a contract with the U.S. Department of Health and Human Services’ Biomedical Advanced Research and Development Authority, or BARDA, to develop diagnostic countermeasures for pandemic influenza. Under the terms of the 3.5 year contract, BARDA will provide up to $12.9 million to us to support the development of a rapid, molecular, low-cost influenza diagnostic device with PCR-like performance at the point of care. The project is designed to help support future preparedness and medical response to an influenza pandemic. Funding from BARDA is subject to successful completion of various interim feasibility and development milestones
F-70
Table of Contents
ALERE INC. AND SUBSIDIARIES
NOTES TO CONSOLIDATED FINANCIAL STATEMENTS (Continued)
(19) Other Arrangements (Continued)
as defined in the agreement. As of December 31, 2015 and 2014, we had incurred $3.4 million and $0.4 million, respectively, of qualified expenditures under the contract, for which we had received cash reimbursement from BARDA in the amount of $2.7 million and $0.1 million, respectively, and $0.7 million and $0.3 million was recorded as a receivable as of December 31, 2015 and 2014. Reimbursements of qualified expenditures under this contract are recorded as a reduction of our related qualified research and development expenditures.
In February 2013, we entered into an agreement with the Bill & Melinda Gates Foundation, or the Gates Foundation, whereby we were awarded a grant by the Gates Foundation in the amount of $21.6 million to support the development and commercialization of validated, low-cost, nucleic-acid assays and cartridges for clinical tuberculosis (TB) detection and drug-resistance testing, and adaptation of an analyzer platform capable of operation in rudimentary laboratories in low-resource settings. In connection with this agreement, we also entered into a loan agreement with the Gates Foundation, or the Gates Loan Agreement, which provided for the making of subordinated term loans by the Gates Foundation to us from time to time, subject to the achievement of certain milestones, in an aggregate principal amount of up to $20.6 million. In April 2016, we and the Gates Foundation agreed to mutually terminate this grant and loan agreement and, therefore, there will be no additional grants and no advances will be available under the loan agreement. As of December 31, 2015 and through the mutual termination in April 2016, we had borrowed no amounts under the Gates Loan Agreement. As of December 31, 2015, we had received approximately $19.7 million in grant-related funding from the Gates Foundation. Grant funds were recorded upon receipt as restricted cash and deferred grant funding, with the deferred grant funding classified within accrued expenses and other current liabilities on our accompanying consolidated balance sheet. As qualified expenditures were incurred under the terms of the grant, we used the deferred funding to recognize a reduction of our related qualified research and development expenditures. For the years ended December 31, 2015, 2014 and 2013, we incurred approximately $3.9 million, $9.5 million and $6.6 million, respectively, of qualified expenditures, for which we reduced our deferred grant funding balance and recorded an offset to our research and development expenses. There were no amounts remaining as restricted cash or deferred grant funding as of December 31, 2015.
In addition to the February 2013 grant discussed above, we were awarded a grant in November 2014 by the Gates Foundation in the amount of approximately $0.4 million to support the elimination of malaria. During 2015, we incurred approximately $0.3 million of qualifying expenses in connection with this grant, and returned the remaining $0.1 million of excess funds to the Gates Foundation. In further support of the goal to eliminate malaria, we were awarded a grant in June 2015 in the amount of approximately $0.9 million and a grant in November 2015 in the amount of approximately $1.1 million by the Gates Foundation. In connection with the June 2015 grant, we received total funding of $0.5 million during 2015 and incurred qualifying expenses totaling approximately $0.1 million. In connection with the November 2015 grant, we received total funding of approximately $0.8 million during 2015. No qualifying expenditures were incurred during 2015 related to the November 2015 grant. As of December 31, 2015, we had received a total of approximately $1.7 million, net of the $0.1 million of returned funds, in grant-related funding from the Gates Foundation in connection with these malaria-related grants. We expect that, as qualified expenditures are incurred under the terms of the grants, we will use the deferred grant funding to recognize a reduction of our related qualified research and development expenditures. For the year ended December 31, 2015, we incurred approximately $0.5 million of qualified expenditures under these grants for which we reduced our deferred grant funding balance and recorded an offset to our research and development expenses. As
F-71
Table of Contents
ALERE INC. AND SUBSIDIARIES
NOTES TO CONSOLIDATED FINANCIAL STATEMENTS (Continued)
(19) Other Arrangements (Continued)
of December 31, 2015, $1.2 million was recorded as restricted cash and deferred grant funding on our accompanying consolidated balance sheet.
(20) Related Party Transactions
(a) Divestiture of ACS Companies
On October 10, 2014, we completed the sale of ACS to ACS Acquisition, LLC (the “Purchaser”), pursuant to the terms of a Membership Interest Purchase Agreement with the Purchaser and Sumit Nagpal. In connection with the sale of ACS, in June 2015 we also sold our subsidiary Wellogic ME FZ – LLC (“Wellogic,” together with ACS, the “ACS Companies”) to the Purchaser. See Note 3.
Mr. Nagpal was a director of Wellogic and served as the chief executive officer and a director of ACS until his resignation on September 2, 2014. Mr. Nagpal was also the owner of Method Factory, Inc., the company that sold the business and assets of ACS to Alere in 2011 and that sold Wellogic to us in 2012.
(b) SPD Joint Venture
In May 2007, we completed the formation of SPD Swiss Precision Diagnostics GmbH, or SPD, our 50/50 joint venture with Procter & Gamble, or P&G, for the development, manufacturing, marketing and sale of existing and to-be-developed consumer diagnostic products, outside the cardiometabolic, diabetes and oral care fields. Upon completion of the arrangement to form the joint venture, we ceased to consolidate the operating results of our consumer diagnostic products business related to the joint venture and instead account for our 50% interest in the results of the joint venture under the equity method of accounting.
We had a net payable to SPD of $1.2 million and $4.0 million as of December 31, 2015 and 2014, respectively. Included in the $1.2 million net payable balance as of December 31, 2015 is a receivable of approximately $1.5 million for costs incurred in connection with our 2008 SPD-related restructuring plans. Included in the $4.0 million net payable balance as of December 31, 2014 is approximately $1.6 million of costs incurred in connection with our 2008 SPD-related restructuring plans. We have also recorded a long-term receivable totaling approximately $8.9 million and $10.9 million as of December 31, 2015 and 2014, respectively, related to the 2008 SPD-related restructuring plans. Additionally, customer receivables associated with revenue earned after the formation of the joint venture was completed have been classified as other receivables within prepaid and other current assets on our consolidated balance sheets in the amount of $7.8 million and $9.6 million as of December 31, 2015 and 2014, respectively. In connection with the joint venture arrangement, the joint venture bears the collection risk associated with these receivables. Sales to the joint venture under our manufacturing agreement totaled $77.1 million, $83.2 million and $78.0 million during the years ended December 31, 2015, 2014 and 2013, respectively. Additionally, services revenue generated pursuant to the long-term services agreement with the joint venture totaled $1.1 million, $1.3 million and $1.3 million during the years ended December 31, 2015, 2014 and 2013, respectively. Sales under our manufacturing agreement and long-term services agreement are included in net product sales and services revenue, respectively, in our consolidated statements of operations.
Under the terms of our product supply agreement, SPD purchases products from our manufacturing facilities in China. SPD in turn sells a portion of those tests back to us for final assembly and packaging. Once packaged, a portion of the tests are sold to P&G for distribution to third-party
F-72
Table of Contents
ALERE INC. AND SUBSIDIARIES
NOTES TO CONSOLIDATED FINANCIAL STATEMENTS (Continued)
(20) Related Party Transactions (Continued)
customers in North America. We defer our profit on the products sold to SPD until the products are sold through to the customer. As a result of these related transactions, we have recorded $9.9 million and $10.5 million of trade receivables which are included in accounts receivable on our consolidated balance sheets as of December 31, 2015 and 2014, respectively, and $23.6 million and $30.8 million of trade accounts payable which are included in accounts payable on our consolidated balance sheets as of December 31, 2015 and 2014, respectively. During 2015 and 2013, we received $23.4 million and $28.0 million, respectively, in cash from SPD as a distribution of earnings, which are included in cash flows from investing activities in our consolidated statements of cash flows.
The following table summarizes our related party balances with SPD within our consolidated balance sheets (in thousands):
| Balance Sheet Caption |
As of December 31, | |||||||
| 2015 | 2014 | |||||||
| Accounts receivable, net of allowances |
$ | 9,873 | $ | 10,465 | ||||
| Prepaid expenses and other current assets |
$ | 6,602 | $ | 9,635 | ||||
| Deferred financing costs, net, and other non-current assets |
$ | 8,895 | $ | 10,875 | ||||
| Accounts payable |
$ | 24,887 | $ | 34,816 | ||||
As previously disclosed, SPD is currently involved in civil litigation brought by a competitor in the United States with respect to the advertising of one of SPD’s products in the United States. During 2015, SPD appealed the district court’s injunction with respect to sales and advertising of such product, which was based on a finding that SPD violated certain laws with respect to the advertising of such product. The appellate court has issued a stay of the injunction, pending the outcome of the appeal. A ruling on the appeal is expected in the near future. In addition, a class action lawsuit has been initiated against SPD in United States District Court for the Central District of California, alleging violations of certain laws in connection with the sales and advertising of one of SPD’s products which claims are based on similar grounds as those at issue in the litigation described above in this paragraph. SPD has moved to dismiss the class action lawsuit on the ground, among others, that the claims pleaded are preempted by federal law. A decision on the motion is expected shortly. In addition, there may be additional lawsuits against SPD or us relating to this matter in the future. The ultimate resolution of these matters is not known at this time, nor is the potential impact they may have on SPD or us, including whether any such resolution or any damages imposed by either court would have a material adverse impact on SPD and, ultimately, by virtue of our 50% interest in SPD, on our financial position or results of operations.
(c) Entrustment Loan Arrangement with SPD Shanghai
Alere (Shanghai) Diagnostics Co., Ltd., or Alere Shanghai, and SPD Trading (Shanghai) Co., Ltd., or SPD Shanghai, entered into an entrustment loan arrangement for a maximum of CNY 23 million (approximately $3.5 million at December 31, 2015), in order to finance the latter’s short-term working capital needs, with the Royal Bank of Scotland (China) Co., Ltd. Shanghai Branch, or RBS. The agreement governs the setting up of an Entrustment Loan Account with RBS, into which Alere Shanghai deposits certain monies. This restricted cash account provides a guarantee to RBS of amounts borrowed from RBS by SPD Shanghai. The Alere Shanghai RBS account is recorded as restricted cash on Alere Shanghai’s balance sheet and amounted to $3.5 million at December 31, 2015.
F-73
Table of Contents
ALERE INC. AND SUBSIDIARIES
NOTES TO CONSOLIDATED FINANCIAL STATEMENTS (Continued)
(20) Related Party Transactions (Continued)
(d) TechLab
We have an equity method investment in TechLab, Inc., or TechLab, a company that provides diagnostic testing products used by physicians and other health care customers to diagnose, treat, and monitor intestinal diseases and other medical conditions. We own approximately 49% of Techlab. We have also entered into an exclusive distributor agreement with Techlab. This agreement grants us the global distribution rights to Techlab’s products with certain exceptions. We had trade payables owed to Techlab of $3.2 million and $2.2 million as of December 31, 2015 and 2014, respectively. We made product purchases from Techlab of $27.1 million, $24.8 million and $25.2 million during the years ended December 31, 2015, 2014 and 2013, respectively.
(21) Valuation and Qualifying Accounts
We have established reserves against accounts receivable for doubtful accounts, product returns, discounts and other allowances. The activity in the table below includes all accounts receivable reserves. Provisions for doubtful accounts are recorded as a component of general and administrative expenses. Provisions for returns, discounts and other allowances are charged against net product sales. The following table sets forth activities in our accounts receivable reserve accounts (in thousands):
| Balance at Beginning of Period |
Provision | Amounts Charged Against Reserves |
Balance at End of Period |
|||||||||||||
| Year ended December 31, 2013 |
$ | 30,073 | $ | 65,643 | $ | (26,570 | ) | $ | 69,146 | |||||||
| Year ended December 31, 2014 |
$ | 69,146 | $ | 42,477 | $ | (35,460 | ) | $ | 76,163 | |||||||
| Year ended December 31, 2015 |
$ | 76,163 | $ | 45,279 | $ | (31,741 | ) | $ | 89,701 | |||||||
We have established reserves against obsolete and slow-moving inventories. The activity in the table below includes all inventory reserves. Provisions for obsolete and slow-moving inventories are recorded as a component of cost of net product sales. The following table sets forth activities in our inventory reserve accounts (in thousands):
| Balance at Beginning of Period |
Provision | Amounts Charged Against Reserves |
Balance at End of Period |
|||||||||||||
| Year ended December 31, 2013 |
$ | 21,822 | $ | 3,286 | $ | (3,671 | ) | $ | 21,437 | |||||||
| Year ended December 31, 2014 |
$ | 21,437 | $ | 12,818 | $ | (6,907 | ) | $ | 27,348 | |||||||
| Year ended December 31, 2015 |
$ | 27,348 | $ | 21,592 | $ | (11,165 | ) | $ | 37,775 | |||||||
We have established a valuation allowance against our deferred tax assets based on the weight of available positive and negative evidence, including our estimates of future income by the jurisdictions in which we operate and the period over which our deferred tax assets will be recoverable. The following table sets forth activities in our deferred tax accounts (in thousands):
| Balance at Beginning of Period |
Additions | Amounts Charged Against Other Accounts |
Balance at End of Period |
|||||||||||||
| Year ended December 31, 2013 |
$ | 75,455 | $ | 5,598 | $ | 3,262 | $ | 84,315 | ||||||||
| Year ended December 31, 2014 |
$ | 84,315 | $ | 143,454 | $ | 864 | $ | 228,633 | ||||||||
| Year ended December 31, 2015 |
$ | 228,633 | $ | 33,590 | $ | — | $ | 262,223 | ||||||||
F-74
Table of Contents
ALERE INC. AND SUBSIDIARIES
NOTES TO CONSOLIDATED FINANCIAL STATEMENTS (Continued)
(22) Restructuring Activities
The following table sets forth aggregate restructuring charges recorded in our consolidated statements of operations for the years ended December 31, 2015, 2014 and 2013 (in thousands):
| Statement of Operations Caption |
2015 | 2014 | 2013 | |||||||||
| Cost of net revenue |
$ | 3,816 | $ | 11,760 | $ | 6,145 | ||||||
| Research and development |
2,752 | 9,800 | 1,795 | |||||||||
| Sales and marketing |
3,004 | 11,350 | 1,550 | |||||||||
| General and administrative |
6,071 | 25,786 | 4,953 | |||||||||
|
|
|
|
|
|
|
|||||||
| Total operating expenses |
15,643 | 58,696 | 14,443 | |||||||||
| Interest expense, including amortization of original issue discounts and deferred financing costs |
24 | 42 | 58 | |||||||||
|
|
|
|
|
|
|
|||||||
| Total charges |
$ | 15,667 | $ | 58,738 | $ | 14,501 | ||||||
|
|
|
|
|
|
|
|||||||
(a) 2014 Restructuring Plans
In 2014, management developed world-wide cost reduction plans to reduce costs and improve operational efficiencies within our professional diagnostics and corporate and other business segments, primarily impacting our global sales and marketing, information technology, and research and development groups, as well as closing certain business locations in Europe and Asia. The following table summarizes the restructuring activities related to our 2014 restructuring plans for the year ended December 31, 2015 and 2014 and since inception of these restructuring plans (in thousands):
| Professional Diagnostics |
2015 | 2014 | Since Inception |
|||||||||
| Severance-related costs |
$ | 7,143 | $ | 27,806 | $ | 34,949 | ||||||
| Facility and transition costs |
3,452 | 3,460 | 6,912 | |||||||||
|
|
|
|
|
|
|
|||||||
| Cash charges |
10,595 | 31,266 | 41,861 | |||||||||
| Fixed asset and inventory impairments |
678 | 10,952 | 11,630 | |||||||||
| Other non-cash charges |
1,918 | — | 1,918 | |||||||||
|
|
|
|
|
|
|
|||||||
| Total charges |
$ | 13,191 | $ | 42,218 | $ | 55,409 | ||||||
|
|
|
|
|
|
|
|||||||
| Corporate and Other |
2015 | 2014 | Since Inception |
|||||||||
| Severance-related costs |
$ | 1,376 | $ | 2,901 | $ | 4,277 | ||||||
| Facility and transition costs |
(14 | ) | 11,334 | 11,322 | ||||||||
|
|
|
|
|
|
|
|||||||
| Total cash charges |
$ | 1,362 | $ | 14,235 | $ | 15,599 | ||||||
|
|
|
|
|
|
|
|||||||
We anticipate incurring approximately $4.4 million in additional costs under our 2014 restructuring plans related to our professional diagnostics business segment, primarily related to the closure of our manufacturing facility in Israel. We do not anticipate incurring significant additional costs under our existing 2014 restructuring plans relating to our corporate and other business segment. As of December 31, 2015, $2.8 million in severance and transition costs arising under our 2014 restructuring plans remain unpaid.
(b) Restructuring Plans Prior to 2014
In 2013, management developed cost reduction plans impacting businesses in our United States, Europe and Asia Pacific regions. In 2012, management developed cost reduction plans to integrate our
F-75
Table of Contents
ALERE INC. AND SUBSIDIARIES
NOTES TO CONSOLIDATED FINANCIAL STATEMENTS (Continued)
(22) Restructuring Activities (Continued)
businesses in Brazil, Europe and the United States. In 2011, management developed plans to consolidate operating activities among certain of our United States, European and Asia Pacific subsidiaries, including transferring the manufacturing of our Panbio products from Australia to our Standard Diagnostics facility in South Korea and eliminating redundant costs among our Axis-Shield subsidiaries. Additionally, in 2008, management developed and initiated plans to transition the Cholestech business to our San Diego, California facility. All of these plans impacted our professional diagnostics business segment.
The following table summarizes the restructuring activities related to our active restructuring plans for the years ended December 31, 2015, 2014, and 2013 and since inception of these restructuring plans (in thousands):
| Professional Diagnostics |
2015 | 2014 | 2013(1) | Since Inception |
||||||||||||
| Severance-related costs |
$ | — | $ | 1,265 | $ | 7,668 | $ | 32,626 | ||||||||
| Facility and transition costs |
1,089 | 938 | 4,238 | 12,011 | ||||||||||||
| Other exit costs |
24 | 42 | 58 | 822 | ||||||||||||
|
|
|
|
|
|
|
|
|
|||||||||
| Cash charges |
1,113 | 2,245 | 11,964 | 45,459 | ||||||||||||
| Fixed asset and inventory impairments |
— | 39 | 1,851 | 7,880 | ||||||||||||
| Intangible asset impairments |
— | — | 686 | 686 | ||||||||||||
| Other non-cash charges |
— | — | — | 64 | ||||||||||||
|
|
|
|
|
|
|
|
|
|||||||||
| Total charges |
$ | 1,113 | $ | 2,284 | $ | 14,501 | $ | 54,089 | ||||||||
|
|
|
|
|
|
|
|
|
|||||||||
| (1) | Includes amounts related to our former patient self-testing segment. |
We do not anticipate incurring significant additional costs under these plans related to our professional diagnostics business segments. As of December 31, 2015, $1.1 million in cash charges remain unpaid, primarily related to facility lease obligations, which are anticipated to continue through 2017.
(d) Restructuring Reserves
The following table summarizes our restructuring reserves related to the plans described above, of which $3.2 million is included in accrued expenses and other current liabilities and $0.6 million is included in other long-term liabilities on our consolidated balance sheets (in thousands):
| Severance- related Costs |
Facility and Transition Costs |
Other Exit Costs |
Total | |||||||||||||
| Balance, December 31, 2012 |
$ | 2,011 | $ | 256 | $ | 415 | $ | 2,682 | ||||||||
| Cash charges |
7,668 | 4,238 | 58 | 11,964 | ||||||||||||
| Payments |
(8,573 | ) | (2,725 | ) | (106 | ) | (11,404 | ) | ||||||||
| Currency adjustments |
(114 | ) | 12 | — | (102 | ) | ||||||||||
|
|
|
|
|
|
|
|
|
|||||||||
| Balance, December 31, 2013 |
992 | 1,781 | 367 | 3,140 | ||||||||||||
| Cash charges |
31,972 | 15,733 | 42 | 47,747 | ||||||||||||
| Payments |
(27,394 | ) | (7,345 | ) | (119 | ) | (34,858 | ) | ||||||||
| Currency adjustments |
(980 | ) | (301 | ) | — | (1,281 | ) | |||||||||
|
|
|
|
|
|
|
|
|
|||||||||
| Balance, December 31, 2014 |
4,590 | 9,868 | 290 | 14,748 | ||||||||||||
| Cash charges |
8,519 | 4,528 | 24 | 13,071 | ||||||||||||
| Payments |
(11,145 | ) | (12,222 | ) | (134 | ) | (23,501 | ) | ||||||||
| Currency adjustments |
(331 | ) | (208 | ) | — | (539 | ) | |||||||||
|
|
|
|
|
|
|
|
|
|||||||||
| Balance, December 31, 2015 |
$ | 1,633 | $ | 1,966 | $ | 180 | $ | 3,779 | ||||||||
|
|
|
|
|
|
|
|
|
|||||||||
F-76
Table of Contents
ALERE INC. AND SUBSIDIARIES
NOTES TO CONSOLIDATED FINANCIAL STATEMENTS (Continued)
(23) Equity Investments
We account for the results from our equity investments under the equity method of accounting in accordance with ASC 323, Investments — Equity Method and Joint Ventures, based on the percentage of our ownership interest in the business. Our equity investments primarily include the following:
(a) SPD
We recorded earnings of $14.3 million, $16.2 million and $15.0 million for the years ended December 31, 2015, 2014 and 2013, respectively, in equity earnings of unconsolidated entities, net of tax, in our consolidated statements of operations, which represented our 50% share of SPD’s net income for the respective periods and elimination of intercompany profit in inventory related to sales from Alere to SPD which is reflected in SPD’s net income.
(b) TechLab
We recorded earnings of $1.5 million, $1.6 million and $2.0 million for the years ended December 31, 2015, 2014 and 2013, respectively, in equity earnings of unconsolidated entities, net of tax, in our consolidated statements of operations, which represented our minority share of TechLab’s net income for the respective periods.
As of December 31, 2015, we continued to meet the held for sale criteria with respect to our 49% investment in TechLab. We intend to use all or a portion of the proceeds from any sale of this investment to fund our working capital, operations, research and development or repay a portion of our outstanding indebtedness. Accordingly, we have classified our investment in TechLab in assets held for sale – non-current in our consolidated balance sheet as of December 31, 2015.
Summarized financial information for SPD and TechLab on a combined basis is as follows (in thousands):
Combined Condensed Results of Operations:
| For The Years Ended December 31, | ||||||||||||
| 2015 | 2014 | 2013 | ||||||||||
| Net revenue |
$ | 202,611 | $ | 211,370 | $ | 203,115 | ||||||
|
|
|
|
|
|
|
|||||||
| Gross profit |
$ | 147,386 | $ | 160,192 | $ | 152,698 | ||||||
|
|
|
|
|
|
|
|||||||
| Net income after taxes |
$ | 32,457 | $ | 35,646 | $ | 34,079 | ||||||
|
|
|
|
|
|
|
|||||||
Combined Condensed Balance Sheets:
| As of December 31, | ||||||||
| 2015 | 2014 | |||||||
| Current assets |
$ | 71,542 | $ | 90,546 | ||||
| Non-current assets |
30,802 | 33,697 | ||||||
|
|
|
|
|
|||||
| Total assets |
$ | 102,344 | $ | 124,243 | ||||
|
|
|
|
|
|||||
| Current liabilities |
$ | 37,609 | $ | 35,954 | ||||
| Non-current liabilities |
5,157 | 5,884 | ||||||
|
|
|
|
|
|||||
| Total liabilities |
$ | 42,766 | $ | 41,838 | ||||
|
|
|
|
|
|||||
F-77
Table of Contents
ALERE INC. AND SUBSIDIARIES
NOTES TO CONSOLIDATED FINANCIAL STATEMENTS (Continued)
(23) Equity Investments (Continued)
The dividends we received in cash as a return of capital from our equity investments have been included in our consolidated statements of cash flows for all the periods presented.
(24) Assets Held for Sale
(a) Sale of Alere E-Santé
In December 2015, we entered into an agreement with Air Liquide Santé International to sell 100% of the shares and voting rights of Alere E-Santé SAS, or Alere E-Santé, a wholly owned subsidiary of Alere Inc. for a total purchase price of $9.0 million, including up to $1.5 million of contingent cash consideration. The final purchase price was subject to a post-closing working capital adjustment. The E-Santé business is a component of our professional diagnostics reporting unit. We have segregated and classified $4.2 million of various assets associated with our E-Santé business, including $3.2 million of allocated goodwill, as assets held for sale—current and $0.4 million of various liabilities as liabilities related to assets held for sale—current, on our consolidated balance sheet as of December 31, 2015.
In January 2016, we completed the sale of Alere E-Santé. We received cash consideration of approximately $8.1 million, net of the final working capital adjustment. As a result of this transaction, we recorded a $3.8 million gain in 2016 on the disposition of the Alere E-Santé business.
(b) Sale of TechLab Equity Method Investment
As of December 31, 2015, we continued to meet the held for sale criteria with respect to our 49% investment in TechLab. We intend to use all or a portion of the proceeds from any sale of this investment to fund our working capital, operations, research and development or repay a portion of our outstanding indebtedness. Accordingly, we have classified our investment in TechLab, with a value of approximately $13.3 million, in assets held for sale – non-current in our consolidated balance sheet as of December 31, 2015. See Note 23(b).
(25) Impairment and (Gain) Loss on Dispositions, Net
In November 2015, we completed the sale of the BBI business. The BBI business was a component of our professional diagnostics reporting unit and business segment. We received cash consideration of approximately $106.4 million, net of a final working capital adjustment, and we are eligible to receive contingent consideration payments of up to $46.6 million upon the achievement of certain milestones. The net assets disposed of in connection with the disposition of the BBI business were valued at an aggregate of $66.5 million and the value of the allocated goodwill was $49.2 million. Because the aggregate value of the net assets and goodwill disposed of in the transaction exceeded the closing cash consideration, we recorded a $9.3 million loss in 2015 on the disposition of the BBI business.
In July 2015, we sold certain assets of our Inverness Medical Innovations Australia Pty Ltd business, which was part of our professional diagnostics reporting unit and business segment, for AUD 0.2 million (approximately $0.1 million as of the date of disposition) in cash proceeds and, as a result of this transaction, we recorded a loss of $1.2 million during 2015.
In May 2015, we sold our Alere Analytics business, which was part of our professional diagnostics reporting unit and business segment. Under the terms of the sale we received nominal consideration and agreed to contribute working capital of $2.7 million to Alere Analytics, of which $2.4 million was
F-78
Table of Contents
ALERE INC. AND SUBSIDIARIES
NOTES TO CONSOLIDATED FINANCIAL STATEMENTS (Continued)
(25) Impairment and (Gain) Loss on Dispositions, Net (Continued)
contributed in cash immediately prior to the closing of the sale and the remaining $0.3 million of which was deposited in escrow pending the performance by the buyers under certain contracts. As a result of this transaction we recorded a loss of $3.6 million during 2015. During 2015, before identifying a buyer for Alere Analytics, our management decided to close the business, and in connection with this decision we recorded an impairment charge of $26.7 million during 2015, including the write-off of $26.2 million of acquisition-related intangible assets and $0.5 million of fixed assets.
In March 2015, we sold certain assets of our AdnaGen GmbH business, which was part of our professional diagnostics reporting unit and business segment, for approximately $4.6 million in cash proceeds and, as a result of this transaction, we recorded a loss of $0.3 million during 2015.
In March 2015, we sold our Gesellschaft fur Patientenhilfe DGP GmbH subsidiary, which was part of our professional diagnostics reporting unit and business segment, for €7.6 million (approximately $8.2 million at March 31, 2015) and, as a result of this transaction, we recorded a loss on disposition of $7.5 million during 2015.
We recorded additional charges of approximately $0.8 million in connection with certain other business closures or divestitures during 2015.
In December 2014, our management decided to close our Alere Connect, LLC subsidiary located in Scottsdale, Arizona. In connection with this decision, we recorded an impairment charge of $10.8 million. During 2015, in connection with this decision, we recorded impairment charges of $1.1 million, consisting primarily of severance costs, inventory write-offs and other closure-related expenses.
In November 2014, we sold BioNote to the former owner of that company who was also its Chief Executive Officer while it was owned by us. We received cash consideration of KRW 48.0 billion (approximately $43.2 million at the date of disposition), resulting in a gain on disposition of $6.5 million.
In October 2014, we sold our subsidiary Mologic Ltd., located in the United Kingdom, to former owners of the company who were also members of management while it was owned by us. The consideration received was nominal, resulting in a loss on disposition of $2.8 million.
The financial results for the above businesses are immaterial to our consolidated financial results.
(26) Supplemental Cash Flow Information
Cash Paid for Interest and Income Taxes:
During 2015, 2014 and 2013, we made cash payments for interest totaling $167.6 million, $192.1 million and $206.3 million, respectively.
During 2015, 2014 and 2013, total net cash paid for income taxes was $36.5 million, $58.8 million and $49.1 million, respectively.
(27) Guarantor Financial Information
Our 7.25% senior notes due 2018, our 6.5% senior subordinated notes due 2020 and our 6.375% senior subordinated notes due 2023 are guaranteed, and before their redemption on October 1, 2015, our 8.625% senior subordinated notes due 2018 were guaranteed, by certain of our consolidated 100% owned subsidiaries, or the Guarantor Subsidiaries. The guarantees are full and unconditional and joint
F-79
Table of Contents
ALERE INC. AND SUBSIDIARIES
NOTES TO CONSOLIDATED FINANCIAL STATEMENTS (Continued)
(27) Guarantor Financial Information (Continued)
and several. The following supplemental financial information sets forth, on a consolidating basis, audited balance sheets as of December 31, 2015 and 2014, the related statements of operations, statements of comprehensive income (loss) and cash flows for each of the three years in the period ended December 31, 2015, respectively, for Alere Inc., the Guarantor Subsidiaries and our other subsidiaries, or the Non-Guarantor Subsidiaries. The supplemental financial information reflects the investments of Alere Inc. and the Guarantor Subsidiaries in the Guarantor and Non-Guarantor Subsidiaries using the equity method of accounting.
We have extensive transactions and relationships between various members of the consolidated group. These transactions and relationships include intercompany pricing agreements, intellectual property royalty agreements and general and administrative and research and development cost-sharing agreements. Because of these relationships, it is possible that the terms of these transactions are not the same as those that would result from transactions among wholly unrelated parties.
For comparative purposes, certain amounts for prior periods have been reclassified to conform to the current period classification. Prior periods have been presented on a basis that is consistent with the current period, giving retrospective effect to the impact of discontinued operations.
As discussed in Note 2, in connection with the preparation of our consolidated financial statements for 2015, we determined that, in 2013 and 2014, each of the interim periods in 2014, and the first three quarters of fiscal 2015, we had incorrectly recorded the revenue for such periods. In addition, we made several out-of-period adjustments related the correction of a specific bonus accrual, the measurement of a certain royalty obligation and adjustments related to the accounting for income taxes. As a result, we are revising our consolidated financial information as of December 31, 2014 and 2013 and the interim periods in 2014 and the first three quarters of 2015. The revisions to the Guarantor consolidating statements of cash flows did not impact previously reported net cash flows from operating activities, investing activities, or financing activities and as a result, there was no net impact to net change in cash and cash equivalents for any previously reported periods.
The following schedules reconcile the amounts as previously reported in guarantor financial information, consolidating financial statements to the corresponding revised amounts:
| Year Ended December 31, 2014 | ||||||||||||
| Revised Consolidating Statement of Operations- Guarantor Subsidiaries (in thousands) |
As Previously Reported |
Revision Adjustment |
As Revised |
|||||||||
| Net revenue |
$ | 1,330,816 | $ | 2,379 | $ | 1,333,195 | ||||||
| Cost of net revenue |
$ | 761,054 | $ | 509 | $ | 761,563 | ||||||
| General and administrative |
$ | 155,794 | $ | 1 | $ | 155,795 | ||||||
| Loss from continuing operations before benefit for income taxes |
$ | 110,945 | $ | 379 | $ | 111,324 | ||||||
| Income (loss) from continuing operations |
$ | 66,790 | $ | 379 | $ | 67,169 | ||||||
| As of December 31, 2014 | ||||||||||||
| Revised Consolidating Balance Sheet- Guarantor Subsidiaries (In thousands) |
As Previously Reported |
Revision Adjustment |
As Revised |
|||||||||
| Total current assets |
$ | 1,702,939 | $ | (139 | ) | $ | 1,702,800 | |||||
| Total assets |
$ | 5,318,120 | $ | (138 | ) | $ | 5,317,982 | |||||
| Total current liabilities |
$ | 1,022,546 | $ | (1,521 | ) | $ | 1,021,025 | |||||
| Total long term-liabilities |
$ | 1,580,151 | $ | 1 | $ | 1,580,152 | ||||||
| Total equity |
$ | 2,715,423 | $ | 1,382 | $ | 2,716,805 | ||||||
| Total liabilities and equity |
$ | 5,318,120 | $ | (138 | ) | $ | 5,317,982 | |||||
F-80
Table of Contents
ALERE INC. AND SUBSIDIARIES
NOTES TO CONSOLIDATED FINANCIAL STATEMENTS (Continued)
(27) Guarantor Financial Information (Continued)
| Year Ended December 31, 2013 | ||||||||||||
| Revised Consolidating Statement of Operations- Guarantor Subsidiaries(in |
As Previously Reported |
Revision Adjustment |
As Revised |
|||||||||
| Net revenue |
$ | 1,356,313 | $ | (2,322 | ) | $ | 1,353,991 | |||||
| Cost of net revenue |
$ | 733,098 | $ | (487 | ) | $ | 732,611 | |||||
| Sales and Marketing |
$ | 255,949 | $ | 1 | $ | 255,950 | ||||||
| Loss from continuing operations before benefit for income taxes |
$ | 158,126 | $ | (1,836 | ) | $ | 156,290 | |||||
| Income (loss) from continuing operations |
$ | 73,991 | $ | (1,836 | ) | $ | 72,155 | |||||
| Year Ended December 31, 2014 | ||||||||||||
| Revised Consolidating Statement of Operations- Non-Guarantor (in thousands) |
As Previously Reported |
Revision Adjustment |
As Revised |
|||||||||
| Net revenue |
$ | 1,507,227 | $ | (15,805 | ) | $ | 1,491,422 | |||||
| Cost of net revenue |
$ | 855,221 | $ | (7,237 | ) | $ | 847,984 | |||||
| Sales and Marketing |
$ | 273,797 | $ | (840 | ) | $ | 272,957 | |||||
| General and administrative |
$ | 204,242 | $ | (361 | ) | $ | 203,881 | |||||
| Loss from continuing operations before benefit for income taxes |
$ | 101,876 | $ | (7,367 | ) | $ | 94,509 | |||||
| Provision (benefit) for income taxes |
$ | 49,347 | $ | (2,729 | ) | $ | 46,618 | |||||
| Income (loss) from continuing operations |
$ | 68,457 | $ | (4,638 | ) | $ | 63,819 | |||||
| As of December 31, 2014 | ||||||||||||
| Revised Consolidating Balance Sheet- Non-Guarantor Subsidiaries (In thousands) |
As Previously Reported |
Revision Adjustment |
As Revised |
|||||||||
| Total current assets |
$ | 1,014,322 | $ | 7,312 | $ | 1,021,634 | ||||||
| Total assets |
$ | 3,095,976 | $ | 7,965 | $ | 3,103,941 | ||||||
| Total current liabilities |
$ | 637,659 | $ | 18,933 | $ | 656,592 | ||||||
| Total long term-liabilities |
$ | 1,186,410 | $ | 1,033 | $ | 1,187,443 | ||||||
| Total equity |
$ | 1,271,907 | $ | (12,001 | ) | $ | 1,259,906 | |||||
| Total liabilities and equity |
$ | 3,095,976 | $ | 7,965 | $ | 3,103,941 | ||||||
| Year Ended December 31, 2013 | ||||||||||||
| Revised Consolidating Statement of Operations- Non-Guarantor (in thousands) |
As Previously Reported |
Revision Adjustment |
As Revised |
|||||||||
| Net revenue |
$ | 1,460,137 | $ | (5,406 | ) | $ | 1,454,731 | |||||
| Cost of net revenue |
$ | 759,911 | $ | (2,299 | ) | $ | 757,612 | |||||
| Sales and Marketing |
$ | 303,848 | $ | (1 | ) | $ | 303,847 | |||||
| General and administrative |
$ | 217,246 | $ | 1 | $ | 217,247 | ||||||
| Loss from continuing operations before benefit for income taxes |
$ | 101,133 | $ | (3,107 | ) | $ | 98,026 | |||||
| Provision (benefit) for income taxes |
$ | 42,038 | $ | (237 | ) | $ | 41,801 | |||||
| Income (loss) from continuing operations |
$ | 74,565 | $ | (2,870 | ) | $ | 71,695 | |||||
F-81
Table of Contents
ALERE INC. AND SUBSIDIARIES
NOTES TO CONSOLIDATED FINANCIAL STATEMENTS (Continued)
(27) Guarantor Financial Information (Continued)
CONSOLIDATING STATEMENT OF OPERATIONS
For the Year Ended December 31, 2015
(in thousands)
| Issuer | Guarantor Subsidiaries |
Non-Guarantor Subsidiaries |
Eliminations | Consolidated | ||||||||||||||||
| Net product sales. |
$ | — | $ | 892,086 | $ | 1,326,454 | $ | (264,509 | ) | $ | 1,954,031 | |||||||||
| Services revenue |
— | 440,709 | 51,599 | — | 492,308 | |||||||||||||||
|
|
|
|
|
|
|
|
|
|
|
|||||||||||
| Net product sales and services revenue. |
— | 1,332,795 | 1,378,053 | (264,509 | ) | 2,446,339 | ||||||||||||||
| License and royalty revenue. |
— | 12,968 | 19,594 | (15,585 | ) | 16,977 | ||||||||||||||
|
|
|
|
|
|
|
|
|
|
|
|||||||||||
| Net revenue |
— | 1,345,763 | 1,397,647 | (280,094 | ) | 2,463,316 | ||||||||||||||
|
|
|
|
|
|
|
|
|
|
|
|||||||||||
| Cost of net product sales. |
3,114 | 510,918 | 759,411 | (230,840 | ) | 1,042,603 | ||||||||||||||
| Cost of services revenue |
205 | 305,813 | 30,319 | (31,949 | ) | 304,388 | ||||||||||||||
|
|
|
|
|
|
|
|
|
|
|
|||||||||||
| Cost of net product sales and services revenue. |
3,319 | 816,731 | 789,730 | (262,789 | ) | 1,346,991 | ||||||||||||||
| Cost of license and royalty revenue. |
(40 | ) | 230 | 19,175 | (15,584 | ) | 3,781 | |||||||||||||
|
|
|
|
|
|
|
|
|
|
|
|||||||||||
| Cost of net revenue |
3,279 | 816,961 | 808,905 | (278,373 | ) | 1,350,772 | ||||||||||||||
|
|
|
|
|
|
|
|
|
|
|
|||||||||||
| Gross profit (loss). |
(3,279 | ) | 528,802 | 588,742 | (1,721 | ) | 1,112,544 | |||||||||||||
| Operating expenses: |
||||||||||||||||||||
| Research and development. |
16,461 | 60,787 | 42,205 | — | 119,453 | |||||||||||||||
| Sales and marketing. |
5,901 | 219,566 | 209,664 | — | 435,131 | |||||||||||||||
| General and administrative. |
119,520 | 147,539 | 102,511 | — | 369,570 | |||||||||||||||
| Impairment and (gain) loss on dispositions, net |
79,951 | (8,747 | ) | (20,664 | ) | — | 50,540 | |||||||||||||
|
|
|
|
|
|
|
|
|
|
|
|||||||||||
| Operating income (loss). |
(225,112 | ) | 109,657 | 255,026 | (1,721 | ) | 137,850 | |||||||||||||
| Interest expense, including amortization of original issue discounts and deferred financing costs. |
(215,070 | ) | (11,517 | ) | (18,227 | ) | 27,817 | (216,997 | ) | |||||||||||
| Other income (expense), net |
10,008 | 14,276 | 4,890 | (31,017 | ) | (1,843 | ) | |||||||||||||
|
|
|
|
|
|
|
|
|
|
|
|||||||||||
| Income (loss) from continuing operations before provision (benefit) for income taxes. |
(430,174 | ) | 112,416 | 241,689 | (4,921 | ) | (80,990 | ) | ||||||||||||
| Provision (benefit) for income taxes. |
(151,406 | ) | 33,447 | 64,947 | 308 | (52,704 | ) | |||||||||||||
|
|
|
|
|
|
|
|
|
|
|
|||||||||||
| Income (loss) from continuing operations before equity in earnings of subsidiaries and unconsolidated entities, net of tax |
(278,768 | ) | 78,969 | 176,742 | (5,229 | ) | (28,286 | ) | ||||||||||||
| Equity in earnings of subsidiaries, net of tax. |
262,616 | — | — | (262,616 | ) | — | ||||||||||||||
| Equity earnings of unconsolidated entities, net of tax. |
1,484 | — | 14,065 | (19 | ) | 15,530 | ||||||||||||||
|
|
|
|
|
|
|
|
|
|
|
|||||||||||
| Income from continuing operations. |
(14,668 | ) | 78,969 | 190,807 | (267,864 | ) | (12,756 | ) | ||||||||||||
| Income (loss) from discontinued operations, net of tax. |
221,425 | (1,912 | ) | — | — | 219,513 | ||||||||||||||
|
|
|
|
|
|
|
|
|
|
|
|||||||||||
| Net income. |
206,757 | 77,057 | 190,807 | (267,864 | ) | 206,757 | ||||||||||||||
| Less: Net income attributable to non-controlling interests. |
— | — | 381 | — | 381 | |||||||||||||||
|
|
|
|
|
|
|
|
|
|
|
|||||||||||
| Net income attributable to Alere Inc. and Subsidiaries. |
206,757 | 77,057 | 190,426 | (267,864 | ) | 206,376 | ||||||||||||||
| Preferred stock dividends. |
(21,293 | ) | — | — | — | (21,293 | ) | |||||||||||||
|
|
|
|
|
|
|
|
|
|
|
|||||||||||
| Net income available to common stockholders. |
$ | 185,464 | $ | 77,057 | $ | 190,426 | $ | (267,864 | ) | $ | 185,083 | |||||||||
|
|
|
|
|
|
|
|
|
|
|
|||||||||||
F-82
Table of Contents
ALERE INC. AND SUBSIDIARIES
NOTES TO CONSOLIDATED FINANCIAL STATEMENTS (Continued)
(27) Guarantor Financial Information (Continued)
CONSOLIDATING STATEMENT OF OPERATIONS
For the Year Ended December 31, 2014
(in thousands)
| Issuer | Guarantor Subsidiaries |
Non-Guarantor Subsidiaries |
Eliminations | Consolidated | ||||||||||||||||
| Net product sales |
$ | — | $ | 855,435 | $ | 1,403,871 | $ | (237,066 | ) | $ | 2,022,240 | |||||||||
| Services revenue |
— | 464,283 | 67,705 | — | 531,988 | |||||||||||||||
|
|
|
|
|
|
|
|
|
|
|
|||||||||||
| Net product sales and services revenue |
— | 1,319,718 | 1,471,576 | (237,066 | ) | 2,554,228 | ||||||||||||||
| License and royalty revenue |
— | 13,477 | 19,846 | (12,273 | ) | 21,050 | ||||||||||||||
|
|
|
|
|
|
|
|
|
|
|
|||||||||||
| Net revenue |
— | 1,333,195 | 1,491,422 | (249,339 | ) | 2,575,278 | ||||||||||||||
|
|
|
|
|
|
|
|
|
|
|
|||||||||||
| Cost of net product sales |
5,329 | 473,076 | 796,775 | (212,681 | ) | 1,062,499 | ||||||||||||||
| Cost of services revenue |
261 | 288,288 | 33,584 | (27,184 | ) | 294,949 | ||||||||||||||
|
|
|
|
|
|
|
|
|
|
|
|||||||||||
| Cost of net product sales and services revenue |
5,590 | 761,364 | 830,359 | (239,865 | ) | 1,357,448 | ||||||||||||||
| Cost of license and royalty revenue |
40 | 199 | 17,625 | (12,272 | ) | 5,592 | ||||||||||||||
|
|
|
|
|
|
|
|
|
|
|
|||||||||||
| Cost of net revenue |
5,630 | 761,563 | 847,984 | (252,137 | ) | 1,363,040 | ||||||||||||||
|
|
|
|
|
|
|
|
|
|
|
|||||||||||
| Gross profit (loss) |
(5,630 | ) | 571,632 | 643,438 | 2,798 | 1,212,238 | ||||||||||||||
| Operating expenses: |
||||||||||||||||||||
| Research and development |
23,190 | 61,862 | 59,776 | — | 144,828 | |||||||||||||||
| Sales and marketing |
7,598 | 232,406 | 272,957 | — | 512,961 | |||||||||||||||
| General and administrative |
93,952 | 155,795 | 203,881 | — | 453,628 | |||||||||||||||
| Impairment and gain (loss) on dispositions, net |
4,236 | 11,393 | (7,887 | ) | — | 7,742 | ||||||||||||||
|
|
|
|
|
|
|
|
|
|
|
|||||||||||
| Operating income (loss) |
(134,606 | ) | 110,176 | 114,711 | 2,798 | 93,079 | ||||||||||||||
| Interest expense, including amortization of original issue discounts and deferred financing costs |
(205,919 | ) | (18,995 | ) | (18,629 | ) | 34,352 | (209,191 | ) | |||||||||||
| Other income (expense), net |
13,626 | 20,143 | (1,573 | ) | (34,417 | ) | (2,221 | ) | ||||||||||||
|
|
|
|
|
|
|
|
|
|
|
|||||||||||
| Income (loss) from continuing operations before provision (benefit) for income taxes |
(326,899 | ) | 111,324 | 94,509 | 2,733 | (118,333 | ) | |||||||||||||
| Provision (benefit) for income taxes |
(20,865 | ) | 44,155 | 46,618 | 1,022 | 70,930 | ||||||||||||||
|
|
|
|
|
|
|
|
|
|
|
|||||||||||
| Income (loss) from continuing operations before equity in earnings of subsidiaries and unconsolidated entities, net of tax |
(306,034 | ) | 67,169 | 47,891 | 1,711 | (189,263 | ) | |||||||||||||
| Equity in earnings of subsidiaries, net of tax |
125,130 | — | — | (125,130 | ) | — | ||||||||||||||
| Equity earnings of unconsolidated entities, net of tax |
1,717 | — | 15,928 | (136 | ) | 17,509 | ||||||||||||||
|
|
|
|
|
|
|
|
|
|
|
|||||||||||
| Income (loss) from continuing operations |
(179,187 | ) | 67,169 | 63,819 | (123,555 | ) | (171,754 | ) | ||||||||||||
| Income (loss) from discontinued operations, net of tax |
145,751 | (27,839 | ) | 20,400 | 6 | 138,318 | ||||||||||||||
|
|
|
|
|
|
|
|
|
|
|
|||||||||||
| Net income (loss) |
(33,436 | ) | 39,330 | 84,219 | (123,549 | ) | (33,436 | ) | ||||||||||||
| Less: Net income attributable to non-controlling interests |
— | — | 30 | — | 30 | |||||||||||||||
|
|
|
|
|
|
|
|
|
|
|
|||||||||||
| Net income (loss) attributable to Alere Inc. and Subsidiaries |
(33,436 | ) | 39,330 | 84,189 | (123,549 | ) | (33,466 | ) | ||||||||||||
| Preferred stock dividends |
(21,293 | ) | — | — | — | (21,293 | ) | |||||||||||||
|
|
|
|
|
|
|
|
|
|
|
|||||||||||
| Net income (loss) available to common stockholders |
$ | (54,729 | ) | $ | 39,330 | $ | 84,189 | $ | (123,549 | ) | $ | (54,759 | ) | |||||||
|
|
|
|
|
|
|
|
|
|
|
|||||||||||
F-83
Table of Contents
ALERE INC. AND SUBSIDIARIES
NOTES TO CONSOLIDATED FINANCIAL STATEMENTS (Continued)
(27) Guarantor Financial Information (Continued)
CONSOLIDATING STATEMENT OF OPERATIONS
For the Year Ended December 31, 2013
(in thousands)
| Issuer | Guarantor Subsidiaries |
Non-Guarantor Subsidiaries |
Eliminations | Consolidated | ||||||||||||||||
| Net product sales |
$ | — | $ | 878,391 | $ | 1,357,445 | $ | (187,047 | ) | $ | 2,048,789 | |||||||||
| Services revenue |
— | 454,989 | 77,629 | — | 532,618 | |||||||||||||||
|
|
|
|
|
|
|
|
|
|
|
|||||||||||
| Net product sales and services revenue |
— | 1,333,380 | 1,435,074 | (187,047 | ) | 2,581,407 | ||||||||||||||
| License and royalty revenue |
— | 20,611 | 19,657 | (13,039 | ) | 27,229 | ||||||||||||||
|
|
|
|
|
|
|
|
|
|
|
|||||||||||
| Net revenue |
— | 1,353,991 | 1,454,731 | (200,086 | ) | 2,608,636 | ||||||||||||||
|
|
|
|
|
|
|
|
|
|
|
|||||||||||
| Cost of net product sales |
4,458 | 474,955 | 701,282 | (166,164 | ) | 1,014,531 | ||||||||||||||
| Cost of services revenue |
47 | 257,587 | 35,598 | (19,003 | ) | 274,229 | ||||||||||||||
|
|
|
|
|
|
|
|
|
|
|
|||||||||||
| Cost of net product sales and services revenue |
4,505 | 732,542 | 736,880 | (185,167 | ) | 1,288,760 | ||||||||||||||
| Cost of license and royalty revenue |
— | 69 | 20,732 | (13,038 | ) | 7,763 | ||||||||||||||
|
|
|
|
|
|
|
|
|
|
|
|||||||||||
| Cost of net revenue |
4,505 | 732,611 | 757,612 | (198,205 | ) | 1,296,523 | ||||||||||||||
|
|
|
|
|
|
|
|
|
|
|
|||||||||||
| Gross profit (loss) |
(4,505 | ) | 621,380 | 697,119 | (1,881 | ) | 1,312,113 | |||||||||||||
| Operating expenses: |
||||||||||||||||||||
| Research and development |
21,971 | 65,752 | 71,330 | — | 159,053 | |||||||||||||||
| Sales and marketing |
6,340 | 255,950 | 303,847 | — | 566,137 | |||||||||||||||
| General and administrative |
76,075 | 141,877 | 217,247 | — | 435,199 | |||||||||||||||
| Loss on disposition |
— | — | 5,124 | — | 5,124 | |||||||||||||||
|
|
|
|
|
|
|
|
|
|
|
|||||||||||
| Operating income (loss) |
(108,891 | ) | 157,801 | 99,571 | (1,881 | ) | 146,600 | |||||||||||||
| Interest expense, including amortization of original issue discounts and deferred financing costs |
(252,791 | ) | (25,582 | ) | (11,192 | ) | 34,219 | (255,346 | ) | |||||||||||
| Other income (expense), net |
(10,759 | ) | 24,071 | 9,647 | (34,219 | ) | (11,260 | ) | ||||||||||||
|
|
|
|
|
|
|
|
|
|
|
|||||||||||
| Income (loss) from continuing operations before provision (benefit) for income taxes |
(372,441 | ) | 156,290 | 98,026 | (1,881 | ) | (120,006 | ) | ||||||||||||
| Provision (benefit) for income taxes |
(167,073 | ) | 81,187 | 41,801 | (622 | ) | (44,707 | ) | ||||||||||||
|
|
|
|
|
|
|
|
|
|
|
|||||||||||
| Income (loss) from continuing operations before equity in earnings (losses) of subsidiaries and unconsolidated entities, net of tax |
(205,368 | ) | 75,103 | 56,225 | (1,259 | ) | (75,299 | ) | ||||||||||||
| Equity in earnings (losses) of subsidiaries, net of tax |
129,298 | (2,948 | ) | — | (126,350 | ) | — | |||||||||||||
| Equity earnings of unconsolidated entities, net of tax |
1,890 | — | 15,470 | 83 | 17,443 | |||||||||||||||
|
|
|
|
|
|
|
|
|
|
|
|||||||||||
| Income (loss) from continuing operations |
(74,180 | ) | 72,155 | 71,695 | (127,526 | ) | (57,856 | ) | ||||||||||||
| Income (loss) from discontinued operations, net of tax |
198 | (14,370 | ) | (1,954 | ) | — | (16,126 | ) | ||||||||||||
|
|
|
|
|
|
|
|
|
|
|
|||||||||||
| Net income (loss) |
(73,982 | ) | 57,785 | 69,741 | (127,526 | ) | (73,982 | ) | ||||||||||||
| Less: Net income attributable to non-controlling interests |
— | — | 976 | — | 976 | |||||||||||||||
|
|
|
|
|
|
|
|
|
|
|
|||||||||||
| Net income (loss) attributable to Alere Inc. and Subsidiaries |
(73,982 | ) | 57,785 | 68,765 | (127,526 | ) | (74,958 | ) | ||||||||||||
| Preferred stock dividends |
(21,293 | ) | — | — | — | (21,293 | ) | |||||||||||||
|
|
|
|
|
|
|
|
|
|
|
|||||||||||
| Net income (loss) available to common stockholders |
$ | (95,275 | ) | $ | 57,785 | $ | 68,765 | $ | (127,526 | ) | $ | (96,251 | ) | |||||||
|
|
|
|
|
|
|
|
|
|
|
|||||||||||
F-84
Table of Contents
ALERE INC. AND SUBSIDIARIES
NOTES TO CONSOLIDATED FINANCIAL STATEMENTS (Continued)
(27) Guarantor Financial Information (Continued)
CONSOLIDATING STATEMENT OF COMPREHENSIVE INCOME
For the Year Ended December 31, 2015
(in thousands)
| Issuer | Guarantor Subsidiaries |
Non-Guarantor Subsidiaries |
Eliminations | Consolidated | ||||||||||||||||
| Net income |
$ | 206,757 | $ | 77,057 | $ | 190,807 | $ | (267,864 | ) | $ | 206,757 | |||||||||
|
|
|
|
|
|
|
|
|
|
|
|||||||||||
| Other comprehensive loss, before tax: |
||||||||||||||||||||
| Changes in cumulative translation adjustment |
(1,175 | ) | (816 | ) | (144,267 | ) | (180 | ) | (146,438 | ) | ||||||||||
| Minimum pension liability adjustment |
— | — | (1,173 | ) | — | (1,173 | ) | |||||||||||||
|
|
|
|
|
|
|
|
|
|
|
|||||||||||
| Other comprehensive loss, before tax |
(1,175 | ) | (816 | ) | (145,440 | ) | (180 | ) | (147,611 | ) | ||||||||||
| Income tax provision related to items of other comprehensive loss |
— | — | 56 | — | 56 | |||||||||||||||
|
|
|
|
|
|
|
|
|
|
|
|||||||||||
| Other comprehensive loss, net of tax |
(1,175 | ) | (816 | ) | (145,496 | ) | (180 | ) | (147,667 | ) | ||||||||||
|
|
|
|
|
|
|
|
|
|
|
|||||||||||
| Comprehensive income |
205,582 | 76,241 | 45,311 | (268,044 | ) | 59,090 | ||||||||||||||
| Less: Comprehensive income attributable to non-controlling interests |
— | — | 381 | — | 381 | |||||||||||||||
|
|
|
|
|
|
|
|
|
|
|
|||||||||||
| Comprehensive income attributable to Alere Inc. and Subsidiaries |
$ | 205,582 | $ | 76,241 | $ | 44,930 | $ | (268,044 | ) | $ | 58,709 | |||||||||
|
|
|
|
|
|
|
|
|
|
|
|||||||||||
F-85
Table of Contents
ALERE INC. AND SUBSIDIARIES
NOTES TO CONSOLIDATED FINANCIAL STATEMENTS (Continued)
(27) Guarantor Financial Information (Continued)
CONSOLIDATING STATEMENT OF COMPREHENSIVE INCOME (LOSS)
For the Year Ended December 31, 2014
(in thousands)
| Issuer | Guarantor Subsidiaries |
Non-Guarantor Subsidiaries |
Eliminations | Consolidated | ||||||||||||||||
| Net income (loss) |
$ | (33,436 | ) | $ | 39,330 | $ | 84,219 | $ | (123,549 | ) | $ | (33,436 | ) | |||||||
|
|
|
|
|
|
|
|
|
|
|
|||||||||||
| Other comprehensive loss, before tax: |
||||||||||||||||||||
| Changes in cumulative translation adjustment |
(489 | ) | (516 | ) | (165,443 | ) | — | (166,448 | ) | |||||||||||
| Unrealized losses on available for sale securities |
— | (17 | ) | — | — | (17 | ) | |||||||||||||
| Unrealized gains on hedging instruments |
— | — | 38 | — | 38 | |||||||||||||||
| Minimum pension liability adjustment |
— | — | (169 | ) | — | (169 | ) | |||||||||||||
|
|
|
|
|
|
|
|
|
|
|
|||||||||||
| Other comprehensive loss, before tax |
(489 | ) | (533 | ) | (165,574 | ) | — | (166,596 | ) | |||||||||||
| Income tax benefit related to items of other comprehensive loss |
— | — | (173 | ) | — | (173 | ) | |||||||||||||
|
|
|
|
|
|
|
|
|
|
|
|||||||||||
| Other comprehensive loss, net of tax |
(489 | ) | (533 | ) | (165,401 | ) | — | (166,423 | ) | |||||||||||
|
|
|
|
|
|
|
|
|
|
|
|||||||||||
| Comprehensive income (loss) |
(33,925 | ) | $ | 38,797 | $ | (81,182 | ) | (123,549 | ) | (199,859 | ) | |||||||||
| Less: Comprehensive income attributable to non-controlling interests |
— | — | 30 | — | 30 | |||||||||||||||
|
|
|
|
|
|
|
|
|
|
|
|||||||||||
| Comprehensive income (loss) attributable to Alere Inc. and Subsidiaries |
$ | (33,925 | ) | $ | 38,797 | $ | (81,212 | ) | $ | (123,549 | ) | $ | (199,889 | ) | ||||||
|
|
|
|
|
|
|
|
|
|
|
|||||||||||
F-86
Table of Contents
ALERE INC. AND SUBSIDIARIES
NOTES TO CONSOLIDATED FINANCIAL STATEMENTS (Continued)
(27) Guarantor Financial Information (Continued)
CONSOLIDATING STATEMENT OF COMPREHENSIVE INCOME (LOSS)
For the Year Ended December 31, 2013
(in thousands)
| Issuer | Guarantor Subsidiaries |
Non-Guarantor Subsidiaries |
Eliminations | Consolidated | ||||||||||||||||
| Net income (loss) |
$ | (73,982 | ) | $ | 57,785 | $ | 69,741 | $ | (127,526 | ) | $ | (73,982 | ) | |||||||
|
|
|
|
|
|
|
|
|
|
|
|||||||||||
| Other comprehensive loss, before tax: |
||||||||||||||||||||
| Changes in cumulative translation adjustment |
(550 | ) | (619 | ) | (48,998 | ) | 1 | (50,166 | ) | |||||||||||
| Unrealized gains on hedging instruments |
— | — | 39 | — | 39 | |||||||||||||||
| Minimum pension liability adjustment |
— | — | (415 | ) | — | (415 | ) | |||||||||||||
|
|
|
|
|
|
|
|
|
|
|
|||||||||||
| Other comprehensive loss, before tax |
(550 | ) | (619 | ) | (49,374 | ) | 1 | (50,542 | ) | |||||||||||
| Income tax benefit related to items of other comprehensive loss |
— | — | (106 | ) | — | (106 | ) | |||||||||||||
|
|
|
|
|
|
|
|
|
|
|
|||||||||||
| Other comprehensive loss, net of tax |
(550 | ) | (619 | ) | (49,268 | ) | 1 | (50,436 | ) | |||||||||||
|
|
|
|
|
|
|
|
|
|
|
|||||||||||
| Comprehensive income (loss) |
(74,532 | ) | 57,166 | 20,473 | (127,525 | ) | (124,418 | ) | ||||||||||||
| Less: Comprehensive income attributable to non-controlling interests |
— | — | 976 | — | 976 | |||||||||||||||
|
|
|
|
|
|
|
|
|
|
|
|||||||||||
| Comprehensive income (loss) attributable to Alere Inc. and Subsidiaries |
$ | (74,532 | ) | $ | 57,166 | $ | 19,497 | $ | (127,525 | ) | $ | (125,394 | ) | |||||||
|
|
|
|
|
|
|
|
|
|
|
|||||||||||
F-87
Table of Contents
ALERE INC. AND SUBSIDIARIES
NOTES TO CONSOLIDATED FINANCIAL STATEMENTS (Continued)
(27) Guarantor Financial Information (Continued)
CONSOLIDATING BALANCE SHEET
December 31, 2015
(in thousands)
| Issuer | Guarantor Subsidiaries |
Non-Guarantor Subsidiaries |
Eliminations | Consolidated | ||||||||||||||||
| ASSETS |
||||||||||||||||||||
| Current assets: |
||||||||||||||||||||
| Cash and cash equivalents |
$ | 139,153 | $ | 21,150 | $ | 341,897 | $ | — | $ | 502,200 | ||||||||||
| Restricted cash |
1,250 | — | 4,444 | — | 5,694 | |||||||||||||||
| Marketable securities |
— | 164 | — | — | 164 | |||||||||||||||
| Accounts receivable, net of allowances |
— | 192,591 | 253,242 | — | 445,833 | |||||||||||||||
| Inventories, net |
— | 173,383 | 194,192 | (20,574 | ) | 347,001 | ||||||||||||||
| Deferred tax assets |
(52,410 | ) | 31,285 | 23,244 | (2,119 | ) | — | |||||||||||||
| Prepaid expenses and other current assets |
7,575 | 27,095 | 110,961 | 6,602 | 152,233 | |||||||||||||||
| Assets held for sale — current |
— | — | 4,165 | — | 4,165 | |||||||||||||||
| Intercompany receivables |
620,838 | 812,957 | 50,691 | (1,484,486 | ) | — | ||||||||||||||
|
|
|
|
|
|
|
|
|
|
|
|||||||||||
| Total current assets |
716,406 | 1,258,625 | 982,836 | (1,500,577 | ) | 1,457,290 | ||||||||||||||
| Property, plant and equipment, net |
31,384 | 228,065 | 188,084 | (1,494 | ) | 446,039 | ||||||||||||||
| Goodwill |
— | 1,823,919 | 1,012,996 | — | 2,836,915 | |||||||||||||||
| Other intangible assets with indefinite lives |
— | 7,638 | 20,531 | (59 | ) | 28,110 | ||||||||||||||
| Finite-lived intangible assets, net |
2,951 | 627,269 | 370,261 | (3,200 | ) | 997,281 | ||||||||||||||
| Restricted cash |
— | — | 43,228 | — | 43,228 | |||||||||||||||
| Deferred financing costs, net and other |
||||||||||||||||||||
| non-current assets |
34,670 | 2,340 | 15,564 | (446 | ) | 52,128 | ||||||||||||||
| Investments in subsidiaries |
3,294,857 | 158,195 | 57,650 | (3,510,702 | ) | — | ||||||||||||||
| Investments in unconsolidated entities |
502 | 14,764 | 37,947 | 12,120 | 65,333 | |||||||||||||||
| Deferred tax assets |
(14,078 | ) | (14 | ) | 28,085 | — | 13,993 | |||||||||||||
| Non-current income tax receivable |
3,517 | — | — | — | 3,517 | |||||||||||||||
| Assets held for sale — non-current |
13,337 | — | — | — | 13,337 | |||||||||||||||
| Intercompany notes receivables |
1,905,188 | 672,032 | 6,900 | (2,584,120 | ) | — | ||||||||||||||
|
|
|
|
|
|
|
|
|
|
|
|||||||||||
| Total assets |
$ | 5,988,734 | $ | 4,792,833 | $ | 2,764,082 | $ | (7,588,478 | ) | $ | 5,957,171 | |||||||||
|
|
|
|
|
|
|
|
|
|
|
|||||||||||
| LIABILITIES AND EQUITY |
||||||||||||||||||||
| Current liabilities: |
||||||||||||||||||||
| Short-term debt and current portion of |
||||||||||||||||||||
| long-term debt |
$ | 197,084 | $ | — | $ | 2,908 | $ | — | $ | 199,992 | ||||||||||
| Current portion of capital lease obligations |
— | 2,018 | 1,944 | — | 3,962 | |||||||||||||||
| Accounts payable |
15,981 | 76,890 | 102,881 | — | 195,752 | |||||||||||||||
| Accrued expenses and other current liabilities |
(554,350 | ) | 650,632 | 225,944 | 2,239 | 324,465 | ||||||||||||||
| Liabilities related to assets held for sale — current |
— | — | 363 | — | 363 | |||||||||||||||
| Intercompany payables |
1,122,042 | 249,553 | 112,891 | (1,484,486 | ) | — | ||||||||||||||
|
|
|
|
|
|
|
|
|
|
|
|||||||||||
| Total current liabilities |
780,757 | 979,093 | 446,931 | (1,482,247 | ) | 724,534 | ||||||||||||||
|
|
|
|
|
|
|
|
|
|
|
|||||||||||
| Long-term liabilities: |
||||||||||||||||||||
| Long-term debt, net of current portion |
2,818,779 | — | 46,437 | — | 2,865,216 | |||||||||||||||
| Capital lease obligations, net of current portion |
— | 840 | 6,341 | — | 7,181 | |||||||||||||||
| Deferred tax liabilities |
(157,708 | ) | 250,495 | 54,749 | 82 | 147,618 | ||||||||||||||
| Other long-term liabilities |
14,962 | 59,309 | 80,369 | (447 | ) | 154,193 | ||||||||||||||
| Intercompany notes payables |
477,779 | 1,181,168 | 925,173 | (2,584,120 | ) | — | ||||||||||||||
|
|
|
|
|
|
|
|
|
|
|
|||||||||||
| Total long-term liabilities |
3,153,812 | 1,491,812 | 1,113,069 | (2,584,485 | ) | 3,174,208 | ||||||||||||||
|
|
|
|
|
|
|
|
|
|
|
|||||||||||
| Total stockholders’ equity |
2,054,165 | 2,321,928 | 1,199,818 | (3,521,746 | ) | 2,054,165 | ||||||||||||||
| Non-controlling interests |
— | — | 4,264 | — | 4,264 | |||||||||||||||
|
|
|
|
|
|
|
|
|
|
|
|||||||||||
| Total equity |
2,054,165 | 2,321,928 | 1,204,082 | (3,521,746 | ) | 2,058,429 | ||||||||||||||
|
|
|
|
|
|
|
|
|
|
|
|||||||||||
| Total liabilities and equity |
$ | 5,988,734 | $ | 4,792,833 | $ | 2,764,082 | $ | (7,588,478 | ) | $ | 5,957,171 | |||||||||
|
|
|
|
|
|
|
|
|
|
|
|||||||||||
F-88
Table of Contents
ALERE INC. AND SUBSIDIARIES
NOTES TO CONSOLIDATED FINANCIAL STATEMENTS (Continued)
(27) Guarantor Financial Information (Continued)
CONSOLIDATING BALANCE SHEET
December 31, 2014
(in thousands)
| Issuer | Guarantor Subsidiaries |
Non-Guarantor Subsidiaries |
Eliminations | Consolidated | ||||||||||||||||
| ASSETS |
||||||||||||||||||||
| Current assets: |
||||||||||||||||||||
| Cash and cash equivalents |
$ | 2,149 | $ | 69,154 | $ | 307,158 | $ | — | $ | 378,461 | ||||||||||
| Restricted cash |
5,012 | — | 32,559 | — | 37,571 | |||||||||||||||
| Marketable securities |
— | 259 | — | — | 259 | |||||||||||||||
| Accounts receivable, net of allowances |
— | 192,579 | 268,517 | — | 461,096 | |||||||||||||||
| Inventories, net |
— | 191,381 | 207,732 | (21,764 | ) | 377,349 | ||||||||||||||
| Deferred tax assets |
51,695 | 44,961 | 31,264 | — | 127,920 | |||||||||||||||
| Prepaid expenses and other current assets |
9,800 | 31,410 | 88,696 | 2,507 | 132,413 | |||||||||||||||
| Assets held for sale — current |
1,361 | 284,369 | 29,785 | — | 315,515 | |||||||||||||||
| Intercompany receivables |
404,991 | 888,687 | 55,923 | (1,349,601 | ) | — | ||||||||||||||
|
|
|
|
|
|
|
|
|
|
|
|||||||||||
| Total current assets |
475,008 | 1,702,800 | 1,021,634 | (1,368,858 | ) | 1,830,584 | ||||||||||||||
| Property, plant and equipment, net |
30,547 | 218,613 | 204,841 | 222 | 454,223 | |||||||||||||||
| Goodwill |
— | 1,795,663 | 1,131,003 | — | 2,926,666 | |||||||||||||||
| Other intangible assets with indefinite lives |
— | 9,287 | 34,422 | (58 | ) | 43,651 | ||||||||||||||
| Finite-lived intangible assets, net |
6,104 | 742,760 | 527,580 | — | 1,276,444 | |||||||||||||||
| Deferred financing costs, net and other non-current assets |
40,992 | 5,334 | 21,541 | (35 | ) | 67,832 | ||||||||||||||
| Investments in subsidiaries |
3,729,385 | 179,315 | 58,067 | (3,966,767 | ) | — | ||||||||||||||
| Investments in unconsolidated entities |
13,987 | 14,765 | 49,609 | 13,332 | 91,693 | |||||||||||||||
| Deferred tax assets |
(2,251 | ) | — | 8,569 | — | 6,318 | ||||||||||||||
| Non-current income tax receivable |
2,468 | — | — | — | 2,468 | |||||||||||||||
| Intercompany notes receivables |
2,028,702 | 649,445 | 46,675 | (2,724,822 | ) | — | ||||||||||||||
|
|
|
|
|
|
|
|
|
|
|
|||||||||||
| Total assets |
$ | 6,324,942 | $ | 5,317,982 | $ | 3,103,941 | $ | (8,046,986 | ) | $ | 6,699,879 | |||||||||
|
|
|
|
|
|
|
|
|
|
|
|||||||||||
| LIABILITIES AND EQUITY |
||||||||||||||||||||
| Current liabilities: |
||||||||||||||||||||
| Short-term debt and current portion of long-term debt |
$ | 61,700 | $ | 2 | $ | 27,173 | $ | — | $ | 88,875 | ||||||||||
| Current portion of capital lease obligations |
— | 1,045 | 3,196 | — | 4,241 | |||||||||||||||
| Accounts payable |
21,402 | 81,741 | 110,449 | — | 213,592 | |||||||||||||||
| Accrued expenses and other current liabilities |
(543,264 | ) | 661,701 | 267,536 | (46 | ) | 385,927 | |||||||||||||
| Liabilities related to assets held for sale — current |
1,094 | 77,749 | — | — | 78,843 | |||||||||||||||
| Intercompany payables |
902,576 | 198,787 | 248,238 | (1,349,601 | ) | — | ||||||||||||||
|
|
|
|
|
|
|
|
|
|
|
|||||||||||
| Total current liabilities |
443,508 | 1,021,025 | 656,592 | (1,349,647 | ) | 771,478 | ||||||||||||||
|
|
|
|
|
|
|
|
|
|
|
|||||||||||
| Long-term liabilities: |
||||||||||||||||||||
| Long-term debt, net of current portion |
3,615,759 | — | 5,626 | — | 3,621,385 | |||||||||||||||
| Capital lease obligations, net of current portion |
— | 4,097 | 7,496 | — | 11,593 | |||||||||||||||
| Deferred tax liabilities |
(90,520 | ) | 252,944 | 69,457 | 82 | 231,963 | ||||||||||||||
| Other long-term liabilities |
28,101 | 46,866 | 71,987 | (34 | ) | 146,920 | ||||||||||||||
| Intercompany notes payables |
415,700 | 1,276,245 | 1,032,877 | (2,724,822 | ) | — | ||||||||||||||
|
|
|
|
|
|
|
|
|
|
|
|||||||||||
| Total long-term liabilities |
3,969,040 | 1,580,152 | 1,187,443 | (2,724,774 | ) | 4,011,861 | ||||||||||||||
|
|
|
|
|
|
|
|
|
|
|
|||||||||||
| Total stockholders’ equity |
1,912,394 | 2,716,805 | 1,255,760 | (3,972,565 | ) | 1,912,394 | ||||||||||||||
| Non-controlling interests |
— | — | 4,146 | — | 4,146 | |||||||||||||||
|
|
|
|
|
|
|
|
|
|
|
|||||||||||
| Total equity |
1,912,394 | 2,716,805 | 1,259,906 | (3,972,565 | ) | 1,916,540 | ||||||||||||||
|
|
|
|
|
|
|
|
|
|
|
|||||||||||
| Total liabilities and equity |
$ | 6,324,942 | $ | 5,317,982 | $ | 3,103,941 | $ | (8,046,986 | ) | $ | 6,699,879 | |||||||||
|
|
|
|
|
|
|
|
|
|
|
|||||||||||
F-89
Table of Contents
ALERE INC. AND SUBSIDIARIES
NOTES TO CONSOLIDATED FINANCIAL STATEMENTS (Continued)
(27) Guarantor Financial Information (Continued)
CONSOLIDATING STATEMENT OF CASH FLOWS
For the Year Ended December 31, 2015
(in thousands)
| Issuer | Guarantor Subsidiaries |
Non-Guarantor Subsidiaries |
Eliminations | Consolidated | ||||||||||||||||
| Cash Flows from Operating Activities: |
||||||||||||||||||||
| Net income. |
$ | 206,757 | $ | 77,057 | $ | 190,807 | $ | (267,864 | ) | $ | 206,757 | |||||||||
| Income (loss) from discontinued operations, net of tax. |
221,425 | (1,912 | ) | — | — | 219,513 | ||||||||||||||
|
|
|
|
|
|
|
|
|
|
|
|||||||||||
| Income from continuing operations. |
(14,668 | ) | 78,969 | 190,807 | (267,864 | ) | (12,756 | ) | ||||||||||||
| Adjustments to reconcile net income from continuing operations to net cash provided by (used in) operating activities: |
||||||||||||||||||||
| Equity in earnings of subsidiaries, net of tax |
(262,616 | ) | — | — | 262,616 | — | ||||||||||||||
| Non-cash interest expense, including amortization of original issue discounts and deferred financing costs |
12,697 | 25 | 109 | — | 12,831 | |||||||||||||||
| Depreciation and amortization |
10,105 | 175,415 | 123,921 | (177 | ) | 309,264 | ||||||||||||||
| Non-cash stock-based compensation expense |
14,400 | 5,869 | 6,122 | — | 26,391 | |||||||||||||||
| Impairment of inventory |
— | 133 | 15,464 | — | 15,597 | |||||||||||||||
| Impairment of long-lived assets |
— | 3,391 | 317 | — | 3,708 | |||||||||||||||
| Loss on sale of fixed assets |
121 | 2,757 | 1,047 | — | 3,925 | |||||||||||||||
| Equity earnings of unconsolidated entities, net of tax |
(1,484 | ) | — | (14,065 | ) | 19 | (15,530 | ) | ||||||||||||
| Deferred income taxes |
(83,208 | ) | (112 | ) | (16,508 | ) | 439 | (99,389 | ) | |||||||||||
| Loss on extinguishment of debt. |
19,886 | — | — | — | 19,886 | |||||||||||||||
| Loss related to impairment and net (gain) loss on dispositions |
79,951 | (8,747 | ) | (20,664 | ) | — | 50,540 | |||||||||||||
| Other non-cash items |
4,809 | 996 | 19,777 | 3,200 | 28,782 | |||||||||||||||
| Non-cash change in fair value of contingent purchase price consideration |
(32,975 | ) | 11,577 | (38,473 | ) | — | (59,871 | ) | ||||||||||||
| Changes in assets and liabilities, net of acquisitions: |
||||||||||||||||||||
| Accounts receivable, net |
— | 1,529 | (15,909 | ) | — | (14,380 | ) | |||||||||||||
| Inventories, net |
— | (22,881 | ) | (39,494 | ) | 1,897 | (60,478 | ) | ||||||||||||
| Prepaid expenses and other current assets |
3,177 | (26,268 | ) | (15,828 | ) | (4,095 | ) | (43,014 | ) | |||||||||||
| Accounts payable |
(5,467 | ) | (7,741 | ) | 2,425 | — | (10,783 | ) | ||||||||||||
| Accrued expenses and other current liabilities |
(29,379 | ) | 64,588 | (13,300 | ) | 2,285 | 24,194 | |||||||||||||
| Other non-current liabilities |
(4,089 | ) | 3,034 | 33,703 | 1,714 | 34,362 | ||||||||||||||
| Cash paid for contingent consideration |
(6,302 | ) | — | (13 | ) | — | (6,315 | ) | ||||||||||||
| Intercompany payable (receivable) |
549,850 | (313,983 | ) | (235,867 | ) | — | — | |||||||||||||
|
|
|
|
|
|
|
|
|
|
|
|||||||||||
| Net cash provided by (used in) continuing operations |
254,808 | (31,449 | ) | (16,429 | ) | 34 | 206,964 | |||||||||||||
| Net cash provided by discontinued operations |
— | 318 | — | — | 318 | |||||||||||||||
|
|
|
|
|
|
|
|
|
|
|
|||||||||||
| Net cash provided by (used in) operating activities |
254,808 | (31,131 | ) | (16,429 | ) | 34 | 207,282 | |||||||||||||
|
|
|
|
|
|
|
|
|
|
|
|||||||||||
| Cash Flows from Investing Activities: |
||||||||||||||||||||
| (Increase) decrease in restricted cash |
3,763 | — | (17,478 | ) | — | (13,715 | ) | |||||||||||||
| Purchases of property, plant and equipment |
(12,710 | ) | (29,748 | ) | (49,375 | ) | 1,055 | (90,778 | ) | |||||||||||
| Proceeds from sale of property, plant and equipment |
— | 993 | 2,161 | (1,055 | ) | 2,099 | ||||||||||||||
| Cash received from (used in) dispositions, net of cash divested |
591,844 | (8,723 | ) | 92,702 | — | 675,823 | ||||||||||||||
| Cash paid for business acquisitions, net of cash acquired |
(60,135 | ) | — | — | — | (60,135 | ) | |||||||||||||
| Cash received from sales of marketable securities. |
— | 92 | — | — | 92 | |||||||||||||||
| Cash received from equity method investments |
2,695 | — | 23,441 | — | 26,136 | |||||||||||||||
| (Increase) decrease in other assets. |
301 | 485 | (2,546 | ) | (34 | ) | (1,794 | ) | ||||||||||||
|
|
|
|
|
|
|
|
|
|
|
|||||||||||
| Net cash provided by (used in) continuing operations |
525,758 | (36,901 | ) | 48,905 | (34 | ) | 537,728 | |||||||||||||
| Net cash used in discontinued operations |
— | (209 | ) | — | — | (209 | ) | |||||||||||||
|
|
|
|
|
|
|
|
|
|
|
|||||||||||
| Net cash provided by (used in) investing activities |
525,758 | (37,110 | ) | 48,905 | (34 | ) | 537,519 | |||||||||||||
|
|
|
|
|
|
|
|
|
|
|
|||||||||||
| Cash Flows from Financing Activities: |
||||||||||||||||||||
| Cash paid for financing costs |
(15,973 | ) | — | (215 | ) | — | (16,188 | ) | ||||||||||||
| Cash paid for contingent purchase price consideration |
(13,640 | ) | — | (583 | ) | — | (14,223 | ) | ||||||||||||
| Cash paid for dividends |
(21,293 | ) | — | — | — | (21,293 | ) | |||||||||||||
| Proceeds from issuance of common stock, net of issuance costs. |
79,185 | — | — | — | 79,185 | |||||||||||||||
| Proceeds from issuance of short-term debt |
— | — | 1,511 | — | 1,511 | |||||||||||||||
| Proceeds from issuance of long-term debt |
2,119,125 | — | 43,037 | — | 2,162,162 | |||||||||||||||
| Payments on short-term debt |
— | — | (25,584 | ) | — | (25,584 | ) | |||||||||||||
| Payments on long-term debt |
(2,655,343 | ) | — | (1,043 | ) | — | (2,656,386 | ) | ||||||||||||
| Net (payments) proceeds under revolving credit facilities |
(127,000 | ) | — | (536 | ) | — | (127,536 | ) | ||||||||||||
| Principal payments on capital lease obligations |
— | (2,565 | ) | (3,053 | ) | — | (5,618 | ) | ||||||||||||
| Other |
(8,623 | ) | — | (314 | ) | — | (8,937 | ) | ||||||||||||
|
|
|
|
|
|
|
|
|
|
|
|||||||||||
| Net cash provided by (used in) continuing operations |
(643,562 | ) | (2,565 | ) | 13,220 | — | (632,907 | ) | ||||||||||||
| Net cash used in discontinued operations |
— | (76 | ) | — | — | (76 | ) | |||||||||||||
|
|
|
|
|
|
|
|
|
|
|
|||||||||||
| Net cash provided by (used in) financing activities |
(643,562 | ) | (2,641 | ) | 13,220 | — | (632,983 | ) | ||||||||||||
|
|
|
|
|
|
|
|
|
|
|
|||||||||||
| Foreign exchange effect on cash and cash equivalents |
— | (422 | ) | (10,957 | ) | — | (11,379 | ) | ||||||||||||
|
|
|
|
|
|
|
|
|
|
|
|||||||||||
| Net increase (decrease) in cash and cash equivalents |
137,004 | (71,304 | ) | 34,739 | — | 100,439 | ||||||||||||||
| Cash and cash equivalents, beginning of period — continuing operations |
2,149 | 69,154 | 307,158 | — | 378,461 | |||||||||||||||
| Cash and cash equivalents, beginning of period — discontinued operations |
— | 23,300 | — | — | 23,300 | |||||||||||||||
|
|
|
|
|
|
|
|
|
|
|
|||||||||||
| Cash and cash equivalents of continuing operations, end of period |
$ | 139,153 | $ | 21,150 | $ | 341,897 | $ | — | $ | 502,200 | ||||||||||
|
|
|
|
|
|
|
|
|
|
|
|||||||||||
F-90
Table of Contents
ALERE INC. AND SUBSIDIARIES
NOTES TO CONSOLIDATED FINANCIAL STATEMENTS (Continued)
(27) Guarantor Financial Information (Continued)
CONSOLIDATING STATEMENT OF CASH FLOWS
For the Year Ended December 31, 2014
(in thousands)
| Issuer | Guarantor Subsidiaries |
Non-Guarantor Subsidiaries |
Eliminations | Consolidated | ||||||||||||||||
| Cash Flows from Operating Activities: |
||||||||||||||||||||
| Net income (loss) |
$ | (33,436 | ) | $ | 39,330 | $ | 84,219 | $ | (123,549 | ) | $ | (33,436 | ) | |||||||
| Income (loss) from discontinued operations, net of tax |
145,751 | (27,839 | ) | 20,400 | 6 | 138,318 | ||||||||||||||
|
|
|
|
|
|
|
|
|
|
|
|||||||||||
| Income (loss) from continuing operations |
(179,187 | ) | 67,169 | 63,819 | (123,555 | ) | (171,754 | ) | ||||||||||||
| Adjustments to reconcile net income (loss) from continuing operations to net cash provided by operating activities: |
||||||||||||||||||||
| Equity in earnings of subsidiaries, net of tax |
(125,130 | ) | — | — | 125,130 | — | ||||||||||||||
| Non-cash interest expense, including amortization of original issue discounts and deferred financing costs |
15,780 | 42 | 411 | — | 16,233 | |||||||||||||||
| Depreciation and amortization |
8,783 | 177,347 | 149,884 | 15 | 336,029 | |||||||||||||||
| Non-cash stock-based compensation expense |
3,446 | 4,957 | 4,049 | — | 12,452 | |||||||||||||||
| Tax benefit related to discontinued operations retained by Alere Inc |
— | 12,977 | (3,132 | ) | — | 9,845 | ||||||||||||||
| Impairment of inventory |
— | — | 3,124 | — | 3,124 | |||||||||||||||
| Impairment of long-lived assets |
1,019 | (712 | ) | 6,712 | — | 7,019 | ||||||||||||||
| Loss on disposition of fixed assets |
1 | 4,807 | 1,737 | — | 6,545 | |||||||||||||||
| Equity earnings of unconsolidated entities, net of tax |
(1,717 | ) | — | (15,928 | ) | 136 | (17,509 | ) | ||||||||||||
| Deferred income taxes |
59,929 | (32,750 | ) | (15,945 | ) | 1,020 | 12,254 | |||||||||||||
| (Gain) loss related to impairment and net gain on dispositions |
4,236 | 11,393 | (7,887 | ) | — | 7,742 | ||||||||||||||
| Other non-cash items |
1,418 | 3,726 | (179 | ) | — | 4,965 | ||||||||||||||
| Non-cash change in fair value of contingent consideration |
(3,414 | ) | 11,256 | (165 | ) | — | 7,677 | |||||||||||||
| Changes in assets and liabilities, net of acquisitions: |
||||||||||||||||||||
| Accounts receivable, net |
— | (16,345 | ) | 13,083 | — | (3,262 | ) | |||||||||||||
| Inventories, net |
— | (52,670 | ) | (13,218 | ) | (2,145 | ) | (68,033 | ) | |||||||||||
| Prepaid expenses and other current assets |
501,023 | (474,115 | ) | (78,161 | ) | (745 | ) | (51,998 | ) | |||||||||||
| Accounts payable |
8,818 | 24,776 | 14,257 | — | 47,851 | |||||||||||||||
| Accrued expenses and other current liabilities |
(583,144 | ) | 537,209 | 85,445 | (1,812 | ) | 37,698 | |||||||||||||
| Other non-current liabilities |
(594 | ) | 1,380 | 9,897 | 2,571 | 13,254 | ||||||||||||||
| Cash paid for contingent purchase price consideration |
(21,867 | ) | — | (210 | ) | — | (22,077 | ) | ||||||||||||
| Intercompany payable (receivable) |
428,340 | (266,833 | ) | (161,507 | ) | — | — | |||||||||||||
|
|
|
|
|
|
|
|
|
|
|
|||||||||||
| Net cash provided by continuing operations |
117,740 | 13,614 | 56,086 | 615 | 188,055 | |||||||||||||||
| Net cash provided by (used in) discontinued operations |
(671 | ) | 44,060 | 79 | — | 43,468 | ||||||||||||||
|
|
|
|
|
|
|
|
|
|
|
|||||||||||
| Net cash provided by operating activities |
117,069 | 57,674 | 56,165 | 615 | 231,523 | |||||||||||||||
|
|
|
|
|
|
|
|
|
|
|
|||||||||||
| Cash Flows from Investing Activities: |
||||||||||||||||||||
| Increase in restricted cash |
(2,791 | ) | — | (2,655 | ) | — | (5,446 | ) | ||||||||||||
| Purchases of property, plant and equipment |
(21,680 | ) | (40,737 | ) | (41,862 | ) | 3,717 | (100,562 | ) | |||||||||||
| Proceeds from sale of property, plant and equipment |
726 | 845 | 4,165 | (4,250 | ) | 1,486 | ||||||||||||||
| Cash received from disposition, net of cash divested |
— | 1,081 | 43,995 | — | 45,076 | |||||||||||||||
| Cash paid for business acquisitions, net of cash acquired |
(75 | ) | — | — | — | (75 | ) | |||||||||||||
| Cash received (paid) for investments |
477 | (279 | ) | — | 198 | |||||||||||||||
| Proceeds from sale of equity investment |
— | — | 8,546 | — | 8,546 | |||||||||||||||
| Cash received from sales of marketable securities |
— | 576 | 4 | — | 580 | |||||||||||||||
| Cash received from equity method investments |
— | — | 980 | — | 980 | |||||||||||||||
| Decrease in other assets |
96 | 714 | 130 | 46 | 986 | |||||||||||||||
|
|
|
|
|
|
|
|
|
|
|
|||||||||||
| Net cash provided by (used in) continuing operations |
(23,247 | ) | (37,800 | ) | 13,303 | (487 | ) | (48,231 | ) | |||||||||||
| Net cash used in discontinued operations |
— | (8,972 | ) | — | — | (8,972 | ) | |||||||||||||
|
|
|
|
|
|
|
|
|
|
|
|||||||||||
| Net cash provided by (used in) investing activities |
(23,247 | ) | (46,772 | ) | 13,303 | (487 | ) | (57,203 | ) | |||||||||||
|
|
|
|
|
|
|
|
|
|
|
|||||||||||
| Cash Flows from Financing Activities: |
||||||||||||||||||||
| Cash paid for financing costs |
(1,528 | ) | — | — | — | (1,528 | ) | |||||||||||||
| Cash paid for contingent purchase price consideration |
(32,467 | ) | — | (435 | ) | — | (32,902 | ) | ||||||||||||
| Cash paid for dividends |
(21,293 | ) | — | — | — | (21,293 | ) | |||||||||||||
| Proceeds from issuance of common stock, net of issuance costs |
51,555 | — | — | — | 51,555 | |||||||||||||||
| Proceeds from issuance of short-term debt |
— | — | 806 | — | 806 | |||||||||||||||
| Proceeds from issuance of long-term debt |
— | — | 58 | — | 58 | |||||||||||||||
| Payments on long-term debt |
(60,000 | ) | (271 | ) | (4,851 | ) | — | (65,122 | ) | |||||||||||
| Net (payments) proceeds under revolving credit facilities |
(43,000 | ) | — | 478 | — | (42,522 | ) | |||||||||||||
| Excess tax benefits on exercised stock options |
460 | 422 | 90 | — | 972 | |||||||||||||||
| Principal payments on capital lease obligations |
— | (2,885 | ) | (3,200 | ) | — | (6,085 | ) | ||||||||||||
| Purchase of non-controlling interest |
— | — | (623 | ) | — | (623 | ) | |||||||||||||
|
|
|
|
|
|
|
|
|
|
|
|||||||||||
| Net cash used in continuing operations |
(106,273 | ) | (2,734 | ) | (7,677 | ) | — | (116,684 | ) | |||||||||||
| Net cash used in discontinued operations |
— | (893 | ) | (578 | ) | — | (1,471 | ) | ||||||||||||
|
|
|
|
|
|
|
|
|
|
|
|||||||||||
| Net cash used in financing activities |
(106,273 | ) | (3,627 | ) | (8,255 | ) | — | (118,155 | ) | |||||||||||
|
|
|
|
|
|
|
|
|
|
|
|||||||||||
| Foreign exchange effect on cash and cash equivalents |
(201 | ) | (273 | ) | (15,710 | ) | (128 | ) | (16,312 | ) | ||||||||||
|
|
|
|
|
|
|
|
|
|
|
|||||||||||
| Net increase (decrease) in cash and cash equivalents |
(12,652 | ) | 7,002 | 45,503 | — | 39,853 | ||||||||||||||
| Cash and cash equivalents, beginning of period - continuing operations |
14,801 | 78,976 | 261,654 | — | 355,431 | |||||||||||||||
| Cash and cash equivalents, beginning of period - discontinued operations |
— | 6,476 | 1 | — | 6,477 | |||||||||||||||
|
|
|
|
|
|
|
|
|
|
|
|||||||||||
| Cash and cash equivalents, end of period |
2,149 | 92,454 | 307,158 | — | 401,761 | |||||||||||||||
| Less: Cash and cash equivalents of discontinued operations, end of period |
— | 23,300 | — | — | 23,300 | |||||||||||||||
|
|
|
|
|
|
|
|
|
|
|
|||||||||||
| Cash and cash equivalents of continuing operations, end of period |
$ | 2,149 | $ | 69,154 | $ | 307,158 | $ | — | $ | 378,461 | ||||||||||
|
|
|
|
|
|
|
|
|
|
|
|||||||||||
F-91
Table of Contents
ALERE INC. AND SUBSIDIARIES
NOTES TO CONSOLIDATED FINANCIAL STATEMENTS (Continued)
(27) Guarantor Financial Information (Continued)
CONSOLIDATING STATEMENT OF CASH FLOWS
For the Year Ended December 31, 2013
(in thousands)
| Issuer | Guarantor Subsidiaries |
Non-Guarantor Subsidiaries |
Eliminations | Consolidated | ||||||||||||||||
| Cash Flows from Operating Activities: |
||||||||||||||||||||
| Net income (loss) |
$ | (73,982 | ) | $ | 57,785 | $ | 69,741 | $ | (127,526 | ) | $ | (73,982 | ) | |||||||
| Income (loss) from discontinued operations, net of tax |
198 | (14,370 | ) | (1,954 | ) | — | (16,126 | ) | ||||||||||||
|
|
|
|
|
|
|
|
|
|
|
|||||||||||
| Income (loss) from continuing operations |
(74,180 | ) | 72,155 | 71,695 | (127,526 | ) | (57,856 | ) | ||||||||||||
| Adjustments to reconcile net income (loss) from continuing operations to net cash provided by operating activities: |
||||||||||||||||||||
| Equity in earnings of subsidiaries, net of tax |
(129,298 | ) | 2,948 | — | 126,350 | — | ||||||||||||||
| Non-cash interest expense, including amortization of original issue discounts and deferred financing costs |
17,704 | 59 | 76 | — | 17,839 | |||||||||||||||
| Depreciation and amortization |
5,864 | 189,325 | 179,587 | (119 | ) | 374,657 | ||||||||||||||
| Non-cash charges for sale of inventories revalued at the date of acquisition |
— | — | 2,504 | — | 2,504 | |||||||||||||||
| Non-cash stock-based compensation expense |
8,792 | 5,158 | 7,260 | — | 21,210 | |||||||||||||||
| Tax benefit related to discontinued operations retained by Alere Inc |
— | 6,567 | 1,315 | — | 7,882 | |||||||||||||||
| Impairment of inventory |
— | 26 | 311 | — | 337 | |||||||||||||||
| Impairment of intangible and long-lived assets |
— | 4,581 | 1,923 | — | 6,504 | |||||||||||||||
| Loss on disposition of fixed assets |
— | 326 | 1,145 | — | 1,471 | |||||||||||||||
| Equity earnings of unconsolidated entities, net of tax |
(1,890 | ) | — | (15,470 | ) | (83 | ) | (17,443 | ) | |||||||||||
| Deferred income taxes |
(34,615 | ) | (26,116 | ) | (61,144 | ) | (620 | ) | (122,495 | ) | ||||||||||
| Loss on extinguishment of debt |
35,603 | — | — | — | 35,603 | |||||||||||||||
| Loss related to impairment and net gain on dispositions |
— | — | 5,124 | — | 5,124 | |||||||||||||||
| Bargain purchase gain |
— | — | (8,023 | ) | — | (8,023 | ) | |||||||||||||
| Other non-cash items |
5,202 | 1,617 | 3,631 | — | 10,450 | |||||||||||||||
| Non-cash change in fair value of contingent consideration |
(2,295 | ) | 6,928 | 14,617 | — | 19,250 | ||||||||||||||
| Changes in assets and liabilities, net of acquisitions: |
||||||||||||||||||||
| Accounts receivable, net |
— | (6,275 | ) | (35,034 | ) | — | (41,309 | ) | ||||||||||||
| Inventories, net |
— | (56,270 | ) | (31,464 | ) | 2,054 | (85,680 | ) | ||||||||||||
| Prepaid expenses and other current assets |
(577,892 | ) | 515,020 | 54,469 | (2,907 | ) | (11,310 | ) | ||||||||||||
| Accounts payable |
4,591 | (4,541 | ) | 17,700 | — | 17,750 | ||||||||||||||
| Accrued expenses and other current liabilities |
497,897 | (447,697 | ) | (30,369 | ) | 2,906 | 22,737 | |||||||||||||
| Other non-current liabilities |
(19,442 | ) | (4,824 | ) | 11,368 | 24 | (12,874 | ) | ||||||||||||
| Cash paid for contingent consideration |
(10,236 | ) | — | (1,424 | ) | — | (11,660 | ) | ||||||||||||
| Intercompany payable (receivable) |
410,392 | (251,389 | ) | (159,037 | ) | 34 | — | |||||||||||||
|
|
|
|
|
|
|
|
|
|
|
|||||||||||
| Net cash provided by continuing operations |
136,197 | 7,598 | 30,760 | 113 | 174,668 | |||||||||||||||
| Net cash provided by (used in) discontinued operations |
(2,103 | ) | 71,184 | 182 | (31 | ) | 69,232 | |||||||||||||
|
|
|
|
|
|
|
|
|
|
|
|||||||||||
| Net cash provided by operating activities |
134,094 | 78,782 | 30,942 | 82 | 243,900 | |||||||||||||||
|
|
|
|
|
|
|
|
|
|
|
|||||||||||
| Cash Flows from Investing Activities: |
||||||||||||||||||||
| Increase in restricted cash |
(2,221 | ) | — | (28,943 | ) | — | (31,164 | ) | ||||||||||||
| Purchases of property, plant and equipment |
(11,400 | ) | (33,483 | ) | (69,920 | ) | 14,895 | (99,908 | ) | |||||||||||
| Proceeds from sale of property, plant and equipment |
— | 5,183 | 12,876 | (14,441 | ) | 3,618 | ||||||||||||||
| Cash received from disposition, net of cash divested |
— | — | 29,000 | — | 29,000 | |||||||||||||||
| Cash paid for business acquisitions, net of cash acquired |
(166,772 | ) | — | (9,359 | ) | — | (176,131 | ) | ||||||||||||
| Cash received from sales of marketable securities |
— | (66 | ) | 107 | — | 41 | ||||||||||||||
| Cash received from equity method investments |
1,960 | — | 27,384 | (6 | ) | 29,338 | ||||||||||||||
| (Increase) decrease in other assets |
15,269 | (1,428 | ) | 905 | (23 | ) | 14,723 | |||||||||||||
|
|
|
|
|
|
|
|
|
|
|
|||||||||||
| Net cash used in continuing operations |
(163,164 | ) | (29,794 | ) | (37,950 | ) | 425 | (230,483 | ) | |||||||||||
| Net cash used in discontinued operations |
— | (26,936 | ) | (27 | ) | — | (26,963 | ) | ||||||||||||
|
|
|
|
|
|
|
|
|
|
|
|||||||||||
| Net cash used in investing activities |
(163,164 | ) | (56,730 | ) | (37,977 | ) | 425 | (257,446 | ) | |||||||||||
|
|
|
|
|
|
|
|
|
|
|
|||||||||||
| Cash Flows from Financing Activities: |
||||||||||||||||||||
| Cash paid for financing costs |
(9,845 | ) | — | — | — | (9,845 | ) | |||||||||||||
| Cash paid for contingent purchase price consideration |
(39,073 | ) | — | (1,006 | ) | — | (40,079 | ) | ||||||||||||
| Cash paid for dividends |
(21,293 | ) | — | — | — | (21,293 | ) | |||||||||||||
| Proceeds from issuance of common stock, net of issuance costs |
20,863 | — | — | — | 20,863 | |||||||||||||||
| Proceeds from issuance of long-term debt |
425,000 | — | 33,962 | — | 458,962 | |||||||||||||||
| Payments on long-term debt |
(461,845 | ) | (299 | ) | (8,413 | ) | — | (470,557 | ) | |||||||||||
| Net (payments) proceeds under revolving credit facilities |
147,500 | — | (8,537 | ) | — | 138,963 | ||||||||||||||
| Excess tax benefits on exercised stock options |
193 | 200 | 68 | — | 461 | |||||||||||||||
| Principal payments on capital lease obligations |
— | (3,278 | ) | (3,255 | ) | — | (6,533 | ) | ||||||||||||
| Purchase of non-controlling interest |
— | — | (165 | ) | — | (165 | ) | |||||||||||||
| Other |
(18,953 | ) | — | — | — | (18,953 | ) | |||||||||||||
|
|
|
|
|
|
|
|
|
|
|
|||||||||||
| Net cash provided by (used in) continuing operations |
42,547 | (3,377 | ) | 12,654 | — | 51,824 | ||||||||||||||
| Net cash used in discontinued operations |
(2,299 | ) | (534 | ) | — | — | (2,833 | ) | ||||||||||||
|
|
|
|
|
|
|
|
|
|
|
|||||||||||
| Net cash provided by (used in) financing activities |
40,248 | (3,911 | ) | 12,654 | — | 48,991 | ||||||||||||||
|
|
|
|
|
|
|
|
|
|
|
|||||||||||
| Foreign exchange effect on cash and cash equivalents |
— | (618 | ) | (746 | ) | (507 | ) | (1,871 | ) | |||||||||||
|
|
|
|
|
|
|
|
|
|
|
|||||||||||
| Net increase in cash and cash equivalents |
11,178 | 17,523 | 4,873 | — | 33,574 | |||||||||||||||
| Cash and cash equivalents, beginning of period - continuing operations |
3,623 | 56,074 | 256,782 | — | 316,479 | |||||||||||||||
| Cash and cash equivalents, beginning of period - discontinued operations |
— | 11,855 | — | — | 11,855 | |||||||||||||||
|
|
|
|
|
|
|
|
|
|
|
|||||||||||
| Cash and cash equivalents, end of period |
14,801 | 85,452 | 261,655 | — | 361,908 | |||||||||||||||
| Less: Cash and cash equivalents of discontinued operations, end of period |
— | 6,476 | 1 | — | 6,477 | |||||||||||||||
|
|
|
|
|
|
|
|
|
|
|
|||||||||||
| Cash and cash equivalents of continuing operations, end of period |
$ | 14,801 | $ | 78,976 | $ | 261,654 | $ | — | $ | 355,431 | ||||||||||
|
|
|
|
|
|
|
|
|
|
|
|||||||||||
F-92
Table of Contents
ALERE INC. AND SUBSIDIARIES
NOTES TO CONSOLIDATED FINANCIAL STATEMENTS (Continued)
(28) Subsequent Events
Merger Agreement with Abbott Laboratories
On January 30, 2016, we entered into an Agreement and Plan of Merger, or the Merger Agreement, with Abbott Laboratories, or Abbott. The Merger Agreement provides for the merger of a newly formed, wholly owned subsidiary of Abbott with and into Alere, or the merger, with Alere surviving the merger as a wholly owned subsidiary of Abbott, or the surviving corporation. Under the terms of the Merger Agreement, holders of shares of our common stock will receive $56.00 in cash, without interest, in exchange for each share of common stock. Each share of our Series B Convertible Perpetual Preferred Stock, par value $0.001 per share, or Series B Preferred Stock, issued and outstanding immediately prior to the effective time of the merger will remain issued and outstanding immediately following the consummation of the merger as one share of Series B Convertible Preferred Stock, par value $0.001 per share, of the surviving corporation. The Merger Agreement was approved by our board of directors. Completion of the merger is subject to customary closing conditions, including (1) the adoption of the Merger Agreement by the affirmative vote of the holders of at least a majority of all outstanding shares of our common stock, (2) there being no judgment or law enjoining or otherwise prohibiting the consummation of the merger and (3) the expiration of the waiting period applicable to the merger under the Hart-Scott-Rodino Antitrust Improvements Act of 1976, as amended, or the HSR Act, and receipt of other required antitrust approvals. The obligation of each of the parties to consummate the merger is also conditioned on the other party’s representations and warranties being true and correct (subject to certain materiality exceptions) and the other party having performed in all material respects its obligations under the Merger Agreement. The Merger Agreement contains certain termination rights and provides that, upon termination of the Merger Agreement under certain circumstances, Alere would be required to pay Abbott a termination fee equal to $177.0 million. The Company currently expects that the transaction will close by the end of 2016.
On May 2, 2016, Abbott and Alere received a request for additional information, or a “second request,” from the United States Federal Trade Commission, or the FTC, relating to Abbott’s potential acquisition of Alere. The second request was issued under the HSR Act. In addition, Abbott has agreed voluntarily to provide the FTC at least 60 days advance notice before certifying substantial compliance with the second request and to extend the waiting period imposed by the HSR Act until 60 days after Abbott and Alere have substantially complied with the second request, unless the period is further extended voluntarily by the parties or terminated sooner by the FTC. On June 23, 2016, Abbott and Alere received a request for additional information, or a “supplemental information request,” from the Canadian Competition Bureau, or the Bureau, relating to Abbott’s potential acquisition of Alere. The supplemental information request was issued under the Competition Act of Canada, or the Competition Act. The effect of the supplemental information request is to extend the waiting period imposed by the Competition Act until 30 days after Abbott and Alere have each complied with the supplemental information request, unless the period is extended voluntarily by the parties or terminated sooner by the Bureau. Under the terms of the Merger Agreement, Abbott has agreed to make certain divestitures if necessary to obtain the consent of the antitrust authorities to the transaction contemplated by the Merger Agreement, subject to certain materiality exceptions provided for in the Merger Agreement.
In addition, after entering into the Merger Agreement, Abbott informed Alere that it had serious concerns about, among other things, the accuracy of various representations, warranties and covenants made by us in the Merger Agreement. Abbott indicated that these concerns relate to the delay in filing this Annual Report on Form 10-K for the fiscal year ended December 31, 2015 as well as governmental investigations previously announced by Alere. Abbott has since requested information from Alere about these and other matters, citing contractual rights to receive information under the Merger Agreement. In the initial meeting in which Abbott expressed its concerns to Alere, as part of a discussion about potential
F-93
Table of Contents
ALERE INC. AND SUBSIDIARIES
NOTES TO CONSOLIDATED FINANCIAL STATEMENTS (Continued)
(28) Subsequent Events (Continued)
paths forward, Abbott requested that Alere agree to terminate the merger agreement in return for a payment by Abbott to Alere in the range of between $30 and $50 million in respect of Alere’s transaction expenses. Alere’s Board of Directors promptly rejected that request. In these discussions, Abbott affirmed its commitment to abide by its obligations under the Merger Agreement.
Amendments to Credit Facilities and Indenture
We were delayed in filing our Annual Report on Form 10-K for the fiscal year ended December 31, 2015 and our Quarterly Report on Form 10-Q for the quarter ended March 31, 2016 in connection with our previously announced review of certain aspects of the timing of revenue recognition, more specifically, revenue cutoff, in Africa and China for the years ended December 31, 2013, 2014 and 2015 (and each of the quarters in those annual periods). In order to avoid events of default under our secured credit facility and the indentures governing our 7.25% senior notes, our 6.5% senior subordinated notes and our 6.375% senior subordinated notes, we entered into an amendment to our Credit Agreement and obtained consents from the requisite holders of such notes to obtain an extension for filing of our Annual Report on Form 10-K for the fiscal year ended December 31, 2015 and our Quarterly Report on Form 10-Q for the quarter ended March 31, 2016 with the SEC and furnishing such financial information and certain related deliverables to the holders of such debt.
On April 22, 2016, we and the requisite lenders under the Credit Agreement entered into an amendment to the Credit Agreement pursuant to which they agreed to (i) waive certain Defaults and Events of Defaults (each as defined in the Credit Agreement) that may have occurred, are occurring or will occur, resulting from, among other things, (x) our failure to deliver to the Administrative Agents (as defined in the Credit Agreement) the financial statements and certain related deliverables for the year ended December 31, 2015 by the applicable deadline under the Credit Agreement, (y) any restatement of certain financial statements as a result of our incorrect application of revenue recognition principles for the years ended December 31, 2013, 2014 and 2015, or (z) any breach of any representation or affirmative covenant as a result of certain deliverables being incorrect when delivered, which breach is discovered as part of the audit of our financial statements for the year ended December 31, 2015, to the extent that such breach is due to our incorrect application of revenue recognition principles for the years ended December 31, 2013, 2014 and 2015, and (ii) extend the deadlines for delivery of the financial statements for the year ended December 31, 2015, the financial statements for the quarter ended March 31, 2016 and certain related deliverables. Under the terms of this amendment, we are required to deliver our unaudited financial statements for the three months ended March 31, 2016 and certain related deliverables on or before August 18, 2016, and our failure to do so could give rise to an Event of Default under the Credit Agreement and may result in the acceleration of the amounts due there under. In connection with this amendment, we paid, among other fees and expenses, to each consenting lender aggregate consent fees of 0.250% of the sum of (i) the aggregate principal amount of such lender’s Term Loans outstanding on the effective date of the amendment and (ii) such lender’s Revolving Credit Commitment (each as defined in the Credit Agreement) outstanding on the effective date of the amendment, or approximately $4.5 million in the aggregate for all consenting lenders. The amendment also increases the applicable interest rate margins for all loans outstanding under our secured credit facility by 0.25% per annum for the period from July 1, 2016 to the date of delivery of such financial reports and related deliverables under our secured credit facility.
F-94
Table of Contents
ALERE INC. AND SUBSIDIARIES
NOTES TO CONSOLIDATED FINANCIAL STATEMENTS (Continued)
(28) Subsequent Events (Continued)
In addition, on April 29, 2016, we commenced consent solicitations relating to our 6.5% senior subordinated notes, our 6.375% senior subordinated notes and our 7.25% senior notes, which we refer to collectively as the Notes. The consent solicitations were made to holders of record of the Notes as of April 28, 2016, and such solicitations were completed on May 9, 2016. Pursuant to the consent solicitations, the requisite holders of each series of Notes agreed to extend the deadline for delivery of certain financial information and to waive, through and until 5:00 p.m., New York City time, on August 31, 2016, any default or event of default that occurred, is continuing or may occur under the indentures under which the Notes were issued (and its consequences) in connection with any failure to timely file with the SEC or to timely furnish to the relevant trustees pursuant to the indentures, our Annual Report on Form 10-K for the year ended December 31, 2015 and our subsequent Quarterly Reports on Form 10-Q, or the Failures to File. In connection with the Failures to File, we paid, in May and July 2016, to each holder of Notes who validly delivered a consent aggregate cash payments equal to $15.00 for each $1,000 aggregate principal amount of such holder’s Notes, or an aggregate of $19.2 million.
Maturity of our 3.0% convertible senior subordinated notes
Our 3% convertible senior subordinated notes matured on May 15, 2016. Based on the price of our common stock on the date of maturity, we paid all outstanding principal and accrued interest owing under such notes in cash. The aggregate amount paid to the noteholders at maturity was approximately $152.0 million, consisting of $125.0 million in cash drawn under our revolving credit facility plus $27.0 million of cash available on such date.
INRatio®2 PT/INR Monitoring System Voluntary Withdrawal
Following a collaborative process with the FDA, in July 2016 we announced that we will be initiating a voluntary withdrawal of the Alere INRatio and INRatio2 PT/INR Monitoring System. We are currently working with the FDA on implementing the product withdrawal and eventual product discontinuation.
In December 2014, we initiated a voluntary correction to inform users of the Alere INRatio and INRatio2 PT/INR Monitoring Systems that patients with certain medical conditions should not be tested with the systems. We proactively reported these device concerns to the FDA and began conducting a thorough investigation into these events.
Over the course of the past two years, Alere invested in the research and development of software Enhancements intended to address the potential, in certain cases, of the system to deliver a result that differs from that of another measurement method.
We submitted the software enhancements to the FDA at the end of 2015. The FDA notified us that it believes the company’s studies do not adequately demonstrate the effectiveness of the software modification and advised us to submit a proposed plan to voluntarily remove the INRatio® device from the market.
In light of this input from the FDA and our business considerations, in July 2016 we determined to voluntarily remove the INRatio systems from the market.
Due to the fact that the circumstances giving rise to the voluntary withdrawal in the United States and related action outside the U.S. existed as of December 31, 2015, certain charges incurred in
F-95
Table of Contents
ALERE INC. AND SUBSIDIARIES
NOTES TO CONSOLIDATED FINANCIAL STATEMENTS (Continued)
(28) Subsequent Events (Continued)
connection with the recall were recorded in 2015. Specifically, we recorded a charge of approximately $38 million in the year ending December 31, 2015, of which, approximately $18 million is attributable to the impairment of certain inventory of our INRatio and INRatio2 products; approximately $3 million is related to the impairment of production equipment; and, approximately $16 million related to the estimated costs of removing our INRatio and INRatio2 from the market, including: notifications to users, return and disposals costs and other related amounts. Additionally, our decision to withdraw the INRatio and INRatio2 PT/INR Monitoring Systems impacted the useful life assumptions of certain tangible and intangible assets. As a result of this change in estimate, we recorded approximately $4 million of accelerated amortization of intangible assets and approximately $1 million of accelerated depreciation of tangible assets in the year ending December 31, 2015. Finally, during fiscal year 2016 we expect to incur approximately $16 million of accelerated amortization, approximately $3 million of accelerated depreciation, and $2 million of other one-time cash expenditures.
F-96