Attached files
| file | filename |
|---|---|
| EX-32.2 - EXHIBIT 32.2 - United States Commodity Index Funds Trust | v444780_ex32-2.htm |
| EX-32.1 - EXHIBIT 32.1 - United States Commodity Index Funds Trust | v444780_ex32-1.htm |
| EX-31.2 - EXHIBIT 31.2 - United States Commodity Index Funds Trust | v444780_ex31-2.htm |
| EX-31.1 - EXHIBIT 31.1 - United States Commodity Index Funds Trust | v444780_ex31-1.htm |
UNITED STATES
SECURITIES AND EXCHANGE COMMISSION
Washington, D.C. 20549
FORM 10-Q
| x | Quarterly report pursuant to Section 13 or 15(d) of the Securities Exchange Act of 1934 for the quarterly period ended June 30, 2016. |
OR
| ¨ | Transition report pursuant to Section 13 or 15(d) of the Securities Exchange Act of 1934 for the transition period from to . |
Commission File Number: 001-34833
United States Commodity Index Funds Trust
(Exact name of registrant as specified in its charter)
| Delaware | 27-1537655 |
| (State or other jurisdiction of | (I.R.S. Employer |
| incorporation or organization) | Identification No.) |
1999 Harrison Street, Suite 1530
Oakland, California 94612
(Address of principal executive offices) (Zip code)
(510) 522-9600
(Registrant’s telephone number, including area code)
N/A
(Former name, former address and former fiscal year, if changed since last report)
Indicate by check mark whether the registrant (1) has filed all reports required to be filed by Section 13 or 15(d) of the Securities Exchange Act of 1934 during the preceding 12 months (or for such shorter period that the registrant was required to file such reports), and (2) has been subject to such filing requirements for the past 90 days. x Yes ¨ No
Indicate by check mark whether the registrant has submitted electronically and posted on its corporate Website, if any, every Interactive Data File required to be submitted and posted pursuant to Rule 405 of Regulation S-T (§232.405 of this chapter) during the preceding 12 months (or for such shorter period that the registrant was required to submit and post such files). x Yes ¨ No
Indicate by check mark whether the registrant is a large accelerated filer, an accelerated filer, a non-accelerated filer, or a smaller reporting company. See the definitions of “large accelerated filer,” “accelerated filer” and “smaller reporting company” in Rule 12b-2 of the Exchange Act.
| Large accelerated filer | ¨ | Accelerated filer | x | |||
| Non-accelerated filer | ¨ (Do not check if a smaller reporting company) | Smaller reporting company | ¨ |
Indicate by check mark whether the registrant is a shell company (as defined in Rule 12b-2 of the Exchange Act). ¨ Yes x No
The number of shares outstanding of each series of the registrant as of August 2, 2016 are included in the table below:
| Number of Outstanding Shares as of August 2, 2016 | ||||
| United States Agriculture Index Fund | 16,500,000 | |||
| United States Commodity Index Fund | 200,000 | |||
| United States Copper Index Fund | 100,000 | |||
| Total | 16,800,000 | |||
UNITED STATES COMMODITY INDEX FUNDS TRUST
Item 1. Condensed Financial Statements.
Index to Condensed Financial Statements
| 1 |
United States Commodity Index Funds Trust
Condensed Statements of Financial Condition
At June 30, 2016 (Unaudited) and December 31, 2015
| United States Commodity Index Fund | ||||||||
| June 30, 2016 | December 31, 2015 | |||||||
| Assets | ||||||||
| Cash and cash equivalents (Notes 2 and 6) | $ | 611,301,606 | $ | 474,315,271 | ||||
| Equity in trading accounts: | ||||||||
| Cash and cash equivalents | 38,619,613 | 55,991,723 | ||||||
| Unrealized gain (loss) on open commodity futures contracts | 11,926,929 | (8,582,227 | ) | |||||
| Interest receivable | 1,261 | 1,261 | ||||||
| Directors' fees and insurance receivable | 10,669 | 6,190 | ||||||
| Total assets | $ | 661,860,078 | $ | 521,732,218 | ||||
| Liabilities and Capital | ||||||||
| Management fees payable (Note 4) | $ | 400,257 | $ | 359,544 | ||||
| Professional fees payable | 326,238 | 693,889 | ||||||
| Brokerage commissions payable | 42,815 | 42,815 | ||||||
| Total liabilities | 769,310 | 1,096,248 | ||||||
| Commitments and Contingencies (Notes 4, 5 and 6) | ||||||||
| Capital | ||||||||
| Sponsor | – | – | ||||||
| Shareholders | 661,090,768 | 520,635,970 | ||||||
| Total Capital | 661,090,768 | 520,635,970 | ||||||
| Total liabilities and capital | $ | 661,860,078 | $ | 521,732,218 | ||||
| Shares outstanding | 15,350,000 | 12,850,000 | ||||||
| Net asset value per share | $ | 43.07 | $ | 40.52 | ||||
| Market value per share | $ | 43.19 | $ | 40.47 | ||||
See accompanying notes to condensed financial statements.
| 2 |
United States Commodity Index Funds Trust
Condensed Statements of Financial Condition
At June 30, 2016 (Unaudited) and December 31, 2015
| United States Copper Index Fund | ||||||||
| June 30, 2016 | December 31, 2015 | |||||||
| Assets | ||||||||
| Cash and cash equivalents (Notes 2 and 6) | $ | 2,558,846 | $ | 1,871,256 | ||||
| Equity in trading accounts: | ||||||||
| Cash and cash equivalents | 267,085 | 433,440 | ||||||
| Unrealized gain (loss) on open commodity futures contracts | 80,238 | (180,625 | ) | |||||
| Receivable from Sponsor (Note 4) | 34,031 | 59,601 | ||||||
| Directors' fees and insurance receivable | 30 | 32 | ||||||
| Total assets | $ | 2,940,230 | $ | 2,183,704 | ||||
| Liabilities and Capital | ||||||||
| Management fees payable (Note 4) | $ | 1,475 | $ | 1,156 | ||||
| Professional fees payable | 34,191 | 47,158 | ||||||
| Total liabilities | 35,666 | 48,314 | ||||||
| Commitments and Contingencies (Notes 4, 5 and 6) | ||||||||
| Capital | ||||||||
| Sponsor | – | – | ||||||
| Shareholders | 2,904,564 | 2,135,390 | ||||||
| Total Capital | 2,904,564 | 2,135,390 | ||||||
| Total liabilities and capital | $ | 2,940,230 | $ | 2,183,704 | ||||
| Shares outstanding | 200,000 | 150,000 | ||||||
| Net asset value per share | $ | 14.52 | $ | 14.24 | ||||
| Market value per share | $ | 14.50 | $ | 14.27 | ||||
See accompanying notes to condensed financial statements.
| 3 |
United States Commodity Index Funds Trust
Condensed Statements of Financial Condition
At June 30, 2016 (Unaudited) and December 31, 2015
| United States Agriculture Index Fund | ||||||||
| June 30, 2016 | December 31, 2015 | |||||||
| Assets | ||||||||
| Cash and cash equivalents (Notes 2 and 6) | $ | 1,962,943 | $ | 1,820,742 | ||||
| Equity in trading accounts: | ||||||||
| Cash and cash equivalents | 79,265 | 139,467 | ||||||
| Unrealized gain (loss) on open commodity futures contracts | 89,593 | 6,157 | ||||||
| Receivable from Sponsor (Note 4) | 31,558 | 56,324 | ||||||
| Interest receivable | 46 | 46 | ||||||
| Directors' fees and insurance receivable | 39 | – | ||||||
| Total assets | $ | 2,163,444 | $ | 2,022,736 | ||||
| Liabilities and Capital | ||||||||
| Management fees payable (Note 4) | $ | 2,225 | $ | 2,171 | ||||
| Professional fees payable | 28,683 | 40,981 | ||||||
| Directors' fees and insurance payable | – | 64 | ||||||
| Total liabilities | 30,908 | 43,216 | ||||||
| Commitments and Contingencies (Notes 4, 5 and 6) | ||||||||
| Capital | ||||||||
| Sponsor | – | – | ||||||
| Shareholders | 2,132,536 | 1,979,520 | ||||||
| Total Capital | 2,132,536 | 1,979,520 | ||||||
| Total liabilities and capital | $ | 2,163,444 | $ | 2,022,736 | ||||
| Shares outstanding | 100,000 | 100,000 | ||||||
| Net asset value per share | $ | 21.33 | $ | 19.80 | ||||
| Market value per share | $ | 20.10 | $ | 19.39 | ||||
See accompanying notes to condensed financial statements.
| 4 |
United States Commodity Index Funds Trust
Condensed Statements of Financial Condition
At June 30, 2016 (Unaudited) and December 31, 2015
| United States Commodity Index Funds Trust | ||||||||
| June 30, 2016 | December 31, 2015 | |||||||
| Assets | ||||||||
| Cash and cash equivalents (Notes 2 and 6) | $ | 615,823,395 | $ | 478,007,269 | ||||
| Equity in trading accounts: | ||||||||
| Cash and cash equivalents | 38,965,963 | 56,564,630 | ||||||
| Unrealized gain (loss) on open commodity futures contracts | 12,096,760 | (8,756,695 | ) | |||||
| Receivable from Sponsor (Note 4) | 65,589 | 115,925 | ||||||
| Interest receivable | 1,307 | 1,307 | ||||||
| Directors' fees and insurance receivable | 10,738 | 6,222 | ||||||
| Total assets | $ | 666,963,752 | $ | 525,938,658 | ||||
| Liabilities and Capital | ||||||||
| Management fees payable (Note 4) | $ | 403,957 | $ | 362,871 | ||||
| Professional fees payable | 389,112 | 782,028 | ||||||
| Brokerage commissions payable | 42,815 | 42,815 | ||||||
| Directors' fees and insurance payable | – | 64 | ||||||
| Total liabilities | 835,884 | 1,187,778 | ||||||
| Commitments and Contingencies (Notes 4, 5 and 6) | ||||||||
| Capital | ||||||||
| Sponsor | – | – | ||||||
| Shareholders | 666,127,868 | 524,750,880 | ||||||
| Total Capital | 666,127,868 | 524,750,880 | ||||||
| Total liabilities and capital | $ | 666,963,752 | $ | 525,938,658 | ||||
| Shares outstanding | 15,650,000 | 13,100,000 | ||||||
See accompanying notes to condensed financial statements.
| 5 |
United States Commodity Index Funds Trust
Condensed Schedule of Investments (Unaudited)
At June 30, 2016
United States Commodity Index Fund
| Number of Contracts | Unrealized Gain (Loss) on Open Commodity Contracts | % of Capital | ||||||||||
| Open Futures Contracts - Long | ||||||||||||
| Foreign Contracts | ||||||||||||
| LME Tin Futures LT July 2016 contracts, expiring July 2016 | 575 | $ | 908,940 | 0.14 | ||||||||
| ICE-US Cocoa Futures CC September 2016 contracts, expiring September 2016 | 1,553 | (533,070 | ) | (0.08 | ) | |||||||
| ICE-US Sugar #11 Futures SB October 2016 contracts, expiring September 2016 | 2,108 | 5,928,568 | 0.90 | |||||||||
| ICE-US Cotton #2 Futures CT December 2016 contracts, expiring December 2016 | 1,440 | 358,365 | 0.05 | |||||||||
| LME Tin Futures LT January 2017 contracts, expiring January 2017 | 552 | 225,873 | 0.03 | |||||||||
| 6,228 | 6,888,676 | 1.04 | ||||||||||
| United States Contracts | ||||||||||||
| CME Lean Hogs Futures LH August 2016 contracts, expiring August 2016 | 1,388 | 921,090 | 0.14 | |||||||||
| CME Feeder Cattle Futures FC August 2016 contracts, expiring August 2016 | 662 | 481,387 | 0.07 | |||||||||
| NYMEX Natural Gas Futures NG September 2016 contracts, expiring August 2016 | 1,690 | 1,115,960 | 0.17 | |||||||||
| CME Live Cattle Futures LC August 2016 contracts, expiring August 2016 | 1,035 | (244,017 | ) | (0.04 | ) | |||||||
| CBOT Corn Futures C September 2016 contracts, expiring September 2016 | 2,382 | (5,100,713 | ) | (0.77 | ) | |||||||
| CBOT Soybean Futures S September 2016 contracts, expiring September 2016 | 832 | 3,731,313 | 0.56 | |||||||||
| COMEX Copper Futures HG September 2016 contracts, expiring September 2016 | 873 | 1,870,875 | 0.28 | |||||||||
| COMEX Silver Futures SI September 2016 contracts, expiring September 2016 | 521 | 1,179,510 | 0.18 | |||||||||
| CBOT Soybean Meal Futures SM January 2017 contracts, expiring January 2017 | 1,226 | 1,393,040 | 0.21 | |||||||||
| COMEX Gold Futures GC June 2017 contracts, expiring June 2017 | 346 | (90,170 | ) | (0.01 | ) | |||||||
| 10,955 | 5,258,275 | 0.79 | ||||||||||
| Open Futures Contracts - Short* | ||||||||||||
| Foreign Contracts | ||||||||||||
| LME Tin Futures LT July 2016 contracts, expiring July 2016 | 575 | (220,022 | ) | (0.03 | ) | |||||||
| Total Open Futures Contracts** | 17,758 | $ | 11,926,929 | 1.80 | ||||||||
| Principal Amount | Market Value | |||||||||||
| Cash Equivalents | ||||||||||||
| United States Treasury Obligations | ||||||||||||
| U.S. Treasury Bills: | ||||||||||||
| 0.46%, 7/07/2016 | $ | 30,000,000 | $ | 29,997,725 | 4.54 | |||||||
| 0.43%, 7/28/2016 | 20,000,000 | 19,993,550 | 3.03 | |||||||||
| 0.43%, 8/18/2016 | 20,000,000 | 19,988,667 | 3.03 | |||||||||
| 0.48%, 9/01/2016 | 30,000,000 | 29,975,458 | 4.54 | |||||||||
| 0.46%, 9/08/2016 | 20,000,000 | 19,982,558 | 3.02 | |||||||||
| 0.44%, 9/22/2016 | 20,000,000 | 19,979,711 | 3.02 | |||||||||
| 0.38%, 9/29/2016 | 20,000,000 | 19,981,000 | 3.02 | |||||||||
| 0.35%, 10/13/2016 | 20,000,000 | 19,980,067 | 3.02 | |||||||||
| 0.35%, 10/20/2016 | 30,000,000 | 29,967,625 | 4.53 | |||||||||
| 0.40%, 10/27/2016 | 20,000,000 | 19,974,106 | 3.02 | |||||||||
| 0.38%, 11/03/2016 | 30,000,000 | 29,960,417 | 4.53 | |||||||||
| 0.36%, 11/10/2016 | 30,000,000 | 29,960,950 | 4.53 | |||||||||
| 0.40%, 11/17/2016 | 40,000,000 | 39,938,995 | 6.04 | |||||||||
| 0.47%, 11/25/2016 | 30,000,000 | 29,942,425 | 4.53 | |||||||||
| 0.41%, 12/08/2016 | 40,000,000 | 39,927,111 | 6.04 | |||||||||
| 0.34%, 12/15/2016 | 30,000,000 | 29,952,683 | 4.53 | |||||||||
| 0.39%, 12/22/2016 | 30,000,000 | 29,943,813 | 4.53 | |||||||||
| 0.34%, 12/29/2016 | 30,000,000 | 29,949,471 | 4.53 | |||||||||
| Total Cash Equivalents | $ | 489,396,332 | 74.03 | |||||||||
* All short contracts are offset by the same number of Futures Contracts in the corresponding long positions and are acquired solely for the purpose of reducing a long position (e.g., due to a redemption or to reflect a rebalancing of the SDCI).
** Collateral amounted to $38,619,613 on open futures contracts.
See accompanying notes to condensed financial statements.
| 6 |
United States Commodity Index Funds Trust
Condensed Schedule of Investments (Unaudited)
At June 30, 2016
United States Copper Index Fund
| Number of Contracts | Unrealized Gain (Loss) on Open Commodity Contracts | % of Capital | ||||||||||
| Open Futures Contracts – Long | ||||||||||||
| United States Contracts | ||||||||||||
| COMEX Copper Futures HG September 2016 contracts, expiring September 2016 | 27 | $ | 42,950 | 1.48 | ||||||||
| COMEX Copper Futures HG December 2016 contracts, expiring December 2016 | 26 | 37,288 | 1.28 | |||||||||
| Total Open Futures Contracts* | 53 | $ | 80,238 | 2.76 | ||||||||
| Principal Amount | Market Value | |||||||||||
| Cash Equivalents | ||||||||||||
| United States Treasury Obligations | ||||||||||||
| U.S. Treasury Bills: | ||||||||||||
| 0.46%, 7/07/2016 | $ | 250,000 | $ | 249,981 | 8.61 | |||||||
| 0.38%, 9/29/2016 | 250,000 | 249,762 | 8.60 | |||||||||
| 0.35%, 10/13/2016 | 250,000 | 249,751 | 8.60 | |||||||||
| 0.34%, 10/20/2016 | 250,000 | 249,738 | 8.60 | |||||||||
| 0.40%, 10/27/2016 | 500,000 | 499,353 | 17.19 | |||||||||
| 0.38%, 11/03/2016 | 250,000 | 249,670 | 8.59 | |||||||||
| 0.40%, 11/17/2016 | 250,000 | 249,619 | 8.59 | |||||||||
| 0.39%, 12/22/2016 | 250,000 | 249,532 | 8.59 | |||||||||
| Total Cash Equivalents | $ | 2,247,406 | 77.37 | |||||||||
* Collateral amounted to $267,085 on open futures contracts.
See accompanying notes to condensed financial statements.
| 7 |
United States Commodity Index Funds Trust
Condensed Schedule of Investments (Unaudited)
At June 30, 2016
United States Agriculture Index Fund
| Number of Contracts | Unrealized Gain (Loss) on Open Commodity Contracts | % of Capital | ||||||||||
| Open Futures Contracts – Long | ||||||||||||
| Foreign Contracts | ||||||||||||
| ICE-US Sugar #11 Futures SB October 2016 contracts, expiring September 2016 | 12 | $ | 36,434 | 1.71 | ||||||||
| ICE-Canola Futures RS November 2016 contracts, expiring November 2016 | 3 | (1,077 | ) | (0.05 | ) | |||||||
| ICE-US Cotton #2 Futures CT December 2016 contracts, expiring December 2016 | 3 | 1,285 | 0.06 | |||||||||
| ICE-US Cocoa Futures CC December 2016 contracts, expiring December 2016 | 6 | (1,670 | ) | (0.08 | ) | |||||||
| ICE-US Coffee-C Futures KC December 2016 contracts, expiring December 2016 | 3 | 25,012 | 1.17 | |||||||||
| 27 | 59,984 | 2.81 | ||||||||||
| United States Contracts | ||||||||||||
| CME Lean Hogs Futures LH August 2016 contracts, expiring August, 2016 | 5 | 5,400 | 0.25 | |||||||||
| CME Feeder Cattle Futures LC August 2016 contracts, expiring August, 2016 | 1 | 2,250 | 0.11 | |||||||||
| CME Live Cattle Futures LC August 2016 contracts, expiring August, 2016 | 6 | (2,200 | ) | (0.10 | ) | |||||||
| CBOT Corn Futures C September 2016 contracts, expiring September, 2016 | 11 | (21,012 | ) | (0.99 | ) | |||||||
| CBOT Soybean Oil Futures BO September 2016 contracts, expiring September, 2016 | 1 | 216 | 0.01 | |||||||||
| CBOT Wheat Futures W September 2016 contracts, expiring September, 2016 | 6 | (10,025 | ) | (0.47 | ) | |||||||
| CBOT Soybean Meal Futures SM October 2016 contracts, expiring October, 2016 | 4 | 29,830 | 1.40 | |||||||||
| CBOT Soybean Futures S November 2016 contracts, expiring November, 2016 | 6 | 29,825 | 1.40 | |||||||||
| KCBT Hard Red Winter Wheat Futures KW December 2016 contracts, expiring December, 2016 | 2 | (4,675 | ) | (0.22 | ) | |||||||
| 42 | 29,609 | 1.39 | ||||||||||
| Total Open Futures Contracts* | 69 | $ | 89,593 | 4.20 | ||||||||
| Principal Amount | Market Value | |||||||||||
| Cash Equivalents | ||||||||||||
| United States Treasury Obligations | ||||||||||||
| U.S. Treasury Bills: | ||||||||||||
| 0.46%, 7/07/2016 | $ | 250,000 | $ | 249,981 | 11.72 | |||||||
| 0.43%, 8/18/2016 | 250,000 | 249,858 | 11.72 | |||||||||
| 0.40%, 10/27/2016 | 250,000 | 249,676 | 11.71 | |||||||||
| 0.38%, 11/03/2016 | 250,000 | 249,670 | 11.71 | |||||||||
| 0.40%, 11/17/2016 | 250,000 | 249,619 | 11.70 | |||||||||
| 0.39%, 12/22/2016 | 250,000 | 249,532 | 11.70 | |||||||||
| Total Cash Equivalents | $ | 1,498,336 | 70.26 | |||||||||
* Collateral amounted to $79,265 on open futures contracts.
See accompanying notes to condensed financial statements.
| 8 |
United States Commodity Index Funds Trust
Condensed Statements of Operations (Unaudited)
For the three and six months ended June 30, 2016 and 2015
United States Commodity Index Fund
| Three months ended June 30, 2016 | Three months ended June 30, 2015 | Six months ended June 30, 2016 | Six months ended June 30, 2015 | |||||||||||||
| Income | ||||||||||||||||
| Gain (loss) on trading of commodity futures contracts: | ||||||||||||||||
| Realized gain (loss) on closed positions | $ | 30,228,101 | $ | (5,385,302 | ) | $ | 15,028,812 | $ | (54,343,959 | ) | ||||||
| Change in unrealized gain (loss) on open positions | 6,381,712 | 31,831,009 | 20,509,156 | 34,803,676 | ||||||||||||
| Realized gain (loss) on short-term investments | – | – | – | 3,645 | ||||||||||||
| Interest income | 455,142 | 84,905 | 793,125 | 165,976 | ||||||||||||
| ETF transaction fees | 6,300 | 4,550 | 8,750 | 8,750 | ||||||||||||
| Total income (loss) | 37,071,255 | 26,535,162 | 36,339,843 | (19,361,912 | ) | |||||||||||
| Expenses | ||||||||||||||||
| Management fees (Note 4) | 1,115,215 | 1,072,363 | 2,114,266 | 2,383,627 | ||||||||||||
| Professional fees | 138,443 | 279,169 | 288,404 | 540,705 | ||||||||||||
| Brokerage commissions | 183,218 | 151,217 | 359,905 | 350,400 | ||||||||||||
| Directors' fees and insurance | 14,143 | 28,429 | 37,195 | 56,042 | ||||||||||||
| Total expenses | 1,451,019 | 1,531,178 | 2,799,770 | 3,330,774 | ||||||||||||
| Net income (loss) | $ | 35,620,236 | $ | 25,003,984 | $ | 33,540,073 | $ | (22,692,686 | ) | |||||||
| Net income (loss) per share | $ | 2.66 | $ | 2.18 | $ | 2.55 | $ | (1.12 | ) | |||||||
| Net income (loss) per weighted average share | $ | 2.66 | $ | 2.15 | $ | 2.58 | $ | (1.75 | ) | |||||||
| Weighted average shares outstanding | 13,407,692 | 11,620,879 | 13,011,813 | 12,948,619 | ||||||||||||
See accompanying notes to condensed financial statements.
| 9 |
United States Commodity Index Funds Trust
Condensed Statements of Operations (Unaudited)
For the three and six months ended June 30, 2016 and 2015
United States Copper Index Fund
| Three months ended June 30, 2016 | Three months ended June 30, 2015 | Six months ended June 30, 2016 | Six months ended June 30, 2015 | |||||||||||||
| Income | ||||||||||||||||
| Gain (loss) on trading of commodity futures contracts: | ||||||||||||||||
| Realized gain (loss) on closed positions | $ | 2,826 | $ | 173,162 | $ | (246,050 | ) | $ | (189,213 | ) | ||||||
| Change in unrealized gain (loss) on open positions | (1,375 | ) | (259,063 | ) | 260,863 | (11,825 | ) | |||||||||
| Realized gain (loss) on short-term investments | – | – | – | 17 | ||||||||||||
| Interest income | 2,201 | 252 | 3,466 | 553 | ||||||||||||
| ETF transaction fees | – | – | 350 | 350 | ||||||||||||
| Total income (loss) | 3,652 | (85,649 | ) | 18,629 | (200,118 | ) | ||||||||||
| Expenses | ||||||||||||||||
| Management fees (Note 4) | 4,568 | 3,021 | 8,080 | 6,124 | ||||||||||||
| Professional fees | 18,502 | 17,077 | 34,779 | 28,262 | ||||||||||||
| Brokerage commissions | 215 | 296 | 896 | 556 | ||||||||||||
| Directors' fees and insurance | 130 | 103 | 222 | 202 | ||||||||||||
| Total expenses | 23,415 | 20,497 | 43,977 | 35,144 | ||||||||||||
| Expense waiver (Note 4) | (17,699 | ) | (16,779 | ) | (34,033 | ) | (27,603 | ) | ||||||||
| Net expenses | 5,716 | 3,718 | 9,944 | 7,541 | ||||||||||||
| Net income (loss) | $ | (2,064 | ) | $ | (89,367 | ) | $ | 8,685 | $ | (207,659 | ) | |||||
| Net income (loss) per share | $ | (0.01 | ) | $ | (0.90 | ) | $ | 0.28 | $ | (1.46 | ) | |||||
| Net income (loss) per weighted average share | $ | (0.01 | ) | $ | (0.89 | ) | $ | 0.05 | $ | (2.00 | ) | |||||
| Weighted average shares outstanding | 200,000 | 100,000 | 177,198 | 103,867 | ||||||||||||
See accompanying notes to condensed financial statements.
| 10 |
United States Commodity Index Funds Trust
Condensed Statements of Operations (Unaudited)
For the three and six months ended June 30, 2016 and 2015
United States Agriculture Index Fund
| Three months ended June 30, 2016 | Three months ended June 30, 2015 | Six months ended June 30, 2016 | Six months ended June 30, 2015 | |||||||||||||
| Income | ||||||||||||||||
| Gain (loss) on trading of commodity futures contracts: | ||||||||||||||||
| Realized gain (loss) on closed positions | $ | 49,837 | $ | (104,754 | ) | $ | 73,847 | $ | (274,438 | ) | ||||||
| Change in unrealized gain (loss) on open positions | 120,644 | 257,421 | 83,436 | 222,298 | ||||||||||||
| Realized gain (loss) on foreign currency transactions | – | 6 | (15 | ) | 59 | |||||||||||
| Change in unrealized gain (loss) on foreign currency translations | 6 | 36 | 876 | 4 | ||||||||||||
| Interest income | 1,614 | 320 | 2,845 | 648 | ||||||||||||
| Total income (loss) | 172,101 | 153,029 | 160,989 | (51,429 | ) | |||||||||||
| Expenses | ||||||||||||||||
| Management fees (Note 4) | 3,329 | 3,393 | 6,463 | 6,891 | ||||||||||||
| Professional fees | 16,876 | 15,629 | 31,870 | 25,637 | ||||||||||||
| Brokerage commissions | 420 | 406 | 1,016 | 1,064 | ||||||||||||
| Directors' fees and insurance | 104 | 94 | 182 | 195 | ||||||||||||
| Total expenses | 20,729 | 19,522 | 39,531 | 33,787 | ||||||||||||
| Expense waiver (Note 4) | (16,612 | ) | (15,392 | ) | (31,558 | ) | (25,283 | ) | ||||||||
| Net expenses | 4,117 | 4,130 | 7,973 | 8,504 | ||||||||||||
| Net income (loss) | $ | 167,984 | $ | 148,899 | $ | 153,016 | $ | (59,933 | ) | |||||||
| Net income (loss) per share | $ | 1.68 | $ | 1.49 | $ | 1.53 | $ | (0.60 | ) | |||||||
| Net income (loss) per weighted average share | $ | 1.68 | $ | 1.49 | $ | 1.53 | $ | (0.60 | ) | |||||||
| Weighted average shares outstanding | 100,000 | 100,000 | 100,000 | 100,000 | ||||||||||||
See accompanying notes to condensed financial statements.
| 11 |
United States Commodity Index Funds Trust
Condensed Statements of Operations (Unaudited)
For the three and six months ended June 30, 2016 and 2015
United States Commodity Index Funds Trust
| Three months ended June 30, 2016 | Three months ended June 30, 2015 | Six months ended June 30, 2016 | Six months ended June 30, 2015 | |||||||||||||
| Income | ||||||||||||||||
| Gain (loss) on trading of commodity futures contracts: | ||||||||||||||||
| Realized gain (loss) on closed positions | $ | 30,280,764 | $ | (5,316,894 | ) | $ | 14,856,609 | $ | (54,990,026 | ) | ||||||
| Change in unrealized gain (loss) on open positions | 6,500,981 | 31,829,367 | 20,853,455 | 35,150,713 | ||||||||||||
| Realized gain (loss) on foreign currency transactions | – | 6 | (15 | ) | 59 | |||||||||||
| Realized gain (loss) on short-term investments | – | – | – | 3,812 | ||||||||||||
| Change in unrealized gain (loss) on foreign currency translations | 6 | 36 | 876 | 4 | ||||||||||||
| Interest income | 458,957 | 85,477 | 799,436 | 167,335 | ||||||||||||
| ETF transaction fees | 6,300 | 4,550 | 9,100 | 9,450 | ||||||||||||
| Total income (loss) | 37,247,008 | 26,602,542 | 36,519,461 | (19,658,653 | ) | |||||||||||
| Expenses | ||||||||||||||||
| Management fees (Note 4) | 1,123,112 | 1,078,777 | 2,128,809 | 2,398,737 | ||||||||||||
| Professional fees | 173,821 | 311,875 | 355,053 | 603,647 | ||||||||||||
| Brokerage commissions | 183,853 | 151,919 | 361,817 | 352,329 | ||||||||||||
| Directors' fees and insurance | 14,377 | 28,626 | 37,599 | 56,510 | ||||||||||||
| Total expenses | 1,495,163 | 1,571,197 | 2,883,278 | 3,411,223 | ||||||||||||
| Expense waiver (Note 4) | (34,311 | ) | (32,171 | ) | (65,591 | ) | (61,779 | ) | ||||||||
| Net expenses | 1,460,852 | 1,539,026 | 2,817,687 | 3,349,444 | ||||||||||||
| Net income (loss) | $ | 35,786,156 | $ | 25,063,516 | $ | 33,701,774 | $ | (23,008,097 | ) | |||||||
See accompanying notes to condensed financial statements.
| 12 |
United States Commodity Index Funds Trust
Condensed Statement of Changes in Capital (Unaudited)
For the six months ended June 30, 2016
| United States Commodity Index Fund | ||||||||||||
| Sponsor | Shareholders | Total | ||||||||||
| Balances, at December 31, 2015 | $ | – | $ | 520,635,970 | $ | 520,635,970 | ||||||
| Additions | – | 126,570,004 | 126,570,004 | |||||||||
| Redemptions | – | (19,655,279 | ) | (19,655,279 | ) | |||||||
| Net income (loss) | – | 33,540,073 | 33,540,073 | |||||||||
| Balances, at June 30, 2016 | $ | – | $ | 661,090,768 | $ | 661,090,768 | ||||||
Condensed Statement of Changes in Shares Outstanding (Unaudited)
For the six months ended June 30, 2016
| Sponsor | Shareholders | Total | ||||||||||
| Shares Outstanding, at December 31, 2015 | – | 12,850,000 | 12,850,000 | |||||||||
| Additions | – | 3,000,000 | 3,000,000 | |||||||||
| Redemptions | – | (500,000 | ) | (500,000 | ) | |||||||
| Shares Outstanding, at June 30, 2016 | – | 15,350,000 | 15,350,000 | |||||||||
| Net Asset Value Per Share: | ||||||||||||
| At December 31, 2015 | $ | 40.52 | ||||||||||
| At June 30, 2016 | $ | 43.07 | ||||||||||
See accompanying notes to condensed financial statements.
| 13 |
United States Commodity Index Funds Trust
Condensed Statement of Changes in Capital (Unaudited)
For the six months ended June 30, 2016
United States Copper Index Fund
| Sponsor | Shareholders | Total | ||||||||||
| Balances, at December 31, 2015 | $ | – | $ | 2,135,390 | $ | 2,135,390 | ||||||
| Additions | – | 760,489 | 760,489 | |||||||||
| Redemptions | – | – | – | |||||||||
| Net income (loss) | – | 8,685 | 8,685 | |||||||||
| Balances, at June 30, 2016 | $ | – | $ | 2,904,564 | $ | 2,904,564 | ||||||
Condensed Statement of Changes in Shares Outstanding (Unaudited)
For the six months ended June 30, 2016
| Sponsor | Shareholders | Total | ||||||||||
| Shares Outstanding, at December 31, 2015 | – | 150,000 | 150,000 | |||||||||
| Additions | – | 50,000 | 50,000 | |||||||||
| Redemptions | – | – | – | |||||||||
| Shares Outstanding, at June 30, 2016 | – | 200,000 | 200,000 | |||||||||
| Net Asset Value Per Share: | ||||||||||||
| At December 31, 2015 | $ | 14.24 | ||||||||||
| At June 30, 2016 | $ | 14.52 | ||||||||||
See accompanying notes to condensed financial statements.
| 14 |
United States Commodity Index Funds Trust
Condensed Statement of Changes in Capital (Unaudited)
For the six months ended June 30, 2016
| United States Agriculture Index Fund | ||||||||||||
| Sponsor | Shareholders | Total | ||||||||||
| Balances, at December 31, 2015 | $ | – | $ | 1,979,520 | $ | 1,979,520 | ||||||
| Additions | – | – | – | |||||||||
| Redemptions | – | – | – | |||||||||
| Net income (loss) | – | 153,016 | 153,016 | |||||||||
| Balances, at June 30, 2016 | $ | – | $ | 2,132,536 | $ | 2,132,536 | ||||||
Condensed Statement of Changes in Shares Outstanding (Unaudited)
For the six months ended June 30, 2016
| Sponsor | Shareholders | Total | ||||||||||
| Shares Outstanding, at December 31, 2015 | – | 100,000 | 100,000 | |||||||||
| Additions | – | – | – | |||||||||
| Redemptions | – | – | – | |||||||||
| Shares Outstanding, at June 30, 2016 | – | 100,000 | 100,000 | |||||||||
| Net Asset Value Per Share: | ||||||||||||
| At December 31, 2015 | $ | 19.80 | ||||||||||
| At June 30, 2016 | $ | 21.33 | ||||||||||
See accompanying notes to condensed financial statements.
| 15 |
United States Commodity Index Funds Trust
Condensed Statement of Changes in Capital (Unaudited)
For the six months ended June 30, 2016
| United States Commodity Index Funds Trust | ||||||||||||
| Sponsor | Shareholders | Total | ||||||||||
| Balances, at December 31, 2015 | $ | – | $ | 524,750,880 | $ | 524,750,880 | ||||||
| Additions | – | 127,330,493 | 127,330,493 | |||||||||
| Redemptions | – | (19,655,279 | ) | (19,655,279 | ) | |||||||
| Net income (loss) | – | 33,701,774 | 33,701,774 | |||||||||
| Balances, at June 30, 2016 | $ | – | $ | 666,127,868 | $ | 666,127,868 | ||||||
Condensed Statement of Changes in Shares Outstanding (Unaudited)
For the six months ended June 30, 2016
| Sponsor | Shareholders | Total | ||||||||||
| Shares Outstanding, at December 31, 2015 | – | 13,100,000 | 13,100,000 | |||||||||
| Additions | – | 3,050,000 | 3,050,000 | |||||||||
| Redemptions | – | (500,000 | ) | (500,000 | ) | |||||||
| Shares Outstanding, at June 30, 2016 | – | 15,650,000 | 15,650,000 | |||||||||
See accompanying notes to condensed financial statements.
| 16 |
United States Commodity Index Funds Trust
Condensed Statements of Cash Flows (Unaudited)
For the six months ended June 30, 2016 and 2015
United States Commodity Index Fund
| Six months ended June 30, 2016 | Six months ended June 30, 2015 | |||||||
| Cash Flows from Operating Activities: | ||||||||
| Net income (loss) | $ | 33,540,073 | $ | (22,692,686 | ) | |||
| Adjustments to reconcile net income (loss) to net cash provided by (used in) operating activities: | ||||||||
| (Increase) decrease in commodity futures trading account - cash and cash equivalents | 17,372,110 | 27,537,914 | ||||||
| Unrealized (gain) loss on open futures contracts | (20,509,156 | ) | (34,803,676 | ) | ||||
| (Increase) decrease in directors' fees and insurance receivable | (4,479 | ) | (42,177 | ) | ||||
| (Increase) decrease in ETF transaction fees receivable | – | 700 | ||||||
| Increase (decrease) in management fees payable | 40,713 | (172,440 | ) | |||||
| Increase (decrease) in professional fees payable | (367,651 | ) | (167,826 | ) | ||||
| Increase (decrease) in directors' fees and insurance payable | – | (15,638 | ) | |||||
| Net cash provided by (used in) operating activities | 30,071,610 | (30,355,829 | ) | |||||
| Cash Flows from Financing Activities: | ||||||||
| Addition of shares | 126,570,004 | 85,880,155 | ||||||
| Redemption of shares | (19,655,279 | ) | (255,334,061 | ) | ||||
| Net cash provided by (used in) financing activities | 106,914,725 | (169,453,906 | ) | |||||
| Net Increase (Decrease) in Cash and Cash Equivalents | 136,986,335 | (199,809,735 | ) | |||||
| Cash and Cash Equivalents, beginning of period | 474,315,271 | 711,984,950 | ||||||
| Cash and Cash Equivalents, end of period | $ | 611,301,606 | $ | 512,175,215 | ||||
See accompanying notes to condensed financial statements.
| 17 |
United States Commodity Index Funds Trust
Condensed Statements of Cash Flows (Unaudited)
For the six months ended June 30, 2016 and 2015
United States Copper Index Fund
| Six months ended June 30, 2016 | Six months ended June 30, 2015 | |||||||
| Cash Flows from Operating Activities: | ||||||||
| Net income (loss) | $ | 8,685 | $ | (207,659 | ) | |||
| Adjustments to reconcile net income (loss) to net cash provided by (used in) operating activities: | ||||||||
| (Increase) decrease in commodity futures trading account - cash and cash equivalents | 166,355 | 5,965 | ||||||
| Unrealized (gain) loss on open futures contracts | (260,863 | ) | 11,825 | |||||
| (Increase) decrease in receivable from Sponsor | 25,570 | 15,227 | ||||||
| (Increase) decrease in interest receivable | – | 25 | ||||||
| (Increase) decrease in directors' fees and insurance receivable | 2 | (175 | ) | |||||
| Increase (decrease) in management fees payable | 319 | (653 | ) | |||||
| Increase (decrease) in professional fees payable | (12,967 | ) | (24,694 | ) | ||||
| Increase (decrease) in directors' fees and insurance payable | – | (35 | ) | |||||
| Net cash provided by (used in) operating activities | (72,899 | ) | (200,174 | ) | ||||
| Cash Flows from Financing Activities: | ||||||||
| Addition of shares | 760,489 | – | ||||||
| Redemption of shares | – | (893,833 | ) | |||||
| Net cash provided by (used in) financing activities | 760,489 | (893,833 | ) | |||||
| Net Increase (Decrease) in Cash and Cash Equivalents | 687,590 | (1,094,007 | ) | |||||
| Cash and Cash Equivalents, beginning of period | 1,871,256 | 2,729,373 | ||||||
| Cash and Cash Equivalents, end of period | $ | 2,558,846 | $ | 1,635,366 | ||||
See accompanying notes to condensed financial statements.
| 18 |
United States Commodity Index Funds Trust
Condensed Statements of Cash Flows (Unaudited)
For the six months ended June 30, 2016 and 2015
United States Agriculture Index Fund
| Six months ended June 30, 2016 | Six months ended June 30, 2015 | |||||||
| Cash Flows from Operating Activities: | ||||||||
| Net income (loss) | $ | 153,016 | $ | (59,933 | ) | |||
| Adjustments to reconcile net income (loss) to net cash provided by (used in) operating activities: | ||||||||
| (Increase) decrease in commodity futures trading account - cash and cash equivalents | 60,202 | 77,854 | ||||||
| Unrealized (gain) loss on open futures contracts | (83,436 | ) | (222,298 | ) | ||||
| (Increase) decrease in receivable from Sponsor | 24,766 | 13,850 | ||||||
| (Increase) decrease in directors' fees and insurance receivable | (39 | ) | (43 | ) | ||||
| Increase (decrease) in management fees payable | 54 | (174 | ) | |||||
| Increase (decrease) in professional fees payable | (12,298 | ) | (22,578 | ) | ||||
| Increase (decrease) in directors' fees and insurance payable | (64 | ) | (104 | ) | ||||
| Net cash provided by (used in) operating activities | 142,201 | (213,426 | ) | |||||
| Cash Flows from Financing Activities: | ||||||||
| Addition of shares | – | – | ||||||
| Redemption of shares | – | – | ||||||
| Net cash provided by (used in) financing activities | – | – | ||||||
| Net Increase (Decrease) in Cash and Cash Equivalents | 142,201 | (213,426 | ) | |||||
| Cash and Cash Equivalents, beginning of period | 1,820,742 | 2,142,415 | ||||||
| Cash and Cash Equivalents, end of period | $ | 1,962,943 | $ | 1,928,989 | ||||
See accompanying notes to condensed financial statements.
| 19 |
United States Commodity Index Funds Trust
Condensed Statements of Cash Flows (Unaudited)
For the six months ended June 30, 2016 and 2015
United States Commodity Index Funds Trust
| Six months ended June 30, 2016 | Six months ended June 30, 2015 | |||||||
| Cash Flows from Operating Activities: | ||||||||
| Net income (loss) | $ | 33,701,774 | $ | (23,008,097 | ) | |||
| Adjustments to reconcile net income (loss) to net cash provided by (used in) operating activities: | ||||||||
| (Increase) decrease in commodity futures trading account - cash and cash equivalents | 17,598,667 | 27,939,889 | ||||||
| Unrealized (gain) loss on open futures contracts | (20,853,455 | ) | (35,150,713 | ) | ||||
| (Increase) decrease in receivable from Sponsor | 50,336 | 66,862 | ||||||
| (Increase) decrease in interest receivable | – | 36 | ||||||
| (Increase) decrease in directors' fees and insurance receivable | (4,516 | ) | (42,395 | ) | ||||
| (Increase) decrease in ETF transaction fees receivable | – | 700 | ||||||
| Increase (decrease) in management fees payable | 41,086 | (174,395 | ) | |||||
| Increase (decrease) in professional fees payable | (392,916 | ) | (254,094 | ) | ||||
| Increase (decrease) in directors' fees and insurance payable | (64 | ) | (15,856 | ) | ||||
| Net cash provided by (used in) operating activities | 30,140,912 | (30,638,063 | ) | |||||
| Cash Flows from Financing Activities: | ||||||||
| Addition of shares | 127,330,493 | 85,880,155 | ||||||
| Redemption of shares | (19,655,279 | ) | (258,161,695 | ) | ||||
| Net cash provided by (used in) financing activities | 107,675,214 | (172,281,540 | ) | |||||
| Net Increase (Decrease) in Cash and Cash Equivalents | 137,816,126 | (202,919,603 | ) | |||||
| Cash and Cash Equivalents, beginning of period | 478,007,269 | 718,659,173 | ||||||
| Cash and Cash Equivalents, end of period | $ | 615,823,395 | $ | 515,739,570 | ||||
See accompanying notes to condensed financial statements.
| 20 |
United States Commodity Index Funds Trust
Notes to Condensed Financial Statements
For the period ended June 30, 2016 (Unaudited)
NOTE 1 - ORGANIZATION AND BUSINESS
The United States Commodity Index Funds Trust (the “Trust”) was organized as a Delaware statutory trust on December 21, 2009. The Trust is a series trust formed pursuant to the Delaware Statutory Trust Act and includes the United States Commodity Index Fund (“USCI”), a commodity pool formed on April 1, 2010 and first made available to the public on August 10, 2010, the United States Copper Index Fund (“CPER”), a commodity pool formed on November 26, 2010 and first made available to the public on November 15, 2011, and the United States Agriculture Index Fund (“USAG”), a commodity pool formed on November 26, 2010 and first made available to the public on April 13, 2012. USCF as the sponsor of the Trust and its series the United States Metals Index Fund (“USMI”) terminated USMI effective March 18, 2015 and USMI was also delisted from NYSE Arca. On March 24, 2015, USMI liquidated all its assets and distributed cash pro rata to all remaining shareholders as of such date.
USCI, CPER and USAG each issue shares (“shares”) that may be purchased and sold on the NYSE Arca, Inc. (“NYSE Arca”). USCI, CPER, and USAG are collectively referred to herein as the “Trust Series.” The Trust and each Trust Series operate pursuant to the Third Amended and Restated Declaration of Trust and Trust Agreement dated as of March 22, 2013 (the “Trust Agreement”). United States Commodity Funds LLC (“USCF”) is the sponsor of the Trust and the Trust Series and is also responsible for the management of the Trust and the Trust Series. For purposes of the financial statement presentation, unless specified otherwise, all references will be to the Trust Series.
USCF has the power and authority to establish and designate one or more series and to issue shares thereof, from time to time as it deems necessary or desirable. USCF has exclusive power to fix and determine the relative rights and preferences as between the shares of any series as to right of redemption, special and relative rights as to dividends and other distributions and on liquidation, conversion rights, and conditions under which the series shall have separate voting rights or no voting rights. The term for which the Trust is to exist commenced on the date of the filing of the Certificate of Trust, and the Trust and any Trust Series will exist in perpetuity, unless earlier terminated in accordance with the provisions of the Trust Agreement. Separate and distinct records must be maintained for each Trust Series and the assets associated with a Trust Series must be held in such separate and distinct records (directly or indirectly, including a nominee or otherwise) and accounted for in such separate and distinct records separately from the assets of any other Trust Series. Each Trust Series is separate from all other Trust Series created as series of the Trust in respect of the assets and liabilities allocated to that Trust Series and represents a separate investment portfolio of the Trust.
In connection with the Third Amended and Restated Declaration of Trust, dated March 22, 2013, a new series of the Trust was designated on June 1, 2016, the USCF Canadian Crude Oil Index Fund (“UCCO”). UCCO has not commenced operations as of the filing of this quarterly report on Form 10-Q.
The sole Trustee of the Trust is Wilmington Trust Company (the “Trustee”), a Delaware banking corporation. The Trustee is unaffiliated with USCF. The Trustee’s duties and liabilities with respect to the offering of shares and the management of the Trust are limited to its express obligations under the Trust Agreement.
USCF is a member of the National Futures Association (the “NFA”) and became a commodity pool operator (“CPO”) registered with the Commodity Futures Trading Commission (the “CFTC”) effective December 1, 2005. The Trust and each Trust Series have a fiscal year ending on December 31.
USCF is also the general partner of the United States Oil Fund, LP (“USO”), the United States Natural Gas Fund, LP (“UNG”), the United States 12 Month Oil Fund, LP (“USL”), the United States Gasoline Fund, LP (“UGA”) and the United States Diesel-Heating Oil Fund, LP (“UHN”), which listed their limited partnership shares on the American Stock Exchange (the “AMEX”) under the ticker symbols “USO” on April 10, 2006, “UNG” on April 18, 2007, “USL” on December 6, 2007, “UGA” on February 26, 2008 and “UHN” on April 9, 2008, respectively. As a result of the acquisition of the AMEX by NYSE Euronext, each of USO’s, UNG’s, USL’s, UGA’s and UHN’s shares commenced trading on the NYSE Arca on November 25, 2008. USCF is also the general partner of the United States Short Oil Fund, LP (“DNO”), the United States 12 Month Natural Gas Fund, LP (“UNL”) and the United States Brent Oil Fund, LP (“BNO”), which listed their limited partnership shares on the NYSE Arca under the ticker symbols “DNO” on September 24, 2009, “UNL” on November 18, 2009 and “BNO” on June 2, 2010, respectively. All funds listed previously are referred to collectively herein as the “Related Public Funds.”
| 21 |
Effective as of May 1, 2012, each of USCI, CPER and USAG issue shares to certain authorized purchasers (“Authorized Participants”) by offering baskets consisting of 50,000 shares (“Creation Baskets”) through ALPS Distributors, Inc., as the marketing agent (the “Marketing Agent”). Prior to May 1, 2012, each of USCI, CPER and USAG issued shares to Authorized Participants by offering baskets consisting of 100,000 shares through the Marketing Agent. The purchase price for a Creation Basket is based upon the net asset value (“NAV”) of a share calculated shortly after the close of the core trading session on the NYSE Arca on the day the order to create the basket is properly received.
Authorized Participants pay USCI $350 for each order placed to create one or more Creation Baskets or to redeem one or more baskets (“Redemption Baskets”), consisting of 50,000 shares; prior to July 1, 2011, Authorized Participants paid USCI $1,000 for each order placed to create one or more Creation Baskets or to redeem one or more Redemption Baskets. Since May 1, 2012, Authorized Participants paid to CPER and USAG $350 for each order placed to create one or more Creation Baskets or to redeem one or more Redemption Baskets; prior to May 1, 2012, Authorized Participants paid $1,000 for each order placed to create one or more Creation Baskets or to redeem one or more Redemption Baskets. Shares may be purchased or sold on a nationally recognized securities exchange in smaller increments than a Creation Basket or Redemption Basket. Shares purchased or sold on a nationally recognized securities exchange are not purchased or sold at the per share NAV of each Trust Series but rather at market prices quoted on such exchange.
The accompanying unaudited condensed financial statements have been prepared in accordance with Rule 10-01 of Regulation S-X promulgated by the U.S. Securities and Exchange Commission (the “SEC”) and, therefore, do not include all information and footnote disclosure required under generally accepted accounting principles (“GAAP”) in the United States of America. The financial information included herein is unaudited; however, such financial information reflects all adjustments, consisting only of normal recurring adjustments, which are, in the opinion of USCF, necessary for the fair presentation of the condensed financial statements for the interim period.
NOTE 2 - SUMMARY OF SIGNIFICANT ACCOUNTING POLICIES
Basis of Presentation
The financial statements have been prepared in conformity with GAAP as detailed in the Financial Accounting Standards Board’s (“FASB”) Accounting Standards Codification. Each Trust Series is an investment company and follows the accounting and reporting guidance in FASB Topic 946. The Trust financial statements included its respective series of funds financial statements including USCI, CPER, USAG and USMI through March 31, 2015. For reporting commencing with the June 30, 2015 reporting period, and in conjunction with the termination of USMI on March 18, 2015 the USMI financial statements have not been included, but are included in the overall Trust financial statements for the applicable reporting periods.
Revenue Recognition
Commodity futures contracts, forward contracts, physical commodities, and related options are recorded on the trade date. All such transactions are recorded on the identified cost basis and marked to market daily. Unrealized gains or losses on open contracts are reflected in the condensed statements of financial condition and represent the difference between the original contract amount and the market value (as determined by exchange settlement prices for futures contracts and related options and cash dealer prices at a predetermined time for forward contracts, physical commodities, and their related options) as of the last business day of the year or as of the last date of the condensed financial statements. Changes in the unrealized gains or losses between periods are reflected in the condensed statements of operations. Each Trust Series earns income on funds held at the custodian or futures commission merchant (“FCM”) at prevailing market rates earned on such investments.
Brokerage Commissions
Brokerage commissions on all open commodity futures contracts are accrued on a full-turn basis.
Income Taxes
The Trust Series are not subject to federal income taxes; each investor reports his/her allocable share of income, gain, loss deductions or credits on his/her own income tax return.
In accordance with GAAP, each Trust Series is required to determine whether a tax position is more likely than not to be sustained upon examination by the applicable taxing authority, including resolution of any tax related appeals or litigation processes, based on the technical merits of the position. Each Trust Series files an income tax return in the U.S. federal jurisdiction, and may file income tax returns in various U.S. states. None of the Trust Series is subject to income tax return examinations by major taxing authorities for years before 2012. The tax benefit recognized is measured as the largest amount of benefit that has a greater than fifty percent likelihood of being realized upon ultimate settlement. De-recognition of a tax benefit previously recognized results in each Trust Series recording a tax liability that reduces net assets. However, each Trust Series’ conclusions regarding this policy may be subject to review and adjustment at a later date based on factors including, but not limited to, on-going analysis of and changes to tax laws, regulations and interpretations thereof. Each Trust Series recognizes interest accrued related to unrecognized tax benefits and penalties related to unrecognized tax benefits in income tax fees payable, if assessed. No interest expense or penalties have been recognized as of and for the period ended June 30, 2016 for any Trust Series.
| 22 |
Trust Capital and Allocation of Income and Losses
Profit or loss shall be allocated among the shareholders of each Trust Series in proportion to the number of shares each investor holds as of the close of each month. USCF may revise, alter or otherwise modify this method of allocation as described in the Trust Agreement.
Creations and Redemptions
Effective as of May 1, 2012, Authorized Participants may purchase Creation Baskets or redeem Redemption Baskets for USCI, CPER and USAG only in blocks of 50,000 shares at a price equal to the NAV of the shares calculated shortly after the close of the core trading session on the NYSE Arca on the day the order is placed.
Each Trust Series receives or pays the proceeds from shares sold or redeemed within three business days after the trade date of the purchase or redemption. The amounts due from Authorized Participants are reflected in each Trust Series’ condensed statements of financial condition as receivable for shares sold, and amounts payable to Authorized Participants upon redemption are reflected as payable for shares redeemed.
Authorized Participants pay each Trust Series a fee of $350 for each order placed to create one or more Creation Baskets or to redeem one or more Redemption Baskets.
Calculation of Per Share Net Asset Value (“NAV”)
Each Trust Series’ per share NAV is calculated on each NYSE Arca trading day by taking the current market value of its total assets, subtracting any liabilities and dividing the amount by the total number of shares issued and outstanding. Each Trust Series uses the closing prices on the relevant Futures Exchanges (as defined in Note 3 below) of the Applicable Benchmark Component Futures Contracts (as defined in Note 3 below) that at any given time make up the Applicable Index (as defined in Note 3 below) (determined at the earlier of the close of such exchange or 2:30 p.m. New York time) for the contracts traded on the Futures Exchanges, but calculates or determines the value of all other investments of each Trust Series using market quotations, if available, or other information customarily used to determine the fair value of such investments.
Net Income (Loss) Per Share
Net income (loss) per share is the difference between the per share NAV at the beginning of each period and the per share NAV at the end of each period. The weighted average number of shares outstanding was computed for purposes of disclosing net income (loss) per weighted average share. The weighted average shares are equal to the number of shares outstanding at the end of the period, adjusted proportionately for shares added and redeemed based on the amount of time the shares were outstanding during such period. As of June 30, 2016, USCF held 5 shares of USCI, 40 shares of CPER and 5 shares of USAG.
Offering Costs
Offering costs incurred in connection with the registration of shares prior to the commencement of the offering are borne by USCF. Offering costs incurred in connection with the registration of additional shares after the commencement of the offering are borne by each Trust Series. These costs include registration fees paid to regulatory agencies and all legal, accounting, printing and other expenses associated with such offerings. Costs borne by the Trust Series after the commencement of an offering are accounted for as a deferred charge and thereafter amortized to expense over twelve months on a straight-line basis or a shorter period if warranted.
Cash Equivalents
Cash equivalents include money market funds and overnight deposits or time deposits with original maturity dates of six months or less.
Reclassifications
Certain prior year amounts have been reclassified to conform to the current year presentation.
| 23 |
Use of Estimates
The preparation of condensed financial statements in conformity with GAAP requires USCF to make estimates and assumptions that affect the reported amount of assets and liabilities and disclosure of contingent assets and liabilities at the date of the condensed financial statements, and the reported amounts of the revenue and expenses during the reporting period. Actual results may differ from those estimates and assumptions.
NOTE 3 - TRUST SERIES
In connection with the execution of the First Trust Agreement on April 1, 2010, USCI was designated as the first series of the Trust. USCF contributed $1,000 to the Trust upon its formation on December 21, 2009, representing an initial contribution of capital to the Trust. Following the designation of USCI as the first series of the Trust, the initial capital contribution of $1,000 was transferred from the Trust to USCI and deemed an initial contribution to USCI. In connection with the commencement of USCI’s initial offering of shares, USCF received 20 Sponsor Shares of USCI in exchange for the previously received capital contribution, representing a beneficial ownership interest in USCI.
On July 30, 2010, USCI received a notice of effectiveness from the U.S. Securities and Exchange Commission (the “SEC”) for its registration of 50,000,000 shares on Form S-1 with the SEC. On August 10, 2010, USCI listed its shares on the NYSE Arca under the ticker symbol “USCI”. USCI established its’ initial per share NAV by setting the price at $50.00 and issued 100,000 shares in exchange for $5,000,000 on August 10, 2010. USCI also commenced investment operations on August 10, 2010 by purchasing Futures Contracts traded on the Futures Exchanges. In order to satisfy NYSE Arca listing standards that at least 100,000 shares be outstanding at the beginning of the trading day on the NYSE Arca, USCF purchased the initial Creation Basket from the initial Authorized Participant at the initial offering price. The $1,000 fee that would otherwise be charged to the Authorized Participant in connection with an order to create or redeem was waived in connection with the initial Creation Basket. USCF held such initial Creation Basket until September 3, 2010, at which time the initial Authorized Participant repurchased the shares comprising such basket in accordance with the specified conditions noted above. On September 14, 2011, USCF redeemed the 20 Sponsor Shares of USCI and, on September 19, 2011, USCF purchased five shares of USCI in the open market.
In connection with the Second Amended and Restated Trust Agreement dated November 10, 2010, USMI, USAG and CPER were designated as three additional series of the Trust. Following the designation of the additional series, an initial capital contribution of $3,000 was transferred from USCF to the Trust. On November 10, 2010, the Trust transferred $1,000 to each of USMI, USAG and CPER, which was deemed a capital contribution to each series. On November 14, 2011, USCF received 40 Sponsor Shares of CPER in exchange for the previously received capital contribution, representing a beneficial interest in CPER. On December 7, 2011, USCF redeemed the 40 Sponsor Shares of CPER and purchased 40 shares of CPER in the open market. On April 13, 2012, USCF received 40 Sponsor Shares of USAG in exchange for the previously received capital contribution, representing a beneficial interest in USAG. On June 28, 2012, USCF redeemed the 40 Sponsor Shares of USAG and on October 3, 2012, purchased 5 shares of USAG on the open market. On June 10, 2012, USCF received 40 Sponsor Shares of USMI in exchange for the previously received capital contribution, representing a beneficial interest in USMI. On August 27, 2012, USCF redeemed the 40 Sponsor Shares of USMI and on September 4, 2013, purchased 5 shares of USMI on the open market. On March 18, 2015, all Sponsor Shares of USMI were redeemed and USMI discontinued trading.
CPER and USAG received notice of effectiveness from the SEC for its registration of 30,000,000 CPER shares and 20,000,000 USAG shares on September 6, 2011. The order to permit listing CPER and USAG on the NYSE Arca was received on October 20, 2011. On November 15, 2011, CPER listed its shares on the NYSE Arca under the ticker symbol “CPER.” CPER established its’ initial per share NAV by setting the price at $25 and issued 100,000 shares to the initial Authorized Participant, Merrill Lynch Professional Clearing Corp., in exchange for $2,500,000 in cash on November 15, 2011. The $1,000 fee that would otherwise be charged to the Authorized Participant in connection with an order to create or redeem was waived in connection with the initial Creation Basket.
On April 13, 2012, USAG listed its shares on the NYSE Arca under the ticker symbol “USAG.” USAG established its’ initial per share NAV by setting the price at $25. On April 14, 2012, USCF purchased two initial Creation Baskets of USAG. In accordance with applicable requirements of Regulation M under the Securities Exchange Act of 1934, as amended, (“Exchange Act”), no Creation Baskets were offered to Authorized Participants nor were the shares listed on the NYSE Arca until five business days had elapsed from the date of USCF’s purchase of the initial Creation Basket on April 4, 2012. The $1,000 fee that would have otherwise been charged in connection with an order to create or redeem was waived in connection with the initial Creation Basket.
In connection with the Third Amended and Restated Declaration of Trust, dated March 22, 2013, a new series of the Trust was designated on June 1, 2016, the USCF Canadian Crude Oil Index Fund (“UCCO”). UCCO has not commenced operations as of the filing of this quarterly report on Form 10-Q.
| 24 |
USCI’s Investment Objective
USCI invests in futures contracts for commodities that are currently traded on the New York Mercantile Exchange (the “NYMEX”), ICE Futures (“ICE Futures”), Chicago Board of Trade (“CBOT”), Chicago Mercantile Exchange (“CME”), London Metal Exchange (“LME”), Commodity Exchange, Inc. (“COMEX”) or on other foreign exchanges (the NYMEX, ICE Futures, CBOT, CME, LME, COMEX and other foreign exchanges, collectively, the “Futures Exchanges”) (such futures contracts, collectively, “Futures Contracts”) and, to a lesser extent, in order to comply with regulatory requirements or in view of market conditions, other commodity-based contracts and instruments such as cash-settled options on Futures Contracts, forward contracts relating to commodities, cleared swap contracts and other non-exchange traded over-the-counter (“OTC”) transactions that are based on the price of commodities and Futures Contracts (collectively, “Other Commodity-Related Investments”). Market conditions that USCF currently anticipates could cause USCI to invest in Other Commodity Related Investments would be those allowing USCI to obtain greater liquidity or to execute transactions with more favorable pricing. Futures Contracts and Other Commodity-Related Investments collectively are referred to as “Commodity Interests.”
The investment objective of USCI is for the daily changes in percentage terms of its shares’ per share net asset value (“NAV”) to reflect the daily changes in percentage terms of the SummerHaven Dynamic Commodity Index Total ReturnSM (the “SDCI”), less USCI’s expenses. USCF does not intend to operate USCI in a fashion such that its per share NAV will equal, in dollar terms, the spot prices of the commodities underlying the Benchmark Component Futures Contracts (as defined below) that comprise the SDCI or the prices of any particular group of Futures Contracts. USCI will not seek to achieve its stated investment objective over a period of time greater than one day. USCI believes that it is not practical to manage the portfolio to achieve such an investment goal when investing in Futures Contracts and Other Commodity-Related Investments. The SDCI is designed to reflect the performance of a diversified group of commodities. The SDCI is comprised of 14 Futures Contracts that are selected on a monthly basis from a list of 27 possible Futures Contracts. The Futures Contracts that at any given time make up the SDCI are referred to herein as “Benchmark Component Futures Contracts.” The SDCI is owned and maintained by SummerHaven Index Management, LLC (“SHIM”) and calculated and published by Bloomberg, L.P. USCI invests first in the current Applicable Benchmark Component Futures Contracts and other Futures Contracts intended to replicate the return on the current Benchmark Component Futures Contracts and, thereafter may hold Futures Contracts in a particular commodity other than one specified as the Benchmark Component Futures Contract, or may hold Other Commodity-Related Investments that are intended to replicate the return on the Benchmark Component Futures Contracts, but may fail to closely track the SDCI’s total return movements. If USCI increases in size, and due to its obligations to comply with regulatory limits or due to other market pricing or liquidity factors, USCI may invest in Futures Contract months other than the designated month specified as the Benchmark Component Futures Contracts, or in Other Commodity-Related Investments, which may have the effect of increasing transaction related expenses and may result in increased tracking error.
USCI’s shares began trading on August 10, 2010. As of June 30, 2016, USCI held 1,690 Futures Contracts on the NYMEX, 5,101 Futures Contracts on the ICE Futures, 4,440 Futures Contracts on the CBOT, 3,085 Futures Contracts on the CME, 1,702 Futures Contracts on the LME and 1,740 Futures Contracts on the COMEX, totaling 17,758 futures contracts.
CPER’s Investment Objective
The investment objective of CPER is for the daily changes in percentage terms of its shares’ per share NAV to reflect the daily changes in percentage terms of the SummerHaven Copper Index Total ReturnSM (the “SCI”), less CPER’s expenses. USCF does not intend to operate CPER in a fashion such that its per share NAV will equal, in dollar terms, the spot prices of the commodities underlying the Benchmark Component Copper Futures Contracts (as defined below) that comprise the SCI or the prices of any particular group of Futures Contracts. CPER will not seek to achieve a stated investment objective over a period of time greater than one day. USCF believes that it is not practical to manage the portfolio to achieve such an investment goal when investing in Futures Contracts and Other Copper-Related Investments (as defined below). The SCI is designed to reflect the performance of the investment returns from a portfolio of copper futures contracts. The SCI is owned and maintained by SHIM and calculated and published by the NYSE Arca. The SCI is comprised of either two or three Eligible Copper Futures Contracts that are selected on a monthly basis based on quantitative formulas relating to the prices of the Eligible Copper Futures Contracts developed by SHIM. The Eligible Copper Futures Contracts that at any given time make up the SCI are referred to herein as “Benchmark Component Copper Futures Contracts.”
CPER seeks to achieve its investment objective by investing to the fullest extent possible in the Benchmark Component Copper Futures Contracts. Then, if constrained by regulatory requirements or in view of market conditions, CPER will invest next in other Eligible Copper Futures Contracts, and finally to a lesser extent, in other exchange traded futures contracts that are economically identical or substantially similar to the Benchmark Component Copper Futures Contracts if one or more other Eligible Copper Futures Contracts is not available. When CPER has invested to the fullest extent possible in exchange-traded futures contracts, CPER may then invest in other contracts and instruments based on the Benchmark Component Copper Futures Contracts, other Eligible Copper Futures Contracts or copper, such as cash-settled options, forward contracts, cleared swap contracts and swap contracts other than cleared swap contracts. Other exchange-traded futures contracts that are economically identical or substantially similar to the Benchmark Component Copper Futures Contracts and other contracts and instruments based on the Benchmark Component Copper Futures Contracts, are referred to collectively as “Other Copper-Related Investments,” and together with Benchmark Component Copper Futures Contracts and other Eligible Copper Futures Contracts, “Copper Interests.” CPER’s shares began trading on November 15, 2011. As of June 30, 2016, CPER held 53 Futures Contracts on the COMEX.
| 25 |
USAG’s Investment Objective
The investment objective of USAG is for the daily changes in percentage terms of its shares’ per share NAV to reflect the daily changes in percentage terms of the SummerHaven Dynamic Agriculture Index Total ReturnSM (the “SDAI”), less USAG’s expenses. USCF does not intend to operate USAG in a fashion such that its per share NAV will equal, in dollar terms, the spot prices of the commodities underlying the Benchmark Component Agriculture Futures Contracts (as defined below) that comprise the SDAI or the prices of any particular group of Futures Contracts. USAG will not seek to achieve its stated investment objective over a period of time greater than one day. USCF believes that it is not practical to manage the portfolio to achieve such an investment goal when investing in Futures Contracts and Other Agriculture-Related Investments (as defined below). The SDAI is designed to reflect the performance of a diversified group of agricultural commodities. The SDAI is owned and maintained by SHIM and calculated and published by the NYSE Arca. Futures contracts for the agricultural commodities comprising the SDAI are traded on ICE Future US, ICE Futures Canada, the CBOT, the Kansas City Board of Trade (“KCBT”) and the CME and are collectively referred to herein as “Eligible Agriculture Futures Contracts.” The SDAI is comprised of 14 Eligible Agriculture Futures Contracts that are selected on a monthly basis based on quantitative formulas developed by SHIM. The Eligible Agriculture Futures Contracts that at any given time make up the SDAI are referred to herein as “Benchmark Component Agriculture Futures Contracts.” The relative weighting of the Benchmark Component Agriculture Futures Contracts will change on a monthly basis, based on quantitative formulas relating to the prices of the Benchmark Component Agriculture Futures Contracts developed by SHIM.
USAG seeks to achieve its investment objective by investing to the fullest extent possible in the Benchmark Component Agriculture Futures Contracts. Then, if constrained by regulatory requirements or in view of market conditions, USAG will invest next in other Eligible Agriculture Futures Contracts based on the same agricultural commodity as the futures contracts subject to such regulatory constraints or market conditions, and finally, to a lesser extent, in other exchange traded futures contracts that are economically identical or substantially similar to the Benchmark Component Agriculture Futures Contracts if one or more other Eligible Agriculture Futures Contracts is not available. When USAG has invested to the fullest extent possible in exchange-traded futures contracts, USAG may then invest in other contracts and instruments based on the Benchmark Component Agriculture Futures Contracts, other Eligible Agriculture Futures Contracts or the agricultural commodities included in the SDAI, such as cash-settled options, forward contracts, cleared swap contracts and swap contracts other than cleared swap contracts. Other exchange-traded futures contracts that are economically identical or substantially similar to the Benchmark Component Agriculture Futures Contracts and other contracts and instruments based on the Benchmark Component Agriculture Futures Contracts, as well as metals included in the SDAI, are collectively referred to as “Other Agriculture-Related Investments,” and together with Benchmark Component Agriculture Futures Contracts and other Eligible Agriculture Futures Contracts, “Agriculture Interests.” USAG’s shares began trading on April 13, 2012. As of June 30, 2016, USAG held 27 Futures Contracts on the ICE Futures, 28 Futures Contracts on the CBOT, 12 Futures Contracts on the CME, and 2 Futures Contracts on the KCBT, totaling 69 futures contracts.
Other Defined Terms – Trust Series
The SDCI, the SCI and the SDAI are referred to throughout these Notes to Financial Statements collectively as the “Applicable Index” or “Indices.”
Benchmark Component Futures Contracts, Benchmark Component Copper Futures Contracts and Benchmark Component Agriculture Futures Contracts are referred to throughout these Notes to Condensed Financial Statements collectively as “Applicable Benchmark Component Futures Contracts.”
Other Commodity-Related Investments, Other Copper-Related Investments and Other Agriculture-Related Interests are referred to throughout these Notes to Condensed Financial Statements collectively as “Other Related Investments.”
Trading Advisor and Trustee
The Trust Series’ trading advisor is SummerHaven Investment Management, LLC (“SummerHaven”), a Delaware limited liability company that is registered as a commodity trading advisor and CPO with the CFTC and is a member of the NFA. SummerHaven provides advisory services to USCF with respect to the Applicable Index of each Trust Series and the investment decisions of each Trust Series.
The Trustee accepts service of legal process on the Trust in the State of Delaware and makes certain filings under the Delaware Statutory Trust Act. The Trustee does not owe any other duties to the Trust, USCF or the shareholders.
| 26 |
NOTE 4 - FEES PAID BY EACH TRUST SERIES AND RELATED PARTY TRANSACTIONS
USCF Management Fee
Under the Trust Agreement, USCF is responsible for investing the assets of each Trust Series in accordance with the objectives and policies of each such Trust Series. In addition, USCF has arranged for one or more third parties to provide trading advisory, administrative, custody, accounting, transfer agency and other necessary services to each Trust Series. For these services, each of USCI, CPER and USAG is contractually obligated to pay USCF a fee, which is paid monthly, equal to 0.95% per annum of average daily total net assets. Effective January 1, 2016, USCF permanently lowered the management fee for USCI to 0.80% (80 basis points) per annum of average daily total net assets for USCI and 0.65% (65 basis points) per annum of average daily total net assets for both CPER and USAG, respectively.
Trustee Fee
The Trustee is the Delaware trustee of the Trust. In connection with the Trustee’s services, USCF is responsible for paying the Trustee’s annual fee in the amount of $3,000.
Ongoing Registration Fees and Other Offering Expenses
Each Trust Series pays the costs and expenses associated with the ongoing registration of its shares subsequent to the initial offering. These costs include registration or other fees paid to regulatory agencies in connection with the offer and sale of shares, and all legal, accounting, printing and other expenses associated with such offer and sale. During the six months ended June 30, 2016 and 2015, no Trust Series incurred any registration fees or other offering expenses.
Independent Directors’ and Officers’ Expenses
Each Trust Series is responsible for paying its portion of the directors’ fees and directors’ and officers’ liability insurance for such Trust Series and the Related Public Funds. Each Trust Series shares the fees and expenses on a pro rata basis with each other Trust Series and each Related Public Fund, as described above, based on the relative assets of each fund computed on a daily basis. These fees and expenses for the year ended December 31, 2016, are estimated to be a total of $554,800 for the Trust Series and the Related Public Funds. USCI’s portion of such fees and expenses for year ended December 31, 2016 are estimated to be a total of $65,400, CPER’s portion of such fees and expenses for year ended December 31, 2016 are estimated to be a total of $300 and USAG’s portion of such fees and expenses for year ended December 31, 2016 are estimated to be a total of $200.
Investor Tax Reporting Cost
The fees and expenses associated with each Trust Series’ audit expenses and tax accounting and reporting requirements are paid by such Trust Series. These costs are estimated to be $650,000 for the year ended December 31, 2016 for USCI, $46,000 for the year ended December 31, 2016 for CPER, and $42,000 for the year ended December 31, 2016 for USAG.
Other Expenses and Fees and Expense Waivers
In addition to the fees described above, each Trust Series pays all brokerage fees and other expenses in connection with the operation of such Trust Series, excluding costs and expenses paid by USCF as outlined in Note 5– Contracts and Agreements below. In addition, USCF pays certain expenses normally borne by each of CPER and USAG to the extent that such expenses exceed 0.15% (15 basis points) of each of CPER’s and USAG’s NAV, on an annualized basis. USCF has no obligation to continue such payments into subsequent periods. For the six months ended June 30, 2016, USCF waived $34,033 in expenses for CPER and $31,558 for USAG. This voluntary expense waiver is in addition to those amounts USCF is contractually obligated to pay as described in Note 5 – Contracts and Agreements below.
NOTE 5 – CONTRACTS AND AGREEMENTS
Marketing Agent Agreement
USCF and the Trust, each on its own behalf and on behalf of each Trust Series, are party to a marketing agent agreement, dated as of July 22, 2010, as amended from time to time, with the Marketing Agent, whereby the Marketing Agent provides certain marketing services for each Trust Series as outlined in the agreement. The fee of the Marketing Agent, which is borne by USCF, is equal to 0.06% on each Trust Series’ assets up to $3 billion and 0.04% on each Trust Series’ assets in excess of $3 billion. In no event may the aggregate compensation paid to the Marketing Agent and any affiliate of USCF for distribution related services exceed 10% of the gross proceeds of each Trust Series’ offering.
The above fee does not include website construction and development, which are also borne by USCF.
| 27 |
Brown Brothers Harriman & Co. Agreements
USCF and the Trust, on its own behalf and on behalf of each Trust Series, are also party to a custodian agreement, dated July 22, 2010, as amended from time to time, with Brown Brothers Harriman & Co. (“BBH&Co.”), whereby BBH&Co. holds investments on behalf of each Trust Series. USCF pays the fees of the custodian, which are determined by the parties from time to time. In addition, USCF and the Trust, on its own behalf and on behalf of each Trust Series, are party to an administrative agency agreement, dated July 22, 2010, as amended from time to time, with BBH&Co., whereby BBH&Co. acts as the administrative agent, transfer agent and registrar for each Trust Series. USCF also pays the fees of BBH&Co. for its services under such agreement and such fees are determined by the parties from time to time.
Currently, USCF pays BBH&Co. for its services, in the foregoing capacities, a minimum amount of $75,000 annually for its custody, fund accounting and fund administration services rendered to each Trust Series and each of the Related Public Funds, as well as a $20,000 annual fee for its transfer agency services. In addition, USCF pays BBH&Co. an asset-based charge of: (a) 0.06% for the first $500 million of the Related Public Funds’ combined net assets, (b) 0.0465% for the Related Public Funds’ combined net assets greater than $500 million but less than $1 billion, and (c) 0.035% once the Related Public Funds’ combined net assets exceed $1 billion. The annual minimum amount will not apply if the asset-based charge for all accounts in the aggregate exceeds $75,000. USCF also pays BBH&Co. transaction fees ranging from $7 to $15 per transaction.
Brokerage and Futures Commission Merchant Agreements
On July 7, 2014, the Trust on behalf of each Trust Series entered into a Futures and Cleared Swaps Agreement with Wells Fargo Securities, LLC (“WFS”). WFS is referred to as the “Futures Commissions Merchant” or “FCM”. The agreements require the FCM to provide services to each Trust Series in connection with the purchase and sale of Futures Contracts and Other Related Investments that may be purchased and sold by or through the FCM for each Trust Series’ account. In accordance with the agreement, the FCM charges each Trust Series commissions of approximately $7 to $8 per round-turn trade, including applicable exchange and NFA fees for Futures Contracts and options on Futures Contracts. Such fees include those incurred when purchasing Futures Contracts and options on Futures Contracts when each Trust Series issues shares as a result of a Creation Basket, as well as fees incurred when selling Futures Contacts and options on Futures Contracts when each Trust Series redeems shares as a result of a Redemption Basket. Such fees are also incurred when Futures Contracts and options on Futures Contracts are purchased or redeemed for the purpose of rebalancing the portfolio. Each Trust Series also incurs commissions to brokers for the purchase and sale of Futures Contracts, Other Commodity-Related Investments or short-term obligations of the United States of two years or less (“Treasuries”).
USCI
| For the six months ended June 30, 2016 | For the six months ended June 30, 2015 | |||||||
| Total commissions accrued to brokers | $ | 359,905 | $ | 350,400 | ||||
| Total commissions as an annualized percentage of average total net assets | 0.14 | % | 0.12 | % | ||||
| Commissions accrued as a result of rebalancing | $ | 346,525 | $ | 325,949 | ||||
| Percentage of commissions accrued as a result of rebalancing | 96.28 | % | 93.02 | % | ||||
| Commissions accrued as a result of creation and redemption activity | $ | 13,380 | $ | 24,451 | ||||
| Percentage of commissions accrued as a result of creation and redemption activity | 3.72 | % | 6.98 | % | ||||
The increase in USCI’s total commissions accrued to brokers for the six months ended June 30, 2016, compared to the six months ended June 30, 2015, was primarily due to an increase in the number of contracts traded during the rebalancing periods.
CPER
| For the six months ended June 30, 2016 | For the six months ended June 30, 2015 | |||||||
| Total commissions accrued to brokers | $ | 896 | $ | 556 | ||||
| Total commissions as an annualized percentage of average total net assets | 0.07 | % | 0.06 | % | ||||
| Commissions accrued as a result of rebalancing | $ | 800 | $ | 486 | ||||
| Percentage of commissions accrued as a result of rebalancing | 89.29 | % | 87.37 | % | ||||
| Commissions accrued as a result of creation and redemption activity | $ | 96 | $ | 70 | ||||
| Percentage of commissions accrued as a result of creation and redemption activity | 10.71 | % | 12.63 | % | ||||
| 28 |
CPER’s total commissions accrued to brokers for the six months ended June 30, 2016, compared to the six months ended June 30, 2015, increased due to the number contracts traded during the rebalancing periods.
USAG
| For the six months ended June 30, 2016 | For the six months ended June 30, 2015 | |||||||
| Total commissions accrued to brokers | $ | 1,016 | $ | 1,064 | ||||
| Total commissions as an annualized percentage of average total net assets | 0.10 | % | 0.10 | % | ||||
| Commissions accrued as a result of rebalancing | $ | 1,016 | $ | 1,064 | ||||
| Percentage of commissions accrued as a result of rebalancing | 100 | % | 100 | % | ||||
| Commissions accrued as a result of creation and redemption activity | $ | — | $ | — | ||||
| Percentage of commissions accrued as a result of creation and redemption activity | — | % | — | % | ||||
USAG’s total commissions accrued to brokers for the six months ended June 30, 2016, compared to the six months ended June 30, 2015, decreased slightly due to the contracts traded during the rebalancing periods.
SummerHaven Agreements
USCF is party to an Amended Advisory Agreement, dated July 1, 2011, as amended from time to time, with SummerHaven, whereby SummerHaven provides advisory services to USCF with respect to the Applicable Index for each Trust Series and investment decisions for each Trust Series. SummerHaven’s advisory services include, but are not limited to, general consultation regarding the calculation and maintenance of the Applicable Index for each Trust Series, anticipated changes to each Applicable Index and the nature of each Applicable Index’s current or anticipated component securities. For these services, USCF pays SummerHaven a fee based on a percentage of the average total net assets of each Trust Series. For USCI, the fee is equal to the percentage fees paid to USCF minus 0.14%, with that result multiplied by 0.5, minus 0.06% to arrive at the actual fee paid. For each of CPER and USAG, the fee is equal to the percentage fees paid to USCF minus 0.18%, with that result multiplied by 0.5, minus 0.06% to arrive at the actual fee paid.
USCF is also party to an Amended Licensing Agreement, dated July 1, 2011, as amended from time to time, with SummerHaven, whereby SummerHaven sub-licensed to each Trust Series the use of certain names and marks, including the Applicable Index for each Trust Series for which SummerHaven has a sub-license from SHIM, the owner of each Applicable Index. Under the Licensing Agreement, USCF paid SummerHaven an annual fee of $15,000 per each Trust Series for the year ended December 31, 2015, plus an annual fee of 0.06% of the average daily total net assets of each Trust Series.
NOTE 6 – FINANCIAL INSTRUMENTS, OFF-BALANCE SHEET RISKS AND CONTINGENCIES
Each Trust Series engages in the trading of futures contracts, options on futures contracts and cleared swaps (collectively, “derivatives”). As such, each Trust Series is exposed to both market risk, which is the risk arising from changes in the market value of the contracts, and credit risk, which is the risk of failure by another party to perform according to the terms of a contract.
Each Trust Series may enter into futures contracts and options on futures contracts to gain exposure to changes in the value of an underlying commodity. A futures contract obligates the seller to deliver (and the purchaser to accept) the future delivery of a specified quantity and type of a commodity at a specified time and place. Some futures contracts may call for physical delivery of the asset, while others are settled in cash. The contractual obligations of a buyer or seller may generally be satisfied by taking or making physical delivery of the underlying commodity or by making an offsetting sale or purchase of an identical futures contract on the same or linked exchange before the designated date of delivery. Cleared swaps are OTC agreements that are eligible to be cleared by a clearinghouse, e.g. ICE Clear Europe, but which are not traded on an exchange. A cleared swap is created when the parties to an off-exchange OTC swap transaction agree to extinguish their OTC swap and replace it with a cleared swap. Cleared swaps are intended to provide the efficiencies and benefits that centralized clearing on an exchange offers to traders of futures contracts, including credit risk intermediation and the ability to offset positions initiated with different counterparties.
The purchase and sale of futures contracts and options on futures contracts require margin deposits with an FCM. Additional deposits may be necessary for any loss on contract value. The Commodity Exchange Act requires an FCM to segregate all customer transactions and assets from the FCM’s proprietary activities.
| 29 |
Futures contracts, options on futures contracts and cleared swaps involve, to varying degrees, elements of market risk (specifically commodity price risk) and exposure to loss in excess of the amount of variation margin. The face or contract amounts reflect the extent of the total exposure each Trust Series has in the particular classes of instruments. Additional risks associated with the use of futures contracts are an imperfect correlation between movements in the price of the futures contracts and the market value of the underlying securities and the possibility of an illiquid market for a futures contract. Buying and selling options on futures contracts exposes investors to the risks of purchasing or selling futures contracts.
All of the Futures Contracts held by each Trust Series were exchange-traded through June 30, 2016. The risks associated with exchange-traded contracts are generally perceived to be less than those associated with OTC swaps since, in OTC swaps, a party must rely solely on the credit of its respective individual counterparties. However, in the future if each Trust Series were to enter into non-exchange traded contracts (including Exchange for Related Position or EFRP), it would be subject to the credit risk associated with counterparty non-performance. The credit risk from counterparty non-performance associated with such instruments is the net unrealized gain, if any, on the transaction. Currently, each Trust Series has credit risk under its futures contracts since the sole counterparty to all domestic and foreign futures contracts is the clearinghouse for the exchange on which the relevant contracts are traded. In addition, each Trust Series bears the risk of financial failure by the clearing broker.
A Trust Series’ cash and other property, such as Treasuries, deposited with an FCM are considered commingled with all other customer funds, subject to the FCM’s segregation requirements. In the event of an FCM’s insolvency, recovery may be limited to a pro rata share of segregated funds available. It is possible that the recovered amount could be less than the total of cash and other property deposited. The insolvency of an FCM could result in the complete loss of a Trust Series’ assets posted with that FCM; however, the majority of each Trust Series’ assets are held in Treasuries, cash and/or cash equivalents with the Trust Series’ custodian and would not be impacted by the insolvency of an FCM. The failure or insolvency of the Trust Series’ custodian, however, could result in a substantial loss of each Trust Series’ assets.
USCF may invest a portion of each Trust Series’ cash in money market funds that seek to maintain a stable per share NAV. Each Trust Series may be exposed to any risk of loss associated with an investment in such money market funds. As of June 30, 2016 and December 31, 2015, none of the Trust Series held investments in money market funds. Each Trust Series holds cash deposits with its custodian. Pursuant to a written agreement with BBH&Co., uninvested overnight cash balances are swept to offshore branches of U.S. regulated and domiciled banks located in Toronto, Canada; London, United Kingdom; Grand Cayman, Cayman Islands; and Nassau, Bahamas; which are subject to U.S. regulation and regulatory oversight. As of June 30, 2016 and December 31, 2015, USCI held cash deposits and investments in Treasuries in the amounts of $649,921,219 and $530,306,994, respectively, with the custodian and FCM. As of June 30, 2016 and December 31, 2015, CPER held cash deposits and investments in Treasuries in the amounts of $2,825,931 and $2,304,696, respectively, with the custodian and FCM. As of June 30, 2016 and December 31, 2015, USAG held cash deposits and investments in Treasuries in the amounts of $2,042,208 and $1,960,209, respectively, with the custodian and FCM. Some or all of these amounts may be subject to loss should the Trust Series’ custodian and/or FCM cease operations.
For derivatives, risks arise from changes in the market value of the contracts. Theoretically, each Trust Series is exposed to market risk equal to the value of Futures Contracts purchased and unlimited liability on such contracts sold short. As both a buyer and a seller of options, each Trust Series pays or receives a premium at the outset and then bears the risk of unfavorable changes in the price of the contract underlying the option.
The Trust Series’ policy is to continuously monitor its exposure to market and counterparty risk through the use of a variety of financial, position and credit exposure reporting controls and procedures. In addition, the Trust Series or USCF have a policy of requiring review of the credit standing of each broker or counterparty with which they conduct business.
The financial instruments held by the applicable Trust Series are reported in its condensed statements of financial condition at market or fair value, or at carrying amounts that approximate fair value, because of their highly liquid nature and short-term maturity.
| 30 |
NOTE 7 – FINANCIAL HIGHLIGHTS
The following tables present per share performance data and other supplemental financial data for each Trust Series for the six months ended June 30, 2016 and 2015 for the shareholders. This information has been derived from information presented in the condensed financial statements.
USCI
| For the six months ended June 30, 2016 (Unaudited) | For the six months ended June 30, 2015 (Unaudited) | |||||||
| Per Share Operating Performance: | ||||||||
| Net asset value, beginning of period | $ | 40.52 | $ | 48.24 | ||||
| Total income (loss) | 2.77 | (0.86 | ) | |||||
| Net expenses | (0.22 | ) | (0.26 | ) | ||||
| Net increase (decrease) in net asset value | 2.55 | (1.12 | ) | |||||
| Net asset value, end of period | $ | 43.07 | $ | 47.12 | ||||
| Total Return | 6.29 | % | (2.32 | )% | ||||
| Ratios to Average Net Assets | ||||||||
| Total income (loss) | 6.84 | % | (3.22 | )% | ||||
| Management fees* | 0.80 | %** | 0.80 | %*** | ||||
| Total expenses excluding management fees* | 0.26 | % | 0.32 | % | ||||
| Expenses waived* | — | %** | — | %*** | ||||
| Net expenses excluding management fees* | 0.26 | % | 0.32 | % | ||||
| Net income (loss) | 6.31 | % | (3.78 | )% | ||||
| * | Annualized. |
| ** | Effective January 1, 2016 USCF’s management fee charged to USCI is 0.80% per annum of average daily total net assets. |
| *** | Effective May 1, 2014 and continuing through December 31, 2015, USCF contractually agreed to lower the management fee to 0.80% per annum of average daily total net assets for USCI. |
CPER
| For the six months ended June 30, 2016 (Unaudited) | For the six months ended June 30, 2015 (Unaudited) | |||||||
| Per Share Operating Performance: | ||||||||
| Net asset value, beginning of period | $ | 14.24 | $ | 19.10 | ||||
| Total income (loss) | 0.34 | (1.39 | ) | |||||
| Net expenses | (0.06 | ) | (0.07 | ) | ||||
| Net increase (decrease) in net asset value | 0.28 | (1.46 | ) | |||||
| Net asset value, end of period | $ | 14.52 | $ | 17.64 | ||||
| Total Return | 1.97 | % | (7.64 | )% | ||||
| Ratios to Average Net Assets | ||||||||
| Total income (loss) | 0.75 | % | (10.53 | )% | ||||
| Management fees* | 0.65 | %** | 0.65 | %*** | ||||
| Total expenses excluding management fees* | 2.89 | % | 3.08 | % | ||||
| Expenses waived* | (2.74 | )%† | (2.93 | )%***† | ||||
| Net expenses excluding management fees* | 0.15 | % | 0.15 | % | ||||
| Net income (loss) | 0.35 | % | (10.93 | )% | ||||
| * | Annualized. |
| ** | Effective January 1, 2016 USCF’s management fee charged to CPER is 0.65% per annum of average daily total net assets. |
| *** | Effective May 1, 2014 and continuing through December 31, 2015, USCF contractually agreed to lower the management fee to 0.65% per annum of average daily total net assets for CPER. |
| † | USCF paid certain expenses on a discretionary basis typically borne by CPER where expenses exceeded 0.15% (15 basis points) of CPER’s NAV, on an annualized basis, through June 30, 2016. USCF has no obligation to continue such payments into subsequent periods. |
| 31 |
USAG
| For the six months ended June 30, 2016 (Unaudited) | For the six months ended June 30, 2015 (Unaudited) | |||||||
| Per Share Operating Performance: | ||||||||
| Net asset value, beginning of period | $ | 19.80 | $ | 22.97 | ||||
| Total income (loss) | 1.61 | (0.51 | ) | |||||
| Net expenses | (0.08 | ) | (0.09 | ) | ||||
| Net increase (decrease) in net asset value | 1.53 | (0.60 | ) | |||||
| Net asset value, end of period | $ | 21.33 | $ | 22.37 | ||||
| Total Return | 7.73 | % | (2.61 | )% | ||||
| Ratios to Average Net Assets | ||||||||
| Total income (loss) | 8.05 | % | (2.41 | )% | ||||
| Management fees* | 0.65 | %** | 0.65 | %*** | ||||
| Total expenses excluding management fees* | 3.33 | % | 2.54 | % | ||||
| Expenses waived* | (3.18 | )%† | (2.39 | )%***† | ||||
| Net expenses excluding management fees* | 0.15 | % | 0.15 | % | ||||
| Net income (loss) | 7.65 | % | (2.80 | )% | ||||
| * | Annualized. |
| ** | Effective January 1, 2016, USCF’s management fee charged to USAG is 0.65% per annum of average daily total net assets. |
| *** | Effective May 1, 2014 and continuing through December 31, 2015, USCF contractually agreed to lower the management fee to 0.65% per annum of average daily total net assets for USAG. |
| † | USCF paid certain expenses on a discretionary basis typically borne by USAG where expenses exceeded 0.15% (15 basis points) of USAG’s NAV, on an annualized basis, through June 30, 2016. USCF has no obligation to continue such payments into subsequent periods. |
Total returns are calculated based on the change in value during the period. An individual shareholder’s total return and ratio may vary from the above total returns and ratios based on the timing of contributions to and withdrawals from each Trust Series.
NOTE 8 — FAIR VALUE OF FINANCIAL INSTRUMENTS
The Trust and each Trust Series value their investments in accordance with Accounting Standards Codification 820 – Fair Value Measurements and Disclosures (“ASC 820”). ASC 820 defines fair value, establishes a framework for measuring fair value in generally accepted accounting principles, and expands disclosures about fair value measurement. The changes to past practice resulting from the application of ASC 820 relate to the definition of fair value, the methods used to measure fair value, and the expanded disclosures about fair value measurement. ASC 820 establishes a fair value hierarchy that distinguishes between: (1) market participant assumptions developed based on market data obtained from sources independent of the Trust and each Trust Series (observable inputs) and (2) the Trust’s and each Trust Series’ own assumptions about market participant assumptions developed based on the best information available under the circumstances (unobservable inputs). The three levels defined by the ASC 820 hierarchy are as follows:
Level I – Quoted prices (unadjusted) in active markets for identical assets or liabilities that the reporting entity has the ability to access at the measurement date.
Level II – Inputs other than quoted prices included within Level I that are observable for the asset or liability, either directly or indirectly. Level II assets include the following: quoted prices for similar assets or liabilities in active markets, quoted prices for identical or similar assets or liabilities in markets that are not active, inputs other than quoted prices that are observable for the asset or liability, and inputs that are derived principally from or corroborated by observable market data by correlation or other means (market-corroborated inputs).
Level III – Unobservable pricing input at the measurement date for the asset or liability. Unobservable inputs shall be used to measure fair value to the extent that observable inputs are not available.
In some instances, the inputs used to measure fair value might fall within different levels of the fair value hierarchy. The level in the fair value hierarchy within which the fair value measurement in its entirety falls shall be determined based on the lowest input level that is significant to the fair value measurement in its entirety.
| 32 |
The following table summarizes the valuation of USCI’s securities at June 30, 2016 using the fair value hierarchy:
| At June 30, 2016 | Total | Level I | Level II | Level III | ||||||||||||
| Short-Term Investments | $ | 489,396,332 | $ | 489,396,332 | $ | — | $ | — | ||||||||
| Exchange-Traded Futures Contracts | ||||||||||||||||
| Foreign Contracts | 6,668,654 | 6,668,654 | — | — | ||||||||||||
| United States Contracts | 5,258,275 | 5,258,275 | — | — | ||||||||||||
During the six months ended June 30, 2016, there were no transfers between Level I and Level II.
The following table summarizes the valuation of USCI’s securities at December 31, 2015 using the fair value hierarchy:
| At December 31, 2015 | Total | Level I | Level II | Level III | ||||||||||||
| Short-Term Investments | $ | 299,704,608 | $ | 299,704,608 | $ | — | $ | — | ||||||||
| Exchange-Traded Futures Contracts | ||||||||||||||||
| Foreign Contracts | (4,020,212 | ) | (4,020,212 | ) | — | — | ||||||||||
| United States Contracts | (4,562,015 | ) | (4,562,015 | ) | — | — | ||||||||||
During the year ended December 31, 2015, there were no transfers between Level I and Level II.
The following table summarizes the valuation of CPER’s securities at June 30, 2016 using the fair value hierarchy:
| At June 30, 2016 | Total | Level I | Level II | Level III | ||||||||||||
| Short-Term Investments | $ | 2,247,406 | $ | 2,247,406 | $ | — | $ | — | ||||||||
| Exchange-Traded Futures Contracts | ||||||||||||||||
| United States Contracts | 80,238 | 80,238 | — | — | ||||||||||||
During the six months ended June 30, 2016, there were no transfers between Level I and Level II.
The following table summarizes the valuation of CPER’s securities at December 31, 2015 using the fair value hierarchy:
| At December 31, 2015 | Total | Level I | Level II | Level III | ||||||||||||
| Short-Term Investments | $ | 998,899 | $ | 998,899 | $ | — | $ | — | ||||||||
| Exchange-Traded Futures Contracts | ||||||||||||||||
| United States Contracts | (180,625 | ) | (180,625 | ) | — | — | ||||||||||
During the year ended December 31, 2015, there were no transfers between Level I and Level II.
The following table summarizes the valuation of USAG’s securities at June 30, 2016 using the fair value hierarchy:
| At June 30, 2016 | Total | Level I | Level II | Level III | ||||||||||||
| Short-Term Investments | $ | 1,498,336 | $ | 1,498,336 | $ | — | $ | — | ||||||||
| Exchange-Traded Futures Contracts | ||||||||||||||||
| Foreign Contracts | 59,984 | 59,984 | — | — | ||||||||||||
| United States Contracts | 29,609 | 29,609 | — | — | ||||||||||||
During the six months ended June 30, 2016, there were no transfers between Level I and Level II.
The following table summarizes the valuation of USAG’s securities at December 31, 2015 using the fair value hierarchy:
| At December 31, 2015 | Total | Level I | Level II | Level III | ||||||||||||
| Short-Term Investments | $ | 749,059 | $ | 749,059 | $ | — | $ | — | ||||||||
| Exchange-Traded Futures Contracts | ||||||||||||||||
| Foreign Contracts | 48,270 | 48,270 | — | — | ||||||||||||
| United States Contracts | (42,113 | ) | (42,113 | ) | — | — | ||||||||||
During the year ended December 31, 2015, there were no transfers between Level I and Level II.
| 33 |
The Trust and each Trust Series have adopted the provisions of Accounting Standards Codification 815 – Derivatives and Hedging, which require presentation of qualitative disclosures about objectives and strategies for using derivatives, quantitative disclosures about fair value amounts and gains and losses on derivatives.
Fair Value of Derivative Instruments Held by USCI
| Derivatives not Accounted for as Hedging Instruments | Condensed Statements of Financial Condition Location | Fair Value At June 30, 2016 | Fair Value At December 31, 2015 | |||||||
| Futures - Commodity Contracts | Assets | $ | 11,926,929 | $ | (8,582,227 | ) | ||||
Fair Value of Derivative Instruments Held by CPER
| Derivatives not Accounted for as Hedging Instruments | Condensed Statements of Financial Condition Location | Fair Value At June 30, 2016 | Fair Value At December 31, 2015 | |||||||
| Futures - Commodity Contracts | Assets | $ | 80,238 | $ | (180,625 | ) | ||||
Fair Value of Derivative Instruments Held by USAG
| Derivatives not Accounted for as Hedging Instruments | Condensed Statements of Financial Condition Location | Fair Value At June 30, 2016 | Fair Value At December 31, 2015 | |||||||
| Futures - Commodity Contracts | Assets | $ | 89,593 | $ | 6,157 | |||||
The Effect of Derivative Instruments on the Condensed Statements of Operations of USCI
| For the six months ended June 30, 2016 | For the six months ended June 30, 2015 | |||||||||||||||||
| Derivatives not Accounted for as Hedging Instruments | Location of Gain (Loss) on Derivatives Recognized in Income | Realized Gain (Loss) on Derivatives Recognized in Income | Change in Unrealized Gain (Loss) on Derivatives Recognized in Income | Realized Gain (Loss) on Derivatives Recognized in Income | Change in Unrealized Gain (Loss) on Derivatives Recognized in Income | |||||||||||||
| Futures – Commodity Contracts | Realized gain (loss) on closed contracts | $ | 15,028,812 | $ | (54,343,959 | ) | ||||||||||||
| Change in unrealized gain (loss) on open contracts | $ | 20,509,156 | $ | 34,803,676 | ||||||||||||||
The Effect of Derivative Instruments on the Condensed Statements of Operations of CPER
| For the six months ended June 30, 2016 | For the six months ended June 30, 2015 | |||||||||||||||||
| Derivatives not Accounted for as Hedging Instruments | Location of Gain (Loss) on Derivatives Recognized in Income | Realized Gain (Loss) on Derivatives Recognized in Income | Change in Unrealized Gain (Loss) on Derivatives Recognized in Income | Realized Gain (Loss) on Derivatives Recognized in Income | Change in Unrealized Gain (Loss) on Derivatives Recognized in Income | |||||||||||||
| Futures – Commodity Contracts | Realized gain (loss) on closed contracts | $ | (246,050 | ) | $ | (189,213 | ) | |||||||||||
| Change in unrealized gain (loss) on open contracts | $ | 260,863 | $ | 11,825 | ||||||||||||||
| 34 |
The Effect of Derivative Instruments on the Condensed Statements of Operations of USAG
| For the six months ended June 30, 2016 | For the six months ended June 30, 2015 | |||||||||||||||||
| Derivatives not Accounted for as Hedging Instruments | Location of Gain (Loss) on Derivatives Recognized in Income | Realized Gain (Loss) on Derivatives Recognized in Income | Change in Unrealized Gain (Loss) on Derivatives Recognized in Income | Realized Gain (Loss) on Derivatives Recognized in Income | Change in Unrealized Gain (Loss) on Derivatives Recognized in Income | |||||||||||||
| Futures – Commodity Contracts | Realized gain (loss) on closed contracts | $ | 73,847 | $ | (274,438 | ) | ||||||||||||
| Change in unrealized gain (loss) on open contracts | $ | 83,436 | $ | 222,298 | ||||||||||||||
NOTE 9 – SUBSEQUENT EVENTS
The Trust and each Trust Series have performed an evaluation of subsequent events through the date the condensed financial statements were issued. This evaluation did not result in any subsequent events that necessitated disclosures and/or adjustments.
Item 2. Management’s Discussion and Analysis of Financial Condition and Results of Operations.
The following discussion should be read in conjunction with the condensed financial statements and the notes thereto of the United States Commodity Index Funds Trust (the “Trust”) included elsewhere in this quarterly report on Form 10-Q.
Forward-Looking Information
This quarterly report on Form 10-Q, including this “Management’s Discussion and Analysis of Financial Condition and Results of Operations,” contains forward-looking statements regarding the plans and objectives of management for future operations. This information may involve known and unknown risks, uncertainties and other factors that may cause the Trust’s actual results, performance or achievements to be materially different from future results, performance or achievements expressed or implied by any forward-looking statements. Forward-looking statements, which involve assumptions and describe the Trust’s future plans, strategies and expectations, are generally identifiable by use of the words “may,” “will,” “should,” “expect,” “anticipate,” “estimate,” “believe,” “intend” or “project,” the negative of these words, other variations on these words or comparable terminology. These forward-looking statements are based on assumptions that may be incorrect, and the Trust cannot assure investors that the projections included in these forward-looking statements will come to pass. The Trust’s actual results could differ materially from those expressed or implied by the forward-looking statements as a result of various factors.
The Trust has based the forward-looking statements included in this quarterly report on Form 10-Q on information available to it on the date of this quarterly report on Form 10-Q, and the Trust assumes no obligation to update any such forward-looking statements. Although the Trust undertakes no obligation to revise or update any forward-looking statements, whether as a result of new information, future events or otherwise, investors are advised to consult any additional disclosures that the Trust may make directly to them or through reports that the Trust in the future files with the U.S. Securities and Exchange Commission (the “SEC”), including annual reports on Form 10-K, quarterly reports on Form 10-Q and current reports on Form 8-K.
Introduction
The United States Commodity Index Fund (“USCI”), the United States Copper Index Fund (“CPER”) and the United States Agriculture Index Fund (“USAG”) are each a commodity pool that issues shares representing fractional undivided beneficial interests in USCI, CPER and USAG, respectively (“shares”) that may be purchased and sold on the NYSE Arca, Inc. (the “NYSE Arca”). USCI, CPER and USAG are collectively referred to herein as the “Trust Series.” The Trust Series are series of the Trust, a Delaware statutory trust formed on December 21, 2009. The Trust and each Trust Series operate pursuant to the Trust’s Third Amended and Restated Declaration of Trust and Trust Agreement (the “Trust Agreement”), dated March 22, 2013. Wilmington Trust Company (the “Trustee”), a Delaware banking corporation, is the Delaware trustee of the Trust. The Trust and each Trust Series are managed and controlled by United States Commodity Funds LLC (“USCF”).
| 35 |
United States Commodity Index Fund
USCI invests in futures contracts for commodities that are traded on the New York Mercantile Exchange (the “NYMEX”), ICE Futures (“ICE Futures”), Chicago Board of Trade (“CBOT”), Chicago Mercantile Exchange (“CME”), London Metal Exchange (“LME”), Commodity Exchange, Inc. (“COMEX”) or on other domestic or foreign exchanges (such exchanges, collectively, the “Futures Exchanges”) (such futures contracts, collectively, “Futures Contracts”) and, to a lesser extent, in order to comply with regulatory requirements or in view of market conditions, other commodity-based contracts and instruments such as cash-settled options on Futures Contracts, forward contracts relating to commodities, cleared swap contracts and other over-the-counter (“OTC”) swaps that are based on the price of commodities and Futures Contracts (collectively, “Other Commodity-Related Investments”). Market conditions that USCF currently anticipates could cause USCI to invest in Other Commodity Related Investments would be those allowing USCI to obtain greater liquidity or to execute transactions with more favorable pricing.
The investment objective of USCI is for the daily changes in percentage terms of its shares’ per share net asset value (“NAV”) to reflect the daily changes in percentage terms of the SummerHaven Dynamic Commodity Index Total ReturnSM (the “SDCI”), less USCI’s expenses. USCF does not intend to operate USCI in a fashion such that its per share NAV will equal, in dollar terms, the spot prices of the commodities underlying the Benchmark Component Futures Contracts (as defined below) that comprise the SDCI or the prices of any particular group of Futures Contracts. The SDCI is owned and maintained by SummerHaven Index Management, LLC (“SHIM”) and calculated and published by the NYSE Arca. The SDCI is comprised of 14 Futures Contracts that are selected on a monthly basis from a list of 27 possible Futures Contracts. The Futures Contracts that at any given time make up the SDCI are referred to herein as “Benchmark Component Futures Contracts.” USCI invests first in the current Benchmark Component Futures Contracts and other Futures Contracts intended to replicate the return on the current Benchmark Component Futures Contracts and, thereafter may hold Futures Contracts in a particular commodity other than one specified as the Benchmark Component Futures Contract, or may hold Other Commodity-Related Investments that may fail to closely track the SDCI’s total return movements. If USCI increases in size, and due to its obligations to comply with regulatory limits or due to other market pricing or liquidity factors, USCI may invest in Futures Contract months other than the designated month specified as the Benchmark Component Futures Contract, or in Other Commodity-Related Investments, which may have the effect of increasing transaction related expenses and may result in increased tracking error.
USCI seeks to achieve its investment objective by investing in Futures Contracts and Other Commodity-Related Investments such that daily changes in its’ per share NAV closely track the daily changes in the price of the SDCI. USCI’s positions in Commodity Interests are rebalanced on a monthly basis in order to track the changing nature of the SDCI. If Futures Contracts relating to a particular commodity remain in the SDCI from one month to the next, such Futures Contracts are rebalanced to the 7.14% target weight. Specifically, on a specified day near the end of each month (the “Selection Date”), it will be determined if a current Benchmark Component Futures Contract will be replaced by a new Futures Contract in either the same or different underlying commodity as a Benchmark Component Futures Contract for the following month, in which case USCI’s investments would have to be changed accordingly. In order that USCI’s trading does not unduly cause extraordinary market movements, and to make it more difficult for third parties to profit by trading based on market movements that could be expected from changes in the Benchmark Component Futures Contracts, USCI’s investments typically are not rebalanced entirely on a single day, but rather typically rebalanced over a period of four days. After fulfilling the margin and collateral requirements with respect to its Commodity Interests, USCF invests the remainder of USCI’s proceeds from the sale of shares in short-term obligations of the United States government (“Treasuries”) or cash equivalents, and/or merely hold such assets in cash (generally in interest-bearing accounts). As of June 30, 2016, USCI held 1,690 Futures Contracts on the NYMEX, 5,101 Futures Contracts on the ICE Futures, 4,440 Futures Contracts on the CBOT, 3,085 Futures Contracts on the CME, 1,702 Futures Contracts on the LME and 1,740 Futures Contracts on the COMEX.
United States Copper Index Fund
CPER invests in Futures Contracts for commodities that are traded on the COMEX and, to a lesser extent, in order to comply with regulatory requirements or in view of market conditions, Other Copper-Related Investments. Market conditions that USCF currently anticipates could cause CPER to invest in Other Copper-Related Investments would be those allowing CPER to obtain greater liquidity or to execute transactions with more favorable pricing.
The investment objective of CPER is for the daily changes in percentage terms of its shares’ per share NAV to reflect the daily changes in percentage terms of the SummerHaven Copper Index Total ReturnSM (the “SCI”), less CPER’s expenses. USCF does not intend to operate CPER in a fashion such that its per share NAV will equal, in dollar terms, the spot prices of the commodities underlying the Benchmark Component Copper Futures Contracts (as defined below) that comprise the SCI or the prices of any particular group of Futures Contracts. The SCI is designed to reflect the performance of the investment returns form a portfolio of copper futures contracts. The SCI is owned and maintained by SHIM and calculated and published by the NYSE Arca. The SCI is comprised of either two or three Eligible Copper Futures Contracts that are selected on a monthly basis based on quantitative formulas relating to the prices of the Eligible Copper Futures Contracts developed by SHIM. The Eligible Copper Futures Contracts that at any given time make up the SCI are referred to herein as “Benchmark Component Copper Futures Contracts.”
| 36 |
CPER seeks to achieve its investment objective by investing to the fullest extent possible in the Benchmark Component Copper Futures Contracts. Then, if constrained by regulatory requirements or in view of market conditions, CPER will invest next in other Eligible Copper Futures Contracts, and finally to a lesser extent, in other exchange traded futures contracts that are economically identical or substantially similar to the Benchmark Component Copper Futures Contracts if one or more other Eligible Copper Futures Contracts is not available. When CPER has invested to the fullest extent possible in exchange-traded futures contracts, CPER may then invest in other contracts and instruments based on the Benchmark Component Copper Futures Contracts, other Eligible Copper Futures Contracts or copper, such as cash-settled options, forward contracts, cleared swap contracts and swap contracts other than cleared swap contracts. Other exchange-traded futures contracts that are economically identical or substantially similar to the Benchmark Component Copper Futures Contracts and other contracts and instruments based on the Benchmark Component Copper Futures Contracts, are collectively referred to as “Other Copper-Related Investments,” and together with Benchmark Component Copper Futures Contracts and other Eligible Copper Futures Contracts, “Copper Interests.” As of June 30, 2016, CPER held 53 Futures Contracts on the COMEX.
United States Agriculture Index Fund
USAG invests in Futures Contracts for commodities that are traded on the ICE Futures US, the ICE Futures Canada, the CBOT, the CME and the Kansas City Board of Trade (“KCBT”) and to a lesser extent, in order to comply with regulatory requirements or in view of market conditions, Other Agriculture-Related Investments (as defined below). Market conditions that USCF currently anticipates could cause USAG to invest in Other Agriculture-Related Investments would be those allowing USAG to obtain greater liquidity or to execute transactions with more favorable pricing.
The investment objective of USAG is for the daily changes in percentage terms of its shares’ per share NAV to reflect the daily changes in percentage terms of the SummerHaven Dynamic Agriculture Index Total ReturnSM (the “SDAI”), less USAG’s expenses. USCF does not intend to operate USAG in a fashion such that its per share NAV will equal, in dollar terms, the spot prices of the commodities underlying the Benchmark Component Agriculture Futures Contracts (as defined below) that comprise the SDAI or the prices of any particular group of Agriculture Futures Contracts. The SDAI is designed to reflect the performance of a diversified group of agricultural commodities. The SDAI is owned and maintained by SHIM and calculated and published by the NYSE Arca comprised of 14 Eligible Agriculture Futures Contracts that are selected on a monthly basis based on quantitative formulas developed by SHIM. The Eligible Agriculture Futures Contracts that at any given time make up the SDAI are referred to herein as “Benchmark Component Agriculture Futures Contracts.”
USAG seeks to achieve its investment objective by investing to the fullest extent possible in Benchmark Component Agriculture Futures Contracts. Then, if constrained by regulatory requirements or in view of market conditions, USAG will invest next in other Eligible Agriculture Futures Contracts based on the same agricultural commodity as the futures contracts subject to such regulatory constraints or market conditions, and finally, to a lesser extent, in other exchange traded futures contracts that are economically identical or substantially similar to the Benchmark Component Agriculture Futures Contracts, if one or more Eligible Agriculture Futures Contracts is not available. When USAG has invested to the fullest extent possible in exchange-traded futures contracts, USAG may then invest in other contracts and instruments based on the Benchmark Component Agriculture Futures Contracts, other Eligible Agriculture Futures Contracts or the agricultural commodities included in the SDAI, such as cash-settled options, forward contracts, cleared swap contracts and swap contracts other than cleared swap contracts. Other exchange-traded futures contracts that are economically identical or substantially similar to the Benchmark Component Agriculture Futures Contracts and other contracts and instruments based on the Benchmark Component Agriculture Futures Contracts, are collectively referred to as “Other Agriculture-Related Investments,” and together with Benchmark Component Agriculture Futures Contracts and other Eligible Agriculture Futures Contracts, “Agriculture Interests.” As of June 30, 2016, USAG held 27 Futures Contracts on the ICE Futures, 28 Futures Contracts on the CBOT, 12 Futures Contract on the CME and 2 Futures Contracts on the KCBT.
Other Defined Terms
The SCI, together with the SDCI and the SDAI are referred to throughout this quarterly report on Form 10-Q collectively as the “Applicable Index” or “Indices.”
Benchmark Component Futures Contracts, Benchmark Component Copper Futures Contracts and Benchmark Component Agriculture Futures Contracts are referred to throughout this quarterly report on Form 10-Q collectively as “Applicable Benchmark Component Futures Contracts.”
Other Commodity-Related Investments, Other Copper-Related Investments and Other Agriculture-Related Investments are collectively referred to herein as “Other Related Investments.” Commodity Interests, Copper Interests and Agriculture Interests are collectively referred to herein as “Applicable Interests” throughout this quarterly report on Form 10-Q.
| 37 |
Regulatory Disclosure
Accountability Levels, Position Limits and Price Fluctuation Limits. Designated contract markets, such as the NYMEX and ICE Futures, have established accountability levels and position limits on the maximum net long or net short futures contracts in commodity interests that any person or group of persons under common trading control (other than as a hedge, which is not applicable to the Trust Series’ investments) may hold, own or control. These levels and position limits apply to the futures contracts that the Trust invests in to meet its investment objective. In addition to accountability levels and position limits, the NYMEX and ICE Futures also set daily price fluctuation limits on futures contracts. The daily price fluctuation limit established the maximum amount that the price of a futures contract may vary either up or down from the previous day’s settlement price. Once that daily price fluctuation limit has been reached in a particular futures contract, no trades may be made at a price beyond that limit.
The accountability levels for the commodities comprising an Applicable Index and other futures contracts traded on U.S.-based futures exchanges are not a fixed ceiling, but rather a threshold above which such exchanges may exercise greater scrutiny and control over an investor’s positions. As of June 30, 2016, USCI held 1,690 Futures Contracts on the NYMEX, 5,101 Futures Contracts on the ICE Futures, 4,440 Futures Contracts on the CBOT, 3,085 Futures Contracts on the CME, 1,702 Futures Contracts on the LME and 1,740 Futures Contracts on the COMEX, totaling 17,758 futures contracts. As of June 30, 2016, CPER held 53 Futures Contracts on the COMEX. As of June 30, 2016, USAG held 27 Futures Contracts on the ICE Futures, 28 Futures Contracts on the CBOT, 12 Futures Contracts on the CME and 2 Futures Contracts on the KCBT, totaling 69 futures contracts. For the six months ended June 30, 2016, no Trust Series exceeded accountability levels imposed by the NYMEX, COMEX, CME, CBOT, KCBT, LME or ICE Futures.
Position limits differ from accountability levels in that they represent fixed limits on the maximum number of futures contracts that any person may hold and cannot allow such limits to be exceeded without express CFTC authority to do so. In addition to accountability levels and position limits that may apply at any time, the Futures Exchanges may impose position limits on contracts held in the last few days of trading in the near month contract to expire. It is unlikely that a Trust Series will run up against such position limits. A Trust Series does not typically hold the near month contract in its Applicable Benchmark Component Futures Contracts. In addition, each Trust Series’ investment strategy is to close out its positions during each Rebalancing Period in advance of the period right before expiration and purchase new contracts. As such, none of the Trust Series anticipates that position limits that apply to the last few days prior to a contract’s expiration will impact it. For the six months ended June 30, 2016, no Trust Series exceeded position limits imposed by the NYMEX, COMEX, CME, CBOT, KCBT, LME or ICE Futures.
Regulation of Commodity Interests
The regulation of commodity interest trading in the United States and other countries is an evolving area of the law. The various statements made in this summary are subject to modification by legislative action and changes in the rules and regulations of Financial Industry Regulatory Authority (“FINRA”), the CFTC, the National Futures Association (the “NFA”), the SEC, the futures exchanges, clearing organizations and other regulatory bodies.
Futures Contracts and Position Limits
The CFTC is generally prohibited by statute from regulating trading on non-U.S. futures exchanges and markets. The CFTC, however, has adopted regulations relating to the marketing of non-U.S. futures contracts in the United States. These regulations permit certain contracts on non-U.S. exchanges to be offered and sold in the United States.
The CFTC has proposed to adopt limits on speculative positions in 28 physical commodity futures and option contracts and swaps that are economically equivalent to such contracts in the agriculture, energy and metals markets and rules addressing the circumstances under which market participants would be required to aggregate their positions with other persons under common ownership or control (the “Position Limit Rules”). The Position Limit Rules would, among other things: identify which contracts are subject to speculative position limits; set thresholds that restrict the number of speculative positions that a person may hold in a spot month, individual month, and all months combined; create an exemption for positions that constitute bona fide hedging transactions; impose responsibilities on designated contract markets (“DCMs”) and swap execution facilities (“SEFs”) to establish position limits or, in some cases, position accountability rules; and apply to both futures and swaps across four relevant venues: OTC, DCMs, SEFs as well as non-U.S. located platforms. The CFTC’s first attempt at finalizing the Position Limit Rules, in 2011, was successfully challenged by market participants in 2012 and, since then, the CFTC has re-proposed them and solicited comments from market participants multiple times.
Until such time as the Position Limit Rules are adopted, the regulatory architecture in effect prior to the adoption of the Position Limit Rules will govern transactions in commodities and related derivatives (collectively, “Referenced Contracts”). Under that system, the CFTC enforces federal limits on speculation in agricultural products (e.g., corn, wheat and soy), while futures exchanges enforce position limits and accountability levels for agricultural and certain energy products (e.g., oil and natural gas). As a result, a Trust Series may be limited with respect to the size of its investments in any commodities subject to these limits. Finally, subject to certain narrow exceptions, the Position Limit Rules require the aggregation, for purposes of the position limits, of all positions in the 28 Referenced Contracts held by a single entity and its affiliates, regardless of whether such position existed on U.S. futures exchanges, non-U.S. futures exchanges, in cleared swaps or in OTC swaps. Under the CFTC’s existing position limits requirements and the Position Limit Rules, a market participant is generally required to aggregate all positions for which that participant controls the trading decisions with all positions for which that participant has a 10 percent or greater ownership interest in an account or position, as well as the positions of two or more persons acting pursuant to an express or implied agreement or understanding. At this time, it is unclear how the Position Limit Rules may affect a Trust Series, but the effect may be substantial and adverse. By way of example, the Position Limit Rules may negatively impact the ability of a Trust Series to meet its investment objectives through limits that may inhibit USCF’s ability to sell additional Creation Baskets of a Trust Series.
| 38 |
“Swap” Transactions
The Dodd-Frank Wall Street Reform and Consumer Protection Act (the “Dodd-Frank Act”) imposes regulatory requirements on certain “swap” transactions that a Trust Series is authorized to engage in that may ultimately impact the ability of a Trust Series to meet its investment objective. The term “swap” is broadly defined to include various types of OTC derivatives, including swaps and options.
CFTC regulations require that certain transactions ultimately falling within the definition of “swap” be executed on organized exchanges or “swap execution facilities” and cleared through regulated clearing organizations (“CCPs”). “Clearing” refers to the process by which a trade that is bilaterally executed by two parties is submitted to a CCP, via a clearing member (i.e., an FCM), and replaced by two mirror swaps, with the CCP becoming the counterparty to both of the initial parties to the swap. CCPs have several layers of protection against default including margin, member capital contributions and FCM guarantees of their customers’ transactions with the CCP. FCMs also pre-qualify the counterparties to all swaps that are sent to the CCP from a credit perspective, setting limits for each counterparty and collecting initial and variation margin daily from each counterparty for changes in the value of cleared swaps. The margin collected from both parties to the swap protects against credit risk in the event a counterparty defaults. The initial and variation margin requirements are set by and held for the benefit of the CCP. Additional initial margin may be required and held by the FCM, due to its guarantees of its customers’ trades with the CCP.
Current rules and regulations require enhanced customer protections, risk management programs, internal monitoring and controls, capital and liquidity standards, customer disclosures and auditing and examination programs for FCMs. The rules are intended to afford greater assurances to market participants that customer segregated funds and secured amounts are protected, customers are provided with appropriate notice of the risks of futures trading and of the FCMs with which they may choose to do business, FCMs are monitoring and managing risks in a robust manner, the capital and liquidity of FCMs are strengthened to safeguard the continued operations and the auditing and examination programs of the CFTC and the self-regulatory organizations are monitoring the activities of FCMs in a thorough manner.
Certain index-based credit default swaps and interest rate swaps are subject to mandatory clearing. If a Trust Series enters into index-based credit default swaps or interest rate swaps that are subject to mandatory clearing, the Trust Series will be required to centrally clear those swaps.
To the extent that a swap is required to be cleared, it must also be executed on a SEF or DCM if it is designated as “made available to trade” by a SEF or DCM. “Made available to trade” refers to the regulatory process by which the SEF or DCM execution requirement is implemented by the CFTC. To date, only certain of the index-based credit default swaps and interest rate swaps that are required to be cleared are made available to trade on a SEF. If a Trust Series enters into index-based credit default swaps or interest rate swaps that are subject to mandatory clearing, such Trust Series will be required to execute those swaps on a SEF if they are designated as made available to trade. In order to execute swaps on a SEF, a Trust Series will have to be a member of a SEF or it may access the SEF through an intermediary. Members of a SEF are subject to additional requirements under CFTC regulations and are subject to the rules and jurisdiction of the relevant SEF.
Swaps that are not required to be cleared and executed on a SEF but that are executed bilaterally are also subject to various requirements pursuant to CFTC regulations, including, among others, reporting and recordkeeping requirements and, depending on the status of the counterparties, trading documentation requirements and dispute resolution requirements. In addition, U.S. regulators are in the process of adopting rules to impose initial and variation margin requirements that will apply to swap dealers and major swap participants and their counterparties. If a Trust Series engages in non-cleared swap transactions it may be subject to some or all of these requirements.
In addition to the rules and regulations imposed under the Dodd-Frank Act, swap dealers that are European banks may also be subject to European Market Infrastructure Regulation (“EMIR”). EMIR imposes requirements on non-cleared derivatives that are similar to those imposed by the CFTC and other regulators in the United States and which are described above. A Trust Series may be indirectly impacted by EMIR to the extent that it engages in derivatives transactions with entities that are subject to EMIR.
| 39 |
On August 12, 2013, the CFTC issued final rules establishing compliance obligations for commodity pool operators (“CPOs”) of investment companies registered under the Investment Company Act of 1940 (the “Investment Company Act”) that are required to register due to recent changes to CFTC Regulation 4.5. The final rules were issued in a CFTC release entitled “Harmonization of Compliance Obligations for Registered Investment Companies Required to Register as Commodity Pool Operators.” Although a Trust Series is not a registered investment company under the Investment Company Act, the Harmonization Rules amended certain CFTC disclosure rules to make the requirements for all CPOs to periodically update their disclosure documents consistent with those of the SEC. This change will decrease the burden to a Trust Series and USCF of having to comply with inconsistent regulatory requirements. It is not known whether the CFTC will make additional amendments to its disclosure, reporting and recordkeeping rules to further harmonize these obligations with those of the SEC as they apply to a Trust Series and USCF, but any such further rule changes could result in additional operating efficiencies for a Trust Series and USCF.
Money Market Reform
On July 23, 2014, the SEC adopted rules to reform money market funds such that institutional prime money market funds will float their net asset value as well as impose rules such that all money market funds’ boards of directors will be required to implement rules to discourage and prevent runs by investors through the use of redemption fees and gates. Money market funds have two years from the date of adoption to implement the reform. Each Trust Series currently invests in money market funds, as well as Treasuries with a maturity date of two years or less, as an investment for assets not used for margin or collateral in the Futures Contracts. It is unclear at this time what the impact of money market reform would have on a Trust Series’ ability to hedge risk, however, the imposition of a floating net asset value could cause a Trust Series to limit remaining assets solely in Treasuries and cash.
As the regulatory requirements are constantly evolving, it is difficult to predict the effect any regulatory changes may have on a Trust Series.
Commodity Markets
Commodity Futures Price Movements
Six months ended June 30, 2016
As measured by the four major diversified commodity indexes listed below, commodity futures prices exhibited an upward trend during the six months ended June 30, 2016. The table below compares the total returns of the SDCI to the three major diversified commodity indexes over this time period.
| SummerHaven Dynamic Commodity Index Total ReturnSM(1) | 6.66 | % | ||
| S&P GSCI Commodity Index Total Return(2) | 9.86 | % | ||
| Bloomberg Commodity Index Total ReturnSM(2) | 13.25 | % | ||
| Deutsche Bank Liquid Commodity Index-Optimum Yield Total ReturnTM(2) | 7.30 | % |
| (1) | The inception date for the SummerHaven Dynamic Commodity Index Total ReturnSM is December 2009. |
| (2) | Source: Bloomberg |
The value of the SDCI as of December 31, 2015 was $1,265.58. As of June 30, 2016, the value of the SDCI was $1,349.90, up approximately 6.66% over the six months ended June 30, 2016.
The return of approximately 6.66% on the SDCI listed above is a hypothetical return only and could not actually be achieved by an investor holding Futures Contracts due to the impact of trading costs and other expenses. USCI’s per share NAV began the year at $40.52 and ended the period at $43.07 on June 30, 2016, an increase of approximately 6.29% over the period. USCI’s per share NAV reached its high for the period on June 8, 2016 at $43.74 and reached its low for the period on January 20, 2016 at $38.47. See “Tracking Each Trust Series’ Benchmark” below for information about how expenses and income affect USCI’s NAV.
Copper Markets
Copper Futures Price Movements
Six months ended June 30, 2016
As measured by the two major copper indexes, copper futures prices exhibited daily swings with an upward trend during the six months ended June 30, 2016. The table below compares the total returns of the SCI to the Bloomberg Copper Sub index Total Return over this time period.
| SummerHaven Copper Index Total ReturnTM(1) | 2.23 | % | ||
| Bloomberg Copper Sub Index Total Return(2) | 2.21 | % |
| (1) | The inception date for the SummerHaven Copper Index Total ReturnTM is November 2010. |
| (2) | Source: Bloomberg |
| 40 |
The value of the SCI as of December 31, 2015 was $704.39. As of June 30, 2016, the value of the SCI was $720.09, up approximately 2.23% over the six months ended June 30, 2016.
The return of approximately 2.23% on the SCI listed above is a hypothetical return only and could not actually be achieved by an investor holding Futures Contracts due to the impact of trading costs and other expenses. CPER’s per share NAV began the year at $14.24 and ended the period at $14.52 on June 30, 2016, an increase of approximately 1.97% over the period. CPER’s per share NAV reached its high for the period on March 21, 2016 at $15.23 and reached its low for the period on January 15, 2016 at $12.96. See “Tracking the Each Trust Series’ Benchmark” for information about how expenses and income affect CPER’s NAV.
Agriculture Markets
Agriculture Futures Price Movements
Six months ended June 30, 2016
As measured by the three major agriculture indexes listed below, agriculture futures prices exhibited moderate daily swings along with an upward trend during the six months ended June 30, 2016. The table below compares the total returns of the SDAI to the two major agriculture indexes over this time period.
| SummerHaven Dynamic Agriculture Index Total ReturnSM(1) | 7.46 | % | ||
| Bloomberg Agriculture Sub Index Total ReturnSM(2) | 13.47 | % | ||
| Deutsche Bank Liquid Commodity Index-Optimum Yield Agriculture ReturnTM(2) | 7.02 | % |
| (1) | The inception date for the SummerHaven Dynamic Agriculture Index Total ReturnSM is September 2010. |
| (2) | Source: Bloomberg |
The value of the SDAI as of December 31, 2015 was $285.01. As of June 30, 2016, the value of the SDAI was $306.27, up approximately 7.46% over the six months ended June 30, 2016.
The return of approximately 7.46% on the SDAI listed above is a hypothetical return only and could not actually be achieved by an investor holding Futures Contracts due to the impact of trading costs and other expenses. USAG’s per share NAV began the year at $19.80 and ended the period at $21.33 on June 30, 2016, an increase of approximately 7.73% over the period. USAG’s per share NAV reached its high for the period on June 8, 2016 at $22.26 and reached its low for the period on February 11, 2016 at $18.88. See “Tracking Each Trust Series’ Benchmark” below for information about how expenses and income affect USAG’s per share NAV.
Valuation of Futures Contracts and the Computation of the Per Share NAV
Each Trust Series’ NAV is calculated once each NYSE Arca trading day. The per share NAV for a particular trading day is released after 4:00 p.m. New York time. Trading during the core trading session on the NYSE Arca typically closes at 4:00 p.m. New York time. The Trust Series’ Administrator uses the closing prices on the relevant Futures Exchanges of the Applicable Benchmark Component Futures Contracts (determined at the earlier of the close of such exchange or 2:30 p.m. New York time) for the contracts held on the Futures Exchanges, but calculates or determines the value of all other investments of such Trust Series using market quotations, if available, or other information customarily used to determine the fair value of such investments.
Results of Operations
On July 30, 2010, USCI received a notice of effectiveness from the SEC for its registration of 50,000,000 shares on Form S-1 with the SEC. On August 10, 2010, USCI listed its shares on the NYSE Arca under the ticker symbol “USCI.” USCI established its initial offering per share NAV by setting the price at $50 and issued 100,000 shares to the initial Authorized Participant, Merrill Lynch Professional Clearing Corp., in exchange for $5,000,000 in cash on August 10, 2010. USCI commenced investment operations on August 10, 2010 by purchasing Futures Contracts traded on the Futures Exchanges. In order to satisfy NYSE Arca listing standards that at least 100,000 shares be outstanding at the beginning of the trading day on the NYSE Arca, USCF purchased the initial Creation Basket from the initial Authorized Participant at the initial offering price. The $1,000 fee that would otherwise be charged to the Authorized Participant in connection with an order to create or redeem was waived in connection with the initial Creation Basket. USCF agreed not to resell the shares comprising such basket except that it may require the initial Authorized Participant to repurchase all of these shares at a per share price equal to USCI’s per share NAV within five days following written notice from USCF, subject to the conditions that: (i) on the date of repurchase, the initial Authorized Participant must immediately redeem these shares in accordance with the terms of the Authorized Participant Agreement and (ii) immediately following such redemption at least 100,000 shares of USCI remain outstanding. USCF held such initial Creation Basket until September 3, 2010, at which time the initial Authorized Participant repurchased the shares comprising such basket in accordance with the specified conditions noted above. On September 14, 2011, USCF redeemed the 20 Sponsor Shares of USCI, and on September 19, 2011, USCF purchased five shares of USCI in the open market. USCF redeemed all Sponsor Shares of USMI on March 18, 2015. On March 18, 2015, at the close of markets, USMI ceased all trading and all of USMI’s assets were liquidated on March 24, 2015.
| 41 |
Since its initial offering of 50,000,000 shares, USCI has not registered any subsequent offerings of its shares. As of June 30, 2016, USCI had issued 27,650,000 shares, 15,350,000 of which were outstanding. As of June 30, 2016, there were 22,350,000 remaining shares registered but not yet issued. More shares may have been issued by USCI than are outstanding due to the redemption of shares.
In connection with the Second Amended and Restated Trust Agreement dated November 10, 2010, USMI, USAG and CPER were designated as three additional series of the Trust. Following the designation of the additional series, an initial capital contribution of $3,000 was transferred from USCF to the Trust. On November 10, 2010, the Trust transferred $1,000 to each of USMI, USAG and CPER, which was deemed a capital contribution to each series. On November 14, 2011, USCF received 40 Sponsor Shares of CPER in exchange for the previously received capital contribution, representing a beneficial interest in CPER. On December 7, 2011, USCF redeemed the 40 Sponsor Shares of CPER and purchased 40 shares of CPER in the open market. On April 13, 2012, USCF received 40 Sponsor Shares of USAG in exchange for the previously received capital contribution, representing a beneficial interest in USAG. On June 28, 2012, USCF redeemed the 40 Sponsor shares of USAG and on October 3, 2012, purchased 5 shares of USAG on the open market. On June 19, 2012, USCF received 40 Sponsor Shares of USMI in exchange for the previously received capital contribution, representing a beneficial interest in USMI. On August 27, 2012, USCF redeemed the 40 Sponsor shares of USMI and on September 4, 2013, USCF purchased 5 shares of USMI on the open market. USCF redeemed all Sponsor Shares of USMI on March 18, 2015. On March 18, 2015, at the close of markets, USMI ceased all trading and all of USMI’s assets were liquidated on March 24, 2015.
CPER and USAG received notice of effectiveness from the SEC for its registration of 30,000,000 CPER shares and 20,000,000 USAG shares on September 6, 2011. The order to permit listing CPER and USAG on the NYSE Arca was received on October 20, 2011. On November 15, 2011, CPER listed its shares on the NYSE Arca under the ticker symbol “CPER.” CPER established its initial offering per share NAV by setting the price at $25 and issued 100,000 shares to the initial Authorized Participant, Merrill Lynch Professional Clearing Corp., in exchange for $2,500,000 in cash on November 15, 2011. The $1,000 fee that would otherwise be charged to the Authorized Participant in connection with an order to create or redeem was waived in connection with the initial Creation Basket.
Since its initial offering of 30,000,000 shares, CPER has not registered any subsequent offerings of its shares. As of June 30, 2016, CPER had issued 400,000 shares, 200,000 of which were outstanding. As of June 30, 2016, there were 29,600,000 remaining shares registered but not yet issued. More shares may have been issued by CPER than are outstanding due to the redemption of shares.
On April 13, 2012, USAG listed its shares on the NYSE Arca under the ticker symbol “USAG.” USAG established its’ initial per share NAV by setting the price at $25.00. On April 14, 2012, USCF purchased 2 initial Creation Baskets of USAG. In accordance with applicable requirements of Regulation M under the Exchange Act, no Creation Baskets were offered to Authorized Participants nor were the shares listed on the NYSE Arca until five business days had elapsed from the date of USCF’s purchase of the initial Creation Basket on April 4, 2012. The fee that would have otherwise been charged in connection with an order to create or redeem was waived in connection with the initial Creation Basket.
Since its initial offering of 20,000,000 shares, USAG has not registered any subsequent offerings of its shares. As of June 30, 2016, USAG had issued 200,000 shares, 100,000 of which were outstanding. As of June 30, 2016, there were 19,800,000 remaining shares registered but not yet issued. More shares may have been issued by USAG than are outstanding due to the redemption of shares.
Unlike funds that are registered under the Investment Company Act, shares that have been redeemed by the Trust Series cannot be resold. As a result, each Trust Series contemplates that additional offerings of its shares will be registered with the SEC in the future in anticipation of additional issuances and redemptions.
As of June 30, 2016, USCI, CPER and USAG had the following Authorized Participants: BNP Paribas Prime Brokerage, Inc., BNP Paribas Securities Corp., Citadel Securities LLC, Credit Suisse Securities USA LLC, Goldman Sachs & Company, Jefferies & Company Inc., JP Morgan Securities Inc., Merrill Lynch Professional Clearing Corp., Morgan Stanley & Co. LLC, RBC Capital Markets LLC and Virtu Financial BD LLC.
| 42 |
For the Six Months ended June 30, 2016 Compared to the Six Months ended June 30, 2015
USCI
| For the six months ended June 30, 2016 | For the six months ended June 30, 2015 | |||||||
| Average daily total net assets | $ | 531,470,664 | $ | 600,845,315 | ||||
| Dividend and interest income earned on Treasuries, cash and/or cash equivalents | $ | 793,125 | $ | 165,976 | ||||
| Annualized yield based on average daily total net assets | 0.30 | % | 0.06 | % | ||||
| Management fee | $ | 2,114,266 | $ | 2,383,627 | ||||
| Total fees and other expenses excluding management fees | $ | 685,504 | $ | 947,147 | ||||
| Fees and expenses related to the registration or offering of additional shares | $ | — | $ | — | ||||
| Total commissions accrued to brokers | $ | 359,905 | $ | 350,400 | ||||
| Total commissions as annualized percentage of average total net assets | 0.14 | % | 0.12 | % | ||||
| Commissions accrued as a result of rebalancing | $ | 346,525 | $ | 325,949 | ||||
| Percentage of commissions accrued as a result of rebalancing | 96.28 | % | 93.02 | % | ||||
| Commissions accrued as a result of creation and redemption activity | $ | 13,380 | $ | 24,451 | ||||
| Percentage of commissions accrued as a result of creation and redemption activity | 3.72 | % | 6.98 | % | ||||
Portfolio Expenses. USCI’s expenses consist of investment management fees, brokerage fees and commissions, certain offering costs, licensing fees, the fees and expenses of the independent directors of USCF and expenses relating to tax accounting and reporting requirements. The management fee that USCI pays to USCF is calculated as a percentage of the total net assets of USCI. The fee is accrued daily and paid monthly.
Average interest rates earned on short-term investments held by USCI, including cash, cash equivalents and Treasuries, were higher during the six months ended June 30, 2016, compared to the six months ended June 30, 2015. As a result, the amount of income earned by USCI as a percentage of average daily total net assets was higher during the six months ended June 30, 2016, compared to the six months ended June 30, 2015.
USCI’s total fees and expenses excluding management fees for the six months ended June 30, 2016, compared to the six months ended June 30, 2015, decreased as a result of a decrease in certain operating expenses.
USCI’s total commissions accrued to brokers for the six months ended June 30, 2016, compared to the six months ended June 30, 2015, increased primarily due to an increase in the number of contracts traded during the rebalancing periods.
CPER
| For the six months ended June 30, 2016 | For the six months ended June 30, 2015 | |||||||
| Average daily total net assets | $ | 2,499,651 | $ | 1,899,864 | ||||
| Dividend and interest income earned on Treasuries, cash and/or cash equivalents | $ | 3,466 | $ | 553 | ||||
| Annualized yield based on average daily total net assets | 0.28 | % | 0.06 | % | ||||
| Management fee | $ | 8,080 | $ | 6,124 | ||||
| Total fees and other expenses excluding management fees | $ | 35,897 | $ | 29,020 | ||||
| Fees and expenses related to the registration or offering of additional shares | $ | — | $ | — | ||||
| Total amount of Expense Waiver | $ | 34,033 | $ | 27,603 | ||||
| Expenses before the allowance for the expense waiver | $ | 43,977 | $ | 35,144 | ||||
| Expenses after allowance for the expense waiver | $ | 9,944 | $ | 7,541 | ||||
| Total commissions accrued to brokers | $ | 896 | $ | 556 | ||||
| Total commissions as annualized percentage of average total net assets | 0.07 | % | 0.06 | % | ||||
| Commissions accrued as a result of rebalancing | $ | 800 | $ | 486 | ||||
| Percentage of commissions accrued as a result of rebalancing | 89.29 | % | 87.37 | % | ||||
| Commissions accrued as a result of creation and redemption activity | $ | 96 | $ | 70 | ||||
| Percentage of commissions accrued as a result of creation and redemption activity | 10.71 | % | 12.63 | % | ||||
Portfolio Expenses. CPER’s expenses consist of investment management fees, brokerage fees and commissions, certain offering costs, licensing fees, the fees and expenses of the independent directors of USCF and expenses relating to tax accounting and reporting requirements. The management fee that CPER pays to USCF is calculated as a percentage of the total net assets of CPER. The fee is accrued daily and paid monthly.
Average interest rates earned on short-term investments held by CPER, including cash, cash equivalents and Treasuries, were higher during the six months ended June 30, 2016, compared to the six months ended June 30, 2015. The amount of income earned by CPER as a percentage of average daily total net assets was higher during the six months ended June 30, 2016, compared to the six months ended June 30, 2015.
| 43 |
CPER’s total fees and expenses excluding management fees for the six months ended June 30, 2016, compared to the six months ended June 30, 2015, increased as a result of higher other expenses.
CPER’s total commissions accrued to brokers for the six months ended June 30, 2016, compared to the six months ended June 30, 2015, increased due to the number of contracts traded during the rebalancing periods.
USAG
| For the six months ended June 30, 2016 | For the six months ended June 30, 2015 | |||||||
| Average daily total net assets | $ | 1,999,543 | $ | 2,137,842 | ||||
| Dividend and interest income earned on Treasuries, cash and/or cash equivalents | $ | 2,845 | $ | 648 | ||||
| Annualized yield based on average daily total net assets | 0.29 | % | 0.06 | % | ||||
| Management fee | $ | 6,463 | $ | 6,891 | ||||
| Total fees and other expenses excluding management fees | $ | 33,068 | $ | 26,896 | ||||
| Fees and expenses related to the registration or offering of additional shares | $ | — | $ | — | ||||
| Total amount of Expense Waiver | $ | 31,558 | $ | 25,283 | ||||
| Expenses before the allowance for the expense waiver | $ | 39,531 | $ | 33,787 | ||||
| Expenses after allowance for the expense waiver | $ | 7,973 | $ | 8,504 | ||||
| Total commissions accrued to brokers | $ | 1,016 | $ | 1,064 | ||||
| Total commissions as annualized percentage of average total net assets | 0.10 | % | 0.10 | % | ||||
| Commissions accrued as a result of rebalancing | $ | 1,016 | $ | 1,064 | ||||
| Percentage of commissions accrued as a result of rebalancing | 100.00 | % | 100.00 | % | ||||
| Commissions accrued as a result of creation and redemption activity | $ | — | $ | — | ||||
| Percentage of commissions accrued as a result of creation and redemption activity | — | % | — | % | ||||
Portfolio Expenses. USAG’s expenses consist of investment management fees, brokerage fees and commissions, certain offering costs, licensing fees, the fees and expenses of the independent directors of USCF and expenses relating to tax accounting and reporting requirements. The management fee that USAG pays to USCF is calculated as a percentage of the total net assets of USAG. The fee is accrued daily and paid monthly.
Average interest rates earned on short-term investments held by USAG, including cash, cash equivalents and Treasuries, were higher during the six months ended June 30, 2016, compared to the six months ended June 30, 2015. As a result, the amount of income earned by USAG as a percentage of average daily total net assets was higher during the six months ended June 30, 2016, compared to the six months ended June 30, 2015.
USAG’s total fees and expenses excluding management fees for the six months ended June 30, 2016, compared to the six months ended June 30, 2015, increased as a result of an increase in certain operating expenses.
USAG’s total commissions accrued to brokers for the six months ended June 30, 2016, compared to the six months ended June 30, 2015, decreased due to the number of contracts traded during the rebalancing periods.
For the Three Months ended June 30, 2016 Compared to the Three Months ended June 30, 2015
USCI
| For the three months ended June 30, 2016 | For the three months ended June 30, 2015 | |||||||
| Average daily total net assets | $ | 560,670,938 | $ | 537,654,704 | ||||
| Dividend and interest income earned on Treasuries, cash and/or cash equivalents | $ | 455,142 | $ | 84,905 | ||||
| Annualized yield based on average daily total net assets | 0.33 | % | 0.06 | % | ||||
| Management fee | $ | 1,115,215 | $ | 1,072,363 | ||||
| Total fees and other expenses excluding management fees | $ | 335,804 | $ | 458,815 | ||||
| Fees and expenses related to the registration or offering of additional shares | $ | — | $ | — | ||||
| Total commissions accrued to brokers | $ | 183,218 | $ | 151,217 | ||||
| Total commissions as annualized percentage of average total net assets | 0.13 | % | 0.11 | % | ||||
| Commissions accrued as a result of rebalancing | $ | 173,578 | $ | 144,546 | ||||
| Percentage of commissions accrued as a result of rebalancing | 94.74 | % | 95.59 | % | ||||
| Commissions accrued as a result of creation and redemption activity | $ | 9,640 | $ | 6,671 | ||||
| Percentage of commissions accrued as a result of creation and redemption activity | 5.26 | % | 4.41 | % | ||||
| 44 |
Portfolio Expenses. USCI’s expenses consist of investment management fees, brokerage fees and commissions, certain offering costs, licensing fees, the fees and expenses of the independent directors of USCF and expenses relating to tax accounting and reporting requirements. The management fee that USCI pays to USCF is calculated as a percentage of the total net assets of USCI. The fee is accrued daily and paid monthly.
Average interest rates earned on short-term investments held by USCI, including cash, cash equivalents and Treasuries, were higher during the three months ended June 30, 2016, compared to the three months ended June 30, 2015. As a result, the amount of income earned by USCI as a percentage of average daily total net assets was higher during the three months ended June 30, 2016, compared to the three months ended June 30, 2015.
USCI’s total fees and expenses excluding management fees for the three months ended June 30, 2016, compared to the three months ended June 30, 2015, decreased as a result of a decrease in certain operating expenses.
USCI’s total commissions accrued to brokers for the three months ended June 30, 2016, compared to the three months ended June 30, 2015, increased primarily due to an increase in the number of contracts traded during the rebalancing periods.
CPER
| For the three months ended June 30, 2016 | For the three months ended June 30, 2015 | |||||||
| Average daily total net assets | $ | 2,826,368 | $ | 1,864,325 | ||||
| Dividend and interest income earned on Treasuries, cash and/or cash equivalents | $ | 2,201 | $ | 252 | ||||
| Annualized yield based on average daily total net assets | 0.31 | % | 0.05 | % | ||||
| Management fee | $ | 4,568 | $ | 3,021 | ||||
| Total fees and other expenses excluding management fees | $ | 18,847 | $ | 17,476 | ||||
| Fees and expenses related to the registration or offering of additional shares | $ | — | $ | — | ||||
| Total amount of Expense Waiver | $ | 17,699 | $ | 16,779 | ||||
| Expenses before the allowance for the expense waiver | $ | 23,415 | $ | 20,497 | ||||
| Expenses after allowance for the expense waiver | $ | 5,716 | $ | 3,718 | ||||
| Total commissions accrued to brokers | $ | 215 | $ | 296 | ||||
| Total commissions as annualized percentage of average total net assets | 0.03 | % | 0.06 | % | ||||
| Commissions accrued as a result of rebalancing | $ | 215 | $ | 296 | ||||
| Percentage of commissions accrued as a result of rebalancing | 100.00 | % | 100.00 | % | ||||
| Commissions accrued as a result of creation and redemption activity | $ | — | $ | — | ||||
| Percentage of commissions accrued as a result of creation and redemption activity | — | % | — | % | ||||
Portfolio Expenses. CPER’s expenses consist of investment management fees, brokerage fees and commissions, certain offering costs, licensing fees, the fees and expenses of the independent directors of USCF and expenses relating to tax accounting and reporting requirements. The management fee that CPER pays to USCF is calculated as a percentage of the total net assets of CPER. The fee is accrued daily and paid monthly.
Average interest rates earned on short-term investments held by CPER, including cash, cash equivalents and Treasuries, were higher during the three months ended June 30, 2016, compared to the three months ended June 30, 2015. The amount of income earned by CPER as a percentage of average daily total net assets was higher during the three months ended June 30, 2016, compared to the three months ended June 30, 2015.
CPER’s total fees and expenses excluding management fees for the three months ended June 30, 2016, compared to the three months ended June 30, 2015, increased as a result of higher other expenses.
CPER’s total commissions accrued to brokers for the three months ended June 30, 2016, compared to the three months ended June 30, 2015, decreased due to the number of contracts traded during the rebalancing periods.
| 45 |
USAG
| For the three months ended June 30, 2016 | For the three months ended June 30, 2015 | |||||||
| Average daily total net assets | $ | 2,059,687 | $ | 2,093,768 | ||||
| Dividend and interest income earned on Treasuries, cash and/or cash equivalents | $ | 1,614 | $ | 320 | ||||
| Annualized yield based on average daily total net assets | 0.32 | % | 0.06 | % | ||||
| Management fee | $ | 3,329 | $ | 3,393 | ||||
| Total fees and other expenses excluding management fees | $ | 17,400 | $ | 16,129 | ||||
| Fees and expenses related to the registration or offering of additional shares | $ | — | $ | — | ||||
| Total amount of Expense Waiver | $ | 16,612 | $ | 15,392 | ||||
| Expenses before the allowance for the expense waiver | $ | 20,729 | $ | 19,522 | ||||
| Expenses after allowance for the expense waiver | $ | 4,117 | $ | 4,130 | ||||
| Total commissions accrued to brokers | $ | 420 | $ | 406 | ||||
| Total commissions as annualized percentage of average total net assets | 0.08 | % | 0.08 | % | ||||
| Commissions accrued as a result of rebalancing | $ | 420 | $ | 406 | ||||
| Percentage of commissions accrued as a result of rebalancing | 100.00 | % | 100.00 | % | ||||
| Commissions accrued as a result of creation and redemption activity | $ | — | $ | — | ||||
| Percentage of commissions accrued as a result of creation and redemption activity | — | % | — | % | ||||
Portfolio Expenses. USAG’s expenses consist of investment management fees, brokerage fees and commissions, certain offering costs, licensing fees, the fees and expenses of the independent directors of USCF and expenses relating to tax accounting and reporting requirements. The management fee that USAG pays to USCF is calculated as a percentage of the total net assets of USAG. The fee is accrued daily and paid monthly.
Average interest rates earned on short-term investments held by USAG, including cash, cash equivalents and Treasuries, were higher during the three months ended June 30, 2016, compared to the three months ended June 30, 2015. As a result, the amount of income earned by USAG as a percentage of average daily total net assets was higher during the three months ended June 30, 2016, compared to the three months ended June 30, 2015.
USAG’s total fees and expenses excluding management fees for the three months ended June 30, 2016, compared to the three months ended June 30, 2015, increased as a result of an increase in certain operating expenses.
USAG’s total commissions accrued to brokers for the three months ended June 30, 2016, compared to the three months ended June 30, 2015, increased slightly due to the number of contracts traded during the rebalancing periods.
Tracking Each Trust Series’ Benchmark
USCF seeks to manage each Trust Series’ portfolio such that changes in its average daily per share NAV, on a percentage basis, closely track the changes in the average price of the Applicable Index, also on a percentage basis. Specifically, USCF seeks to manage the portfolio such that over any rolling period of 30-valuation days, the average daily change in a Trust Series’ per share NAV is within a range of 90% to 110% (0.9 to 1.1) of the average daily change in the price of the Applicable Index. As an example, if the average daily movement of the price of the Applicable Index for a particular 30-valuation day time period was 0.50% per day, USCF would attempt to manage the portfolio such that the average daily movement of the per share NAV during that same time period fell between 0.45% and 0.55% (i.e., between 0.9 and 1.1 of the Applicable Index’s results). Each Trust Series’ portfolio management goals do not include trying to make the nominal price of its per share NAV equal to the nominal price of the Applicable Index, the nominal price of any particular commodity Futures Contract or the spot price for any particular commodity. USCF believes that it is not practical to manage the portfolio to achieve such an investment goal when investing in listed Futures Contracts and Other-Related Investments.
USCI
For the 30-valuation days ended June 30, 2016, the simple average daily change in the SDCI was 0.097%, while the simple average daily change in the per share NAV of USCI over the same time period was 0.092% The average daily difference was (0.005%) (or (0.5) basis points, where 1 basis point equals 1/100 of 1%). As a percentage of the daily movement of the SDCI, the average error in daily tracking by the per share NAV was (4.903)%, meaning that over this time period USCI’s tracking error was within the plus or minus 10% range established as its benchmark tracking goal. This measurement is based on the relative movement in the benchmark. When the benchmark movement is small, small differences are magnified. On a daily basis, USCI is tracking very close to its benchmark.
| 46 |
Since the commencement of the offering of USCI’s shares to the public on August 10, 2010 to June 30, 2016, the simple average daily change in the SDCI was (0.001)%, while the simple average daily change in the per share NAV of USCI over the same time period was (0.007)%. The average daily difference was (0.006)% (or (0.6) basis points, where 1 basis point equals 1/100 of 1%). As a percentage of the daily movement of the SDCI, the average error in daily tracking by the per share NAV was (9.192)%, meaning that over this time period USCI’s tracking error was within the plus or minus 10% range established as its benchmark tracking goal. The first chart below shows the daily movement of USCI’s per share NAV versus the daily movement of the SDCI for the 30-valuation day period ended June 30, 2016. The second chart below shows the monthly total returns of USCI as compared to the monthly value of the SDCI for the five years ended June 30, 2016.
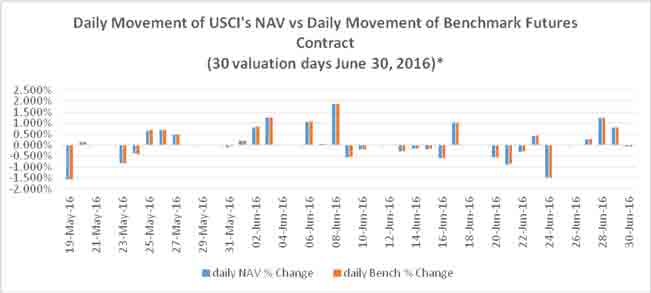
*PAST PERFORMANCE IS NOT NECESSARILY INDICATIVE OF FUTURE RESULTS
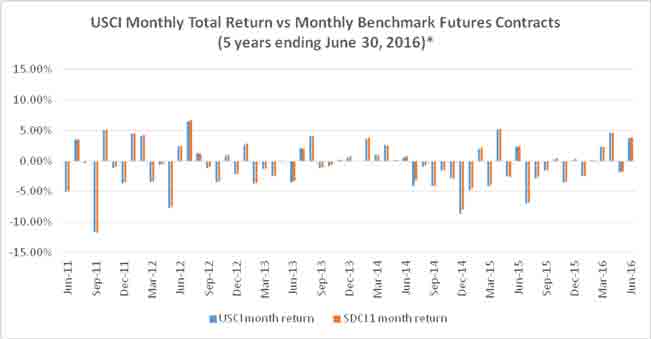
*PAST PERFORMANCE IS NOT NECESSARILY INDICATIVE OF FUTURE RESULTS
An alternative tracking measurement of the return performance of USCI versus the return of the SDCI can be calculated by comparing the actual return of USCI, measured by changes in its NAV, versus the expected changes in its NAV under the assumption that USCI’s returns had been exactly the same as the daily changes in the price of the SDCI.
| 47 |
For the six months ended June 30, 2016, the actual total return of USCI as measured by changes in its per share NAV was 6.29%. This is based on an initial per share NAV of $40.52 on December 31, 2015 and an ending per share NAV as of June 30, 2016 of $43.07. During this time period, USCI made no distributions to its shareholders. However, if USCI’s daily changes in its per share NAV had instead exactly tracked the changes in the daily return of the SDCI, USCI would have had an estimated per share NAV of $43.22 as of June 30, 2016, for a total return over the relevant time period of 6.66%. The difference between the actual per share NAV total return of USCI of 6.29% and the expected total return based on the SDCI of 6.66% was an error over the time period of (0.37)%, which is to say that USCI’s actual total return underperformed the SDCI result by that percentage. USCI incurs expenses primarily composed of the management fee, brokerage commissions for the buying and selling of futures contracts, and other expenses. The impact of these expenses tends to cause daily changes in the per share NAV of USCI to track slightly lower than daily changes in the price of the SDCI.
By comparison, for the six months ended June 30, 2015, the actual total return of USCI as measured by changes in its per share NAV was (2.32)%. This is based on an initial per share NAV of $48.24 as of December 31, 2014 and an ending per share NAV as of June 30, 2015 of $47.12. During this time period, USCI made no distributions to its shareholders. However, if USCI’s daily changes in its per share NAV had instead exactly tracked the changes in the daily total return of the SDCI, USCI would have had an estimated per share NAV of $47.52 as of June 30, 2015, for a total return over the relevant time period of (1.49)%. The difference between the actual per share NAV total return of USCI of (2.32)% and the expected total return based on the SDCI of (1.49)% was an error over the time period of (0.83)%, which is to say that USCI’s actual total return underperformed the SDCI result by that percentage. USCI incurred expenses primarily composed of the management fee, brokerage commissions for the buying and selling of futures contracts, and other expenses. The impact of these expenses tended to cause daily changes in the per share NAV of USCI to track slightly lower than daily changes in the price of the SDCI.
CPER
For the 30-valuation days ended June 30, 2016, the simple average daily change in the SCI was 0.185%, while the simple average daily change in the per share NAV of CPER over the same time period was 0.181%. The average daily difference was (0.004)% (or (0.4) basis points, where 1 basis point equals 1/100 of 1%). As a percentage of the daily movement of the SCI, the average error in daily tracking by the per share NAV was (7.058)%, meaning that over this time period CPER’s tracking error was within the plus or minus 10% range established as its benchmark tracking goal.
| 48 |
Since the commencement of the offering of CPER’s shares to the public on November 15, 2011 to June 30, 2016, the simple average daily change in the SCI was (0.035)%, while the simple average daily change in the per share NAV of CPER over the same time period was (0.038)%. The average daily difference was (0.003)% (or (0.3) basis points, where 1 basis point equals 1/100 of 1%). As a percentage of the daily movement of the SCI, the average error in daily tracking by the per share NAV was (4.151)%, meaning that over this time period CPER’s tracking error was within the plus or minus 10% range established as its benchmark tracking goal. The first chart below shows the daily movement of CPER’s per share NAV versus the daily movement of the SCI for the 30-valuation day period June 30, 2016. The second chart below shows the monthly total returns of CPER as compared to the monthly value of the SCI for the four years ended June 30, 2016.
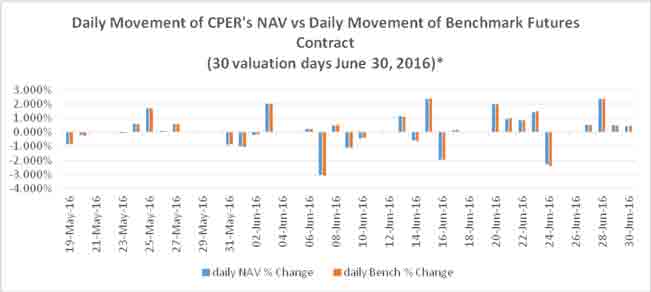
*PAST PERFORMANCE IS NOT NECESSARILY INDICATIVE OF FUTURE RESULTS
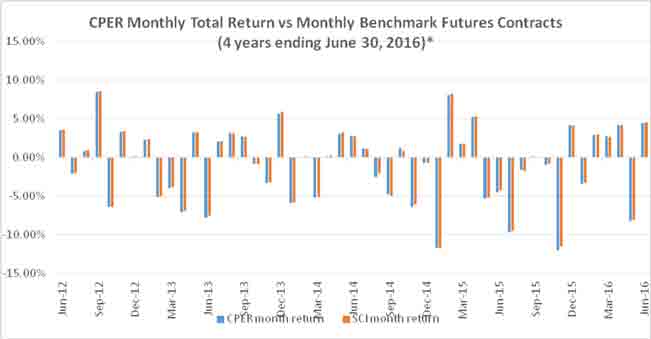
*PAST PERFORMANCE IS NOT NECESSARILY INDICATIVE OF FUTURE RESULTS
An alternative tracking measurement of the return performance of CPER versus the return of the SCI can be calculated by comparing the actual return of CPER, measured by changes in its per share NAV, versus the expected changes in its per share NAV under the assumption that CPER’s returns had been exactly the same as the daily changes in the price of the SCI.
For the six months ended June 30, 2016, the actual total return of CPER as measured by changes in its’ per share NAV was 1.97%. This is based on an initial per share NAV of $14.24 as of December 31, 2015 and an ending per share NAV as of June 30, 2016 of $14.52. During this time period, CPER made no distributions to its shareholders. However, if CPER’s daily changes in its’ per share NAV had instead exactly tracked the changes in the daily total return of the SCI, CPER would have had an estimated per share NAV of $14.56 as of June 30, 2016, for a total return over the relevant time period of 2.25%. The difference between the actual per share NAV total return of CPER of 1.97% and the expected total return based on the SCI of 2.25% was an error over the time period of (0.28)%, which is to say that CPER’s actual total return underperformed the SCI result by that percentage. CPER incurs expenses primarily composed of the management fee, brokerage commissions for the buying and selling of futures contracts, and other expenses. The impact of these expenses tends to cause daily changes in the per share NAV of CPER to track slightly lower than daily changes in the price of the SCI.
By comparison, for six months ended June 30, 2015, the actual total return of CPER as measured by changes in its per share NAV was (7.64)%. This is based on an initial per share NAV of $19.10 as of December 31, 2014 and an ending per share NAV as of June 30, 2015 of $17.64. During this time period, CPER made no distributions to its shareholders. However, if CPER’s daily changes in its per share NAV had instead exactly tracked the changes in the daily total return of the SCI, CPER would have had an estimated per share NAV of $17.72 as of June 30, 2015, for a total return over the relevant time period of (7.20)%. The difference between the actual per share NAV total return of CPER of (7.64)% and the expected total return based on the SCI of (7.20)% was an error over the time period of (0.44)%, which is to say that CPER’s actual total return underperformed the SCI result by that percentage. CPER incurred expenses primarily composed of the management fee, brokerage commissions for the buying and selling of futures contracts, and other expenses. The impact of these expenses tended to cause daily changes in the per share NAV of CPER to track slightly lower than daily changes in the price of the SCI.
USAG
For the 30-valuation days ended June 30, 2016, the simple average daily change in the SDAI was 0.091%, while the simple average daily change in the per share NAV of USAG over the same time period was 0.097%. The average daily difference was 0.006% (or 0.6 basis points, where 1 basis point equals 1/100 of 1%). As a percentage of the daily movement of the SDAI, the average error in daily tracking by the per share NAV was 1.475%, meaning that over this time period USAG’s tracking error was within the plus or minus 10% range established as its benchmark tracking goal. This measurement is based on the relative movement in the benchmark. When the benchmark movement is small, small differences are magnified. On a daily basis, USAG is tracking very close to its benchmark.
| 49 |
Since the commencement of the offering of USAG’s shares to the public on April 13, 2012 to June 30, 2016, the simple average daily change in the SDAI was (0.010)%, while the simple average daily change in the per share NAV of USAG over the same time period was (0.012)%. The average daily difference was (0.002)% (or (0.2) basis points, where 1 basis point equals 1/100 of 1%). As a percentage of the daily movement of the SDAI, the average error in daily tracking by the per share NAV was 7.658%, meaning that over this time period USAG’s tracking error was within the plus or minus 10% range established as its benchmark tracking goal. The first chart below shows the daily movement of USAG’s per share NAV versus the daily movement of the SDAI for the 30-valuation day period ended June 30, 2016. The second chart below shows the monthly total returns of USAG as compared to the monthly value of the SDAI for the three years ended June 30, 2016.
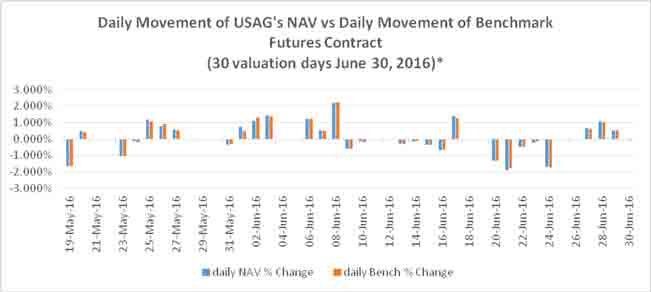
*PAST PERFORMANCE IS NOT NECESSARILY INDICATIVE OF FUTURE RESULTS
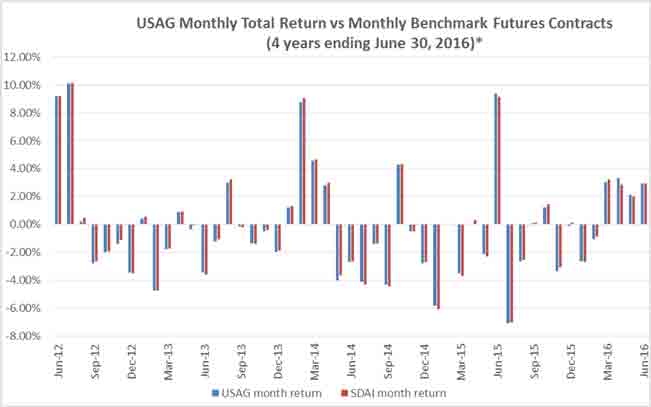
*PAST PERFORMANCE IS NOT NECESSARILY INDICATIVE OF FUTURE RESULTS
| 50 |
An alternative tracking measurement of the return performance of USAG versus the return of the SDAI can be calculated by comparing the actual return of USAG, measured by changes in its per share NAV, versus the expected changes in its per share NAV under the assumption that USAG’s returns had been exactly the same as the daily changes in the price of the SDAI.
For the six months ended June 30, 2016, the actual total return of USAG as measured by changes in its per share NAV was 7.73%. This is based on an initial per share NAV of $19.80 as of December 31, 2015 and an ending per share NAV as of June 30, 2016, of $21.33. During this time period, USAG made no distributions to its shareholders. However, if USAG’s daily changes in its per share NAV had instead exactly tracked the changes in the daily total return of the SDAI, USAG would have had an estimated per share NAV of $21.28 as of June 30, 2016, for a total return over the relevant time period of 7.47%. The difference between the actual per share NAV total return of USAG of 7.73% and the expected total return based on the SDAI of 7.47% was an error over the time period of 0.26%, which is to say that USAG’s actual total return outperformed the SDAI result by that percentage. USAG incurs expenses primarily composed of the management fee, brokerage commissions for the buying and selling of futures contracts, and other expenses. The impact of these expenses usually cause daily changes in the per share NAV of USAG to track slightly lower than daily changes in the price of the SDAI. In this case the NAV for USAG outperformed its benchmark.
By comparison, for the six months ended June 30, 2015, the actual total return of USAG as measured by changes in its per share NAV was (2.61)%.This is based on an initial per share NAV of $22.97 as of December 31, 2014 and an ending per share NAV as of June 30, 2015 of $22.37. During this time period, USAG made no distributions to its shareholders. However, if USAG’s daily changes in its’ per share NAV had instead exactly tracked the changes in the daily total return of the SDAI, USAG would have had an estimated per share NAV of $22.23 as of June 30, 2015, for a total return over the relevant time period of (3.24)%. The difference between the actual per share NAV total return of USAG of (2.61)% and the expected total return based on the SDAI of (3.24)% was an error over the time period of 0.63%, which is to say that USAG’s actual total return outperformed the SDAI result by that percentage. USAG incurred expenses primarily composed of the management fee, brokerage commissions for the buying and selling of futures contracts, and other expenses. The impact of these expenses usually cause daily changes in the per share NAV of USAG to track slightly lower than daily changes in the price of the SDAI. In this case the NAV for USAG outperformed its benchmark.
Factors That Can Impact Ability to Track the Applicable Index
There are currently five factors that have impacted or are most likely to impact a Trust Series’ ability to accurately track its Applicable Index.
First, a Trust Series may buy or sell its holdings in the then current Applicable Benchmark Component Futures Contracts at a price other than the closing settlement price of that contract on the day during which such Trust Series executes the trade. In that case, a Trust Series may pay a price that is higher, or lower, than that of the Applicable Benchmark Component Futures Contracts, which could cause the changes in the daily per share NAV of a Trust Series to either be too high or too low relative to the daily changes in the price of the Applicable Index. During the six months ended June 30, 2016, USCF attempted to minimize the effect of these transactions by seeking to execute its purchase or sale of the Applicable Index at, or as close as possible to, the end of the day settlement price. However, it may not always be possible for a Trust Series to obtain the closing settlement price and there is no assurance that failure to obtain the closing settlement price in the future will not adversely impact a Trust Series’ attempt to track the Applicable Index over time.
Second, each Trust Series incurs expenses primarily composed of the management fees, brokerage commissions for the buying and selling of futures contracts, and other expenses. The impact of these expenses tends to cause daily changes in the per share NAV of such Trust Series to track slightly lower than daily changes in the price of the Applicable Index. At the same time, each Trust Series earns interest income on its cash, cash equivalents and Treasuries. A Trust Series is not required to distribute any portion of its income to its shareholders and none of the Trust Series made any distributions to shareholders during the six months ended June 30, 2016. Interest payments, and any other income, were retained within the portfolio and added to each Trust Series’ NAV. At the same time, each Trust Series incurred expenses for its management fee, brokerage commissions and other expenses (including ongoing registration fees). The calculation of each Applicable Index includes an interest portion, calculated daily using the 90-Day U.S. Treasury Bill’s total return, but does not include an expense component. When a Trust Series’ income exceeds the sum of its expenses by the yield on the 90-Day U.S. Treasury Bill, such Trust Series realizes a net yield that tends to cause daily changes in the per share NAV of such Trust Series to track slightly higher than daily changes in the price of the Applicable Index. If this net yield is lower than the yield on the 90-Day U.S. Treasury Bill, that tends to cause daily changes in the per share NAV of such Trust Series to track slightly lower than daily changes in the price of the Applicable Index. If short-term interest rates rise above the current levels, the level of deviation created by the yield would decrease. Conversely, if short-term interest rates were to decline, the amount of error created by the yield would increase. When short-term yields drop to a level lower than the combined expenses of the management fee and the brokerage commissions, then the tracking error becomes a negative number and would tend to cause the daily returns of the per share NAV to underperform the daily returns of the Applicable Index. USCF anticipates that interest rates will continue to remain at historical lows and, therefore, it is anticipated that fees and expenses paid by each Trust Series will continue to be higher than interest earned by each Trust Series. As such, USCF anticipates that each Trust Series will continue to underperform tracking the Applicable Index until such a time when interest earns at least equals or exceeds the fees and expenses paid by each Trust Series.
| 51 |
Third, a Trust Series may hold Futures Contracts in a particular commodity other than the one specified as the Applicable Benchmark Component Futures Contract, or may hold Other Related Investments in its portfolio that may fail to closely track the Applicable Index’ total return movements. Taking USCI as an example, assume for a given month one of the Applicable Benchmark Component Futures Contracts is the NYMEX WTI physically settled Futures Contract, trading under the symbol “CL,” for the contract month of November 2016. It is possible that USCI could hold a NYMEX WTI financially settled Futures Contract, trading under the symbol “WS,” for the contract month of November 2016. Alternatively, and using the same example, USCI could hold the ICE WTI financially settled Futures Contract, also for the contract month of November 2016. As a third example, USCI could hold the NYMEX WTI physically settled Futures Contract, trading under the symbol “CL,” but for a contract month other than November 2016.
Fourth, a Trust Series could hold Other Related Investments. In any of these cases, the error in tracking the Applicable Index could result in daily changes in the per share NAV of a Trust Series that are either too high, or too low, relative to the daily changes in the price of the Applicable Index. During the six months ended June 30, 2016, none of the Trust Series held any Other Related Investments, but did, at times, hold Futures Contracts that were in months other than the months specified as the Applicable Benchmark Component Futures Contract. If any Trust Series increases in size, and due to its obligations to comply with regulatory limits or due to other market pricing or liquidity factors, such Trust Series may invest in Futures Contract months other than the designated month specified as the Applicable Benchmark Component Futures Contract, or in Other Related Investments, which may have the effect of increasing transaction related expenses and may result in increased tracking error.
Finally, a Trust Series could hold the same Futures contracts as its benchmark but at a different weight. This is due to the fact that the benchmark can theoretically own a fractional percentage of a Futures contract but a Trust Series must own a full contract. For a Trust Series with smaller asset base, this percentage difference can have a material impact.
The SDCI
The SDCI was developed based upon academic research by Yale University professors Gary B. Gorton and K. Geert Rouwenhorst, and Hitotsubashi University professor Fumio Hayashi. The SDCI is designed to reflect the performance of a fully margined or collateralized portfolio of 14 Eligible Commodity Futures Contracts with equal weights, selected each month from a universe of the 27 Eligible Commodity Futures Contracts. The SDCI is rules-based and rebalanced monthly based on observable price signals. In this context, the term “rules-based” is meant to indicate that the composition of the SDCI in any given month will be determined by quantitative formulas relating to the prices of the futures contracts that relate to the commodities that are eligible to be included in the SDCI. Such formulas are not subject to adjustment based on other factors. The overall return on the SDCI is generated by two components: (i) uncollateralized returns from the Applicable Benchmark Component Futures Contracts comprising the SDCI and (ii) a daily fixed income return reflecting the interest earned on a hypothetical 3-month U.S. Treasury Bill collateral portfolio, calculated using the weekly auction rate for the 3-Month U.S. Treasury Bills published by the U.S Department of the Treasury. SHIM is the owner of the SDCI.
The SDCI is composed of physical non-financial commodity futures contracts with active and liquid markets traded upon futures exchanges in major industrialized countries. The futures contracts are denominated in U.S. dollars and weighted equally by notional amount. The SDCI currently reflects commodities in six commodity sectors: energy (e.g., crude oil, natural gas, diesel-heating oil, etc.), precious metals (e.g., gold, silver platinum), industrial metals (e.g., zinc, nickel, aluminum, copper, etc.), grains (e.g., wheat, corn, soybeans, etc.), softs (e.g., sugar, cotton, coffee, cocoa), and livestock (e.g., live cattle, lean hogs, feeder cattle).
| 52 |
Table 1 below lists the eligible commodities, the relevant Futures Exchanges on which the Eligible Commodity Futures Contracts are listed and quotation details. Table 2 lists the Eligible Commodity Futures Contracts, their sector designation and maximum allowable tenor.
Table 1
| Commodity | Designated Contract | Exchange | Units | Quote | ||||
| Aluminum | High Grade Primary Aluminum | LME | 25 metric tons | USD/metric ton | ||||
| Cocoa | Cocoa | ICE-US | 10 metric tons | USD/metric ton | ||||
| Coffee | Coffee “C” | ICE-US | 37,500 lbs | U.S. cents/pound | ||||
| Copper | Copper | COMEX | 25,000 lbs | U.S. cents/pound | ||||
| Corn | Corn | CBOT | 5,000 bushels | U.S. cents/bushel | ||||
| Cotton | Cotton | ICE-US | 50,000 lbs | U.S. cents/pound | ||||
| Crude Oil (WTI) | Light, Sweet Crude Oil | NYMEX | 1,000 barrels | USD/barrel | ||||
| Crude Oil (Brent) | Crude Oil | ICE-UK | 1,000 barrels | USD/barrel | ||||
| Gas Oil | Gas Oil | ICE-UK | 100 metric tons | USD/metric ton | ||||
| Gold | Gold | COMEX | 100 troy oz. | USD/troy oz. | ||||
| Heating Oil | Heating Oil | NYMEX | 42,000 gallons | U.S. cents/gallon | ||||
| Lead | Lead | LME | 25 metric tons | USD/metric ton | ||||
| Lean Hogs | Lean Hogs | CME | 40,000 lbs. | U.S. cents/pound | ||||
| Live Cattle | Live Cattle | CME | 40,000 lbs. | U.S. cents/pound | ||||
| Feeder Cattle | Feeder Cattle | CME | 50,000 lbs. | U.S. cents/pound | ||||
| Natural Gas | Henry Hub Natural Gas | NYMEX | 10,000 mmbtu | USD/mmbtu | ||||
| Nickel | Primary Nickel | LME | 6 metric tons | USD/metric ton | ||||
| Platinum | Platinum | NYMEX | 50 troy oz. | USD/troy oz. | ||||
| Silver | Silver | COMEX | 5,000 troy oz. | U.S. cents/troy oz. | ||||
| Soybeans | Soybeans | CBOT | 5,000 bushels | U.S. cents/bushel | ||||
| Soybean Meal | Soybean Meal | CBOT | 100 tons | USD/ton | ||||
| Soybean Oil | Soybean Oil | CBOT | 60,000 lbs. | U.S. cents/pound | ||||
| Sugar | World Sugar No. 11 | ICE-US | 112,000 lbs. | U.S. cents/pound | ||||
| Tin | Tin | LME | 5 metric tons | USD/metric ton | ||||
| Unleaded Gasoline | Reformulated Blendstock for Oxygen Blending | NYMEX | 42,000 gallons | U.S. cents/gallon | ||||
| Wheat | Wheat | CBOT | 5,000 bushels | U.S. cents/bushel | ||||
| Zinc | Special High Grade Zinc | LME | 25 metric tons | USD/metric ton |
Table 2
| Commodity Symbol |
Commodity Name | Sector | Allowed Contracts | Max. Tenor | ||||
| CO | Brent Crude | Energy | All 12 Calendar Months | 12 | ||||
| CL | Crude Oil | Energy | All 12 Calendar Months | 12 | ||||
| QS | Gas Oil | Energy | All 12 Calendar Months | 12 | ||||
| HO | Diesel-Heating Oil | Energy | All 12 Calendar Months | 12 | ||||
| NG | Natural Gas | Energy | All 12 Calendar Months | 12 | ||||
| XB | RBOB | Energy | All 12 Calendar Months | 12 | ||||
| FC | Feeder Cattle | Livestock | Jan, Mar, Apr, May, Aug, Sep, Oct, Nov | 5 | ||||
| LH | Lean Hogs | Livestock | Feb, Apr, Jun, Jul, Aug, Oct, Dec | 5 | ||||
| LC | Live Cattle | Livestock | Feb, Apr, Jun, Aug, Oct, Dec | 5 | ||||
| BO | Soybean Oil | Grains | Jan, Mar, May, Jul, Aug, Sep, Oct, Dec | 7 | ||||
| C | Corn | Grains | Mar, May, Jul, Sep, Dec | 12 | ||||
| S | Soybeans | Grains | Jan, Mar, May, Jul, Aug, Sep, Nov | 12 | ||||
| SM | Soymeal | Grains | Jan, Mar, May, Jul, Aug, Sep, Oct, Dec | 7 | ||||
| W | Wheat (Soft Red Winter) | Grains | Mar, May, Jul, Sep, Dec | 7 | ||||
| LA | Aluminum | Industrial Metals | All 12 Calendar months | 12 | ||||
| HG | Copper | Industrial Metals | All 12 Calendar Months | 12 | ||||
| LL | Lead | Industrial Metals | All 12 Calendar Months | 7 | ||||
| LN | Nickel | Industrial Metals | All 12 Calendar Months | 7 | ||||
| LT | Tin | Industrial Metals | All 12 Calendar Months | 7 | ||||
| LX | Zinc | Industrial Metals | All 12 Calendar Months | 7 | ||||
| GC | Gold | Precious Metals | Feb, Apr, Jun, Aug, Oct, Dec | 12 | ||||
| PL | Platinum | Precious Metals | Jan, Apr, Jul, Oct | 5 | ||||
| SI | Silver | Precious Metals | Mar, May, Jul, Sep, Dec | 5 | ||||
| CC | Cocoa | Softs | Mar, May, Jul, Sep, Dec | 7 | ||||
| KC | Coffee | Softs | Mar, May, Jul, Sep, Dec | 7 | ||||
| CT | Cotton | Softs | Mar, May, Jul, Dec | 7 | ||||
| SB | Sugar | Softs | Mar, May, Jul, Oct | 7 |
| 53 |
Prior to the end of each month, SHIM determines the composition of the SDCI and provides such information to Bloomberg, L.P. (“Bloomberg”). Values of the SDCI are computed by Bloomberg and disseminated approximately every fifteen (15) seconds from 8:00 a.m. to 5:00 p.m., New York City time, which also publishes a daily SDCI value at approximately 5:30 p.m., New York City time, under the index ticker symbol “SDCITR:IND.” Only settlement and last-sale prices are used in the SDCI’s calculation, bids and offers are not recognized — including limit-bid and limit-offer price quotes. Where no last-sale price exists, typically in the more deferred contract months, the previous days’ settlement price is used. This means that the underlying SDCI may lag its theoretical value. This tendency to lag is evident at the end of the day when the SDCI value is based on the settlement prices of the Applicable Benchmark Component Futures Contracts, and explains why the underlying SDCI often closes at or near the high or low for the day.
Composition of the SDCI
The composition of the SDCI on any given day, as determined and published by SHIM, is determinative of the benchmark for USCI. However, it is not possible to anticipate all possible circumstances and events that may occur with respect to the SDCI and the methodology for its composition, weighting and calculation. Accordingly, a number of subjective judgments must be made in connection with the operation of the SDCI that cannot be adequately reflected in this description of the SDCI. All questions of interpretation with respect to the application of the provisions of the SDCI methodology, including any determinations that need to be made in the event of a market emergency or other extraordinary circumstances, will be resolved by SHIM.
Contract Expirations
Because the SDCI is comprised of actively traded contracts with scheduled expirations, it can be calculated only by reference to the prices of contracts for specified expiration, delivery or settlement periods, referred to as contract expirations. The contract expirations included in the SDCI for each commodity during a given year are designated by SHIM, provided that each contract must be an active contract. An active contract for this purpose is a liquid, actively-traded contract expiration, as defined or identified by the relevant trading facility or, if no such definition or identification is provided by the relevant trading facility, as defined by standard custom and practice in the industry.
If a Futures Exchange ceases trading in all contract expirations relating to a particular Futures Contract, SHIM may designate a replacement contract on the commodity. The replacement contract must satisfy the eligibility criteria for inclusion in the SDCI. To the extent practicable, the replacement will be effected during the next monthly review of the composition of the SDCI. If that timing is not practicable, SHIM will determine the date of the replacement based on a number of factors, including the differences between the existing Futures Contract and the replacement Futures Contract with respect to contractual specifications and contract expirations.
If a contract is eliminated and there is no replacement contract, the underlying commodity will necessarily be dropped from the SDCI. The designation of a replacement contract, or the elimination of a commodity from the SDCI because of the absence of a replacement contract, could affect the value of the SDCI, either positively or negatively, depending on the price of the contract that is eliminated and the prices of the remaining contracts. It is impossible, however, to predict the effect of these changes, if they occur, on the value of the SDCI.
Commodity Selection
Fourteen of the 27 Futures Contracts are selected for inclusion in the SDCI for the next month, subject to the constraint that each of the six commodity sectors is represented by at least one commodity. The methodology used to select the 14 Futures Contracts is based solely on quantitative data using observable futures prices and is not subject to human bias.
Monthly commodity selection is a two-step process based upon examination of the relevant futures prices for each commodity:
| 1) | The annualized percentage price difference between the closest-to-expiration Futures Contract and the next closest-to-expiration Futures Contract is calculated for each of the 27 eligible Futures Contracts on the Selection Date. The seven commodities with the highest percentage price difference are selected. | |
| 2) | For the remaining 20 eligible commodities, the percentage price change of each commodity over the previous year is calculated, as measured by the change in the price of the closest-to-expiration Futures Contract on the Selection Date from the price of the closest-to-expiration Futures Contract a year prior to the Selection Date. The seven commodities with the highest percentage price change are selected. |
When evaluating the data from the second step, all six commodity sectors must be represented. If the selection of the seven additional commodities with the highest price change fails to meet the overall diversification requirement that all six commodity sectors are represented in the SDCI, the commodity with the highest price change among the commodities of the omitted sector(s) would be substituted for the commodity with the lowest price change among the seven additional commodities.
The 14 commodities selected are included in the SDCI for the next month on an equally-weighted basis. Due to the dynamic monthly commodity selection, the sector weights will vary from approximately 7% to 43% over time, depending on the price observations each month. The Selection Date for the SDCI is the fifth business day prior to the first business day of the next calendar month.
| 54 |
The following graph shows the sector weights of the commodities selected for inclusion in the SDCI as of June 30, 2016.
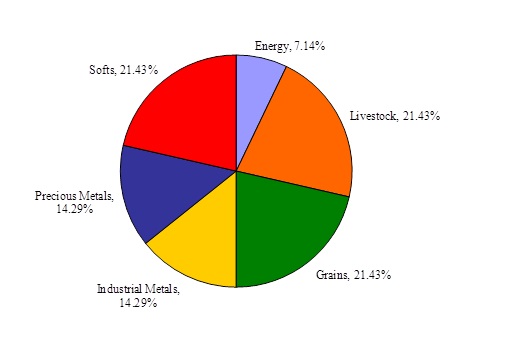
Contract Selection
For each commodity selected for inclusion into the SDCI for a particular month, the SDCI selects a specific Benchmark Component Futures Contract with a tenor (i.e., contract month) among the eligible tenors (the range of contract months) based upon the relative prices of the Applicable Benchmark Component Futures Contracts within the eligible range of contract months. The previous notwithstanding, the contract expiration is not changed for such month if a contract remains in the SDCI, as long as the contract does not expire or enter its notice period in the subsequent month.
Portfolio Construction
The portfolio rebalancing takes place during the last four business days of the month (the “Rebalancing Period”). At the end of each of the days in the Rebalancing Period, one fourth of the prior month portfolio positions are replaced by an equally-weighted position in the commodity contracts determined on the Selection Date. At the end of the Rebalancing Period, the SDCI takes an equal-weight position of approximately 7.14% in each of the selected commodity contracts.
SDCI Total Return Calculation
The value of the SDCI on any business day is equal to the product of (i) the value of the SDCI on the immediately preceding business day multiplied by (ii) one plus the sum of the day’s returns for another version of the SDCI known as the SummerHaven Dynamic Commodity Index Excess Return (“SDCI ER”) (explained below) and one business day’s interest from hypothetical Treasuries. The value of the SDCI is calculated and published by Bloomberg.
SDCI Base Level
The SDCI was set to 100 on January 2, 1991.
SDCI ER Calculation
The total return of the SDCI ER reflects the percentage change of the market values of the underlying commodity futures. During the Rebalancing Period, the SDCI changes its contract holdings during a four day period. The value of the SDCI ER at the end of a business day “t” is equal to the SDCI ER value on day “t -1” multiplied by the sum of the daily percentage price changes of each commodity future factoring in each respective commodity future’s notional holding on day “t -1”.
| 55 |
Rebalancing Period
During the Rebalancing Period, existing positions are replaced by new positions based on the signals used for contract selection as outlined above. At the end of the first day of the Rebalancing Period, the signals are observed and on the second day a new portfolio is constructed that is equally weighted in terms of notional positions in the newly selected contracts.
Hypothetical Performance of Each Applicable Index
SDCI
The table and chart below show the hypothetical performance of the SDCI from January 1, 2006 through June 30, 2016.
HYPOTHETICAL PERFORMANCE RESULTS HAVE MANY INHERENT LIMITATIONS, SOME OF WHICH ARE DESCRIBED BELOW. NO REPRESENTATION IS BEING MADE THAT USCI WILL OR IS LIKELY TO ACHIEVE PROFITS OR LOSSES SIMILAR TO THOSE SHOWN. IN FACT, THERE ARE FREQUENTLY SHARP DIFFERENCES BETWEEN HYPOTHETICAL PERFORMANCE RESULTS AND THE ACTUAL RESULTS ACHIEVED BY ANY PARTICULAR TRADING PROGRAM.
ONE OF THE LIMITATIONS OF HYPOTHETICAL PERFORMANCE RESULTS IS THAT THEY ARE GENERALLY PREPARED WITH THE BENEFIT OF HINDSIGHT. IN ADDITION, HYPOTHETICAL TRADING DOES NOT INVOLVE FINANCIAL RISK, AND NO HYPOTHETICAL TRADING RECORD CAN COMPLETELY ACCOUNT FOR THE IMPACT OF FINANCIAL RISK IN ACTUAL TRADING.
FOR EXAMPLE, THE ABILITY TO WITHSTAND LOSSES OR TO ADHERE TO A PARTICULAR TRADING PROGRAM IN SPITE OF TRADING LOSSES ARE MATERIAL POINTS WHICH CAN ALSO ADVERSELY AFFECT ACTUAL TRADING RESULTS. THERE ARE NUMEROUS OTHER FACTORS RELATED TO THE MARKETS IN GENERAL OR TO THE IMPLEMENTATION OF ANY SPECIFIC TRADING PROGRAM WHICH CANNOT BE FULLY ACCOUNTED FOR IN THE PREPARATION OF HYPOTHETICAL PERFORMANCE RESULTS AND ALL OF WHICH CAN ADVERSELY AFFECT ACTUAL TRADING RESULTS.
USCF HAS HAD LITTLE OR NO EXPERIENCE IN TRADING ACTUAL ACCOUNTS FOR CUSTOMERS. BECAUSE THERE ARE NO ACTUAL TRADING RESULTS TO COMPARE TO THE HYPOTHETICAL PERFORMANCE RESULTS, CUSTOMERS SHOULD BE PARTICULARLY WARY OF PLACING UNDUE RELIANCE ON THESE HYPOTHETICAL PERFORMANCE RESULTS.
Since the SDCI was launched on December 18, 2009, there is only actual performance history of the SDCI from that date to the present. This data is available for periods prior to December 18, 2009. However, the components of the SDCI and the weighting of the components of the SDCI are established each month based on purely quantitative data that is not subject to revision based on other external factors. As a result, the table below reflects how the SDCI would have performed from January 1, 2006 through June 30, 2016 had it been in effect during such time period. The performance data does not reflect any reinvestment or distribution of profits, commission charges, management fees or other expenses that would have been incurred in connection with operating and managing a commodity pool designed to track the SDCI. Such fees and expenses would reduce the performance returns shown in the table below.
Hypothetical Performance Results* for the period
from January 1, 2006 through June 30, 2016
| Year | Ending Level* | Annual Return | ||||||
| 2006 | 1,115.82 | 42.70 | % | |||||
| 2007 | 1,518.71 | 36.11 | % | |||||
| 2008 | 1,175.77 | (22.58 | )% | |||||
| 2009 | 1,532.84 | 30.37 | % | |||||
| 2010 | 1,852.04 | 20.82 | % | |||||
| 2011 | 1,703.23 | (8.03 | )% | |||||
| 2012 | 1,726.55 | 1.37 | % | |||||
| 2013 | 1,678.73 | (2.77 | )% | |||||
| 2014 | 1,475.68 | (12.10 | )% | |||||
| 2015 | 1,265.58 | (14.24 | )% | |||||
| 2016 (YTD) | 1,349.90 | 6.66 | % | |||||
* The “base level” for the SDCI was set at 100 on January 2, 1991. The “Ending Level” represents the value of the components of the SDCI on the last trading day of each year and is used to illustrate the cumulative performance of the SDCI.
PAST PERFORMANCE IS NOT NECESSARILY INDICATIVE OF FUTURE RESULTS
| 56 |
SummerHaven Dynamic Commodity Index SM (“SDCI”) Year-Over-Year
Hypothetical Total Returns (1/1/2006-6/30/2016 YTD)
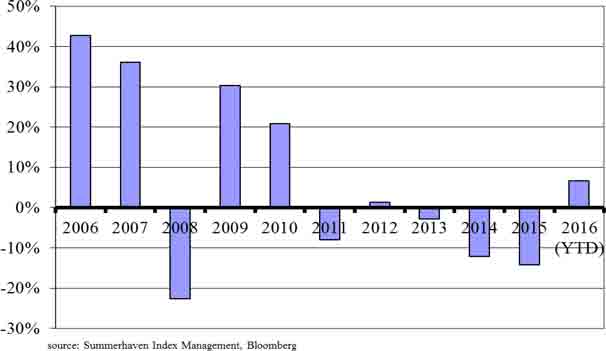
PAST PERFORMANCE IS NOT NECESSARILY INDICATIVE OF FUTURE RESULTS
The following table and chart compare the hypothetical total return of the SDCI in comparison with the actual total return of three major indexes for the period from December 31, 1997 to June 30, 2016.
| Hypothetical and Historical Results for the period from | ||||||||||||||||
| December 31, 1997 through June 30, 2016 | ||||||||||||||||
| BCOM TR | S&P GSCI TR | DB LCI OY TR | SDCI TR | |||||||||||||
| Total return | 15.99 | % | (22.05 | )% | 150.85 | % | 499.90 | % | ||||||||
| Average annual return (total) | 3.65 | % | 3.35 | % | 8.13 | % | 12.29 | % | ||||||||
| Annualized volatility | 16.80 | % | 23.33 | % | 19.24 | % | 15.35 | % | ||||||||
| Annualized Sharpe ratio | 0.09 | 0.05 | 0.31 | 0.65 | ||||||||||||
Source: SHIM, Bloomberg
PAST PERFORMANCE IS NOT NECESSARILY INDICATIVE OF FUTURE RESULTS
| 57 |
The table immediately above shows the performance of the SDCI from December 31, 1997 through June 30, 2016 in comparison with three traditional commodities indices: the S&P GSCI Commodity Index (GSCI®) Total Return, Bloomberg Commodity Index Total ReturnSM and the Deutsche Bank Liquid Commodity Index-Optimum Yield Total ReturnTM. The S&P GSCI® Commodity Index Total Return is a composite index of commodity sector returns representing an unleveraged, long-only investment in commodity futures that is broadly diversified across the spectrum of commodities. The Bloomberg Commodity Index Total ReturnSM is currently composed of futures contracts on a diversified basket of commodities traded on U.S. exchanges. The Deutsche Bank Liquid Commodity Index-Optimum Yield Total ReturnTM is designed to reflect the performance of certain wheat, corn, light sweet crude oil, heating oil, gold and aluminum futures contracts plus the returns from investing in 3-month U.S. Treasury Bills. The data for the SDCI Total Return Index is derived by using the SDCI’s calculation methodology with historical prices for the futures contracts comprising the SDCI. The information about each of the indices comes from publicly-available material about such indices but is not designed to provide a thorough overview of the methodology of each index.
None of the indices has an investment objective identical to the SDCI. As a result, there are inherent limitations in comparing the performance of such indices against the SDCI. For more information about these indices and their methodologies, please refer to the material published by the sponsors of each such index which may be found on their websites. USCI is not responsible for any information found on such websites, and such information is not part of this quarterly report on Form 10-Q.
In the table above, “Total Return” refers to the return of the relevant index from December 31, 1997 to June 30, 2016; “Annualized Volatility” is a measure of the amount of variation or fluctuation in the returns of the relevant index. Annualized Volatility is calculated by taking the monthly standard deviation of the relevant index’s return and multiplying it by the square root of 12; and “Annualized Sharpe Ratio” is a measure of the total return of each relevant index adjusted by the risk-free interest rate (the 90-Day U.S. Treasury Bill yield) and the volatility of each index. Many investors consider volatility to be a measure of risk, and lower volatility of investment returns is considered a positive investment attribute as opposed to higher volatility. Annualized Sharpe Ratio is a standard measure for investors to compare two different investments or indexes that have different levels of volatility. If two indexes have the same total return, but one has lower Annualized Volatility, then its Annualized Sharpe Ratio will be higher. The higher the Annualized Sharpe Ratio, the better the risk-adjusted performance. Annualized Sharpe Ratio is calculated by taking the average monthly total return of the relevant index and subtracting the then current yield on the 90-Day U.S. Treasury Bill. The annualized return of this series is then divided by the Annualized Volatility of this series, and this result is the Annualized Sharpe Ratio for the relevant index. A higher Sharpe Ratio is not a guarantee that one investment or index will in the future produce better risk adjustment total returns, but USCF believes it is a useful tool for investors to consider when making investment decisions.
| 58 |
The following chart compares the hypothetical total return of the SDCI in comparison with the actual total return of three major indexes between June 30, 2006 and June 30, 2016.
Ten Year Comparison of Index Returns of the BCOM TR, S&P GSCI TR,
DBLCI OY TR, and the Hypothetical Returns of the SDCI TR
(6/30/2006-6/30/2016)
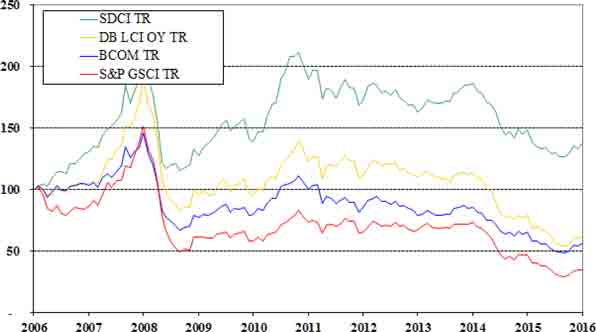
Source: SHIM, Bloomberg
PAST PERFORMANCE IS NOT NECESSARILY INDICATIVE OF FUTURE RESULTS
| 59 |
The following chart compares the hypothetical total return of the SDCI in comparison with the actual total return of three major indexes over a five year period.
Five Year Comparison of Index Returns of the BCOM TR, S&P GSCI TR,
DBLCI OY TR, and the Hypothetical Returns of the SDCI TR
(6/30/2011-6/30/2016)
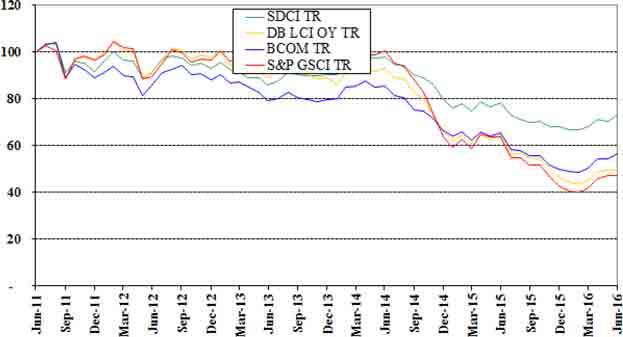
Source: SHIM, Bloomberg
PAST PERFORMANCE IS NOT NECESSARILY INDICATIVE OF FUTURE RESULTS
SCI
The SCI is a single-commodity index designed to be an investment benchmark for copper as an asset class. The SCI is composed of copper futures contracts on the COMEX exchange. The SCI attempts to maximize backwardation and minimize contango while utilizing contracts in liquid portions of the futures curve.
The SCI is rules-based and is rebalanced monthly based on observable price signals described below in the section “Contract Selection and Weighting.” In this context, the term “rules-based” is meant to indicate that the composition of the SCI in any given month will be determined by quantitative formulas relating to the prices of the futures contracts that are included in the SCI. Such formulas are not subject to adjustment based on other factors.
The overall return on the SCI is generated by two components: (i) uncollateralized returns from the Benchmark Component Copper Futures Contracts comprising the SCI, and (ii) a daily fixed income return reflecting the interest earned on hypothetical 3-month Treasuries, calculated using the weekly auction rate for 3-Month Treasuries published by the U.S. Department of the Treasury. SHIM is the owner of the SCI.
Table 1 below lists the Futures Exchange on which the Eligible Copper Futures Contracts are listed and quotation details. Table 2 lists the Eligible Copper Futures Contracts, their sector designation and maximum allowable tenor.
TABLE 1
| Commodity | Designated Contract | Exchange | Units | Quote | ||||
| Copper | Copper | COMEX | 25,000 lbs | U.S. cents/pound |
TABLE 2
| Commodity Name | Commodity Symbol |
Allowed Contracts | Max. Tenor | |||
| Copper | HG | All 12 calendar months | 19 |
| 60 |
Prior to the end of each month, SHIM determines the composition of the SCI and provides such information to the NYSE Arca. Values of the SCI are computed by the NYSE Arca and disseminated approximately every fifteen (15) seconds from 8:00 a.m. to 5:00 p.m., New York City time, which also publishes a daily SCI value at approximately 5:30 p.m., New York City time, under the index ticker symbol “SCI”. Only settlement and last-sale prices are used in the SCI’s calculation, bids and offers are not recognized – including limit-bid and limit-offer price quotes. Where no last-sale price exists, typically in the more deferred contract months, the previous days’ settlement price is used. This means that the underlying SCI may lag its theoretical value. This tendency to lag is evident at the end of the day when the SCI value is based on the settlement prices of the Benchmark Component Copper Futures Contracts, and explains why the underlying SCI often closes at or near the high or low for the day.
Composition of the SCI
The composition of the SCI on any given day, as determined and published by SHIM, is determinative of the benchmark for CPER. Neither the index methodology for the SCI nor any set of procedures, however, are capable of anticipating all possible circumstances and events that may occur with respect to the SCI and the methodology for its composition, weighting and calculation. Accordingly, a number of subjective judgments must be made in connection with the operation of the SCI that cannot be adequately reflected in this description of the SCI. All questions of interpretation with respect to the application of the provisions of the index methodology for the SCI, including any determinations that need to be made in the event of a market emergency or other extraordinary circumstances, will be resolved by SHIM.
Contract Expirations
Because the SCI is comprised of actively traded contracts with scheduled expirations, it can be calculated only by reference to the prices of contracts for specified expiration, delivery or settlement periods, referred to as contract expirations. The contract expirations included in the SCI for each commodity during a given year are designated by SHIM, provided that each contract must be an active contract. An active contract for this purpose is a liquid, actively-traded contract expiration, as defined or identified by the relevant trading facility or, if no such definition or identification is provided by the relevant trading facility, as defined by standard custom and practice in the industry.
If a futures exchange, such as the COMEX, ceases trading in all contract expirations relating to an Eligible Copper Futures Contract, SHIM may designate a replacement contract. The replacement contract must satisfy the eligibility criteria for inclusion in the SCI. To the extent practicable, the replacement will be effected during the next monthly review of the composition of the SCI. If that timing is not practicable, SHIM will determine the date of the replacement based on a number of factors, including the differences between the existing Benchmark Component Copper Futures Contract and the replacement contract with respect to contractual specifications and contract expirations.
The designation of a replacement contract could affect the value of the SCI, either positively or negatively, depending on the price of the contract that is eliminated and the prices of the replacement contract. It is impossible, however, to predict the effect of these changes, if they occur, on the value of the SCI.
Contract Selection and Weighting
Weights for each of the Benchmark Component Copper Futures Contracts are determined for the next month. The methodology used to calculate the SCI weighting is based solely on quantitative data using observable futures prices and is not subject to human bias.
The monthly weighting selection is a process based upon examination of the relevant futures prices for copper:
1) On the Selection Date:
| a) | the copper futures curve is assessed to be in either backwardation or contango (as discussed below); and |
| b) | the annualized percentage price difference between the Closest-to-Expiration Eligible Copper Futures Contract and each of the Next Four Eligible Copper Futures Contracts is calculated. For each month, the Closest-to-Expiration Eligible Copper Futures Contract and the Next Four Eligible Copper Futures Contracts are as follows: |
| Month | January | February | March | April | May | June | July | August | September | October | November | December | |||||||||||||
| Closest-to-Expiration | |||||||||||||||||||||||||
| Eligible | |||||||||||||||||||||||||
| Futures | |||||||||||||||||||||||||
| Contract | February | March | April | May | June | July | August | September | October | November | December | January | |||||||||||||
| Next Four | April | May | June | July | August | September | October | November | December | January | February | March | |||||||||||||
| Eligible | May | June | July | August | September | October | November | December | January | February | March | April | |||||||||||||
| Futures | June | July | August | September | October | November | December | January | February | March | April | May | |||||||||||||
| Contracts | July | August | September | October | November | December | January | February | March | April | May | June |
| 61 |
A futures curve in backwardation occurs when the price of the closest-to-expiration contract is greater than or equal to the price of the third closest-to-expiration contract. These contracts will have expirations that are approximately two months apart. A curve not in backwardation is defined as being in contango, which occurs when the price of the closest-to-expiration contract is less than the price of the third closest-to-expiration contract.
2a) Backwardation: If the copper futures curve is in backwardation on the Selection Date, the SCI takes positions in the two Eligible Copper Futures Contracts with the highest annualized percentage price difference, each weighted at 50%.
A hypothetical example is included below, with the two selected Eligible Copper Futures Contracts shaded below (the selected commodities are ranked 1 and 2):
| Copper Futures Contract | Expiration Date | Contract Price | ||||
| Nearest-to-maturity | November - 10 | 374.00 | ||||
| Third nearest-to-maturity | January - 11 | 365.20 | ||||
| Eligible Copper Futures Contracts | Price | Annualized Percentage Price Difference | Ranking | |||||||||
| January-11 | 365.20 | 10.47 | % | 1 | ||||||||
| February-11 | 363.00 | 10.15 | % | 4 | ||||||||
| March-11 | 359.70 | 10.36 | % | 3 | ||||||||
| April-11 | 356.70 | 10.41 | % | 2 | ||||||||
2b) Contango: If the copper futures curve is in contango, then the SCI takes positions in three Eligible Copper Futures Contracts, as follows: first, the SCI takes positions in the two Eligible Copper Futures Contracts with the highest annualized percentage price difference, each weighted at 25%; then, the SCI also takes a position in the closest-to-expiration December Eligible Future Contract that has expiration more distant than the fourth of the Next Four Eligible Copper Futures Contracts for the applicable month, which position is weighted at 50%.
A hypothetical example is included below, with the next two selected Eligible Copper Futures Contracts shaded below (the selected commodities are ranked 1 – 2):
| Copper Futures Contract | Expiration Date | Contract Price | ||||
| Nearest-to-maturity | November - 10 | 374.00 | ||||
| Third nearest-to-maturity | January - 11 | 375.70 | ||||
| Eligible Copper Futures Contracts | Price | Annualized Percentage Price Difference | Ranking | |||||||||
| January-11 | 375.70 | -1.97 | % | 4 | ||||||||
| February-11 | 376.00 | -1.78 | % | 3 | ||||||||
| March-11 | 376.30 | -1.59 | % | 2 | ||||||||
| April-11 | 376.40 | -1.37 | % | 1 | ||||||||
| 62 |
Due to the dynamic monthly weighting calculation, the individual weights will vary-over time, depending on the price observations each month. The Selection Date for the SCI is the last business day of the calendar month.
The following graph shows the weights of the Benchmark Component Copper Futures Contracts selected for inclusion in the SCI as of June 30, 2016.
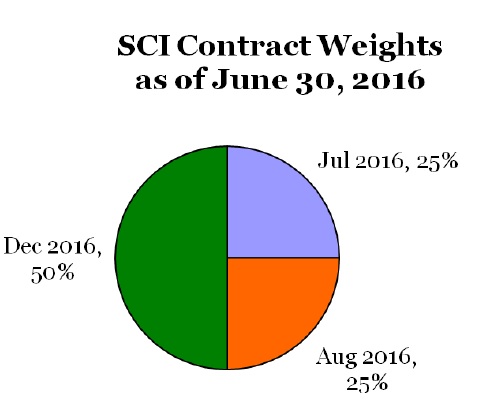
Portfolio Construction
The portfolio rebalancing takes place during the Rebalancing Period. At the end of each of the days in the Rebalancing Period one fourth of the prior month portfolio positions are replaced by the new weights for the Benchmark Component Copper Futures Contracts determined on the Selection Date.
SCI Total Return Calculation
The value of the SCI on any business day is equal to the product of (i) the value of the SCI on the immediately preceding business day multiplied by (ii) one plus the sum of the day’s returns for another version of the SCI known as the SummerHaven Dynamic Copper Index Excess Return (“SCI ER”) (explained below) and one business day’s interest from the hypothetical Treasury Bill portfolio. The value of the SCI will be calculated and published by the NYSE Arca.
SCI Base Level
The SCI was set to 100 on January 2, 1991.
SCI ER Calculation
The total return of the SCI ER reflects the percentage change of the market values of the underlying commodity futures. During the Rebalancing Period, the SCI changes its contract holdings and weightings during a four day period. The value of the SCI ER at the end of a business day “t” is equal to the SCI ER value on day “t -1” multiplied by the sum of the daily percentage price changes of each commodity future factoring in each respective commodity future’s notional holding on day “t -1”.
| 63 |
Rebalancing Period
The SCI is rebalanced during the first 4 business days of each calendar month, when existing positions are placed by new positions and weightings based on the signals used for contract selection on the last business day of the prior calendar month as outlined above.
Hypothetical Performance of the SCI
The table and chart below show the hypothetical performance of the SCI from January 1, 2006 through June 30, 2016.
HYPOTHETICAL PERFORMANCE RESULTS HAVE MANY INHERENT LIMITATIONS, SOME OF WHICH ARE DESCRIBED BELOW. NO REPRESENTATION IS BEING MADE THAT CPER WILL OR IS LIKELY TO ACHIEVE PROFITS OR LOSSES SIMILAR TO THOSE SHOWN. IN FACT, THERE ARE FREQUENTLY SHARP DIFFERENCES BETWEEN HYPOTHETICAL PERFORMANCE RESULTS AND THE ACTUAL RESULTS ACHIEVED BY ANY PARTICULAR TRADING PROGRAM.
ONE OF THE LIMITATIONS OF HYPOTHETICAL PERFORMANCE RESULTS IS THAT THEY ARE GENERALLY PREPARED WITH THE BENEFIT OF HINDSIGHT. IN ADDITION, HYPOTHETICAL TRADING DOES NOT INVOLVE FINANCIAL RISK, AND NO HYPOTHETICAL TRADING RECORD CAN COMPLETELY ACCOUNT FOR THE IMPACT OF FINANCIAL RISK IN ACTUAL TRADING. FOR EXAMPLE, THE ABILITY TO WITHSTAND LOSSES OR TO ADHERE TO A PARTICULAR TRADING PROGRAM IN SPITE OF TRADING LOSSES ARE MATERIAL POINTS WHICH CAN ALSO ADVERSELY AFFECT ACTUAL TRADING RESULTS. THERE ARE NUMEROUS OTHER FACTORS RELATED TO THE MARKETS IN GENERAL OR TO THE IMPLEMENTATION OF ANY SPECIFIC TRADING PROGRAM WHICH CANNOT BE FULLY ACCOUNTED FOR IN THE PREPARATION OF HYPOTHETICAL PERFORMANCE RESULTS AND ALL OF WHICH CAN ADVERSELY AFFECT ACTUAL TRADING RESULTS.
Since the SCI was launched on November 4, 2010, there is no actual performance history of the SCI to present. However, the components of the SCI and the weighting of the components of the SCI are established each month based on purely quantitative data that is not subject to revisions based on other external factors. This data is available for periods prior to November 4, 2010. As a result, the tables below reflects how the SCI would have performed from January 1, 2006 through June 30, 2016 had it been in effect during such time period. The performance data does not reflect any reinvestment or distribution profits, commission charges, management fees or other expenses that would have been incurred in connection with operating and managing a commodity pool designed to track the SCI. Such fees and expenses would reduce the performance returns shown in the table below.
Hypothetical Performance Results for the SCI for the period
from January 1, 2006 through June 30, 2016
| Year | Ending Level* | Annual Return | ||||||
| 2006 | 911.128 | 65.39 | % | |||||
| 2007 | 1,059.165 | 16.25 | % | |||||
| 2008 | 497.182 | (53.06 | )% | |||||
| 2009 | 1,153.122 | 131.93 | % | |||||
| 2010 | 1,491.949 | 29.38 | % | |||||
| 2011 | 1,164.510 | (21.95 | )% | |||||
| 2012 | 1,223.150 | 5.04 | % | |||||
| 2013 | 1,114.30 | (8.90 | )% | |||||
| 2014 | 937.33 | (15.88 | )% | |||||
| 2015 | 704.39 | (24.85 | )% | |||||
| 2016 (YTD) | 720.09 | 2.23 | % | |||||
| * | The “base level” for the SCI was set at 100 on January 2, 1991. The “Ending Level” represents the value of the components of the SCI on the last trading day of each year and is used to illustrate the cumulative performance of the SCI. |
PAST PERFORMANCE IS NOT NECESSARILY INDICATIVE OF FUTURE RESULTS
| 64 |
SummerHaven Copper Index Year-Over-Year
Hypothetical Total Returns (1/1/2006-6/30/2016 YTD)
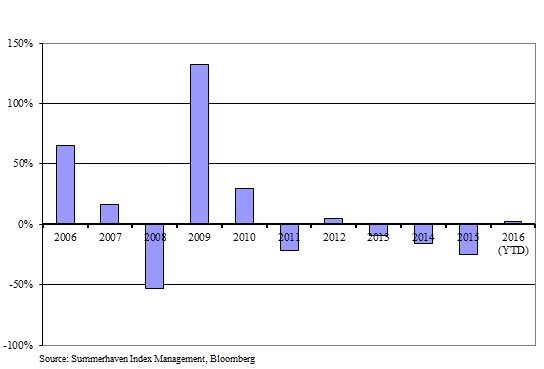
PAST PERFORMANCE IS NOT NECESSARILY INDICATIVE OF FUTURE RESULTS
The following table compares the hypothetical total return of the SCI in comparison with the actual total return of a major index from December 31, 1997 through June 30, 2016.
| Hypothetical and Historical Results for the period from | ||||||||||||
| December 31, 1997 through June 30, 2016 | ||||||||||||
| BCOMHGTR | Spot Copper (less storage) | SCI TR | ||||||||||
| Total return | 210.87 | % | 66.32 | % | 359.83 | % | ||||||
| Average Annual return (total) | 12.89 | % | 9.00 | % | 15.61 | % | ||||||
| Annualized volatility | 27.03 | % | 26.02 | % | 26.44 | % | ||||||
| Annualized Sharpe ratio | 0.40 | 0.27 | 0.50 | |||||||||
Source: SHIM, Bloomberg
PAST PERFORMANCE IS NOT NECESSARILY INDICATIVE OF FUTURE RESULTS
The table above shows the performance of the SCI from December 31, 1997 through June 30, 2016 in comparison with a traditional commodity index and spot copper prices: the Bloomberg Copper Sub index Total ReturnSM (BCOMHGTR), (formerly known as Bloomberg Copper Sub index Total Return as of July 1, 2014) and spot copper prices less warehouse storage rents. The Bloomberg Copper Sub index Total ReturnSM includes the contract in the Bloomberg Commodity Index Total Return that relates to a single commodity, copper (currently the Copper High Grade futures contract traded on the COMEX). The data for the SCI Total Return Index is derived by using the SCI’s calculation methodology with historical prices for the futures contracts comprising the SCI. The information about the index above comes from publicly-available material about such index but is not designed to provide a thorough overview of the methodology of such index. The index noted above does not have investment objectives identical to the SCI. As a result, there are inherent limitations in comparing such performance against the SCI. For more information about the index and its methodologies, please refer to the material published by the sponsor of the Bloomberg Copper Sub index Total Return which may be found on its website. USCF is not responsible for any information found on such website, and such information is not part of this quarterly report on Form 10-Q.
| 65 |
In the table above, “Total Return” refers to the return of the relevant index from December 31, 1997 to June 30, 2016; “Annualized Volatility” is a measure of the amount of variation or fluctuation in the returns of the relevant index. Annualized Volatility is calculated by taking the monthly standard deviation of the relevant index’s return and multiplying it by the square root of 12; and “Annualized Sharpe Ratio” is a measure of the total return of each relevant index adjusted by the risk-free interest rate (the 90-Day U.S. Treasury Bill yield) and the volatility of each index. Many investors consider volatility to be a measure of risk, and lower volatility of investment returns is considered a positive investment attribute as opposed to higher volatility. Annualized Sharpe Ratio is a standard measure for investors to compare two different investments or indexes that have different levels of volatility. If two indexes have the same total return, but one has lower Annualized Volatility, then its Annualized Sharpe Ratio will be higher. The higher the Annualized Sharpe Ratio, the better the risk-adjusted performance. Annualized Sharpe Ratio is calculated by taking the average monthly total return of the relevant index and subtracting the then current yield on the 90-Day U.S. Treasury Bill. The annualized return of this series is then divided by the Annualized Volatility of this series, and this result is the Annualized Sharpe Ratio for the relevant index. A higher Sharpe Ratio is not a guarantee that one investment or index will in the future produce better risk adjustment total returns, but USCF believes it is a useful tool for investors to consider when making investment decisions.
The following chart compares the hypothetical total return of the SCI in comparison with the actual total return of a major index and spot copper prices (less storage cost) between June 30, 2006 and June 30, 2016.
Ten Year Comparison of Index Returns of
BCOMHGTR, Spot Copper price, Spot Copper Price less Storage
Cost, and the Hypothetical Returns of the SCI TR (6/30/2006-6/30/2016)
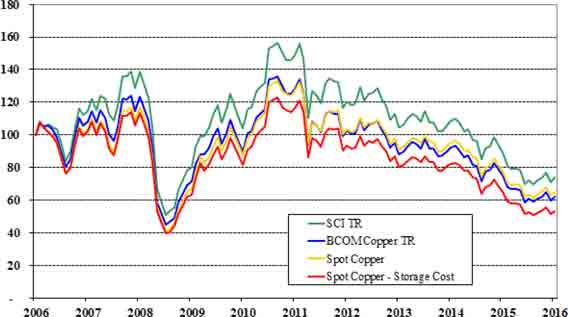
Source: SHIM, Bloomberg, LME
PAST PERFORMANCE IS NOT NECESSARILY INDICATIVE OF FUTURE RESULTS
| 66 |
The following chart compares the hypothetical total return of the SCI in comparison with the actual total return of two major indices and spot copper prices (less storage cost) over a 5 year period.
Five Year Comparison of Index Returns of
BCOMHGTR, Spot Copper price, Spot Copper Price
less Storage Cost, and the Hypothetical Returns of the SCI TR (6/30/11-6/30/16)
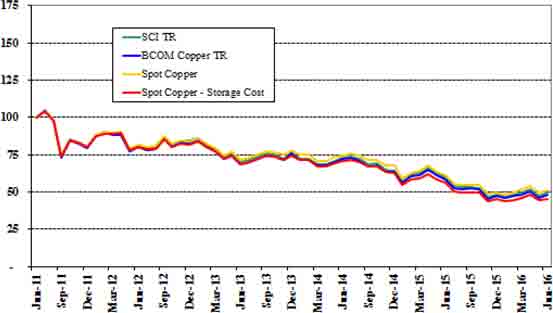
Source: SHIM, Bloomberg, LME
PAST PERFORMANCE IS NOT NECESSARILY INDICATIVE OF FUTURE RESULTS
SDAI
The SDAI is an agricultural sector index designed to broadly represent major agricultural commodities while overweighting the components that are assessed to be in a low inventory state and underweighting the components assessed to be in a high inventory state.
The SDAI consists of fourteen agricultural markets: soybeans, corn, soft red winter wheat, hard red winter wheat, soybean oil, soybean meal, canola, sugar, cocoa, coffee, cotton, live cattle, feeder cattle and lean hogs. Each agricultural commodity is assigned a base weight based on an assessment of market liquidity and the commodity’s overall economic importance. Each commodity is U.S. dollar based, with the exception of canola, which is quoted in Canadian dollars and converted to U.S. dollars for the purpose of the SDAI calculation.
Academic research by Professors Gorton, Rouwenhorst and Hayashi has shown that commodities in relatively low inventory states tend to have higher returns than commodities in relatively high inventory states. Furthermore, relative inventory comparisons can be estimated by the price-based signals momentum and basis. Momentum is the percentage price change in a commodity over the previous year. Basis is the annualized percentage difference between the nearest-to-maturity contract and the second nearest-to-maturity contract. Using these price-based signals, agricultural commodities determined to be in low inventory state will be weighted more heavily, and agricultural commodities in high inventory state will be weighted less heavily during any given month.
The SDAI is rules-based and rebalanced monthly based on observable price signals described above. In this context, the term “rules-based” is meant to indicate that the composition of the SDAI in any given month will be determined by quantitative formulas relating to the prices of the futures contracts that relate to the commodities that are included in the SDAI. Such formulas are not subject to adjustment based on other factors.
The overall return on the SDAI is generated by two components: (i) uncollateralized returns from the Benchmark Component Agriculture Futures Contracts comprising the SDAI and (ii) a daily fixed income return reflecting the interest earned on a hypothetical 3-month U.S. Treasury Bill collateral portfolio, calculated using the weekly auction rate for the 3-Month U.S. Treasury Bills published by the U.S Department of the Treasury. SHIM is the owner of the SDAI.
| 67 |
Table 1 below lists the eligible agricultural commodities, the relevant Futures Exchange on which each Benchmark Component Agriculture Futures Contract is listed and quotation details. Table 2 lists the Benchmark Component Agriculture Futures Contracts, their sector designation and maximum allowable tenor.
TABLE 1
| Commodity | Designated Contract | Exchange | Units | Quote | ||||
| Soybeans | Soybeans | CBOT | 5,000 bushels | U.S. cents/bushel | ||||
| Corn | Corn | CBOT | 5,000 bushels | U.S. cents/bushel | ||||
| Soft Red Winter Wheat | Soft Red Winter Wheat | CBOT | 5,000 bushels | U.S. cents/bushel | ||||
| Hard Red Winter Wheat | Hard Red Winter Wheat | KCBT | 5,000 bushels | U.S. cents/bushel | ||||
| Bean Oil | Bean Oil | CBOT | 60,000 lbs. | U.S. cents/pound | ||||
| Soybean Meal | Soybean Meal | CBOT | 100 tons | USD/ton | ||||
| Coffee | Coffee “C” | ICE-US | 37,500 lbs. | U.S. cents/pound | ||||
| Cocoa | Cocoa | ICE-US | 10 metric tons | USD/metric ton | ||||
| Sugar | World Sugar No. 11 | ICE-US | 112,000 lbs. | U.S. cents/pound | ||||
| Canola | Canola | ICE- CANADA | 20 metric tonnes | $CAD/tonne | ||||
| Cotton | Cotton | ICE-US | 50,000 lbs. | U.S. cents/pound | ||||
| Feeder Cattle | Feeder Cattle | CME | 50,000 lbs. | U.S. cents/pound | ||||
| Live Cattle | Live Cattle | CME | 40,000 lbs. | U.S. cents/pound | ||||
| Lean Hogs | Lean Hogs | CME | 40,000 lbs. | U.S. cents/pound |
TABLE 2
| Commodity Name | Commodity Symbol |
Allowed Contracts | Max. Tenor | |||||
| Soybeans | S | Jan, Mar, May, July, Aug, Sep, Nov | 12 | |||||
| Corn | C | Mar, May, July, Sep, Dec | 12 | |||||
| Soft Red Winter Wheat | W | Mar, May, July, Sep, Dec | 7 | |||||
| Hard Red Winter Wheat | KW | Mar, May, July, Sep, Dec | 5 | |||||
| Bean Oil | BO | Jan, Mar, May, July, Aug, Sep, Oct, Dec | 7 | |||||
| Soybean Meal | SM | Jan, Mar, May, July, Aug, Sep, Oct, Dec | 7 | |||||
| Coffee | KC | Mar, May, July, Sep, Dec | 7 | |||||
| Cocoa | CC | Mar, May, July, Sep, Dec | 7 | |||||
| Sugar | SB | Mar, May, July, Oct, | 7 | |||||
| Canola | RS | Jan, Mar, May, July, Nov | 5 | |||||
| Cotton | CT | Mar, May, July, Dec | 7 | |||||
| Feeder Cattle | FC | Jan, Mar, April, May, Aug, Sep, Oct, Nov | 5 | |||||
| Live Cattle | LC | Feb, April, June, Aug, Oct, Dec | 5 | |||||
| Lean Hogs | LH | Feb, April, June, July, Aug, Oct, Dec | 5 | |||||
| 68 |
Prior to the end of each month, SHIM determines the composition of the SDAI and provides such information to the NYSE Arca. Values of the SDAI are computed by the NYSE Arca and disseminated approximately every fifteen (15) seconds from 8:00 a.m. to 5:00 p.m., New York City time, which also publishes a daily SDAI value at approximately 5:30 p.m., New York City time, under the index ticker symbol “SDAITR”. Only settlement and last-sale prices are used in the SDAI’s calculation, bids and offers are not recognized; including limit-bid and limit-offer price quotes. Where no last-sale price exists, typically in the more deferred contract months, the previous days’ settlement price is used. This means that the underlying SDAI may lag its theoretical value. This tendency to lag is evident at the end of the day when the SDAI value is based on the settlement prices of the Benchmark Component Agriculture Futures Contracts, and explains why the underlying SDAI often closes at or near the high or low for the day.
Currency Conversion
Canola seed futures trade on the ICE Futures Canada and are denominated in Canadian dollars. Canola futures prices are divided by the USD/CAD foreign exchange spot price for purposes of index calculation and commodity weighting calculations. The USD/CAD price used for canola futures for the daily SDAI value is the 3:00 p.m. EST USD/CAD price quoted by Bloomberg under currency ticker “USDCAD F150”.
Composition of the SDAI
The composition of the SDAI on any given day, as determined and published by SHIM, is determinative of the benchmark for USAG. Neither the SDAI methodology nor any set of procedures, however, are capable of anticipating all possible circumstances and events that may occur with respect to the SDAI and the methodology for its composition, weighting and calculation. Accordingly, a number of subjective judgments must be made in connection with the operation of the SDAI that cannot be adequately reflected in this description of the SDAI. All questions of interpretation with respect to the application of the provisions of the SDAI methodology, including any determinations that need to be made in the event of a market emergency or other extraordinary circumstances, will be resolved by SHIM.
Contract Expirations
Because the SDAI is comprised of actively traded contracts with scheduled expirations, it can be calculated only by reference to the prices of contracts for specified expiration, delivery or settlement periods, referred to as contract expirations. The contract expirations included in the SDAI for each commodity during a given year are designated by SHIM, provided that each contract must be an active contract. An active contract for this purpose is a liquid, actively-traded contract expiration, as defined or identified by the relevant trading facility or, if no such definition or identification is provided by the relevant trading facility, as defined by standard custom and practice in the industry.
If a Futures Exchange ceases trading in all contract expirations relating to a particular Benchmark Component Agriculture Futures Contract, SHIM may designate a replacement contract on the particular agricultural commodity. The replacement contract must satisfy the eligibility criteria for inclusion in the SDAI. To the extent practicable, the replacement will be effected during the next monthly review of the composition of the SDAI. If that timing is not practicable, SHIM will determine the date of the replacement based on a number of factors, including the differences between the existing Benchmark Component Agriculture Futures Contract and the replacement contract with respect to contractual specifications and contract expirations.
If a Benchmark Component Agriculture Futures Contract is eliminated and there is no replacement contract, the underlying agricultural commodity will necessarily drop out of the SDAI. The designation of a replacement contract, or the elimination of an agricultural commodity from the SDAI because of the absence of a replacement contract, could affect the value of the SDAI, either positively or negatively, depending on the price of the contract that is eliminated and the prices of the remaining contracts. It is impossible, however, to predict the effect of these changes, if they occur, on the value of the SDAI.
| 69 |
Commodity Weighting
Each of the Benchmark Component Agriculture Futures Contracts will remain in the SDAI from month to month. Weights for each of the Benchmark Component Agriculture Futures Contracts in the SDAI are determined for the next month. The methodology used to calculate the SDAI weighting is based solely on quantitative data using observable futures prices and is not subject to human bias.
The monthly weighting selection is a three-step process based upon examination of the relevant futures prices for each agricultural commodity:
| 1) | The annualized percentage price difference between the closest-to-expiration Benchmark Component Agriculture Futures Contract and the next closest-to-expiration Benchmark Component Agriculture Futures Contract is calculated for each of the 14 eligible agricultural commodities on the fifth business day prior to the first business day of the next calendar month (the “Selection Date”). The four agricultural commodities with the highest percentage price difference are selected. |
| 2) | For the remaining 10 eligible agricultural commodities, the percentage price change of each agricultural commodity over the previous year is calculated, as measured by the change in the price of the closest-to- expiration Benchmark Component Agriculture Futures Contract on the Selection Date from the price of the closest-to-expiration Benchmark Component Agriculture Futures Contract a year prior to the Selection Date. The three agricultural commodities with the highest percentage price change are selected. |
| 3) | For the seven commodities selected through basis (step 1) and momentum (step 2), each commodity weight is increased by 2% above its base weighting for the following month. For the remaining seven commodities not selected, each commodity weight is decreased by 2% below its base weighting for the following month. |
Due to the dynamic monthly agricultural commodity weighting calculation, the individual agricultural commodity weights will vary over time, depending on the price observations each month. The Selection Date for the SDAI is the fifth business day prior to the first business day of the next calendar month.
The following graph shows the agricultural commodity weights of the agricultural commodities selected for inclusion in the SDAI as of June 30, 2016.
SDAI Commodity Weights
as of June 30, 2016
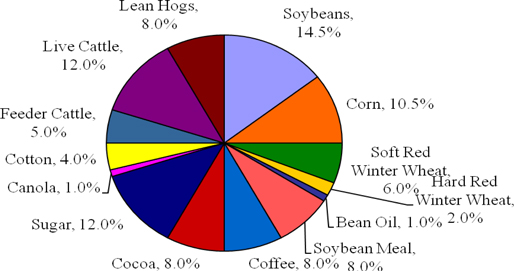
| 70 |
Contract Selection
For each agricultural commodity in the SDAI, the index selects a specific Benchmark Component Agriculture Futures Contract with a tenor (i.e., contract month) among the eligible tenors (the range of contract months) based upon the relative prices of the Benchmark Component Agriculture Futures Contracts within the eligible range of contract months. The previous notwithstanding, the contract expiration is not changed for that month if a Benchmark Component Agriculture Futures Contract remains in the SDAI, as long as the contract does not enter expire or enter its notice period in the subsequent month.
Portfolio Construction
The portfolio rebalancing takes place during the Rebalancing Period. At the end of each of the days in the last four business days of each month (the “Rebalancing Period”) one fourth of the prior month portfolio positions are replaced by the new commodity weights for the commodity contracts determined on the Selection Date.
Currency Conversion
Canola futures are denominated and quoted in Canadian dollars.
SDAI Total Return Calculation
The value of the SDAI on any business day is equal to the product of (i) the value of the SDAI on the immediately preceding business day multiplied by (ii) one plus the sum of the day’s returns for another version of the SDAI known as the SummerHaven Dynamic Agriculture Index Excess Return (“SDAI ER”) (explained below) and one business day’s interest from the hypothetical Treasury Bill portfolio. The value of the Agriculture will be calculated and published by the NYSE Arca.
SDAI Base Level
The SDAI was set to 100 on January 2, 1991.
SDAI ER Calculation
The total return of the SDAI ER reflects the percentage change of the market values of the underlying Benchmark Component Agriculture Futures Contracts. During the Rebalancing Period, the SDAI changes its contract holdings and weightings during a four day period. The value of the SDAI ER at the end of a business day “t” is equal to the SDAI ER value on day “t -1” multiplied by the sum of the daily percentage price changes of each commodity future factoring in each respective commodity future’s notional holding on day “t -1”.
Rebalancing Period
During the Rebalancing Period, existing positions are replaced by new positions based on the signals used for contract selection as outlined above. At the end of the first day of the Rebalancing Period, the signals are observed and on the second day a new portfolio is constructed that is equally weighted in terms of notional positions in the newly selected contracts.
The table and chart below show the hypothetical performance of the SDAI from January 1, 2006 through June 30, 2016.
HYPOTHETICAL PERFORMANCE RESULTS HAVE MANY INHERENT LIMITATIONS, SOME OF WHICH ARE DESCRIBED BELOW. NO REPRESENTATION IS BEING MADE THAT USAG WILL OR IS LIKELY TO ACHIEVE PROFITS OR LOSSES SIMILAR TO THOSE SHOWN. IN FACT, THERE ARE FREQUENTLY SHARP DIFFERENCES BETWEEN HYPOTHETICAL PERFORMANCE RESULTS AND THE ACTUAL RESULTS ACHIEVED BY ANY PARTICULAR TRADING PROGRAM.
ONE OF THE LIMITATIONS OF HYPOTHETICAL PERFORMANCE RESULTS IS THAT THEY ARE GENERALLY PREPARED WITH THE BENEFIT OF HINDSIGHT. IN ADDITION, HYPOTHETICAL TRADING DOES NOT INVOLVE FINANCIAL RISK, AND NO HYPOTHETICAL TRADING RECORD CAN COMPLETELY ACCOUNT FOR THE IMPACT OF FINANCIAL RISK IN ACTUAL TRADING. FOR EXAMPLE, THE ABILITY TO WITHSTAND LOSSES OR TO ADHERE TO A PARTICULAR TRADING PROGRAM IN SPITE OF TRADING LOSSES ARE MATERIAL POINTS WHICH CAN ALSO ADVERSELY AFFECT ACTUAL TRADING RESULTS. THERE ARE NUMEROUS OTHER FACTORS RELATED TO THE MARKETS IN GENERAL OR TO THE IMPLEMENTATION OF ANY SPECIFIC TRADING PROGRAM WHICH CANNOT BE FULLY ACCOUNTED FOR IN THE PREPARATION OF HYPOTHETICAL PERFORMANCE RESULTS AND ALL OF WHICH CAN ADVERSELY AFFECT ACTUAL TRADING RESULTS.
| 71 |
USCF HAS HAD LITTLE OR NO EXPERIENCE IN TRADING ACTUAL ACCOUNTS FOR CUSTOMERS. BECAUSE THERE ARE NO ACTUAL TRADING RESULTS TO COMPARE TO THE HYPOTHETICAL PERFORMANCE RESULTS, CUSTOMERS SHOULD BE PARTICULARLY WARY OF PLACING UNDUE RELIANCE ON THESE HYPOTHETICAL PERFORMANCE RESULTS.
Since the SDAI was launched on September 23, 2010, there is only actual performance history of the SDAI from that date to the present. However, the components of the SDAI and the weighting of the components of the SDAI are established each month based on purely quantitative data that is not subject to revisions based on other external factors. This data is available for periods prior to September 23, 2010. As a result, the table below reflects how the SDAI would have performed from January 1, 2006 through June 30, 2016 had it been in effect during such time period. The performance data does not reflect any reinvestment or distribution of profits, commission charges, management fees or other expenses that would have been incurred in connection with operating and managing a commodity pool designed to track the SDAI. Such fees and expenses would reduce the performance returns shown in the table below.
Hypothetical Performance Results for the period
from January 1, 2006 through June 30, 2016
| Year | Ending Level* | Annual Return | ||||||
| 2006 | 259.773 | 12.14 | % | |||||
| 2007 | 315.849 | 21.59 | % | |||||
| 2008 | 261.024 | (17.36 | )% | |||||
| 2009 | 282.237 | 8.13 | % | |||||
| 2010 | 377.898 | 33.89 | % | |||||
| 2011 | 348.780 | (7.71 | )% | |||||
| 2012 | 360.610 | 3.39 | % | |||||
| 2013 | 324.11 | (10.12 | )% | |||||
| 2014 | 329.88 | 1.78 | % | |||||
| 2015 | 285.01 | (13.60 | )% | |||||
| 2016 (YTD) | 306.27 | 7.46 | % | |||||
| * | The “base level” for the SDAI was set at 100 on January 2, 1991. The “Ending Level” represents the value of the components of the Index on the last trading day of each year and is used to illustrate the cumulative performance of the Index. |
PAST PERFORMANCE IS NOT NECESSARILY INDICATIVE OF FUTURE RESULTS
| 72 |
SummerHaven Dynamic Agriculture Index Year-Over-Year
Hypothetical Total Returns (1/1/2006-6/30/2016 YTD)
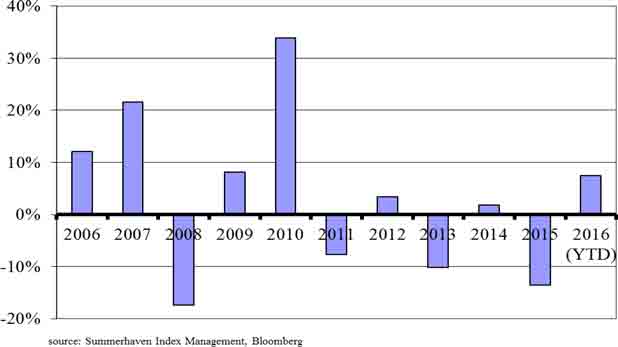
PAST PERFORMANCE IS NOT NECESSARILY INDICATIVE OF FUTURE RESULTS
The following table compares the hypothetical total return of the SDAI in comparison with the actual total return of three major indexes from December 31, 1997 through June 30, 2016.
| Hypothetical and Historical Results for the period from | ||||||||||||||||
| December 31, 1997 through June 30, 2016 | ||||||||||||||||
| BCOM Ag TR | S&P GSCI Ag TR | DB LCI OY Ag TR | SDAI TR | |||||||||||||
| Total return | 31.50 | % | (62.01 | )% | (14.28 | )% | 42.12 | % | ||||||||
| Average annual return (total) | 0.37 | % | (3.05 | )% | 1.38 | % | 3.24 | % | ||||||||
| Annualized volatility | 20.30 | % | 21.11 | % | 19.52 | % | 15.21 | % | ||||||||
| Annualized Sharpe ratio | (0.08 | ) | (0.23 | ) | (0.03 | ) | 0.08 | |||||||||
The table above shows the performance of the SDAI from December 31, 1997 through June 30, 2016 in comparison with three traditional agricultural commodities indices: the S&P GSCI® Agriculture Index Total Return, Bloomberg Sub index Total ReturnSM, and the Deutsche Bank Liquid Commodity Index-Optimum Yield Agriculture Total ReturnTM. The S&P GSCI® Agriculture Index Total Return comprises the commodities: Wheat (Chicago and Kansas), Corn, Soybeans, Cotton, Sugar, Coffee, and Cocoa, and is part of a series of sub-indices representing components of the S&P GSCI. The Bloomberg Agriculture Sub index Total ReturnSM is currently composed of seven futures contracts on agricultural commodities traded on U.S. exchanges. The Deutsche Bank Liquid Commodity Index-Optimum Yield Agriculture Total ReturnTM is designed to reflect the performance of certain corn, wheat, soybean and sugar futures contracts plus the returns from investing in 3 month U.S. Treasury Bills. The data for the SDAI is derived by using the SDAI’s calculation methodology with historical prices for the futures contracts comprising the SDAI. The information about each of the indices comes from publicly-available material about such indices but is not designed to provide a thorough overview of the methodology of each index. None of the indices have investment objectives identical to the SDAI. As a result, there are inherent limitations in comparing the performance of such indices against the SDAI. For more information about these indices and their methodologies, please refer to the material published by the sponsors of each such index which may be found on their websites. USAG is not responsible for any information found on such website, and such information is not part of this quarterly report on Form 10-Q.
| 73 |
In the table above, “Total Return” refers to the return of the relevant index from December 31, 1997 through June 30, 2016; “Annualized Volatility” is a measure of the amount of variation or fluctuation in the returns of the relevant index. Annualized Volatility is calculated by taking the monthly standard deviation of the relevant index’s return and multiplying it by the square root of 12; and “Annualized Sharpe Ratio” is a measure of the total return of each relevant index adjusted by the risk-free interest rate (the 90 Day U.S. Treasury Bill yield) and the volatility of each index. Many investors consider volatility to be a measure of risk, and lower volatility of investment returns is considered a positive investment attribute as opposed to higher volatility. Annualized Sharpe Ratio is a standard measure for investors to compare two different investments or indexes that have different levels of volatility. If two indexes have the same total return, but one has lower Annualized Volatility, then its Annualized Sharpe Ratio will be higher. The higher the Annualized Sharpe Ratio, the better the risk-adjusted performance. Annualized Sharpe Ratio is calculated by taking the average monthly total return of the relevant index and subtracting the then current yield on the 90 Day U.S. Treasury Bill. The annualized return of this series is then divided by the Annualized Volatility of this series, and this result is the Annualized Sharpe Ratio for the relevant index. A higher Sharpe Ratio is not a guarantee that one investment or index will in the future produce better risk adjustment total returns, but USCF believes it is a useful tool for investors to consider when making investment decisions.
The following chart compares the hypothetical total return of the SDAI in comparison with the actual total return of three major indexes between June 30, 2006 and June 30, 2016.
Ten Year Comparison of Index Returns of the BCOM Ag TR, S&P GSCI Ag TR,
DB LCI OY Ag TR, and the Hypothetical Returns of the SDAI TR
(6/30/06-6/30/16)
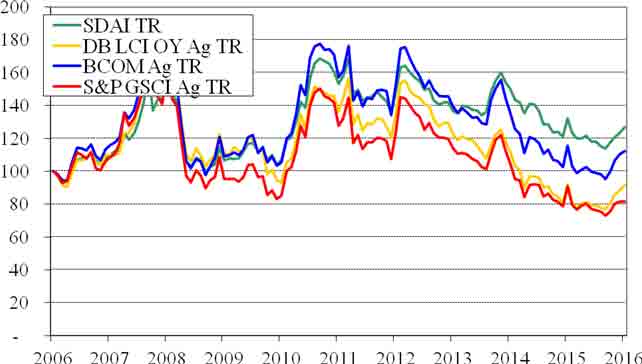
Source: SHIM, Bloomberg
PAST PERFORMANCE IS NOT NECESSARILY INDICATIVE OF FUTURE RESULTS
| 74 |
The following chart compares the hypothetical total return of the SDAI in comparison with the actual total return of three major indexes over a 5 year period.
Five Year Comparison of Index Returns of the DJ-UBS Ag TR, S&P GSCI Ag TR,
DB LCI OY Ag TR, and the Hypothetical Returns of the SDAI TR
(6/30/11-6/30/16)
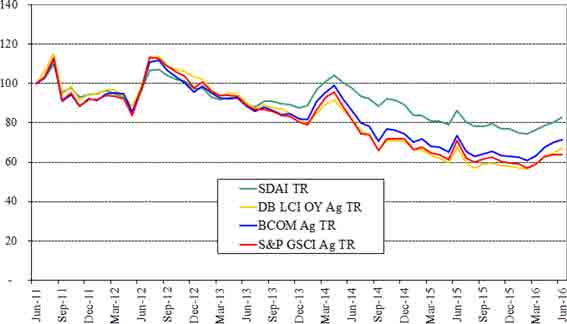
Source: SHIM, Bloomberg
PAST PERFORMANCE IS NOT NECESSARILY INDICATIVE OF FUTURE RESULTS
Critical Accounting Policies
Preparation of the condensed financial statements and related disclosures in compliance with accounting principles generally accepted in the United States of America requires the application of appropriate accounting rules and guidance, as well as the use of estimates. The Trust’s application of these policies involves judgments and actual results may differ from the estimates used.
USCF has evaluated the nature and types of estimates that it makes in preparing the Trust’s condensed financial statements and related disclosures and has determined that the valuation of Applicable Interests, which are not traded on a United States or internationally recognized futures exchange (such as forward contracts and OTC swaps) involves a critical accounting policy. The values which are used by each Trust Series for its Futures Contracts are provided by its commodity broker who uses market prices when available, while OTC swaps are valued based on the present value of estimated future cash flows that would be received from or paid to a third party in settlement of these derivative contracts prior to their delivery date and valued on a daily basis. In addition, each Trust Series estimates interest income on a daily basis using prevailing rates earned on its cash and cash equivalents. These estimates are adjusted to the actual amount received on a monthly basis and the difference, if any, is not considered material.
Liquidity and Capital Resources
None of the Trust Series has made, and does not anticipate making, use of borrowings or other lines of credit to meet its obligations. Each Trust Series has met, and it is anticipated that each Trust Series will continue to meet, its liquidity needs in the normal course of business from the proceeds of the sale of its investments, or from the Treasuries, cash and/or cash equivalents that it intends to hold at all times. Each Trust Series’ liquidity needs include: redeeming shares, providing margin deposits for its existing Futures Contracts or the purchase of additional Futures Contracts and posting collateral for its OTC swaps and payment of its expenses, summarized below under “Contractual Obligations.”
Each Trust Series currently generates cash primarily from: (i) the sale of baskets consisting of 50,000 shares (“Creation Baskets”) and (ii) income earned on Treasuries, cash and/or cash equivalents. Each Trust Series has allocated substantially all of its net assets to trading in Applicable Interests. Each Trust Series invests in Applicable Interests to the fullest extent possible without being leveraged or unable to satisfy its current or potential margin or collateral obligations with respect to its investments in Applicable Interests. A significant portion of each Trust Series’ NAV is held in Treasuries, cash and cash equivalents that are used as margin and as collateral for its trading in Applicable Interests. The balance of the assets is held in each Trust Series’ account at the Custodian and in Treasuries at the FCM. Income received from any investments in money market funds and Treasuries by a Trust Series will be paid to such Trust Series. During the six months ended June 30, 2016, each Trust Series’ expenses exceeded the income it earned and the cash earned from the sale of Creation Baskets and the redemption of Redemption Baskets.
| 75 |
Each Trust Series’ investments in Applicable Interests may be subject to periods of illiquidity because of market conditions, regulatory considerations and other reasons. For example, most commodity exchanges limit the fluctuations in futures contract prices during a single day by regulations referred to as “daily limits.” During a single day, no trades may be executed at prices beyond the daily limit. Once the price of a futures contract has increased or decreased by an amount equal to the daily limit, positions in the contracts can neither be taken nor liquidated unless the traders are willing to effect trades at or within the specified daily limit. Such market conditions could prevent a Trust Series from promptly liquidating its positions in Futures Contracts. During the six months ended June 30, 2016, none of the Trust Series purchased or liquidated any of its positions while daily limits were in effect; however, no Trust Series can predict whether such an event may occur in the future.
Prior to the initial offering of each Trust Series, all payments with respect to each Trust Series’ expenses are paid by USCF. None of the Trust Series has an obligation or intention to refund such payments made by USCF. USCF is under no obligation to pay any Trust Series’ future expenses. Since the initial offering of shares, each Trust Series has been responsible for expenses relating to: (i) management fees, (ii) brokerage fees and commissions, (iii) ongoing registration expenses in connection with offers and sales of its shares subsequent to the initial offering, (iv) other expenses, including tax reporting costs, (v) the fees of the Trustee in connection with its services as Delaware trustee of the Trust, (vi) fees and expenses of the independent directors of USCF and (vii) other extraordinary expenses not in the ordinary course of business, while USCF has been responsible for expenses relating to the fees of the Trust Series’ Marketing Agent, Administrator and Custodian, the trading advisory and licensing fees of SummerHaven and offering expenses relating to the initial offering of shares of each Trust Series. If USCF and each Trust Series are unsuccessful in raising sufficient funds to cover these respective expenses or in locating any other source of funding, one or more of the Trust Series could terminate and investors may lose all or part of their investment.
Market Risk
Trading in Applicable Interests such as Futures Contracts involves each Trust Series entering into contractual commitments to purchase or sell specified amounts of commodities at a specified date in the future. The aggregate market value of the contracts will significantly exceed each Trust Series’ future cash requirements since each Trust Series intends to close out its open positions prior to settlement. As a result, each Trust Series is generally only subject to the risk of loss arising from the change in value of the contracts. Each Trust Series considers the “fair value” of its derivative instruments to be the unrealized gain or loss on the contracts. The market risk associated with each Trust Series’ commitments to purchase a specific commodity will be limited to the aggregate market value of the contracts held.
Each Trust Series’ exposure to market risk depends on a number of factors, including the markets for commodities, the volatility of interest rates and foreign exchange rates, the liquidity of the Applicable Interest markets and the relationships among the contracts held by each such Trust Series. The limited experience that each Trust Series has had in utilizing its model to trade in Applicable Interests in a manner intended to track the changes in the Applicable Index, as well as drastic market occurrences, could ultimately lead to the loss of all or substantially all of an investor’s capital.
Credit Risk
When a Trust Series enters into Futures Contracts and Other Related Investments, it is exposed to the credit risk that the counterparty will not be able to meet its obligations. The counterparty for the Futures Contracts traded on the Futures Exchanges is the clearinghouse associated with the particular exchange. In general, in addition to margin required to be posted by the clearinghouse in connection with cleared trades, clearinghouses are backed by their members who may be required to share in the financial burden resulting from the nonperformance of one of their members and, therefore, this additional member support should significantly reduce credit risk. The Trust Series are not currently a member of any clearinghouse. Some foreign exchanges are not backed by their clearinghouse members but may be backed by a consortium of banks or other financial institutions. Unlike in the case of exchange-traded Futures Contracts, the counterparty to an OTC transaction is generally a single bank or other financial institution. As a result, there will be greater counterparty credit risk in OTC transactions. There can be no assurance that any counterparty, clearinghouse, or their members or their financial backers will satisfy their obligations to a Trust Series in such circumstances.
| 76 |
USCF attempts to manage the credit risk of each Trust Series by following various trading limitations and policies. In particular, each Trust Series generally posts margin and/or holds liquid assets that are approximately equal to the market value of its obligations to counterparties under the Futures Contracts and Other Related Investments it holds. USCF has implemented procedures that include, but are not limited to, executing and clearing trades and entering into OTC transactions only with creditworthy parties and/or requiring the posting of collateral or margin by such parties for the benefit of each Trust Series to limit its credit exposure. Each Trust Series’ commodity broker, or any other broker that may be retained by a Trust Series in the future, when acting as the Trust Series’ FCM in accepting orders to purchase or sell Futures Contracts on United States exchanges, is required by CFTC regulations to separately account for and segregate as belonging to a Trust Series, all assets of a Trust Series relating to domestic Futures Contracts trading. These FCMs are not allowed to commingle a Trust Series’ assets with their other assets. In addition, the CFTC requires commodity brokers to hold in a secure account a Trust Series’ assets related to foreign Futures Contracts trading. During the six months ended June 30, 2016, the only foreign exchanges on which USCI made investments were the ICE Futures, which is a London based futures exchange, and the LME, which is a London based metal commodities exchange. Such Futures Contracts are denominated in U.S. dollars. During the six months ended June 30, 2016, CPER did not make investments on any foreign exchanges. During the six months ended June 30, 2016, the only foreign exchange on which USAG made investments was the ICE Futures. Such Futures Contracts are denominated in U.S. dollars except Canola, which is denominated in Canadian dollars.
If, in the future, a Trust Series purchases OTC swaps, see “Item 3. Quantitative and Qualitative Disclosures About Market Risk” in this quarterly report on Form 10-Q for a discussion of OTC swaps.
As of June 30, 2016, each of USCI, CPER and USAG held cash deposits and investments in Treasuries in the amount of $649,921,219, $2,825,931 and $2,042,208 respectively, with the custodian and FCM. Some or all of these amounts held by a custodian or an FCM, as applicable, may be subject to loss should the Trust Series’ custodian or FCM, as applicable, cease operations.
Off Balance Sheet Financing
As of June 30, 2016, neither the Trust nor any Trust Series had any loan guarantee, credit support or other off-balance sheet arrangement of any kind other than agreements entered into in the normal course of business, which may include indemnification provisions relating to certain risks that service providers undertake in performing services which are in the best interests of any Trust Series. While each Trust Series’ exposure under these indemnification provisions cannot be estimated, they are not expected to have a material impact on any Trust Series’ financial position.
European Sovereign Debt
None of the Trust Series had direct exposure to European sovereign debt as of June 30, 2016 or had direct exposure to European sovereign debt as of the filing of this quarterly report on Form 10-Q.
Redemption Basket Obligation
In order to meet its investment objective and pay its contractual obligations described below, each Trust Series requires liquidity to redeem shares, which redemptions must be in blocks of 50,000 shares called “Redemption Baskets.” Each Trust Series has to date satisfied this obligation by paying from the cash or cash equivalents it holds or through the sale of its Treasuries in an amount proportionate to the number of shares being redeemed. Authorized Participants paid USCI $350 for each order placed to create one or more Creation Baskets or to redeem one or more Redemption Baskets; prior to July 1, 2011, Authorized Participants paid USCI $1,000 for each order placed to create one or more Creation Baskets or to redeem one or more Redemption Baskets. Authorized Participants paid to CPER and USAG $350 for each order placed to create one or more Creation Baskets or to redeem one or more Redemption Baskets. Prior to May 1, 2012, Authorized Participants paid $1,000 for each order placed to create one or more Creation Baskets or to redeem one or more Redemption Baskets.
Contractual Obligations
The Trust’s (and each series thereunder) primary contractual obligations are with USCF and certain other service providers. USCF, in return for its services, is entitled to a management fee calculated as a fixed percentage of a Trust Series’ NAV. Effective January 1, 2016, USCF permanently lowered the management fee for USCI to 0.80% (80 basis points) per annum of average daily total net assets for USCI and 0.65% (65 basis points) per annum of average daily total net assets for both CPER and USAG. Ongoing fees, costs and expenses of its operation for which a Trust Series is responsible include:
| · | brokerage and other fees and commissions incurred in connection with the trading activities of each Trust Series; |
| · | expenses incurred in connection with registering additional shares of each Trust Series or offering shares of each Trust Series after the time any shares of each Trust Series have begun trading on the NYSE Arca; |
| · | the routine expenses associated with distribution, including printing and mailing, of any monthly, annual and other reports to shareholders required by applicable U.S. federal and state regulatory authorities; |
| · | payment for routine services of the Trustee, legal counsel and independent accountants; |
| 77 |
| · | payment for fees associated with tax accounting and reporting, routine accounting, bookkeeping, whether performed by an outside service provider or by affiliates of USCF; |
| · | costs and expenses associated with investor relations and services; |
| · | the payment of any distributions related to redemption of shares; |
| · | payment of all federal, state, local or foreign taxes payable on the income, assets or operations of each Trust Series and the preparation of all tax returns related thereto; |
| · | fees and expenses of the independent directors of USCF; and |
| · | extraordinary expenses (including, but not limited to, indemnification of any person against liabilities and obligations to the extent permitted by law and required under the Trust Agreement and the bringing and defending of actions at law or in equity and otherwise engaging in the conduct of litigation and the incurring of legal expense and the settlement of claims and litigation). |
While USCF has agreed to pay registration fees to the SEC, FINRA, NYSE Arca or any other regulatory agency or exchange in connection with the initial offer and sale of the shares and the legal, printing, accounting and other expenses associated with such registration, each Trust Series is responsible for any registration fees and related expenses incurred in connection with any subsequent offer and sale of its shares after the initial offering of shares.
Each Trust Series pays its own brokerage and other transaction costs. Each Trust Series pays fees to the FCM in connection with its transactions in Futures Contracts. For the six months ended June 30, 2016, FCM fees were approximately 0.13% of average daily total net assets for USCI, approximately 0.07% of average daily total net assets for CPER, and approximately 0.10% of average daily total net assets for USAG. In general, transaction costs on OTC Applicable Interests and on Treasuries and other short-term securities are embedded in the purchase or sale price of the instrument being purchased or sold, and may not readily be estimated. USCF had voluntarily agreed to pay certain expenses normally borne by USCI to the extent that such expenses exceeded 0.15% (15 basis points) of USCI’s NAV, on an annualized basis, through March 31, 2011. As of March 31, 2011, the expense waiver was no longer in effect for USCI. USCF has voluntarily agreed to pay certain expenses typically borne by each CPER and USAG to the extent that such expenses exceed 0.15% (15 basis points) of each of CPER’s or USAG’s NAV, on an annualized basis. USCF can terminate this agreement at any time in its sole discretion. If this agreement were terminated, the Annual Fund Operating Expenses could increase, which would negatively impact your total return from an investment in CPER or USAG.
This voluntary expense waiver is in addition to those amounts USCF is contractually obligated to pay as described in Note 5 – Contracts and Agreements.
The parties cannot anticipate the amount of payments that will be required under these arrangements for future periods, as each Trust Series’ NAVs and trading levels to meet its investment objective will not be known until a future date. These agreements are effective for a specific term agreed upon by the parties with an option to renew, or, in some cases, are in effect for the duration of a Trust Series’ existence. Either party may terminate these agreements earlier for certain reasons described in the agreements.
As of June 30, 2016, USCI’s portfolio consisted of 17,758 Futures Contracts traded on the Futures Exchanges, CPER’s portfolio consisted of 53 Futures Contracts traded on the COMEX and USAG’s portfolio consisted of 69 Futures Contracts traded on the Futures Exchanges. For a list of each of USCI’s, CPER’s and USAG’s current holdings, please see www.unitedstatescommodityfunds.com. See “Portfolio Holdings” for a complete list of Futures Contracts held by each of USCI, CPER and USAG during the six months ended June 30, 2016.
Item 3. Quantitative and Qualitative Disclosures About Market Risk.
OTC Derivatives (including Spreads and Straddles)
Each Trust Series may purchase OTC swaps. Unlike most exchange-traded futures contracts or exchange-traded options on such futures, each party to an OTC swap bears the credit risk that the other party may not be able to perform its obligations under its contract.
| 78 |
The Trust, on behalf of each Trust Series may enter into certain transactions where an OTC component is exchanged for a corresponding futures contract (“Exchange for Related Position” or “EFRP” transactions). In the most common type of EFRP transaction entered into by the Trust, the OTC component is the purchase or sale of one or more baskets of a Trust Series shares. These EFRP transactions may expose a Trust Series to counterparty risk during the interim period between the executions of the OTC component and the exchange for a corresponding futures contract. Generally, the counterparty risk from the EFRP transaction will exist only on the day of execution.
Swap transactions, like other financial transactions, involves a variety of significant risks. The specific risks presented by a particular swap transaction necessarily depend upon the terms and circumstances of the transaction. In general, however, all swap transactions involve some combination of market risk, credit risk, counterparty risk, funding risk, liquidity risk and operational risk.
Highly customized swap transactions in particular may increase liquidity risk, which may result in a suspension of redemptions. Highly leveraged transactions may experience substantial gains or losses in value as a result of relatively small changes in the value or level of an underlying or related market factor.
In evaluating the risks and contractual obligations associated with a particular swap transaction, it is important to consider that a swap transaction may be modified or terminated only by mutual consent of the original parties and subject to agreement on individually negotiated terms. Therefore, it may not be possible for USCF to modify, terminate or offset a Trust Series’ obligations or its exposure to the risks associated with a transaction prior to its scheduled termination date.
To reduce the credit risk that arises in connection with such contracts, a Trust Series will generally enter into an agreement with each counterparty based on the Master Agreement published by ISDA that provides for the netting of its overall exposure to its counterparty if the counterparty is unable to meet its obligations to the Trust Series due to the occurrence of a specified event, such as the insolvency of the counterparty.
A Trust Series assesses or reviews, as appropriate, the creditworthiness of each potential or existing counterparty to an OTC contract pursuant to guidelines approved by USCF’s Board. Furthermore, USCF on behalf of a Trust Series only enters into OTC contracts with counterparties who are, or are affiliates of, (a) banks regulated by a United States federal bank regulator, (b) broker-dealers regulated by the SEC, (c) insurance companies domiciled in the United States, or (d) producers, users or traders of energy, whether or not regulated by the CFTC. Any entity acting as a counterparty shall be regulated in either the United States or the United Kingdom unless otherwise approved by the Board after consultation with its legal counsel. Existing counterparties are also reviewed periodically by USCF. A Trust Series will also require that the counterparty be highly rated and/or provide collateral or other credit support. Even if collateral is used to reduce counterparty credit risk, sudden changes in the value of OTC transactions may leave a party open to financial risk due to a counterparty default since the collateral held may not cover a party’s exposure on the transaction in such situations.
In general, valuing OTC derivatives is less certain than valuing actively traded financial instruments such as exchange-traded futures contracts and securities or cleared swaps because the price and terms on which such OTC derivatives are entered into or can be terminated are individually negotiated, and those prices and terms may not reflect the best price or terms available from other sources. In addition, while market makers and dealers generally quote indicative prices or terms for entering into or terminating OTC swaps, they typically are not contractually obligated to do so, particularly if they are not a party to the transaction. As a result, it may be difficult to obtain an independent value for an outstanding OTC derivatives transaction.
During the six month reporting period ended June 30, 2016, no series of the Trust limited its OTC activities to EFRP transactions.
Each Trust Series anticipates that the use of Other Related Investments together with its investments in Futures Contracts will produce price and total return results that closely track the investment goals of such Trust Series. However, there can be no assurance of this. OTC swaps may result in higher transaction-related expenses than the brokerage commissions paid in connection with the purchase of Futures Contracts, which may impact a Trust Series’ ability to successfully track its Applicable Index.
Item 4. Controls and Procedures.
Disclosure Controls and Procedures
The Trust and each Trust Series maintain disclosure controls and procedures that are designed to ensure that material information required to be disclosed in the Trust’s periodic reports filed or submitted under the Exchange Act, is recorded, processed, summarized and reported within the time period specified in the SEC’s rules and forms.
The duly appointed officers of USCF, including its chief executive officer and chief financial officer, who perform functions equivalent to those of a principal executive officer and principal financial officer of the Trust if the Trust had any officers, have evaluated the effectiveness of the Trust’s and each Trust Series’ disclosure controls and procedures and have concluded that the disclosure controls and procedures of the Trust and each Trust Series have been effective as of the end of the period covered by this quarterly report on Form 10-Q.
| 79 |
Change in Internal Control Over Financial Reporting
There were no changes in the Trust’s or any Trust Series’ internal control over financial reporting during the last fiscal quarter that have materially affected, or are reasonably likely to materially affect, the Trust’s or any Trust Series’ internal control over financial reporting.
Not applicable.
There have been no material changes to the risk factors previously disclosed in the Trust’s Annual Report on Form 10-K for the fiscal year ended December 31, 2015, filed on March 11, 2016.
Item 2. Unregistered Sales of Equity Securities and Use of Proceeds.
Not applicable.
Item 3. Defaults Upon Senior Securities.
Not applicable.
Item 4. Mine Safety Disclosures.
Not applicable.
Monthly Account Statements
Pursuant to the requirement under Rule 4.22 under the Commodity Exchange Act, each month the Trust and each Trust Series publish account statements for the Trust Series’ shareholders, which include Statements of Income (Loss) and Statements of Changes in Net Asset Value. The account statements are furnished to the SEC on a current report on Form 8-K pursuant to Section 13 or 15(d) of the Exchange Act and posted each month on each Trust Series’ website at www.unitedstatescommodityfunds.com.
Listed below are the exhibits, which are filed as part of this quarterly report on Form 10-Q (according to the number assigned to them in Item 601 of Regulation S-K):
| Exhibit Number | Description of Document | |
| 31.1* | Certification by Principal Executive Officer Pursuant to Section 302 of the Sarbanes-Oxley Act of 2002. | |
| 31.2* | Certification by Principal Financial Officer Pursuant to Section 302 of the Sarbanes-Oxley Act of 2002. | |
| 32.1* | Certification by Principal Executive Officer Pursuant to 18 U.S.C. Section 1350, as Adopted Pursuant to Section 906 of the Sarbanes-Oxley Act of 2002. | |
| 32.2* | Certification by Principal Financial Officer Pursuant to 18 U.S.C. Section 1350, as Adopted Pursuant to Section 906 of the Sarbanes-Oxley Act of 2002. | |
| 101.INS | XBRL Instance Document. | |
| 101.SCH | XBRL Taxonomy Extension Schema. | |
| 101.CAL | XBRL Taxonomy Extension Calculation Linkbase. | |
| 101.DEF | XBRL Taxonomy Extension Definition Linkbase. | |
| 101.LAB | XBRL Taxonomy Extension Label Linkbase. | |
| 101.PRE | XBRL Taxonomy Extension Presentation Linkbase. |
| * | Filed herewith. |
| 80 |
SIGNATURES
Pursuant to the requirements of the Securities Exchange Act of 1934, the registrant has duly caused this report to be signed on its behalf by the undersigned thereunto duly authorized.
United States Commodity Index Funds Trust (Registrant)
By: United States Commodity Funds LLC, its Sponsor
| By: | /s/ John P. Love | |
| John P. Love | ||
| President and Chief Executive Officer | ||
| (Principal executive officer) | ||
| Date: August 5, 2016 | ||
| By: | /s/ Stuart P. Crumbaugh | |
| Stuart P. Crumbaugh | ||
| Chief Financial Officer | ||
| (Principal financial and accounting officer) | ||
| Date: August 5, 2016 | ||
| 81 |