Attached files
| file | filename |
|---|---|
| EX-32.1 - EXHIBIT 32.1 - LiveRamp Holdings, Inc. | acxm-20160630ex3212d6c9b.htm |
| EX-32.2 - EXHIBIT 32.2 - LiveRamp Holdings, Inc. | acxm-20160630ex322eb71be.htm |
| EX-31.2 - EXHIBIT 31.2 - LiveRamp Holdings, Inc. | acxm-20160630ex312b64fbf.htm |
| EX-31.1 - EXHIBIT 31.1 - LiveRamp Holdings, Inc. | acxm-20160630ex311d72923.htm |
| EX-10.1 - EXHIBIT 10.1 - LiveRamp Holdings, Inc. | acxm-20160630ex101e6b0ef.htm |
UNITED STATES
SECURITIES AND EXCHANGE COMMISSION
Washington, D.C. 20549
FORM 10-Q
(Mark One)
|
[X] |
QUARTERLY REPORT PURSUANT TO SECTION 13 OR 15(d) OF THE SECURITIES EXCHANGE ACT OF 1934 |
For the quarterly period ended June 30, 2016
OR
|
[ ] |
TRANSITION REPORT PURSUANT TO SECTION 13 OR 15(d) OF THE SECURITIES EXCHANGE ACT OF 1934 |
For the transition period from ----- to -----
Commission file number 0-13163
|
Acxiom Corporation |
|
|
(Exact Name of Registrant as Specified in Its Charter) |
|
|
|
|
|
DELAWARE (State or Other Jurisdiction of |
71-0581897 (I.R.S. Employer Identification No.) |
|
|
|
|
P.O. Box 8190, 601 E. Third Street, Little Rock, Arkansas (Address of Principal Executive Offices) |
72203-8190 (Zip Code) |
|
|
|
|
(501) 342-1000 (Registrant's Telephone Number, Including Area Code) |
|
Indicate by check mark whether the registrant: (1) has filed all reports required to be filed by Section 13 or 15(d) of the Securities Exchange Act of 1934 during the preceding 12 months (or for such shorter period that the registrant was required to file such reports), and (2) has been subject to such filing requirements for the past 90 days.
Yes [X] No [ ]
Indicate by check mark whether the registrant has submitted electronically and posted on its corporate Web site, if any, every Interactive Data File required to be submitted and posted pursuant to Rule 405 of Regulation S-T (§232.405 of this chapter) during the preceding 12 months (or for such shorter period that the registrant was required to submit and post such files).
Yes [X] No [ ]
Indicate by check mark whether the registrant is a large accelerated filer, an accelerated filer, a non-accelerated filer or a smaller reporting company. See the definitions of “large accelerated filer,” “accelerated filer” and “smaller reporting company” in Rule 12b-2 of the Exchange Act.
|
Large accelerated filer [X] |
Accelerated filer [ ] |
|
|
|
|
Non-accelerated filer [ ] |
Smaller reporting company [ ] |
Indicate by check mark whether the registrant is a shell company (as defined in Rule 12b-2 of the Exchange Act).
Yes [ ] No [X]
The number of shares of common stock, $ 0.10 par value per share, outstanding as of August 2, 2016 was 77,409,054.
ACXIOM CORPORATION AND SUBSIDIARIES
REPORT ON FORM 10-Q
June 30, 2016
2
ACXIOM CORPORATION AND SUBSIDIARIES
CONDENSED CONSOLIDATED BALANCE SHEETS
(Dollars in thousands)
|
|
|
June 30, |
|
March 31, |
|
||
|
|
|
2016 |
|
2016 |
|
||
|
ASSETS |
|
|
(Unaudited) |
|
|
|
|
|
Current assets: |
|
|
|
|
|
|
|
|
Cash and cash equivalents |
|
$ |
150,160 |
|
$ |
189,629 |
|
|
Trade accounts receivable, net |
|
|
127,655 |
|
|
138,650 |
|
|
Refundable income taxes |
|
|
7,606 |
|
|
9,834 |
|
|
Other current assets |
|
|
34,919 |
|
|
37,897 |
|
|
Total current assets |
|
|
320,340 |
|
|
376,010 |
|
|
|
|
|
|
|
|
|
|
|
Property and equipment, net of accumulated depreciation and amortization |
|
|
179,211 |
|
|
183,043 |
|
|
Software, net of accumulated amortization |
|
|
52,537 |
|
|
55,735 |
|
|
Goodwill |
|
|
492,598 |
|
|
492,745 |
|
|
Purchased software licenses, net of accumulated amortization |
|
|
9,561 |
|
|
10,116 |
|
|
Deferred income taxes |
|
|
6,170 |
|
|
6,885 |
|
|
Other assets, net |
|
|
23,547 |
|
|
25,315 |
|
|
|
|
$ |
1,083,964 |
|
$ |
1,149,849 |
|
|
LIABILITIES AND EQUITY |
|
|
|
|
|
|
|
|
Current liabilities: |
|
|
|
|
|
|
|
|
Current installments of long-term debt |
|
$ |
32,262 |
|
$ |
32,243 |
|
|
Trade accounts payable |
|
|
26,216 |
|
|
37,717 |
|
|
Accrued expenses |
|
|
|
|
|
|
|
|
Payroll |
|
|
27,733 |
|
|
61,309 |
|
|
Other |
|
|
47,977 |
|
|
48,254 |
|
|
Deferred revenue |
|
|
38,378 |
|
|
44,477 |
|
|
Total current liabilities |
|
|
172,566 |
|
|
224,000 |
|
|
|
|
|
|
|
|
|
|
|
Long-term debt |
|
|
150,124 |
|
|
157,897 |
|
|
Deferred income taxes |
|
|
52,571 |
|
|
53,964 |
|
|
Other liabilities |
|
|
14,939 |
|
|
15,020 |
|
|
Commitments and contingencies |
|
|
|
|
|
|
|
|
Equity: |
|
|
|
|
|
|
|
|
Common stock |
|
|
13,102 |
|
|
13,039 |
|
|
Additional paid-in capital |
|
|
1,095,510 |
|
|
1,082,220 |
|
|
Retained earnings |
|
|
602,477 |
|
|
598,501 |
|
|
Accumulated other comprehensive income |
|
|
7,590 |
|
|
8,590 |
|
|
Treasury stock, at cost |
|
|
(1,024,915) |
|
|
(1,003,382) |
|
|
Total equity |
|
|
693,764 |
|
|
698,968 |
|
|
|
|
$ |
1,083,964 |
|
$ |
1,149,849 |
|
See accompanying notes to condensed consolidated financial statements.
3
ACXIOM CORPORATION AND SUBSIDIARIES
CONDENSED CONSOLIDATED STATEMENTS OF OPERATIONS
(Unaudited)
(Dollars in thousands, except per share amounts)
|
|
|
For the Three months ended |
|
||||
|
|
|
June 30, |
|
||||
|
|
|
2016 |
|
2015 |
|
||
|
|
|
|
|
|
|
|
|
|
Revenues |
|
$ |
214,801 |
|
$ |
196,895 |
|
|
Cost of revenue |
|
|
122,819 |
|
|
117,709 |
|
|
Gross profit |
|
|
91,982 |
|
|
79,186 |
|
|
Operating expenses: |
|
|
|
|
|
|
|
|
Research and development |
|
|
18,652 |
|
|
20,011 |
|
|
Sales and marketing |
|
|
37,348 |
|
|
29,494 |
|
|
General and administrative |
|
|
27,506 |
|
|
31,743 |
|
|
Gains, losses and other items, net |
|
|
314 |
|
|
807 |
|
|
Total operating expenses |
|
|
83,820 |
|
|
82,055 |
|
|
Income (loss) from operations |
|
|
8,162 |
|
|
(2,869) |
|
|
Other income (expense): |
|
|
|
|
|
|
|
|
Interest expense |
|
|
(1,812) |
|
|
(1,885) |
|
|
Other, net |
|
|
307 |
|
|
304 |
|
|
Total other expense |
|
|
(1,505) |
|
|
(1,581) |
|
|
Income (loss) from continuing operations before income taxes |
|
|
6,657 |
|
|
(4,450) |
|
|
Income taxes |
|
|
2,681 |
|
|
732 |
|
|
Net earnings (loss) from continuing operations |
|
|
3,976 |
|
|
(5,182) |
|
|
Earnings from discontinued operations, net of tax |
|
|
— |
|
|
4,143 |
|
|
Net earnings (loss) |
|
$ |
3,976 |
|
$ |
(1,039) |
|
|
|
|
|
|
|
|
|
|
|
Basic earnings (loss) per share: |
|
|
|
|
|
|
|
|
Net earnings (loss) from continuing operations |
|
$ |
0.05 |
|
$ |
(0.07) |
|
|
Net earnings from discontinued operations |
|
|
— |
|
|
0.05 |
|
|
Net earnings (loss) |
|
$ |
0.05 |
|
$ |
(0.01) |
|
|
|
|
|
|
|
|
|
|
|
Diluted earnings (loss) per share: |
|
|
|
|
|
|
|
|
Net earnings (loss) from continuing operations |
|
$ |
0.05 |
|
$ |
(0.07) |
|
|
Net earnings from discontinued operations |
|
|
— |
|
|
0.05 |
|
|
Net earnings (loss) |
|
$ |
0.05 |
|
$ |
(0.01) |
|
Some earnings (loss) per share amounts may not add due to rounding.
See accompanying notes to condensed consolidated financial statements.
4
ACXIOM CORPORATION AND SUBSIDIARIES
CONDENSED CONSOLIDATED STATEMENTS OF COMPREHENSIVE INCOME (LOSS)
(Unaudited)
(Dollars in thousands)
|
|
|
For the Three months ended |
|
||||
|
|
|
June 30, |
|
||||
|
|
|
2016 |
|
2015 |
|
||
|
|
|
|
|
|
|
|
|
|
Net earnings (loss) |
$ |
3,976 |
$ |
(1,039) | |||
|
Other comprehensive income (loss): |
|||||||
|
Change in foreign currency translation adjustment |
|
|
(1,005) |
|
|
718 |
|
|
Unrealized gain on interest rate swap |
|
|
5 |
|
|
11 |
|
|
Other comprehensive income (loss) |
(1,000) | 729 | |||||
|
Comprehensive income (loss) |
$ |
2,976 |
$ |
(310) | |||
See accompanying notes to condensed consolidated financial statements.
5
ACXIOM CORPORATION AND SUBSIDIARIES
CONDENSED CONSOLIDATED STATEMENT OF EQUITY
THREE MONTHS ENDED JUNE 30, 2016
(Unaudited)
(Dollars in thousands)
|
|
|
|
|
|
|
|
|
|
|
|
|
|
Accumulated |
|
|
|
|
|
|
|
|
|
|
|
|
|
Common Stock |
|
Additional |
|
|
|
|
other |
|
Treasury Stock |
|
|
|
|
||||||||
|
|
|
Number |
|
|
|
|
paid-in |
|
Retained |
|
comprehensive |
|
Number |
|
|
|
|
Total |
|
||||
|
|
|
of shares |
|
Amount |
|
Capital |
|
earnings |
|
income |
|
of shares |
|
Amount |
|
Equity |
|
||||||
|
|
|
|
|
|
|
|
|
|
|
|
|
|
|
|
|
|
|
|
|
|
|
|
|
|
Balances at March 31, 2016 |
|
130,390,106 |
|
$ |
13,039 |
|
$ |
1,082,220 |
|
$ |
598,501 |
|
$ |
8,590 |
|
(53,030,682) |
|
$ |
(1,003,382) |
|
$ |
698,968 |
|
|
Employee stock awards, benefit plans and other issuances |
|
288,212 |
|
|
29 |
|
|
4,271 |
|
|
— |
|
|
— |
|
(66,955) |
|
|
(1,326) |
|
|
2,974 |
|
|
Tax impact of stock options and restricted stock |
|
— |
|
|
— |
|
|
463 |
|
|
— |
|
|
— |
|
— |
|
|
— |
|
|
463 |
|
|
Non-cash stock-based compensation |
|
14,746 |
|
|
1 |
|
|
8,589 |
|
|
— |
|
|
— |
|
— |
|
|
— |
|
|
8,590 |
|
|
Restricted stock units vested |
|
331,800 |
|
|
33 |
|
|
(33) |
|
|
— |
|
|
— |
|
— |
|
|
— |
|
|
— |
|
|
Acquisition of treasury stock |
|
— |
|
|
— |
|
|
— |
|
|
— |
|
|
— |
|
(925,838) |
|
|
(20,207) |
|
|
(20,207) |
|
|
Comprehensive income (loss): |
|
|
|
|
|
|
|
|
|
|
|
|
|
|
|
|
|
|
|
|
|
|
|
|
Foreign currency translation |
|
— |
|
|
— |
|
|
— |
|
|
— |
|
|
(1,005) |
|
— |
|
|
— |
|
|
(1,005) |
|
|
Unrealized gain on interest rate swap |
|
— |
|
|
— |
|
|
— |
|
|
— |
|
|
5 |
|
— |
|
|
— |
|
|
5 |
|
|
Net earnings |
|
— |
|
|
— |
|
|
— |
|
|
3,976 |
|
|
— |
|
— |
|
|
— |
|
|
3,976 |
|
|
Balances at June 30, 2016 |
|
131,024,864 |
|
$ |
13,102 |
|
$ |
1,095,510 |
|
$ |
602,477 |
|
$ |
7,590 |
|
(54,023,475) |
|
$ |
(1,024,915) |
|
$ |
693,764 |
|
See accompanying notes to condensed consolidated financial statements
6
ACXIOM CORPORATION AND SUBSIDIARIES
CONDENSED CONSOLIDATED STATEMENTS OF CASH FLOWS
(Unaudited)
(Dollars in thousands)
|
|
|
For the Three months ended June 30, |
|
||||
|
|
|
2016 |
|
2015 |
|
||
|
|
|
|
|
|
|
|
|
|
Cash flows from operating activities: |
|
|
|
|
|
|
|
|
Net earnings (loss) |
|
$ |
3,976 |
|
$ |
(1,039) |
|
|
Earnings from discontinued operations, net of tax |
|
|
— |
|
|
(4,143) |
|
|
Adjustments to reconcile net earnings (loss) to net cash provided by operating activities: |
|
|
|
|
|
|
|
|
Depreciation and amortization |
|
|
20,790 |
|
|
21,775 |
|
|
Loss on disposal or impairment of assets |
|
|
— |
|
|
241 |
|
|
Deferred income taxes |
|
|
(678) |
|
|
(1,522) |
|
|
Non-cash stock-based compensation expense |
|
|
8,590 |
|
|
8,123 |
|
|
Changes in operating assets and liabilities: |
|
|
|
|
|
|
|
|
Accounts receivable, net |
|
|
9,487 |
|
|
(8,037) |
|
|
Other assets |
|
|
5,383 |
|
|
384 |
|
|
Accounts payable and other liabilities |
|
|
(41,021) |
|
|
(3,530) |
|
|
Deferred revenue |
|
|
(5,777) |
|
|
(255) |
|
|
Net cash provided by operating activities |
|
|
750 |
|
|
11,997 |
|
|
|
|
|
|
|
|
|
|
|
Cash flows from investing activities: |
|
|
|
|
|
|
|
|
Capitalized software development costs |
|
|
(3,982) |
|
|
(2,797) |
|
|
Capital expenditures |
|
|
(10,694) |
|
|
(12,876) |
|
|
Data acquisition costs |
|
|
(20) |
|
|
(430) |
|
|
Net cash used in investing activities |
|
|
(14,696) |
|
|
(16,103) |
|
|
|
|
|
|
|
|
|
|
|
Cash flows from financing activities: |
|
|
|
|
|
|
|
|
Payments of debt |
|
|
(8,053) |
|
|
(8,099) |
|
|
Sale of common stock, net of stock acquired for withholding taxes |
|
|
2,974 |
|
|
2,069 |
|
|
Excess tax benefits from stock-based compensation |
|
|
514 |
|
|
(77) |
|
|
Acquisition of treasury stock |
|
|
(20,207) |
|
|
(14,951) |
|
|
Net cash used in financing activities |
|
|
(24,772) |
|
|
(21,058) |
|
|
Net cash used in continuing operations |
|
|
(38,718) |
|
|
(25,164) |
|
|
|
|
|
|
|
|
|
|
|
Cash flows from discontinued operations: |
|
|
|
|
|
|
|
|
Net cash provided by operating activities |
|
|
— |
|
|
11,653 |
|
|
Net cash used in investing activities |
|
|
— |
|
|
(4,484) |
|
|
Net cash used in financing activities |
|
|
— |
|
|
(153) |
|
|
Net cash provided by discontinued operations |
|
|
— |
|
|
7,016 |
|
|
Net cash used in continuing and discontinued operations |
|
|
(38,718) |
|
|
(18,148) |
|
|
Effect of exchange rate changes on cash |
|
|
(751) |
|
|
330 |
|
|
|
|
|
|
|
|
|
|
|
Net change in cash and cash equivalents |
|
|
(39,469) |
|
|
(17,818) |
|
|
Cash and cash equivalents at beginning of period |
|
|
189,629 |
|
|
141,010 |
|
|
Cash and cash equivalents at end of period |
|
$ |
150,160 |
|
$ |
123,192 |
|
See accompanying notes to condensed consolidated financial statements.
7
CONDENSED CONSOLIDATED STATEMENTS OF CASH FLOWS (Continued)
(Unaudited)
(Dollars in thousands)
|
|
|
For the Three months ended June 30, |
|
||||
|
|
|
2016 |
|
2015 |
|
||
|
Supplemental cash flow information: |
|
|
|
|
|
|
|
|
Cash paid (received) during the period for: |
|
|
|
|
|
|
|
|
Interest |
|
$ |
2,258 |
|
$ |
2,185 |
|
|
Income taxes |
|
|
(76) |
|
|
(1,044) |
|
|
Payments on capital leases and installment payment arrangements |
|
|
— |
|
|
216 |
|
|
Other debt payments |
|
|
8,053 |
|
|
8,036 |
|
See accompanying notes to condensed consolidated financial statements.
8
ACXIOM CORPORATION AND SUBSIDIARIES
NOTES TO CONDENSED CONSOLIDATED FINANCIAL STATEMENTS
(Unaudited)
1.BASIS OF PRESENTATION AND SUMMARY OF SIGNIFICANT ACCOUNTING POLICIES:
These condensed consolidated financial statements have been prepared by Acxiom Corporation (“Registrant,” “Acxiom”, we, us or the “Company”), without audit, pursuant to the rules and regulations of the Securities and Exchange Commission (the “SEC” or the “Commission”). In the opinion of the Registrant’s management all adjustments necessary for a fair presentation of the results for the periods included have been made and the disclosures are adequate to make the information presented not misleading. All such adjustments are of a normal recurring nature. Certain note information has been omitted because it has not changed significantly from that reflected in Notes 1 through 18 of the Notes to Consolidated Financial Statements filed as part of Item 8 of the Registrant’s annual report on Form 10-K for the fiscal year ended March 31, 2016 (“2016 Annual Report”), as filed with the Commission on May 27, 2016. This quarterly report and the accompanying condensed consolidated financial statements should be read in connection with the 2016 Annual Report. The financial information contained in this quarterly report is not necessarily indicative of the results to be expected for any other period or for the full fiscal year ending March 31, 2017.
Management of the Company has made a number of estimates and assumptions relating to the reporting of assets and liabilities and the disclosure of contingent assets and liabilities to prepare these condensed consolidated financial statements in conformity with accounting principles generally accepted in the United States (“U.S. GAAP”). Actual results could differ from those estimates. Certain of the accounting policies used in the preparation of these condensed consolidated financial statements are complex and require management to make judgments and/or significant estimates regarding amounts reported or disclosed in these financial statements. Additionally, the application of certain of these accounting policies is governed by complex accounting principles and their interpretation. A discussion of the Company’s significant accounting principles and their application is included in Note 1 of the Notes to Consolidated Financial Statements and in Item 7, Management’s Discussion and Analysis of Financial Condition and Results of Operations, of the Company’s 2016 Annual Report.
Unless otherwise indicated, information in these notes to the condensed consolidated financial statements relates to continuing operations.
Recent Accounting Pronouncements Not Yet Adopted
In March 2016, the Financial Accounting Standards Board (the “FASB”) issued Accounting Standards Update (“ASU”) No. 2016-09, Compensation - Stock Compensation (Topic 718): Improvements to Employee Share-Based Payment Accounting as part of its simplification initiative. The objective of the simplification initiative is to identify, evaluate, and improve areas of U.S. GAAP for which cost and complexity can be reduced while maintaining the usefulness of the information provided to users of financial statements. The areas for simplification in ASU 2016-09 involve several aspects of the accounting for share-based payment transactions, including the income tax consequences, classification of awards as either equity or liabilities, and classification on the statement of cash flows. ASU 2016-09 is effective for annual periods beginning after December 15, 2016 (fiscal 2018 for the Company), including interim periods within those fiscal years. Earlier adoption is permitted. The Company is currently evaluating the impact of the adoption of this guidance on its consolidated financial condition, results of operations and cash flows.
In February 2016, the FASB issued ASU No. 2016-02, Leases (Topic 842), as a comprehensive new standard that amends various aspects of existing guidance for leases and requires additional disclosures about leasing arrangements. The new standard will require lessees to recognize lease assets and lease liabilities for those leases classified as operating leases under previous guidance, ASC 840, Leases. ASU 2016-02 creates a new Topic, ASC 842, Leases. This new Topic retains a distinction between finance leases and operating leases. The classification criteria for distinguishing between finance leases and operating leases are substantially similar to the classification criteria for distinguishing between capital leases and operating leases in the previous leases guidance. ASU 2016-02 is effective for annual periods beginning after December 15, 2018 (fiscal 2020 for the Company), including interim periods within those fiscal years. Earlier
9
adoption is permitted. In the financial statements in which the ASU is first applied, leases shall be measured and recognized at the beginning of the earliest comparative period presented with an adjustment to equity. The Company is currently evaluating the impact of the adoption of this guidance on its consolidated financial condition, results of operations and cash flows.
In May 2014, the FASB issued ASU No. 2014-09, Revenue from Contracts with Customers: Topic 606, to supersede nearly all existing revenue recognition guidance under U.S. GAAP, as well as some cost guidance and guidance on certain gains and losses. The FASB also issued ASU 2016-08, Revenue from Contracts with Customers – Principal versus Agent Considerations, and ASU 2016-10, Revenue from Contracts with Customers – Identifying Performance Obligations and Licensing. The core principle of the new guidance is to recognize revenues when promised goods or services are transferred to customers in an amount that reflects the consideration that is expected to be received for those goods or services. The guidance defines a five-step process to achieve this core principle and, in doing so, it is possible more judgment and estimates may be required within the revenue recognition process than are required under existing U.S. GAAP, including identifying performance obligations in the contract, estimating the amount of variable consideration to include in the transaction price and allocating the transaction price to each separate performance obligation, among other areas. The effective date for the update has been deferred until fiscal 2019 for the Company, with early application allowed for fiscal 2018. Adoption of the update may be applied using either of two methods: (i) retrospective application to each prior reporting period presented with the option to elect certain practical expedients; or (ii) retrospective application with the cumulative effect recognized at the date of initial application and providing certain additional disclosures. The Company is currently evaluating the accounting, transition and disclosure requirements of the standard and cannot currently estimate the financial statement impact of adoption.
The Company does not anticipate that the adoption of any other recent accounting pronouncements will have a material impact on the Company's consolidated financial position, results of operations, or cash flows.
10
2.EARNINGS (LOSS) PER SHARE AND STOCKHOLDERS’ EQUITY:
Earnings (Loss) Per Share
A reconciliation of the numerator and denominator of basic and diluted earnings (loss) per share is shown below (in thousands, except per share amounts):
|
|
|
For the quarter ended |
|
||||
|
|
|
June 30, |
|
||||
|
|
|
2016 |
|
2015 |
|
||
|
Basic earnings (loss) per share: |
|
|
|
|
|
|
|
|
Net income (loss) from continuing operations |
|
$ |
3,976 |
|
$ |
(5,182) |
|
|
Net earnings from discontinued operations, net of tax |
|
|
— |
|
|
4,143 |
|
|
Net earnings (loss) |
|
$ |
3,976 |
|
$ |
(1,039) |
|
|
|
|
|
|
|
|
|
|
|
Basic weighted-average shares outstanding |
|
|
77,471 |
|
|
77,918 |
|
|
Basic earnings (loss) per share: |
|
|
|
|
|
|
|
|
Continuing operations |
|
$ |
0.05 |
|
$ |
(0.07) |
|
|
Discontinued operations |
|
|
— |
|
|
0.05 |
|
|
Net earnings (loss) |
|
$ |
0.05 |
|
$ |
(0.01) |
|
|
|
|
|
|
|
|
|
|
|
Diluted earnings (loss) per share: |
|
|
|
|
|
|
|
|
Basic weighted-average shares outstanding |
|
|
77,471 |
|
|
77,918 |
|
|
Dilutive effect of common stock options, warrants, and restricted stock as computed under the treasury stock method |
|
|
1,882 |
|
|
— |
|
|
Diluted weighted-average shares outstanding |
|
|
79,353 |
|
|
77,918 |
|
|
Diluted earnings (loss) per share: |
|
|
|
|
|
|
|
|
Continuing operations |
|
$ |
0.05 |
|
$ |
(0.07) |
|
|
Discontinued operations |
|
|
— |
|
|
0.05 |
|
|
Net earnings (loss) |
|
$ |
0.05 |
|
$ |
(0.01) |
|
Some earnings (loss) per share amounts may not add due to rounding.
Due to the net loss from continuing operations incurred by the Company during the quarter ended June 30, 2015, the dilutive effect of options, warrants and restricted stock units covering 1.4 million shares of common stock was excluded from the diluted loss per share calculation since the impact on the calculation was anti-dilutive.
Additional options and warrants to purchase shares of common stock and restricted stock units, including performance-based restricted stock units not meeting performance criteria, that were outstanding during the periods presented but were not included in the computation of diluted earnings (loss) per share because the effect was anti-dilutive are shown below (in thousands, except per share amounts):
|
|
|
For the quarter ended |
|
||||
|
|
|
June 30, |
|
||||
|
|
|
2016 |
|
2015 |
|
||
|
Number of shares outstanding under options, warrants and restricted stock units |
|
|
709 |
|
|
2,029 |
|
|
Range of exercise prices for options |
|
$ |
19.07 - $32.85 |
|
$ |
2.58 - $62.06 |
|
Stockholders’ Equity
On August 29, 2011, the board of directors adopted a common stock repurchase program. That program was subsequently modified and expanded, most recently on July 28, 2016 (see Note 14). Under the modified common stock repurchase program, the Company may purchase up to $400.0 million of its common stock through the period ending June 30, 2018. During the three months ended June 30, 2016, the Company repurchased 0.9 million shares of its common stock for $20.2 million. Through June 30, 2016, the Company
11
had repurchased 16.4 million shares of its stock for $275.4 million, leaving remaining capacity of $124.6 million under the stock repurchase program.
Accumulated Other Comprehensive Income
The following table presents the accumulated balances for each component of other comprehensive income (dollars in thousands):
|
|
|
June 30, |
|
March 31, |
|
||
|
|
|
2016 |
|
2016 |
|
||
|
Foreign currency translation |
|
$ |
7,699 |
|
$ |
8,705 |
|
|
Unrealized loss on interest rate swap |
|
|
(109) |
|
|
(115) |
|
|
|
|
$ |
7,590 |
|
$ |
8,590 |
|
3.SHARE-BASED COMPENSATION:
Share-based Compensation Plans
The Company has stock option and equity compensation plans for which a total of 28.9 million shares of the Company’s common stock have been reserved for issuance since the inception of the plans. These plans provide that the exercise prices of qualified options will be at or above the fair market value of the common stock at the time of the grant. Board policy requires that nonqualified options also be priced at or above the fair market value of the common stock at the time of grant. At June 30, 2016, there were a total of 2.3 million shares available for future grants under the plans.
Stock Option Activity
Stock option activity for the three-month period ended June 30, 2016 was:
|
|
|
|
|
|
|
|
Weighted-average |
|
|
|
|
|
|
|
|
|
Weighted-average |
|
remaining |
|
Aggregate |
|
||
|
|
|
Number of |
|
exercise price |
|
contractual term |
|
Intrinsic value |
|
||
|
|
|
shares |
|
per share |
|
(in years) |
|
(in thousands) |
|
||
|
Outstanding at March 31, 2016 |
|
3,604,102 |
|
$ |
14.52 |
|
|
|
|
|
|
|
Exercised |
|
(158,632) |
|
$ |
9.00 |
|
|
|
$ |
1,997 |
|
|
Forfeited or cancelled |
|
(28,441) |
|
$ |
13.42 |
|
|
|
|
|
|
|
Outstanding at June 30, 2016 |
|
3,417,029 |
|
$ |
14.78 |
|
5.1 |
|
$ |
25,363 |
|
|
Exercisable at June 30, 2016 |
|
2,645,523 |
|
$ |
15.03 |
|
4.3 |
|
$ |
19,033 |
|
The aggregate intrinsic value in the table above represents the total pre-tax intrinsic value (the difference between Acxiom’s closing stock price on the last trading day of the quarter and the exercise price for each in-the-money option) that would have been realized by the option holders had option holders exercised their options on June 30, 2016. This amount changes based upon changes in the fair market value of Acxiom’s common stock.
A summary of stock options outstanding and exercisable as of June 30, 2016 is presented below:
|
|
|
|
|
|
|
Options outstanding |
|
Options exercisable |
|
|||||||||
|
Range of |
|
|
|
Weighted-average |
|
Weighted-average |
|
|
|
Weighted-average |
|
|||||||
|
exercise price |
|
Options |
|
remaining |
|
exercise price |
|
Options |
|
exercise price |
|
|||||||
|
per share |
|
outstanding |
|
contractual life |
|
per share |
|
exercisable |
|
per share |
|
|||||||
|
|
|
|
|
|
|
|
|
|
|
|
|
|
|
|
|
|
|
|
|
$ |
0.85 |
- |
$ |
9.99 |
|
626,572 |
|
6.8 |
years |
|
$ |
1.85 |
|
387,045 |
|
$ |
1.85 |
|
|
$ |
10.00 |
- |
$ |
19.99 |
|
1,756,862 |
|
5.1 |
years |
|
$ |
15.10 |
|
1,439,173 |
|
$ |
14.51 |
|
|
$ |
20.00 |
- |
$ |
24.99 |
|
1,014,043 |
|
4.1 |
years |
|
$ |
21.88 |
|
809,531 |
|
$ |
22.06 |
|
|
$ |
25.00 |
- |
$ |
32.85 |
|
19,552 |
|
7.4 |
years |
|
$ |
32.85 |
|
9,774 |
|
$ |
32.85 |
|
|
|
|
|
|
|
|
3,417,029 |
|
5.1 |
years |
|
$ |
14.78 |
|
2,645,523 |
|
$ |
15.03 |
|
12
Total expense related to stock options for the three months ended June 30, 2016 and 2015 was approximately $1.8 million and $2.7 million, respectively. Future expense for these options is expected to be approximately $7.8 million over the next four years.
Performance Stock Option Unit Activity
On June 29, 2016, the Company granted 622,084 performance-based stock option units with a value at the date of grant of $4.8 million, determined using a Monte Carlo simulation model. All of the units granted in the current period vest and become exercisable in three equal tranches, each being subject to attainment of performance criteria and a subsequent service period established by the compensation committee of the board of directors (“Comp Committee”). Each of the three tranches may vest in a number of stock options, from zero to 300% of the initial award, each having an exercise price of $21.32, based on the attainment of certain revenue growth and operating margin targets for the years ending March 31, 2017, 2018, and 2019 respectively. Each tranche is subject to a service period following the respective performance periods, such that each tranche will cliff vest in two separate 50% increments over two years beginning with the Comp Committee meeting that immediately follows the end of the respective performance period.
Performance stock option unit activity for the three-month period ended June 30, 2016 was:
|
|
|
|
|
|
|
|
Weighted-average |
|
|
|
|
|
|
|
|
|
|
Weighted-average |
|
remaining |
|
|
Aggregate |
|
|
|
|
Number |
|
|
exercise price |
|
contractual term |
|
|
intrinsic value |
|
|
|
|
of shares |
|
|
per share |
|
(in years) |
|
|
(in thousands) |
|
|
Outstanding at March 31, 2016 |
— |
$ |
— |
||||||||
|
Granted |
622,084 |
$ |
21.32 | ||||||||
|
Outstanding at June 30, 2016 |
|
622,084 |
|
$ |
21.32 |
|
2.9 |
|
$ |
417 |
|
|
Exercisable at June 30, 2016 |
|
— |
|
$ |
— |
|
— |
|
$ |
— |
|
Total expense related to performance stock option units for the three months ended June 30, 2016 was not material. Future expense for these performance stock option units is expected to be approximately $4.8 million over the next four years.
Stock Appreciation Right (SAR) Activity
SAR activity for the three-month period ended June 30, 2016 was:
|
|
|
|
|
|
|
|
Weighted-average |
|
|
|
|
|
|
|
|
|
|
Weighted-average |
|
remaining |
|
|
Aggregate |
|
|
|
|
Number |
|
|
exercise price |
|
contractual term |
|
|
intrinsic value |
|
|
|
|
of shares |
|
|
per share |
|
(in years) |
|
|
(in thousands) |
|
|
Outstanding at March 31, 2016 |
245,404 |
$ |
40.00 | ||||||||
|
Outstanding at June 30, 2016 |
245,404 |
$ |
40.00 | 0.75 |
$ |
— |
|||||
|
Exercisable at June 30, 2016 |
|
— |
|
$ |
— |
|
— |
|
$ |
— |
|
Total expense related to SARs for the three months ended June 30, 2016 and 2015 was not material. Future expense for these SARs is expected to be approximately $0.1 million over the next year.
Restricted Stock Unit Activity
During the three months ended June 30, 2016, the Company granted time-vesting restricted stock units covering 1,099,159 shares of common stock with a value at the date of grant of $23.4 million. Of the restricted stock units granted in the current period, 1,085,055 vest in equal annual increments over four years and 14,104 vest in one year. Valuation of these units is equal to the quoted market price for the shares on the date of grant.
13
Non-vested time-vesting restricted stock unit activity for the three-month period ended June 30, 2016 was:
|
|
|
|
|
Weighted average |
|
|
|
|
|
|
|
|
|
fair value per |
|
Weighted-average |
|
|
|
|
|
Number |
|
share at grant |
|
remaining contractual |
|
|
|
|
|
of shares |
|
date |
|
term (in years) |
|
|
|
Outstanding at March 31, 2016 |
|
2,279,895 |
|
$ |
19.69 |
|
2.12 |
|
|
Granted |
|
1,099,159 |
|
$ |
21.25 |
|
|
|
|
Vested |
|
(334,886) |
|
$ |
18.44 |
|
|
|
|
Forfeited or cancelled |
|
(34,028) |
|
$ |
19.71 |
|
|
|
|
Outstanding at June 30, 2016 |
|
3,010,140 |
|
$ |
20.40 |
|
2.61 |
|
During the three months ended June 30, 2016, the Company granted performance-based restricted stock units covering 254,420 shares of common stock with a value at the date of grant of $6.3 million, using a Monte Carlo simulation model. All of the performance-based restricted stock units granted in the current period vest subject to attainment of performance criteria established by the Comp Committee. The units granted in the current period may vest in a number of shares from zero to 200% of the award, based on the total shareholder return of Acxiom common stock compared to total shareholder return of a group of peer companies established by the Comp Committee of the board of directors for the period from April 1, 2016 to March 31, 2019.
Non-vested performance-based restricted stock unit activity for the three-month period ended June 30, 2016 was:
|
|
|
|
|
Weighted average |
|
|
|
|
|
|
|
|
|
fair value per |
|
Weighted-average |
|
|
|
|
|
Number |
|
share at grant |
|
remaining contractual |
|
|
|
|
|
of shares |
|
date |
|
term (in years) |
|
|
|
Outstanding at March 31, 2016 |
|
516,818 |
|
$ |
18.62 |
|
1.67 |
|
|
Granted |
|
254,420 |
|
$ |
24.66 |
|
|
|
|
Forfeited or cancelled |
|
(8,898) |
|
$ |
17.43 |
|
|
|
|
Outstanding at June 30, 2016 |
|
762,340 |
|
$ |
20.65 |
|
1.87 |
|
Total expense related to all restricted stock units in the three months ended June 30, 2016 and 2015 was approximately $6.2 million and $5.1 million, respectively. Future expense for these restricted stock units is expected to be approximately $55.3 million over the next four years.
Other Performance Unit Activity
Other performance-based unit activity for the three-month period ended June 30, 2016 was:
|
|
|
|
|
Weighted average |
|
|
|
|
|
|
|
|
|
fair value per |
|
Weighted-average |
|
|
|
|
|
Number |
|
share at grant |
|
remaining contractual |
|
|
|
|
|
of shares |
|
date |
|
term (in years) |
|
|
|
Outstanding at March 31, 2016 |
|
635,655 |
|
$ |
4.07 |
|
1.30 |
|
|
Outstanding at June 30, 2016 |
|
635,655 |
|
$ |
4.07 |
|
1.05 |
|
Total expense related to other performance units for the three months ended June 30, 2016 and 2015 was $0.2 million in both periods. Future expense for these performance units is expected to be approximately $1.1 million over the next two years.
14
4.DISCONTINUED OPERATIONS:
IT Infrastructure Management business (“ITO”)
During fiscal 2016, the Company completed the sale of its ITO business to Charlesbank Capital Partners and M/C Partners. The business qualified for treatment as discontinued operations during fiscal 2016. Accordingly, the results of operations, cash flows, and the balance sheet amounts pertaining to ITO, for all periods reported, have been classified as discontinued operations in the condensed consolidated financial statements.
Summary results of operations of ITO for the three months ended June 30, 2015, are segregated and included in earnings from discontinued operations, net of tax, in the condensed consolidated statements of operations.
The following table is a reconciliation of the major classes of line items constituting earnings from discontinued operations, net of tax (dollars in thousands):
|
|
|
For the Three months ended |
|
||||
|
|
|
June 30, |
|
||||
|
|
|
2016 |
|
2015 |
|
||
|
Major classes of line items constituting earnings from discontinued operations, net of tax: |
|
|
|
|
|
|
|
|
Revenues |
|
$ |
— |
|
$ |
52,580 |
|
|
Cost of revenue |
|
|
— |
|
|
40,568 |
|
|
Gross profit |
|
|
— |
|
|
12,012 |
|
|
Operating expenses: |
|
|
|
|
|
|
|
|
Sales and marketing |
|
|
— |
|
|
998 |
|
|
General and administrative |
|
|
— |
|
|
3,768 |
|
|
Total operating expenses |
|
|
— |
|
|
4,766 |
|
|
Income from discontinued operations |
|
|
— |
|
|
7,246 |
|
|
Interest expense |
|
|
— |
|
|
(564) |
|
|
Other, net |
|
|
— |
|
|
(3) |
|
|
Earnings from discontinued operations before income taxes |
|
|
— |
|
|
6,679 |
|
|
Income taxes |
|
|
— |
|
|
2,536 |
|
|
Earnings from discontinued operations, net of tax |
|
$ |
— |
|
$ |
4,143 |
|
ITO was a provider of managed hosting and cloud infrastructure services, optimized for mid-tier enterprises. The Company entered into certain agreements with ITO in which support services, including data center co-location services, are provided from the Company to ITO, and from ITO to the Company. Additionally, the Company entered into certain other agreements with ITO to provide or receive leased office space. The terms of these agreements range from several months to the longest of which continues through July 2020. The agreements generally provide cancellation provisions, without penalty, at various times throughout the term. For the quarter ended June 30, 2016, cash inflows and outflows related to the agreements, included in cash flows from operating activities in the condensed consolidated statements of cash flows, were $1.8 million and $1.5 million, respectively. Revenues and expenses related to the agreements, included in income (loss) from continued operations in the condensed consolidated statements of operations, were $1.7 million and $1.4 million, respectively.
15
5.OTHER CURRENT AND NONCURRENT ASSETS:
Other current assets consist of the following (dollars in thousands):
|
|
|
June 30, |
|
March 31, |
|
||
|
|
|
2016 |
|
2016 |
|
||
|
Prepaid expenses |
|
$ |
22,119 |
|
$ |
25,365 |
|
|
Assets of non-qualified retirement plan |
|
|
12,800 |
|
|
12,532 |
|
|
Other current assets |
|
$ |
34,919 |
|
$ |
37,897 |
|
Other noncurrent assets consist of the following (dollars in thousands):
|
|
|
June 30, |
|
March 31, |
|
||
|
|
|
2016 |
|
2016 |
|
||
|
Acquired intangible assets, net |
|
$ |
17,850 |
|
$ |
19,203 |
|
|
Deferred data acquisition costs |
|
|
1,273 |
|
|
1,644 |
|
|
Deferred expenses |
|
|
1,035 |
|
|
883 |
|
|
Prepaid expenses |
|
|
1,381 |
|
|
1,404 |
|
|
Other miscellaneous noncurrent assets |
|
|
2,008 |
|
|
2,181 |
|
|
Noncurrent assets |
|
$ |
23,547 |
|
$ |
25,315 |
|
6.GOODWILL:
The following table summarizes Goodwill activity, by segment, for the three months ended June 30, 2016 (dollars in thousands).
|
|
|
|
|
|
|
|
|
|
|
|
|
||
|
|
|
Marketing |
|
Audience |
|
|
|
|
|
|
|||
|
|
|
Services |
|
Solutions |
|
Connectivity |
|
Total |
|
||||
|
Balance at March 31, 2016 |
|
$ |
124,586 |
|
$ |
273,430 |
|
$ |
94,729 |
|
$ |
492,745 |
|
|
Allant adjustment |
|
|
— |
|
|
19 |
|
|
— |
|
|
19 |
|
|
Change in foreign currency translation adjustment |
|
|
(115) |
|
|
— |
|
|
(51) |
|
|
(166) |
|
|
Balance at June 30, 2016 |
|
$ |
124,471 |
|
$ |
273,449 |
|
$ |
94,678 |
|
$ |
492,598 |
|
Goodwill by component included in each segment as of June 30, 2016 was:
|
|
|
Marketing |
|
Audience |
|
|
|
|
|
|
|
||
|
|
|
Services |
|
Solutions |
|
Connectivity |
|
Total |
|
||||
|
U.S. |
|
$ |
116,594 |
|
$ |
273,449 |
|
$ |
91,164 |
|
$ |
481,207 |
|
|
APAC |
|
|
7,877 |
|
|
— |
|
|
3,514 |
|
|
11,391 |
|
|
Balance at June 30, 2016 |
|
$ |
124,471 |
|
$ |
273,449 |
|
$ |
94,678 |
|
$ |
492,598 |
|
16
7.LONG-TERM DEBT:
Long-term debt consists of the following (dollars in thousands):
|
|
|
June 30, |
|
March 31, |
|
||
|
|
|
2016 |
|
2016 |
|
||
|
Term loan credit agreement |
|
$ |
177,500 |
|
$ |
185,000 |
|
|
Other debt and long-term liabilities |
|
|
7,302 |
|
|
7,856 |
|
|
Total long-term debt and capital leases |
|
|
184,802 |
|
|
192,856 |
|
|
|
|
|
|
|
|
|
|
|
Less current installments |
|
|
32,262 |
|
|
32,243 |
|
|
Less deferred debt financing costs |
|
|
2,416 |
|
|
2,716 |
|
|
Long-term debt, excluding current installments and deferred debt financing costs |
|
$ |
150,124 |
|
$ |
157,897 |
|
The Company’s amended and restated credit agreement provides for (1) term loans up to an aggregate principal amount of $300 million and (2) revolving credit facility borrowings consisting of revolving loans, letter of credit participations and swing-line loans up to an aggregate amount of $300 million.
The term loan is payable in quarterly installments of $7.5 million through September 2017, followed by quarterly installments of $11.3 million through June 2018, with a final payment of $106.3 million due October 9, 2018. The revolving loan commitment expires October 9, 2018.
Term loan and revolving credit facility borrowings bear interest at LIBOR or at an alternative base rate plus a credit spread. At June 30, 2016, the LIBOR credit spread was 2.00%. There were no revolving credit borrowings outstanding at June 30, 2016 or March 31, 2016. The weighted-average interest rate on term loan borrowings at June 30, 2016 was 2.6%. Outstanding letters of credit at June 30, 2016 were $2.1 million.
The term loan allows for prepayments before maturity. The credit agreement is secured by the accounts receivable of Acxiom and its domestic subsidiaries, as well as by the outstanding stock of certain Acxiom subsidiaries.
Under the terms of the term loan, the Company is required to maintain certain debt-to-cash flow and debt service coverage ratios, among other restrictions. At June 30, 2016, the Company was in compliance with these covenants and restrictions. In addition, if certain financial ratios and other conditions are not satisfied, the revolving credit facility limits the Company’s ability to pay dividends in excess of $30 million in any fiscal year (plus additional amounts in certain circumstances).
On March 10, 2014, the Company entered into an interest rate swap agreement. The agreement provides for the Company to pay interest through March 10, 2017 at a fixed rate of 0.98% plus the applicable credit spread on $50.0 million notional amount, while receiving interest for the same period at the LIBOR rate on the same notional amount. The LIBOR rate as of June 30, 2016 was 0.65%. The swap was entered into as a cash flow hedge against LIBOR interest rate movements on the term loan. The Company assesses the effectiveness of the hedge based on the hypothetical derivative method. There was no ineffectiveness for the period ended June 30, 2016. Under the hypothetical derivative method, the cumulative change in fair value of the actual swap is compared to the cumulative change in fair value of the hypothetical swap, which has terms that identically match the critical terms of the hedged transaction. Thus, the hypothetical swap is presumed to perfectly offset the hedged cash flows. The change in the fair value of the hypothetical swap will then be regarded as a proxy for the present value of the cumulative change in the expected future cash flows from the hedged transactions. All of the fair values are derived from an interest-rate futures model. As of June 30, 2016, the hedge relationship still qualified as an effective hedge under applicable accounting standards. Consequently, all changes in fair value of the derivative will be deferred and recorded in other comprehensive income (loss) until the related forecasted transaction is recognized in the condensed consolidated statement of operations. The fair market value of the derivative was zero at inception and an unrealized loss of $0.1 million since inception is recorded in other comprehensive income (loss). The fair value of the interest rate swap agreement recorded in accumulated other comprehensive income (loss) may be recognized in the condensed consolidated statement of operations if certain terms of the floating-rate debt
17
change, if the floating-rate debt is extinguished or if the interest rate swap agreement is terminated prior to maturity. The Company has assessed the creditworthiness of the counterparty of the swap and concludes that no substantial risk of default exists as of June 30, 2016.
8.ALLOWANCE FOR DOUBTFUL ACCOUNTS:
Trade accounts receivable are presented net of allowances for doubtful accounts, returns and credits of $6.9 million at June 30, 2016 and $7.3 million at March 31, 2016.
9.SEGMENT INFORMATION:
The Company reports segment information consistent with the way management internally disaggregates its operations to assess performance and to allocate resources.
Revenues and cost of revenue are generally directly attributed to the segments. Certain revenue contracts are allocated among the segments based on the relative value of the underlying products and services. Cost of revenue, excluding non-cash stock compensation expense and purchased intangible asset amortization, is directly charged in most cases and allocated in certain cases based upon proportional usage.
Operating expenses, excluding non-cash stock compensation expense and purchased intangible asset amortization, are attributed to the segment groups as follows:
|
· |
Research and development expenses are primarily directly recorded to each segment group based on identified products supported. |
|
· |
Sales and marketing expenses are primarily directly recorded to each segment group based on products supported and sold. |
|
· |
General and administrative expenses are generally not allocated to the segments unless directly attributable. |
|
· |
Gains, losses and other items, net are not allocated to the segment groups. |
We do not track our assets by operating segments. Consequently, it is not practical to show assets by operating segment.
18
The following table presents information by business segment (dollars in thousands):
|
|
|
For the Three months ended |
|
||||
|
|
|
June 30, |
|
||||
|
|
|
2016 |
|
2015 |
|
||
|
Revenues: |
|
|
|
|
|
|
|
|
Marketing Services |
|
$ |
109,715 |
|
$ |
107,726 |
|
|
Audience Solutions |
|
|
73,744 |
|
|
68,550 |
|
|
Connectivity |
|
|
31,342 |
|
|
20,619 |
|
|
Total segment revenues |
|
$ |
214,801 |
|
$ |
196,895 |
|
|
|
|
|
|
|
|
|
|
|
Gross profit(1): |
|
|
|
|
|
|
|
|
Marketing Services |
|
$ |
37,466 |
|
$ |
36,034 |
|
|
Audience Solutions |
|
|
41,912 |
|
|
36,824 |
|
|
Connectivity |
|
|
17,575 |
|
|
11,953 |
|
|
Total segment gross profit |
|
$ |
96,953 |
|
$ |
84,811 |
|
|
|
|
|
|
|
|
|
|
|
Income (loss) from operations(1): |
|
|
|
|
|
|
|
|
Marketing Services |
|
$ |
20,145 |
|
$ |
16,853 |
|
|
Audience Solutions |
|
|
25,096 |
|
|
24,087 |
|
|
Connectivity |
|
|
291 |
|
|
(791) |
|
|
Total segment income from operations |
|
$ |
45,532 |
|
$ |
40,149 |
|
|
|
|
|
|
|
|
|
|
|
(1) |
Gross profit and Income (loss) from operations reflect only the direct and allocable controllable costs of each segment and do not include allocations of corporate expenses (primarily general and administrative expenses) and gains, losses, and other items, net. Additionally, Gross profit and Income (loss) from operations do not reflect non-cash stock compensation expense and purchased intangible asset amortization. |
The following table reconciles total operating segment gross profit to gross profit and total operating segment income from operations to income (loss) from operations:
|
|
|
For the Three months ended |
|
||||
|
|
|
June 30, |
|
||||
|
|
|
2016 |
|
2015 |
|
||
|
|
|
|
|
|
|
|
|
|
Total segment gross profit |
|
$ |
96,953 |
|
$ |
84,811 |
|
|
|
|
|
|
|
|
|
|
|
Less: |
|
|
|
|
|
|
|
|
Purchased intangible asset amortization |
|
|
4,077 |
|
|
3,754 |
|
|
Non-cash stock compensation |
|
|
894 |
|
|
429 |
|
|
Accelerated amortization |
|
|
— |
|
|
1,442 |
|
|
Gross profit |
|
$ |
91,982 |
|
$ |
79,186 |
|
|
|
|
|
|
|
|
|
|
|
Total segment income from operations |
|
$ |
45,532 |
|
$ |
40,149 |
|
|
|
|
|
|
|
|
|
|
|
Less: |
|
|
|
|
|
|
|
|
Corporate expenses (principally general and administrative) |
|
|
24,389 |
|
|
25,478 |
|
|
Gains, losses and other items, net |
|
|
314 |
|
|
807 |
|
|
Purchased intangible asset amortization |
|
|
4,077 |
|
|
3,754 |
|
|
Non-cash stock compensation |
|
|
8,590 |
|
|
8,123 |
|
|
Separation and transformation costs |
|
|
— |
|
|
3,414 |
|
|
Accelerated amortization |
|
|
— |
|
|
1,442 |
|
|
Income (loss) from operations |
|
$ |
8,162 |
|
$ |
(2,869) |
|
19
10.RESTRUCTURING, IMPAIRMENT AND OTHER CHARGES:
The following table summarizes the restructuring activity for the three months ended June 30, 2016 (dollars in thousands):
|
|
|
Associate-related |
|
Ongoing |
|
|
|
|||
|
|
|
reserves |
|
contract costs |
|
Total |
|
|||
|
|
|
|
|
|
|
|
|
|
|
|
|
March 31, 2016 |
|
$ |
2,855 |
|
$ |
3,524 |
|
$ |
6,379 |
|
|
Restructuring charges and adjustments |
|
|
279 |
|
|
— |
|
|
279 |
|
|
Payments |
|
|
(2,011) |
|
|
(879) |
|
|
(2,890) |
|
|
June 30, 2016 |
|
$ |
1,123 |
|
$ |
2,645 |
|
$ |
3,768 |
|
|
|
|
|
|
|
|
|
|
|
|
|
The above balances are included in accrued expenses and other liabilities on the condensed consolidated balance sheet.
Restructuring Plans
In the three months ended June 30, 2016, the Company recorded a total of $0.3 million in restructuring charges and adjustments included in gains, losses and other items, net in the condensed consolidated statement of operations. The expense included severance and other associate-related charges of $0.3 million and represented adjustments to the fiscal 2016 restructuring plan.
In fiscal 2016, the Company recorded a total of $12.0 million in restructuring charges and adjustments included in gains, losses and other items, net in the condensed consolidated statement of operations. The expense included severance and other associate-related charges of $8.6 million, lease termination charges and accruals of $3.0 million, and leasehold improvement write-offs of $0.4 million.
The associate-related accruals of $8.6 million relate to the termination of associates in the United States, Europe, Brazil and Australia. Of the amount accrued for 2016, $0.8 million remained accrued as of June 30, 2016. These costs are expected to be paid out in fiscal 2017.
The lease termination charges and accruals of $3.0 million included a $1.4 million lease early-termination fee in France, a lease accrual of $0.2 million, and a $1.4 million increase to the fiscal 2015 lease restructuring plans. The fiscal 2016 lease early-termination fee and lease accrual were fully paid during fiscal 2016.
In fiscal 2015, the Company recorded a total of $21.8 million in restructuring charges and adjustments included in gains, losses and other items, net in the condensed consolidated statement of operations. The expense included severance and other associate-related charges of $13.3 million, lease accruals of $6.5 million, and the write-off of leasehold improvements of $2.0 million.
The associate-related accruals of $13.3 million related to the termination of associates in the United States, Europe, Australia, and China and included an increase of $0.7 million to the fiscal 2014 restructuring plan. Of the amount accrued for 2015, $0.3 million remained accrued as of June 30, 2016. These costs are expected to be paid out in fiscal 2017.
The lease accruals of $6.5 million were determined in accordance with the accounting standards that govern exit costs. These accounting standards require the Company to accrue for lease costs that will continue to be incurred without economic benefit to the Company upon the date that the Company ceases using the leased properties. The Company has ceased using certain leased office facilities. The Company intends to attempt to sublease the facilities to the extent possible. The Company established a liability for the fair value of the remaining lease payments, partially offset by the estimated sublease payments to be received over the course of the leases. The fair value of these liabilities is based on a net present value model using a credit-adjusted risk-free rate. The liability will be paid out over the remainder of the leased properties’ terms, which continue through November 2025. Actual sublease terms may differ from the estimates originally made by the Company. Any future changes in the estimates or in the actual sublease income could require future
20
adjustments to the liabilities, which would impact net earnings (loss) in the period the adjustment is recorded. Of the amount accrued for 2015, $2.6 million remained accrued as of June 30, 2016.
Gains, Losses and Other Items
Gains, losses and other items for each of the periods presented are as follows (dollars in thousands):
|
|
|
For the Three months ended |
|
||||
|
|
|
June 30, |
|
||||
|
|
|
2016 |
|
2015 |
|
||
|
Restructuring plan charges and adjustments |
|
$ |
279 |
|
$ |
803 |
|
|
Other |
|
|
35 |
|
|
4 |
|
|
|
|
$ |
314 |
|
$ |
807 |
|
11.COMMITMENTS AND CONTINGENCIES:
Legal Matters
The Company is involved in various claims and legal proceedings. Management routinely assesses the likelihood of adverse judgments or outcomes to these matters, as well as ranges of probable losses, to the extent losses are reasonably estimable. The Company records accruals for these matters to the extent that management concludes a loss is probable and the financial impact, should an adverse outcome occur, is reasonably estimable. These accruals are reflected in the Company’s condensed consolidated financial statements. In management’s opinion, the Company has made appropriate and adequate accruals for these matters and management believes the probability of a material loss beyond the amounts accrued to be remote. However, the ultimate liability for these matters is uncertain, and if accruals are not adequate, an adverse outcome could have a material effect on the Company’s consolidated financial condition or results of operations. The Company maintains insurance coverage above certain limits. There are currently no matters pending against the Company or its subsidiaries for which the potential exposure is considered material to the Company’s condensed consolidated financial statements.
Commitments
The Company leases data processing equipment, office furniture and equipment, land and office space under noncancellable operating leases. The Company has a future commitment for lease payments over the next 24 years of $83.0 million.
In connection with the disposal of certain assets, the Company guaranteed a lease for the buyer of the assets. This guarantee was made by the Company primarily to facilitate favorable financing terms for the third party. Should the third party default, the Company would be required to perform under this guarantee. At June 30, 2016, the Company’s maximum potential future payments under this guarantee totaled $0.4 million.
21
12.INCOME TAX:
In determining the quarterly provision for income taxes, the Company makes its best estimate of the effective tax rate expected to be applicable for the full fiscal year. The estimated annual effective income tax rate for the current fiscal year is impacted by state income taxes, federal research tax credits, losses in foreign jurisdictions, and nondeductible share-based compensation. State income taxes are influenced by the geographic and legal entity mix of the Company’s U.S. income as well as the diversity of rules among the states. In addition, the Company qualifies for research tax credits in certain states. The Company does not record a tax benefit for certain foreign losses due to uncertainty of future benefit.
13.FINANCIAL INSTRUMENTS:
The following methods and assumptions were used to estimate the fair value of each class of financial instruments for which it is practicable to estimate that value:
|
· |
Cash and cash equivalents, trade receivables, unbilled and notes receivable, short-term borrowings and trade payables - The carrying amount approximates fair value because of the short maturity of these instruments. |
|
· |
Long-term debt - The interest rate on the term loan and revolving credit agreement is adjusted for changes in market rates and therefore the carrying value of these loans approximates fair value. The estimated fair value of other long-term debt was determined based upon the present value of the expected cash flows considering expected maturities and using interest rates currently available to the Company for long-term borrowings with similar terms. At June 30, 2016, the estimated fair value of long-term debt approximates its carrying value. |
|
· |
Derivative instruments included in other liabilities - The carrying value is adjusted to fair value through other comprehensive income (loss) at each balance sheet date. The fair value is determined from an interest-rate futures model. |
Under applicable accounting standards financial assets and liabilities are classified in their entirety based on the lowest level of input that is significant to the fair value measurements. The Company assigned assets and liabilities to the hierarchy in the accounting standards, which is Level 1 - quoted prices in active markets for identical assets or liabilities, Level 2 - significant other observable inputs and Level 3 - significant unobservable inputs.
The following table presents the balances of assets and liabilities measured at fair value as of June 30, 2016 (dollars in thousands):
|
|
|
Level 1 |
|
Level 2 |
|
Level 3 |
|
Total |
|
||||
|
Assets: |
|
|
|
|
|
|
|
|
|
|
|
|
|
|
Other current assets |
|
$ |
12,800 |
|
$ |
— |
|
$ |
— |
|
$ |
12,800 |
|
|
Total assets |
|
$ |
12,800 |
|
$ |
— |
|
$ |
— |
|
$ |
12,800 |
|
|
|
|
|
|
|
|
|
|
|
|
|
|
|
|
|
Liabilities: |
|
|
|
|
|
|
|
|
|
|
|
|
|
|
Other accrued expenses |
|
$ |
— |
|
$ |
109 |
|
$ |
— |
|
$ |
109 |
|
|
Total liabilities |
|
$ |
— |
|
$ |
109 |
|
$ |
— |
|
$ |
109 |
|
22
14.SUBSEQUENT EVENTS:
Impact Email Business Disposition
On August 4, 2016, the Company announced that it had entered into a definitive agreement to sell its Impact email business to Zeta Interactive for a total consideration of $22 million. The Company will also enter into a separate multi-year contract to provide Zeta Interactive with Connectivity and Audience Solutions services. These transactions sharpen the Company’s focus on providing the data foundation for the world’s best marketers and opens the door to deeper partnerships with the marketing ecosystem.
The sale is expected to close in the second quarter of fiscal 2017, following the satisfaction of customary closing conditions. The Company plans to use the proceeds from the sale to help fund the expansion of its share repurchase program.
Stock Repurchase Program Expansion
On July 28, 2016, the board of directors adopted an amendment to its existing stock repurchase program. The amendment increases its stock repurchase authorization from $300 to $400 million and extends the program through June 30, 2018. The Company is authorized to repurchase shares from time to time over the next 18 months in open market or privately negotiated transactions, depending on prevailing market conditions and other factors. The stock repurchase program may be suspended or discontinued at any time.
23
PART I. FINANCIAL INFORMATION
Item 2. Management’s Discussion and Analysis of Financial Condition and Results of Operations
Introduction and Overview
Acxiom Corporation is a global technology and enablement services company with a vision to power a world where all marketing is relevant. We provide the data foundation for the world’s best marketers. By making it safe and easy to activate, validate, enhance, and unify data, we provide marketers with the ability to deliver relevant messages at scale and tie those messages back to actual results. Our products and services enable people-based marketing, allowing our clients to generate higher return on investment and drive better omni-channel customer experiences.
Acxiom is a Delaware corporation founded in 1969 in Conway, Arkansas. Our common stock is listed on the NASDAQ Global Select Market under the symbol “ACXM.” We serve a global client base from locations in the United States, Europe, and the Asia-Pacific (“APAC”) region. Our client list includes more than 3,000 of the world’s largest and best known brands across most major industry verticals, including but not limited to financial, insurance and investment services, automotive, retail, telecommunications, high tech, healthcare, travel, entertainment, non-profit, and government.
Operating Segments
Our operating segments provide management with a comprehensive view of our key businesses based on how we manage our operations and measure results. Additional information related to our operating segments and geographic information is contained in Note 9 – Segment Information of the Notes to Condensed Consolidated Financial Statements.
Marketing Services
Our Marketing Services segment helps clients unify data at the individual level in a privacy-safe environment, so they can execute people-based marketing campaigns, tie back to real results, and drive a continual cycle of optimization. We help architect the foundation for data-driven marketing by delivering solutions that integrate customer and prospect data across the enterprise, thereby enabling our clients to establish a single view of the customer. We also support our clients in navigating the complexities of consumer privacy regulation, making it easy and safe for them to use innovative technology, maintain choice in channels and media, and stay agile in this competitive era of the consumer. These services allow our clients to generate higher return on marketing investments and, at the same time, drive better, more relevant customer experiences.
The Marketing Services segment includes the following service offerings: Marketing Database Services, Strategy and Analytics, and Impact Email Platform and Services.
|
· |
Marketing Database Services. Our Marketing Database offering provides solutions that unify consumer data across an enterprise, enabling clients to execute relevant, people-based marketing and activate data across the marketing ecosystem. Our consumer marketing databases, which we design, build, and manage for our clients, make it possible for our clients to collect and analyze information from all sources, thereby increasing customer acquisition, retention, and loyalty. Through our growing partner network, clients are able to integrate their data with best-of-breed marketing solutions while respecting and protecting consumer privacy. |
Marketing Database services are generally provided under long-term contracts. Our revenue consists primarily of recurring monthly billings, and to a lesser extent, other volume and variable based billings.
|
· |
Strategy and Analytics. Our Strategy and Analytics offering consists of marketing strategists and data scientists who leverage industry knowledge and advanced analytics to assist our clients with identifying growth opportunities, addressing marketing data and technology needs, and adopting best practices. In addition, we help our clients identify and address their data privacy and governance |
24
|
requirements. |
Strategy and Analytics revenue consists primarily of project-based fees.
|
· |
Impact Email Platform and Services. Acxiom Impact™ provides email and cross-channel data-driven marketing solutions for enterprise marketers, including a proprietary marketing platform and agency services. |
Acxiom ImpactTM revenue consists of (1) volume-based fees for the use of the Impact email platform and (2) project-based and retainer-based fees for associated agency services.
Audience Solutions
Our Audience Solutions segment helps clients validate the accuracy of their data, enhance it with additional insight, and keep it up to date, enabling clients to reach desired audiences with highly relevant messages. Leveraging our recognition and data assets, clients can identify, segment, and differentiate their audiences for more effective marketing and superior customer experiences. Audience Solutions’ offerings include InfoBase, our large consumer data store that serves as the basis for Acxiom’s consumer demographics products, and AbiliTec, our patented identity resolution technology that assists our clients in reconciling and managing variations of customer identity over time and across multiple channels.
|
· |
InfoBase. With more than 1,500 demographic, socio-economic and lifestyle data elements and several thousand predictive models, our InfoBase products provide marketers with the ability to identify and reach the right audience with the right message across both traditional and digital channels. Through partnerships with a wide range of online publishers and digital marketing platforms, including Facebook, Twitter, 4INFO, AOL, eBay, MSN, and Yahoo!, marketers can use InfoBase data to create and target specific audiences. For example, using InfoBase data available inside of Facebook’s Custom Audiences tool, a local pet store can run a campaign targeting male pet-owners who live in zip code 94123. Similarly, a regional bank can leverage our data to create and target an audience of households with children that generate a certain annual income and live in Central Arkansas. |
|
· |
AbiliTec. As shown in the illustration below, AbiliTec helps brands recognize individuals and households using a number of different input variables and connects identities online and offline. |

By identifying and linking multiple identifiers and data elements back to a persistent ID, our clients are able to create a single view of the customer, which allows them to perform more effective audience targeting and deliver better, more relevant customer experiences.
Our Audience Solutions revenue consists primarily of licensing fees, which are typically in the form of recurring monthly billings, but can also be based on transactional volume or one-time usage. In addition, Audience Solutions generates digital data revenue from certain digital publishers and addressable television providers in the form of revenue sharing agreements. Our Marketing Database clients are a significant channel for our Audience Solutions offerings.
25
Connectivity
As shown in the illustration below, our Connectivity segment activates data and makes it portable across the open marketing ecosystem.
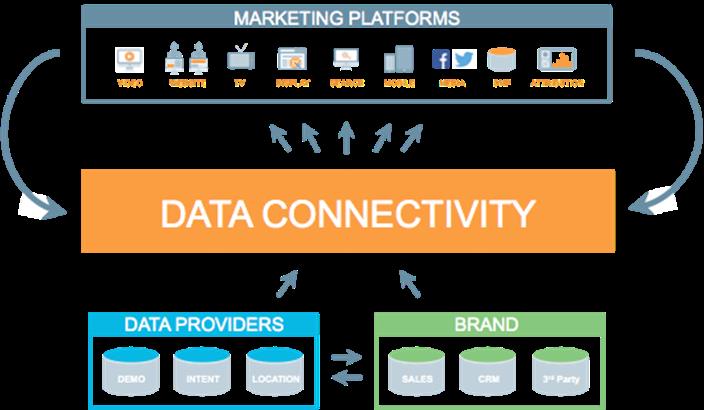
Through integrations with more than 300 leading digital marketing platforms and data providers, we have become a key point of entry into the digital ecosystem, thus helping our clients eliminate data silos and unlock greater value from the marketing tools they use every day. We operate as an open connectivity layer enabling our clients to reach consumers across channels and measure the impact of marketing on sales.
Today, we offer two primary services through our LiveRamp Connect platform:
|
· |
Data Onboarding. Data Onboarding enables clients to activate offline data for use across their preferred marketing platforms for display, search, video, mobile, site optimization, data management, attribution, and more. By activating data through a central hub that is automated, secure, and privacy-safe, brands are able to reduce the number of places they send personally identifiable information. Data files are securely imported, anonymized, matched to online or mobile devices and digital IDs, and distributed for use to any of the more than 300 partners in our network. |
|
· |
Customer Link. Customer Link helps clients tie together customer data in a privacy-safe way. Using the same infrastructure developed for Data Onboarding, we ingest data from a variety of sources, including campaign impression data from digital advertising platforms, website traffic, and purchase data, and tie it to anonymous links that represent a unique consumer. This enables our clients to create a unified view of online and offline customer activity that can be used to improve campaign performance. |
Our Connectivity revenue consists primarily of recurring subscription fees paid by advertisers, and to a lesser extent, transactional revenue from certain digital publishers and addressable television providers in the form of revenue-sharing agreements.
Summary
Together, our products and services form the “power grid” for data, the critical foundation for people-based marketing that brands need to engage consumers across today’s highly fragmented landscape of channels and devices.
We provide integrations with the largest number of marketing platforms and data providers in the digital marketing ecosystem, enabling our clients to innovate through their preferred choice of technology, data, and services providers. Our industry-leading recognition and data assets power best-in-class consumer identification and linking across channels and devices. And, our integrated services offering provides the
26
expertise required to manage large sets of data legally, ethically, securely, and in a way that protects consumer privacy.
Summary Results and Notable Events
A summary of the quarter ended June 30, 2016 is presented below:
|
· |
Revenues of $214.8 million, a 9.1% increase from $196.9 million in the same quarter a year ago. |
|
· |
Cost of revenue of $122.8 million, a 4.3% increase from $117.7 million in the same quarter a year ago. |
|
· |
Gross margin increased to 42.8% from 40.2% in the same quarter a year ago. |
|
· |
Total operating expenses of $83.8 million, a 2.2% increase from $82.1 million in the same quarter a year ago. |
|
· |
Cost of revenue and operating expenses for the quarters ended June 30, 2016 and 2015 include the following items: |
|
o |
Non-cash stock compensation of $8.6 million and $8.1 million, respectively (cost of revenue and operating expenses) |
|
o |
Purchased intangible asset amortization of $4.1 million and $3.8 million, respectively (cost of revenue) |
|
o |
Restructuring charges and other adjustments of $0.3 million and $0.8 million, respectively (operating expenses) |
|
o |
Separation and transformation costs of $0.0 million and $3.4 million, respectively (operating expenses) |
|
o |
Accelerated amortization of $0.0 million and $1.4 million, respectively (cost of revenue) |
|
· |
Net earnings from continuing operations of $4.0 million or $.05 per share compared to net loss from continuing operations of $5.2 million or $.07 per share in the same quarter a year ago. |
|
· |
The Company repurchased 0.9 million shares of its common stock for $20.2 million under the Company’s common stock repurchase program. |
The summary above is intended to identify to the reader some of the more significant events and transactions of the Company during the quarter ended June 30, 2016. However, this is not intended to be a full discussion of the Company’s results for the quarter. This should be read in conjunction with the following discussion of Results of Operations and Capital Resources and Liquidity and with the Company’s condensed consolidated financial statements and footnotes accompanying this quarterly report.
Results of Operations
A summary of selected financial information for each of the periods reported is presented below (dollars in thousands, except per share amounts):
|
|
|
For the Three months ended |
|
||||||
|
|
|
June 30, |
|
||||||
|
|
|
|
|
|
|
|
|
% |
|
|
|
|
2016 |
|
2015 |
|
Change |
|
||
|
Revenues |
|
$ |
214,801 |
|
$ |
196,895 |
|
9 |
|
|
Cost of revenue |
|
|
122,819 |
|
|
117,709 |
|
4 |
|
|
Gross profit |
|
|
91,982 |
|
|
79,186 |
|
16 |
|
|
Operating expenses |
|
|
83,820 |
|
|
82,055 |
|
2 |
|
|
Income/(loss) from operations |
|
|
8,162 |
|
|
(2,869) |
|
385 |
|
|
Net earnings (loss) from continuing operations |
|
|
3,976 |
|
|
(5,182) |
|
177 |
|
|
Diluted earnings (loss) per share from continuing operations |
|
$ |
0.05 |
|
$ |
(0.07) |
|
175 |
|
27
Revenues
The following table presents the Company’s revenue by reporting segment for each of the periods reported (dollars in thousands):
|
|
|
For the Three months ended |
|
||||||
|
|
|
June 30, |
|
||||||
|
|
|
|
|
|
|
|
|
% |
|
|
|
|
2016 |
|
2015 |
|
Change |
|
||
|
Marketing Services |
|
$ |
109,715 |
|
$ |
107,726 |
|
2 |
|
|
Audience Solutions |
|
|
73,744 |
|
|
68,550 |
|
8 |
|
|
Connectivity |
|
|
31,342 |
|
|
20,619 |
|
52 |
|
|
Total revenues |
|
$ |
214,801 |
|
$ |
196,895 |
|
9 |
|
Total revenues were $214.8 million, an increase of 9.1%, or $17.9 million, from $196.9 million in the same quarter a year ago. Excluding the unfavorable impact of exchange rates ($0.7 million), total revenues increased 9.4%.
Marketing Services (“MS”) revenue for the quarter ended June 30, 2016 was $109.7 million, a $2.0 million, or 1.8%, increase compared to the same quarter a year ago. On a geographic basis, U.S. MS revenue increased $3.9 million, or 3.9%, due to an increase in Marketing Database revenue offset by a $3.4 million decrease in Acxiom Impact revenue as a result of contract losses. International MS revenue decreased $1.9 million, or 20.5%. Excluding the unfavorable impact of exchange rates ($0.5 million), International MS revenue decreased $1.4 million, primarily due to contract and volume reductions in APAC ($1.9 million). By line of business, increases in U.S. Marketing Database ($7.5 million) were offset by declines in U.S. Impact ($3.4 million), APAC Impact ($1.5 million), and the Brazil exit ($0.6 million).
Audience Solutions (“AS”) revenue for the quarter ended June 30, 2016 was $73.7 million, a $5.2 million, or 7.6%, increase compared to the same quarter a year ago. On a geographic basis, U.S. AS revenue increased $5.4 million, or 9.0%, due to increases in Digital Data business with existing partners. International AS revenue decreased $0.2 million, or 2.9%. International AS revenue was impacted by the exit from Brazil ($0.3 million) and Australia ($0.7 million), offset partially by an increase in Europe ($0.7 million). By line of business, AS revenue growth in Consumer Data ($7.2 million), due primarily to increases in revenue from digital data partners, were offset by declines in Recognition ($2.1 million) due primarily to a terminated contract.
Connectivity revenue for the quarter ended June 30, 2016 was $31.3 million, a $10.7 million, or 52.0%, increase compared to the same quarter a year ago. On a geographic basis, U.S. Connectivity revenue increased $10.0 million, or 52.8%, from the same quarter a year ago due to LiveRamp new customer additions.
Cost of revenue and Gross profit
The following table presents the Company’s cost of revenue and gross profit for each of the periods presented (dollars in thousands):
|
|
|
For the Three months ended |
|
||||||
|
|
|
June 30, |
|
||||||
|
|
|
|
|
|
|
|
|
% |
|
|
|
|
2016 |
|
2015 |
|
Change |
|
||
|
Cost of revenue |
|
$ |
122,819 |
|
$ |
117,709 |
|
4 |
|
|
Gross profit |
|
$ |
91,982 |
|
$ |
79,186 |
|
16 |
|
|
Gross margin |
|
|
42.8% |
|
|
40.2% |
|
7 |
|
Cost of revenue: Includes all direct costs of sales such as data and other third party costs directly associated with revenue. Cost of revenue also includes operating expenses for each of the Company’s operations functions such as client services, account management, agency, strategy and analytics, IT, data acquisition, and products operations. Finally, cost of revenue includes amortization of internally developed software.
Cost of revenue was $122.8 million for the quarter ended June 30, 2016, a $5.1 million increase, or 4.3%, from the same quarter a year ago, and gross margins increased to 42.8% in the current year compared to 40.2% in the prior year. The gross margin increase is due to the Connectivity revenue increases and cost
28
efficiencies. U.S. gross margins increased to 43.7% in the current year from 41.8% in the prior year due to the Connectivity and AS revenue growth. International gross margins increased to 32.8% in the current year from 26.1% in the prior year due to cost reductions in APAC and Connectivity growth.
Operating Expenses
The following table presents the Company’s operating expenses for each of the periods presented (dollars in thousands):
|
|
|
For the Three months ended |
|
||||||
|
|
|
June 30, |
|
||||||
|
|
|
|
|
|
|
|
|
% |
|
|
|
|
2016 |
|
2015 |
|
Change |
|
||
|
Research and development |
|
$ |
18,652 |
|
$ |
20,011 |
|
(7) |
|
|
Sales and marketing |
|
|
37,348 |
|
|
29,494 |
|
27 |
|
|
General and administrative |
|
|
27,506 |
|
|
31,743 |
|
(13) |
|
|
Gains, losses and other items, net |
|
|
314 |
|
|
807 |
|
(61) |
|
|
Total operating expenses |
|
$ |
83,820 |
|
$ |
82,055 |
|
2 |
|
Research and development (“R&D”): Includes operating expenses for the Company’s engineering and product/project management functions supporting research, new development, and related product enhancement.
R&D expenses were $18.7 million for the quarter ended June 30, 2016, a decrease of $1.4 million, or 6.8%, compared to the same quarter a year ago, and is 8.7% of total revenues compared to 10.2% in the prior year. The decrease is due to a $1.4 million reduction in non-cash stock based compensation.
Sales and marketing (“S&M”): Includes operating expenses for the Company’s sales, marketing, and product marketing functions.
S&M expenses were $37.3 million for the quarter ended June 30, 2016, an increase of $7.9 million, or 26.6%, compared to the same quarter a year ago, and is 17.4% of total revenues compared to 15.0% in the prior year. The increase is due to headcount investments in U.S. Connectivity and AS sales partially offset by reductions in International operations.
General and administrative (G&A): Represents operating expenses for all corporate functions, including finance, human resources, legal, corporate IT, and the corporate office.
G&A expenses were $27.5 million for the quarter ended June 30, 2016, a decrease of $4.2 million, or 13.3%, compared to the same quarter a year ago, and is 12.8% of total revenues compared to 16.1% in the prior year. The decrease is due primarily to a decline in separation and transformation costs of $3.4 million.
Gains, losses, and other items, net: Represents restructuring costs and other adjustments.
Gains, losses and other items, net of $0.3 million for the quarter ended June 30, 2016 decreased $0.5 million, or 61.1%, compared to the same quarter a year ago. The current year amount is related primarily to restructuring charges associated with the Australia business.
29
Income (Loss) from Operations and Profit (Loss) Margins
The following table presents the Company’s income (loss) from operations and margin by segment for each of the periods presented (dollars in thousands):
|
|
|
For the Three months ended |
|
||||
|
|
|
June 30, |
|
||||
|
|
|
2016 |
|
2015 |
|
||
|
Operating income (loss) and margin: |
|
|
|
|
|
|
|
|
Marketing Services |
|
$ |
20,145 |
|
$ |
16,853 |
|
|
|
|
|
18.4% |
|
|
15.6% |
|
|
Audience Solutions |
|
|
25,096 |
|
|
24,087 |
|
|
|
|
|
34.0% |
|
|
35.1% |
|
|
Connectivity |
|
|
291 |
|
|
(791) |
|
|
|
|
|
0.9% |
|
|
(3.8%) |
|
|
Less: |
|
|
|
|
|
|
|
|
Corporate |
|
|
24,389 |
|
|
30,334 |
|
|
Gains, losses and other items, net |
|
|
314 |
|
|
807 |
|
|
Purchased intangible asset amortization |
|
|
4,077 |
|
|
3,754 |
|
|
Non-cash stock compensation |
|
|
8,590 |
|
|
8,123 |
|
|
Income (loss) from operations |
|
$ |
8,162 |
|
$ |
(2,869) |
|
|
Total operating margin |
|
|
3.8% |
|
|
(1.5%) |
|
Income from operations was $8.2 million for the quarter ended June 30, 2016 compared to a loss of $2.9 million for the same quarter a year ago. The increase in income from operations of $11.0 million was due primarily to an increase in MS income from operations and a decrease in corporate expenses primarily related to lower separation costs.
MS income from operations was $20.1 million, an 18.4% margin, for the quarter ended June 30, 2016 compared to $16.9 million, a 15.6% margin, for the same quarter a year ago. U.S. margins increased to 19.0% in the current quarter from 17.6% due to R&D cost reductions. International margins increased to 9.6% from negative 5.8% due to gross margin improvements and S&M cost reductions and exchange rate variances.
AS income from operations was $25.1 million, a 34.0% margin, for the quarter ended June 30, 2016 compared to $24.1 million, a 35.1% margin, for the same quarter a year ago. U.S. margins decreased to 35.7% in the current quarter from 38.8% due to the investment in S&M headcount. International margin increased to 20.7% from 9.0% due to cost savings.
Connectivity income from operations was $0.3 million, a 0.9% margin, for the quarter ended June 30, 2016 compared to a loss of $0.8 million, a negative 3.8% margin, for the same quarter a year ago. The improvement is from new customers and upsell to existing customers.
Other Expense, Income Taxes and Other Items
Interest expense was $1.8 million for the quarter ended June 30, 2016 compared to $1.9 million for the same quarter a year ago. The decrease is primarily related to the term loan. The average balance decreased approximately $85 million and the average rate increased approximately 15 basis points.
Other income was $0.3 million for the quarters ended June 30, 2016 and 2015, respectively. Other income and expense primarily consists of foreign currency transaction gains and losses in each period reported.
Income tax expense was $2.7 million on pretax income of $6.7 million for the quarter ended June 30, 2016 compared to income tax expense of $0.7 million on a pretax loss of $4.5 million for the same quarter last year. The effective tax rates for both periods were impacted by state income taxes, nondeductible share-based compensation, and losses in foreign jurisdictions. The Company does not record the income tax benefit of certain of those losses due to uncertainty of future benefit. In addition, the quarter ended June 30, 2015 was impacted by the expiration of the federal research tax credit, which was permanently reinstated in December of 2015.
30
Capital Resources and Liquidity
Working Capital and Cash Flow
Working capital at June 30, 2016 totaled $147.8 million, a $4.2 million decrease when compared to $152.0 million at March 31, 2016, due primarily to treasury share repurchases.
The Company’s cash is primarily located in the United States. Approximately $11.4 million of the total cash balance of $150.2 million, or approximately 7.6%, is located outside of the United States. The Company has no current plans to repatriate this cash to the United States.
Accounts receivable days sales outstanding, from continuing operations, was 54 days at June 30, 2016 compared to 56 days at March 31, 2016, and is calculated as follows (dollars in thousands):
|
|
|
June 30, |
|
March 31, |
|
||
|
|
|
2016 |
|
2016 |
|
||
|
Numerator – trade accounts receivable, net |
|
$ |
127,655 |
|
$ |
138,650 |
|
|
Denominator: |
|
|
|
|
|
|
|
|
Quarter revenue |
|
|
214,801 |
|
|
224,655 |
|
|
Number of days in quarter |
|
|
91 |
|
|
91 |
|
|
Average daily revenue |
|
$ |
2,360 |
|
$ |
2,469 |
|
|
Days sales outstanding |
|
|
54 |
|
|
56 |
|
Net cash provided by operating activities was $0.8 million for the three months ended June 30, 2016, compared to $12.0 million in the same period a year ago. The $11.2 million decrease resulted primarily from the net decrease in working capital.
Investing activities used cash of $14.7 million during the three months ended June 30, 2016 compared to $16.1 million in the same period a year ago. Current year investing activities primarily consisted of capital expenditures ($10.7 million compared to $12.9 million in the prior period) and capitalization of software ($4.0 million compared to $2.8 million in the prior period).
Financing activities used cash of $24.8 million during the three months ended June 30, 2016 compared to $21.1 million in the same period a year ago. Financing activities in the current year period primarily consisted of treasury stock purchases of $20.2 million (0.9 million shares of the Company’s common stock pursuant to the board of directors’ approved stock repurchase plan) and payments of debt of $8.1 million.
On August 29, 2011, the board of directors adopted a common stock repurchase program. That program was subsequently modified and expanded, most recently on July 28, 2016 (see Note 14). Under the modified common stock repurchase program, the Company may purchase up to $400 million of its common stock through the period ending June 30, 2018. During the three months ended June 30, 2016, the Company repurchased 0.9 million shares of its common stock for $20.2 million. Through June 30, 2016, the Company had repurchased a total of 16.4 million shares of its stock for $275.4 million, leaving remaining capacity of $124.6 million under the program.
Credit and Debt Facilities
The Company’s amended and restated credit agreement provides for (1) term loans up to an aggregate principal amount of $300 million and (2) revolving credit facility borrowings consisting of revolving loans, letter of credit participations and swing-line loans up to an aggregate amount of $300 million.
The term loan is payable in quarterly installments of $7.5 million through September 2017, followed by quarterly installments of $11.3 million through June 2018, with a final payment of $106.3 million due October 9, 2018. The revolving loan commitment expires October 9, 2018.
Term loan and revolving credit facility borrowings bear interest at LIBOR or at an alternative base rate plus a credit spread. At June 30, 2016, the LIBOR credit spread was 2.00%. There were no revolving credit
31
borrowings outstanding at June 30, 2016 or March 31, 2016. The weighted-average interest rate on term loan borrowings at June 30, 2016 was 2.6%. Outstanding letters of credit at June 30, 2016 were $2.1 million.
The term loan allows for prepayments before maturity. The credit agreement is secured by the accounts receivable of Acxiom and its domestic subsidiaries, as well as by the outstanding stock of certain Acxiom subsidiaries.
Under the terms of the term loan, the Company is required to maintain certain debt-to-cash flow and debt service coverage ratios, among other restrictions. At June 30, 2016, the Company was in compliance with these covenants and restrictions. In addition, if certain financial ratios and other conditions are not satisfied, the revolving credit facility limits the Company’s ability to pay dividends in excess of $30 million in any fiscal year (plus additional amounts in certain circumstances).
On March 10, 2014, the Company entered into an interest rate swap agreement. The agreement provides for the Company to pay interest through March 10, 2017 at a fixed rate of 0.98% plus the applicable credit spread on $50.0 million notional amount, while receiving interest for the same period at the LIBOR rate on the same notional amount. The LIBOR rate as of June 30, 2016 was 0.65%. The swap was entered into as a cash flow hedge against LIBOR interest rate movements on the term loan. The Company assesses the effectiveness of the hedge based on the hypothetical derivative method. There was no ineffectiveness for the period ended June 30, 2016. Under the hypothetical derivative method, the cumulative change in fair value of the actual swap is compared to the cumulative change in fair value of the hypothetical swap, which has terms that identically match the critical terms of the hedged transaction. Thus, the hypothetical swap is presumed to perfectly offset the hedged cash flows. The change in the fair value of the hypothetical swap will then be regarded as a proxy for the present value of the cumulative change in the expected future cash flows from the hedged transactions. All of the fair values are derived from an interest-rate futures model. As of June 30, 2016, the hedge relationship still qualified as an effective hedge under applicable accounting standards. Consequently, all changes in fair value of the derivative will be deferred and recorded in other comprehensive income (loss) until the related forecasted transaction is recognized in the condensed consolidated statement of operations. The fair market value of the derivative was zero at inception and an unrealized loss of $0.1 million since inception is recorded in other comprehensive income (loss). The fair value of the interest rate swap agreement recorded in accumulated other comprehensive income (loss) may be recognized in the condensed consolidated statement of operations if certain terms of the floating-rate debt change, if the floating-rate debt is extinguished or if the interest rate swap agreement is terminated prior to maturity. The Company has assessed the creditworthiness of the counterparty of the swap and concludes that no substantial risk of default exists as of June 30, 2016.
Based on our current expectations, we believe our liquidity and capital resources will be sufficient to operate our business. However, we may take advantage of opportunities to generate additional liquidity or refinance existing debt through capital market transactions. The amount, nature and timing of any capital market transactions will depend on: our operating performance and other circumstances; our then-current commitments and obligations; the amount, nature and timing of our capital requirements; any limitations imposed by our current credit arrangements; and overall market conditions.
Off-Balance Sheet Items and Commitments
In connection with the disposal of certain assets, the Company guaranteed a lease for the buyer of the assets. This guarantee was made by the Company primarily to facilitate favorable financing terms for the third party. Should the third party default, the Company would be required to perform under this guarantee. At June 30, 2016, the Company’s maximum potential future payments under this guarantee totaled $0.4 million.
Outstanding letters of credit, which reduce the borrowing capacity under the Company’s revolving credit facility, were $2.1 million at June 30, 2016.
Contractual Commitments
The following table presents the Company’s contractual cash obligations, exclusive of interest, and purchase commitments at June 30, 2016. The table does not include the future payment of liabilities related to uncertain tax positions of $4.0 million or the future payment, if any, against the Company’s interest rate swap
32
liability of $0.1 million as the Company is not able to predict the periods in which the payments will be made. The column for 2017 represents the remaining nine months ending March 31, 2017. All other columns represent fiscal years ending March 31 (dollars in thousands).
|
|
|
For the years ending March 31, |
|
|||||||||||||||||||
|
|
|
2017 |
|
2018 |
|
2019 |
|
2020 |
|
2021 |
|
Thereafter |
|
Total |
|
|||||||
|
Term loan |
|
$ |
22,500 |
|
$ |
37,500 |
|
$ |
117,500 |
|
$ |
— |
|
$ |
— |
|
$ |
— |
|
$ |
177,500 |
|
|
Other debt and long-term liabilities |
|
|
1,689 |
|
|
2,320 |
|
|
1,583 |
|
|
1,362 |
|
|
348 |
|
|
— |
|
|
7,302 |
|
|
Total long-term debt and capital leases |
|
|
24,189 |
|
|
39,820 |
|
|
119,083 |
|
|
1,362 |
|
|
348 |
|
|
— |
|
|
184,802 |
|
|
Operating lease payments |
|
|
14,581 |
|
|
13,732 |
|
|
10,892 |
|
|
9,938 |
|
|
9,451 |
|
|
24,383 |
|
|
82,977 |
|
|
Total contractual cash obligations |
|
$ |
38,770 |
|
$ |
53,552 |
|
$ |
129,975 |
|
$ |
11,300 |
|
$ |
9,799 |
|
$ |
24,383 |
|
$ |
267,779 |
|
|
|
|
For the years ending March 31, |
|
|||||||||||||||||||
|
|
|
2017 |
|
2018 |
|
2019 |
|
2020 |
|
2021 |
|
Thereafter |
|
Total |
|
|||||||
|
Total purchase commitments |
|
$ |
36,000 |
|
$ |
18,736 |
|
$ |
15,586 |
|
$ |
14,462 |
|
$ |
7,595 |
|
$ |
— |
|
$ |
92,379 |
|
Purchase commitments include contractual commitments for the purchase of data and open purchase orders for equipment, paper, office supplies, construction and other items. Purchase commitments in some cases will be satisfied by entering into future operating leases, capital leases, or other financing arrangements, rather than payment of cash. The above commitments relating to long-term obligations do not include future payments of interest. The Company estimates future interest payments on debt for the remainder of fiscal 2017 of $5.9 million.
The following are contingencies or guarantees under which the Company could be required, in certain circumstances, to make cash payments as of June 30, 2016 (dollars in thousands):
|
Lease guarantee |
|
$ |
383 |
|
|
Outstanding letters of credit |
|
|
2,138 |
|
|
Surety bonds |
|
|
405 |
|
While the Company does not have any other material contractual commitments for capital expenditures, certain levels of investments in facilities and computer equipment continue to be necessary to support the growth of the business. In some cases, the Company also licenses software and sells hardware to clients. Management believes that the Company’s existing available debt and cash flow from operations will be sufficient to meet the Company’s working capital and capital expenditure requirements for the foreseeable future. The Company also evaluates acquisitions from time to time, which may require up-front payments of cash.
For a description of certain risks that could have an impact on results of operations or financial condition, including liquidity and capital resources, see “Risk Factors” contained in Part I, Item 1A, of the Company’s 2016 Annual Report.
Non-U.S. Operations
The Company has a presence in the United Kingdom, France, Germany, Poland, Australia and China. Most of the Company’s exposure to exchange rate fluctuation is due to translation gains and losses as there are no material transactions that cause exchange rate impact. In general, each of the foreign locations is expected to fund its own operations and cash flows, although funds may be loaned or invested from the U.S. to the foreign subsidiaries subject to limitations in the Company’s revolving credit facility. These advances are considered to be long-term investments, and any gain or loss resulting from changes in exchange rates as well as gains or losses resulting from translating the foreign financial statements into U.S. dollars are included in accumulated other comprehensive income (loss). Exchange rate movements of foreign currencies may have an impact on the Company’s future costs or on future cash flows from foreign investments. The
33
Company has not entered into any foreign currency forward exchange contracts or other derivative instruments to hedge the effects of adverse fluctuations in foreign currency exchange rates.
Critical Accounting Policies
We prepare our condensed consolidated financial statements in conformity with U.S. GAAP. These accounting principles require management to make certain judgments and assumptions that affect the reported amounts of assets and liabilities and the disclosure of contingent assets and liabilities as of the date of the financial statements and the reported amounts of revenues and expenses during the reporting periods. The consolidated financial statements in the Company’s 2016 Annual Report include a summary of significant accounting policies used in the preparation of Acxiom’s consolidated financial statements. In addition, the Management’s Discussion and Analysis filed as part of the 2016 Annual Report contains a discussion of the policies which management has identified as the most critical because they require management’s use of complex and/or significant judgments. None of the Company’s critical accounting policies have materially changed since the date of the last annual report.
New Accounting Pronouncements Not Yet Adopted
See “Recent Accounting Pronouncements Not Yet Adopted” under Note 1, “Basis of Presentation and Summary of Significant Accounting Policies,” of the Notes to Condensed Consolidated Financial Statements (Unaudited) for a discussion of certain accounting standards that have been issued but not yet adopted.
Forward-looking Statements
This document contains forward-looking statements. These statements, which are not statements of historical fact, may contain estimates, assumptions, projections and/or expectations regarding the Company’s financial position, results of operations, market position, product development, growth opportunities, economic conditions, and other similar forecasts and statements of expectation. Forward-looking statements are often identified by words or phrases such as “anticipate,” “estimate,” “plan,” “expect,” “believe,” “intend,” “foresee,” or the negative of these terms or other similar variations thereof. These forward-looking statements are not guarantees of future performance and are subject to a number of factors and uncertainties that could cause the Company’s actual results and experiences to differ materially from the anticipated results and expectations expressed in the forward-looking statements.
Forward-looking statements may include but are not limited to the following:
|
· |
management's expectations about the macro economy; |
|
· |
statements containing a projection of revenues, expenses, income (loss), earnings (loss) per share, capital expenditures, dividends, capital structure, or other financial items; |
|
· |
statements of the plans and objectives of management for future operations; |
|
· |
statements of future economic performance, including, but not limited to, those statements contained in Management’s Discussion and Analysis of Financial Condition and Results of Operations contained in this Quarterly Report on Form 10-Q; |
|
· |
statements containing any assumptions underlying or relating to any of the above statements; and |
|
· |
statements containing a projection or estimate. |
Among the factors that may cause actual results and expectations to differ from anticipated results and expectations expressed in such forward-looking statements are the following:
|
· |
the risk factors described in Part I, “Item 1A. Risk Factors” included in the Company’s 2016 Annual Report and those described from time to time in our future reports filed with the SEC; |
|
· |
the possibility that in the event a change of control of the Company is sought that certain clients may attempt to invoke provisions in their contracts allowing for termination upon a change in control, which may result in a decline in revenue and profit; |
|
· |
the possibility that the integration of acquired businesses may not be as successful as planned; |
|
· |
the possibility that the fair value of certain of our assets may not be equal to the carrying value of those assets now or in future time periods; |
34
|
· |
the possibility that sales cycles may lengthen; |
|
· |
the possibility that we will not be able to properly motivate our sales force or other associates; |
|
· |
the possibility that we may not be able to attract and retain qualified technical and leadership associates, or that we may lose key associates to other organizations; |
|
· |
the possibility that we may be unable to quickly and seamlessly integrate our new executive officers; |
|
· |
the possibility that we will not be able to continue to receive credit upon satisfactory terms and conditions; |
|
· |
the possibility that competent, competitive products, technologies or services will be introduced into the marketplace by other companies; |
|
· |
the possibility that there will be changes in consumer or business information industries and markets that negatively impact the Company; |
|
· |
the possibility that we will not be able to protect proprietary information and technology or to obtain necessary licenses on commercially reasonable terms; |
|
· |
the possibility that there will be changes in the legislative, accounting, regulatory and consumer environments affecting our business, including but not limited to litigation, legislation, regulations and customs relating to our ability to collect, manage, aggregate and use data; |
|
· |
the possibility that data suppliers might withdraw data from us, leading to our inability to provide certain products and services; |
|
· |
the possibility that we may enter into short-term contracts which would affect the predictability of our revenues; |
|
· |
the possibility that the amount of ad hoc, volume-based and project work will not be as expected; |
|
· |
the possibility that we may experience a loss of data center capacity or interruption of telecommunication links or power sources; |
|
· |
the possibility that we may experience failures or breaches of our network and data security systems, leading to potential adverse publicity, negative customer reaction, or liability to third parties; |
|
· |
the possibility that our clients may cancel or modify their agreements with us; |
|
· |
the possibility that we will not successfully complete customer contract requirements on time or meet the service levels specified in the contracts, which may result in contract penalties or lost revenue; |
|
· |
the possibility that we experience processing errors which result in credits to customers, re-performance of services or payment of damages to customers; and |
|
· |
general and global negative economic conditions. |
With respect to the provision of products or services outside our primary base of operations in the United States, all of the above factors apply, along with the difficulty of doing business in numerous sovereign jurisdictions due to differences in scale, competition, culture, laws and regulations.
Other factors are detailed from time to time in periodic reports and registration statements filed with the SEC. The Company believes that it has the product and technology offerings, facilities, associates and competitive and financial resources for continued business success, but future revenues, costs, margins and profits are all influenced by a number of factors, including those discussed above, all of which are inherently difficult to forecast.
In light of these risks, uncertainties and assumptions, the Company cautions readers not to place undue reliance on any forward-looking statements. The Company undertakes no obligation to publicly update or revise any forward-looking statements based on the occurrence of future events, the receipt of new information or otherwise.
35
Item 3. Quantitative and Qualitative Disclosures about Market Risk
Acxiom’s earnings are affected by changes in short-term interest rates primarily as a result of its term loan agreement and its revolving credit agreement, both of which bear interest at a floating rate. Acxiom currently uses an interest-rate swap agreement to mitigate the changes in interest rate risk on $50 million of its floating-rate debt. Risk can be estimated by measuring the impact of a near-term adverse movement of one percentage point in short-term market interest rates. If short-term market interest rates increase one percentage point during the next four quarters compared to the previous four quarters, there would be no material adverse impact on Acxiom’s results of operations. Acxiom has no material future earnings or cash flow expenses from changes in interest rates related to its other long-term debt obligations, as substantially all of Acxiom’s remaining long-term debt instruments have fixed rates. At both June 30, 2016 and March 31, 2016, the fair value of the Company’s fixed rate long-term debt approximated carrying value.
The Company has a presence in the United Kingdom, France, Germany, Poland, Australia, and China. In general, each of the foreign locations is expected to fund its own operations and cash flows, although funds may be loaned or invested from the U.S. to the foreign subsidiaries. Therefore, exchange rate movements of foreign currencies may have an impact on Acxiom’s future costs or on future cash flows from foreign investments. Acxiom has not entered into any foreign currency forward exchange contracts or other derivative instruments to hedge the effects of adverse fluctuations in foreign currency exchange rates.
Item 4. Controls and Procedures
(a)Evaluation of Disclosure Controls and Procedures.
Our management, with the participation of our Chief Executive Officer and President (our principal executive officer) and our Chief Financial Officer and Executive Vice President (our principal financial and accounting officer), evaluated the effectiveness of our disclosure controls and procedures (as defined under Rule 13a-15(e) of the Securities Exchange Act of 1934, as amended). Based on this evaluation, our principal executive officer and our principal financial and accounting officer concluded that as of June 30, 2016, our disclosure controls and procedures were effective.
|
(b) |
Changes in Internal Control over Financial Reporting |
There have been no changes in our internal control over financial reporting that occurred during the fiscal quarter ended June 30, 2016 that have materially affected, or are reasonably likely to materially affect, our internal control over financial reporting.
36
There are currently no matters pending against the Company or its subsidiaries for which the potential exposure is considered material to the Company’s condensed consolidated financial statements.
Item 2. Unregistered Sales of Equity Securities and Use of Proceeds
|
(a)Not Applicable |
|
(b)Not Applicable |
|
(c)The table below provides information regarding purchases by Acxiom of its common stock during the periods indicated. |
|
|
|
|
|
|
|
|
|
Maximum Number (or Approximate |
|
|
|
|
|
Total Number |
|
Average Price |
|
Total Number of Shares |
|
Dollar Value) of Shares that May Yet |
|
|
|
|
|
of Shares |
|
Paid |
|
Purchased as Part of Publicly |
|
Be Purchased Under the |
|
|
|
Period |
|
Purchased |
|
Per Share |
|
Announced Plans or Programs |
|
Plans or Programs |
|
|
|
4/1/16 - 4/30/16 |
|
— |
|
n/a |
|
— |
|
$ |
144,792,367 |
|
|
5/1/16 - 5/31/16 |
|
— |
|
n/a |
|
— |
|
|
144,792,367 |
|
|
6/1/16 - 6/30/16 |
|
925,838 |
|
21.83 |
|
925,838 |
|
|
124,585,732 |
|
|
Total |
|
925,838 |
|
n/a |
|
925,838 |
|
$ |
124,585,732 |
|
On August 29, 2011, the board of directors adopted a common stock repurchase program. That program was subsequently modified and expanded, most recently on July 28, 2016. Under the modified common stock repurchase program, the Company may purchase up to $400.0 million of its common stock through the period ending June 30, 2018. Through June 30, 2016, the Company had repurchased 16.4 million shares of its stock for $275.4 million, leaving remaining capacity of $124.6 million under the stock repurchase program.
37
The following exhibits are filed with this quarterly report:
|
|
10.1 |
Equity Agreement by and between Acxiom Corporation and Travis May dated as of November 11, 2014 |
|
|
|
|
|
|
31.1 |
Certification of Chief Executive Officer and President (principal executive officer) pursuant to SEC Rule 13a-14(a)/15d-14(a), as adopted pursuant to Sections 302 and 404 of the Sarbanes-Oxley Act of 2002 |
|
|
|
|
|
31.2 |
Certification of Chief Financial Officer and Executive Vice President (principal financial and accounting officer) pursuant to SEC Rule 13a-14(a)/15d-14(a), as adopted pursuant to Sections 302 and 404 of the Sarbanes-Oxley Act of 2002 |
|
|
|
32.1 |
Certification of Chief Executive Officer and President (principal executive officer) pursuant to 18 U.S.C. Section 1350, as adopted pursuant to Section 906 of the Sarbanes-Oxley Act of 2002 |
|
|
|
|
|
|
32.2 |
Certification of Chief Financial Officer and Executive Vice President (principal financial and accounting officer) pursuant to 18 U.S.C. Section 1350, as adopted pursuant to Section 906 of the Sarbanes-Oxley Act of 2002 |
|
|
|
|
|
|
101 |
The following financial information from our Quarterly Report on Form 10-Q for the quarter ended June 30, 2016, formatted in XBRL: (i) Condensed Consolidated Balance Sheets at June 30, 2016, and March 31, 2016, (ii) Condensed Consolidated Statements of Operations for the Three Months ended June 30, 2016 and 2015, (iii) Condensed Consolidated Statements of Comprehensive Income (Loss) for the Three Months ended June 30, 2016 and 2015, (iv) Condensed Consolidated Statement of Equity for the Three Months ended June 30, 2016, (v) Condensed Consolidated Statements of Cash Flows for the Three Months ended June 30, 2016 and 2015, and (vi) the Notes to Condensed Consolidated Financial Statements, tagged in detail. |
38
Pursuant to the requirements of the Securities Exchange Act of 1934, the Registrant has duly caused this report to be signed on its behalf by the undersigned thereunto duly authorized.
|
|
Acxiom Corporation |
|
|
|
|
|
|
|
|
|
|
Dated: August 5, 2016 |
|
|
|
|
|
|
|
|
By: |
/s/ Warren C. Jenson |
|
|
|
(Signature) |
|
|
|
Warren C. Jenson |
|
|
|
Chief Financial Officer & Executive Vice President |
|
|
|
(principal financial and accounting officer) |
39
|
Exhibit |
|
Description |
|
10.1 |
|
Equity Agreement by and between Acxiom Corporation and Travis May dated as of November 11, 2014 |
|
|
|
|
|
31.1 |
|
Certification of Chief Executive Officer and President (principal executive officer) pursuant to SEC Rule 13a-14(a)/15d-14(a), as adopted pursuant to Sections 302 and 404 of the Sarbanes-Oxley Act of 2002 |
|
|
|
|
|
31.2 |
|
Certification of Chief Financial Officer and Executive Vice President (principal financial and accounting officer) pursuant to SEC Rule 13a-14(a)/15d-14(a), as adopted pursuant to Sections 302 and 404 of the Sarbanes-Oxley Act of 2002 |
|
|
|
|
|
32.1 |
|
Certification of Chief Executive Officer and President (principal executive officer) pursuant to 18 U.S.C. Section 1350, as adopted pursuant to Section 906 of the Sarbanes-Oxley Act of 2002 |
|
|
|
|
|
32.2 |
|
Certification of Chief Financial Officer and Executive Vice President (principal financial and accounting officer) pursuant to 18 U.S.C. Section 1350, as adopted pursuant to Section 906 of the Sarbanes-Oxley Act of 2002 |
|
|
|
|
|
101 |
|
The following financial information from our Quarterly Report on Form 10-Q for the quarter ended June 30, 2016, formatted in XBRL: (i) Condensed Consolidated Balance Sheets at June 30, 2016, and March 31, 2016, (ii) Condensed Consolidated Statements of Operations for the Three Months ended June 30, 2016 and 2015, (iii) Condensed Consolidated Statements of Comprehensive Income (Loss) for the Three Months ended June 30, 2016 and 2015, (iv) Condensed Consolidated Statement of Equity for the Three Months ended June 30, 2016, (v) Condensed Consolidated Statements of Cash Flows for the Three Months ended June 30, 2016 and 2015, and (vi) the Notes to Condensed Consolidated Financial Statements, tagged in detail. |
40