Attached files
| file | filename |
|---|---|
| 8-K - 8-K - MARKET MOSAIC (AUGUST 2016) - MOSAIC CO | a8-kmarketmosaicaugust2016.htm |
Michael R. Rahm
Vice President, Market and Strategic Analysis
Andy J. Jung
Director, Market and Strategic Analysis
Josh Paula
Market Analysis Manager
Dan Halonen
Market Analyst
Market Mosaic is a newsletter published for our
customers, suppliers and stakeholders by the
Market and Strategic Analysis group of The Mosaic
Company. Some issues assess the near term outlook
for agricultural and plant nutrient markets while
others take an in-depth look at a topic of interest to
our readers.
Administering The Cure
– continued inside
There is an old adage in the commodity business that the cure for
high prices is high prices and the cure for low prices is low prices.
Extraordinarily high prices a few years ago provided the cure for high
prices. Buyers of plant nutrients are feeling much better today, witness
India recently securing urea at $180 tonne c&f port or China settling
2016 potash contracts at a net delivered price in the low $200s tonne.
Now the question is whether current low prices will provide the cure for
low prices and make plant nutrient producers feel better any time soon.
Lower phosphate (P) and potash (K) prices no doubt are triggering
responses on both the supply and demand side of the ledger. This
issue of Market Mosaic highlights some of the adjustments underway
today and speculates about how the cure may play.
We draw several conclusions from our analysis below. First, P&K markets
are administering potent doses of low prices that are causing material
supply adjustments. The cure, in fact, is killing a number of higher cost
operations and, based on recent earnings reports and guidance, inflicting
painful side-effects for most of the rest of the industry. Survivors are
cutting costs and optimizing operations knowing that what doesn’t kill
them will make them stronger lower-cost producers in the long run.
Second, low P&K prices are boosting demand prospects, especially in
key countries such as Brazil and India. In addition, declining prices
and expectations of continued low prices are causing a destocking
throughout the massive global distribution channel. The combination
of strong on-farm demand and lower channel inventories underpin
positive shipment forecasts, especially in the near term.
Third, positive demand prospects coupled with our estimates of net
capacity increases are expected to result in a more balanced supply
and demand outlook than most of the forecasts we have seen from
consultants and sell-side analysts. We have long maintained that the
large drop in P&K prices is more the result of a collapse of costs rather
than a gross supply/demand imbalance. By our count, global P&K
operating rates look relatively flat during the next five years. We do not
see a deep and prolonged cyclical downturn.
Market Mosaic
August 2016
®
Global Phosphate Shipment Forecasts by Region (Aug 2, 2016)
Million Tonnes
DAP/MAP/NPS*/TSP
Low
2016F
High
2016F
Low
2017F
High
2017F
Source: CRU and Mosaic
Comments Numbers may not sum to total due to rounding
China 18.8 19.0 19.1 19.5 We have again lowered our 2016 shipment forecast based on a poor spring season as Chinese supply channels were destocked and a slow start to summer stockpiling. We anticipate that inventories will have been worked through in 2016, setting the stage for a rebound next year.
India 9.3 9.5 9.4 10.0
Despite starting the year with a large overhang of channel inventories, the above-average monsoon and reservoir levels, workable subsidy (despite
the earlier cut and a lowering of retail prices) and strong farm economics have resulted in an upward revision to our 2016 forecast. We believe this
strength will carry through to 2017, provided that the rupee remains stable.
Other Asia & Oceania 8.1 8.2 8.3 8.5
We revised modestly higher our expectations for 2016 last quarter due to higher crop prices, more moderate P prices, average to below-average
channel inventories, improved weather prospects (La Niña), and more stable forex rates. Our 2017 forecast calls for a moderate rebound, as we
expect the positive drivers to persist.
Europe and FSU 5.1 5.2 5.1 5.3 Our 2016 forecast is unchanged. Big harvests this year imply larger fertilizer replacement requirements, but macroeconomic uncertainties and weaker farm economics in Europe will likely be a drag on growth in 2017.
Brazil 7.4 7.6 7.5 7.7
Phosphate shipments through the first half of the year were up 12% from a year ago. Volatility of the real remains an issue, but we anticipate
continuation of constructive ag economics in Brazil to drive phosphates consumption.
Other Latin America 3.4 3.5 3.6 3.7
Higher local-currency ag commodity prices and more moderate fertilizer prices have boosted demand more than previously anticipated in 2016,
leading to an upward revision to our forecast, notably in Argentina.
North America 9.1 9.4 9.0 9.2 2016 shipments were revised up as a result of larger-than expected spring shipments (including a large de-stocking of channel inventories) and prospects for a strong fall season. A small drop is projected next year mainly due to an expected decline in U.S. corn acreage.
Other 3.7 3.8 3.8 4.0 Our 2016 forecast is revised slightly higher. Modest growth is expected in the Middle East in 2017, with much stronger (~5% y-o-y) growth antici-pated in Africa.
World Total 64.9 66.2 65.8 67.9 Our 2016 point estimate of 65.6 million tonnes is unchanged from the May forecast.
* NPS products included in this analysis are those with a combined N and P2O5 nutrient content of 45 units or greater.
Global Potash Shipment Forecasts by Region (Aug 2, 2016)
Muriate of Potash
Million Tonnes (KCL)
Low
2016F
High
2016F
Low
2017F
High
2017F
Comments
China 12.8 13.0 13.7 14.1
Shipments this year are projected to drop more than previously anticipated due to the delayed settlement of 2016 contracts and a drawdown of
channel stocks. 1H imports were down 11% from year-ago levels. We do not anticipate that changes to government support policies to discourage
corn plantings will have a material adverse impact on demand in 2017, and we expect an ~8% rebound to ~14 mmt.
India 4.4 4.6 4.4 4.7
Despite high inventories to start the year, we have upped our forecast for 2016 on the basis of the good monsoon underway, lower potash prices,
workable subsidy (which was cut only notionally this year) and strong local ag commodity prices. Our forecast for 2017 calls for bullish demand
factors to continue, though the stability of the rupee remains a wildcard.
Indonesia/Malaysia 4.5 4.7 5.0 5.2
The rebound in shipments we were expecting in 2016 has been rather muted, but we believe that fundamentals – better rainfall, lower K prices, and
decent rice and palm oil prices – will deliver a more meaningful increase in shipments in 2017.
Europe & FSU 10.3 10.5 10.6 10.8
Shipments in 2016 have been revised slightly higher and are now expected to be flat y-o-y. Our 2017 forecast calls for a moderate expansion to
replace big soil nutrient drawdowns this year and a boost in production of NPKs for export.
Brazil 9.0 9.2 9.2 9.5
Near-record local currency prices for soybeans, sugar and coffee have led to a big demand pull mid-year (overall June fertilizer shipments set an
all-time record). Potash shipments through the first half of the year are up 16% from a year ago. At the same time, imports are running just 3%
ahead of last year and domestic production is off slightly, implying a sizable drawdown in channel inventories. We expect these constructive market
conditions to carry over into 2017, underpinning our forecast for shipments to surpass the 2014 high of 9.3 mmt.
North America 8.9 9.1 8.8 9.0
We have trimmed our 2016 forecast slightly due to relatively high channel inventories, though we expect a very solid fall season as a result of large
potash withdrawals this year and the low cost of rebuilding soil potassium levels. In 2017, we anticipate a pullback in corn acreage due to lower
prices, but that is expected to result in a minor decrease in shipments as acres shift to other crops and the economic incentives to apply potash
remain positive.
Other 9.0 9.2 9.4 9.7
Our 2016 forecast is revised slightly higher, as the reset lower in global benchmark contract prices (i.e. in China and India) provides a floor in spot
market pricing that drives demand in the second half of the year.
World Total 58.9 60.3 61.1 63.0 Our 2016 global shipments point estimate is little-changed at 59.6 million tonnes in an unchanged range of 59-60 mmt.
The Mosaic Company
Atria Corporate Center, Suite E490
3033 Campus Drive
Plymouth, MN 55441
(800) 918-8270
(763) 577-2700
Low Prices
A Potent Dose of Low Prices
On the supply side of the ledger, several adjustments
have occurred and more are expected. In the case
of potash, low prices have forced the permanent
closure of several high cost facilities. For example, all
of the North American facilities that were at the right
end of every estimate of the industry cost curve have
closed. That includes Mosaic’s Carlsbad and Hersey
mines, Intrepid’s Carlsbad East and West operations,
and PotashCorp’s Penobsquis and Picadilly facilities in
New Brunswick. We estimate a net loss of 2.25 million
tonnes of capacity from the closure of these six facilities.
Other producers also have announced mine closures or
changes. ICL will cease MOP operations and transition
to polyhalite production at its Boulby UK mine by
2018. The K+S Sigmundshall facility in Germany and
the Vale Taquari operation in Brazil are scheduled to
mine out during the next few years. These changes will
remove another 2.1 million tonnes of MOP capacity,
and low prices potentially could impact closure dates.
Furthermore, another 3.0 million tonnes of higher-cost
European capacity could be vulnerable if prices remain
at or drop from current levels.
In the case of phosphate, low prices are expected to
accelerate the restructuring of China’s large phosphate
sector. Plans outlined at the National Phosphate and
Compound Fertilizer Industry Annual Conference in
May called for the permanent closure of “outdated”
facilities with capacity of 3.0 million tonnes P2O5 or the
equivalent of 6.5 million tonnes DAP by the end of this
decade. In addition, non-integrated facilities in North
America and elsewhere also could be in jeopardy if
product prices stay low and rock costs remain at high
levels.
Other Producers Optimize Operations
Low prices also are forcing even the most efficient
producers to optimize operations in order to compete,
especially with exporters who have benefited from a
sharp devaluation of their local currencies. For example,
Mosaic has temporarily idled its Colonsay potash
operation and is running its large-scale Belle Plaine and
Esterhazy facilities at higher rates in order to minimize
cost yet still meet customer demand.
Optimization has resulted in a net decline in output. For
example, we estimate that Canadian potash production
was down 10%, or about 1.1 million tonnes, in the
first half of 2016. Uralkali announced that its first-half
output was down 11% or 600,000 tonnes from a year
earlier. BPC also announced that its exports were down
21% during the first four months of this year.
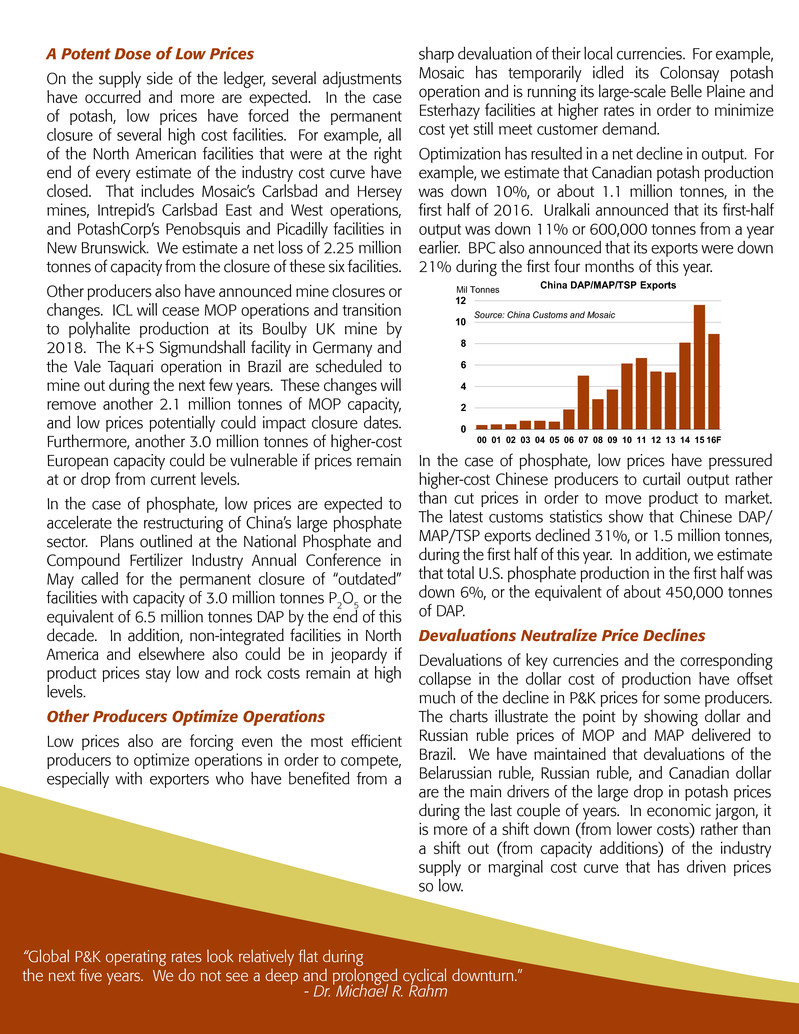
In the case of phosphate, low prices have pressured
higher-cost Chinese producers to curtail output rather
than cut prices in order to move product to market.
The latest customs statistics show that Chinese DAP/
MAP/TSP exports declined 31%, or 1.5 million tonnes,
during the first half of this year. In addition, we estimate
that total U.S. phosphate production in the first half was
down 6%, or the equivalent of about 450,000 tonnes
of DAP.
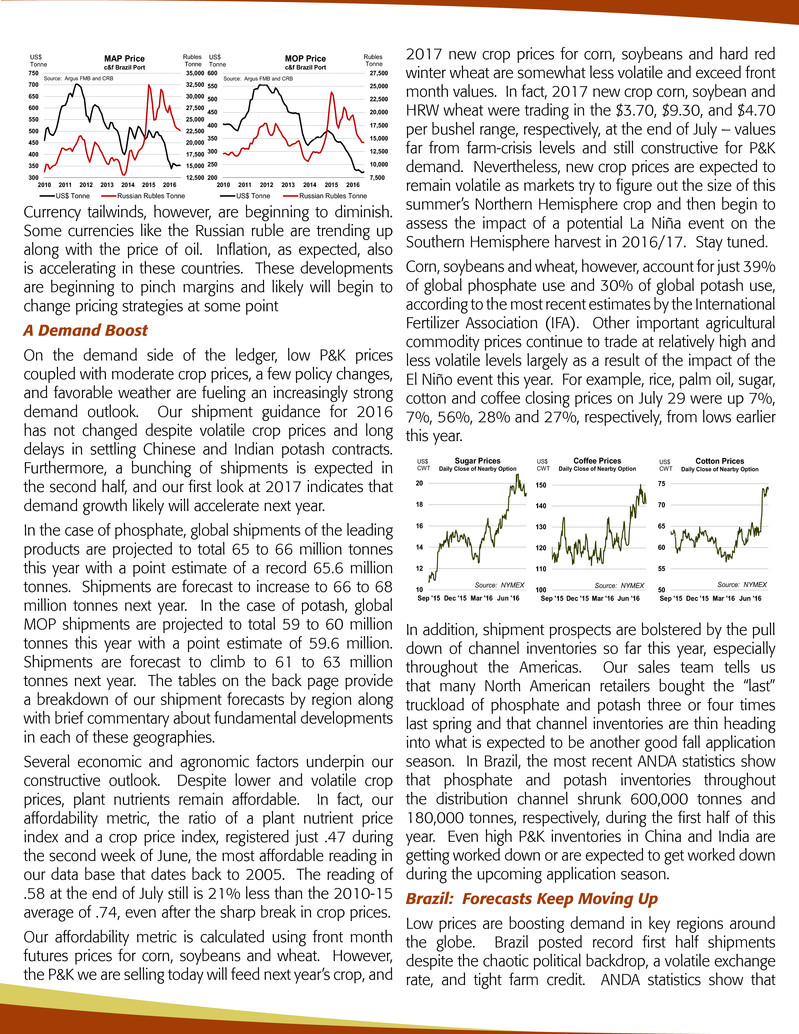
Devaluations Neutralize Price Declines
Devaluations of key currencies and the corresponding
collapse in the dollar cost of production have offset
much of the decline in P&K prices for some producers.
The charts illustrate the point by showing dollar and
Russian ruble prices of MOP and MAP delivered to
Brazil. We have maintained that devaluations of the
Belarussian ruble, Russian ruble, and Canadian dollar
are the main drivers of the large drop in potash prices
during the last couple of years. In economic jargon, it
is more of a shift down (from lower costs) rather than
a shift out (from capacity additions) of the industry
supply or marginal cost curve that has driven prices
so low.
“Global P&K operating rates look relatively flat during
the next five years. We do not see a deep and prolonged cyclical downturn.”
- Dr. Michael R. Rahm
0
2
4
6
8
10
12
00 01 02 03 04 05 06 07 08 09 10 11 12 13 14 15 16F
Mil Tonnes China DAP/MAP/TSP Exports
Source: China Customs and Mosaic
Currency tailwinds, however, are beginning to diminish.
Some currencies like the Russian ruble are trending up
along with the price of oil. Inflation, as expected, also
is accelerating in these countries. These developments
are beginning to pinch margins and likely will begin to
change pricing strategies at some point
A Demand Boost
On the demand side of the ledger, low P&K prices
coupled with moderate crop prices, a few policy changes,
and favorable weather are fueling an increasingly strong
demand outlook. Our shipment guidance for 2016
has not changed despite volatile crop prices and long
delays in settling Chinese and Indian potash contracts.
Furthermore, a bunching of shipments is expected in
the second half, and our first look at 2017 indicates that
demand growth likely will accelerate next year.
In the case of phosphate, global shipments of the leading
products are projected to total 65 to 66 million tonnes
this year with a point estimate of a record 65.6 million
tonnes. Shipments are forecast to increase to 66 to 68
million tonnes next year. In the case of potash, global
MOP shipments are projected to total 59 to 60 million
tonnes this year with a point estimate of 59.6 million.
Shipments are forecast to climb to 61 to 63 million
tonnes next year. The tables on the back page provide
a breakdown of our shipment forecasts by region along
with brief commentary about fundamental developments
in each of these geographies.
Several economic and agronomic factors underpin our
constructive outlook. Despite lower and volatile crop
prices, plant nutrients remain affordable. In fact, our
affordability metric, the ratio of a plant nutrient price
index and a crop price index, registered just .47 during
the second week of June, the most affordable reading in
our data base that dates back to 2005. The reading of
.58 at the end of July still is 21% less than the 2010-15
average of .74, even after the sharp break in crop prices.
Our affordability metric is calculated using front month
futures prices for corn, soybeans and wheat. However,
the P&K we are selling today will feed next year’s crop, and
2017 new crop prices for corn, soybeans and hard red
winter wheat are somewhat less volatile and exceed front
month values. In fact, 2017 new crop corn, soybean and
HRW wheat were trading in the $3.70, $9.30, and $4.70
per bushel range, respectively, at the end of July – values
far from farm-crisis levels and still constructive for P&K
demand. Nevertheless, new crop prices are expected to
remain volatile as markets try to figure out the size of this
summer’s Northern Hemisphere crop and then begin to
assess the impact of a potential La Niña event on the
Southern Hemisphere harvest in 2016/17. Stay tuned.
Corn, soybeans and wheat, however, account for just 39%
of global phosphate use and 30% of global potash use,
according to the most recent estimates by the International
Fertilizer Association (IFA). Other important agricultural
commodity prices continue to trade at relatively high and
less volatile levels largely as a result of the impact of the
El Niño event this year. For example, rice, palm oil, sugar,
cotton and coffee closing prices on July 29 were up 7%,
7%, 56%, 28% and 27%, respectively, from lows earlier
this year.
In addition, shipment prospects are bolstered by the pull
down of channel inventories so far this year, especially
throughout the Americas. Our sales team tells us
that many North American retailers bought the “last”
truckload of phosphate and potash three or four times
last spring and that channel inventories are thin heading
into what is expected to be another good fall application
season. In Brazil, the most recent ANDA statistics show
that phosphate and potash inventories throughout
the distribution channel shrunk 600,000 tonnes and
180,000 tonnes, respectively, during the first half of this
year. Even high P&K inventories in China and India are
getting worked down or are expected to get worked down
during the upcoming application season.
Brazil: Forecasts Keep Moving Up
Low prices are boosting demand in key regions around
the globe. Brazil posted record first half shipments
despite the chaotic political backdrop, a volatile exchange
rate, and tight farm credit. ANDA statistics show that
3
4
5
6
7
8
9
10
11
12
13
147,500
10,000
12,500
15,000
17,500
20,000
22,500
25,000
27,500
200
250
300
350
400
450
500
550
600
2010 2011 2012 2013 2014 2015 2016
Rubles
Tonne
US$
Tonne
Source: Argus FMB and CRB
MOP Price
c&f Brazil Port
US$ Tonne Russian Rubles Tonne
12,500
15,000
17,500
20,000
22,500
25,000
27,500
30,000
32,500
35,000
300
350
400
450
500
550
600
650
700
750
2010 2011 2012 2013 2014 2015 2016
Rubles
Tonne
US$
Tonne
Source: Argus FMB and CRB
MAP Price
c&f Brazil Port
US$ Tonne Russian Rubles Tonne
10
12
14
16
18
20
Sep '15 Dec '15 Mar '16 Jun '16
US$
CWT
Source: NYMEX
Sugar Prices
Daily Close of Nearby Option
50
55
60
65
70
75
Sep '15 Dec '15 Mar '16 Jun '16
US$
CWT
Source: NYMEX
Cotton Prices
Daily Close of Nearby Option
100
110
120
130
140
150
Sep '15 Dec '15 Mar '16 Jun '16
US$
CWT
Source: NYMEX
Coffee Prices
Daily Close of Nearby Option
shipments of all plant nutrient products tallied 13.18
million tonnes during the first half of this year, up 13%
from a year ago and up 2% from the previous high-
water mark of 12.96 million in 2014. All three major
nutrients registered double-digit gains during the first
half of this year. Nitrogen, phosphate and potash
shipments were up 13%, 12% and 16%, respectively,
from a year earlier.
Most analysts are revising up 2016 and 2017 forecasts.
That is not a shocker given lower plant nutrient costs
and record or near-record local currency prices for
soybeans, corn, sugar, cotton and coffee. We now
project that total plant nutrient shipments will top 32
million tonnes this year, up 6% from the lower level last
year. Shipments this year likely will rival the previous
record of 32.2 million in 2014. A first look at 2017
indicates that shipments are expected to climb to more
than 33 million tonnes.
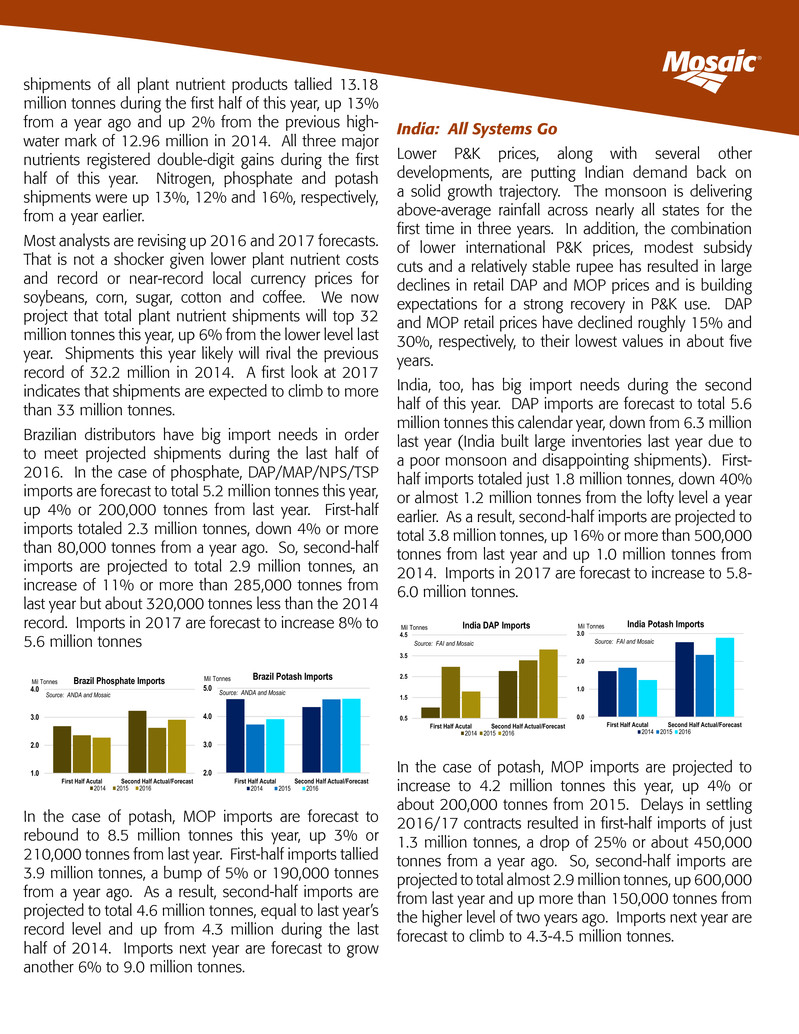
Brazilian distributors have big import needs in order
to meet projected shipments during the last half of
2016. In the case of phosphate, DAP/MAP/NPS/TSP
imports are forecast to total 5.2 million tonnes this year,
up 4% or 200,000 tonnes from last year. First-half
imports totaled 2.3 million tonnes, down 4% or more
than 80,000 tonnes from a year ago. So, second-half
imports are projected to total 2.9 million tonnes, an
increase of 11% or more than 285,000 tonnes from
last year but about 320,000 tonnes less than the 2014
record. Imports in 2017 are forecast to increase 8% to
5.6 million tonnes
In the case of potash, MOP imports are forecast to
rebound to 8.5 million tonnes this year, up 3% or
210,000 tonnes from last year. First-half imports tallied
3.9 million tonnes, a bump of 5% or 190,000 tonnes
from a year ago. As a result, second-half imports are
projected to total 4.6 million tonnes, equal to last year’s
record level and up from 4.3 million during the last
half of 2014. Imports next year are forecast to grow
another 6% to 9.0 million tonnes.
India: All Systems Go
Lower P&K prices, along with several other
developments, are putting Indian demand back on
a solid growth trajectory. The monsoon is delivering
above-average rainfall across nearly all states for the
first time in three years. In addition, the combination
of lower international P&K prices, modest subsidy
cuts and a relatively stable rupee has resulted in large
declines in retail DAP and MOP prices and is building
expectations for a strong recovery in P&K use. DAP
and MOP retail prices have declined roughly 15% and
30%, respectively, to their lowest values in about five
years.
India, too, has big import needs during the second
half of this year. DAP imports are forecast to total 5.6
million tonnes this calendar year, down from 6.3 million
last year (India built large inventories last year due to
a poor monsoon and disappointing shipments). First-
half imports totaled just 1.8 million tonnes, down 40%
or almost 1.2 million tonnes from the lofty level a year
earlier. As a result, second-half imports are projected to
total 3.8 million tonnes, up 16% or more than 500,000
tonnes from last year and up 1.0 million tonnes from
2014. Imports in 2017 are forecast to increase to 5.8-
6.0 million tonnes.
In the case of potash, MOP imports are projected to
increase to 4.2 million tonnes this year, up 4% or
about 200,000 tonnes from 2015. Delays in settling
2016/17 contracts resulted in first-half imports of just
1.3 million tonnes, a drop of 25% or about 450,000
tonnes from a year ago. So, second-half imports are
projected to total almost 2.9 million tonnes, up 600,000
from last year and up more than 150,000 tonnes from
the higher level of two years ago. Imports next year are
forecast to climb to 4.3-4.5 million tonnes.
®
2.0
3.0
4.0
5.0
First Half Acutal Second Half Actual/Forecast
Mil Tonnes
Source: ANDA and Mosaic
Brazil Potash Imports
2014 2015 2016
1.0
2.0
3.0
4.0
First Half Acutal Second Half Actual/Forecast
Mil Tonnes
Source: ANDA and Mosaic
Brazil Phosphate Imports
2014 2015 2016
0.5
1.5
2.5
3.5
4.5
First Half Acutal Second Half Actual/Forecast
Mil Tonnes
Source: FAI and Mosaic
India DAP Imports
2014 2015 2016
0.0
1.0
2.0
3.0
First Half Acutal Second Half Actual/Forecast
Mil Tonnes
Source: FAI and Mosaic
India Potash Imports
2014 2015 2016
Other Regions Popping Up on Radar Screens
Demand prospects in regions such as Africa, Argentina
and the former Soviet Union also have picked up due
to lower P&K prices as well as other developments.
For example, Argentine phosphate imports are
rebounding as a result of the revival of the agricultural
sector following the elimination or reduction of grain
and oilseed export taxes and a sharp devaluation of
the peso. We project that phosphate shipments will
climb to 1.1 million tonnes this year and to 1.2 million
next year compared to a three-year average of about
850,000 tonnes. In Russia, plant nutrient demand
is booming along with agricultural production thanks
to the combination of favorable weather and a highly
depreciated ruble. Russia this year is expected to
grow its largest wheat crop in the post-Soviet era.
Positive Long Term Demand Prospects
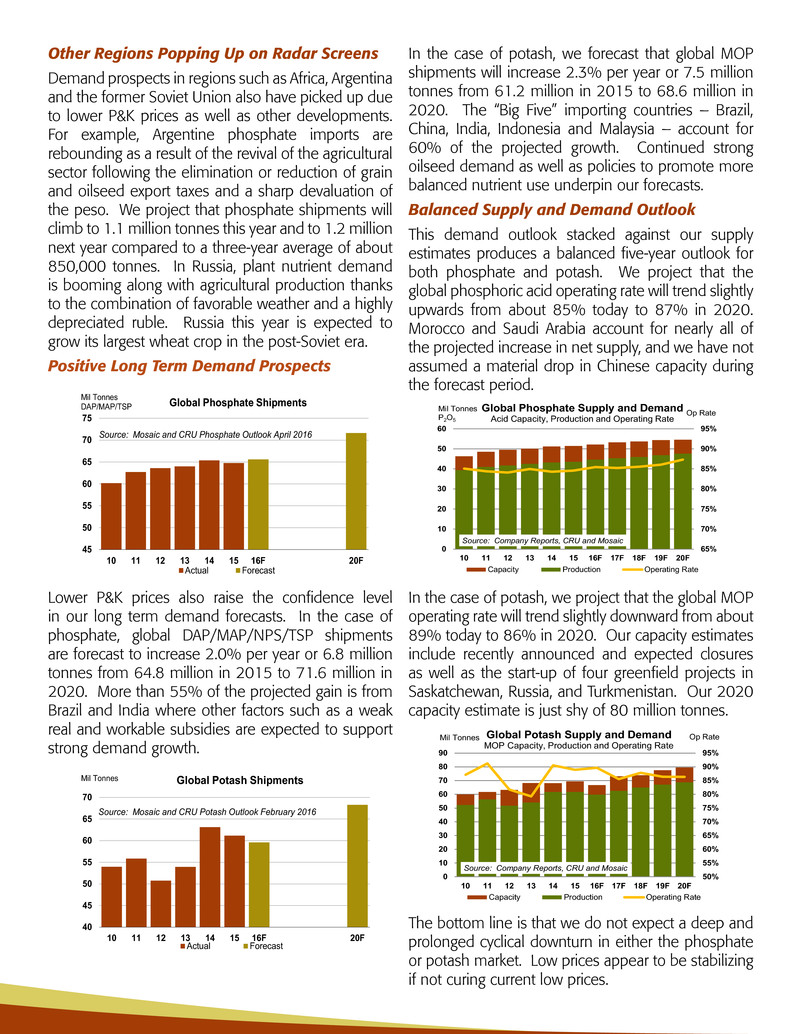
Lower P&K prices also raise the confidence level
in our long term demand forecasts. In the case of
phosphate, global DAP/MAP/NPS/TSP shipments
are forecast to increase 2.0% per year or 6.8 million
tonnes from 64.8 million in 2015 to 71.6 million in
2020. More than 55% of the projected gain is from
Brazil and India where other factors such as a weak
real and workable subsidies are expected to support
strong demand growth.
In the case of potash, we forecast that global MOP
shipments will increase 2.3% per year or 7.5 million
tonnes from 61.2 million in 2015 to 68.6 million in
2020. The “Big Five” importing countries – Brazil,
China, India, Indonesia and Malaysia – account for
60% of the projected growth. Continued strong
oilseed demand as well as policies to promote more
balanced nutrient use underpin our forecasts.
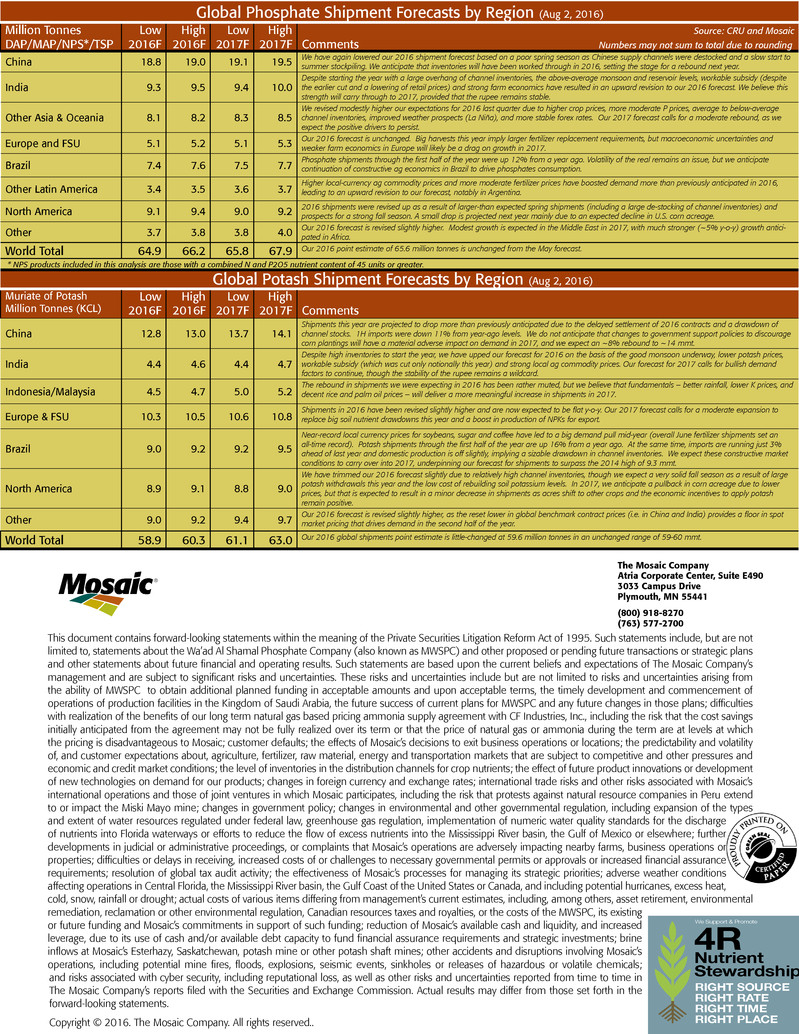
Balanced Supply and Demand Outlook
This demand outlook stacked against our supply
estimates produces a balanced five-year outlook for
both phosphate and potash. We project that the
global phosphoric acid operating rate will trend slightly
upwards from about 85% today to 87% in 2020.
Morocco and Saudi Arabia account for nearly all of
the projected increase in net supply, and we have not
assumed a material drop in Chinese capacity during
the forecast period.
In the case of potash, we project that the global MOP
operating rate will trend slightly downward from about
89% today to 86% in 2020. Our capacity estimates
include recently announced and expected closures
as well as the start-up of four greenfield projects in
Saskatchewan, Russia, and Turkmenistan. Our 2020
capacity estimate is just shy of 80 million tonnes.
The bottom line is that we do not expect a deep and
prolonged cyclical downturn in either the phosphate
or potash market. Low prices appear to be stabilizing
if not curing current low prices.
65%
70%
75%
80%
85%
90%
95%
0
10
20
30
40
50
60
10 11 12 13 14 15 16F 17F 18F 19F 20F
Op RateMil Tonnes P2O5
Source: Company Reports, CRU and Mosaic
Global Phosphate Supply and Demand
Acid Capacity, Production and Operating Rate
Capacity Production Operating Rate
50%
55%
60%
65%
70%
75%
80%
85%
90%
95%
0
10
20
30
40
50
60
70
80
90
10 11 12 13 14 15 16F 17F 18F 19F 20F
Op RateMil Tonnes
Source: Company Reports, CRU and Mosaic
Global Potash Supply and Demand
MOP Capacity, Production and Operating Rate
Capacity Production Operating Rate
45
50
55
60
65
70
75
10 11 12 13 14 15 16F 20F
Global Phosphate Shipments
Actual Forecast
Mil Tonnes
DAP/MAP/TSP
Source: Mosaic and CRU Phosphate Outlook April 2016
40
45
50
55
60
65
70
10 11 12 13 14 15 16F 20F
Actual Forecast
Mil Tonnes
Source: Mosaic and CRU Potash Outlook February 2016
Global Potash Shipments
This document contains forward-looking statements within the meaning of the Private Securities Litigation Reform Act of 1995. Such statements include, but are not
limited to, statements about the Wa’ad Al Shamal Phosphate Company (also known as MWSPC) and other proposed or pending future transactions or strategic plans
and other statements about future financial and operating results. Such statements are based upon the current beliefs and expectations of The Mosaic Company’s
management and are subject to significant risks and uncertainties. These risks and uncertainties include but are not limited to risks and uncertainties arising from
the ability of MWSPC to obtain additional planned funding in acceptable amounts and upon acceptable terms, the timely development and commencement of
operations of production facilities in the Kingdom of Saudi Arabia, the future success of current plans for MWSPC and any future changes in those plans; difficulties
with realization of the benefits of our long term natural gas based pricing ammonia supply agreement with CF Industries, Inc., including the risk that the cost savings
initially anticipated from the agreement may not be fully realized over its term or that the price of natural gas or ammonia during the term are at levels at which
the pricing is disadvantageous to Mosaic; customer defaults; the effects of Mosaic’s decisions to exit business operations or locations; the predictability and volatility
of, and customer expectations about, agriculture, fertilizer, raw material, energy and transportation markets that are subject to competitive and other pressures and
economic and credit market conditions; the level of inventories in the distribution channels for crop nutrients; the effect of future product innovations or development
of new technologies on demand for our products; changes in foreign currency and exchange rates; international trade risks and other risks associated with Mosaic’s
international operations and those of joint ventures in which Mosaic participates, including the risk that protests against natural resource companies in Peru extend
to or impact the Miski Mayo mine; changes in government policy; changes in environmental and other governmental regulation, including expansion of the types
and extent of water resources regulated under federal law, greenhouse gas regulation, implementation of numeric water quality standards for the discharge
of nutrients into Florida waterways or efforts to reduce the flow of excess nutrients into the Mississippi River basin, the Gulf of Mexico or elsewhere; further
developments in judicial or administrative proceedings, or complaints that Mosaic’s operations are adversely impacting nearby farms, business operations or
properties; difficulties or delays in receiving, increased costs of or challenges to necessary governmental permits or approvals or increased financial assurance
requirements; resolution of global tax audit activity; the effectiveness of Mosaic’s processes for managing its strategic priorities; adverse weather conditions
affecting operations in Central Florida, the Mississippi River basin, the Gulf Coast of the United States or Canada, and including potential hurricanes, excess heat,
cold, snow, rainfall or drought; actual costs of various items differing from management’s current estimates, including, among others, asset retirement, environmental
remediation, reclamation or other environmental regulation, Canadian resources taxes and royalties, or the costs of the MWSPC, its existing
or future funding and Mosaic’s commitments in support of such funding; reduction of Mosaic’s available cash and liquidity, and increased
leverage, due to its use of cash and/or available debt capacity to fund financial assurance requirements and strategic investments; brine
inflows at Mosaic’s Esterhazy, Saskatchewan, potash mine or other potash shaft mines; other accidents and disruptions involving Mosaic’s
operations, including potential mine fires, floods, explosions, seismic events, sinkholes or releases of hazardous or volatile chemicals;
and risks associated with cyber security, including reputational loss, as well as other risks and uncertainties reported from time to time in
The Mosaic Company’s reports filed with the Securities and Exchange Commission. Actual results may differ from those set forth in the
forward-looking statements.
Copyright © 2016. The Mosaic Company. All rights reserved..
®
4R
Nutrient
Stewardship
W e S uppo r t & P r omo t e
RIGHT SOURCE
RIGHT RATE
RIGHT TIME
RIGHT PLACE
Global Phosphate Shipment Forecasts by Region (Aug 2, 2016)
Million Tonnes
DAP/MAP/NPS*/TSP
Low
2016F
High
2016F
Low
2017F
High
2017F
Source: CRU and Mosaic
Comments Numbers may not sum to total due to rounding
China 18.8 19.0 19.1 19.5 We have again lowered our 2016 shipment forecast based on a poor spring season as Chinese supply channels were destocked and a slow start to summer stockpiling. We anticipate that inventories will have been worked through in 2016, setting the stage for a rebound next year.
India 9.3 9.5 9.4 10.0
Despite starting the year with a large overhang of channel inventories, the above-average monsoon and reservoir levels, workable subsidy (despite
the earlier cut and a lowering of retail prices) and strong farm economics have resulted in an upward revision to our 2016 forecast. We believe this
strength will carry through to 2017, provided that the rupee remains stable.
Other Asia & Oceania 8.1 8.2 8.3 8.5
We revised modestly higher our expectations for 2016 last quarter due to higher crop prices, more moderate P prices, average to below-average
channel inventories, improved weather prospects (La Niña), and more stable forex rates. Our 2017 forecast calls for a moderate rebound, as we
expect the positive drivers to persist.
Europe and FSU 5.1 5.2 5.1 5.3 Our 2016 forecast is unchanged. Big harvests this year imply larger fertilizer replacement requirements, but macroeconomic uncertainties and weaker farm economics in Europe will likely be a drag on growth in 2017.
Brazil 7.4 7.6 7.5 7.7
Phosphate shipments through the first half of the year were up 12% from a year ago. Volatility of the real remains an issue, but we anticipate
continuation of constructive ag economics in Brazil to drive phosphates consumption.
Other Latin America 3.4 3.5 3.6 3.7
Higher local-currency ag commodity prices and more moderate fertilizer prices have boosted demand more than previously anticipated in 2016,
leading to an upward revision to our forecast, notably in Argentina.
North America 9.1 9.4 9.0 9.2 2016 shipments were revised up as a result of larger-than expected spring shipments (including a large de-stocking of channel inventories) and prospects for a strong fall season. A small drop is projected next year mainly due to an expected decline in U.S. corn acreage.
Other 3.7 3.8 3.8 4.0 Our 2016 forecast is revised slightly higher. Modest growth is expected in the Middle East in 2017, with much stronger (~5% y-o-y) growth antici-pated in Africa.
World Total 64.9 66.2 65.8 67.9 Our 2016 point estimate of 65.6 million tonnes is unchanged from the May forecast.
* NPS products included in this analysis are those with a combined N and P2O5 nutrient content of 45 units or greater.
Global Potash Shipment Forecasts by Region (Aug 2, 2016)
Muriate of Potash
Million Tonnes (KCL)
Low
2016F
High
2016F
Low
2017F
High
2017F
Comments
China 12.8 13.0 13.7 14.1
Shipments this year are projected to drop more than previously anticipated due to the delayed settlement of 2016 contracts and a drawdown of
channel stocks. 1H imports were down 11% from year-ago levels. We do not anticipate that changes to government support policies to discourage
corn plantings will have a material adverse impact on demand in 2017, and we expect an ~8% rebound to ~14 mmt.
India 4.4 4.6 4.4 4.7
Despite high inventories to start the year, we have upped our forecast for 2016 on the basis of the good monsoon underway, lower potash prices,
workable subsidy (which was cut only notionally this year) and strong local ag commodity prices. Our forecast for 2017 calls for bullish demand
factors to continue, though the stability of the rupee remains a wildcard.
Indonesia/Malaysia 4.5 4.7 5.0 5.2
The rebound in shipments we were expecting in 2016 has been rather muted, but we believe that fundamentals – better rainfall, lower K prices, and
decent rice and palm oil prices – will deliver a more meaningful increase in shipments in 2017.
Europe & FSU 10.3 10.5 10.6 10.8
Shipments in 2016 have been revised slightly higher and are now expected to be flat y-o-y. Our 2017 forecast calls for a moderate expansion to
replace big soil nutrient drawdowns this year and a boost in production of NPKs for export.
Brazil 9.0 9.2 9.2 9.5
Near-record local currency prices for soybeans, sugar and coffee have led to a big demand pull mid-year (overall June fertilizer shipments set an
all-time record). Potash shipments through the first half of the year are up 16% from a year ago. At the same time, imports are running just 3%
ahead of last year and domestic production is off slightly, implying a sizable drawdown in channel inventories. We expect these constructive market
conditions to carry over into 2017, underpinning our forecast for shipments to surpass the 2014 high of 9.3 mmt.
North America 8.9 9.1 8.8 9.0
We have trimmed our 2016 forecast slightly due to relatively high channel inventories, though we expect a very solid fall season as a result of large
potash withdrawals this year and the low cost of rebuilding soil potassium levels. In 2017, we anticipate a pullback in corn acreage due to lower
prices, but that is expected to result in a minor decrease in shipments as acres shift to other crops and the economic incentives to apply potash
remain positive.
Other 9.0 9.2 9.4 9.7
Our 2016 forecast is revised slightly higher, as the reset lower in global benchmark contract prices (i.e. in China and India) provides a floor in spot
market pricing that drives demand in the second half of the year.
World Total 58.9 60.3 61.1 63.0 Our 2016 global shipments point estimate is little-changed at 59.6 million tonnes in an unchanged range of 59-60 mmt.
The Mosaic Company
Atria Corporate Center, Suite E490
3033 Campus Drive
Plymouth, MN 55441
(800) 918-8270
(763) 577-2700
