Attached files
| file | filename |
|---|---|
| EX-99.1 - EX-99.1 - MFA FINANCIAL, INC. | a16-15976_1ex99d1.htm |
| 8-K - 8-K - MFA FINANCIAL, INC. | a16-15976_18k.htm |
Exhibit 99.2
Second Quarter 2016 Earnings Presentation

Forward looking statements When used in this presentation or other written or oral communications, statements which are not historical in nature, including those containing words such as “will,” “believe,” “expect,” “anticipate,” “estimate,” “plan,” “continue,” “intend,” “should,” “could”, “would”, “may” or similar expressions, are intended to identify “forward-looking statements” within the meaning of Section 27A of the Securities Act of 1933, as amended, and Section 21E of the Securities Exchange Act of 1934, as amended, and, as such, may involve known and unknown risks, uncertainties and assumptions. Statements regarding the following subjects, among others, may be forward-looking: changes in interest rates and the market value of MFA’s MBS, an increase of which could result in a reduction of the yield on MBS in our portfolio and could require us to reinvest the proceeds received by us as a result of such prepayments in MBS with lower coupons; changes in the prepayment rates on the mortgage loans securing MFA’s MBS; credit risks underlying MFA’s assets, including; changes in the default rates and management’s assumptions regarding default rates on the mortgage loans securing MFA’s Non-Agency MBS and as related to MFA’s residential whole loan portfolio; MFA’s ability to borrow to finance its assets and the terms, including the cost, maturity and other terms, of any such borrowings; implementation of or changes in government regulations or programs affecting MFA’s business; MFA’s estimates regarding taxable income the actual amount of which is dependent on a number of factors, including, but not limited to, changes in the amount of interest income and financing costs, the method elected by the Company to accrete the market discount on Non-Agency MBS and the extent of prepayments, realized losses and changes in the composition of MFA’s Agency MBS and Non-Agency MBS portfolios that may occur during the applicable tax period, including gain or loss on any MBS disposals; the timing and amount of distributions to stockholders, which are declared and paid at the discretion of MFA’s Board of Directors and will depend on, among other things, MFA’s taxable income, its financial results and overall financial condition and liquidity, maintenance of its REIT qualification and such other factors as the Board deems relevant; MFA’s ability to maintain its qualification as a REIT for federal income tax purposes; MFA’s ability to maintain its exemption from registration under the Investment Company Act of 1940, as amended (or the Investment Company Act), including statements regarding the Concept Release issued by the SEC relating to interpretive issues under the Investment Company Act with respect to the status under the Investment Company Act of certain companies that are in engaged in the business of acquiring mortgages and mortgage-related interests; MFA’s ability to successfully implement its strategy to grow its residential whole loan portfolio; expected returns on our investments in non-performing residential whole loans (NPLs), which are affected by, among other things, the length of time required to foreclose upon, sell, liquidate or otherwise reach a resolution of the property underlying the NPL, home price values, amounts advanced to carry the asset (e.g., taxes, insurance, maintenance expenses, etc. on the underlying property) and the amount ultimately realized upon resolution of the asset; and risks associated with investing in real estate assets, including changes in business conditions and the general economy. These and other risks, uncertainties and factors, including those described in the annual, quarterly and current reports that MFA files with the Securities and Exchange Commission, could cause MFA’s actual results to differ materially from those projected in any forward-looking statements it makes. All forward-looking statements speak only as of the date on which they are made. New risks and uncertainties arise over time and it is not possible to predict those events or how they may affect MFA. Except as required by law, MFA is not obligated to, and does not intend to, update or revise any forward-looking statements, whether as a result of new information, future events or otherwise. 2
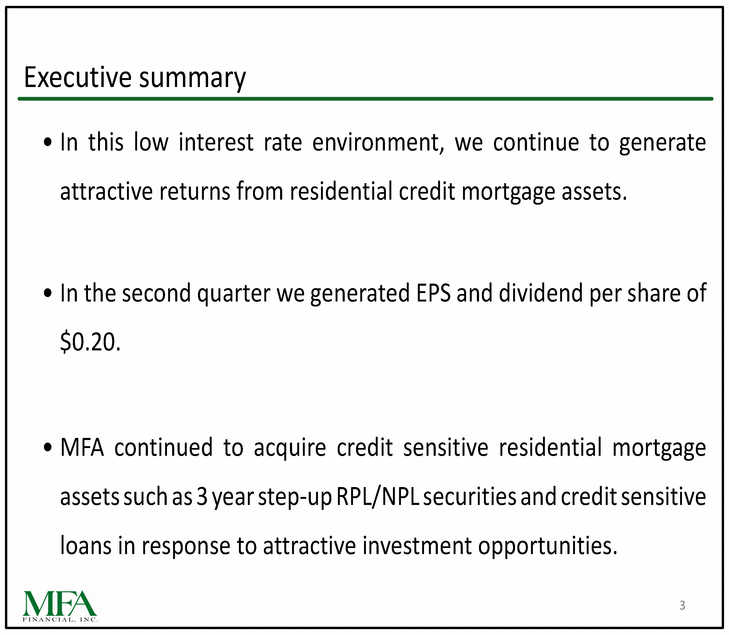
Executive summary • In this low interest rate environment, we continue to generate attractive returns from residential credit mortgage assets. • In the second quarter we generated EPS and dividend per share of $0.20. • MFA continued to acquire credit sensitive residential mortgage assets such as 3 year step-up RPL/NPL securities and credit sensitive loans in response to attractive investment opportunities. 3
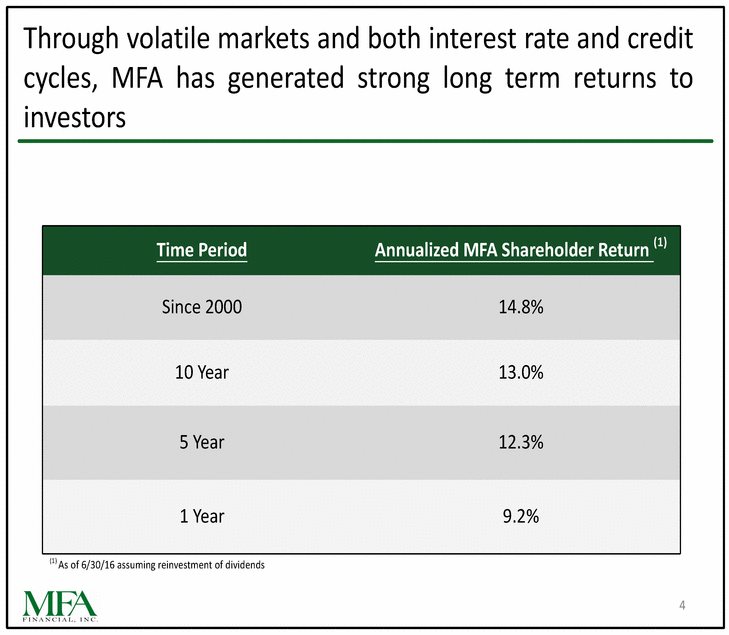
Through volatile markets and both interest rate and credit cycles, MFA has generated strong long term returns to investors (1) As of 6/30/16 assuming reinvestment of dividends 4 Time PeriodAnnualized MFA Shareholder Return (1) Since 200014.8% 10 Year13.0% 5 Year12.3% 1 Year9.2%
2016 MFA strategy 1)Invest in high value-added assets A.Generate returns from investment in credit sensitive residential mortgage assets •MFA’s credit sensitive assets continue to perform well. Legacy Non-Agency MBS Credit Reserve has been reduced by $39.9 million over the past 12 months. B.Acquire assets with less interest rate sensitivity •74% of MFA MBS are adjustable, hybrid or step-up •Net portfolio duration of 0.50 2)Maintain staying power and the ability to invest in distressed, less liquid markets •Permanent equity capital •Debt to Equity Ratio of 3.3x is low enough to accommodate potential declines in asset prices. •MFA is able to invest while other investors may face concerns about capital outflows and potential mark-to-market losses. 5
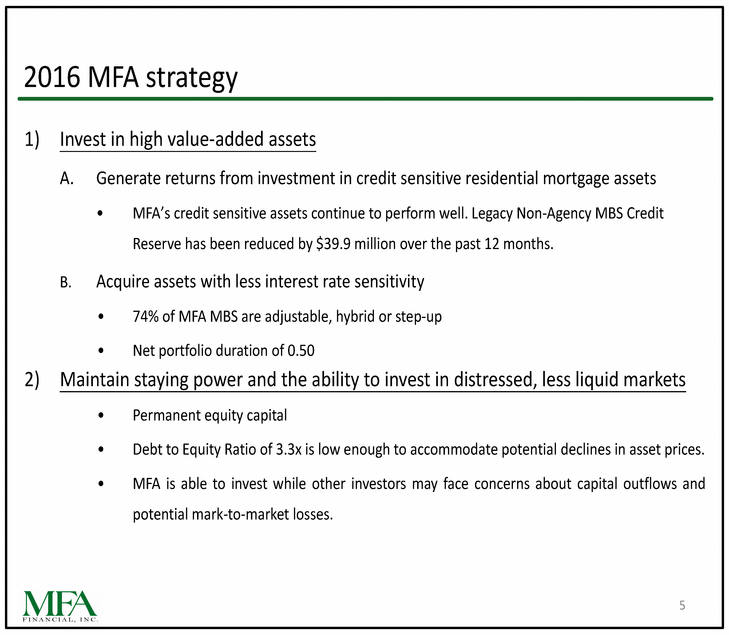
$2,496 $(337) $466 $14 $2,639 $143 NPL Securities $3,605 $(211) $33 $39 $3,466 $(139) MBS Second quarter investment flows Our assets run off due to amortization, paydowns or sale, allowing reinvestment opportunities in changing interest rate and credit environments. $ in Millions 2016RunoffAcquisitionsother changes June 30, 2016Change Non-performing Loans$1,024$(31)$89$(5)$1,077$53 3 Year Step-up RPL/ Securities$216$—$51$6$273$57 Legacy Non-Agency Totals$11,886$(818)$639$56$11,763$(123) 6 Agency MBS$4,545$(239)$—$2$4,308$(237) Credit Risk Transfer March 31,2nd Quarter2nd QuarterMTM and2nd Quarter Re-performing and
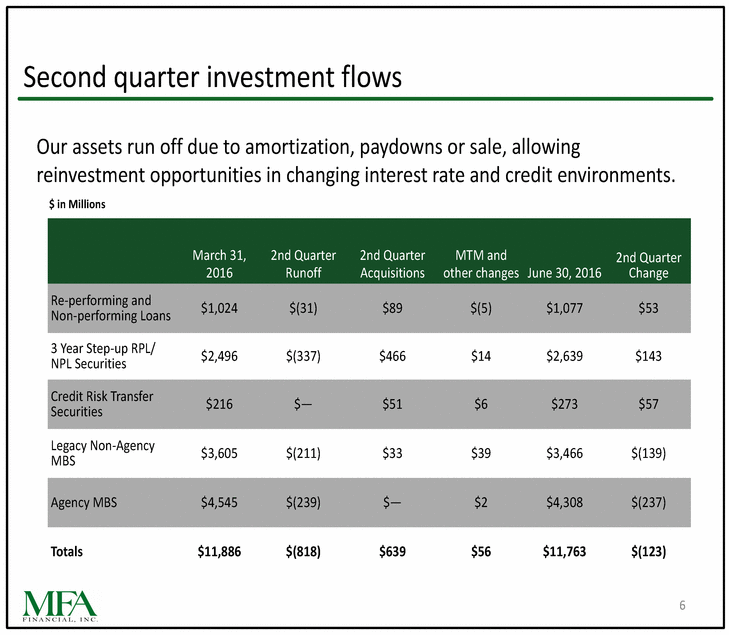
MFA’s yields and spreads remain attractive Earning Assets 4.19% 4.23% 4.15% Rate Spread 2.14% 2.18% 2.22% Equity Ratio 3.3x 3.4x 3.4x 7 SecondFirstFourth QuarterQuarterQuarter 201620162015 Yield on Interest Net Interest Debt EPS$0.20$0.20$0.19
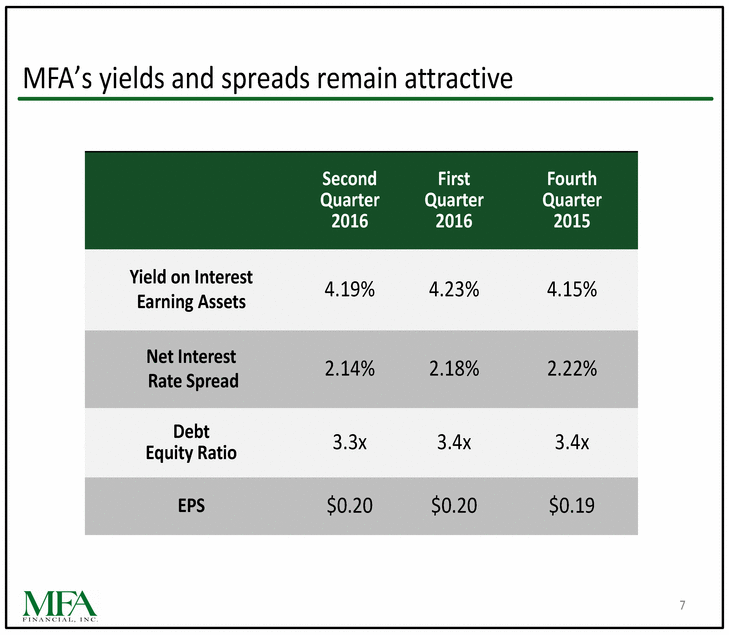
Yields and spreads by asset type (1) Net of 37 bps of servicing costs. (2) Residential whole loans held at fair value produce GAAP income/loss based on changes in fair value in the current period and therefore results will vary on a quarter to quarter basis. The company expects to realize returns over time on these investments of 5-7%. 8 Debt/Net AssetYield/ReturnCost of FundsNet SpreadEquity Ratio Agency MBS1.96%(1.26)%0.70%7.9x Legacy Non-Agency MBS7.72%(2.88)%4.84%2.2x RPL/NPL MBS3.83%(2.01)%1.82%3.6x RPL Whole Loans5.80% (1) (2.78)%3.02%0.8x NPL Whole Loans(2) (3.27)%(2) 1.5x
Undistributed REIT taxable income • As of June 30, 2016 MFA had undistributed REIT taxable income of $0.22 per share. • Undistributed REIT taxable income includes the impact of the settlement of the Countrywide litigation. MFA received its share of the settlement proceeds during the second quarter (resolving MFA’s involvement in the Countrywide actions), resulting in additional estimated taxable income for the quarter of approximately $0.05 per share. 9
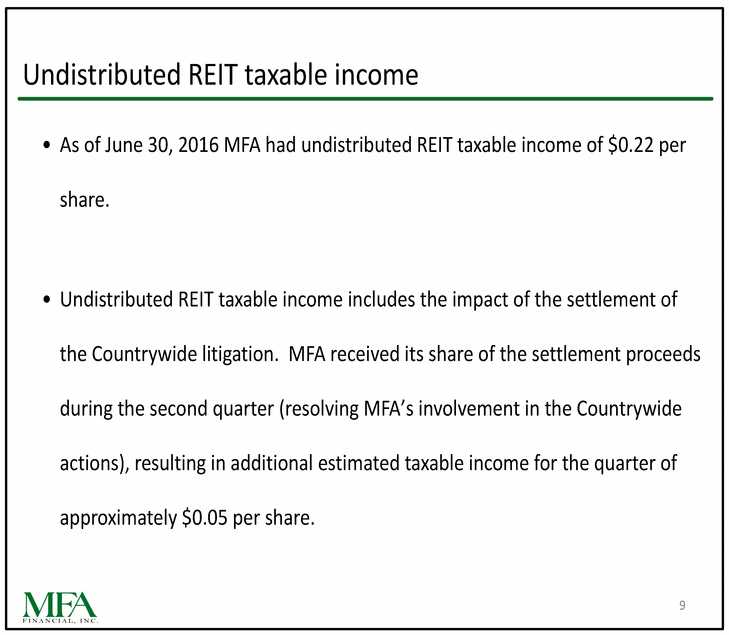
MFA’s interest rate sensitivity remains below 1.0, as measured by net duration $ in Millions 10 Net Duration0.50 AssetsMarket ValueAverage CouponDuration Non-Agency ARMs (12 months or less MTR)$2,5353.18%0.5 Non-Agency Hybrid (13-48 MTR)$924.79%1.0 NPL/RPL Securities$2,6393.84%0.4 Non-Agency Fixed Rate$1,1125.82%3.0 Residential Whole Loans$1,0934.34%2.5 Agency ARMs (12 months or less MTR)$1,6862.82%0.6 Agency ARMs (13-120 MTR)$9793.04%1.1 Agency 15 Year Fixed Rate$1,6423.07%2.7 Cash, Cash Equivalents & Principal Receivable$3270.0 TOTAL ASSETS$12,1041.22 Hedging InstrumentsNotional AmountDuration Swaps (Less than 3 years)$1,200-1.6 Swaps (3-10 years)$1,800-4.0 TOTAL HEDGES$3,000-3.0
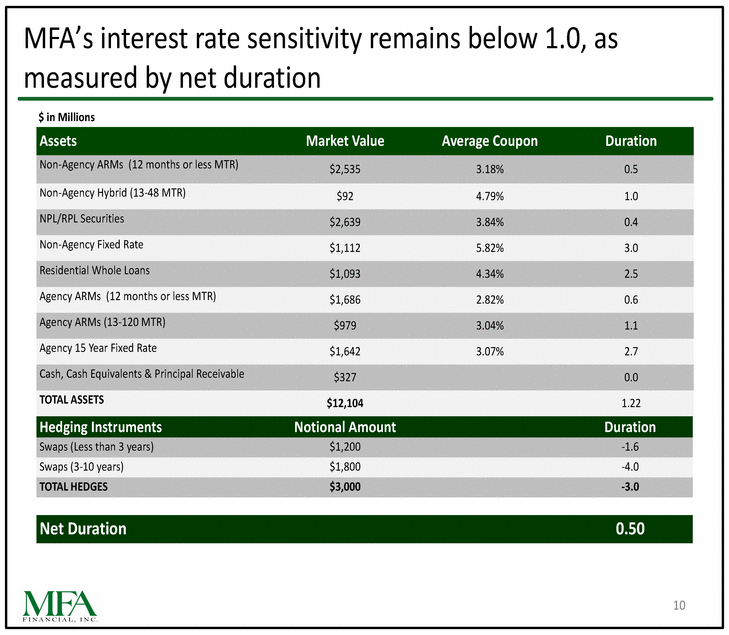
12 10 Agency CPR & Non-Agency CRR Q3-2013 Q4-2013 Q1-2014 Q2-2014 Q3-2014 Q4-2014 Q1-2015 Q2-2015 Q3-2015 Q4-2015 Q1-2016 Q2-2016 10-Yr UST Prepayment speeds on MFA’s Legacy Non-Agency MBS and Agency MBS have trended together over time •MFA’s Agency MBS were acquired at an average premium of 4% and have a remaining premium amount of $154.6 million while our Legacy Non-Agency MBS were acquired at an average discount of 27% and have a remaining discount amount of $1.0 billion. MFA Agency MBS and Legacy Non-Agency MBS Prepayments 223.2 203.0 182.8 162.6 142.4 2.2 82.0 61.8 41.6 21.4 01.2 Agency MBS CPRLegacy Non-Agency MBS CRR10 Yr UST (Right) 11
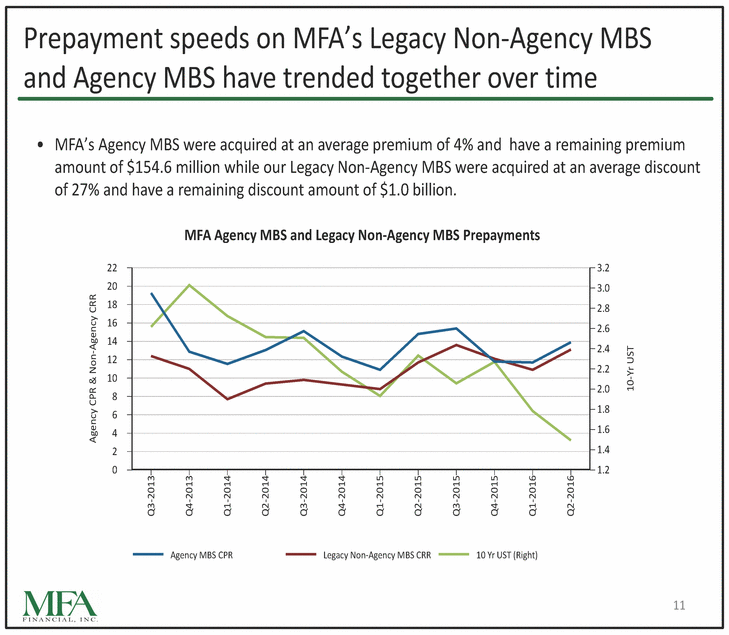
Millions ($) Q3-2013 Q4-2013 Q1-2014 Q2-2014 Q3-2014 Q4-2014 Q1-2015 Q2-2015 Q3-2015 Q4-2015 Q1-2016 Q2-2016 Legacy Non-Agency MBS discount accretion has exceeded Agency MBS premium amortization since 2013 MFA's Agency MBS Premium Amortization and Legacy Non-Agency MBS Discount Accretion by quarter $30 $25 $20 $15 $10 $5 $0 Agency MBS Premium AmortizationLegacy Non-Agency MBS Discount Accretion 12
While economic growth rate is uncertain, there are many positive fundamentals for residential mortgage credit and home prices • Strong fundamental and technical support for residential credit assets and home prices • Sales of existing homes rose 3% year over year to 5.57 million and remain at their highest annual pace since February 2007* • Median existing single-family home prices are up 4.8% year over year* • Total housing inventory is down to 2.12 million, coming close to the lowest level in over 15 years* • Foreclosure inventory is down 24.5% year over year (as of May 2016)** • 268,000 residential properties regained equity in Q1 2016 from the prior quarter** * Data sourced from the National Association of Realtors website **CoreLogic 13
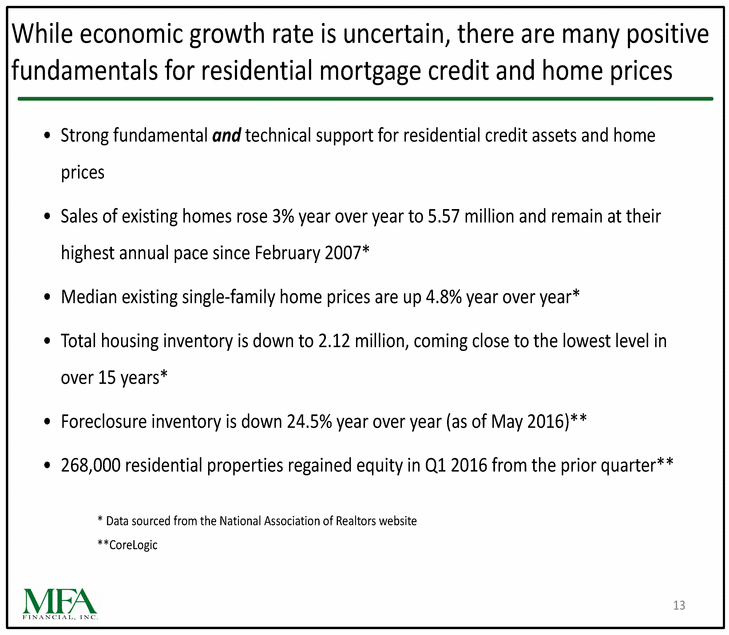
Continued growth in credit sensitive loan portfolio • Re-Performing and Non-Performing Loan Portfolio $ in Millions • At today’s market prices, re-performing and non-performing residential mortgage loans generate higher yields than residential MBS. • Residential whole loans are qualifying interests for purposes of REIT qualification and 1940 Act exemption. • Significant expected supply. 14 June 30, 2016March 31, 2016Dec 31, 2015Sep 30, 2015June 30, 2015 $1,077$1,024$895$777$429
Credit sensitive residential whole loans: growing asset class for MFA • Early results indicate returns to date are consistent with our expectation of 5-7% • Utilizes the same residential mortgage credit expertise we have employed in Legacy Non-Agency MBS since 2008. • Ability to oversee servicing decisions (loan modifications, short sales, etc.) to produce better NPV outcomes. • MFA has obtained financing of $584.0 million through three different warehouse borrowing facilities. We are currently negotiating the establishment of a fourth warehouse facility. • MFA actively manages its loan portfolio through in-house asset management professionals and utilizes third-party special servicers. 15
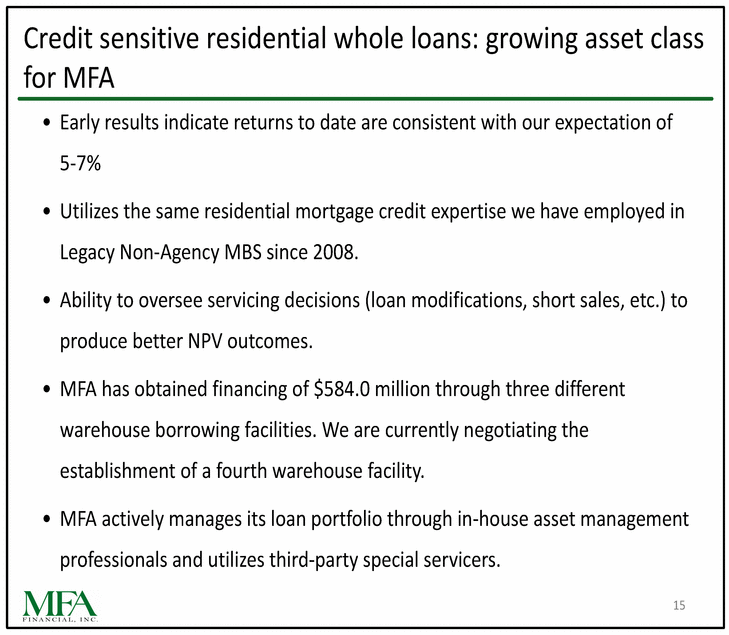
Second quarter RPL/NPL MBS holdings • Current market yields of mid to high 3% • Well protected portfolio with current credit enhancement of 48% • Very short assets with an average of 21 months remaining to step-up ValueNetMonths toCreditCreditAverage 16 FairCurrentOriginal3 Month As of June 30, 2016mmCouponStep-UpSupportSupportBond CPR Re-Performing MBS$4853.71%1347%40%20.1% Non-Performing MBS$2,1543.87%2348%47%26.6% Total RPL/NPL MBS$2,6393.84%2148%46%25.4%
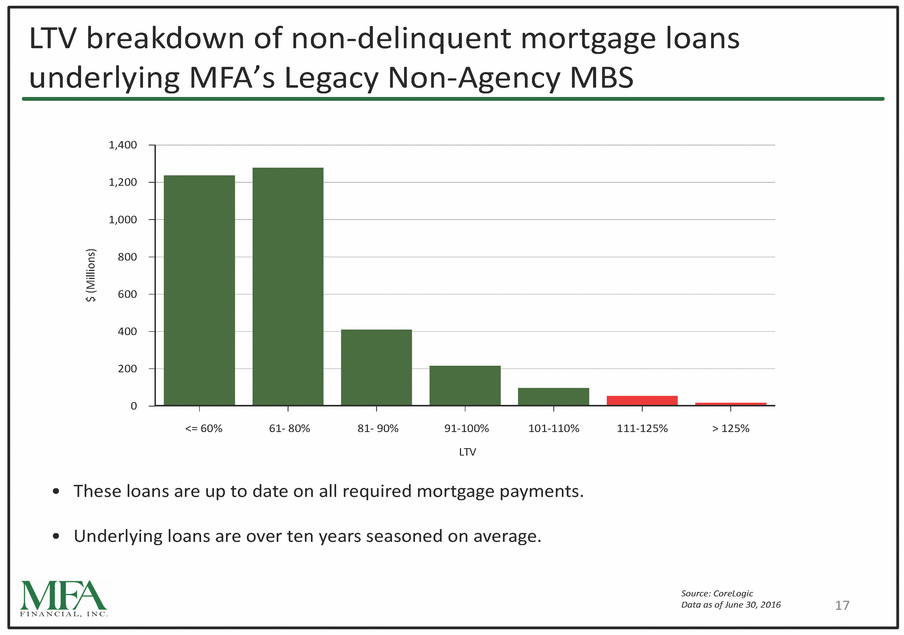
$ (Millions) LTV breakdown of non-delinquent mortgage loans underlying MFA’s Legacy Non-Agency MBS 1,400 1,200 1,000 800 600 400 200 0 <= 60%61-80%81-90%91-100%101-110%111-125%> 125% LTV •These loans are up to date on all required mortgage payments. •Underlying loans are over ten years seasoned on average. Source: CoreLogic Data as of June 30, 201617
Summary •We continue to utilize our expertise to identify and acquire attractive credit sensitive residential mortgage assets. •Continued to acquire 3 Year step-up RPL/NPL securities and credit sensitive mortgage loans during the quarter. •Our credit sensitive assets continue to perform well. •MFA is well positioned for changes in prepayment rates, monetary policy and/or interest rates. 18
Additional Information 19

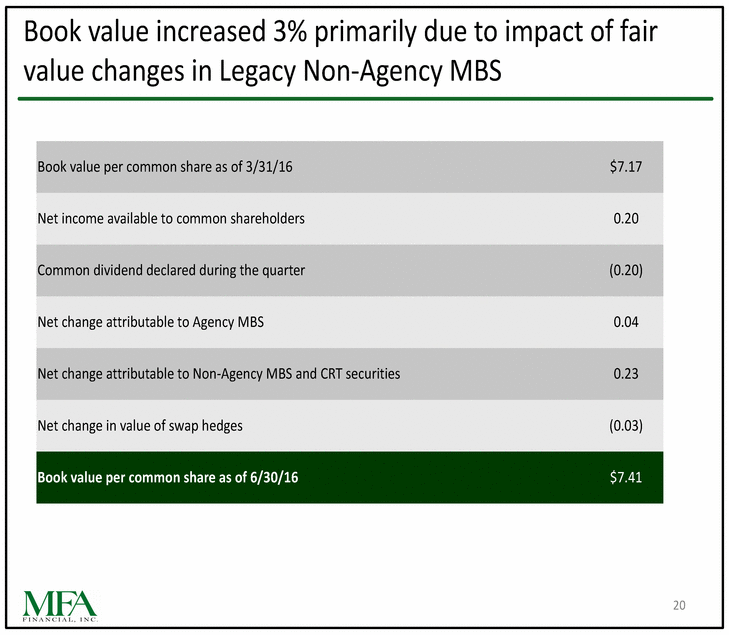
Book value increased 3% primarily due to impact of fair value changes in Legacy Non-Agency MBS 20 Book value per common share as of 3/31/16$7.17 Net income available to common shareholders0.20 Common dividend declared during the quarter(0.20) Net change attributable to Agency MBS0.04 Net change attributable to Non-Agency MBS and CRT securities0.23 Net change in value of swap hedges(0.03) Book value per common share as of 6/30/16$7.41
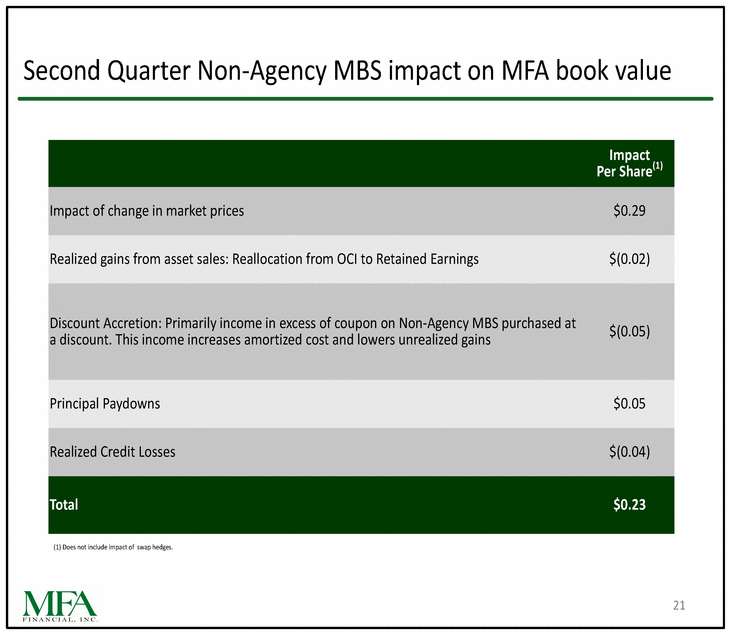
Second Quarter Non-Agency MBS impact on MFA book value Per Share(1) a discount. This income increases amortized cost and lowers unrealized gains$(0.05) (1) Does not include impact of swap hedges. 21 Impact Impact of change in market prices$0.29 Realized gains from asset sales: Reallocation from OCI to Retained Earnings$(0.02) Discount Accretion: Primarily income in excess of coupon on Non-Agency MBS purchased at Principal Paydowns$0.05 Realized Credit Losses$(0.04) Total$0.23
