Attached files
| file | filename |
|---|---|
| 8-K - DIME COMMUNITY BANCSHARES, INC. 8-K 8-2-2016 - DIME COMMUNITY BANCSHARES INC | form8k.htm |
Exhibit 99.1

“Lending for the Way New Yorkers Live” INVESTOR PRESENTATIONKBW 16th Annual Community Bank Investor ConferenceAugust 2016

Forward-looking StatementsThis presentation contains a number of forward-looking statements within the meaning of Section 27A of the Securities Act of 1933, as amended and Section 21E of the Securities Exchange Act of 1934, as amended (the "Exchange Act"). These statements may be identified by use of words such as "anticipate," "believe," "could," "estimate," "expect," "intend," "seek," "may," "outlook," "plan," "potential," "predict," "project," "should," "will," "would" and similar terms and phrases, including references to assumptions.Forward-looking statements are based upon various assumptions and analyses made by Dime Community Bancshares, Inc. (the "Holding Company," and together with its direct and indirect subsidiaries, the "Company") in light of management’s experience and its perception of historical trends, current conditions and expected future developments, as well as other factors it believes appropriate under the circumstances. These statements are not guarantees of future performance and are subject to risks, uncertainties and other factors (many of which are beyond the Company’s control) that could cause actual conditions or results to differ materially from those expressed or implied by such forward-looking statements. These factors include, without limitation, the following:the timing and occurrence or non-occurrence of events may be subject to circumstances beyond the Company’s control;there may be increases in competitive pressure among financial institutions or from non-financial institutions;the net interest margin is subject to material short-term fluctuation based upon market rates;changes in deposit flows, loan demand or real estate values may adversely affect the business of Dime Community Bank (the "Bank");changes in accounting principles, policies or guidelines may cause the Company’s financial condition to be perceived differently;changes in corporate and/or individual income tax laws may adversely affect the Company's business or financial condition;general economic conditions, either nationally or locally in some or all areas in which the Company conducts business, or conditions in the securities markets or the banking industry may be less favorable than the Company currently anticipates;legislation or regulatory changes may adversely affect the Company’s business;technological changes may be more difficult or expensive than the Company anticipates;success or consummation of new business initiatives may be more difficult or expensive than the Company anticipates;litigation or other matters before regulatory agencies, whether currently existing or commencing in the future, may delay the occurrence or non-occurrence of events longer than the Company anticipates; andThe risks referred to in the section entitled "Risk Factors."The Company has no obligation to update any forward-looking statements to reflect events or circumstances after the date of this document. 2

about… DIMENEW YORK CITY’S PREMIER COMMUNITY BANK MULTIFAMILY LENDER SINCE 1965 Dime Community Bancshares, Inc., is the holding company for Dime Community Bank, a $5.56 billion dollar institutionCommunity retail bank model with an emphasis on New York City Multifamily LendingLow credit risk model with consistently strong returnsTwenty-five branches serving Brooklyn, Queens, The Bronx, and Nassau CountiesSplit-adjusted IPO price of a DCOM share is $2.96. The annualized total return since the IPO has been 12%; cumulative total return has approximated 870%Current dividend of $0.14/QTR (Yield of 3.29% based on June 30, 2016 closing price of $17.01)Significant management tenure and insider equity ownershipVariety of initiatives underway to continue to drive shareholder value and returns 3

Branch Network 4 25 Branches in New York City metropolitan areaAverage branch size = $151.2 million as of June 30, 2016 (1) Data as of June 30, 2015 Source: FDIC(2) As of June 30, 2016 City / County 2015 Market Share Rank (1) Number of Dime Branches (2) Deposits in Market ($mm) Total Market Share (%) Brooklyn 10 10 $ 1,264 2.68% Queens 14 7 845 1.5% Nassau 16 7 902 1.32% Bronx 19 1 68 0.57%

Key Officers & Directors 5 Amounts per page 4 of the Company’s proxy statement dated April 12, 2016. Name Title Tenure Inside Ownership* EXECUTIVE OFFICERS and DIRECTORS: Vincent F. Palagiano Chairman & CEO 46 years 2.3% (863,872 shares) Kenneth J. Mahon President & COO 36 years 1.0% (380,665 shares) Total Directors and Executive Officers Ownership 12.7% (4,739,514 shares) OTHER OPERATING OFFICERS: Daniel Harris Chief Lending Officer 8 years (plus 26 years prior combined banking and law) Timothy King Chief Risk Officer 33 years Michael Pucella Chief Accounting Officer 35 years Timothy Lenhoff Chief Technology Officer Since October 2014. 30 years IT industry experience Robert Volino Chief Investment Officer 17 years Anthony Rose Chief Administrative Officer (Start Date: April 2016).

Initiatives: Investing in the Business 6 Plans for three new Brooklyn branches to open by Fall 2016Including 2 new branches in Williamsburg and 1 in Park SlopeBusiness banking outreach to commercial borrowers to grow business depositsDevelopment of Outreach Programs to small- and micro- business customers in the Bank’s trade areasGrowth of sales and training staff; introduction of customer relationship management process. Tighter focus on pay-for-performanceIntegration of customer relationship management software

Initiatives: Investing in the Business 7 Investments in technology and staffing; major focus on e-banking, internet and cybersecurityMobile banking for consumers and small businessDevelopment of the internet banking channel to grow deposits more efficiently and rapidly than brick-and-mortarCost-cutting initiatives to pay for new project implementationsInternal restructuring to create a leaner, more customer-responsive operations departmentMonetization of owned real estate in Williamsburg, Brooklyn, created significant book value and free capital

Another Year of Top Performance BankDirector: DIME RANKS # 39 in $1 to $5 billion asset group“The 200 largest U.S. banks are stronger and more profitable than at any time since the Great Recession.” SNLThrift Investor:DIME RANKS # 5 of 100For the eighth straight year, Dime ranks fifth or higher in SNL survey. Resurgent Performance, Inc:DIME RANKS # 2 in Lending Performance DIME RANKS 4th Most Prolific NYC Real Estate Lender, Oct 30, 2015 8

Focus on GrowthStrong Multifamily ExpertiseLow Cost OperatorShareholder ValueRisk Management Investor Highlights 9

Tangible Common Equity / Tangible Assets (%) Grow assets 15% on average over the next 3 years (goal of 15%-18% growth for 2016)Decrease the loan to deposit ratioRemain focused on NYC commercial real estate lendingMaintain tangible common equity sufficient to support growthRaise additional capital from monetization of Williamsburg real estateIncrease lower cost commercial and business deposits. 3 to 5 Year Goals DIME 3 to 5 Year GoalsFocus on Asset Growth Total Risk Weighted Capital Ratio (Bank) (%) 10

Loan and Deposit Growth 11 Loan CAGR: 10%Deposit CAGR: 11%

12 Deposit Growth Initiatives Increase Percentage of Commercial and Small Business Deposits 2015 - 2017 Deposit Change from 2015 - 2016 Category June 2015 Avg. Cost June 2016 Avg. Cost % Growth CRE deposits 156,036 0.12% 235,484 0.17% 51% Business Deposits 38,503 0.17% 70,450 0.41% 83% Branch Consumer Deposits 2,739,268 0.82% 3,474,331 0.91% 27% Total 2,933,807 0.78% 3,780,265 0.85% 29% Branch Consumer Deposits93% Business Deposits1% CREDeposits6% Pie chart as of June 30, 2016

Focus on GrowthStrong Multifamily ExpertiseLow Cost OperatorShareholder ValueRisk Management Investor Highlights 13

MANHATTAN Loan Portfolio Geographic Distribution BROOKLYN 14

New York City Housing Stock 15 Source: 2014 New York City Housing and Vacancy Survey and census data. Total housing stock equals 3,217,521 units1 New York City is a city of apartment dwellers, and even more so a city of renters. About 2/3rds of New York City’s housing stock is classified as renter-occupiedDime has historically been one of the primary lenders in the small (10 – 75 unit, rent-regulated) apartment house market in New York City, which is summed up in our mission statement: Lending for the Way New Yorkers Live. 15 Source: (1) US Bureau of the Census, 2014 New York City Housing and Vacancy Survey

Balance % of Total Current LTV Pure multi-family 2,658,418 51% 53% Residential mixed use 1,547,981 30% 56% Pure commercial 517,938 10% 51% Commercial mixed use 393,112 8% 50% 1-4 family / Co-ops 67,697 1% 50% HELOC / Home Improvement 13,647 0% N/A 16 Real Estate Loan Portfolio 16 Pure Multifamily Residential Mixed Use Pure Commercial 1-4 family / Co-Ops HELOC / Home Improvement CommercialMixed Use

Certain statements contained in this quarterly report on Form 10-Q that are not statements of historical fact constitute forward-looking statements within the meaning of the Private Securities Litigation Reform Act of 1995 (the “Act”), notwithstanding that such statements are not specifically identified as such. In addition, certain statements may be contained in future filings with the U.S. Securities and Exchange Commission ("SEC"), in press releases, and in oral and written statements made by management or with their approval that are not statements of historical fact and constitute forward-looking statements within the meaning of the Act. Examples of forward-looking statements include, but are not limited to: (i) projections of revenues, expenses, income or loss, earnings or loss per share, the payment or nonpayment of dividends, capital structure and other financial items; (ii) statements of plans, objectives and expectations of Dime Community Bancshares, Inc. and its subsidiaries (the "Company") or those of its management or board of directors, including those relating to products or services; (iii) statements of future economic performance; and (iv) statements of assumptions underlying such statements. Forward-looking statements include information concerning possible or assumed future results of operations and statements preceded by, followed by or that include the words “believes,” “expects,” “feels,” “anticipates,” “intends,” “plans,” “estimates,” “predicts,” “projects,” “potential,” “outlook,” “could,” “will,” “may” or similar expressions. Forward-looking statements are not guarantees of future performance and are subject to risks, uncertainties and assumptions. Actual results may differ materially from those expressed in or implied by these forward-looking statements. Factors that could cause actual results to differ from these forward-looking statements include, but are not limited to, the following, as well as those discussed elsewhere in this report and the documents incorporated by reference herein: Undue reliance should not be placed on any forward-looking statements. Forward-looking statements speak only as of the date they are made, and the Company undertakes no obligation to update them in light of new information or future events except to the extent required by Federal securities laws. CRE Concentration in Residential Loans82% of Dime’s CRE portfolio consists of New York City & area Multifamily Loans In December 2006, Interagency guidance “Concentrations in Commercial Real Estate Lending, Sound Risk Management Practices” is issued, defining “Commercial Real Estate” as including multifamily housingIn recognition of the new regulatory environment, Dime enhanced its CRE underwriting criteria and built out a strong credit administration and portfolio monitoring functionDime’s consistently low, industry leading CRE loan loss and non-performing loan rates underscores the commitment of the bank’s board and management to effectively manage CRE concentration risk 17 Year-end except for 2016, which represents June 30.
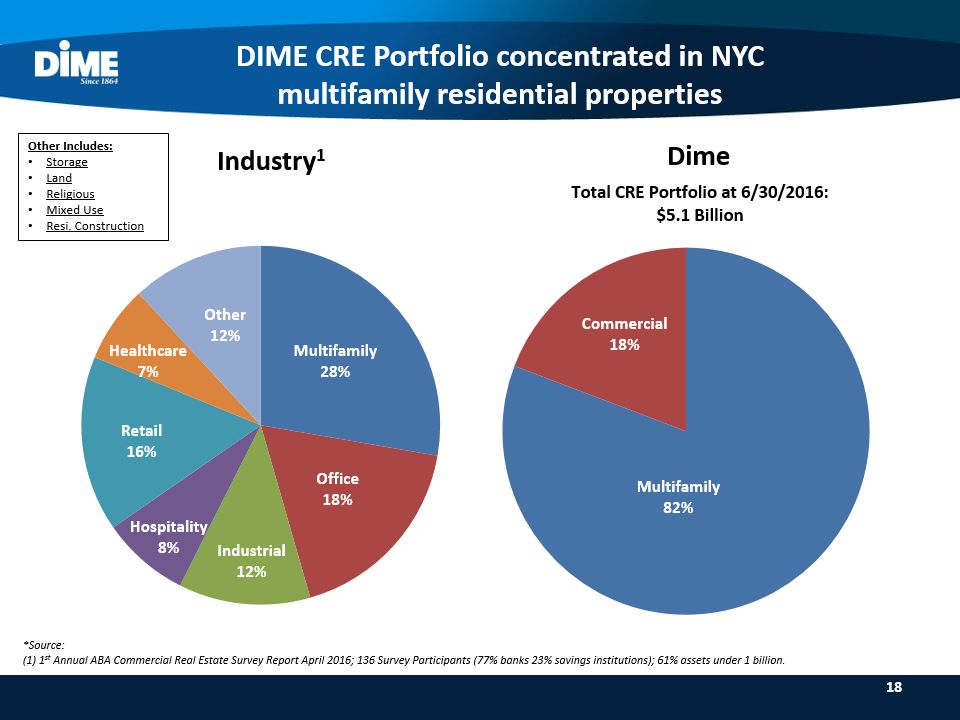
DIME CRE Portfolio concentrated in NYC multifamily residential properties Other Includes:StorageLandReligiousMixed UseResi. Construction *Source: (1) 1st Annual ABA Commercial Real Estate Survey Report April 2016; 136 Survey Participants (77% banks 23% savings institutions); 61% assets under 1 billion. 18

Repricing Real Estate Loans 19 ©1999-2008 Annual Repricings ($ in millions) Frequent repricingEarly prepayments add an element of revenue to the P&L Cumulative Repricings ($ in millions)
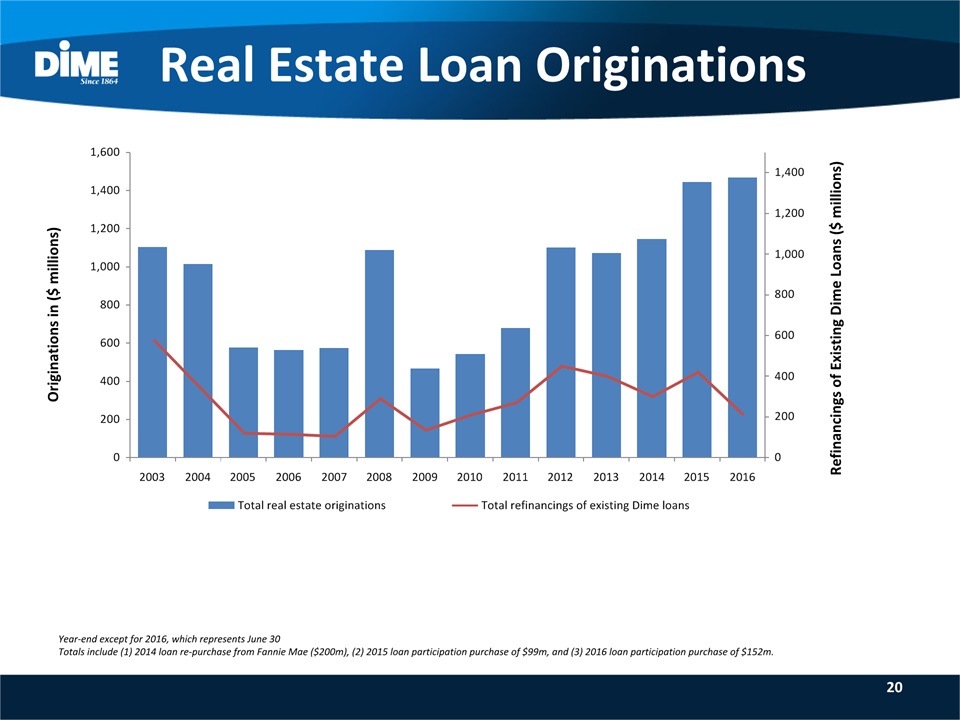
Real Estate Loan Originations 20 Originations in ($ millions) Refinancings of Existing Dime Loans ($ millions) Year-end except for 2016, which represents June 30Totals include (1) 2014 loan re-purchase from Fannie Mae ($200m), (2) 2015 loan participation purchase of $99m, and (3) 2016 loan participation purchase of $152m.

Debt Service & Loan-to-Value Ratios on New Loans 21 ©1999-2008 Loan originations ($ millions) Weighted average LTV consistently at or below 65% Average:DSR = 2.11LTV = 58% Average:DSR = 1.85LTV = 59% Average:DSR = 1.52LTV = 65% Average:DSR = 1.53LTV = 63% Average:DSR = 1.47LTV = 59% Average:DSR = 1.96LTV = 52% Average:DSR = 2.01LTV = 53% Average:DSR = 2.40LTV = 50% Average:DSR = 2.20LTV = 56% Average:DSR = 2.21LTV = 54% Average:DSR = 2.62LTV = 55% Average:DSR = 1.76LTV = 63% Year-end except for 2016, which represents June 30Totals include (1) 2014 loan re-purchase from Fannie Mae ($200m), (2) 2015 loan participation purchase of $99m, and (3) 2016 loan participation purchase of $152m. Average:DSR = 2.37LTV = 56% Average:DSR = 1.98LTV = 53% Average:DSR = 2.37LTV = 56% Average:DSR = 1.93LTV = 55% Average:DSR = 1.60LTV = 62%

Focus on GrowthStrong Multifamily ExpertiseLow Cost OperatorShareholder ValueRisk Management Investor Highlights 22

Source: SNL Financial; peer group includes AF, FNFG, FFIC, ISBC, KRNY, ORIT, NFBK, OCFC, PFS, SNBC, STL, SBNY, VLY2016 represents June 30, 2016 for DCOM, FFIC, SNBC, STL, VLY, SBNY, NYCB, AF, and ISBC. All other peers reflect March 31, 2016 Efficiency Ratio (%) Net Operating Expense / Avg. Assets (%) Low Cost Operator Relative to Peers 23

Focus on GrowthStrong Multifamily ExpertiseLow Cost OperatorShareholder ValueRisk Management Investor Highlights 24

CAGR: 11% Creating Shareholder Value 25

Focus on GrowthStrong Multifamily ExpertiseLow Cost OperatorShareholder ValueRisk Management Investor Highlights 26

Risk Management In 2008, Dime created the position of CHIEF RISK OFFICER, encompassing the fields of : Enterprise Risk, Credit Administration, Compliance, Audit, and Cybersecurity RiskCredit: Concentration in low-risk NYC multifamily marketInterest Rate: Nature of loans is short-term (5- and 7-year)Liquidity: Stable sources of available liquidity 27

Credit Risk Management Dime has a long, successful history of managing its highly concentrated “CRE” portfolio, mainly because multifamily loans are residential housing loansDime has historically been one of the leading lenders in the small (10 – 75 unit) rent-regulated multifamily housing market in New York CityNYC rent regulations provide a level of stability in the marketplace, especially to conservative lenders such as Dime (with loans reliant almost solely upon occupancy for debt service)Dime’s “Texas ratio” (a popular measure of a bank’s ability to absorb credit losses) was 2.0% as of the most recent quarter-end 28

Credit Metrics since the onset of the financial crisis 29 $ thousands 2010 2011 2012 2013 2014 2015 2016 Q2 Total Loans 3,468,479 3,458,416 3,506,368 3,699,519 4,119,240 4,696,776 5,209,117 Non-Performing Loans 20,168 28,973 8,888 12,549 6,198 1,611 4,329 NPLs to Total Loans 0.58% 0.84% 0.25% 0.34% 0.15% 0.03% 0.08% Net Charge Offs (Recoveries) 13,821 5,925 3,707 766 (212) (1,351) 45 NCOs to Total Loans 0.40% 0.17% 0.11% 0.02% -0.01% -0.03% 0.00% Allowance as a % of Loans 0.54% 0.58% 0.59% 0.54% 0.45% 0.39% 0.36% "Texas" ratio1 8.4% 8.9% 2.6% 3.7% 2.5% 1.6% 2.0%

Credit Metrics vs Peer Group Dime’s conservative underwriting has resulted in consistent out-performance of its peers in credit loss experience 30 Source: SNL Financial; peer group includes xxxxxx2016 represents June 30, 2016 for DCOM, FFIC, SNBC, STL, VLY, SBNY, NYCB, AF, and ISBC. All other peers reflect March 31, 2016; Charges offs as a % of average total loans Charge Off History (2009 – 2016 Q2)

$469 million of CD’s with maturities beyond 2017 Maturity in Year Ending Dec. 31st (1) As of June 30, 2016. Dollars in thousands. Borrowings exclude trust preferred corporate debt. Interest Rate Risk Management $419 million of borrowings with maturities beyond 2017 $ in Thousands 31 CD Maturities by Year1 Borrowing Maturities by Year1

Liquidity Risk Management ** Excludes holding company trust preferred debt.As of June 30; Dollars in thousands. More than sufficient borrowing capacity to meet liquidity demandsAmple access to deposit funding in either the local retail marketplace or via internetSufficient capital to support accelerated deposit growth/ borrowings should funding needs warrant 32