Attached files
| file | filename |
|---|---|
| EX-99.1 - CAROLINA FINANCIAL CORP | e00428_ex99-1.htm |
| 8-K - CAROLINA FINANCIAL CORP | e00428_caro-8k.htm |
Second Quarter 2016 Earnings Release Investor Presentation NASDAQ: CARO July 29, 2016
2 Disclaimer Certain statements in this presentation contain “forward - looking statements” within the meaning of the Private Securities Litigation Reform Act of 1995 , such as statements relating to future plans and expectations, and are thus prospective . Such forward - looking statements include but are not limited to statements with respect to plans, objectives, expectations, and intentions and other statements that are not historical facts, and other statements identified by words such as “believes,” “expects,” “anticipates,” “estimates,” “intends,” “plans,” “targets,” and “projects,” as well as similar expressions . Such statements are subject to risks, uncertainties, and other factors which could cause actual results to differ materially from future results expressed or implied by such forward - looking statements . Although we believe that the assumptions underlying the forward - looking statements are reasonable, any of the assumptions could prove to be inaccurate . Therefore, we can give no assurance that the results contemplated in the forward - looking statements will be realized . The inclusion of this forward - looking information should not be construed as a representation by Carolina Financial Corporation (“Carolina Financial” or the “Company”) or any person that such future events, plans, or expectations will occur or be achieved . In addition to factors previously disclosed in the reports filed by Carolina Financial with the Securities and Exchange Commission (the “SEC”), additional risks and uncertainties may include, but are not limited to : ( 1 ) competitive pressures among depository and other financial institutions may increase significantly and have an effect on pricing, spending, third - party relationships and revenues ; ( 2 ) the strength of the United States economy in general and the strength of the local economies in which we conduct operations may be different than expected resulting in, among other things, a deterioration in the credit quality or a reduced demand for credit, including the resultant effect on the Company’s loan portfolio and allowance for loan losses ; ( 3 ) the rate of delinquencies and amounts of charge - offs, the level of allowance for loan loss, the rates of loan growth, or adverse changes in asset quality in our loan portfolio, which may result in increased credit risk - related losses and expenses ; ( 4 ) the risk that the preliminary financial information reported herein and our current preliminary analysis will be different when our review is finalized ; ( 5 ) changes in the U . S . legal and regulatory framework including, but not limited to, the Dodd - Frank Act and regulations adopted thereunder ; ( 6 ) adverse conditions in the stock market, the public debt market and other capital markets (including changes in interest rate conditions) could have a negative impact on the Company ; ( 7 ) the businesses of the Company and Congaree Bancshares, Inc . (“Congaree”) may not be integrated successfully or such integration may take longer to accomplish than expected ; ( 8 ) the expected cost savings and any revenue synergies from the acquisition may not be fully realized within the expected timeframes ; and ( 9 ) disruption from the acquisition may make it more difficult to maintain relationships with clients, associates, or supplier . Additional factors that could cause our results to differ materially from those described in the forward - looking statements can be found in the reports (such as our Annual Report on Form 10 - K, Quarterly Reports on Form 10 - Q and Current Reports on Form 8 - K) filed with the SEC and available at the SEC’s Internet site (http : //www . sec . gov) . All subsequent written and oral forward - looking statements concerning the Company or any person acting on its behalf is expressly qualified in its entirety by the cautionary statements above . We do not undertake any obligation to update any forward - looking statement to reflect circumstances or events that occur after the date the forward - looking statements are made .

3 Second Quarter Highlights • On June 11, 2016, the Company completed its previously announced acquisition of Congaree Bancshares (“Congaree”). – Operational conversion completed in July 2016. • 2016Q2 net income of $2.8 million, or $0.23 per diluted share. (1) – Includes pretax merger expense of $2.8 million for second quarter of 2016. – Income tax expense was reduced by $ 399,000, or $0.03 per diluted share, in the second quarter of 2016 upon early adoption of the issued guidance on share - based payment transactions . • 2016Q2 operating earnings (Non - GAAP) increased 17.3% to $5.1 million, or $0.42 per diluted share compared to $4.4 million, or $0.45 per diluted share in 2015Q2. (1)(2) • Tangible book value (Non - GAAP) per share of $ 11.92 at 6/30/2016 compared to $11.66 at 12/31/2015. • Annualized organic growth in loans held for investment of 15.3% or $70.7 million since 12/31/2015, excluding $73.7 million in loans acquired from Congaree. • Growth in deposits of $143.9 million since 12/31/2015, excluding $87.8 million in deposits acquired from Congaree. • Core Deposits (Non - GAAP), excluding Congaree Deposits acquired, increased $104.7 million since 12/31/2015. (3) • Nonperforming Assets to total assets of 0.45% as of 6/30/2016 as compared to 0.47% as of 12/31/2015 . (1) The 6/30/2016 is preliminary and based on Company data available at the time of the presentation. (2) Operating earnings exclude extinguishment of debt, net gain or loss on sale of securities, fair value adjustments on interest rate swaps, and merger expenses, all net of income taxes at the applicable period effective rate. (3) Core Deposits are defined as checking, savings and money market accounts.

4 Congaree Acquisition Update • Congaree acquisition closed June 11, 2016 with operational conversion completed in July 2016. • Cost savings will be realized slightly faster than originally modeled. By the end of the 3 rd quarter we expect to realize the majority of cost saves. • Merger related expenses of $3.0 million recognized through June 30, 2016. • Included in the June 30, 2016 consolidated balance sheet were approximately $73.7 million in acquired loans, net of related purchase accounting adjustments, and $87.8 million in deposits assumed. (1) The 6/30/2016 information is preliminary and based on Company data available at the time of the presentation. (2) Loans are presented net of purchase accounting adjustments. 6/30/2016 Loan Composition ($M M ) (1)(2) 6/30/2016 Deposit Composition ($MM) ( 1 )

5 Community Banking Segment Results

6 Strong, Improving Community Banking Segment Results Bank Segment Earnings (1) • Banking segment earnings 2016Q2 net income of $2.2 million, or $0.18 per diluted share, versus $2.8 million for 2015Q2, or $0.29 per diluted share. • Included in Banking segment net income was approximately $2.7 million and $186,000 in pretax merger related expenses for 2016Q2 and 2016Q1, respectively. • Operating Bank segment earnings (Non - GAAP) 2016Q2 of $ 4.4 million, or $0.36 per diluted share, versus $3.3 million for 2015Q2, or $0.34 per diluted share. ( 2) • Operating Bank Return on Average Assets (Non - GAAP) increased to 1.18% for 2016Q2 from 1.01% for 2015Q2. ( 2) 2011Y 2012Y ($18.7) (1) Community banking segment earnings as reported in public filings (includes intersegment revenues and expenses and excludes ho ldi ng company expenses). The 6/30/2016 information is preliminary and based on Company data available at the time of the presentation. (2) Operating earnings exclude extinguishment of debt, net gain or loss on sale of securities, fair value adjustments on interest ra te swaps, and merger expenses, all net of effective income tax rate for the applicable business segment. Operating bank EPS segment equals operating bank segment earni ngs divided by weighted average diluted shares.

7 Net Interest Margin (1) The 6/302016 information is preliminary and based on Company data available at the time of the presentation. (2) Net interest margin – tax - equivalent. • Net interest margin expanded 11bps for the second quarter of 2016 due to the following: • Favorable prepayment s peeds on securities as compared to first quarter of 2016. • Collection of prepayment penalty pretax of $136,000 during the second quarter. • Improvement due to higher yielding loans acquired from the Congaree merger. • Cost of funds held flat due to significant growth in core deposits and lower cost Congaree deposits acquired. 4.93% 4.67% 4.73% 4.67% 4.78% 3.80% 3.66% 3.59% 3.53% 3.64% 0.53% 0.54% 0.62% 0.66% 0.66% 0.00% 1.00% 2.00% 3.00% 4.00% 5.00% 6.00% 2015Q2 2015Q3 2015Q4 2016Q1 2016Q2 Yield on Loans Net Interest Margin (2) Cost of Funds ( 1 ) ( 1 )

8 Consistent Core Fee Income Stream • The Bank segment’s core noninterest income is primarily derived from deposit service charges, retail mortgage income and BOLI earnings. Banking Segment Core Noninterest Income ($MM) (1) The 6/30/2016 information is preliminary and based on Company data available at the time of the presentation. (1)

9 Bank Segment Operating Efficiencies • Operating bank s egment n oninterest expenses as a percentage of average consolidated assets of 2.41% in 2016Q2 compared to 2.40% in 2015Q2. • Operating bank segment efficiency ratio improved to 62.0% in 2016Q2 from 65.2% in 2015Q2. Operating Banking Segment Noninterest Expenses/Avg. Assets (%) (1)(2)(3) (1) Bank segment figures include intersegment revenues and expenses and excludes holding company expenses. (2) The 6/30/2016 information is preliminary and based on Company data available at the time of the presentation. (3) Operating Noninterest expense excludes merger related expenses for the applicable segments presented. ( 2 ) Operating Banking Segment Efficiency Ratio (1)(2)(3)

10 Strong Balance Sheet Growth • Organic growth of loans held for investment on an annualized basis by 15.3% since 12/31/2015, excluding Congaree loans acquired. • Core Deposits, excluding Congaree deposits assumed, increased $104.7 million since December 31, 2015. Total Deposits ($MM) ( 1) Total Gross Loans ($MM) (1) Total Assets($MM) ( 1) (1) (1) (1) Includes assets acquired and liabilities assumed from Congaree acquisition, net of fair value adjustments. (2) The 6/30/2016 information is preliminary and based on Company data available at the time of the presentation. (1) (1) (2) (2) (2)

11 Diversified Loan Mix and Solid Asset Quality NPAs/ Assets (%) (1) • We have a diversified loan mix, with a focus on lower risk assets. • Our asset quality has remained consistently low, with NPA’s / assets of 0.45% at 6/30/2016. • The Bank added $1.4 million in real estate acquired through foreclosure, net as a result of the Congaree merger. • We have experienced net recoveries for fiscal years 2014 and 2015 and continue to experience net recoveries through 2016Q2. (1) Excludes performing troubled debt restructurings (TDRs ). (2) The 6/30/2016 information is preliminary and based on Company data available at the time of the presentation. (3) Includes approximately $73.7 million in Congaree loans acquired, net of purchase accounting adjustments. NCOs / Average Loans (%) Loan Composition (6/30/2016) (2)(3) 2016Q2 Yield on Loans: 4.78% ( 2 ) 2015Q3 ( 2 )

12 Improving Deposit Mix Deposit Composition (6/30/16) (1)(2) Checking Accounts (3) • Focus on increasing checking accounts as evidenced by an annualized checking account growth rate of 10.6% since 12/31/2015, excluding accounts acquired through Congaree acquisition. 2016 Q1 Cost of Funds: 0.66% (1) The 6/30/2016 information is preliminary and based on Company data available at the time of the presentation. (2) Includes deposits assumed in Congaree acquisition. (3) Includes approximately 2,575 checking accounts acquired through Congaree acquisition. (1)
13 Attractive Wholesale Mortgage Platform

14 Wholesale Mortgage Platform Strong, Scalable Mortgage Platform (2 ) • Wholesale Mortgage segment earnings of $919,000, or $0.08 per diluted share, for 2016Q2 compared to $1.3 million, or $0.14 per diluted share for 2015Q2. (1) • Despite a challenging operating environment and seasonal influences affecting originations, Crescent Mortgage Company (“CMC”) remains profitable. • Decrease in originations has resulted in a decrease in wholesale mortgage segment earnings reported 2016Q2 from 2015Q2. • New regulatory rules related to TILA - RESPA Integrated Disclosures (“TRID”) have impacted CMC. Mortgage Banking Earnings Contribution (1)(2) (1) Wholesale Mortgage segment earnings include intersegment revenues and expenses and excludes holding company expenses. Wholesale mortgage EPS equals segment earnings divided by weighted average diluted shares. (2) The 6/30/2016 information is preliminary and based on Company data available at the time of the presentation. ( 3 )

15 Strategic Opportunity
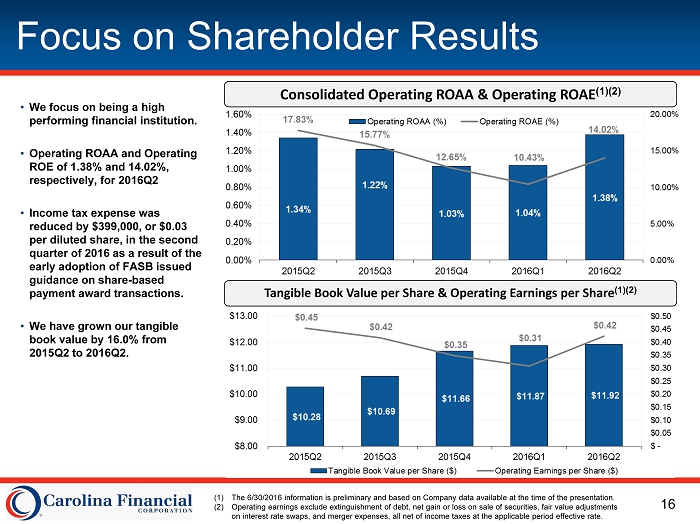
16 Focus on Shareholder Results • We focus on being a high performing financial institution. • Operating ROAA and Operating ROE of 1.38% and 14.02%, respectively, for 2016Q2 • Income tax expense was reduced by $399,000, or $0.03 per diluted share, in the second quarter of 2016 as a result of the early adoption of FASB issued guidance on share - based payment award transactions. • We have grown our tangible book value by 16.0% from 2015Q2 to 2016Q2. Consolidated Operating ROAA & Operating ROAE (1 )(2) Tangible Book Value per Share & Operating Earnings per Share (1)(2) (1) The 6/30/2016 information is preliminary and based on Company data available at the time of the presentation. (2) Operating earnings exclude extinguishment of debt, net gain or loss on sale of securities, fair value adjustments on interest rate swaps, and merger expenses, all net of income taxes at the applicable period effective rate.
17 Investment Considerations x Focus on increasing shareholder value over both the short and long term. x Scarcity value – large foothold in the high growth Charleston and Myrtle Beach markets with growing presence in Greenville, SC, Columbia, SC and Wilmington, NC Markets. x Strong markets to support continued loan growth x Experienced, accomplished management team driving results x Profitability increasing in community banking segment x Track - record of improving deposit mix x Demonstrated acquisition experience, success and focus x Scalable mortgage platform provides an opportunity to generate earnings in changing markets