Attached files
| file | filename |
|---|---|
| EX-99.1 - EX-99.1 - Centennial Resource Development, Inc. | a16-15339_1ex99d1.htm |
| 8-K - 8-K - Centennial Resource Development, Inc. | a16-15339_18k.htm |
Exhibit 99.2
Core Oil Southern Delaware Basin Investor Presentation July 2016
Important Information This Investor Presentation (“Investor Presentation”) is for informational purposes only and does not constitute an offer to sell, a solicitation of an offer to buy, or a recommendation to purchase any equity, debt or other financial instruments of Silver Run Acquisition Corporation (“Silver Run”) or Centennial Resource Production, LLC (“Centennial” or “CRP”) or any of Silver Run’s or Centennial’s affiliates securities (as such term is defined under U.S. federal securities laws). This Investor Presentation has been prepared to assist parties in making their own evaluation with respect to the proposed business combination, as contemplated in the Contribution Agreement (collectively, the “Business Combination”), of Silver Run and Centennial and for no other purpose. The information contained herein does not purport to be all-inclusive. The data contained herein is derived from various internal and external sources. No representation is made as to the reasonableness of the assumptions made within or the accuracy or completeness of any projections or modeling or any other information contained herein. Any data on past performance or modeling contained herein is not an indication as to future performance. Silver Run and Centennial assume no obligation to update the information in this Investor Presentation. Use of Projections This Investor Presentation contains financial forecasts for Centennial, including with respect to Centennial’s drilling and completion (“D&C”) Capex, daily production (Boe/d), Adjusted EBITDAX, total liquidity (borrowing base availability plus cash on hand), debt to Adjusted EBITDAX ratio and production for Centennial’s fiscal years 2016, 2017 and 2018. Neither Silver Run’s nor Centennial’s independent auditors or Centennial’s independent petroleum engineering firm have audited, reviewed, compiled, or performed any procedures with respect to the projections for the purpose of their inclusion in this Investor Presentation, and accordingly, none of them expressed an opinion or provided any other form of assurance with respect thereto for the purpose of this Investor Presentation. These projections are for illustrative purposes only and should not be relied upon as being necessarily indicative of future results. In this Investor Presentation, certain of the above-mentioned projected information has been repeated (in each case, with an indication that the information is subject to the qualifications presented herein), for purposes of providing comparisons with historical data. The assumptions and estimates underlying the prospective financial information are inherently uncertain and are subject to a wide variety of significant business, economic and competitive risks and uncertainties that could cause actual results to differ materially from those contained in the prospective financial information. Even if our assumptions and estimates are correct, projections are inherently uncertain due to a number of factors outside our control. Accordingly, there can be no assurance that the prospective results are indicative of the future performance of Silver Run or Centennial or the combined company after completion of any business combination or that actual results will not differ materially from those presented in the prospective financial information. Inclusion of the prospective financial information in this Investor Presentation should not be regarded as a representation by any person that the results contained in the prospective financial information will be achieved. Use of Non-GAAP Financial Measures This Investor Presentation includes non-GAAP financial measures, including Adjusted EBITDAX. Please refer to the Appendix for a reconciliation of Adjusted EBITDAX to net (loss) income, the most comparable GAAP measure. Centennial believes Adjusted EBITDAX is useful because it allows the company to more effectively evaluate its operating performance and compare the results of its operations from period to period and against its peers without regard to financing methods or capital structure. Centennial excludes the items listed in the Appendix from net (loss) income in arriving at Adjusted EBITDAX because these amounts can vary substantially from company to company within its industry depending upon accounting methods and book values of assets, capital structures and the method by which the assets were acquired. Adjusted EBITDAX should not be considered as an alternative to, or more meaningful than, net income as determined in accordance with GAAP or as an indicator of Centennial’s operating performance or liquidity. Certain items excluded from Adjusted EBITDAX are significant components in understanding and assessing a company’s financial performance, such as a company’s cost of capital and tax structure, as well as the historic costs of depreciable assets, none of which are components of Adjusted EBITDAX. Centennial’s presentation of Adjusted EBITDAX should not be construed as an inference that its results will be unaffected by unusual or non-recurring items. Centennial’s computations of Adjusted EBITDAX may not be comparable to other similarly titled measures of other companies. Industry and Market Data The market data and certain other statistical information used throughout this Investor Presentation are based on independent industry publications, government publications and other published independent sources. Although Silver Run and Centennial believe these third-party sources are reliable as of their respective dates, neither Silver Run nor Centennial has independently verified the accuracy or completeness of this information. Some data is also based on Centennial’s good faith estimates. The industry in which Centennial operates is subject to a high degree of uncertainty and risk due to a variety of factors. These and other factors could cause results to differ materially from those expressed in these publications. Forward Looking Statements This Investor Presentation includes certain statements that may constitute “forward-looking statements” for purposes of U.S. federal securities laws. Forward-looking statements include, but are not limited to, statements that refer to projections, forecasts or other characterizations of future events or circumstances, including any underlying assumptions. The words “anticipate,” “believe,” “continue,” “could,” “estimate,” “expect,” “intends,” “may,” “might,” “plan,” “possible,” “potential,” “predict,” “project,” “should,” “would” and similar expressions may identify forward-looking statements, but the absence of these words does not mean that a statement is not forward-looking. Forward-looking statements may include, for example, statements about: Silver Run’s ability to consummate the Business Combination; the benefits of the Business Combination; the future financial performance of Silver Run following the Business Combination; changes in Centennial’s reserves and future operating results; and expansion plans and opportunities. These forward-looking statements are based on information available as of the date of this Investor Presentation, and current expectations, forecasts and assumptions, and involve a number of judgments, risks and uncertainties. Accordingly, forward-looking statements should not be relied upon as representing Silver Run’s views as of any subsequent date, and Silver Run and Centennial do not undertake any obligation to update forward-looking statements to reflect events or circumstances after the date they were made, whether as a result of new information, future events or otherwise, except as may be required under applicable securities laws. You should not place undue reliance on these forward-looking statements. As a result of a number of known and unknown risks and uncertainties, Silver Run’s actual results or performance may be materially different from those expressed or implied by these forward-looking statements. Some factors that could cause actual results to differ include: (i) the occurrence of any event, change or other circumstances that could delay the business combination or give rise to the termination of the Contribution Agreement; (ii) the outcome of any legal proceedings that may be instituted against Silver Run following announcement of the proposed Business Combination and transactions contemplated thereby; (iii) the inability to complete the Business Combination due to the failure to obtain approval of the stockholders of Silver Run, or other conditions to closing in the Contribution Agreement; (iv) the risk that the proposed Business Combination disrupts current plans and operations of Silver Run or Centennial as a result of the announcement and consummation of the transactions described herein; (v) Silver Run’s ability to recognize the anticipated benefits of the Business Combination, which may be affected by, among other things, competition and the ability of Silver Run to grow and manage growth profitably following the Business Combination; (vi) costs related to the Business Combination; (vii) changes in applicable laws or regulations; (viii) the possibility that Silver Run or Centennial may be adversely affected by other economic, business, and/or competitive factors; and (ix) other risks and uncertainties indicated in the preliminary proxy statement, including those under the section entitled “Risk Factors.” Additional Information In connection with the proposed Business Combination, Silver Run intends to file a proxy statement with the SEC. The definitive proxy statement and other relevant documents will be sent or given to the stockholders of Silver Run and will contain important information about the proposed Business Combination and related matters. Silver Run stockholders and other interested persons are advised to read, when available, the proxy statement in connection with Silver Run’s solicitation of proxies for the meeting of stockholders to be held to approve the proposed business combination because the proxy statement will contain important information about the proposed business combination. When available, the definitive proxy statement will be mailed to Silver Run stockholders as of a record date to be established for voting on the proposed transaction. Stockholders will also be able to obtain copies of the proxy statement, without charge, once available, at the SEC’s website at www.sec.gov. Participants in the Solicitation Silver Run and its directors and officers may be deemed participants in the solicitation of proxies of Silver Run stockholders in connection with the proposed Business Combination. Silver Run stockholders and other interested persons may obtain, without charge, more detailed information regarding the directors and officers of Silver Run in Silver Run’s registration statement on Form S-1, as amended as of February 17, 2016. Additional information will be available in the definitive proxy statement when it becomes available. 2
Presenters Mark Chief Papa Executive Officer 3
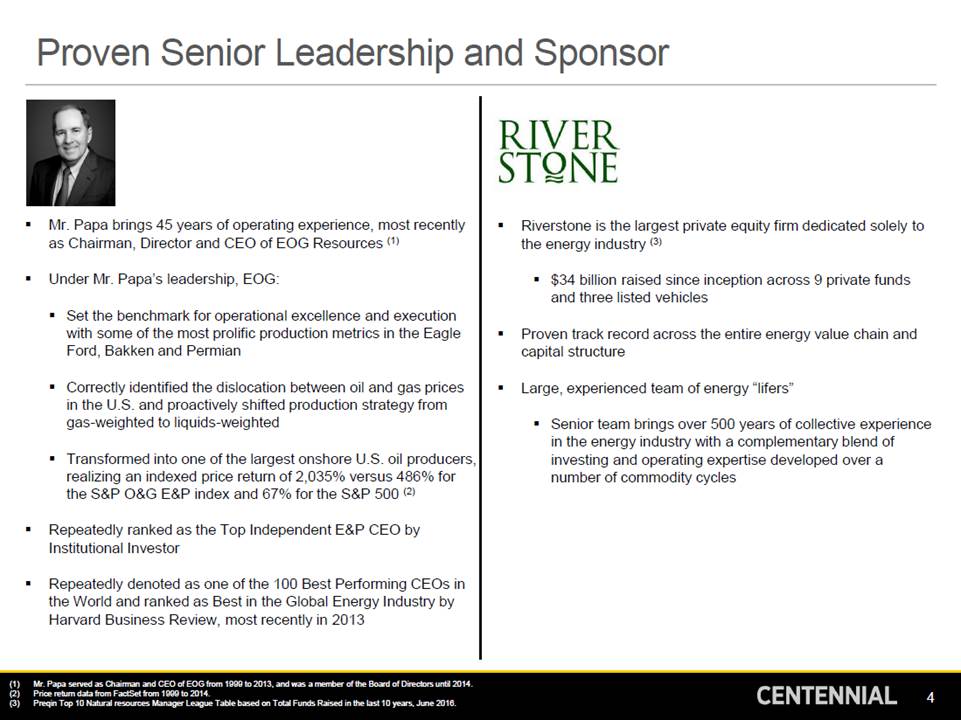
Proven Senior Leadership and Sponsor Mr. Papa brings 45 years of operating experience, most recently as Chairman, Director and CEO of EOG Resources (1) Riverstone is the largest private equity firm dedicated solely to the energy industry (3) Under Mr. Papa’s leadership, EOG: $34 billion raised since inception across 9 private funds and three listed vehicles Set the benchmark for operational excellence and execution with some of the most prolific production metrics in the Eagle Ford, Bakken and Permian Proven track record across the entire energy value chain and capital structure Correctly identified the dislocation between oil and gas prices in the U.S. and proactively shifted production strategy from gas-weighted to liquids-weighted Large, experienced team of energy “lifers” Senior team brings over 500 years of collective experience in the energy industry with a complementary blend of investing and operating expertise developed over a number of commodity cycles Transformed into one of the largest onshore U.S. oil producers, realizing an indexed price return of 2,035% versus 486% for the S&P O&G E&P index and 67% for the S&P 500 (2) Repeatedly ranked as the Top Independent E&P CEO by Institutional Investor Repeatedly denoted as one of the 100 Best Performing CEOs in the World and ranked as Best in the Global Energy Industry by Harvard Business Review, most recently in 2013 (1) (2) (3) Mr. Papa served as Chairman and CEO of EOG from 1999 to 2013, and was a member of the Board of Directors until 2014. Price return data from FactSet from 1999 to 2014. Preqin Top 10 Natural resources Manager League Table based on Total Funds Raised in the last 10 years, June 2016. 4
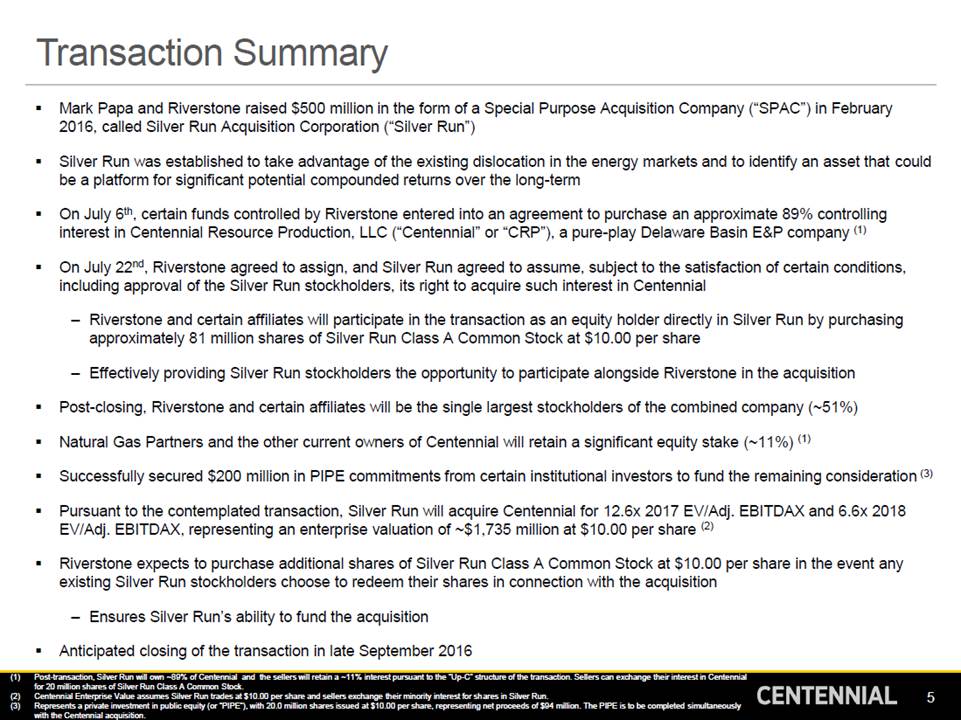
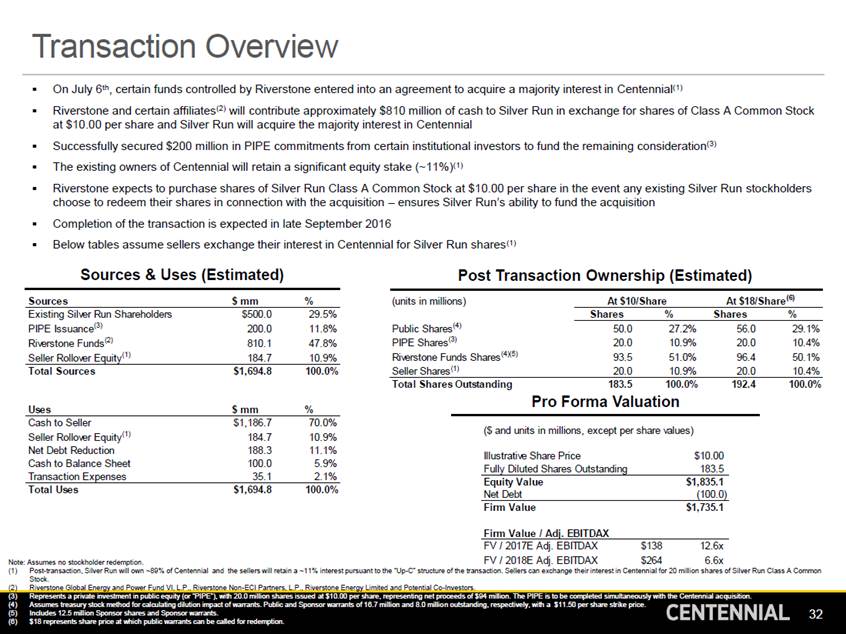
Transaction Summary Mark Papa and Riverstone raised $500 million in the form of a Special Purpose Acquisition Company (“SPAC”) in February 2016, called Silver Run Acquisition Corporation (“Silver Run”) Silver Run was established to take advantage of the existing dislocation in the energy markets and to identify an asset that could be a platform for significant potential compounded returns over the long-term On July 6th, certain funds controlled by Riverstone entered into an agreement to purchase an approximate 89% controlling interest in Centennial Resource Production, LLC (“Centennial” or “CRP”), a pure-play Delaware Basin E&P company (1) On July 22nd, Riverstone agreed to assign, and Silver Run agreed to assume, subject to the satisfaction of certain conditions, including approval of the Silver Run stockholders, its right to acquire such interest in Centennial – Riverstone and certain affiliates will participate in the transaction as an equity holder directly in Silver Run by purchasing approximately 81 million shares of Silver Run Class A Common Stock at $10.00 per share – Effectively providing Silver Run stockholders the opportunity to participate alongside Riverstone in the acquisition Post-closing, Riverstone and certain affiliates will be the single largest stockholders of the combined company (~51%) Natural Gas Partners and the other current owners of Centennial will retain a significant equity stake (~11%) (1) Successfully secured $200 million in PIPE commitments from certain institutional investors to fund the remaining consideration (3) Pursuant to the contemplated transaction, Silver Run will acquire Centennial for 12.6x 2017 EV/Adj. EBITDAX and 6.6x 2018 EV/Adj. EBITDAX, representing an enterprise valuation of ~$1,735 million at $10.00 per share (2) Riverstone expects to purchase additional shares of Silver Run Class A Common Stock at $10.00 per share in the event any existing Silver Run stockholders choose to redeem their shares in connection with the acquisition – Ensures Silver Run’s ability to fund the acquisition Anticipated closing of the transaction in late September 2016 (1) Post-transaction, Silver Run will own ~89% of Centennial and the sellers will retain a ~11% interest pursuant to the “Up-C” structure of the transaction. Sellers can exchange their interest in Centennial for 20 million shares of Silver Run Class A Common Stock. Centennial Enterprise Value assumes Silver Run trades at $10.00 per share and sellers exchange their minority interest for sh ares in Silver Run. Represents a private investment in public equity (or “PIPE”), with 20.0 million shares issued at $10.00 per share, representing net proceeds of $94 million. The PIPE is to be completed simultaneously with the Centennial acquisition. 5 (2) (3)
Agenda Delivering on Investment Criteria Centennial Highlights Path to Value Creation Centennial Overview Financial Overview Transaction Overview Appendix 6
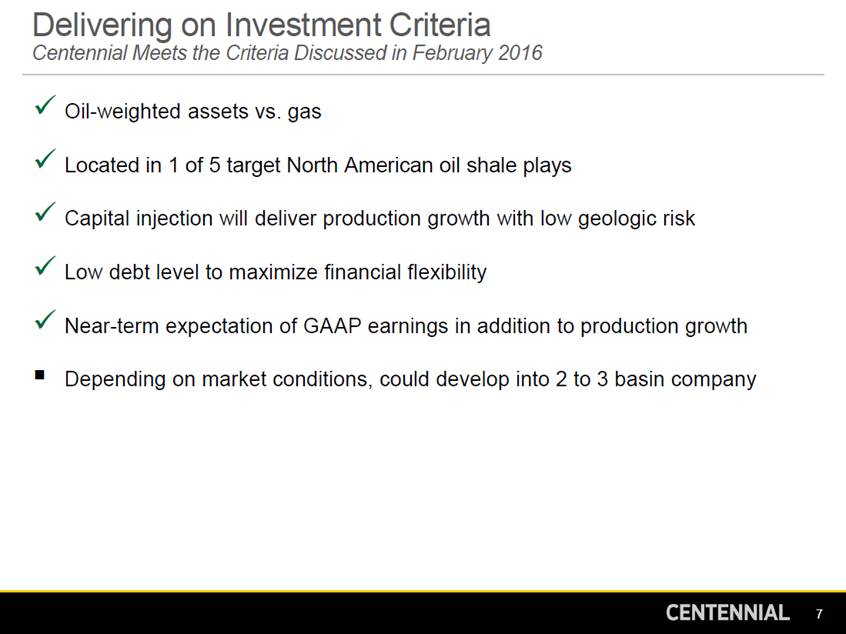
Delivering on Investment Criteria Centennial Meets the Criteria Discussed in February 2016 Oil-weighted assets vs. gas Located in 1 of 5 target North American oil shale plays Capital injection will deliver production growth with low geologic risk Low debt level to maximize financial flexibility Near-term expectation of GAAP earnings in addition to production growth Depending on market conditions, could develop into 2 to 3 basin company 7
Centennial Highlights Unique Delaware Pure-Play Opportunity ~3,000 ft oil column in the deep, high pressured oily core of the Southern Delaware Basin ~42,500 net acres ~32.5 MMBoe 1P reserves (1) Oil-Rich Delaware Core Producing ~7,200 Boe/d from 62 operated Hz wells in 5 different shale zones (2) ~12 years of operated inventory (3) Upside in Avalon and 2nd and 3rd Bone Spring shales; nearby offset operators successfully producing these zones Extensive Low-Risk Horizontal Inventory Steadily improving well performance; ~45% improvement in first year oil cum. since 2014 Among the best performance per lateral ft. in Southern Delaware (~250 Boe/d/1,000 ft) (4) Recent wells ~$5.5MM D&C (includes facilities); ~50% reduction in drilling days since 2014 High Performance, Low Cost Leader Wells more productive per 1,000 ft lateral (4) Stacked pay consisting of 5 currently producing shale zones is on par with upside for 7 more Relative early stage of development in the Delaware Basin provides potential for superior production and cost improvements over time Compares Favorably to Midland Peers No debt and $100 million of cash on the balance sheet pro forma for the transaction with a development plan fully funded into 2018 Drilled effectively within cash flow during past 18+ months, maintained flat production Active hedging program Disciplined Financial Management Led by Mr. Papa who brings 45 years of operating experience and proven track record, most recently as Chairman, Director and CEO of EOG Resources (4) Identified short-list of candidates to augment current bench talent Assembling Best-In-Class Team (1) (2) (3) (4) (5) Reserves per NSAI as of 12/31/15. As of 3/31/2016 from the Third Bone Spring Sand, Upper Wolfcamp A, Lower Wolfcamp A, Wolfcamp B, Wolfcamp C. Years of inventory based on Centennial’s operated inventory and assumes ramp up to 5 rigs. See slides 21 and 37. Mr. Papa served as Chairman and CEO of EOG from 1999 to 2013, and was a member of the Board of Directors until 2014. 8
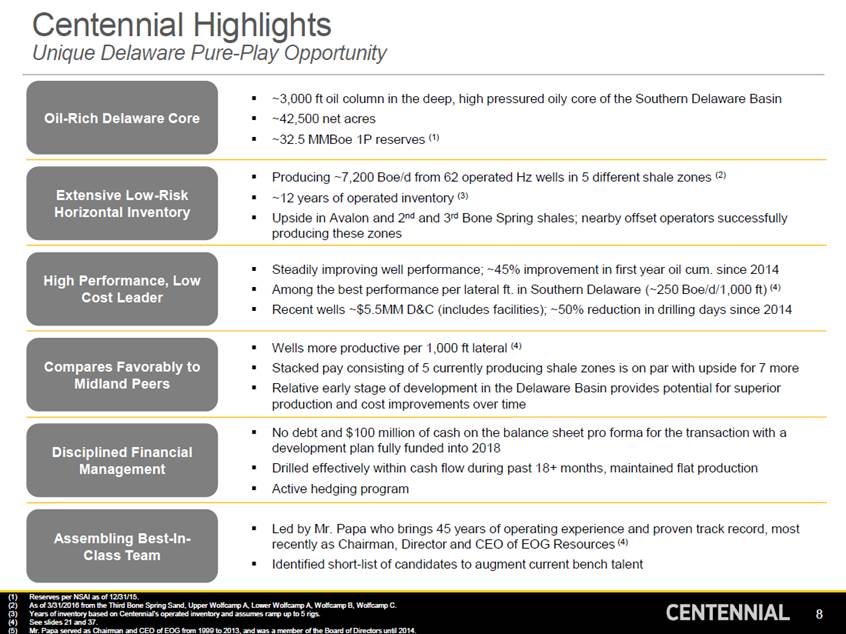
Path to Value Creation Seek to Replicate EOG Operating and Execution Excellence and Expand Position Begin Manufacturing Mode Deliver Operational Efficiencies Aggressively deploy drilling rigs to bring future value forward Drilling Plan: October 2016 + 2 Rigs (3 total); April 2017 + 1 Rig (4); January 2018 + 1 Rig (5) Centennial has the capability and experience to deliver current rig plan and beyond Improve footage drilled per day at lower cost per foot Expand from 2-well pads to 4-well pads Sequenced development within DSUs Batch drilling / zipper fracs Simultaneous operations Shared facilities Leadership and Team Positioned to Deliver Growth Strategy Expand Position Enhance Completions Downspacing to 660 ft/well (~8 wells/zone) adds ~470 Wolfcamp locations Expand core by closely monitoring less delineated areas and zones and drilling occasional step-outs when justified Leverage public currency to consolidate basin at accretive valuations Evaluate new completion parameters Utilize tracers (routinely) and microseismic (sparingly) Trend towards higher density: – Additional slickwater and 100 mesh proppant – Shorter stage lengths and tighter cluster spacing Tailor completion designs to geologic setting 9
Centennial Overview 10
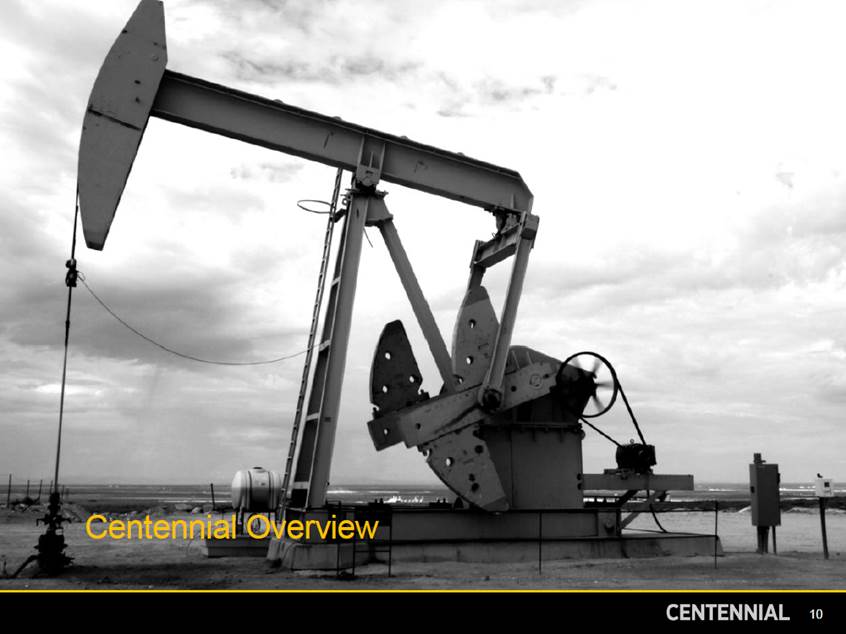
Core Delaware Basin Pure-Play Large, contiguous core position in Southern Delaware Basin Acreage in the Oily Southern Delaware Core – – – ~42,500 net acres; ~80% operated ~84% WI in operated acreage ~79% HBP in operated Reeves and Ward counties Net Acres by County: 6/30/16 Reeves Ward Pecos 35,800 1,900 4,800 Low-risk, oil-rich base with rapid growth potential – Net production: ~7,200 Boe/d (Q1 2016) – Proved reserves: 32.5 MMBoe; 71% oil, 83% liquids (1) Delineation across five Hz zones – – – Exclusively developed with Hz wells since 2013 62 operated Hz wells plus 12 non-op Hz wells 27 operated Vt wells provide valuable technical information Large inventory of identified drilling locations – – – 1,357 Hz drilling locations (2) 674 Operated Hz locations, including 325 extended laterals Upside in Avalon and 2nd and 3rd Bone Spring shales Historical Production (Boe/d) 7,317 7,212 Centennial Acreage Centennial Wells 2014 2015 Q1 2016 (1)Reserves per Netherland, Sewell & Associates, Inc. (“NSAI”) as of 12/31/15. Other data as of 6/30/16, unless otherwise noted. (2)No locations included from Pecos County. 11 5,521 Total 42,500
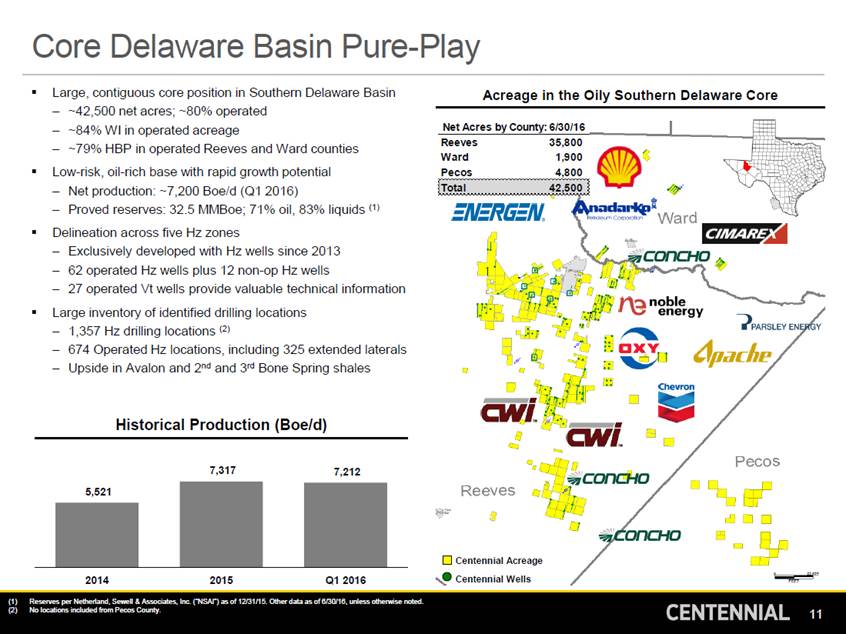
Activity Ramping Up in Delaware Basin US Total Hz Rig Count – Top 5 Oil Basins 69 64 Midland Delaware Eagle Ford Cana Woodford Williston US Total Hz Rig Count – Top 15 Oil Counties 28 11 10 10 10 10 Midland Delaware Cana / Woodford Bakken Niobrara Eagle Ford Source: Rig count data per Baker Hughes as of 7/01/16. 12 Midland Reeves Loving Weld Blaine Mckenzie Lea Upton Kingfisher Dunn Eddy Karnes Grady Howard Martin 24 131312 88887 31 2625

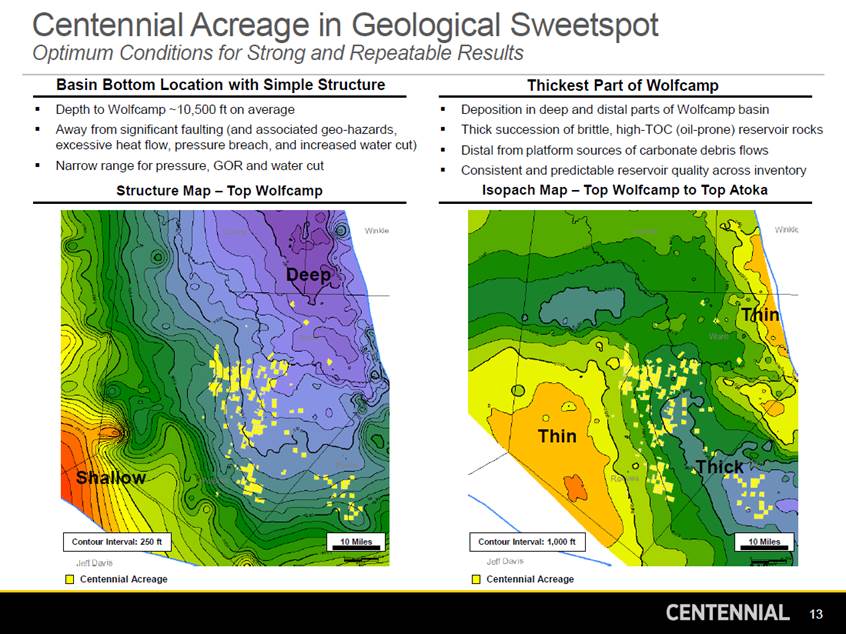
Centennial Acreage in Geological Sweetspot Optimum Conditions for Strong and Repeatable Results Basin Bottom Location with Simple Structure Thickest Part of Wolfcamp Depth to Wolfcamp ~10,500 ft on average Away from significant faulting (and associated geo-hazards, excessive heat flow, pressure breach, and increased water cut) Narrow range for pressure, GOR and water cut Deposition in deep and distal parts of Wolfcamp basin Thick succession of brittle, high-TOC (oil-prone) reservoir rocks Distal from platform sources of carbonate debris flows Consistent and predictable reservoir quality across inventory Structure Map – Top Wolfcamp Isopach Map – Top Wolfcamp to Top Atoka Deep Thin Thin Thick Shallow Centennial Acreage Centennial Acreage 13 10 Miles Contour Interval: 1,000 ft 10 Miles Contour Interval: 250 ft
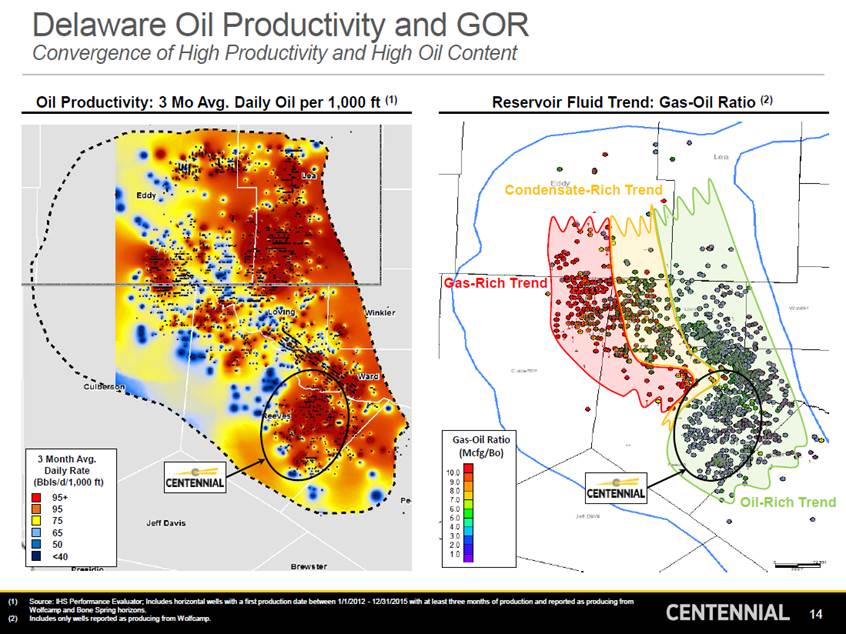
Delaware Oil Productivity and GOR Convergence of High Productivity and High Oil Content Oil Productivity: 3 Mo Avg. Daily Oil per 1,000 ft (1) Reservoir Fluid Trend: Gas-Oil Ratio (2) Condensate-Rich Trend Gas-Rich Trend Oil-Rich Trend (1)Source: IHS Performance Evaluator; Includes horizontal wells with a first production date between 1/1/2012 - 12/31/2015 with at least three months of production and reported as producing from Wolfcamp and Bone Spring horizons. (2)Includes only wells reported as producing from Wolfcamp. 14 3 Month Avg. Daily Rate (Bbls/d/1,000 ft) 95+ 95 75 65 50 <40 Gas-Oil Ratio (Mcfg/Bo)
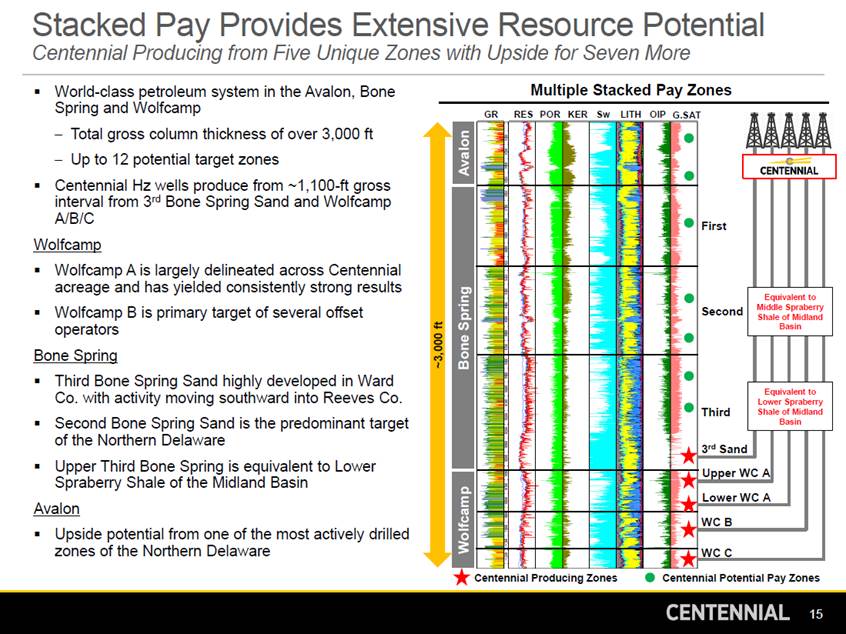
Stacked Pay Provides Extensive Resource Potential Centennial Producing from Five Unique Zones with Upside for Seven More Multiple Stacked Pay Zones World-class petroleum system in the Avalon, Bone Spring and Wolfcamp – Total gross column thickness of over 3,000 ft – Up to 12 potential target zones Centennial Hz wells produce from ~1,100-ft gross interval from 3rd Bone Spring Sand and Wolfcamp A/B/C GR RES POR KER Sw LITH OIP G.SAT Wolfcamp Wolfcamp A is largely delineated across Centennial acreage and has yielded consistently strong results Wolfcamp B is primary target of several offset operators quivalent berry Bone Spring Third Bone Spring Sand highly developed in Ward Co. with activity moving southward into Reeves Co. Second Bone Spring Sand is the predominant target of the Northern Delaware Upper Third Bone Spring is equivalent to Lower Spraberry Shale of the Midland Basin quivalent wer Spraberry Avalon Upside potential from one of the most actively drilled zones of the Northern Delaware Centennial Producing Zones Centennial Potential Pay Zones 15 ~3,000 ft First Second E Mid Sha dle S le of Ba pra Mid sin to land Third E Lo Sha le of Ba Mid sin to land 3rd Sand Upper WC A Lower WC A WC B WC C Avalon Bone Spring Wolfcamp
Stratigraphic Cross Section Consistent and Delineated Across Acreage Position s BS Shale Arroyo Toyah N 3rd BS Sand Centennial PDP 0 0 e Operated Hz 0 Non-Op Hz Ward • Jrd BS Sd Well •Upr WC A Well LwrWCAWell e wcBWell e wcCWell CENTENNIAL 16

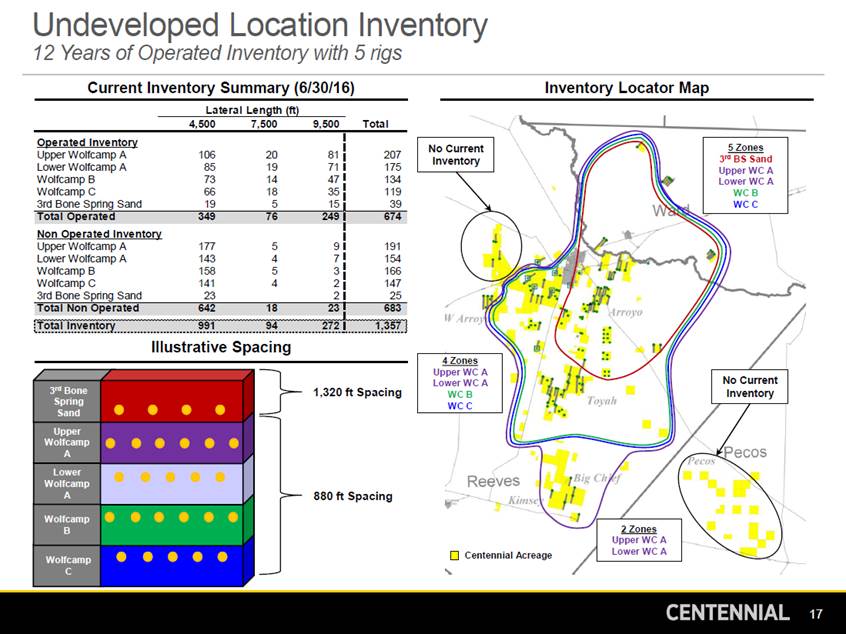
Undeveloped Location Inventory 12 Years of Operated Inventory with 5 rigs Current Inventory Summary (6/30/16) Inventory Locator Map Lateral Length (ft) 4,500 7,500 9,500 Total 175 Illustrative Spacing 1,320 ft Spacing Sand 880 ft Spacing Centennial Acreage 17 2 Zones Upper WC A Lower WC A 3rd Bone Spring Upper Wolfcamp A Lower Wolfcamp A Wolfcamp B Wolfcamp C No Current Inventory 4 Zones Upper WC A Lower WC A WC B WC C Ope ra te d Inve ntory Upper Wolfcamp A 106 20 81 Lower Wolfcamp A 85 19 71 Wolfcamp B 73 14 47 Wolfcamp C 66 18 35 3rd Bone Spring Sand 19 5 15 207 134 119 39 Total Operated 349 76 249 674 Non Ope ra te d Inve ntory Upper Wolfcamp A 177 5 9 Lower Wolfcamp A 143 4 7 Wolfcamp B 158 5 3 Wolfcamp C 141 4 2 3rd Bone Spring Sand 23 2 191 154 166 147 25 Total Non Operated 642 18 23 683 Total Inventory 991 94 272 1,357 5 Zones 3rd BS Sand Upper WC A Lower WC A WC B WC C No Current Inventory
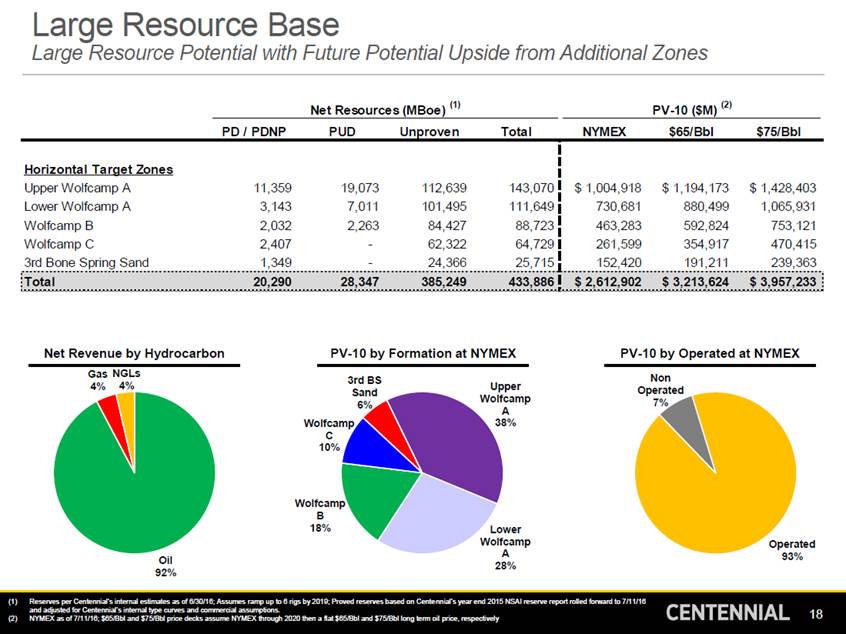
Large Resource Base Large Resource Potential with Future Potential Upside from Additional Zones Net Resources (MBoe) (1) PV-10 ($M) (2) PD / PDNP PUD Unproven Total NYMEX $65/Bbl $75/Bbl Net Revenue by Hydrocarbon PV-10 by Formation at NYMEX PV-10 by Operated at NYMEX Gas NGLs Non Operated 7% 3rd BS Sand 6% Wolfcamp C 10% 4% 4% Upper Wolfcamp A 38% Wolfcamp B 18% Lower Wolfcamp A 28% Operated 93% Oil 92% (1)Reserves per Centennial’s internal estimates as of 6/30/16; Assumes ramp up to 6 rigs by 2019; Proved reserves based on Cente nnial’s year end 2015 NSAI reserve report rolled forward to 7/11/16 and adjusted for Centennial’s internal type curves and commercial assumptions. (2)NYMEX as of 7/11/16; $65/Bbl and $75/Bbl price decks assume NYMEX through 2020 then a flat $65/Bbl and $75/Bbl long term oil price, respectively 18 Horizontal Ta rge t Zone s Upper Wolfcamp A 11,359 19,073 112,639 143,070 Lower Wolfcamp A 3,143 7,011 101,495 111,649 Wolfcamp B 2,032 2,263 84,427 88,723 Wolfcamp C 2,407 - 62,322 64,729 3rd Bone Spring Sand 1,349 - 24,366 25,715 $ 1,004,918 $ 1,194,173 $ 1,428,403 730,681 880,499 1,065,931 463,283 592,824 753,121 261,599 354,917 470,415 152,420 191,211 239,363 Total 20,290 28,347 385,249 433,886 $ 2,612,902 $ 3,213,624 $ 3,957,233
Net Operated Production Maintained Flat Production for 18+ Months Spending Effectively Within Cash Flow 100,000 12 Stack-and-Staggered 10,000 8 1,000 4 100 0 Upr WC A Completion Lwr WC A Completion WC B Completion WC C Completion Daily Production Last 18 Mo Avg Downtime Note: Production data excludes non-op production, currently at ~400 Boe/d. 19 Net Daily Operated 3 Stream Production (Boe/d) Downtime (Avg Days/Well/Month) Last 18 Mo Avg: ~7,000 Boe/d Upper & Lower WC A Two Section Lateral (~9,400ft) Centennial Assumes Operations

Proven Track Record of Performance Operational Improvements Driving Well Performance IP30 Boe/d/1,000ft Lateral (3-Stream) Delivering best-in-class performance 400 350 Last ~30 well average at or above premier operators in Southern Reeves 300 250 200 Optimizing completions, landing zones and effective lateral length continues to enhance productivity 150 100 50 Culture of continuous improvement 0 Quarter/Year Wolfcamp Well Performance (1) Relative Well Performance (2) 140 800 Centennial Delaware Peers 700 120 ~45% Increase 600 100 500 80 400 60 300 40 200 20 100 Delaware Peers Includes: APA, APC, CWEI, CXO, EGN, EOG, MTDR, NBL, OXY, RDS, WPX and XEC 0 0 0 20 40 60 80 100 120 0 30 60 90 120 150 180 210 240 270 300 330 360 Days On Production Wells (Oldest to Newest) (1)Includes all ~4,500ft lateral Wolfcamp wells completed by Centennial in Reeves County, excludes Kimsey area wells; Results un adjusted for downtime. (2)Per IHS performance evaluator; Includes Hz wells with a first production date between 1/1/2014 - 2/29/2016 with at least three months of production and reported as producing from Wolfcamp and Bone Spring. 20 Avg Cumulative Oil Production (MBo) First 3 Mo Cum. per 1,000 ft (MBo/1,000 ft) 30-Day Boe/d/1,000ft Lateral 4,500ft Wolfcamp A Wells (Kimsey Wells Excluded) Average Centennial Last ~30 Well Avg: ~250 Boe/d/1,000ft

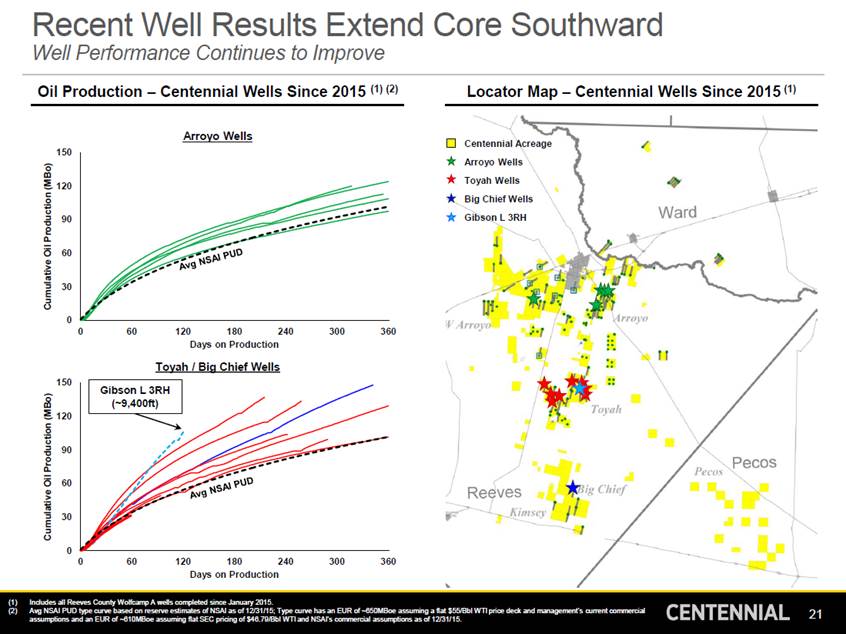
Recent Well Results Extend Well Performance Continues to Improve Core Southward Oil Production – Centennial Wells Since 2015 (1) (2) Locator Map – Centennial Wells Since 2015 (1) Arroyo Wells Centennial Acreage Arroyo Wells Toyah Wells Big Chief Wells Gibson L 3RH 150 120 90 60 30 0 0 60 120 180 240 300 360 Days on Production Toyah / Big Chief Wells 150 120 90 60 30 0 0 60 120 180 240 300 360 Days on Production (1)Includes all Reeves County Wolfcamp A wells completed since January 2015. (2)Avg NSAI PUD type curve based on reserve estimates of NSAI as of 12/31/15; Type curve has an EUR of ~650MBoe assuming a flat $55/Bbl WTI price deck and management’s current commercial assumptions and an EUR of ~610MBoe assuming flat SEC pricing of $46.79/Bbl WTI and NSAI’s commercial assumptions as of 12/31/ 15. 21 Cumulative Oil Production (MBo) Cumulative Oil Production (MBo) Gibson L 3RH (~9,400ft)
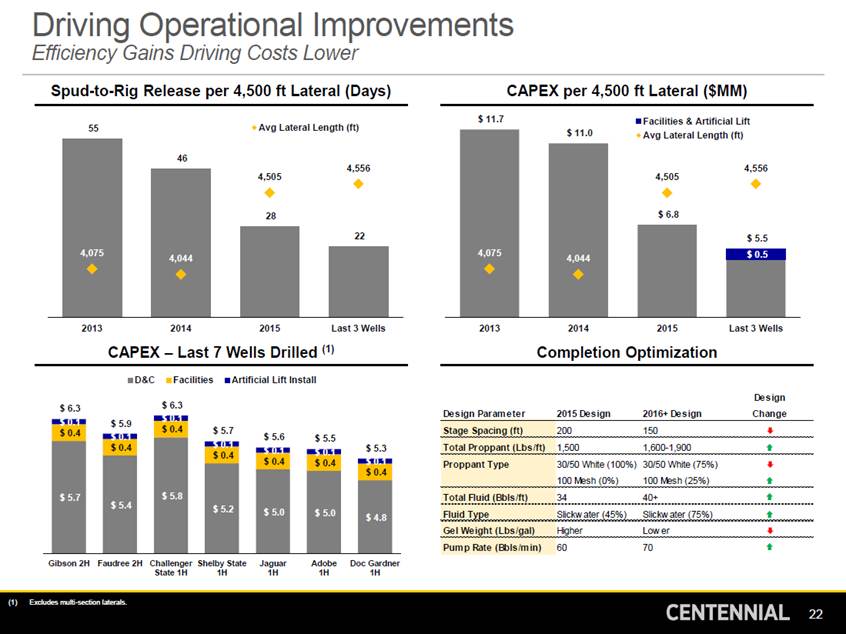
Driving Operational Improvements Efficiency Gains Driving Costs Lower Spud-to-Rig Release per 4,500 ft Lateral (Days) CAPEX per 4,500 ft Lateral ($MM) $ 11.7 Facilities & Artificial Lift Avg Lateral Length (ft) 55 4,556 2013 2014 2015 Last 3 Wells 2013 2014 2015 Last 3 Wells CAPEX – Last 7 Wells Drilled (1) Completion Optimization D&CFacilities Artificial Lift Install De s ign Change $ 6.3 $ 6.3 De s ign Param e te r 2015 De s ign 2016+ De s ign $ 5.9 $ 0.4 $ 5.7 $ 5.6 $ 5.5 30/50 White (100%) 30/50 White (75%) Gibson 2H Faudree 2H Challenger Shelby State Jaguar 1H Adobe 1H Doc Gardner 1H State 1H 1H (1)Excludes multi-section laterals. 22 Stage Spacing (ft) Total Proppant (Lbs /ft) Proppant Type Total Fluid (Bbls /ft) Fluid Type Ge l We ight (Lbs /gal) Pum p Rate (Bbls /m in) 200 150 1,500 1,600-1,900 100 Mesh (0%) 100 Mesh (25%) 34 40+ Slickw ater (45%) Slickw ater (75%) Higher Low er 60 70 $ 0.4 $ 0.4 $ 5.7 $ 5.8 $ 0.4 $ 5.3 $ 0.4 $ 5.4 $ 0.4 $ 0.4 $ 5.2 $ 5.0 $ 5.0 $ 4.8 4,075 46 4,044 4,505 28 22 4,075 $ 11.0Avg Lateral Length (ft) 4,044 4,556 4,505 $ 6.8 $ 5.5 $ 0.5
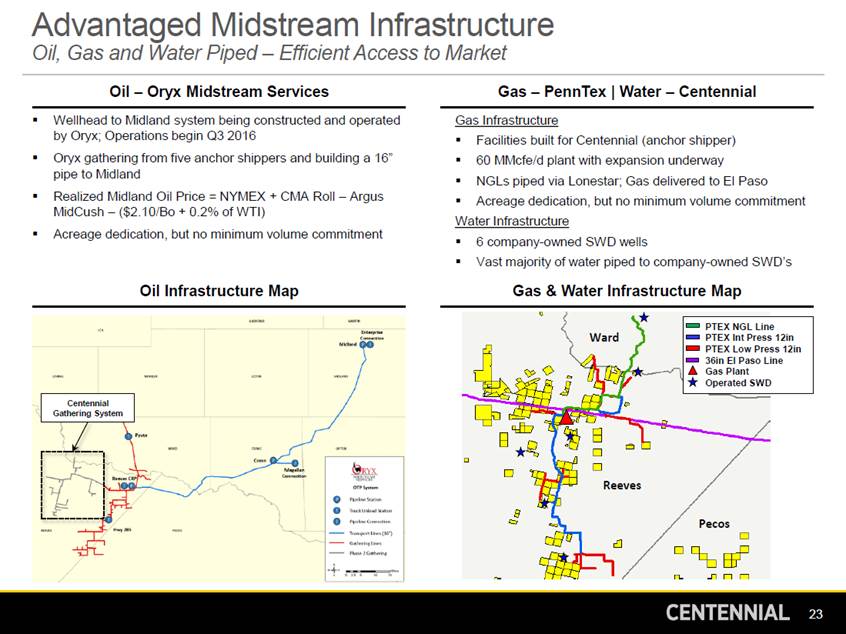
Advantaged Midstream Infrastructure Oil, Gas and Water Piped – Efficient Access to Market Oil – Oryx Midstream Services Gas – PennTex | Water – Centennial Wellhead to Midland system being constructed and operated by Oryx; Operations begin Q3 2016 Oryx gathering from five anchor shippers and building a 16” pipe to Midland Realized Midland Oil Price = NYMEX + CMA Roll – Argus MidCush – ($2.10/Bo + 0.2% of WTI) Acreage dedication, but no minimum volume commitment Gas Infrastructure Facilities built for Centennial (anchor shipper) 60 MMcfe/d plant with expansion underway NGLs piped via Lonestar; Gas delivered to El Paso Acreage dedication, but no minimum volume commitment Water Infrastructure 6 company-owned SWD wells Vast majority of water piped to company-owned SWD’s Oil Infrastructure Map Gas & Water Infrastructure Map Ward 36in El Paso Line Reeves Pecos 23 Centennial Gathering System PTEX NGL Line PTEX Int Press 12in PTEX Low Press 12in Gas Plant Operated SWD
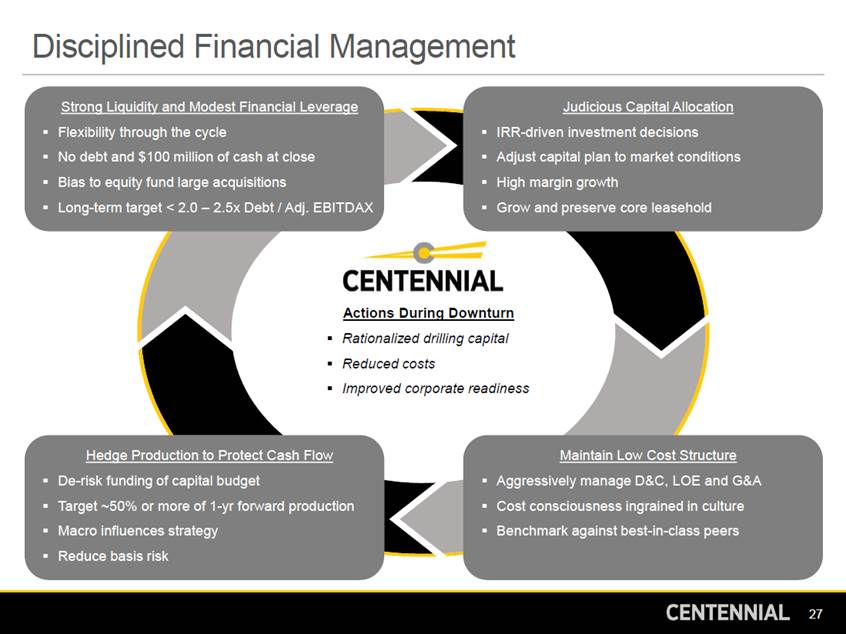
Single Well Returns Lower D&C Costs and Extended Laterals Drive Superior Economics Single Well Statistics IRR Sensitivities SEC Assumptions (1) Current Assumptions (1) NSAI Avg PUD (4,500 ft): EUR vs D&C CAPEX NSAI Avg Gibson L NSAI Avg Gibson L (2) (2) (2) (2) PUD 3RH PUD 3RH 120% Lateral Length (ft) WTI Oil Price Deck ($/Bbl) 3-Stre a m EUR 4,500 $ 46.79 9,363 $ 46.79 4,500 $ 55.00 9,363 $ 55.00 % * Based on Current Assumptions ($55/Bbl flat WTI) Increase EUR 85% 100% 904 MBoe 80% 68% Oil (MBbls) Gas (MMcf) 432 628 990 908 457 665 990 908 +40% 50% 60% 775 MBoe 646 MBoe NGLs (MBbls) 73 103 77 103 59% +20% Total (MBoe) % Oil % Liquids D&C CAPEX ($MM) F&D Costs ($/Boe) 3-Stre a m 30 Da y IP Ra te s 610 71% 83% $ 6.3 $ 13.77 1,245 80% 88% $ 8.5 $ 9.09 646 71% 83% $ 6.3 $ 13.01 1,245 80% 88% $ 8.5 $ 9.09 47% 40% 34% NSAI 38% 20% 30% 21% 0% NSAI ($6.3MM) Current ($5.5MM) D&C CAPEX ($MM) Target ($5.0MM) Oil (Bbls/d) Gas (Mcf/d) 669 972 1,049 948 669 972 1,049 948 NGLs (Bbls/d) 113 108 113 108 NSAI Avg PUD EUR 20% Increase in EUR 40% Increase in EUR Total (Boe/d) Assumptions 944 1,315 944 1,315 Gibson L 3RH (~9,400 ft): Oil Price vs D&C CAPEX B-Factor Year-1 Decline (%) Terminal Decline (%) LOE Variable ($/Bo) LOE Fixed (per well per month) Transportation & Gathering ($/Mcf) Processing (% of Gas & NGL Revenue) Severance Tax (%) Ad Valorem Tax (%) Royalty (%) Single We ll Re turns 1.41 83% 5% $ 2.99 $ 7,200 $ 1.07 0.0% 4.9% 2.0% 25.0% – – – $ 2.99 $ 7,200 $ 1.07 0.0% 4.9% 2.0% 25.0% 1.41 83% 5% $ 2.75 $ 5,000 $ 0.55 20.0% 4.9% 2.0% 25.0% – – – $ 2.75 $ 5,000 $ 0.55 20.0% 4.9% 2.0% 25.0% 120% 107% * Based on Current Assumptions 100% 71% 80% 82% 60% 43% 54% 40% 20% 32% Projected IRR PV-10 ($MM) 10% $ 0.1 32% $ 4.8 21% $ 2.0 54% $ 8.6 0% $ 45.00 $ 55.00 WTI Oil ($/Bbl) $ 65.00 Current ($8.5MM D&C) Target ($7.5MM D&C) (1)SEC Assumption single well statistics estimated utilizing SEC pricing and NSAI’s commercial assumptions as of 12/31/15. Curr ent Assumption single well statistics estimated utilizing flat $55/Bbl WTI and managements current commercial assumptions. (2)Avg NSAI PUD type curve based on reserve estimates of NSAI as of 12/31/15. Gibson L 3RH type curve based on actual productio n as of 6/30/16 and forecasted production thereafter based on management estimates. 24
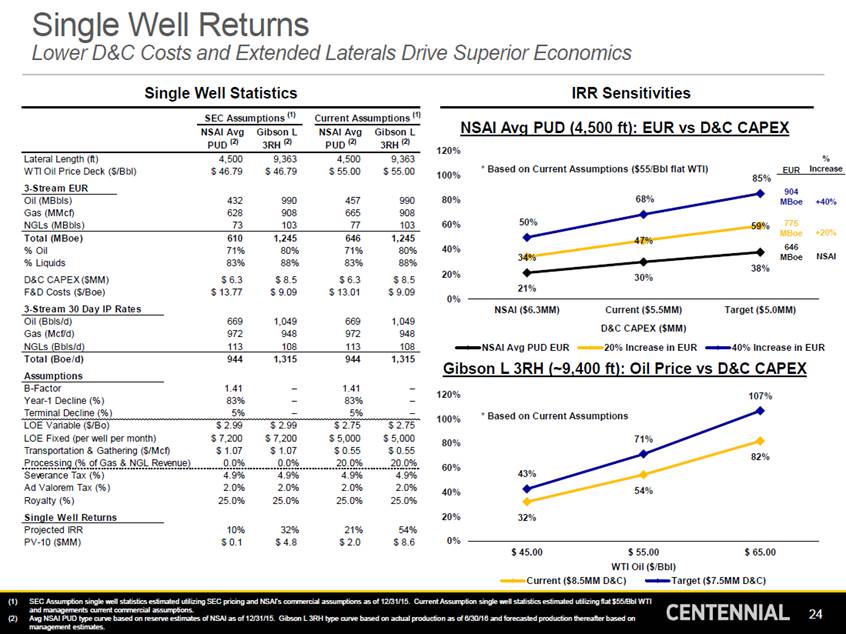
Centennial Horizontal Development Shifting to Extended Laterals and Pad Development Plan Prospect Areas Near-term development planned across three project areas – ~40/60 split between 4,500-ft and extended laterals – Wolfcamp A is primary target and Wolfcamp B&C and 3rd Bone Spring Sand are secondary targets Conservative Planned Rig Ramp – – – – Rig 1 – July 2016 start-up Rig 2 & 3 – October 2016 start-up (Pad drilling) Rig 4 – April 2017 start-up (Pad drilling) Rig 5+ – January 2018 (Pad drilling) Development Summary Arroyo Prospect Area 2H 2016 2017 2018 Toyah Arroyo Toyah Big Chief Big Chief Pecos Kimsey Centennial Acreage Indicates Planned Drilling 25 Total Wells Planned124660
CENTENNIAL 26
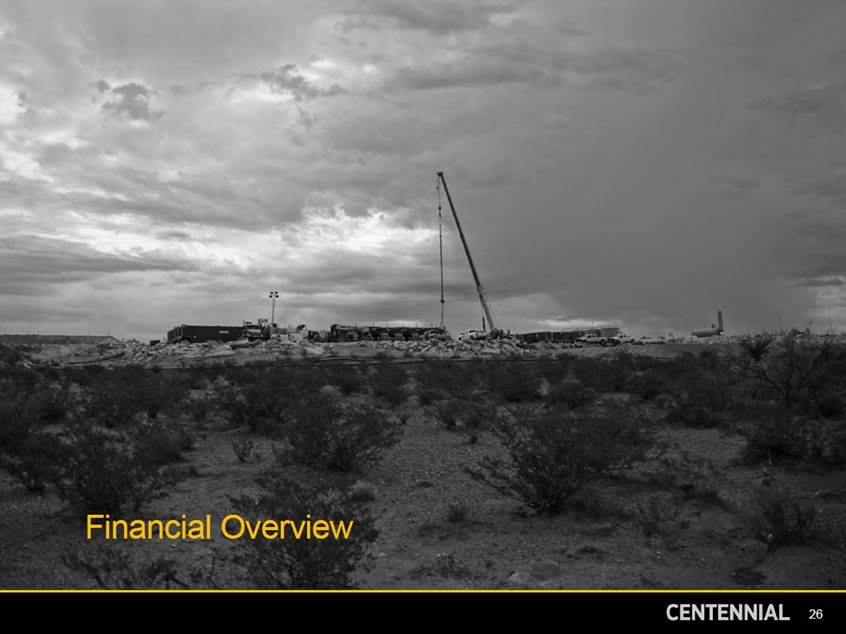
Disciplined Financial Management Strong Liquidity and Modest Financial Leverage Judicious Capital Allocation Flexibility through the cycle No debt and $100 million of cash at close Bias to equity fund large acquisitions Long-term target < 2.0 – 2.5x Debt / Adj. EBITDAX IRR-driven investment decisions Adjust capital plan to market conditions High margin growth Grow and preserve core leasehold Actions During Downturn Rationalized drilling capital Reduced costs Improved corporate readiness Hedge Production to Protect Cash Flow Maintain Low Cost Structure De-risk funding of capital budget Target ~50% or more of 1-yr forward production Macro influences strategy Reduce basis risk Aggressively manage D&C, LOE and G&A Cost consciousness ingrained in culture Benchmark against best-in-class peers 27
Sources & Uses and Pro Forma Capitalization Capitalization as of 3/31/16 Acquisition entirely funded with equity results in debt free balance sheet and ample liquidity to fund drilling program Pro forma liquidity of $260 million based on $100 million of cash on the balance sheet and $160 million of expected revolver borrowing base availability at closing Adjustme nts (1)Credit facility as of 3/31/16 is pro forma for borrowings subsequent to 3/31/16. Includes $44MM drawn to fund acquisitions. (2)Reserves per NSAI as of 12/31/15. 28 ($ in millions, unless specified) Actual Borrow ings Ac q. Pro forma Cash and Cash Equivalents $ 1 $ - $ 99 Revolving Credit Facility (1)$ 77 $ 47 $ (124) First Lien Term Loan 65 - (65) $ 100 $ - - Total Debt $ 142 $ 47 $ (189) $ - Financial & Operating Statistics TTM EBITDAX $ 75 Proved Reserves (MMBoe) (2)32 Proved Developed Reserves (MMBoe) (2)14 Q1 2016A Production (Boe/d) 7,212 Credit metrics Total Debt / TTM EBITDAX 1.9x Proved Reserves ($/Boe) $ 4.37 Proved Developed Reserves ($/Boe) $ 9.97 Q1 2016A Production ($/Boe/d) $ 19,689 Liquidity Expected Borrowing Base $ 140 $ 20 Less: Amount Drawn (77) $ 75 32 14 7,212 0.0x $ - $ - $ - $ 160 - Expected Borrowing Base Availability $ 63 Plus: Cash and Cash Equivalents 1 Less: Letters Of Credit (1) $ 160 100 (1) Liquidity $ 63 $ 260
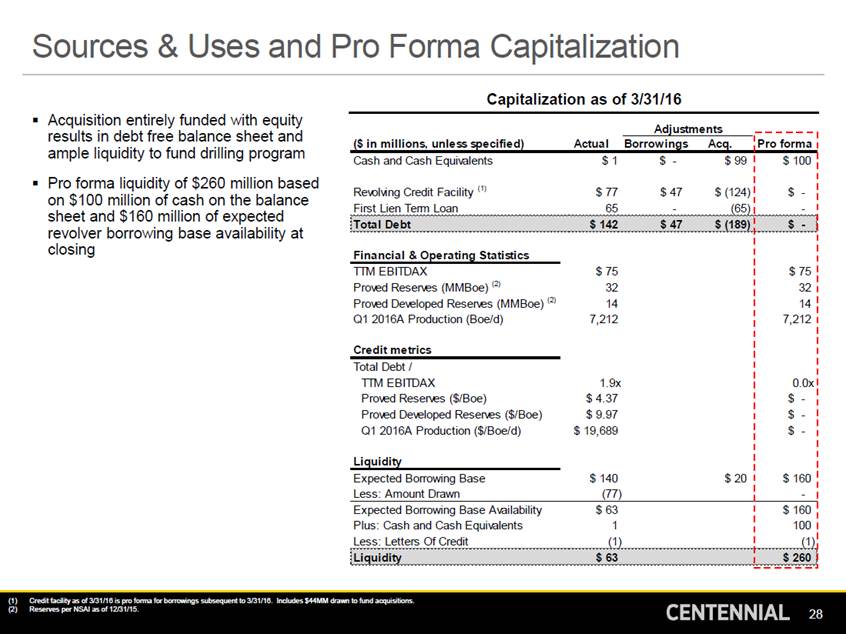
Capital Budget Overview 2015 and 2016 planning focused on capital preservation & discipline, maintaining liquidity, retaining acreage and acquisitions – Maintained flat production with a one rig program over the past 18 months Centennial is currently running one horizontal rig, with plans to add two additional rigs by October 2016 to increase development activity Centennial will opportunistically adjust its capital budget with rising oil prices and discounted services 2016E Capital Budget Detail (1) Capital Spending Overview ($MM) D&C Leasing, Facilities & Misc Acquisitions 2016E CAPEX Range Acquisitions 27% $ 175 Operated D&C 48% Facilities & Misc 4% Lease Renewals 3% Discretionary Leasing 14% Non Op D&C 4% 2015A 2016E Low 2016E High (1)2016E capital budget detail based on the low estimate of expected D&C capital expenditures and high estimate of expected leas ing and acquisition capital expenditures. 29 $ 155 44 $ 131 44 36 23 25 22 $ 95 $ 86 $ 86
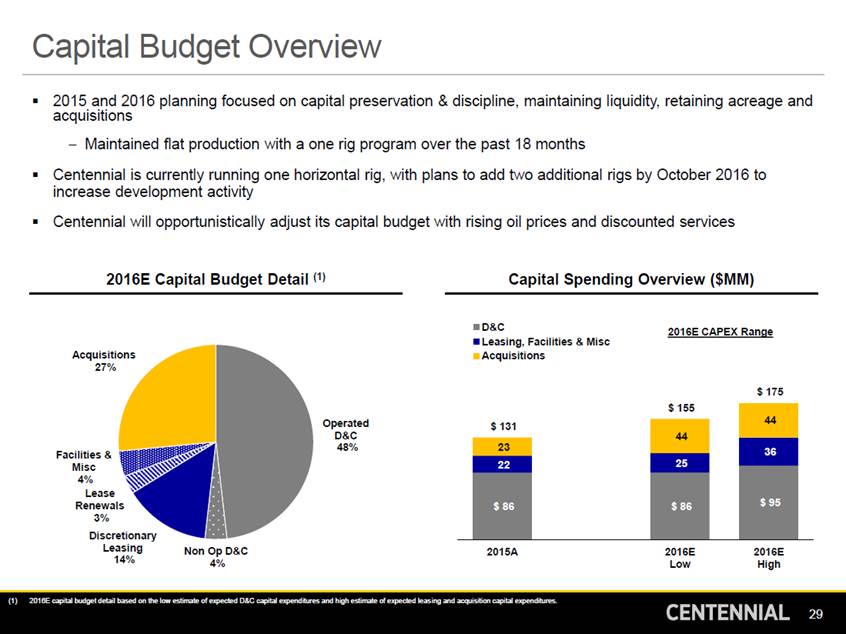
Hedging Activity Consistently Hedging to Protect Cash Flow Cal 2016 Crude Swap Hedging Activity – Volumes Swapped (Bbls/d) | Avg Hedge Price ($/Bbl) $ 42.46/Bbl $ 61.58/Bbl $ 77.25/Bbl 6/30/15 3Q15 4Q15 12/31/15 1Q16 Current Period End Hedge Summary Hedges Added in Period Cal 2017 Crude Swap Hedging Activity – Volumes Swapped (Bbls/d) | Avg Hedge Price ($/Bbl) $ 49.99/Bbl $ 50.41/Bbl $ 64.05/Bbl 6/30/15 4Q15 12/31/15 Period End Hedge Summary 1Q16 2Q16 Current Hedges Added in Period 30 $ 44.64/Bbl $ 54.65/Bbl$ 61.36/Bbl 1,850 Bbls/d 350 Bbls/d 250 Bbls/d 100 Bbls/d 600 Bbls/d 900 Bbls/d $ 51.70/Bbl$ 67.82/Bbl 2,592 Bbls/d $ 53.62/Bbl 1,992 Bbls/d 1,242 Bbls/d 200 Bbls/d 550 Bbls/d 600 Bbls/d
Transaction Overview 31
Transaction Overview On July 6th, certain funds controlled by Riverstone entered into an agreement to acquire a majority interest in Centennial(1) Riverstone and certain affiliates(2) will contribute approximately $810 million of cash to Silver Run in exchange for shares of Class A Common Stock at $10.00 per share and Silver Run will acquire the majority interest in Centennial Successfully secured $200 million in PIPE commitments from certain institutional investors to fund the remaining consideration(3) The existing owners of Centennial will retain a significant equity stake (~11%)(1) Riverstone expects to purchase shares of Silver Run Class A Common Stock at $10.00 per share in the event any existing Silver Run stockholders choose to redeem their shares in connection with the acquisition – ensures Silver Run’s ability to fund the acquisition Completion of the transaction is expected in late September 2016 Below tables assume sellers exchange their interest in Centennial for Silver Run shares(1) Sources & Uses (Estimated) Post Transaction Ownership (Estimated) At $18/Share (6) Sources $ mm % (units in millions) At $10/Share Existing Silver Run Shareholders PIPE Issuance(3) Riverstone Funds(2) Seller Rollover Equity(1) $500.0 200.0 810.1 184.7 29.5% 11.8% 47.8% 10.9% Shares % Shares % Public Shares(4) PIPE Shares(3) Riverstone Funds Shares (4)(5) Seller Shares(1) 50.0 20.0 93.5 20.0 27.2% 10.9% 51.0% 10.9% 56.0 20.0 96.4 20.0 29.1% 10.4% 50.1% 10.4% Total Sources $1,694.8 100.0% Total Shares Outstanding 183.5 100.0% 192.4 100.0% Pro Forma Valuation Use s $ mm % Cash to Seller Seller Rollover Equity(1) Net Debt Reduction Cash to Balance Sheet $1,186.7 184.7 188.3 100.0 70.0% 10.9% 11.1% 5.9% ($ and units in millions, except per share values) Illustrative Share Price $10.00 Fully Diluted Shares Outstanding 183.5 Transaction Expenses 35.1 2.1% Equity Value Net Debt $1,835.1 (100.0) Total Uses $1,694.8 100.0% Firm Value $1,735.1 Firm Va lue / Adj. EBITDAX FV / 2017E Adj. EBITDAX FV / 2018E Adj. EBITDAX $138 $264 12.6x 6.6x Note: Assumes no stockholder redemption. (1) Post-transaction, Silver Run will own ~89% of Centennial and the sellers will retain a ~11% interest pursuant to the “Up-C” structure of the transaction. Sellers can exchange their interest in Centennial for 20 million shares of Silver Run Class A Common Stock. Riverstone Global Energy and Power Fund VI, L.P., Riverstone Non-ECI Partners, L.P., Riverstone Energy Limited and Potential Co-Investors. (2) (3) (4) (5) (6) Represents a private investment in public equity (or “PIPE”), with 20.0 million shares issued at $10.00 per share, representing net proceeds of $94 million. The PIPE is to be completed simultaneously with the Centennial ac quisition. Assumes treasury stock method for calculating dilution impact of warrants. Public and Sponsor warrants of 16.7 million and 8.0 millio n outstanding, respectively, with a $11.50 per share strike price. Includes 12.5 million Sponsor shares and Sponsor warrants. $18 represents share price at which public warrants can be called for redemption. 32
(1) Financial Forecast Summary D&C CAPEX ($MM) Daily Production (Boe/d) $ 326 % YoY Growth 24,138 % of Adj. EBITDAX 2015A 2016E 2017E 2018E 2015A 2016E 2017E 2018E Adj. EBITDAX ($MM) | WTI Oil Price ($/Bbl) Total Liquidity ($MM) | Debt / TTM Adj. EBITDAX (2) Liquidity (3) Debt / TTM Adj. EBITDAX Avg WTI ($/Bbl) $ 264 Cash BB Availability $ 369 $ 359 $ 68 0.0x 2015A 2016E 2017E 2018E 2015A 2016E 2017E 2018E 2015A 2016E 2017E 2018E (1) Forecast based on NYMEX prices as of 7/11/16; Assumes $42.81, $50.13 and $52.85 for 2016E, 2017E and 2018E, respectively. See “Important Information – Use of Projections” at the beginning of this Investor Presentation for important qualifications and limitations on the use of projections. Actual result may differ materially. Please refer to the Appendix for a reconciliation of Adjusted EBITDAX to net (loss) income. Liquidity = Borrowing base availability plus cash on hand; Assumes borrowing base grows with production and is estimated at ~$20,000/Boe/d at time of redetermination. 33 (2) (3) $ 234 1.7x 0.4x $ 68 0.1x $ 138 $ 52.85 $ 82 $ 50.13 $ 48.76 $ 42.81 14,511 66% 7,317 7,840 85% 7% 40% $ 209 123% $ 86 $ 86 152% 104% 126%

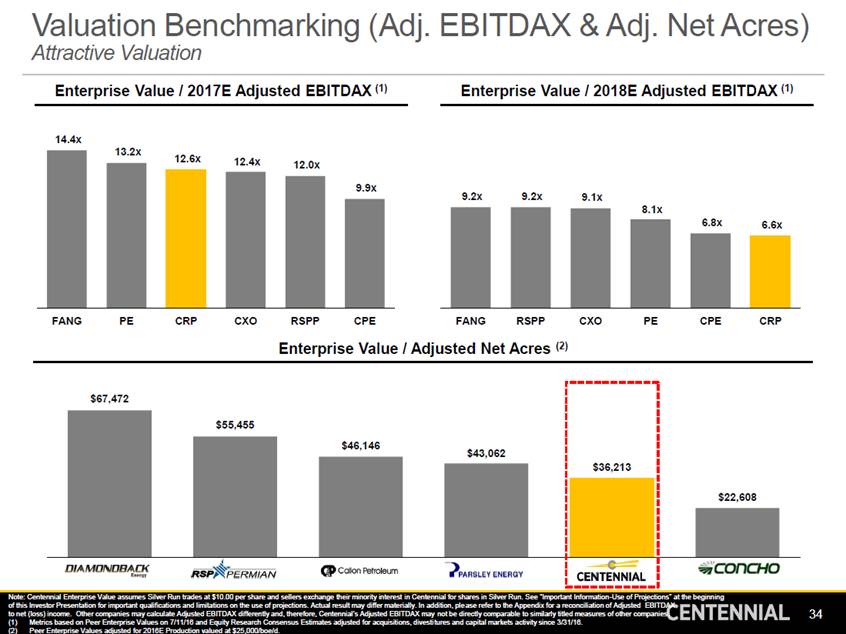
Valuation Benchmarking (Adj. Attractive Valuation EBITDAX & Adj. Net Acres) Enterprise Value / 2017E Adjusted EBITDAX (1) Enterprise Value / 2018E Adjusted EBITDAX (1) 14.4x 13.2x 12.6x 12.4x 9.2x 9.2x 9.1x FANG PE CRP CXO RSPP CPE FANG RSPP CXO PE CPE CRP Enterprise Value / Adjusted Net Acres (2) $43,062 Note: Centennial Enterprise Value assumes Silver Run trades at $10.00 per share and sellers exchange their minority interest in Centennial for shares in Silver Run. See “Important Information-Use of Projections” at the beginning of this Investor Presentation for important qualifications and limitations on the use of projections. Actual result may differ materially. In addition, ple ase refer to the Appendix for a reconciliation of Adjusted EBITDA to net (loss) income. Other companies may calculate Adjusted EBITDAX differently and, therefore, Centennial’s Adjusted EBITDAX may not be directly comparable to similarly titled measures of other companie (1)Metrics based on Peer Enterprise Values on 7/11/16 and Equity Research Consensus Estimates adjusted for acquisitions, divesti tures and capital markets activity since 3/31/16. (2)Peer Enterprise Values adjusted for 2016E Production valued at $25,000/boe/d. 34 $67,472 $36,213 $22,608 $55,455 $46,146 FANGRSPPCPEPE CRP CXO 8.1x 6.8x6.6x 12.0x 9.9x
Valuation Benchmarking (Production) Superior Production Growth EV / 2017E Production (1) EV / 2018E Production (1) $152,079 $124,360 $106,529 $103,366 FANG RSPP PE CRP CXO CPE FANG RSPP CXO PE CPE CRP 2016E / 2017E Production Growth Rate (1) 2017E / 2018E Production Growth Rate (1) 85% 66% CRP PE CPE FANG RSPP CXO CRP PE CPE FANG RSPP CXO Note: Centennial Enterprise Value assumes Silver Run trades at $10.00 per share and sellers exchange their minority interest in Centennial for shares in Silver Run. See “Important Information-Use of Projections” at the beginning of this Investor Presentation for important qualifications and limitations on the use of projections. Actual result may differ materially. (1)Metrics based on Peer Enterprise Values on 7/11/16 and Equity Research Consensus Estimates adjusted for acquisitions, divestitures and capital markets activity since 3/31/16. 35 35% 26%22%21% 11% 32% 23% 16%15% 11% $113,539 $99,059 $84,222 $71,880 $137,906$133,329 $119,565$114,852

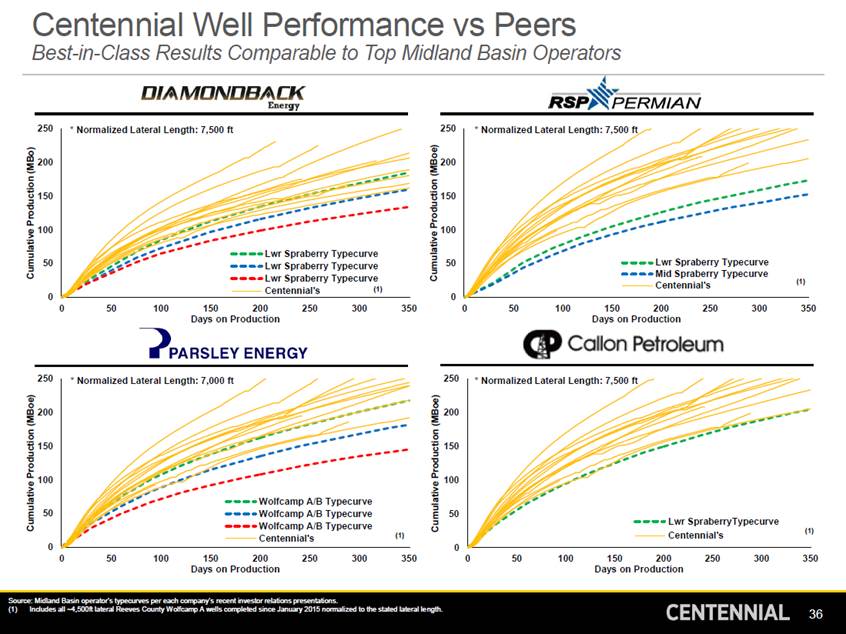
Centennial Well Performance vs Peers Best-in-Class Results Comparable to Top Midland Basin Operators 250 250 200 200 150 150 100 100 50 50 Centennial's 0 0 0 50 100 150 200 250 300 350 0 50 100 150 200 250 300 350 Days on Production Days on Production 250 250 200 200 150 150 100 100 50 50 ) Centennial's 0 0 0 50 100 150 200 250 300 350 0 50 100 150 200 250 300 350 Days on Production Days on Production Source: Midland Basin operator’s typecurves per each company’s recent investor relations presentations. (1)Includes all ~4,500ft lateral Reeves County Wolfcamp A wells completed since January 2015 normalized to the stated lateral le ngth. 36 Cumulative Production (MBoe) Cumulative Production (MBo) Cumulative Production (MBoe) Cumulative Production (MBoe) * Normalized Lateral Length: 7,500 ft Lwr SpraberryTypecurve (1 * Normalized Lateral Length: 7,000 ft Wolfcamp A/B Typecurve Wolfcamp A/B Typecurve Wolfcamp A/B Typecurve Centennial's(1) * Normalized Lateral Length: 7,500 ft Lwr Spraberry Typecurve Mid Spraberry Typecurve(1) * Normalized Lateral Length: 7,500 ft Lwr Spraberry Typecurve Lwr Spraberry Typecurve Lwr Spraberry Typecurve Centennial's (1)
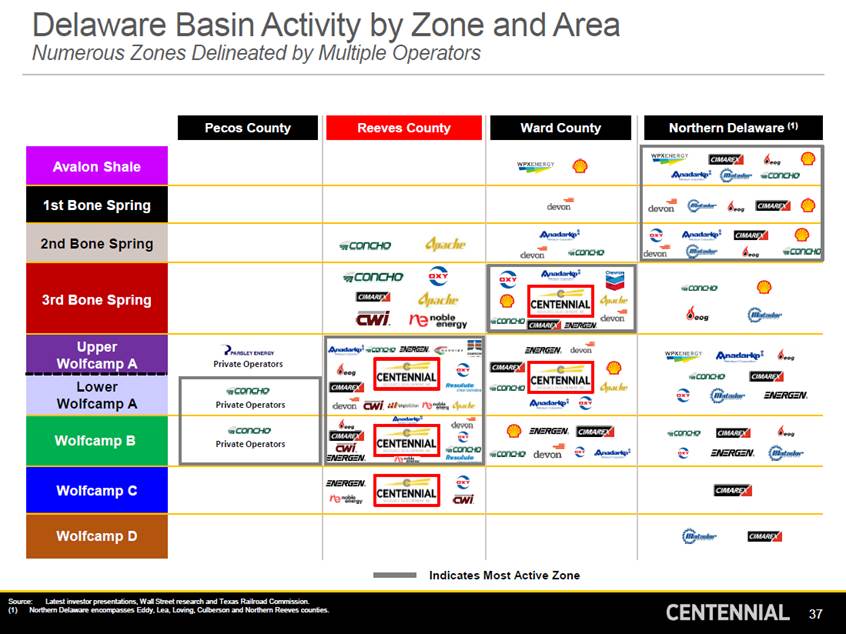
Delaware Basin Activity by Zone Numerous Zones Delineated by Multiple Operators and Area Indicates Most Active Zone Source:Latest investor presentations, Wall Street research and Texas Railroad Commission. (1)Northern Delaware encompasses Eddy, Lea, Loving, Culberson and Northern Reeves counties. 37 Avalon Shale 1st Bone Spring 2nd Bone Spring 3rd Bone Spring Upper Wolfcamp A Private Operators Lower Wolfcamp A Private Operators Wolfcamp B Private Operators Wolfcamp C Wolfcamp D Pecos County Northern Delaware (1) Ward County Reeves County
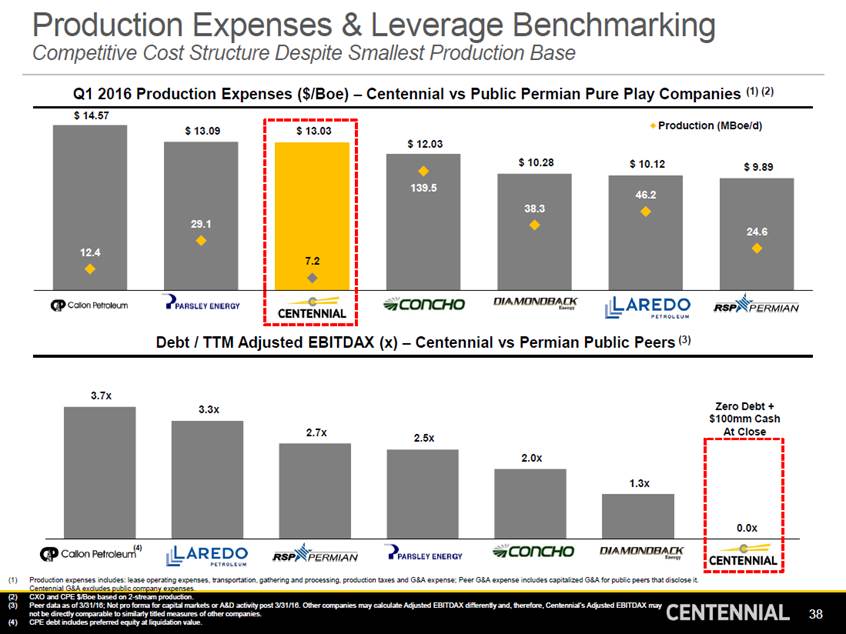
Production Expenses & Leverage Benchmarking Competitive Cost Structure Despite Smallest Production Base Q1 2016 Production Expenses ($/Boe) – Centennial vs Public Permian Pure Play Companies (1) (2) $ 14.57 Debt / TTM Adjusted EBITDAX (x) – Centennial vs Permian Public Peers (3) 3.7x Zero Debt + 3.3x $100mm Cash (1) Production expenses includes: lease operating expenses, transportation, gathering and processing, production taxes and G&A ex pense; Peer G&A expense includes capitalized G&A for public peers that disclose it. Centennial G&A excludes public company expenses. (2) (3) CXO and CPE $/Boe based on 2-stream production. Peer data as of 3/31/16; Not pro forma for capital markets or A&D activity post 3/31/16. Other companies may calculate Adjusted EBITDAX differently and, therefore, Centennial’s Adjusted EBITDAX may not be directly comparable to similarly titled measures of other companies. CPE debt includes preferred equity at liquidation value. 38 (4) 2.7x2.5xAt Close 0.0x 2.0x 1.3x CPE(4)LPIRSPPPECXOFANG CRP PF $ 13.03 Production (MBoe/d) $ 12.03 12.4 $ 13.09 29.1 7.2 139.5 $ 10.28$ 10.12$ 9.89 38.3 46.2 24.6 CPEPE CRP CXOFANGLPIRSPP
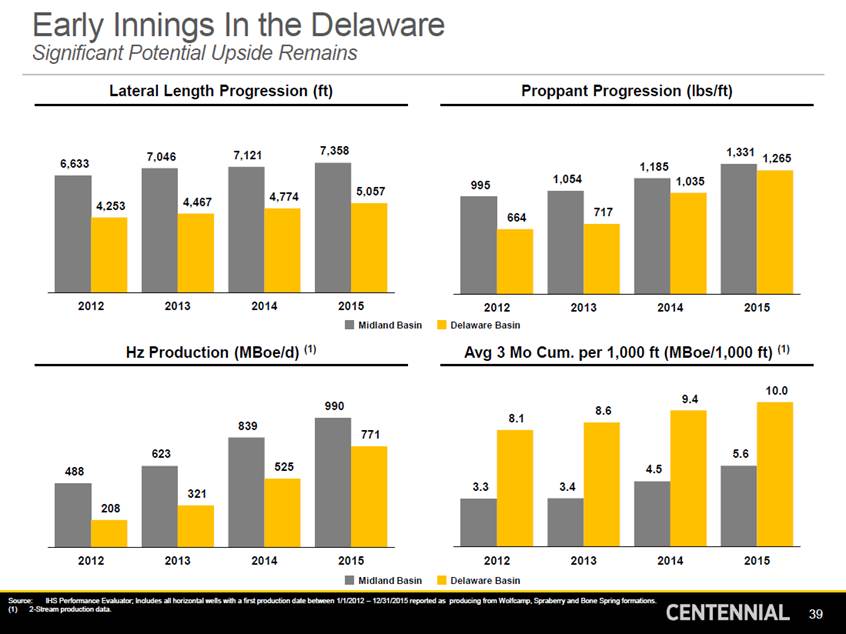
Early Innings In the Delaware Significant Potential Upside Remains Lateral Length Progression (ft) Proppant Progression (lbs/ft) 7,358 1,331 7,121 7,046 1,265 6,633 2012 2013 2014 2015 2012 Delaware Basin 2013 2014 2015 Midland Basin Hz Production (MBoe/d) (1) Avg 3 Mo Cum. per 1,000 ft (MBoe/1,000 ft) (1) 10.0 9.4 990 8.6 8.1 2012 Delaware Basin 2013 2014 2015 2012 2013 2014 2015 Midland Basin Source:IHS Performance Evaluator; Includes all horizontal wells with a first production date between 1/1/2012 – 12/31/2015 reported as producing from Wolfcamp, Spraberry and Bone Spring formations. (1)2-Stream production data. 39 839 771 623 525 488 321 208 5.6 4.5 3.3 3.4 5,057 4,467 4,774 4,253 1,185 9951,054 1,035 717 664
Anticipated Transaction Timeline Date Event Business Combination Agreement Between Riverstone and Centennial Executed July 6th Week of July 25th Preliminary Proxy Materials Filed with SEC Week of Sept 12th Mail Final Proxy Materials to Stockholders 40 Week of Sept 26thHold Stockholder Vote and Close Transaction Week of Aug 29thSet Record Date for Stockholder Vote Week of July 18thTransaction Announced

Appendix 41
Wolfcamp A Activity – Normalized 4,500 ft Hundreds of Hz Producers in Southern Reeves; Centennial Results Best-In-Class Recent Well Results (3-Stream) Centennial Normalized Daily Oil Production (1) (2) CDEV WC A Arroyo CDEV WC A Toyah CDEV WC A Big Chief Stingray – Upper WC A OXY Peck – Upper WC A 1,600 1,400 1H IP30: 1,925 Boe/d 2H IP30: 1,705 Boe/d IP30: 1,760 Boe/d NSAI Avg PUD 1,200 1,000 800 600 Stacked-Staggered Pilot CH Knight 2H – Upper WC A IP30: 1,501 Boe/d CH Knight 3H – Lower WC A IP30: 1,320 Boe/d Jagged Peak Trinity Lower WC A 400 200 0 IP30: 1,296 Boe/d Allen 1H – Upper WC A IP30: 1,089 Boe/d 0 60 120 180 Days on Production 240 300 360 OXY Leigh – Upper WC A IP30: 1,528 Boe/d Shelby 2H – Upper WC A IP30: 1,521 Boepd Normalized Cumulative Oil Production (1) (2) OXY Betty Lou – Upper WC A IP30: 1,310 Boe/d Faudree 2H – Upper WC A 150 CDEV WC A (21 Wells) IP30: 1,277 Boepd +40% Patriot Iron Mike +20% Lower WC A NSAI Avg PUD 120 IP30: 1,385 Boe/d Gibson L 3RH – Upper WC A IP30: 1,346 Boe/d NSAI 90 J. Cleo Oppenheimer Lower WC A IP30: 2,347 Boe/d Bentz 2H – Lower WC A 60 IP30: 1,007 Boe/d CXO Gunnison – Lower WC A 30 IP30: 1,145 Boe/d Hoefs Ranch 1H – Lower WC A ~800 Mboe 0 0 60 120 180 Days on Production 240 300 360 Centennial Acreage (1)Production normalized to 4,500 ft and unadjusted for downtime; Includes all ~4,500 ft lateral Wolfcamp A wells drilled and co mpleted in Reeves County since Centennial assumed operations in mid 2014; Kimsey wells excluded. (2)Avg NSAI PUD type curve based on reserve estimates of NSAI as of 12/31/15; Type curve has an EUR of ~650MBoe assuming a flat $55/Bbl WTI price deck and management’s current commercial assumptions and an EUR of ~610MBoe assuming SEC pricing of $46.79/Bbl WTI and NSAI’s commercial assumptions as of 12/31/15. 42 Daily Oil Production (Bo/d) Cumulative Oil Production (MBo) Upper Wolfcamp A Lower Wolfcamp A

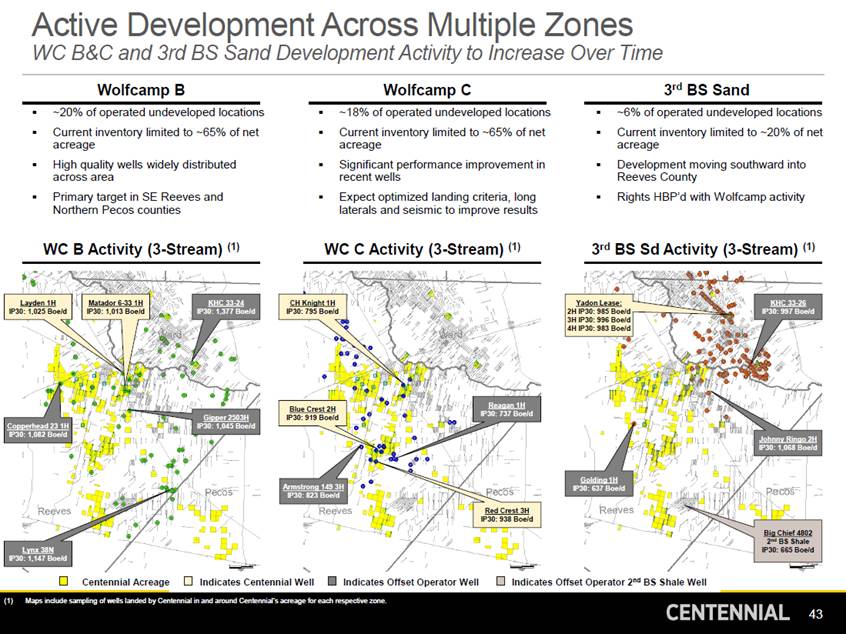
Active Development Across Multiple Zones WC B&C and 3rd BS Sand Development Activity to Increase Over Time Wolfcamp B Wolfcamp C 3rd BS Sand ~20% of operated undeveloped locations Current inventory limited to ~65% of net acreage High quality wells widely distributed across area Primary target in SE Reeves and Northern Pecos counties ~18% of operated undeveloped locations Current inventory limited to ~65% of net acreage Significant performance improvement in recent wells Expect optimized landing criteria, long laterals and seismic to improve results ~6% of operated undeveloped locations Current inventory limited to ~20% of net acreage Development moving southward into Reeves County Rights HBP’d with Wolfcamp activity WC B Activity (3-Stream) (1) WC C Activity (3-Stream) (1) 3rd BS Sd Activity (3-Stream) (1) Layden 1H Matador 6-33 1H KHC 33-24 CH Knight 1H Yadon Lease: KHC 33-26 IP30: 1,025 Boe/d IP30: 1,013 Boe/d IP30: 1,377 Boe/d IP30: 795 Boe/d 2H IP30: 985 Boe/d 3H IP30: 996 Boe/d 4H IP30: 983 Boe/d IP30: 997 Boe/d Reagan 1H Blue Crest 2H IP30: 737 Boe/d Gipper 2503H IP30: 919 Boe/d Copperhead 23 1H IP30: 1,045 Boe/d IP30: 1,082 Boe/d Johnny Ringo 2H IP30: 1,068 Boe/d Golding 1H Armstrong 149 3H IP30: 637 Boe/d IP30: 823 Boe/d Red Crest 3H IP30: 938 Boe/d Big Chief 4802 2nd BS Shale IP30: 665 Boe/d Lynx 38N IP30: 1,147 Boe/d Centennial Acreage Indicates Centennial WellIndicates Offset Operator Well Indicates Offset Operator 2nd BS Shale Well (1)Maps include sampling of wells landed by Centennial in and around Centennial’s acreage for each respective zone. 43
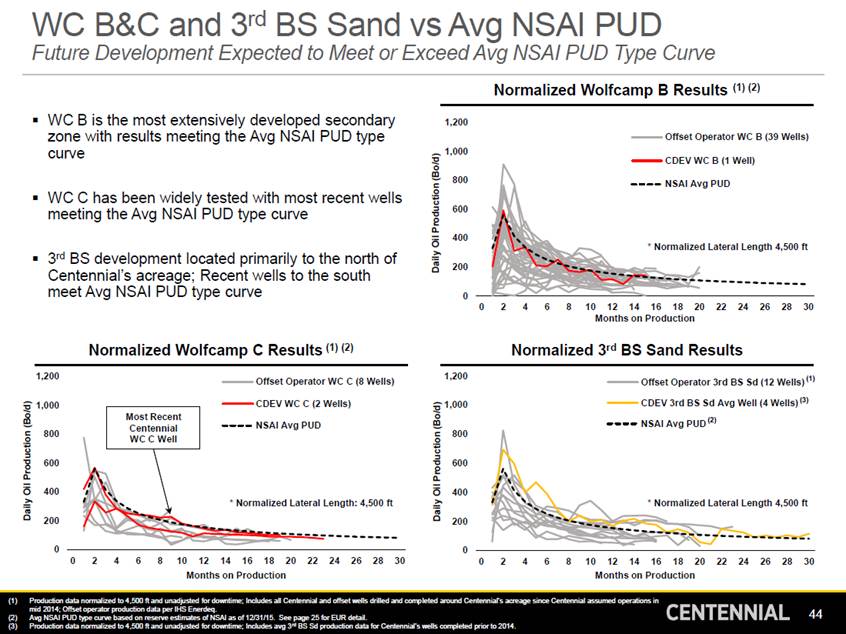
3rd WC B&C and BS Sand vs Avg NSAI PUD Future Development Expected to Meet or Exceed Avg NSAI PUD Type Curve Normalized Wolfcamp B Results (1) (2) WC B is the most extensively developed secondary zone with results meeting the Avg NSAI PUD type curve 1,200 Offset Operator WC B (39 Wells) 1,000 CDEV WC B (1 Well) 800 NSAI Avg PUD WC C has been widely tested with most recent wells meeting the Avg NSAI PUD type curve 600 400 * Normalized Lateral Length 4,500 ft 3rd BS development located primarily to the north of Centennial’s acreage; Recent wells to the south meet Avg NSAI PUD type curve 200 0 0 2 4 6 810 12 14 16 18 20 22 24 26 28 30 Months on Production Normalized Wolfcamp C Results (1) (2) Normalized 3rd BS Sand Results 1,200 1,200 Offset Operator 3rd BS Sd (12 Wells) (1) CDEV 3rd BS Sd Avg Well (4 Wells) (3) Offset Operator WC C (8 Wells) CDEV WC C (2 Wells) 1,000 1,000 (2) NSAI Avg PUD NSAI Avg PUD 800 800 600 600 400 400 * Normalized Lateral Length: 4,500 ft * Normalized Lateral Length 4,500 ft 200 200 0 0 0 2 4 6 810 12 14 16 18 20 22 24 26 28 30 Months on Production 0 2 4 6 810 12 14 16 18 20 22 24 26 28 30 Months on Production (1) Production data normalized to 4,500 ft and unadjusted for downtime; Includes all Centennial and offset wells drilled and comp leted around Centennial’s acreage since Centennial assumed operations in mid 2014; Offset operator production data per IHS Enerdeq. Avg NSAI PUD type curve based on reserve estimates of NSAI as of 12/31/15. See page 25 for EUR detail. Production data normalized to 4,500 ft and unadjusted for downtime; Includes avg 3rd BS Sd production data for Centennial’s wells completed prior to 2014. 44 (2) (3) Daily Oil Production (Bo/d) Daily Oil Production (Bo/d) Daily Oil Production (Bo/d) Most Recent Centennial WC C Well
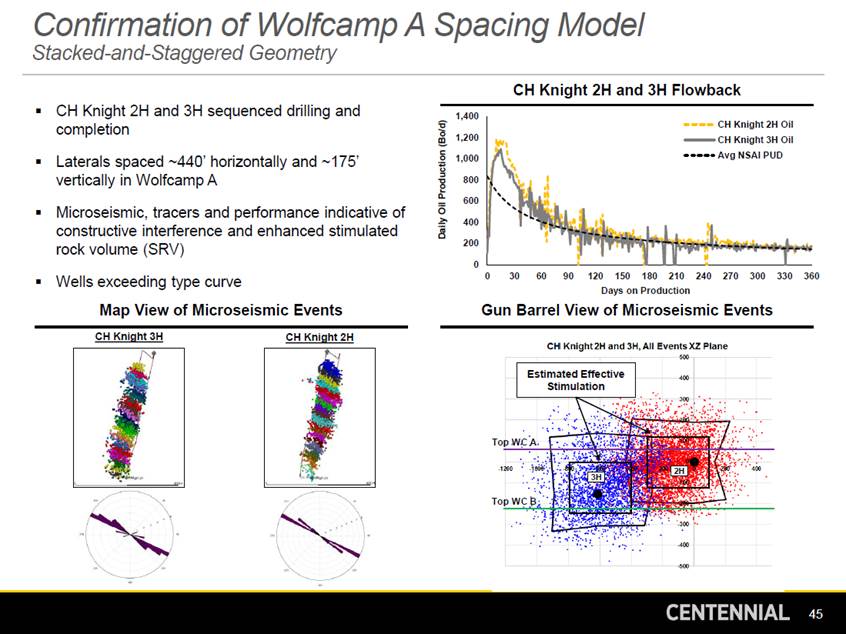
Confirmation of Wolfcamp Stacked-and-Staggered Geometry A Spacing Model CH Knight 2H and 3H Flowback CH Knight 2H and 3H sequenced drilling and completion 1,400 1,200 1,000 Laterals spaced ~440’ horizontally and ~175’ vertically in Wolfcamp A 800 600 Microseismic, tracers and performance indicative of constructive interference and enhanced stimulated rock volume (SRV) 400 200 0 0 30 60 90120 150 180 210 240 270 Days on Production 300 330 360 Wells exceeding type curve Map View of Microseismic Events Gun Barrel View of Microseismic Events CH Knight 3H CH Knight 2H Top WC A Top WC B 45 Daily Oil Production (Bo/d) 3H 2H Estimated Effective Stimulation CH Knight 2H Oil CH Knight 3H Oil Avg NSAI PUD
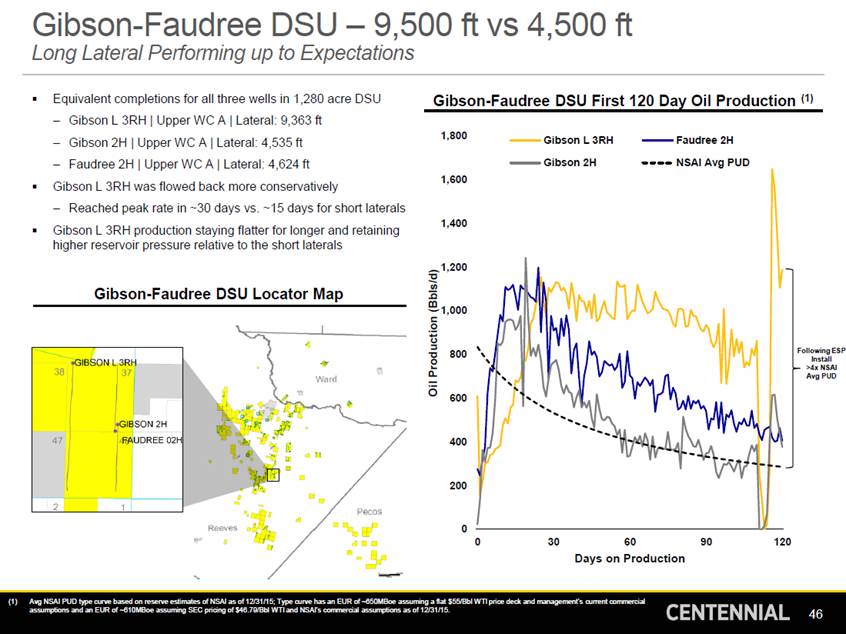
Gibson-Faudree DSU – 9,500 ft vs 4,500 ft Long Lateral Performing up to Expectations Equivalent completions for all three wells in 1,280 acre DSU Gibson-Faudree DSU First 120 Day Oil Production (1) – – – Gibson L 3RH | Upper WC A | Lateral: 9,363 ft Gibson 2H | Upper WC A | Lateral: 4,535 ft Faudree 2H | Upper WC A | Lateral: 4,624 ft 1,800 Gibson L 3RH Faudree 2H Gibson 2H NSAI Avg PUD 1,600 Gibson L 3RH was flowed back more conservatively – Reached peak rate in ~30 days vs. ~15 days for short laterals Gibson L 3RH production staying flatter for longer and retaining higher reservoir pressure relative to the short laterals 1,400 1,200 Gibson-Faudree DSU Locator Map 1,000 Following ESP Install >4x NSAI Avg PUD 800 600 400 200 0 0 30 60 Days on Production 90 120 (1)Avg NSAI PUD type curve based on reserve estimates of NSAI as of 12/31/15; Type curve has an EUR of ~650MBoe assuming a flat $55/Bbl WTI price deck and management’s current commercial assumptions and an EUR of ~610MBoe assuming SEC pricing of $46.79/Bbl WTI and NSAI’s commercial assumptions as of 12/31/15. 46 Oil Production (Bbls/d)
Future Potential Upside from Further Downspacing Operators Developing 8 Wells/Zone Spacing vs Centennial’s 6 Wells/Zone Offset Operators’ Downspacing Tests – 8 Wells/Zone Eland 660’ 660-880’ RSP Permian – 8 Wolfcamp Wells/Zone Energen – 8 Wolfcamp Wells/Zone Cimarex – 8 Wolfcamp Wells/Zone Source: Public operator slides per each companies recent investor relations presentation. 47 CVXOXY Reeves TXLZebra 660’660’ OXY 660’ OXY Gorilla OXY Jackal OXY OXY PeregrineEagleCXO <600’660-880’ Tycoon 700’ OXY Buzzard 800’ NBL Blackjack 660’

Delaware to Midland Stratigraphic Correlation Third Bone Spring Shale Stratigraphically Equivalent to Lower Spraberry Shale W E Delaware Basin Midland Basin Avalon Leonard Shale First Bone Spring Second Bone Spring Upper Second Bone Spring Lower Upper Spraberry Middle Spraberry Lower Spraberry Third Bone Spring Shale Lower Spraberry Shale Third Bone Spring Sand Dean Wolfcamp A Wolfcamp A Wolfcamp B Wolfcamp B Wolfcamp C Wolfcamp C E Wolfcamp D dland in 48 ~3,000 ft Cline CBP DelawareMi BasinBas W

Historical Financial Results D&C CAPEX ($MM) Daily Production (Boe/d) $ 325 7,317 7,212 % of Adj. EBITDAX 2014 2015 Q1 2016 2014 2015 Q1 2016 Adj. EBITDAX ($MM) (1) | WTI Oil Price ($/Bbl) Total Debt ($MM) | Debt / TTM Adj. EBITDAX (1) Adj. EBITDAX NYMEX WTI Oil Price Total Debt Debt / TTM Adj. EBITDAX $ 92.93 $ 88 $ 82 1.9x $ 142 $ 139 1.7x $ 130 2014 2015 Q1 2016 2014 2015 Q1 2016 (1)Please refer to the Appendix for a reconciliation of Adjusted EBITDAX to net (loss) income. 49 0.0x 1.5x 20142015Q1 201620142015Q1 2016 AAttCIPloOse $ 48.76 $ 15 $ 33.63 At Close: No debt, $100MM Cash and Undrawn ~$160MM RBL 369% $ 86 $ 16 104% 107% Cash Flow Effectively Funds D&C CAPEX 5,521

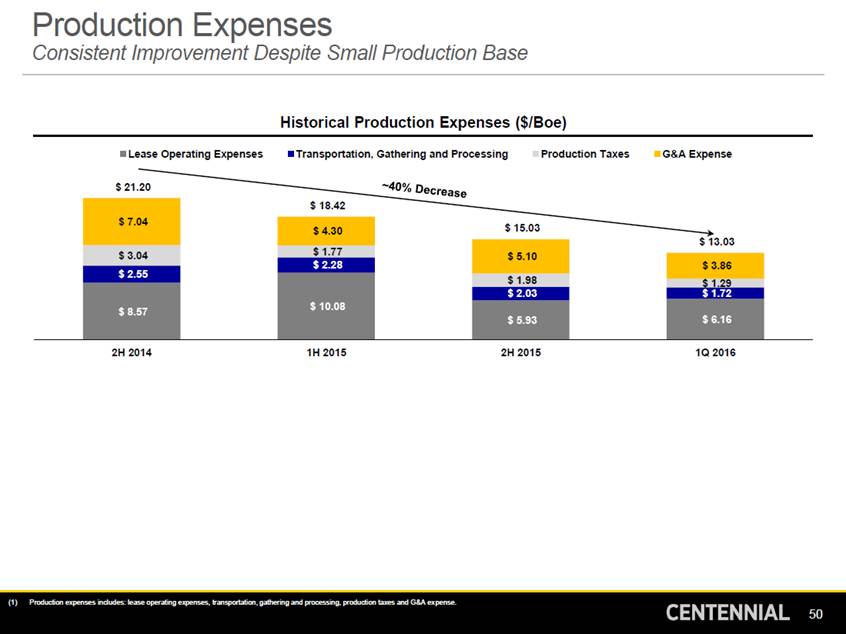
Production Expenses Consistent Improvement Despite Small Production Base Historical Production Expenses ($/Boe) Lease Operating Expenses Transportation, Gathering and Processing Production Taxes G&A Expense $ 21.20 2H 2014 1H 2015 2H 2015 1Q 2016 (1)Production expenses includes: lease operating expenses, transportation, gathering and processing, production taxes and G&A ex pense. 50 $ 7.04 $ 18.42 $ 4.30 $ 15.03 $ 5.10 $ 13.03 $ 3.04 $ 1.77 $ 3.86 $ 2.28 $ 2.55 $ 1.98 $ 10.08 $ 1.29 $ 8.57 $ 2.03 $ 1.72 $ 5.93 $ 6.16
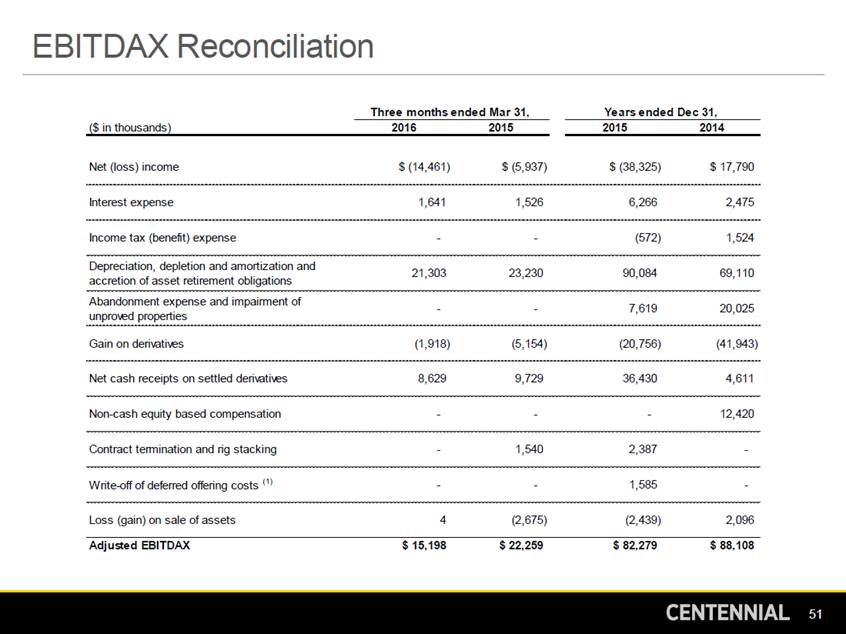
EBITDAX Reconciliation Three months ended Mar 31, Years ended Dec 31, ($ in thousands) 2016 2015 2015 2014 Net (loss) income $ (14,461) $ (5,937) $ (38,325) $ 17,790 Interest expense 1,641 1,526 6,266 2,475 Income tax (benefit) expense - - (572) 1,524 Depreciation, depletion and amortization and accretion of asset retirement obligations Abandonment expense and impairment of unproved properties 21,303 23,230 90,084 69,110 - - 7,619 20,025 Gain on derivatives (1,918) (5,154) (20,756) (41,943) Net cash receipts on settled derivatives 8,629 9,729 36,430 4,611 Non-cash equity based compensation - - - 12,420 Contract termination and rig stacking - 1,540 2,387 - Write-off of deferred offering costs (1) - - 1,585 - Loss (gain) on sale of assets 4 (2,675) (2,439) 2,096 Adjusted EBITDAX $ 15,198 $ 22,259 $ 82,279 $ 88,108 51
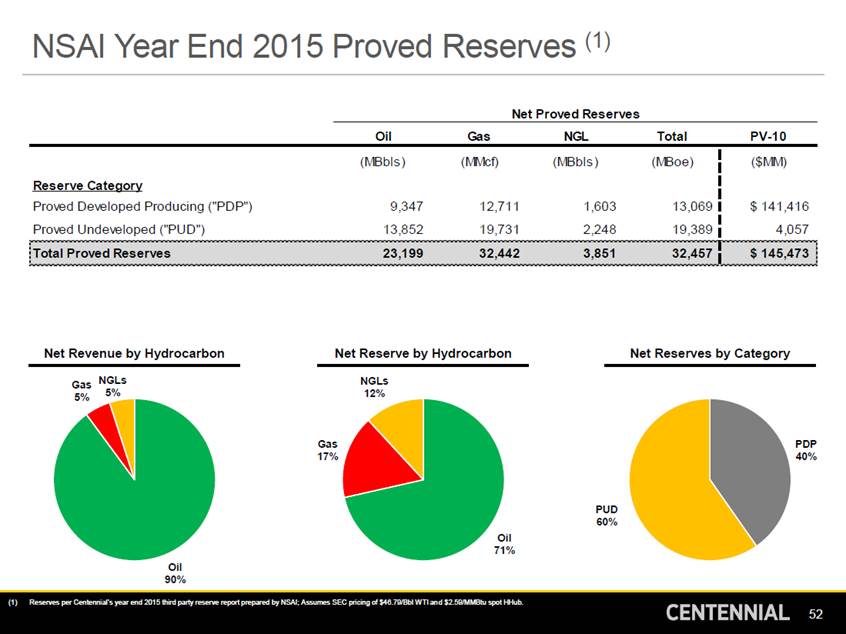
(1) NSAI Year End 2015 Proved Reserves Net Proved Reserves Oil Gas NGL Total PV-10 Net Revenue by Hydrocarbon Net Reserve by Hydrocarbon Net Reserves by Category NGLs 5% NGLs 12% Gas 5% Gas 17% PDP 40% PUD 60% Oil 71% Oil 90% (1)Reserves per Centennial’s year end 2015 third party reserve report prepared by NSAI; Assumes SEC pricing of $46.79/Bbl WTI an d $2.59/MMBtu spot HHub. 52 (MBbls )(MMcf)(MBbls )(MBoe) Reserve Category Proved Developed Producing ("PDP")9,34712,7111,60313,069 Proved Undeveloped ("PUD")13,85219,7312,24819,389 ($MM) $ 141,416 4,057 Total Proved Reserves23,19932,4423,85132,457 $ 145,473
