Attached files
| file | filename |
|---|---|
| EX-99.1 - EXHIBIT 99.1 - ATHENAHEALTH INC | athnq22016earningsreleasev2.htm |
| 8-K/A - 8-K/A - ATHENAHEALTH INC | athnq22016form8ka.htm |
Second Quarter Fiscal Year 2016 
Prepared Remarks July 21, 2016
Jonathan Bush, Chairman & Chief Executive Officer
Karl Stubelis, Senior Vice President, Chief Financial Officer
About These Remarks
The following commentary is provided by management in conjunction with the second quarter fiscal year 2016 earnings press release issued by athenahealth, Inc. (“athenahealth” or “we”). These remarks represent management’s current views on our financial and operational performance and are provided to give investors and analysts more time to analyze and understand our performance in advance of the earnings conference call. These prepared remarks will not be read on the conference call. A complete reconciliation between generally accepted accounting principles (“GAAP”) and non-GAAP results, as well as a summary of supplemental metrics and definitions, is provided in the tables following these prepared remarks.
Earnings Conference Call Information
To participate in our live conference call and webcast, please dial 877-853-5645 (or 408-940-3868 for international calls) using conference code no. 35279580, or visit the Investors section of our website at www.athenahealth.com. A replay will be available for one week following the conference call at 855-859-2056 (and 404-537-3406 for international calls) using conference code no. 35279580. A webcast replay will also be archived on our website.
Safe Harbor and Forward-Looking Statements
These remarks contain forward-looking statements within the meaning of Section 27A of the Securities Act of 1933, as amended, and Section 21E of the Securities Exchange Act of 1934, as amended, including statements regarding management’s expectations for future financial and operational performance and operational expenditures, expected growth, and business outlook, including fiscal 2016 guidance; statements regarding our focus on leveraging our network to drive growth, broaden and deepen our services and build deeper and more strategic connections in the healthcare industry; statements regarding the strength of the drivers of our long-term success; statements regarding our ability to achieve full year PQRS goals; statements regarding improvement of our portal experience and adoption, and patient engagement; statements regarding improving our net promoter score; statements regarding the appropriate future metrics to use in measuring our market share; statements regarding the benefits of and demand for our service offerings, including our newer service offerings and timing of the availability of and transition to these newer offerings, including athenaClinicals Streamlined; statements regarding the potential expansion and value of our network and progress towards building the healthcare information backbone; investments in disruptive innovation and emerging services and the expected long-term value creation from our investments; developments and plans for inpatient service offerings and positioning to serve the hospital and health system market, including the expansion of services to support the acute care market by leveraging our More Disruption Please program; the timing and impact of expansion of our client base outside the traditional ambulatory market; the impact of acquisitions; and statements found under our “Reconciliation of Non-GAAP Financial Measures to Comparable GAAP Measures” and “Reconciliation of Non-GAAP Financial Measures to Comparable GAAP Measures for Fiscal Year 2016 Guidance” sections of these remarks. Forward-looking statements may be identified with words such as “will,” “may,” “expect,” “plan,” “anticipate,” “upcoming,” “believe,” “expect,” or similar terminology, and the negative of these terms. Forward-looking statements are not promises or guarantees of future performance, and are subject to a variety of risks and uncertainties, many of which are beyond our
1
control, which could cause actual results to differ materially from those contemplated in these forward-looking statements. These risks and uncertainties include: our highly competitive industry and our ability to compete effectively and remain innovative; the development of the market for cloud-based healthcare information technology services; changes in the healthcare industry and their impact on the demand for our services; our ability to effectively manage our growth; our ability to protect our intellectual property; current and future litigation, including for intellectual property infringement; our dependence on third-party providers; risks and costs associated with our worldwide operations; our ability to attract and retain highly skilled employees; our fluctuating operating results; our ability to retain our clients and maintain client revenue; our tax liability; our variable sales and implementation cycles; the timing at which we recognize certain revenue and our ability to evaluate our prospects; defects and errors in our software or services, or interruptions or damages to our systems or those of third parties on which we rely; a data security breach; limitations on our use of data; the effect of payer and provider conduct; the failure of our services to provide accurate and timely information; increasing government regulation and the costs and challenges of compliance; the potential for illegal behavior by employees or subcontractors; and the price volatility of our common stock. Forward-looking statements speak only as of the date hereof and, except as required by law, we undertake no obligation to update or revise these forward-looking statements. For additional information regarding these and other risks faced by us, refer to our public filings with the Securities and Exchange Commission (“SEC”), available on the Investors section of our website at www.athenahealth.com and on the SEC’s website at www.sec.gov.
Use of Non-GAAP Financial Measures
These remarks contain non-GAAP financial measures, as defined by SEC Regulation G. The GAAP financial measure most directly comparable to each non-GAAP financial measure used or discussed, and a reconciliation of the differences between each non-GAAP financial measure and the comparable GAAP financial measure, are included following these prepared remarks and can be found within our second quarter fiscal year 2016 earnings press release in the Investors section of our website at www.athenahealth.com.
Opening Remarks
We are well on our way towards building the healthcare internet and using the power of our network to “unbreak healthcare”. We are leveraging our network as never before with the launch of athenaInsight, a new editorial online publication that offers valuable network insight into what is happening in healthcare today. Our vast and connected network has grown to over 80,000 providers, over 81 million unique patient records, and over 131,000 endpoints that exchange information across the network. We will continue to utilize our network to drive growth, broaden and deepen our services, and build deeper and more strategic connections in the healthcare industry.
Highlights from Q2 2016 include the following:
• | Grew consolidated revenue by 17% over Q2 2015 |
• | Delivered Non-GAAP Adjusted Gross Margin of 62.8%, down from 63.3% in Q2 2015 |
• | Delivered GAAP Operating Loss Margin of 0.5%, compared to 1.0% in Q2 2015 |
• | Delivered Non-GAAP Adjusted Operating Income Margin of 9.2%, down from 9.9% in Q2 2015 |
• | Grew net new active physicians on athenaCollector® (1,528 physicians added), athenaClinicals (1,180 physicians added), and athenaCommunicator® (1,489 physicians added) in Q2 2016, compared to athenaCollector (2,114 physicians added), athenaClinicals (1,127 physicians added), and athenaCommunicator (1,670 physicians added) in Q2 2015 |
2
◦ | Grew athenaCollector physicians by 19%, athenaClinicals physicians by 31%, and athenaCommunicator physicians by 24% over Q2 2015, representing continued strong network growth in 2016 |
• | Grew net new active providers on athenaCollector (2,215 providers added), athenaClinicals (1,632 providers added), and athenaCommunicator (1,967 providers added) in Q2 2016, compared to athenaCollector (2,882 providers added), athenaClinicals (1,475 providers added), and athenaCommunicator (2,132 providers added) in Q2 2015 |
◦ | Grew athenaCollector providers by 19%, athenaClinicals providers by 31%, and athenaCommunicator providers by 25% over Q2 2015, representing continued strong network growth in 2016 |
• | Continued the implementation waves at NewYork-Presbyterian Medical Groups (athenaOne) and brought the first implementation wave live at Adventist Health (athenaOne) |
• | Released our annual PayerView® ReportTM, a data-driven review of the performance of the largest payers on athenaNet, which highlighted Cigna as earning the number one ranking in the 2016 PayerView Report |
• | Published our first athenaCollector for Hospitals & Health Systems case studies profiling Mount Grant General Hospital’s record-setting revenue performance and improved staff efficiency and Faith Community Hospital’s improved cash flow, cleaner claims, and improved staff efficiency |
• | Launched our new brand promise, “Unbreak Healthcare”, which aligns directly with our mission to make healthcare work as it should and reflects our maniacal drive to fix what is broken with healthcare |
• | Launched athenaInsight, our new editorial online publication that offers valuable insight into what is happening in healthcare. For more information, please visit https://insight.athenahealth.com. |
• | Hosted our 3rd annual MDP Hill Day, bringing together CEOs from 25 of the most innovative healthcare IT companies to meet with Congressional staff on the Hill |
Results Overview
athenahealth’s top line results for the second quarter of fiscal year (“FY”) 2016 reflect solid revenue growth:
• | Total revenue: |
◦ | $261.9 million in Q2 2016, representing 17% growth over $224.7 million in Q2 2015 |
◦ | $518.1 million for the six months ending June 30, 2016, representing 20% growth over $431.1 million in the same period last year |
Our bottom line results for Q2 2016, consistent with our growth strategy, demonstrate deliberate sales, marketing, and research and development investments, and a focus on operating efficiencies:
• | Non-GAAP Adjusted Gross Profit and Margin: |
◦ | $164.5 million, or 62.8% of total revenue, in Q2 2016, an increase of 16% over $142.1 million, or 63.3% of total revenue, in Q2 2015 |
• | GAAP Selling and Marketing expense: |
◦ | $65.9 million, or 25.2% of total revenue, in Q2 2016, an increase of 21% over $54.4 million, or 24.2% of total revenue, in Q2 2015 |
• | GAAP Research and Development expense: |
3
◦ | $23.6 million, or 9.0% of total revenue, in Q2 2016, a decrease of 3% from $24.4 million, or 10.9% of total revenue, in Q2 2015 |
• | GAAP General and Administrative expense: |
◦ | $41.3 million, or 15.8% of total revenue, in Q2 2016, an increase of 14% from $36.1 million, or 16.1% of total revenue, in Q2 2015 |
• | GAAP Operating Loss and Margin: |
◦ | $1.3 million, or 0.5% of total revenue, in Q2 2016, compared to $2.2 million, or 1.0% of total revenue, in Q2 2015 |
• | Non-GAAP Adjusted Operating Income and Margin: |
◦ | $24.1 million, or 9.2% of total revenue, in Q2 2016, an increase of 9% from $22.2 million, or 9.9% of total revenue, in Q2 2015 |
• | GAAP Net (Loss) Income: |
◦ | $(1.9) million, or $(0.05) per diluted share, in Q2 2016, compared to $9.3 million, or $0.24 per diluted share, in Q2 2015 |
• | Non-GAAP Adjusted Net Income: |
◦ | $13.5 million, or $0.34 per diluted share, in Q2 2016, an increase of 9% from $12.4 million, or $0.32 per diluted share, in Q2 2015 |
We measure our performance based on a balanced scorecard model. We believe that this framework is an excellent report card for our performance for the current year and that it measures the key performance indicators required for long-term success. For 2016, we have developed a more streamlined and more heavily weighted scorecard focused on eight key stability, performance, satisfaction, and financial metrics. The table below shows the scorecard results for Q1 2016, Q2 2016, and year-to-date Q2 2016. Please reference the last page of this document for definitions of our corporate scorecard metrics.
4
athenahealth 2016 Corporate Scorecard
Q1 2016 Results | Q2 2016 Results | YTD 2016 Results | |||||||
Stability (10% weight) | |||||||||
Voluntary Turnover | 2.4 | % | 3.8 | % | 6.2 | % | |||
Employee Engagement | (a) | 4.2 | 4.2 | ||||||
Stability Results | 113 | % | 61 | % | 87 | % | |||
Performance (40% weight) | |||||||||
athenaCollector Composite | 103.1 | % | 100.7 | % | 101.9 | % | |||
athenaClinicals Composite | 89.1 | % | 98.0 | % | 99.2 | % | |||
athenaCommunicator Composite | 96.8 | % | 96.9 | % | 96.9 | % | |||
athenaCoordinator Composite | 108.0 | % | 109.8 | % | 108.9 | % | |||
Epocrates Composite | 100.7 | % | 102.2 | % | 101.5 | % | |||
Performance Results | 98 | % | 100 | % | 101 | % | |||
Satisfaction (15% weight) | |||||||||
Net Promoter Score | 34.0 | 29.3 | 31.6 | ||||||
Satisfaction Results | 77 | % | 67 | % | 72 | % | |||
Financial (35% weight) | |||||||||
Bookings (b) | (b) | (b) | (b) | ||||||
Non-GAAP Adjusted Operating Income ($M) | $ | 24.2 | $ | 24.1 | $ | 48.3 | |||
Financial Results | 96 | % | 97 | % | 95 | % | |||
Total Results | 96 | % | 90 | % | 93 | % | |||
(a) | Employee Engagement survey result reported in Q2 and Q4 only. |
(b) | Since the bookings metric contains highly sensitive data, we do not disclose all of the specific performance measures and targets, because we believe that such disclosure would result in serious competitive harm. |
We believe that our underlying drivers of long-term success remain relatively strong as supported by the following metric results:
• | Voluntary Turnover of 3.8% in Q2 2016, unfavorable to our goal of 2.8%. Year-to-date, Voluntary Turnover is 6.2% versus our goal of 5.5%. We closely track employee retention metrics and monitor employee engagement via our semi-annual engagement surveys. We continue to focus on programs that attract and develop top talent across all of our locations. |
• | Employee Engagement of 4.2 in Q2 2016, slightly below our goal of 4.3. We have a number of initiatives underway focused on our culture and employee engagement. In addition, we are in process of hiring a Chief Human Resources Officer to our leadership team and will have a dedicated leader focused on athenahealth culture and employee engagement. |
• | athenaCollector Composite result of 100.7%, driven by strong performance in the Time of Service “TOS” Collection Rate metric, mainly attributable to the introduction of our new TOS workflow in Q4 2015. |
• | athenaClinicals Composite result of 98.0%, driven by slightly lower than expected 2016 Physician Quality Reporting System (“PQRS”) results and slightly higher than expected After Hours Physician Documentation Time. We made significant progress in our PQRS metric |
5
performance in the second quarter and we remain confident in our ability to achieve our full year PQRS goals. Also, we expect to improve the After Hours Physician Documentation Time metric as we continue to transition the entire athenaClinicals client base to the Streamlined experience during 2016.
• | athenaCommunicator Composite result of 96.9%, driven by slightly lower than expected Portal Adoption and Portal Engagement Rate metric results. We remain focused on improving our patient portal and broader patient communication strategies in order to improve portal experience and increase portal adoption and patient engagement over time. |
• | athenaCoordinator Composite result of 109.8%, driven by strong performance in the Coordinated Patient Rate metric, resulting from the growth in the amount of activity associated with chart sharing between athenaNet and third party vendors. |
• | Epocrates Composite result was 102.2% as the 90 Day Active Doc Engagement rate metric result was in line with our goal. |
• | Net Promoter Score of 29.3 in Q2 2016, versus goal of 44.0 and 34.0 in Q1 2016. We regularly solicit client feedback and we take it seriously. We have a number of initiatives underway that we believe will improve our net promoter score over the long run. First, we have product leaders focused solely on improving service delivery and performance. Second, we are reducing the number of releases that impact client workflows to three times a year. Finally, we are migrating the entire client base to athenaClinicals Streamlined. |
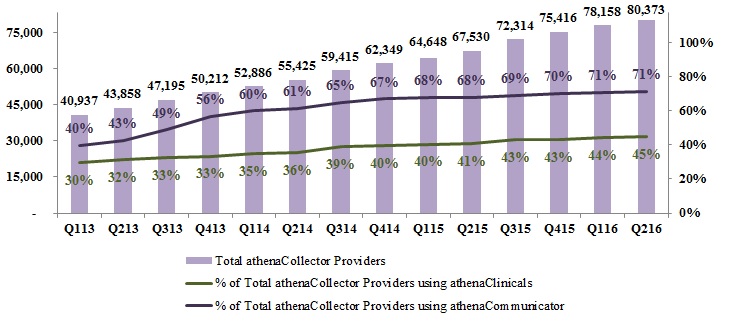
athenahealth’s client base continues to expand while client adoption of other services in the athenahealth service suite grows. As our client base expands outside the traditional ambulatory market, we believe that total active providers, receiver nodes, and eventually covered lives, total managed lives, and discharge bed days managed by or transacted across our network will become more appropriate metrics to use in measuring our market share. During Q2 2016:
• | 78% of all new athenaCollector deals included athenaClinicals, compared to 81% in Q2 2015 |
• | 76% of all new athenaCollector deals included athenaClinicals, athenaCommunicator and athenaCoordinator, compared to 78% in Q2 2015. |
• | 47% of total athenaCollector physicians have adopted athenaClinicals, up from 43% in Q2 2015 |
• | 75% of total athenaCollector physicians have adopted athenaCommunicator, up from 72% in Q2 2015 |
• | Net new physicians and providers added sequentially to the network were as follows: |
athenaCollector | athenaClinicals | athenaCommunicator | ||||||||||||
Active physicians and providers: | Physicians | Providers | Physicians | Providers | Physicians | Providers | ||||||||
Beginning balance as of 3/31/16 | 57,093 | 78,158 | 26,169 | 34,576 | 42,278 | 55,244 | ||||||||
Net new additions | 1,528 | 2,215 | 1,180 | 1,632 | 1,489 | 1,967 | ||||||||
Ending balance as of 6/30/16 | 58,621 | 80,373 | 27,349 | 36,208 | 43,767 | 57,211 | ||||||||
Sequential growth % | 3 | % | 3 | % | 5 | % | 5 | % | 4 | % | 4 | % | ||
6
• | Net new physicians and providers added to the network since Q2 2015 were as follows: |
athenaCollector | athenaClinicals | athenaCommunicator | ||||||||||||
Active physicians and providers: | Physicians | Providers | Physicians | Providers | Physicians | Providers | ||||||||
Beginning balance as of 6/30/15 | 49,176 | 67,530 | 20,923 | 27,641 | 35,248 | 45,902 | ||||||||
Net new additions | 9,445 | 12,843 | 6,426 | 8,567 | 8,519 | 11,309 | ||||||||
Ending balance as of 6/30/16 | 58,621 | 80,373 | 27,349 | 36,208 | 43,767 | 57,211 | ||||||||
Y/Y growth % | 19 | % | 19 | % | 31 | % | 31 | % | 24 | % | 25 | % | ||
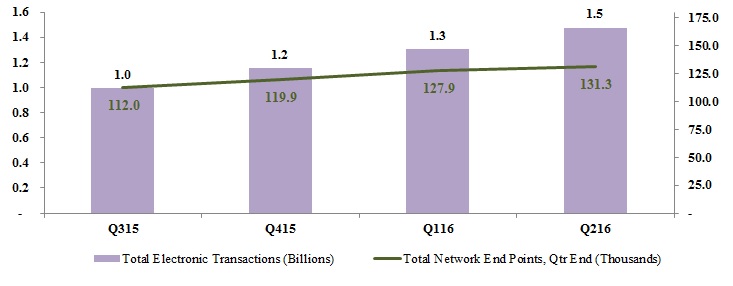
• | Over 3,300 network end points were added to the network in Q2 2016, bringing our total network end points to over 131,000 as of June 30, 2016 |
Revenue Discussion
Q2 2016 revenue was $262.0 million and grew by 17% (or $37.2 million) over Q2 2015. Revenue for the six months ended June 30, 2016 was $518.1 million and grew by 20% (or $87.0 million) over the same period last year.
Q2 2016 | Q2 2015 | Y/Y Growth% | ||
Business Services | $254.1 | $215.4 | 18 | % |
Implementation and other | $7.9 | $9.3 | (15 | )% |
Consolidated Revenue | $262.0 | $224.7 | 17 | % |
YTD Q2 2016 | YTD Q2 2015 | Y/Y Growth% | ||
Business Services | $501.6 | $413.1 | 21 | % |
Implementation and other | $16.5 | $18.0 | (8 | )% |
Consolidated Revenue | $518.1 | $431.1 | 20 | % |
In terms of trends in our recurring revenue base, same-store analysis of claims created—a proxy for physician office utilization—indicates that physician office activity in Q2 2016 increased slightly over physician office activity during Q2 2015 but was relatively flat to physician office activity in Q1 2016.
This is consistent with prior year trends as we typically see a seasonal drop in claims from Q1 to Q2.
Non-GAAP Adjusted Gross Margin Discussion
Our Non-GAAP Adjusted Gross Margin was 62.8% for Q2 2016, down approximately 50 basis points from 63.3% in Q2 2015. As planned, we continue to invest in our go-live support, client support center, and emerging services personnel to support the growth of our core and emerging services. One of our goals is to improve gross margin on a service-line basis each year. As previously discussed, the expansion of our newer service offerings, such as athenaOne for Hospitals and Health Systems, is expected to serve as a headwind to total company margin expansion until these newer services become more automated and scalable. Our fiscal year 2016 Non-GAAP Adjusted Gross Margin guidance range remains at 63.5% to 64.5% and we expect to be at or above the mid-point of this guidance range.
Balance Sheet and Cash Flow Highlights
As of June 30, 2016, we had cash and cash equivalents of $134.3 million and outstanding indebtedness of $296.3 million. Operating cash flow increased by $7.4 million from net cash provided by operating activities of $74.6 million for the six months ended June 30, 2015, to net cash provided by operating activities of $82.0 million for the six months ended June 30, 2016.
7
Fiscal Year 2016 Outlook
We communicated our fiscal year 2016 guidance on December 10, 2015 at our 8th Annual Investor Summit. Our fiscal year 2016 guidance is summarized in the following table:
For the Fiscal Year Ending December 31, 2016 | |
Forward-Looking Guidance1 | |
GAAP Total Revenue | $1,085 - $1,115 million |
Non-GAAP Adjusted Gross Margin | 63.5% - 64.5% |
Non-GAAP Adjusted Operating Income | $120 - $135 million |
Non-GAAP Adjusted Net Income per Diluted Share | $1.65 - $1.85 |
Non-GAAP Tax Rate | 40% |
We are not making any changes to the fiscal year 2016 guidance we communicated on December 10, 2015 at our 8th Annual Investor Summit. However, based on our year-to-date performance that was in line with our internal financial goals and our current expectations for the second half of 2016, we are providing additional insight into our fiscal year 2016 guidance as follows:
• | We expect GAAP Total Revenue to be at or above the mid-point of the $1,085 million to $1,115 million guidance range. |
• | We expect Non-GAAP Adjusted Gross Margin to be at or above the mid-point of the 63.5% to 64.5% guidance range. |
• | We expect Non-GAAP Adjusted Operating Income to be at or above the mid-point of the $120 million to $135 million guidance range. |
• | Finally, we expect Non-GAAP Adjusted Net Income per Diluted Share to be at or above the mid-point of the $1.65 to $1.85 guidance range. |
1 We release annual guidance once per year at our annual investor summit. Recently, the U.S. Securities and Exchange Commission staff issued updates to its Compliance and Disclosure Interpretations regarding the use of non-GAAP financial measures. However, we believe that revising this table mid-year during 2016 to present the GAAP equivalent may confuse the investment community. As a result, we plan to present both the non-GAAP financial measure and the applicable GAAP financial measure in this table beginning with the release of our fiscal year 2017 guidance.
Service Development Discussion
Service development at athenahealth is organized around our mission to be healthcare providers’ most trusted service, helping them do well by doing the right thing. In order to fulfill this mission, we deliver services backed by our network, knowledge, and back-office work. We deliver network-enabled services for revenue cycle and practice management, electronic health records, patient engagement, patient access, care coordination, order transmission, population health management, and clinical decision support.
athenahealth-branded and Epocrates-branded service offerings
The following suite of network-enabled services connects our clients to financial results, clinical outcomes, patients, and the broader care continuum:
8
athenaCollector is our network-enabled revenue cycle and practice management service, which became generally available in 2000. Through this service, athenahealth helps to reduce administrative work and enables clients to improve performance and efficiency under reimbursement models, including Pay-for-Performance. athenaCollector is offered as a stand-alone solution for revenue cycle and practice management and athenaCollector for Hospitals and Health Systems is offered as a stand-alone revenue cycle solution for hospital clients. In addition, our revenue cycle services are also integrated with more comprehensive offerings: athenaOne and athenaOne for Hospitals and Health Systems, respectively.
athenaClinicals is our network-enabled electronic health record (“EHR”) service designed to make the documentation and exchange of health information easier by centering the workflow around the patient visit. athenaClinicals encourages delegation by intelligently surfacing relevant clinical content based on physician behavior across the network, and helps with tedious administrative work associated with managing orders and results. It entered general availability in 2006 and was made available as a stand-alone service in 2010. athenahealth also offers an EHR service to clients who provide care in the acute care setting - athenaClinicals for Hospitals and Health Systems - which transforms the core athenaClinicals services so that they are appropriate for the additional requirements of a non-ambulatory setting. Both athenaClinicals and athenaClinicals for Hospitals and Health Systems are also offered as part of comprehensive solutions: athenaOne and athenaOne for Hospitals and Health Systems, respectively.
athenaCommunicator is our network-enabled patient engagement and communication service. It entered general availability in 2010 and continues to help providers deepen their relationships with their patients. This service offers a unique approach to patient communication by combining web-based automated messaging and patient portal with the ability to speak to live operators for patients who receive specific call types. Clients who also use athenaClinicals can choose to allow their patients to view specific portions of their medical record via the patient portal.
athenahealth Population Health (formerly athenaCommunicator Enterprise) is our network-enabled population health management service. This comprehensive, network-enabled service combines software and analytics to execute, track, and coordinate care across a provider’s network. After clients transfer data from payers, finance systems, laboratories, clinical repositories, and/or EHRs, athenahealth Population Health processes and integrates that data and provides a platform through which clients can glean important insight into and manage the health of their patient population. athenahealth began offering population health management services in 2012 after the acquisition of Healthcare Data Services LLC. Effective 2016, this service has been rebranded as athenahealth Population Health.
athenaCoordinator is our EHR-agnostic, network-enabled order transmission service, which entered general availability in 2012. While most clients who use athenaClinicals are included in the receiver network, athenaCoordinator clients also include stand-alone facilities that receive orders via a “lite” portal to streamline receipt from their senders.
athenaCoordinator Enterprise is our network-enabled care coordination, patient access, and order transmission service. This service was first offered by athenahealth in 2011 after the acquisition of Proxsys, LLC. athenaCoordinator Enterprise is targeted at health systems navigating the difficult and costly work associated with coordinating care among multiple providers and trading partners in order to manage diverse populations of patients. This service enables smooth transitions in care, with direct scheduling across the client’s organization and secure mobile and desktop messaging for provider collaboration.
Epocrates-branded services center around a variety of clinical information and decision support offerings available through healthcare providers’ mobile devices. These services include: drug and disease information, medical calculator and tools, clinical guidelines, clinical messaging, virtual representative services, market research, and formulary hosting. The Epocrates network of members consists of over one million healthcare professionals, including approximately 50% of U.S. physicians. The features available through our Epocrates application help healthcare professionals make more informed prescribing
9
decisions, improve workflow, and enhance patient safety. athenahealth acquired Epocrates on March 12, 2013.
Connecting to financial results:
Our athenaCollector service enables clients to secure full payment faster, reduce administrative drag and cost, and stay current with industry change. Our clients gain greater control over their financial results with our unique rules engine, hands-on performance coaching, and comprehensive back-office services that include claim submission and denial management. The evolving healthcare reimbursement landscape and the shift of financial responsibility to the patient has made our ability to improve patient pay education and the overall patient pay experience even more critical to practice collections. The importance of these areas of focus was validated by a recent peer60 report titled “Healthcare Revenue Cycle Management: 2015”. According to this report, providers want to see revenue cycle management vendors address the issues surrounding improved patient experience, increased point-of-service collections, and better care coordination. We remain committed to investing in our athenaCollector service in order to deliver an ever-better patient experience, particularly around patient pay. The recent release of our new tools such as the Time of Service (“TOS”) workflow and the QuickPay Portal, coupled with our redesigned and easier to understand patient statements, aim to improve practice collections and the patient pay experience. In addition to helping patients better understand their financial responsibility, the flexibility offered by our QuickPay Portal allows them a quick and alternative way to pay their balances online. Our ability to introduce new workflows and tool sets that effectively improve client performance is evidenced by the measurable increase in payment yield when patients understand what they owe. For additional performance insight on patient pay best practices, please see “Patient Pay: Discovering the Best Ways to Collect” ebook on our new athenaInsight website (https://insight.athenahealth.com).
Connecting to clinical outcomes:
Our athenaClinicals service helps providers deliver high quality care by organizing the moment of care for maximum clinical productivity and reimbursement. The launch of the athenaClinicals Streamlined experience enhances our industry-leading, network-driven electronic health record service by radically improving the provider experience. Streamlined centers the encounter around the patient, improves the amount and ease of delegating work away from the physicians, allows the physicians to document as they would communicate, and includes a variety of accelerators to speed documentation of the patient story. The release of Streamlined to our existing clients continues to progress well with nearly 40% of client accounts transitioned as of Q2 2016. Client performance on Streamlined continues to trend positively as evidenced by an average 10% increase in Same Day Encounter Close Rate and an average 22% decline in Post-Visit Documentation Rate, compared to historical controls. Also of note, performance of new clients on Streamlined is even better than existing clients as demonstrated by an average 13% increase in Same Day Encounter Close Rate and an average 24% decline in Post-Visit Documentation Rate, compared to historical controls. This means that all providers on Streamlined, both new and existing, are not only more efficient documenting the patient visit but are spending less time documenting the patient visit after hours.
While new clients love Streamlined, we have heard from a small minority of existing athenaClinicals clients that they prefer our old workflow. We are working with them closely to understand their pain points and to determine how to course-correct. A number of initiatives are underway to help our clients successfully transition to Streamlined, including provider coaching, the rollout of new, specialty-specific functionality, and improvements to our release process. As we continue down the path of transitioning our existing athenaClinicals client base to Streamlined, we remain keenly focused on eliminating unnecessary friction and delivering the best experience for our entire client base.
10
Connecting to patients:
Patient engagement, defined as the active collaboration between patients and providers, is key to driving patient satisfaction and delivering quality care. Studies show that unengaged patients are three-times more likely to have unmet medical needs and two-times more likely to defer care. We remain committed to helping our clients improve patient engagement as proven by the recent launch of our patient satisfaction survey functionality. Leveraging our MDP Program, we worked with MedStatix, an MDP Marketplace partner since late 2015, to integrate light weight patient satisfaction capabilities into our athenaCommunicator service offering. Through this partnership with MedStatix, we now have baseline patient satisfaction metrics and more visibility into patient satisfaction trends. athenahealth’s ability to monitor and measure the patient experience across our network provides us with real-time network insights allowing us to further improve patient engagement and satisfaction. We expect that this unparalleled network insight will improve as our network grows. For example, we added nearly 1.2 million registered patients to our athenaCommunicator platform in the second quarter, bringing our total registered patients to over 12 million. Our patient portal adoption rate is now 30.8%, up from 28.6% in Q2 2015 and up from 30.3% in Q1 2016. We hold ourselves accountable for driving our network’s adoption rate because we believe higher levels of adoption not only improve patient engagement and patient satisfaction, but also clinical outcomes.
Connecting to the care continuum:
We are committed to building the most connected network in healthcare and to driving meaningful, measurable results for everyone on our network. As the first industrial strength internet company in healthcare, we continue to add both breadth and depth to our network. Today, we have over 81 million unique patient records and support the medical operations of over 80,000 providers. In Q2 2016 alone, we exchanged nearly 1.5 billion electronic transactions across over 131 thousand network end points, representing 55% growth from the nearly one billion electronic transactions exchanged in Q2 2015. Our athenaCoordinator service is key to achieving our vision of building the healthcare internet. athenaCoordinator is helping us to tap into historically closed health information technology systems so that we can follow patients as they move through more complex care settings. As of the second quarter of 2016, we have successfully integrated athenaNet with the inpatient vendor at several strategic client sites and are in the process of replicating this integration success at other enterprise client sites. This work provides the ambulatory providers with a complete and integrated picture of the patient across both the ambulatory and acute care settings. For example, the types of patient clinical information that we can successfully pull from the acute care setting into athenaClinicals includes discharge instructions, progress notes, diagnostic results, and hospital and discharge medications. In addition to providing a much richer picture of patient care inside of athenaClinicals, this integration work also significantly improves physician workflows and patient care transitions. The athenaClinicals providers can now better manage the transition of care for their patients back into the ambulatory setting without ever having to leave athenaNet. While we are excited about the progress we are making, it is just one more step in our journey to build the most connected network in healthcare. Stay tuned for more progress updates and integration success stories.
11
athenaCoordinator Network Growth
The emerging services division continues to make leaps forward in transforming athenahealth into a continuum of care company. We are focused on using our network, knowledge, and work to bring disruptive business model transformation to hospitals and health systems. We continue to gain tremendous momentum in the under 50 bed market and are ahead of our growth goals mid-way through the year. In less than a year since launching our athenaOne for Hospitals and Health Systems service, we have grown our contracted hospital client base by nearly 200%, from approximately 25 hospitals in the acquired base to approximately 80 hospitals as of Q2 2016. This success in the hospital and health system market has been highlighted in a recent KLAS report “2016 Hospital EMR Market Share: Significant EMR Decisions Energize U.S. Market”. This KLAS report notes that in 2015 the number of acute care EMR purchasing decisions made in the United States increased to levels not seen since the inception of Meaningful Use. Over 490 acute care hospitals were involved in a contract decision of some kind - representing an increase of almost 200% over 2014. KLAS examined these new organization-wide decisions, add-ons, consolidations, and migrations in order to provide an overview of the hospital EMR market share changes that took place in 2015 and highlight the vendors that are gaining momentum. This KLAS report notes that athenahealth is one of the vendors gaining momentum - athenahealth saw the 3rd largest net increase in new acute hospital wins. We believe this is noteworthy considering our short tenure in the hospital market. We strongly believe that the future of the hospital is the network and we are bringing the power of our network-enabled services to the hospital and health system market. While we are proud of the progress we have made to date in building out our inpatient business, we are most proud of the operational and financial support we are delivering for our clients. Mount Grant General Hospital, an approved National Health Service Corps Critical Access Hospital and Rural Health Clinic located in Hawthorne, Nevada, is one of several of our early success stories. Mount Grant General Hospital was our first client to go live on our athenaCollector for Hospitals and Health Systems service. Within a few months, Mount Grant General Hospital set new records for revenue. In the past 30 years, there was only one month that Mount Grant General Hospital collected one million dollars of revenue. In the first weeks after go-live, Mount Grant General Hospital started to average revenue of almost $900,000 per month and had two “million dollar months”. In addition to improving the hospital’s cash flow, athenahealth has helped wick away administrative work, provide access to critical financial reports, and improve staff efficiency. Our network-enabled services have also significantly improved the financial health at Faith Community Hospital, a 41-bed Level IV Trauma Center and rural health clinic in Jacksboro, Texas. Within weeks of going live with athenaCollector for Hospitals and Health Systems, Faith Community Hospital enjoyed improved cash flow, faster payments, and increased staff efficiency. More specifically, total cash flow at this hospital was 118.5% of its baseline after Q1 2016. Faith Community Hospital is now live on our full suite of services, athenaOne for Hospitals and Health Systems, and is one of our
12
hospital showcase clients, opening its doors to prospects to exhibit the efficacy of our differentiated services.
Business Development Update
More Disruption Please (“MDP”)
Our MDP program’s mission is to create a true distribution platform that attracts and supports new generations of innovators and entrepreneurs and delivers innovative solutions that help our clients optimize their financial and operational performance. The MDP team remains focused on leveraging all three major components of this program - the network, the marketplace, and the accelerator - to identify opportunities in the market and seamlessly integrate innovative solutions that will benefit athenahealth, our clients, and the healthcare industry as a whole. As expected, 2016 continues to be an exciting year for our MDP program. As of the second quarter, we have grown the MDP Marketplace to 100 partners, 67 of which are generally available across 31 capabilities, and another 33 partners that are currently in pilot phase. Client interest and demand for the MDP Marketplace services continues to grow. We are generating leads from over 100 clients per week expressing interest in our MDP Marketplace partners. Client adoption also continues to grow with 1,168 unique clients using an MDP solution, bringing client adoption up 35% since year end. We are also leveraging our MDP Program to help us fill ancillary sockets and expand our network-enabled services across the continuum of care. To date, we have contracted with six inpatient partners to join the MDP Marketplace and help us deliver a more robust inpatient service. One of these inpatient companies featured on the MDP Marketplace is Merge LIS. Merge LIS automates the laboratory workflow process from lab collection to lab results, offering seamless connectivity to our athenaOne for Hospitals and Health Systems service. It is an easy-to-use system that helps our hospital clients improve efficiency, reduce costs, improve quality control, and provide secure access to lab results from anywhere, anytime. In addition to promoting these solutions on our MDP Marketplace, we are also investing in other early stage but innovative solutions through programs such as our MDP Innovation Challenge and MDP Accelerator. The winner of our inaugural MDP Innovation Challenge was The Right Place, a company focused on improving the care coordination process between hospitals and post-acute care facilities. The many facets of our MDP Program remain focused on improving how healthcare works. While we have made tremendous progress since the launch of our MDP program in 2011, we need to drive further industry awareness of this important program. We believe that our nation’s policymakers need to know how today’s emerging healthcare startups operate, the conditions they require to succeed, the barriers they face, and where policy is and is not fostering innovation. To this end, we hosted our 3rd annual MDP Hill Day on June 15, 2016. We brought together CEOs from 25 of the most innovative healthcare IT companies to meet with Congressional staff on the Hill to discuss how government programs and legislation can help foster innovation, enable information exchange, and drive improvements in care. To learn more about our MDP program and partnership opportunities and to explore the athenahealth Marketplace, please visit www.athenahealth.com/disruption.
Client Base Discussion
The total number of physicians who have gone live on athenaCollector, our core service offering, is the metric we currently use to define our ambulatory client base and market share. However, as our client base expands outside the traditional ambulatory market, total active providers, network receivers, and eventually covered lives, total managed lives, and discharge bed days will become more appropriate metrics to use to define our network growth, client base, and market share.
During Q2 2016, 78% of all new athenaCollector deals included athenaClinicals, compared to 81% in Q2 2015. 76% of all new athenaCollector deals included athenaClinicals, athenaCommunicator, and athenaCoordinator. The athenaOne rate of 76% in Q2 2016 compares to 78% in Q2 2015. Among “live” (i.e., implemented and active) athenaCollector clients, adoption of athenaClinicals and athenaCommunicator continues to grow and resulted in continued growth to our installed base across all of our service offerings.
13
athenahealth Service Offering Adoption
(athenaCollector, athenaClinicals, and athenaCommunicator)
athenaCollector Clients
During Q2 2016, total active physicians on athenaCollector grew by 19% year-over-year, to 58,621. On a sequential basis, we added 1,528 net new active physicians on athenaCollector, versus 2,114 in Q2 2015. Our quarterly net new physician additions may vary widely due to the number and size of clients that go live in a particular quarter. Furthermore, our larger clients can be more complex and take longer to go live, particularly if our clients request a more phased implementation approach. Total active providers on athenaCollector grew by 19% year-over-year, to 80,373. On a sequential basis, we added 2,215 net new active providers on athenaCollector, versus 2,882 in Q2 2015.
athenaClinicals Clients
During Q2 2016, total active physicians live on athenaClinicals grew by 31% year-over-year, to 27,349. On a sequential basis, we added 1,180 net new active physicians on athenaClinicals, versus 1,127 in Q2 2015. This equates to an overall adoption rate of 47% of total athenaCollector physicians, up from 43% in Q2 2015. Total active providers on athenaClinicals grew by 31% year-over-year, to 36,208. On a sequential basis, we added 1,632 net new active providers on athenaClinicals, versus 1,475 in Q2 2015. We expect the athenaClinicals client base to increase over time due to cross-selling within our existing base and growth in the volume of athenaOne deals.
athenaCommunicator Clients
During Q2 2016, total active physicians live on athenaCommunicator grew by 24% year-over-year, to 43,767. On a sequential basis, we added 1,489 net new active physicians on athenaCommunicator, versus 1,670 in Q2 2015. This equates to an overall adoption rate of 75% of total athenaCollector physicians, up from 72% in Q2 2015. Total active providers on athenaCommunicator grew by 25% year-over-year, to 57,211. On a sequential basis, we added 1,967 net new providers on athenaCommunicator, versus 2,132 in Q2 2015. We expect the athenaCommunicator client base to increase over time due to cross-selling within our existing base and growth in the volume of athenaOne deals.
New Partnerships
On July 8, 2016, we announced a partnership with the YMCA of the USA (“Y-USA”) to support and strengthen the role of the community-based organization in the delivery of preventive services, including the YMCA’s Diabetes Prevention Program (“YMCA’s DPP”). Together, Y-USA and athenahealth will support local Y's as their healthcare partners as they manage and refer patients with prediabetes to the YMCA’s DPP. The YMCA’s DPP is a twelve-month behavioral and lifestyle intervention initiative
14
targeting adults at risk of developing type 2 diabetes. athenahealth’s health information network and services will allow the Y to connect its proven programs to over 80,000 clinical providers and expand the services and support it provides to health-seekers in thousands of communities across the U.S.
Client Implementations
Below are the publicly disclosed clients that went live or partially live during Q2 2016:
• | NewYork-Presbyterian continued the phased rollout of our suite of services, athenaOne, and brought the second wave live at NewYork-Presbyterian Medical Groups in Q2 2016. |
• | Adventist Health started the phased rollout of our suite of services, athenaOne, and brought the first wave live in Q2 2016. |
Growth Discussion
The athenahealth marketing organization encompasses our growth and sales operations, event and partner marketing, inside sales agents (“ISAs”), advertising, corporate communications, and product marketing teams. This organization executes in-market investments in an effort to generate new business opportunities for athenahealth. The athenahealth sales organization includes all quota-carrying sales representatives, as well as our sales team leaders, channel sales team, and sales training and development organization.
Our Access & Awareness team continues to make progress in driving awareness of athenahealth and distinguishing our network-enabled services from traditional software. Building off of our successful “Let Doctors be Doctors” campaign, we recently launched our new brand promise “Unbreak Healthcare”. We believe it is time to unbreak healthcare and expose key points of failure so we can start fixing them. This latest campaign highlights what unbroken healthcare will look like and feel like, including total connectedness across the continuum of care, humanity brought back to the moment of care, and aligned incentives driving the right outcomes. Over the course of the next few weeks and months, we will communicate this commitment to unbreak healthcare through a variety of public-facing initiatives: 1) a series of satirical short films that point out critical breakdowns in healthcare; 2) conversations on social media to inspire what unbroken healthcare moments look like; and 3) best practices and actionable insights mined from our network data and shared on our new web publication, athenaInsight. As our market awareness and network continue to grow, so does the opportunity to fuel demand and generate growth from our owned channels. While we are still early in this new growth strategy, we can and are generating our own growth. Leads and meetings from our athena-owned channels are growing and represent 32% and 44%, respectively, of our total leads and meetings in the first half of 2016.
As of June 30, 2016, we have a total of 204 quota-carrying sales representatives, including hospital sales, up 31% from June 30, 2015. Our athenahealth-branded services sales force is currently divided into four groups: enterprise, which is dedicated to serving the largest managed care organizations, as well as those with high growth potential; group, which is dedicated to medical practices with seven to 150 physicians; small group, which is dedicated to medical practices with one to six physicians; and hospital, which is dedicated to hospitals and hospital-owned clinics and medical groups with 50 beds or less.
15
Stock-Based Compensation Expense, Amortization of Purchased Intangible Assets, and Reconciliation of Non-GAAP Financial Measures
athenahealth, Inc.
STOCK-BASED COMPENSATION
(Unaudited, in thousands)
Set forth below is a breakout of stock-based compensation impacting the Condensed Consolidated Statements of Income for the three and six months ended June 30, 2016, and 2015:
Three Months Ended June 30, | Six Months Ended June 30, | ||||||||||||||
2016 | 2015 | 2016 | 2015 | ||||||||||||
Stock-based compensation charged to Condensed Consolidated Statements of Income: | |||||||||||||||
Direct operating | $ | 4,446 | $ | 3,603 | $ | 9,289 | $ | 7,299 | |||||||
Selling and marketing | 5,140 | 4,631 | 9,192 | 9,583 | |||||||||||
Research and development | 3,555 | 2,296 | 6,212 | 4,543 | |||||||||||
General and administrative | 5,238 | 6,559 | 8,852 | 11,538 | |||||||||||
Total stock-based compensation expense | 18,379 | 17,089 | 33,545 | 32,963 | |||||||||||
Amortization of capitalized stock-based compensation related to software development (1) | 1,334 | 835 | 2,530 | 1,768 | |||||||||||
Total | $ | 19,713 | $ | 17,924 | $ | 36,075 | $ | 34,731 | |||||||
(1) | In addition, for the three months ended June 30, 2016, and 2015, $0.9 million and $1.7 million, respectively, of stock-based compensation was capitalized in the line item Capitalized software costs, net in the Condensed Consolidated Balance Sheets for which $1.3 million and $0.8 million, respectively, of amortization was included in the line item Depreciation and amortization in the Condensed Consolidated Statements of Income. For the six months ended June 30, 2016, and 2015, $1.2 million and $3.6 million, respectively, of stock-based compensation was capitalized in the line item Capitalized software costs, net in the Condensed Consolidated Balance Sheets for which $2.5 million and $1.8 million, respectively, of amortization was included in the line item Depreciation and amortization in the Condensed Consolidated Statements of Income. |
athenahealth, Inc.
AMORTIZATION OF PURCHASED INTANGIBLE ASSETS
(Unaudited, in thousands)
Set forth below is a breakout of amortization of purchased intangible assets impacting the Condensed Consolidated Statements of Income for the three and six months ended June 30, 2016, and 2015:
Three Months Ended June 30, | Six Months Ended June 30, | ||||||||||||||
Amortization of purchased intangible assets allocated to: | 2016 | 2015 | 2016 | 2015 | |||||||||||
Direct operating | $ | 1,782 | $ | 3,726 | $ | 5,072 | $ | 7,515 | |||||||
Selling and marketing | 2,913 | 2,462 | 5,825 | 4,746 | |||||||||||
Total amortization of purchased intangible assets | $ | 4,695 | $ | 6,188 | $ | 10,897 | $ | 12,261 | |||||||
16
athenahealth, Inc.
RECONCILIATION OF NON-GAAP FINANCIAL MEASURES
TO COMPARABLE GAAP MEASURES
(Unaudited, in thousands, except per share amounts)
The following is a reconciliation of the non-GAAP financial measures used by us to describe our financial results determined in accordance with accounting principles generally accepted in the United States of America (“GAAP”). An explanation of these measures is also included below under the heading “Explanation of Non-GAAP Financial Measures.”
While management believes that these non-GAAP financial measures provide useful supplemental information to investors regarding the underlying performance of our business operations, investors are reminded to consider these non-GAAP measures in addition to, and not as a substitute for, financial performance measures prepared in accordance with GAAP. In addition, it should be noted that these non-GAAP financial measures may be different from non-GAAP measures used by other companies, and management may utilize other measures to illustrate performance in the future. Non-GAAP measures have limitations in that they do not reflect all of the amounts associated with our results of operations as determined in accordance with GAAP.
Please note that these figures may not sum exactly due to rounding.
Non-GAAP Adjusted Gross Margin
Set forth below is a presentation of our “Non-GAAP Adjusted Gross Profit” and “Non-GAAP Adjusted Gross Margin,” which represents Non-GAAP Adjusted Gross Profit as a percentage of total revenue.
(unaudited, in thousands) | Three Months Ended | Six Months Ended | |||||||||||||
June 30, | June 30, | ||||||||||||||
2016 | 2015 | 2016 | 2015 | ||||||||||||
Total revenue | $ | 261,939 | $ | 224,694 | $ | 518,088 | $ | 431,128 | |||||||
Direct operating expense | 103,891 | 89,899 | 209,280 | 174,456 | |||||||||||
Total revenue less direct operating expense | 158,048 | 134,795 | 308,808 | 256,672 | |||||||||||
Add: Stock-based compensation allocated to direct operating expense | 4,446 | 3,603 | 9,289 | 7,299 | |||||||||||
Add: Amortization of purchased intangible assets allocated to direct operating expense | 1,782 | 3,726 | 5,072 | 7,515 | |||||||||||
Add: Exit costs, including restructuring costs allocated to direct operating expense | 264 | — | 264 | — | |||||||||||
Non-GAAP Adjusted Gross Profit | $ | 164,540 | $ | 142,124 | $ | 323,433 | $ | 271,486 | |||||||
Non-GAAP Adjusted Gross Margin | 62.8 | % | 63.3 | % | 62.4 | % | 63.0 | % | |||||||
17
Non-GAAP Adjusted Operating Income
Set forth below is a reconciliation of our “Non-GAAP Adjusted Operating Income” and “Non-GAAP Adjusted Operating Income Margin,” which represents Non-GAAP Adjusted Operating Income as a percentage of total revenue.
(unaudited, in thousands) | Three Months Ended | Six Months Ended | |||||||||||||
June 30, | June 30, | ||||||||||||||
2016 | 2015 | 2016 | 2015 | ||||||||||||
Total revenue | $ | 261,939 | $ | 224,694 | $ | 518,088 | $ | 431,128 | |||||||
GAAP net (loss) income | (1,915 | ) | 9,349 | (2,748 | ) | 517 | |||||||||
Add: Benefit from income taxes | (884 | ) | 8,010 | (1,615 | ) | 4,047 | |||||||||
Add: Total other expense | 1,533 | (19,568 | ) | 3,421 | (18,553 | ) | |||||||||
GAAP operating loss | $ | (1,266 | ) | $ | (2,209 | ) | $ | (942 | ) | $ | (13,989 | ) | |||
GAAP operating loss margin | (0.5 | )% | (1.0 | )% | (0.2 | )% | (3.2 | )% | |||||||
Add: Stock-based compensation expense | 18,379 | 17,089 | 33,545 | 32,963 | |||||||||||
Add: Amortization of capitalized stock-based compensation related to software development | 1,334 | 835 | 2,530 | 1,768 | |||||||||||
Add: Amortization of purchased intangible assets | 4,695 | 6,188 | 10,897 | 12,261 | |||||||||||
Add: Integration and transaction costs | 140 | — | 350 | 964 | |||||||||||
Add: Exit costs, including restructuring costs | 797 | 261 | 1,933 | 4,446 | |||||||||||
Non-GAAP Adjusted Operating Income | $ | 24,079 | $ | 22,164 | $ | 48,313 | $ | 38,413 | |||||||
Non-GAAP Adjusted Operating Income Margin | 9.2 | % | 9.9 | % | 9.3 | % | 8.9 | % | |||||||
18
Non-GAAP Adjusted Net Income
Set forth below is a reconciliation of our “Non-GAAP Adjusted Net Income” and “Non-GAAP Adjusted Net Income per Diluted Share.”
(unaudited, in thousands) | Three Months Ended | Six Months Ended | |||||||||||||
June 30, | June 30, | ||||||||||||||
2016 | 2015 | 2016 | 2015 | ||||||||||||
GAAP net (loss) income | $ | (1,915 | ) | $ | 9,349 | $ | (2,748 | ) | $ | 517 | |||||
Add: Stock-based compensation expense | 18,379 | 17,089 | 33,545 | 32,963 | |||||||||||
Add: Amortization of capitalized stock-based compensation related to software development | 1,334 | 835 | 2,530 | 1,768 | |||||||||||
Add: Amortization of purchased intangible assets | 4,695 | 6,188 | 10,897 | 12,261 | |||||||||||
Add: Integration and transaction costs | 140 | — | 350 | 964 | |||||||||||
Add: Exit costs, including restructuring costs | 797 | 261 | 1,933 | 4,446 | |||||||||||
Less: Gain on sale of marketable securities | — | (21,071 | ) | — | (21,071 | ) | |||||||||
Sub-total of tax deductible items | 25,345 | 3,302 | 49,255 | 31,331 | |||||||||||
Less: Tax impact of tax deductible items (1) | (10,138 | ) | (1,321 | ) | (19,702 | ) | (12,532 | ) | |||||||
Add: Tax impact resulting from applying non-GAAP tax rate (2) | 236 | 1,067 | 130 | 2,221 | |||||||||||
Non-GAAP Adjusted Net Income | $ | 13,528 | $ | 12,397 | $ | 26,935 | $ | 21,537 | |||||||
Weighted average shares - diluted | 39,271 | 39,340 | 39,153 | 39,338 | |||||||||||
Non-GAAP Adjusted Net Income per Diluted Share | $ | 0.34 | $ | 0.32 | $ | 0.69 | $ | 0.55 | |||||||
(1) | Tax impact calculated using a statutory tax rate of 40%. |
(2) | Represents adjusting the GAAP net loss to a non-GAAP tax rate of 40%. We used a non-GAAP tax rate of 40% to normalize the tax impact to our Non-GAAP Adjusted Net Income per Diluted Share based on the fact that a relatively small change in pre-tax GAAP income (loss) in any one period could result in a volatile GAAP effective tax rate. |
19
(unaudited, in thousands) | Three Months Ended | Six Months Ended | |||||||||||||
June 30, | June 30, | ||||||||||||||
2016 | 2015 | 2016 | 2015 | ||||||||||||
GAAP net (loss) income per share - diluted | $ | (0.05 | ) | $ | 0.24 | $ | (0.07 | ) | $ | 0.01 | |||||
Add: Stock-based compensation expense | 0.47 | 0.43 | 0.86 | 0.84 | |||||||||||
Add: Amortization of capitalized stock-based compensation related to software development | 0.03 | 0.02 | 0.06 | 0.04 | |||||||||||
Add: Amortization of purchased intangible assets | 0.12 | 0.16 | 0.28 | 0.31 | |||||||||||
Add: Integration and transaction costs | — | — | 0.01 | 0.02 | |||||||||||
Add: Exit costs, including restructuring costs | 0.02 | 0.01 | 0.05 | 0.11 | |||||||||||
Less: Gain on sale of marketable securities | — | (0.54 | ) | — | (0.54 | ) | |||||||||
Sub-total of tax deductible items | 0.65 | 0.08 | 1.26 | 0.80 | |||||||||||
Less: Tax impact of tax deductible items (1) | (0.26 | ) | (0.03 | ) | (0.50 | ) | (0.32 | ) | |||||||
Add: Tax impact resulting from applying non-GAAP tax rate (2) | 0.01 | 0.03 | — | 0.06 | |||||||||||
Non-GAAP Adjusted Net Income per Diluted Share | $ | 0.34 | $ | 0.32 | $ | 0.69 | $ | 0.55 | |||||||
Weighted average shares - diluted | 39,271 | 39,340 | 39,153 | 39,338 | |||||||||||
(1) | Tax impact calculated using a statutory tax rate of 40%. |
(2) | Represents adjusting the GAAP net loss to a non-GAAP tax rate of 40%. We used a non-GAAP tax rate of 40% to normalize the tax impact to our Non-GAAP Adjusted Net Income per Diluted Share based on the fact that a relatively small change in pre-tax GAAP income (loss) in any one period could result in a volatile GAAP effective tax rate. |
20
athenahealth, Inc.
RECONCILIATION OF NON-GAAP FINANCIAL MEASURES
TO COMPARABLE GAAP MEASURES FOR FISCAL YEAR 2016 GUIDANCE
(Unaudited, in millions, except per share amounts)
Please note that the figures presented below may not sum exactly due to rounding.
Non-GAAP Adjusted Gross Margin Guidance
Set forth below is a presentation of our “Non-GAAP Adjusted Gross Profit” and “Non-GAAP Adjusted Gross Margin” guidance for fiscal year 2016, which represents Non-GAAP Adjusted Gross Profit as a percentage of total revenue.
LOW | HIGH | |||||
Fiscal Year Ending December 31, 2016 | ||||||
Total revenue | $ | 1,085.0 | $ | 1,115.0 | ||
Direct operating expense | 423.4 | 423.2 | ||||
Total revenue less direct operating expense | $ | 661.6 | $ | 691.7 | ||
Add: Stock-based compensation expense | ||||||
allocated to direct operating expense | 19.0 | 19.0 | ||||
Add: Amortization of purchased intangible assets | ||||||
allocated to direct operating expense | 8.4 | 8.4 | ||||
Non-GAAP Adjusted Gross Profit | $ | 689.0 | $ | 719.2 | ||
Non-GAAP Adjusted Gross Margin | 63.5 | % | 64.5 | % | ||
Non-GAAP Adjusted Operating Income Guidance
Set forth below is a reconciliation of our “Non-GAAP Adjusted Operating Income” and “Non-GAAP Adjusted Operating Income Margin” guidance for fiscal year 2016, which represents Non-GAAP Adjusted Operating Income as a percentage of total revenue.
LOW | HIGH | |||||
Fiscal Year Ending December 31, 2016 | ||||||
Total revenue | $ | 1,085.0 | $ | 1,115.0 | ||
GAAP net income | 10.8 | 19.5 | ||||
Add: Provision for income taxes | 7.6 | 12.9 | ||||
Add: Total other expense | 5.3 | 6.4 | ||||
GAAP operating income | $ | 23.7 | $ | 38.8 | ||
GAAP operating income margin | 2.2 | % | 3.5 | % | ||
Add: Stock-based compensation expense | 69.4 | 69.4 | ||||
Add: Amortization of capitalized stock-based compensation related to software development | 6.8 | 6.8 | ||||
Add: Amortization of purchased intangible assets | 20.0 | 20.0 | ||||
Non-GAAP Adjusted Operating Income | $ | 120.0 | $ | 135.0 | ||
Non-GAAP Adjusted Operating Income Margin | 11.1 | % | 12.1 | % | ||
21
Non-GAAP Adjusted Net Income Guidance
Set forth below is a reconciliation of our “Non-GAAP Adjusted Net Income” and “Non-GAAP Adjusted Net Income per Diluted Share” guidance for fiscal year 2016.
LOW | HIGH | |||||
Fiscal Year Ending December 31, 2016 | ||||||
GAAP net income | $ | 10.8 | $ | 19.5 | ||
Add: Stock-based compensation expense | 69.4 | 69.4 | ||||
Add: Amortization of capitalized stock-based compensation related to software development | 6.8 | 6.8 | ||||
Add: Amortization of purchased intangible assets | 20.0 | 20.0 | ||||
Sub-total of tax deductible items | $ | 96.2 | $ | 96.2 | ||
(Less): Tax impact of tax deductible items (1) | (38.5 | ) | (38.5 | ) | ||
Add: Tax impact resulting from applying a normalized non-GAAP tax rate (2) | 0.2 | (0.1 | ) | |||
Non-GAAP Adjusted Net Income | $ | 68.8 | $ | 77.2 | ||
Weighted average shares - diluted | 41.7 | 41.7 | ||||
Non-GAAP Adjusted Net Income per Diluted Share | $ | 1.65 | $ | 1.85 | ||
(1) | Tax impact calculated using a statutory tax rate of 40%. |
(2) | Represents adjusting the GAAP net income to a non-GAAP tax rate of 40%. For 2016, we are using a non-GAAP tax rate of 40% to normalize the tax impact to our Non-GAAP Adjusted Net Income per Diluted Share based on the fact that a relatively small change in pre-tax GAAP income (loss) in any one period could result in a volatile GAAP effective tax rate. |
LOW | HIGH | |||||
Fiscal Year Ending December 31, 2016 | ||||||
GAAP net income per share - diluted | $ | 0.26 | $ | 0.47 | ||
Add: Stock-based compensation expense | 1.66 | 1.66 | ||||
Add: Amortization of capitalized stock-based compensation related to software development | 0.16 | 0.16 | ||||
Add: Amortization of purchased intangible assets | 0.48 | 0.48 | ||||
Sub-total of tax deductible items | $ | 2.31 | $ | 2.31 | ||
(Less): Tax impact of tax deductible items (1) | (0.92 | ) | (0.92 | ) | ||
Add: Tax impact resulting from applying a normalized non-GAAP tax rate (2) | 0.01 | — | ||||
Non-GAAP Adjusted Net Income per Diluted Share | $ | 1.65 | $ | 1.85 | ||
Weighted average shares - diluted | 41.7 | 41.7 | ||||
(1) | Tax impact calculated using a statutory tax rate of 40%. |
(2) | Represents adjusting the GAAP net income to a non-GAAP tax rate of 40%. For 2016, we are using a non-GAAP tax rate of 40% to normalize the tax impact to our Non-GAAP Adjusted Net Income per Diluted Share based on the fact that a relatively small change in pre-tax GAAP income (loss) in any one period could result in a volatile GAAP effective tax rate. |
22
Explanation of Non-GAAP Financial Measures
We report our financial results in accordance with accounting principles generally accepted in the United States of America, or GAAP. However, management believes that, in order to properly understand our short-term and long-term financial and operational trends, investors may wish to consider the impact of certain non-cash or non-recurring items, when used as a supplement to financial performance measures in accordance with GAAP. These items result from facts and circumstances that vary in frequency and impact on continuing operations. Management also uses results of operations before such items to evaluate the operating performance of athenahealth and compare it against past periods, make operating decisions, and serve as a basis for strategic planning. These non-GAAP financial measures provide management with additional means to understand and evaluate the operating results and trends in our ongoing business by eliminating certain non-cash expenses and other items that management believes might otherwise make comparisons of our ongoing business with prior periods more difficult, obscure trends in ongoing operations, or reduce management’s ability to make useful forecasts. Management believes that these non-GAAP financial measures provide additional means of evaluating period-over-period operating performance. In addition, management understands that some investors and financial analysts find this information helpful in analyzing our financial and operational performance and comparing this performance to our peers and competitors.
Management defines “Non-GAAP Adjusted Gross Profit” as total revenue, less direct operating expense, plus (1) stock-based compensation expense allocated to direct operating expense, (2) amortization of purchased intangible assets allocated to direct operating expense, and (3) exit costs, including restructuring costs allocated to direct operating expense, and “Non-GAAP Adjusted Gross Margin” as Non-GAAP Adjusted Gross Profit as a percentage of total revenue. Management considers these non-GAAP financial measures to be important indicators of our operational strength and performance of our business and a good measure of our historical operating trends. Moreover, management believes that these measures enable investors and financial analysts to closely monitor and understand changes in our ability to generate income from ongoing business operations.
Management defines “Non-GAAP Adjusted Operating Income” as the sum of GAAP net loss before benefit from income taxes; total other expense (income); stock-based compensation expense; amortization of capitalized stock-based compensation related to software development; amortization of purchased intangible assets; integration and transaction costs; and exit costs, including restructuring costs; and “Non-GAAP Adjusted Operating Income Margin” as Non-GAAP Adjusted Operating Income as a percentage of total revenue. Management defines “Non-GAAP Adjusted Net Income” as the sum of GAAP net loss before stock-based compensation expense; amortization of capitalized stock-based compensation related to software development; amortization of purchased intangible assets; integration and transaction costs; exit costs, including restructuring costs; and gain on sale of marketable securities and any tax impact related to these preceding items; and an adjustment to the tax provision for the non-GAAP tax rate and “Non-GAAP Adjusted Net Income per Diluted Share” as Non-GAAP Adjusted Net Income divided by weighted average diluted shares outstanding. Management considers all of these non-GAAP financial measures to be important indicators of our operational strength and performance of our business and a good measure of our historical operating trends, in particular the extent to which ongoing operations impact our overall financial performance.
23
Management excludes or adjusts each of the items identified below from the applicable non-GAAP financial measure referenced above for the reasons set forth with respect to that excluded item:
• | Stock-based compensation expense and amortization of capitalized stock-based compensation related to software development — excluded because these are non-cash expenditures that management does not consider part of ongoing operating results when assessing the performance of our business, and also because the total amount of the expenditure is partially outside of our control because it is based on factors such as stock price, volatility, and interest rates, which may be unrelated to our performance during the period in which the expenses are incurred. |
• | Amortization of purchased intangible assets — purchased intangible assets are amortized over their estimated useful lives and generally cannot be changed or influenced by management after the acquisition. Accordingly, this item is not considered by management in making operating decisions. Management does not believe such charges accurately reflect the performance of our ongoing operations for the period in which such charges are incurred. |
• | Integration and transaction costs — Integration costs are the severance payments and retention bonuses for certain employees related to specific transactions. Transaction costs are costs related to specific transactions. Accordingly, management believes that such expenses do not have a direct correlation to future business operations, and therefore, these costs are not considered by management in making operating decisions. Management does not believe such charges accurately reflect the performance of our ongoing operations for the period in which such charges are incurred. |
• | Exit costs, including restructuring costs — represents costs related to workforce reductions and to terminate certain lease or other contract agreements for strategic realignment purposes. Management does not believe such costs accurately reflect the performance of our ongoing operations for the period in which such costs are incurred. |
• | Gain on sale of marketable securities — represents gain on sale of marketable securities. Management does not believe such gains accurately reflect the performance of our ongoing operations for the period in which such gains are reported. |
• | Non-GAAP tax rate — We use a non-GAAP tax rate of 40% to normalize the tax impact to our Non-GAAP Adjusted Net Income per Diluted Share based on the fact that a relatively small change in pre-tax GAAP income (loss) in any one period could result in a volatile GAAP effective tax rate. |
24
Supplemental Metrics and Definitions
Fiscal Year 2015 | Fiscal Year 2016 | ||||||||||||||
Q1 | Q2 | Q3 | Q4 | Q1 | Q2 | ||||||||||
Client Base | |||||||||||||||
Total Physicians on athenaCollector | 47,062 | 49,176 | 53,129 | 55,277 | 57,093 | 58,621 | |||||||||
Total Providers on athenaCollector | 64,648 | 67,530 | 72,314 | 75,416 | 78,158 | 80,373 | |||||||||
Total Physicians on athenaClinicals | 19,796 | 20,923 | 23,741 | 24,867 | 26,169 | 27,349 | |||||||||
Total Providers on athenaClinicals | 26,166 | 27,641 | 31,071 | 32,684 | 34,576 | 36,208 | |||||||||
Total Physicians on athenaCommunicator | 33,578 | 35,248 | 38,670 | 40,635 | 42,278 | 43,767 | |||||||||
Total Providers on athenaCommunicator | 43,770 | 45,902 | 49,986 | 52,821 | 55,244 | 57,211 | |||||||||
Client Performance | |||||||||||||||
Net Promoter Score | 42.3 | 40.5 | 39.9 | 40.3 | 34.0 | 29.5 | |||||||||
Client Days in Accounts Receivable (“DAR”) | 41.1 | 40.8 | 40.7 | 40.1 | 41.3 | 40.6 | |||||||||
First Pass Resolution (“FPR”) Rate | 93.7 | % | 94 | % | 93.8 | % | 94 | % | 94.2 | % | 94.7 | % | |||
Electronic Remittance Advice (“ERA”) Rate | 83.2 | % | 82.9 | % | 82.3 | % | 84.2 | % | 83.8 | % | 84.9 | % | |||
Total Claims Submitted | 32,809,734 | 35,002,061 | 35,826,192 | 40,191,950 | 41,246,696 | 42,261,855 | |||||||||
Total Client Collections ($) | 4,110,989,781 | 4,633,427,941 | 4,803,761,899 | 5,281,307,644 | 5,203,424,281 | 5,563,351,503 | |||||||||
Total Working Days | 61 | 64 | 64 | 62 | 62 | 64 | |||||||||
Employees | |||||||||||||||
Direct | 1,914 | 2,123 | 2,285 | 2,296 | 2,310 | 2,481 | |||||||||
Selling & Marketing | 602 | 649 | 666 | 668 | 652 | 727 | |||||||||
Research & Development | 1,010 | 1,172 | 1,262 | 1,280 | 1,355 | 1,336 | |||||||||
General & Administrative | 351 | 380 | 407 | 424 | 435 | 446 | |||||||||
Total Employees | 3,877 | 4,324 | 4,619 | 4,668 | 4,752 | 4,990 | |||||||||
Quota Carrying Sales Force | |||||||||||||||
Total Quota Carrying Sales Representatives | 150 | 151 | 161 | 163 | 170 | 204 | |||||||||
Supplemental Metrics Definitions | |
Client Base | |
Total Physicians on athenaCollector | The number of physicians that have rendered a service which generated a medical claim that was billed during the last 91 days on the athenaCollector platform. Examples of physicians include Medical Doctors (“MDs”) and Doctors of Osteopathic Medicine (“DOs”). |
Total Providers on athenaCollector | The number of providers, including physicians, that have rendered a service which generated a medical claim that was billed during the last 91 days on the athenaCollector platform. Examples of non-physician providers are Nurse Practitioners (“NPs”) and Registered Nurses (“RNs”). |
Total Physicians on athenaClinicals | The number of physicians that have rendered a service through the athenaClinicals platform which generated a medical claim that was billed during the last 91 days on the athenaCollector platform. |
Total Providers on athenaClinicals | The number of providers, including physicians, that have rendered a service through the athenaClinicals platform which generated a medical claim that was billed during the last 91 days on the athenaCollector platform. |
Total Physicians on athenaCommunicator | The number of physicians that have rendered a service which generated a medical claim that was billed during the last 91 days on the athenaCollector platform and whose practice is actively using athenaCommunicator. |
Total Providers on athenaCommunicator | The number of providers, including physicians, that have rendered a service which generated a medical claim that was billed during the last 91 days on the athenaCollector platform and whose practice is actively using athenaCommunicator. |
Client Performance | |
Net Promoter Score | The percentage of clients who chose 9 or 10 (defined as promoters) less the percentage of clients who chose 0 through 6 (defined as detractors) on a scale of 1 to 10 when asked if they would recommend athenahealth to a trusted friend or colleague. These responses are generated from a "client listening" survey that the Company conducts for its client base twice per year. |
Client Days in Accounts Receivable (“DAR”) | The average number of days that it takes outstanding balances on claims to be resolved, e.g. paid, for clients on athenaCollector. Clients that have been live less than 90 days are excluded, as well as clients who are terminating services. |
First Pass Resolution (“FPR”) Rate | Approximates the percentage of primary claims that are favorably adjudicated and closed after a single submission during the period. Currently, the FPR rate is calculated on a monthly basis, and certain practices are excluded (e.g. those that have been live for less than 90 days). |
Electronic Remittance Advice (“ERA”) Rate | Remittance refers to the information about payments (a/k/a explanations of benefits) received from insurance companies during the period. The ERA rate reflects the percentage of total charges that were posted using electronic remittance. |
Total Claims Submitted | The number of claims billed through athenaNet during the period. |
Total Client Collections | The dollar value of collections posted on behalf of clients during the period. |
Total Working Days | The total number of days during the quarter minus weekends and U.S. Post Office holidays. |
Employees | |
Direct | The total number of full time equivalent individuals (“FTEs”) employed by athenahealth to support its service operations as of quarter end. This team includes production systems, enrollment services, paper claim submission, claim resolution, clinical operations, professional services, account management, and client services. |
Selling & Marketing | The total number of FTEs employed by athenahealth to support its sales and marketing efforts as of quarter end. This team includes sales representatives, business development staff and the marketing team. |
Research & Development | The total number of FTEs employed by athenahealth to support its research and development efforts as of quarter end. This team includes product development and product management. |
General & Administrative | The total number of FTEs employed by athenahealth to support its general and administrative functions as of quarter end. This team includes finance, human resources, compliance, learning and development, internal audit, corporate technology, recruiting, facilities, and legal. |
Total Employees | The total number of FTEs employed by athenahealth as of quarter end. This number excludes interns and seasonal employees. |
Total Quota Carrying Sales Representatives | The total number of athenahealth-branded services sales representatives who carry quota for net new annual recurring revenue as of quarter end. |
Corporate Scorecard Metrics Definitions | |
Stability | |
Voluntary Turnover | The number of voluntary terminations within a quarter divided by the average of the starting headcount and ending headcount for the quarter. Voluntary turnover excludes employees on action plans or employees on counseling out plans. |
Employee Engagement | Quarterly engagement survey results for employees.. Employee engagement results are reported in Q2 and Q4 only. |
Performance | |
athenaCollector Composite | athenaCollector Composite consists of Days in Accounts Receivable (the average number of days that it takes outstanding balances on claims to be resolved), Client Collection Rate (the percentage of charges that are not written off), and Time of Service Collection Rate (the percentage of patient responsibility collected at the time of service in the office). |
athenaClinicals Composite | athenaClinicals Composite consists of PQRS Success (the percent of providers who avoid the Value Modifier penalty based on PQRS performance), Days Documents Open (days of work in the Clinicals inbox), and After Hours Physician Documentation (the percentage of physician encounter documentation that happens after clinical hours). |
athenaCommunicator Composite | athenaCommunicator Composite consists of Portal Adoption Rate (the percentage of patients who have registered for the portal), Portal Engagement Rate (the percentage of patients who logged into the portal within 30 days before or after their appointments), and Annual Visit Rate (the percentage of patients contacted by a well-visit campaign who ultimately scheduled an appointment with the practice). |
athenaCoordinator Composite | athenaCoordinator Composite consists of Coordinator Exchange Rate (the percentage of document exchanges, both inbound and outbound, sent electronically) and Coordinated Patient Rate (the percentage of time that key patient information, for both inbound and outbound transitions of care, is available at the next point of care). |
Epocrates Composite | Epocrates Composite consists of 90 Day Active Physician Engagement (the percentage Epocrates physicians active on the mobile app or website in 9 of the 12 weeks in each quarter). |
Satisfaction | |
Net Promoter Score | Survey respondents from athenaOne survey (sample includes all clients live, surveyed on a bi-annual basis) are categorized as detractors (0-6 score for "likelihood to recommend"), passives (7-8), and promoters (9-10). The Net Promoter Score is calculated by subtracting the % of detractors from the % of promoters. |
Financial | |
Bookings | The annualized value of deals sold. |
Non-GAAP Adjusted Operating Income | Total non-GAAP adjusted operating income. |