Attached files
| file | filename |
|---|---|
| 8-K - 8-K - AMICUS THERAPEUTICS, INC. | a16-12973_18k.htm |
Exhibit 99.1
Goldman Sachs 37th Annual Healthcare Conference June 7, 2016

Introduction 2 Safe Harbor This presentation contains "forward-looking statements" within the meaning of the Private Securities Litigation Reform Act of 1995 relating to preclinical and clinical development of our product candidates, the timing and reporting of results from preclinical studies and clinical trials, the prospects and timing of the potential regulatory approval of our product candidates, commercialization plans, financing plans, and the projected cash position for the Company. The inclusion of forward-looking statements should not be regarded as a representation by us that any of our plans will be achieved. Any or all of the forward-looking statements in this presentation may turn out to be wrong and can be affected by inaccurate assumptions we might make or by known or unknown risks and uncertainties. For example, with respect to statements regarding the goals, progress, timing, and outcomes of discussions with regulatory authorities, and in particular the potential goals, progress, timing, and results of preclinical studies and clinical trials and the expected timing of the EMA’s final decision with respect to regulatory approval of migalastat in the European Union, actual results may differ materially from those set forth in this presentation due to the risks and uncertainties inherent in our business, including, without limitation: the potential that results of clinical or preclinical studies indicate that the product candidates are unsafe or ineffective; the potential that it may be difficult to enroll patients in our clinical trials; the potential that regulatory authorities, including the EMA, may not grant or may delay approval for our product candidates; the potential that we may not be successful in commercializing our product candidates if and when approved; the potential that preclinical and clinical studies could be delayed because we identify serious side effects or other safety issues; and the potential that we will need additional funding to complete all of our studies. Further, the results of earlier preclinical studies and/or clinical trials may not be predictive of future results. With respect to statements regarding projections of the Company's cash position, actual results may differ based on market factors and the Company's ability to execute its operational and budget plans. In addition, all forward-looking statements are subject to other risks detailed in our Annual Report on Form 10-K for the year ended December 31, 2015. You are cautioned not to place undue reliance on these forward-looking statements, which speak only as of the date hereof. All forward-looking statements are qualified in their entirety by this cautionary statement, and we undertake no obligation to revise or update this presentation to reflect events or circumstances after the date hereof.
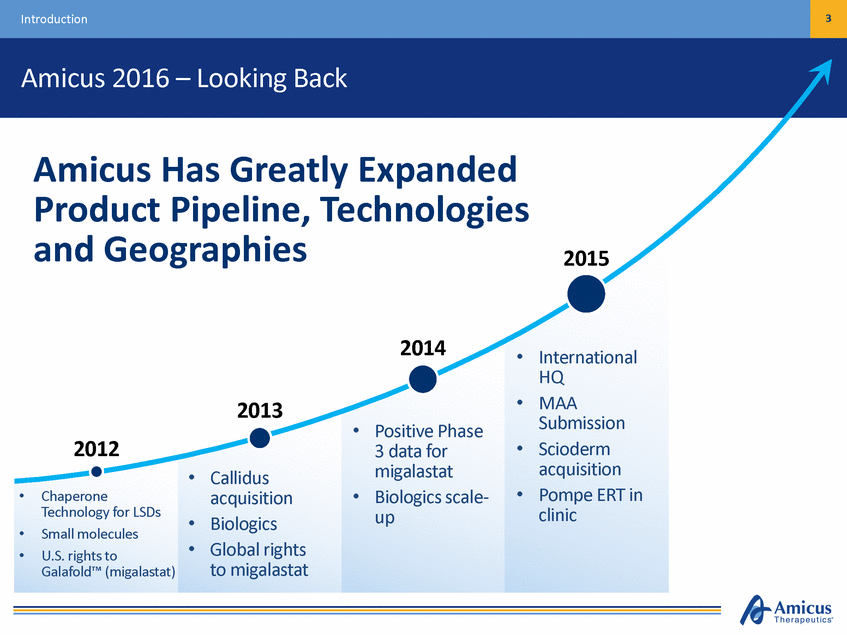
Introduction 3 Amicus 2016 – Looking Back Amicus Has Greatly Expanded Product Pipeline, and Geographies Technologies 2015 2014 • International HQ MAA Submission Scioderm acquisition Pompe ERT in clinic • 2013 • Positive Phase 3 data for migalastat Biologics scale-up 2012 • • Callidus acquisition Biologics Global rights to migalastat • • • Chaperone Technology for LSDs Small molecules U.S. rights to Galafold™ (migalastat) • • • •
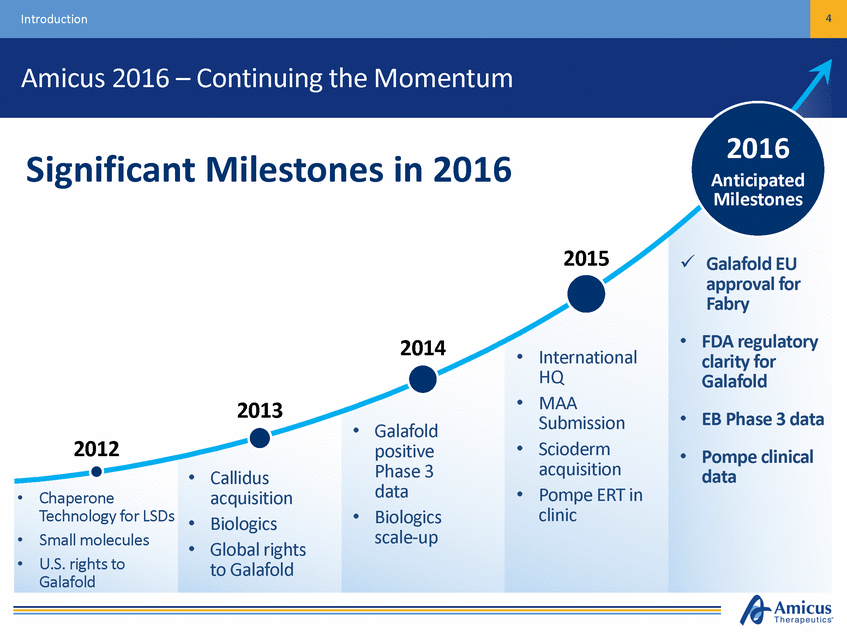
Introduction 4 Amicus 2016 – Continuing the Momentum 2016 Significant Milestones in 2016 Anticipated Milestones 2015 Galafold EU approval for Fabry FDA regulatory clarity for Galafold EB Phase 3 data Pompe clinical data • 2014 • International HQ MAA Submission Scioderm acquisition Pompe ERT in clinic • 2013 • • • Galafold positive Phase 3 data Biologics scale-up 2012 • • Callidus acquisition Biologics Global rights to Galafold • • Chaperone Technology for LSDs Small molecules U.S. rights to Galafold • • • • •
Introduction 5 Amicus Vision Amicus Therapeutics is a global biotechnology company at the forefront of developing advanced therapies to treat a range of devastating rare and orphan diseases Potential First-in-Class / Best-in-Class Meaningful Benefits for Patients Rare & Devastating Diseases
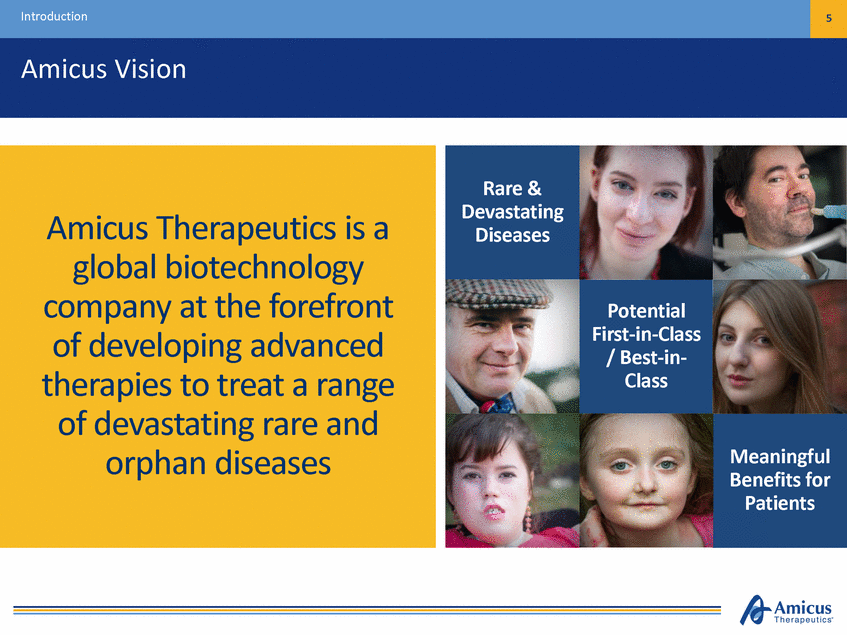
6 Introduction Key Drivers of Value Epidermolysis Bullosa (EB) Fabry Pompe • • Phase 3 Novel Topical Cream (SD-101) U.S. Breakthrough Therapy Designation Rolling NDA Phase 3 Data Expected in 2H16 Novel ERT + Chaperone Treatment Paradigm Biologics Manufacturing Clinical Study Initiated with Data Anticipated in 2016 • Galafold Precision Medicine (Small Molecule) EU Full Approval Launched in Germany (May 30, 2016) FDA Meeting anticipated mid-year • • • • • • • • R&D Engine and Continued Business Development Activity *Pending Approval 3 Novel Product Candidates Each with $500M to $1B+ Market Potential
Galafold™ (Migalastat) Precision Medicine for Fabry Disease

8 Galafold: Precision Medicine for Fabry Disease European Commission Granted Full Approval for Galafold The evaluation of EMA’s Committee for Medicinal Products for Human Use (CHMP) was based on the results of two phase III clinical trials in about 110 patients with Fabry disease who had a genetic mutation which responds to migalastat. Galafold demonstrated its efficacy compared to placebo (a dummy treatment) and to ERT in a long-term comparative study. - EMA Press Release Hard Capsules Oral Use 14 Hard Capsules Galafold Indicated for Long-Term Treatment of Adults and Adolescents Aged > 16 years with a Confirmed Diagnosis of Fabry Disease and Who have an Amenable Mutation
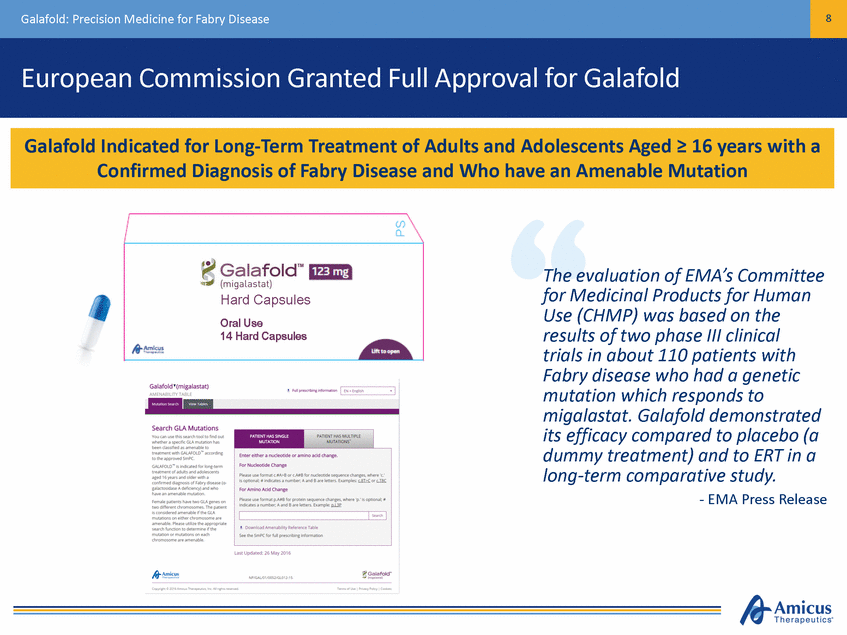
Galafold: Precision Medicine for Fabry Disease 9 Fabry Disease Overview Leading Causes of Death TRANSIENT ISCHEMIC Life-Limiting Symptoms GASTROINTESTINAL3 and diarrhea • ATTACK (TIA) & STROKE1 Nausea, vomiting, cramping, • Pain/bloating after eating, feeling full Constipation Difficulty managing weight HEART DISEASE2 • • • • • Irregular heartbeat (fast or slow) Heart attack or heart failure Enlarged heart Key Facts Deficiency of α-Gal A enzyme leading to GL-3 accumulation >800 known mutations 5-10K diagnosed WW (51% female/49% male4) Newborn screening studies suggest prevalence of ~1:1000 to ~1:4000 KIDNEY DISEASE3 • • • • Protein in the urine Decreased kidney function Kidney failure • • • 1. Desnick R, et al. Ann Intern Med. 2003 2. Yousef Z, et al. Eur Heart J. 2013 3. Germain D. Orphanet J Rare Dis. 2010 4. Fabry Registry 2011 Fabry Disease is a Fatal Genetic Disorder that Affects Multiple Organ Systems
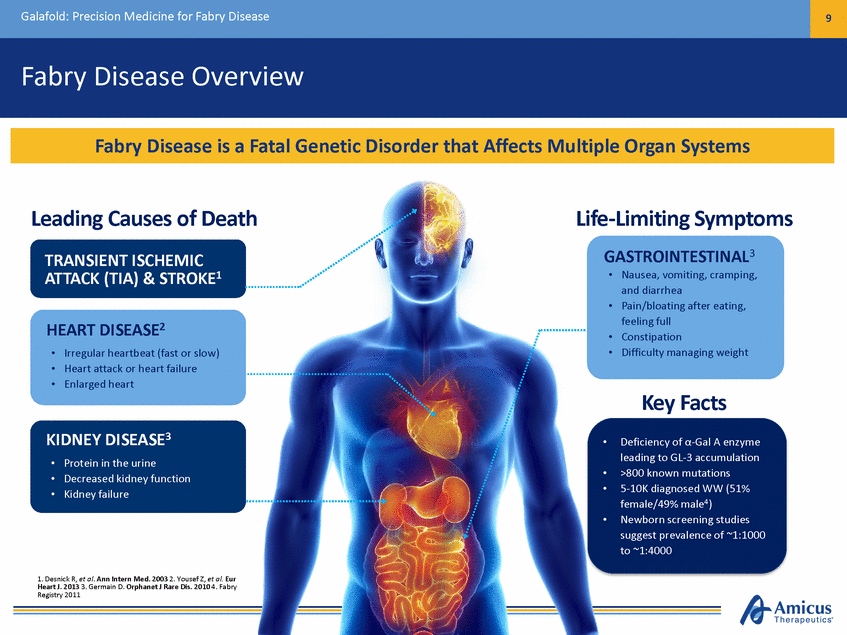
Galafold: Precision Medicine for Fabry Disease 10 Summary of Clinical Data Reduction in Disease Substrate IC GL-3 (Study 0111)* Plasma Lyso Gb-3 (Study 0112,1 and 0123)* Stability of Kidney Function Estimated Glomerular Filtration Rate (eGFR) and Measured GFR (Study 0114 and Study 0124,3) Reduction in Cardiac Mass Left Ventricular Mass Index (LVMI) (Study 0112 and 012)* Improvement in GI Symptoms Gastrointestinal Symptoms Rating Scale (GSRS) (Study 0111)* Low Rate of Fabry-Associated Clinical Events Renal, Cardiac and Cerebro-Vascular Events (Study 0123) *Analyses in this endpoint achieved statistical significance. For more complete clinical data go to amicusrx.com/posters.aspx 1: Improvement versus placebo over 6 months in amenable patients 2: Improvement from baseline over 18+ months 3: Comparable to ERT over 18 months 4: Stabilization from baseline over 18 months with favorable comparison to natural history in literature Favorable Efficacy and Safety Data in Two Largest Phase 3 Studies Ever Completed in Fabry Disease
Galafold: Precision Medicine for Fabry Disease 11 Launch Activities Launch Underway! Medical education and patient advocacy ongoing on behalf of Fabry patients Experienced commercial leadership team with established international operations Patient and physician mapping Global value dossier complete and local submissions in development International distribution system
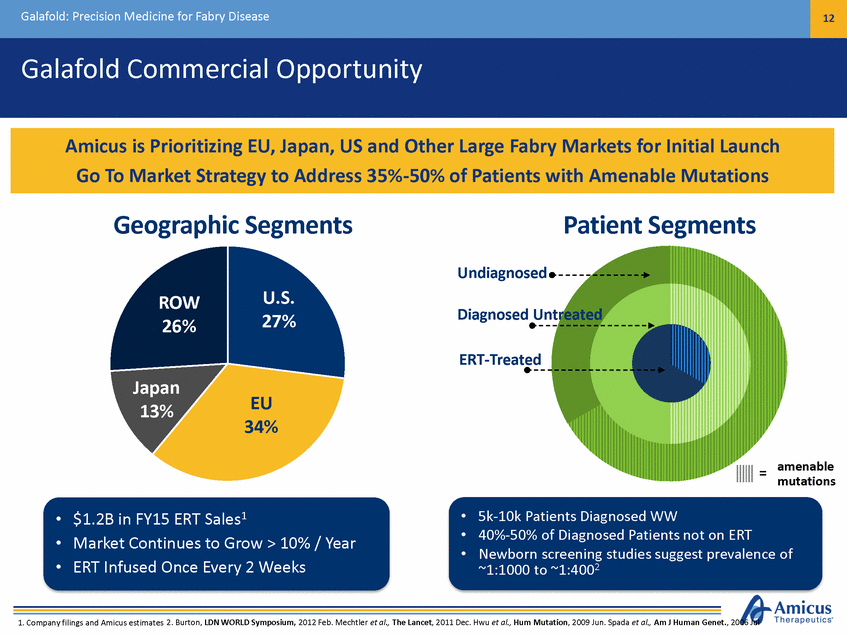
Galafold: Precision Medicine for Fabry Disease 12 Galafold Commercial Opportunity Geographic Segments Patient Segments Undiagnosed U.S. 27% ROW 26% Diagnosed Untreated ERT-Treated Japan 13% EU 34% amenable mutations = • • • 5k-10k Patients Diagnosed WW 40%-50% of Diagnosed Patients not on ERT Newborn screening studies suggest prevalence of ~1:1000 to ~1:4002 • • • $1.2B in FY15 ERT Sales1 Market Continues to Grow > 10% / Year ERT Infused Once Every 2 Weeks 1. Company filings and Amicus estimates 2. Burton, LDN WORLD Symposium, 2012 Feb. Mechtler et al., The Lancet, 2011 Dec. Hwu et al., Hum Mutation, 2009 Jun. Spada et al., Am J Human Genet., 2006 Jul Amicus is Prioritizing EU, Japan, US and Other Large Fabry Markets for Initial Launch Go To Market Strategy to Address 35%-50% of Patients with Amenable Mutations
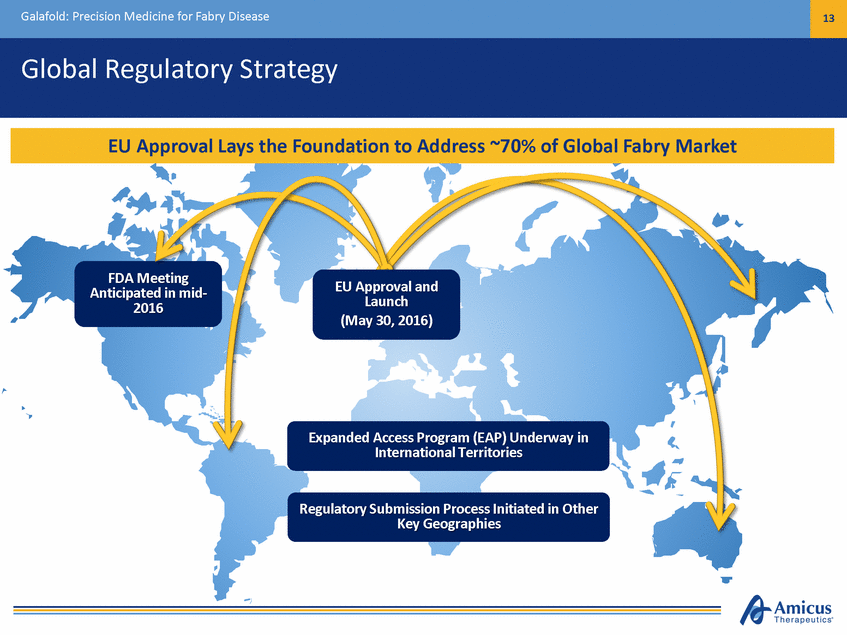
Galafold: Precision Medicine for Fabry Disease 13 Global Regulatory Strategy FDA Meeting Anticipated in mid-2016 EU Approval and Launch (May 30, 2016) Expanded Access Program (EAP) Underway in International Territories Regulatory Submission Process Initiated in Other Key Geographies EU Approval Lays the Foundation to Address ~70% of Global Fabry Market
Galafold: Precision Medicine for Fabry Disease 14 EU Launch Strategy UNITED KINGDOM ERT-treated patients: ~450 Highly Specialised Technology (HST) FRANCE ERT-treated patients : ~375 patients Multiple patients treated under ATU GERMANY ERT-treated patients : ~500 patients ~50% of diagnosed patients untreated Galafold launched – initial patients on treatment EU Market Represents 34% of FY15 ERT Global Sales ($1.2B)
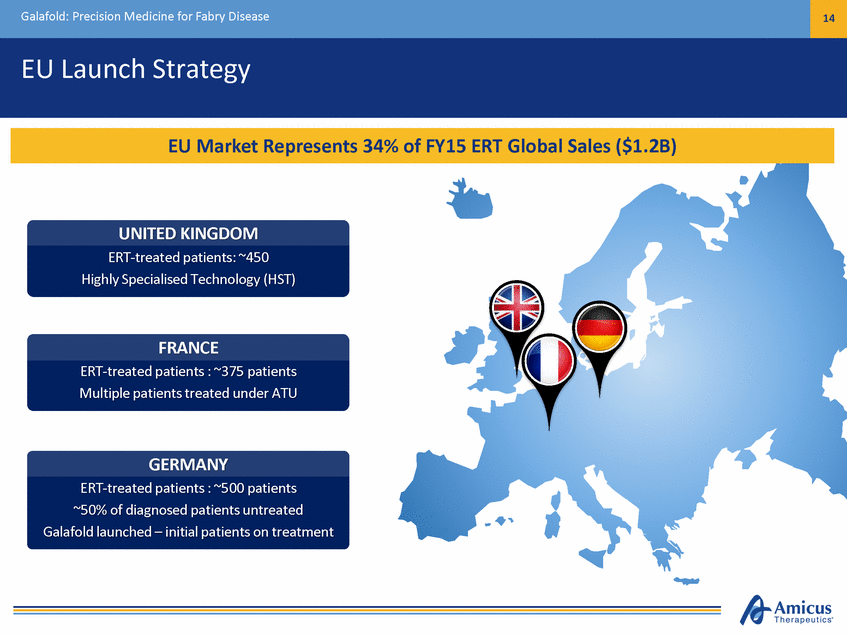
Galafold: Precision Medicine for Fabry Disease 15 German Launch Underway • • • • • • • Experienced, high quality team Launch began May 30, 2016 First prescription successfully delivered Patient support program in place Pricing dossier ready for submission Market mapping complete Significant KOL engagement to date Drug Shipped to First Patient within 24 Hours
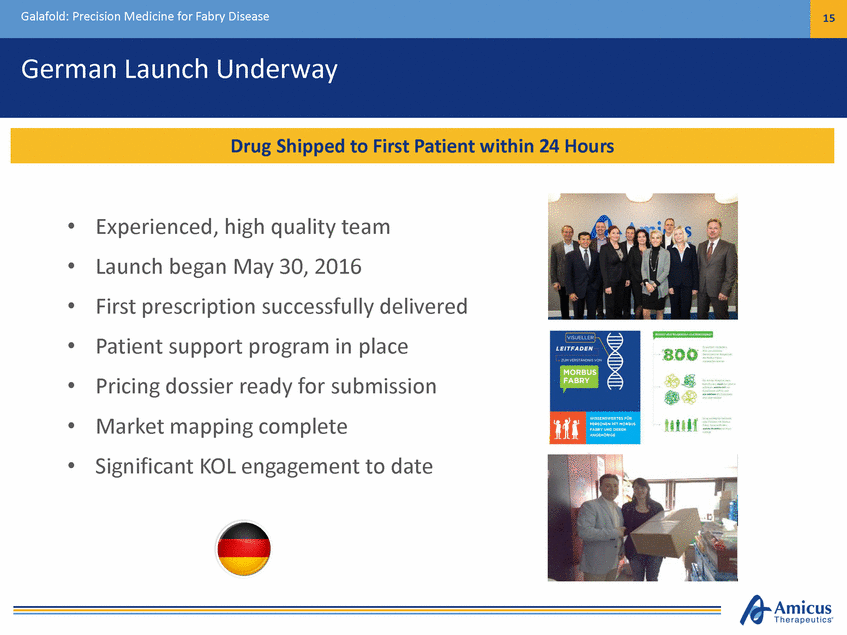
Galafold: Precision Medicine for Fabry Disease 16 Japan Market Overview MARKET OVERVIEW • • • ~650 patients treated No ERT home infusion currently available Physicians tend to initiate treatment early CLINICAL/REGULATORY STATUS • • Phase 1 PK study completed Multiple sites and patients participated in Phase 3 Study 012 Orphan drug designation Regulatory discussions initiated with PMDA • • Amicus is Actively Pursuing a Regulatory Pathway in Japan
Galafold: Precision Medicine for Fabry Disease 17 United States Market Overview MARKET OVERVIEW ERT-treated patients: ~1,500 ~40%-50% diagnosed and untreated Fabrazyme only CLINICAL/REGULATORY STATUS FDA meeting anticipated mid-2016 FDA Meeting and U.S. Regulatory Update Anticipated Mid-2016
Novel Proprietary Fabry ERT 18 Amicus Proprietary Fabry ERT Building on Biologics Capabilities and CHART Platform to Develop Differentiated Novel ERT Target Fabry ERT product profile: •Improved drug targeting •Co-formulation with chaperone Development status: •Cell line transferred to manufacturer •Preclinical data update in 2H16
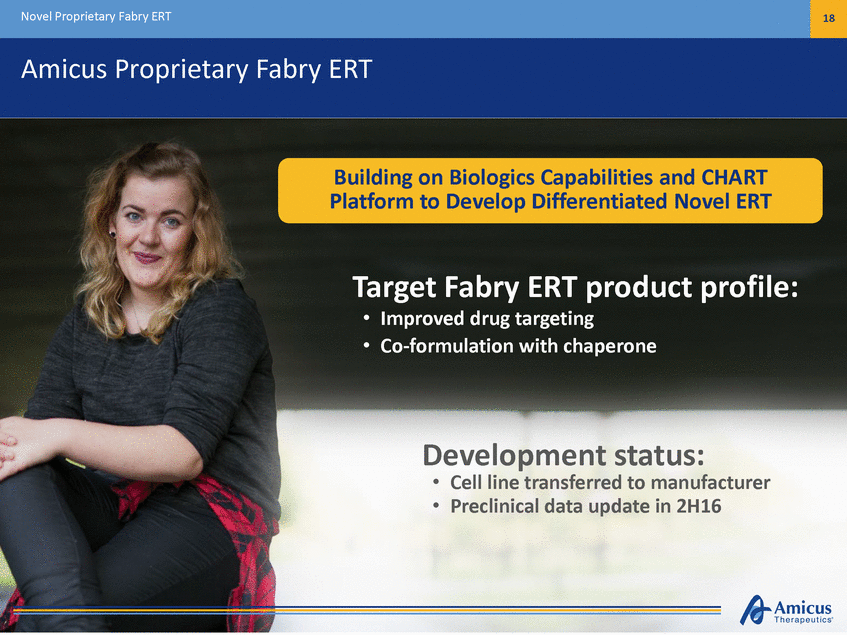
Novel Proprietary Fabry ERT 19 CHART Preclinical Proof-of-Concept for Fabry Co-Formulation A-Gal A Tissue Uptake GL-3 Substrate Reduction Heart Heart GL-3 4 3 2 80 60 0.8 0.6 0.4 0.2 0 40 20 0 JR-051 (1 mg/kg ) JR-051 (3 mg/kg) JR-051 (1 mg/kg ) JR-051 (3 mg/kg ) JR051 alone JR051 + migalastat JR051 alone JR051 + migalastat Kidney Kidney GL-3 80 2.5 2.0 60 1.5 40 1.0 20 0.5 0 0 JR-051 (1 mg/kg ) JR-051 (1 mg/kg ) JR-051 (3 mg/kg) JR-051 (3 mg/kg ) *ERT+/-Migalastat HCl in GLA Knock-Out Mice (Repeat-Dose IV Administration) *ERT designed to be biosimilar to Fabrazyme; **0 = wild-type, 100 = untreated KO mouse α-Gal A (nmol/mg protein/hr) α-Gal A (nmol/mg protein/hr) % Elevated > Wild-Type** % Elevated > Wild-Type** Co-Formulation (ERT + Migalastat) Results in Significantly Greater Tissue Uptake and Further Substrate Reduction*
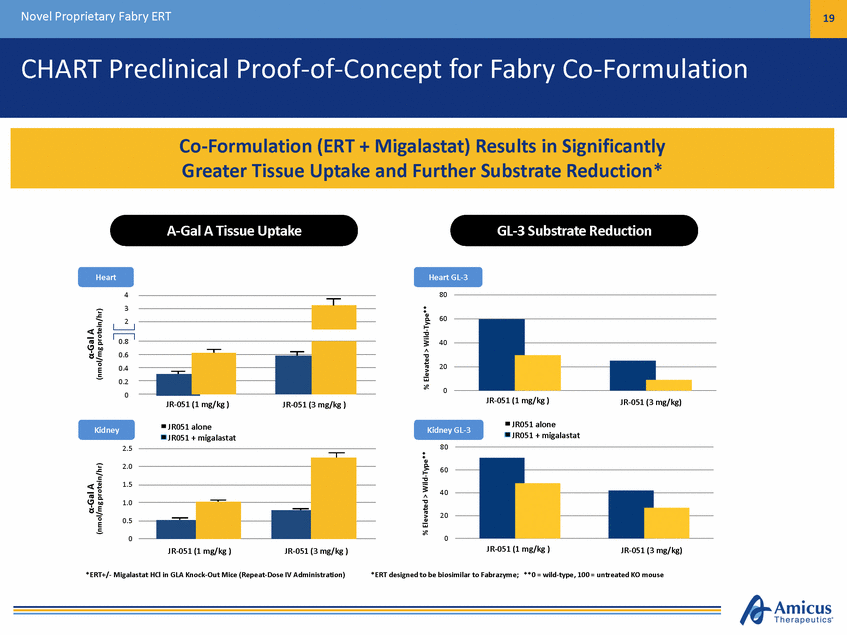
Novel Proprietary Fabry ERT 20 CHART Phase 2a Results for Fabry Co-Administration Study 013 Plasma rhGLA Activity (Area Under Curve) Mean Skin GLA Activity (Day 2) 20,000 ERT Alone ERT + migalastat 450 mg 5,000 +77% 4,000 15,000 3,000 10,000 2,000 5,000 1,000 0 0 Replagal 0.2 mg/kg (n=4) Fabrazyme 0.5 mg/kg (n=1) Fabrazyme 1 mg/kg (n=6) ERT Alone ERT + 450 mg Migalastat 1 Bichet, et al., A Phase 2a Study to Investigate the Effect of a Single Dose of Migalastat HCl, a Pharmacological Chaperone, on Agalsidase Activity in Subjects with Fabry Disease, LDN WORLD 2013. Plasma AUC rhGLA Activity (hr*nmol/hr/mL) Mean Skin GLA Activity (pmol/mg/hr) Fabrazyme 1 mg/kg+125% Fabrazyme 0.5 mg/kg Replagal 0.2 mg/kg +144% +179% +267% +127% Co-Administration with Fabrazyme or Replagal Leads to Consistent Increases in Active Plasma Enzyme Levels and Tissue Uptake1
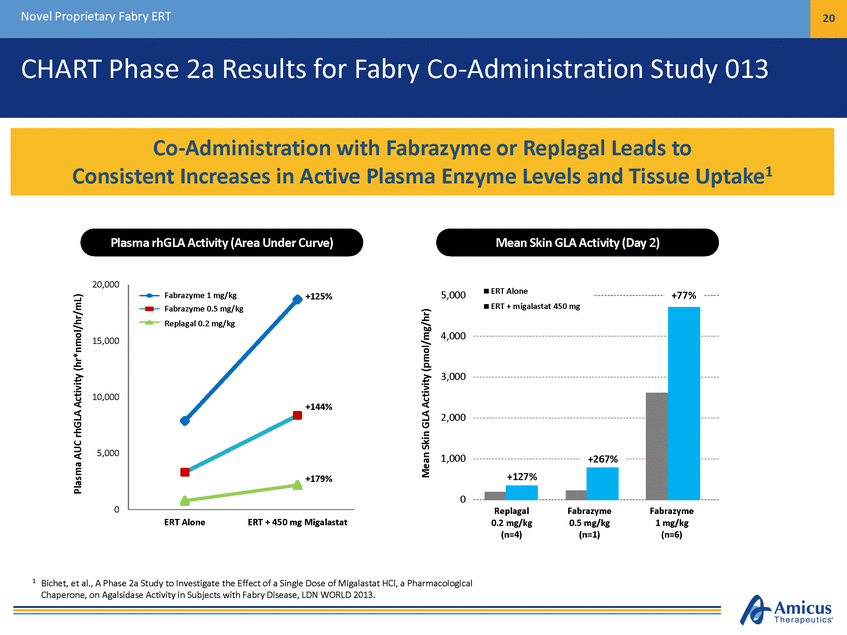
21 Fabry Franchise Fabry Franchise Strategy Galafold Amicus ERT (ERT+Chaperone) Galafold Future Innovative Therapies ERTs ERTs Yesterday Today Tomorrow Amicus Therapeutics is Committed to Delivering the Highest Quality Therapies and Future Innovation to Find a Cure for ALL Fabry Patients
ATB200NovelERTfor Pompe Disease A Proprietary, Clinical-Stage Biologics Program
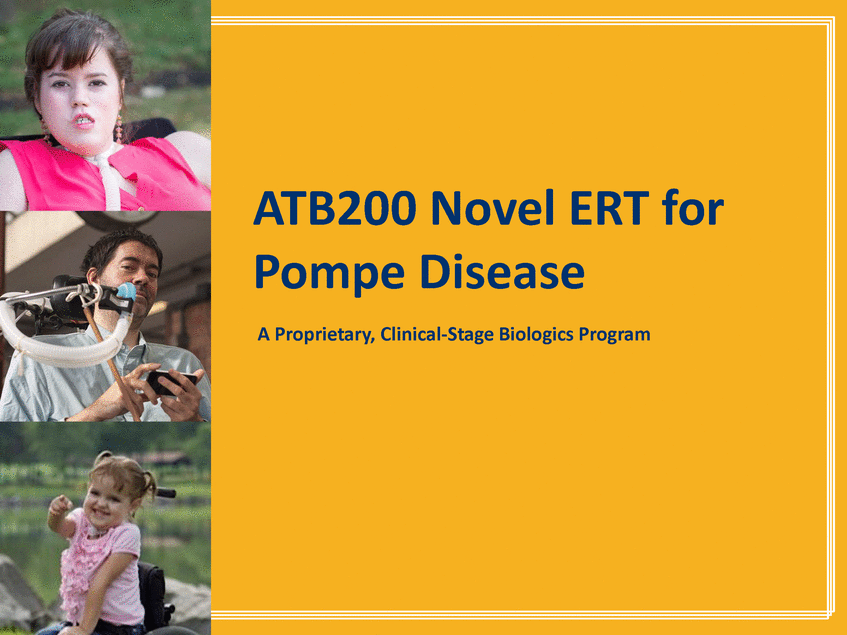
Novel ERT for Pompe Disease – ATB200 + Chaperone 23 Pompe Disease Overview • Deficiency of GAA leading to glycogen accumulation • Age of onset ranges from infancy to adulthood • Symptoms include muscle weakness, respiratory failure, and cardiomyopathy • Respiratory and cardiac failure are leading causes of morbidity and mortality 5,000 – 10,000 patients diagnosed WW1 ~$800M+ Global Pompe ERT sales in FY152 • • 1. National Institute of Neurological Disorders and Stroke (NIH). 2. Sanofi Press Release & 10-K Severe, Fatal, Genetic Disorder with Significant Unmet Medical Need
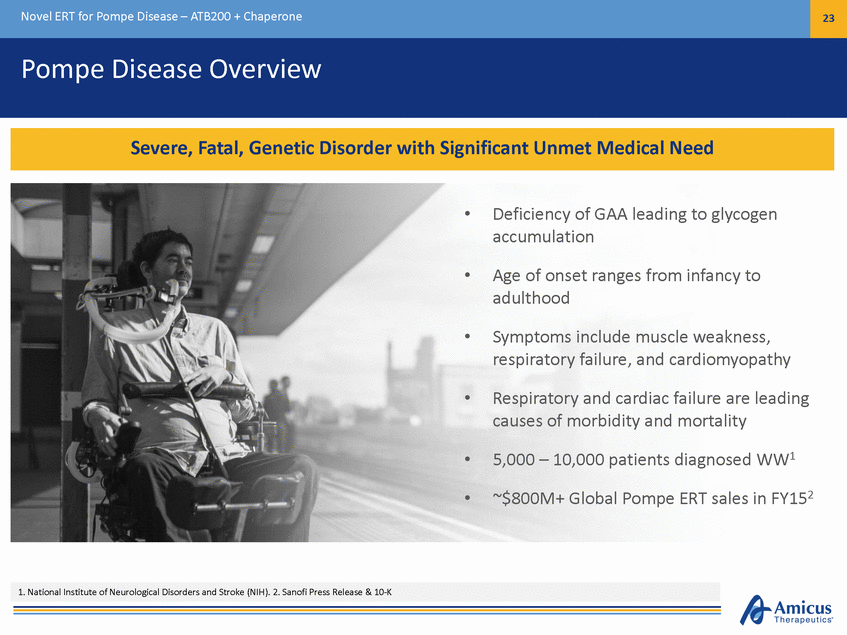
Novel ERT for Pompe Disease – ATB200 + Chaperone 24 Pompe ERT - 3 Challenges Rapid denaturation of ERT in pH of blood1 Protein Aggregation Activity/ Stability Infusion-associated Antibody titers shown to affect treatment outcomes4,5 Tolerability / Immunogenicity reactions in >50% of late-onset patients3 Low M6P receptor uptake into skeletal muscle2 Vast majority of rhGAA not delivered to lysosomes2 Uptake/ Targeting Uniquely Engineered rhGAA Optimized M6P & Carbohydrates 1Khanna et al., PLoS ONE, 2012; 2Zhu et al., Amer. Soc. Gene Therapy, 2009 June; 3Banati et al., Muscle Nerve, 2011 Dec.; 4Banugaria et al., Gen. Med., 2011 Aug.; 5de Vries et al., Mol Genet Metab., 2010 Dec. Amicus Technology Platforms with Potential to Address Challenges with Existing Pompe ERT
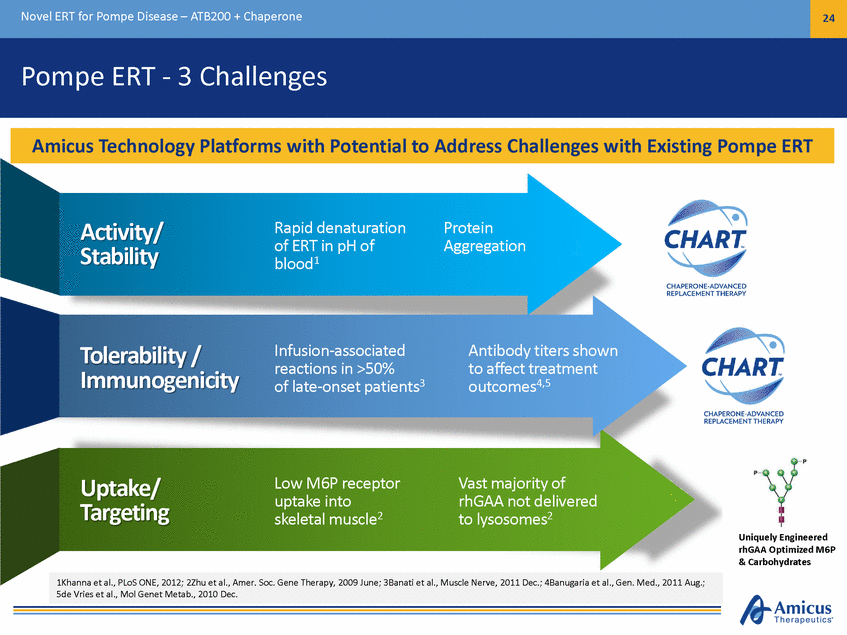
Novel ERT for Pompe Disease – ATB200 + Chaperone 25 Preclinical Proof of Concept PAS-glycogen staining in Quadriceps Alglucosidase Alfa Untreated LAMP1 ATB200 + AT2221 Wild-Type Soleus Immunohistochemical staining in Untreated ATB200 +AT2221 Wild-Type Alglucosidase Alfa LAMP1 (40x) PAS (20x) 1. Following 2 doses of 20mg/kg alglucosidase alfa or ATB200 + AT2221 in Gaa KO mice, skeletal muscles evaluated for glycogen clearance and proliferated lysosomes. Treatment with alglucosidase alfa modestly reduced glycogen or proliferated lysosomes while ATB200, co-administered with AT2221 significantly decreased the muscle pathology associated with Pompe disease. ATB200 + Chaperone Results in Improved Substrate Clearance in Preclinical Models1
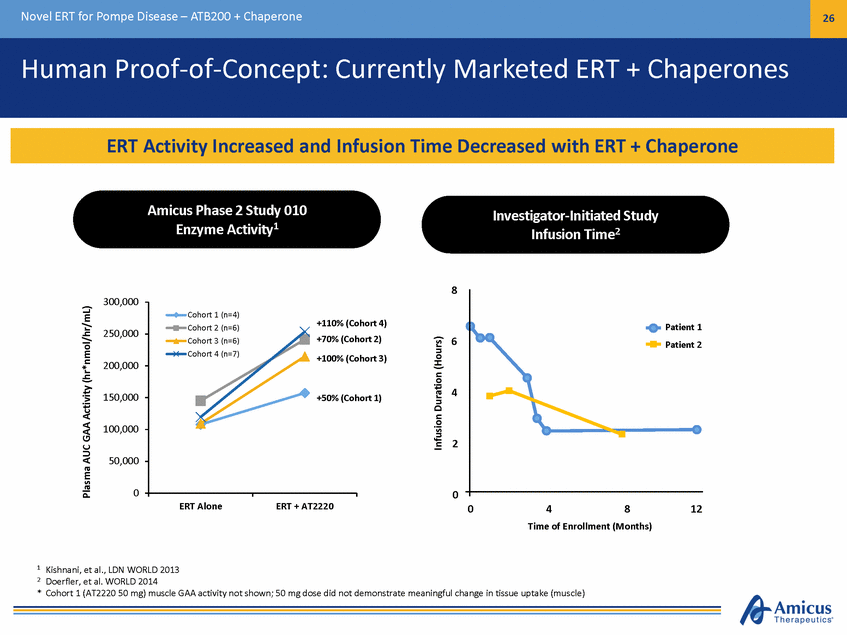
Novel ERT for Pompe Disease – ATB200 + Chaperone 26 Human Proof-of-Concept: Currently Marketed ERT + Chaperones Amicus Phase 2 Study 010 Enzyme Activity1 Investigator-Initiated Study Infusion Time2 8 300,000 (Cohort 4) hort 2) (Cohort 3) Cohort 2 (n=6) 250,000 6 200,000 4 150,000 hort 1) 100,000 2 50,000 0 0 ERT Alone ERT + AT2220 0 4 8 12 Time of Enrollment (Months) 1 2 Kishnani, et al., LDN WORLD 2013 Doerfler, et al. WORLD 2014 * Cohort 1 (AT2220 50 mg) muscle GAA activity not shown; 50 mg dose did not demonstrate meaningful change in tissue uptake (muscle) Plasma AUC GAA Activity (hr*nmol/hr/mL) Infusion Duration (Hours) Patient 1 Patient 2 Cohort 1 (n=4) +110% Cohort 3 (n=6)+70% (Co Cohort 4 (n=7)+100% +50% (Co ERT Activity Increased and Infusion Time Decreased with ERT + Chaperone
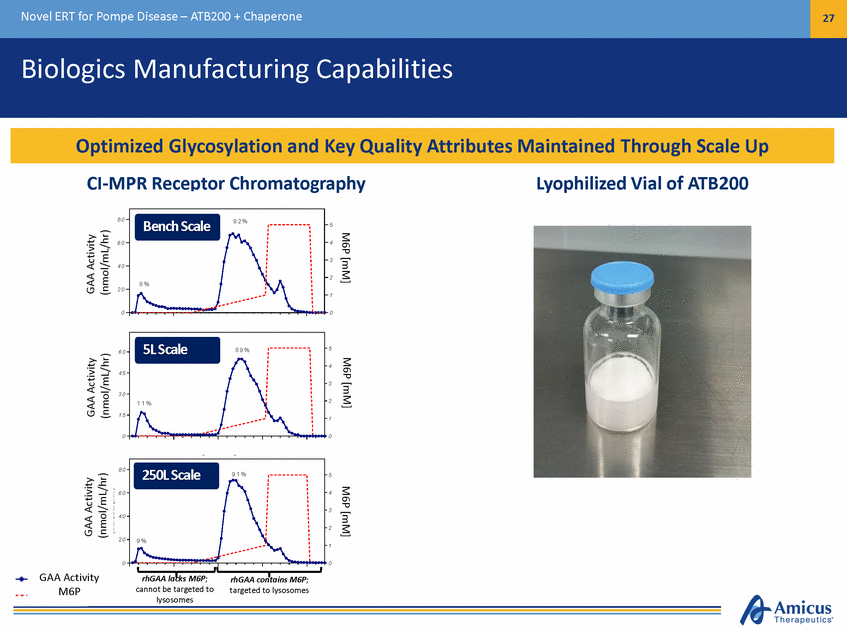
Novel ERT for Pompe Disease – ATB200 + Chaperone 27 Biologics Manufacturing Capabilities CI-MPR Receptor Chromatography Lyophilized Vial of ATB200 P r o o f o f C o n c e p t S t u d i e s 8 0 5 6 0 4 3 4 0 2 2 0 1 0 0 5 L B i o r e a c t o r R u n 5 6 0 4 4 5 3 3 0 2 1 5 1 0 0 E n g i n e e r i n g R u n 2 8 0 5 6 0 4 3 4 0 2 2 0 1 0 0 GAA Activity M6P rhGAA lacks M6P; cannot be targeted to lysosomes rhGAA contains M6P; targeted to lysosomes M6P [mM] M 6 P [ M ] MM6P6 P[m[ m M] ] MM66PP [mmMM] ] GAA Activity (nGmA AoAl/cmt i v Li t y/hr) ( n m o l / m L / h r ) GAA Activity GAA Activity (nmG AoAl/Amc tLi v/i thy r) (nmG AoAl/Amc tLi v/i thy r) ( n m o l / m L / h r ) ( n m o l / m L / h r ) 250L Scale9 1 % 9 % G A A A c t i v it y 5ML6 PS( mcMa)le 8 9 % 1 1 % 9 2 % Bench Scale 8 % Optimized Glycosylation and Key Quality Attributes Maintained Through Scale Up
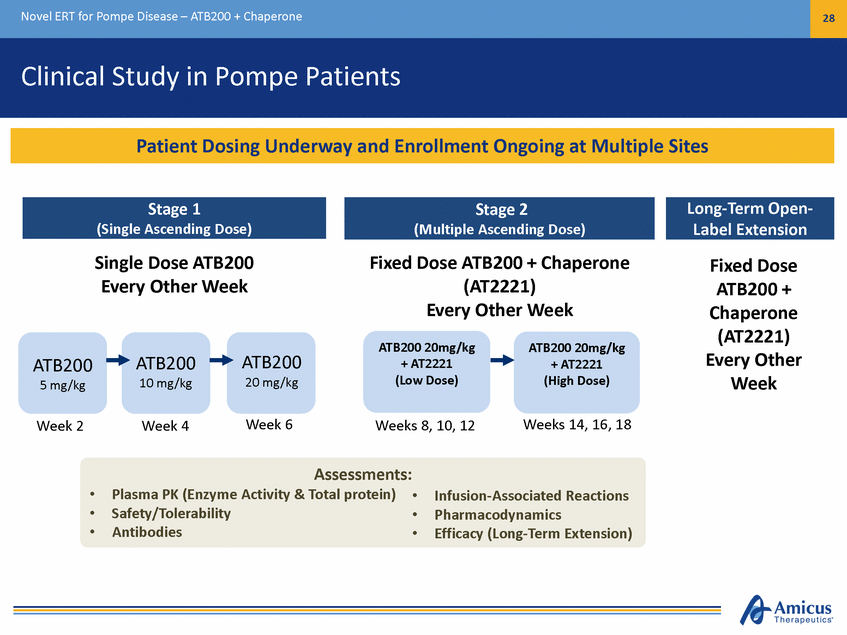
Novel ERT for Pompe Disease – ATB200 + Chaperone 28 Clinical Study in Pompe Patients Single Dose ATB200 Every Other Week Fixed Dose ATB200 + Chaperone (AT2221) Every Other Week Fixed Dose ATB200 + Chaperone (AT2221) Every Other Week ATB200 20mg/kg + AT2221 (Low Dose) ATB200 20mg/kg + AT2221 (High Dose) ATB200 20 mg/kg ATB200 10 mg/kg ATB200 5 mg/kg Week 6 Weeks 14, 16, 18 Weeks 8, 10, 12 Week 2 Week 4 Assessments: Plasma PK (Enzyme Activity & Total protein) Safety/Tolerability Antibodies • • • • • • Infusion-Associated Reactions Pharmacodynamics Efficacy (Long-Term Extension) Long-Term Open-Label Extension Stage 1 (Single Ascending Dose) Stage 2 (Multiple Ascending Dose) Patient Dosing Underway and Enrollment Ongoing at Multiple Sites
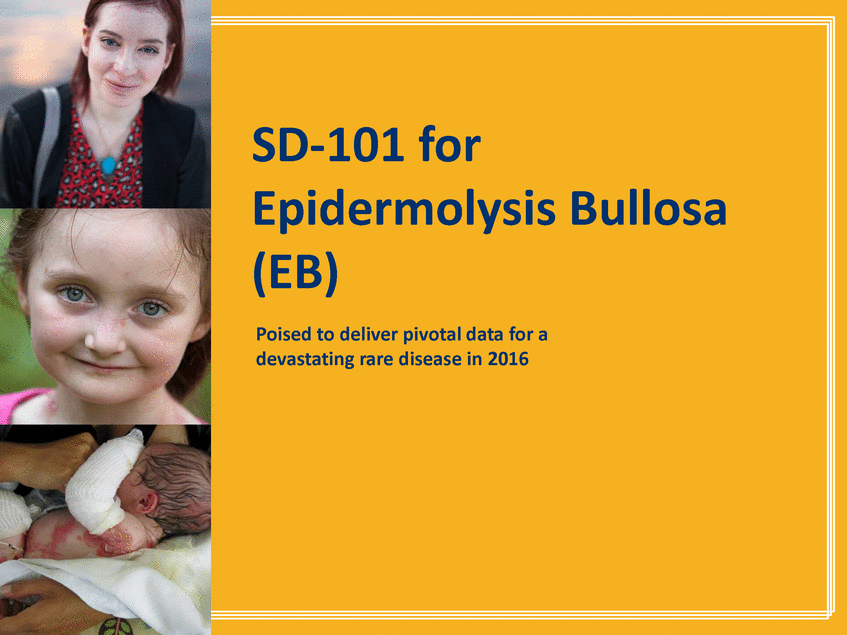
SD-101for Epidermolysis Bullosa (EB) Poised to deliver pivotal data for a devastating rare disease in 2016
SD-101 for EB 30 EB Disease Overview • Multiple genes cause disease which results in fragility of skin and can affect internal organs Diagnosed from infancy to adulthood Severe blistering, open wounds, and scarring in response to minor friction to the skin Disfiguring, excruciatingly painful, and can be fatal Given the lack of approved treatment options, any reduction in disease symptoms would be considered meaningful 30,000 – 40,000 diagnosed patients in major global regions • • • • • Rare, Devastating, Connective Tissue Disorder with No Approved Treatments
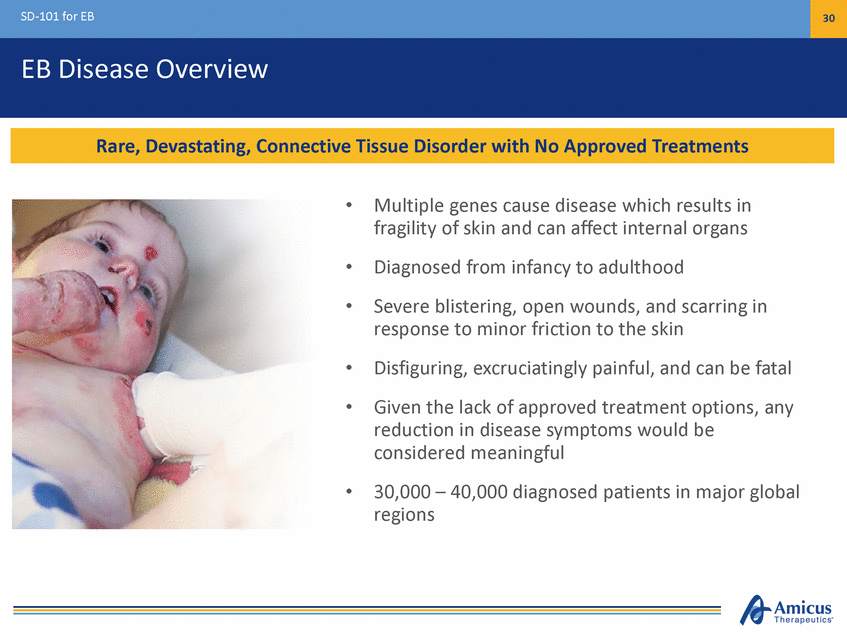
SD-101 for EB 31 Three Major EB Types Represent ~99% of EB Population I N C R E A S I N G S E V E R I T Y No Approved Therapies Today SD-101 in Development for All 3 Major Types 30,000 - 40,000 Diagnosed in Major Markets Multiple Types…Single Devastating and Fatal Genetic Disorder
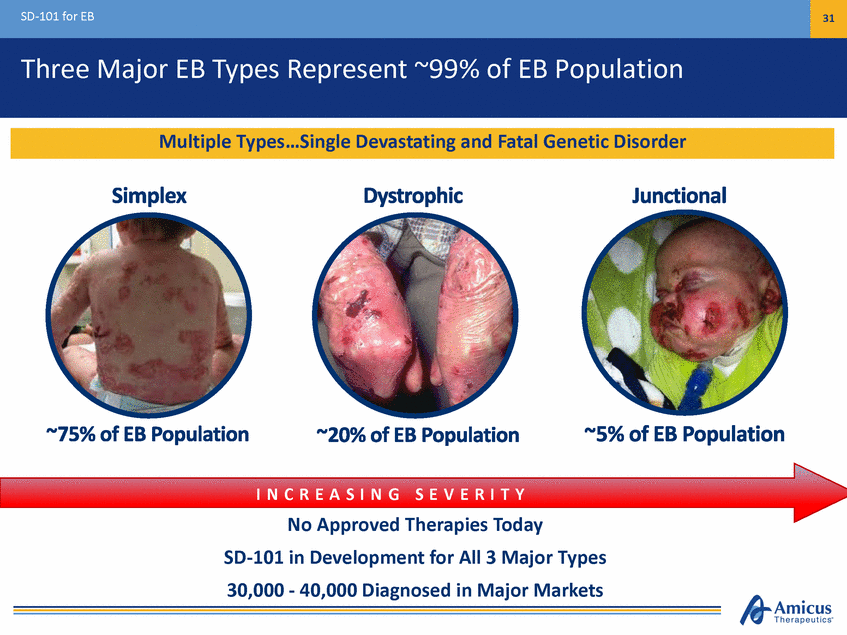
SD-101 for EB 32 U.S. Breakthrough Therapy Designation 1-Year-Old Girl with EB Simplex • • • • Open-label, 8-patient proof of concept study1 Ages 6 months – 9 years All baseline target wounds > 10 cm2 SD-101 3% applied once daily for 3 months 87.5% of patients experienced complete closure of target wounds within 1 month 57% reduction in affected body surface area by month 3 Daily administration generally safe and well-tolerated 1. Simplex (n=3), Junctional (n=3), Dystrophic (n=2) Following 2 months of treatment Baseline Key Findings Positive Early Results from Phase 2a Study Led to Breakthrough Therapy Designation
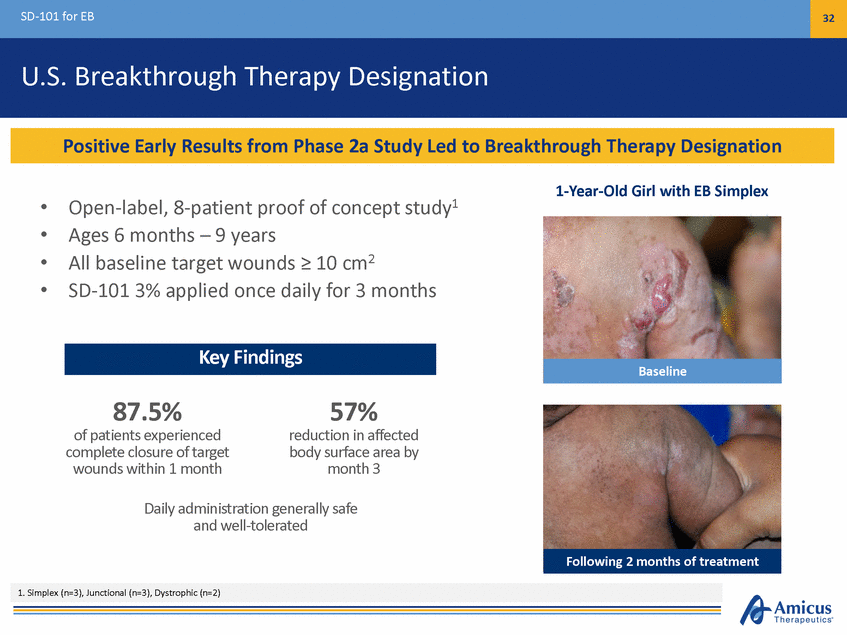
SD-101 for EB 33 Phase 2b Design (Study 003) 3-Month, Double-Blind Treatment Period1 SD-101 6% (n=15) Optional Extension (SD-004) Open-Label SD-101 6% SD-101 3% (n=16) Secondary Efficacy Endpoints Include: • • Time to target wound closure Change in Body Surface Area (BSA) of lesional skin 48 EB patients (age > 6 months)1 - 1:1:1 Randomization - Daily Topical Application 1. Assessments: 0, 14, 30, 60, 90 Days. 2. Initial Disease Severity: Mean target lesion size (cm2) 14.0 (range 5-39); mean lesional BSA: 19.4% (range 0.4-48%); mean wound age (days): 182 (range 21-1,639). EB types enrolled: Simplex (n=11), Dystrophic (n=29), and Junctional (n=8) •Baseline wound: Chronic (> 21 days), size 5-50 cm2 Placebo (n=17) Primary Efficacy Endpoint: Target Wound Healing at Month 1 42/44 Patients entered extension study $400K FDA Grant for Extension Study
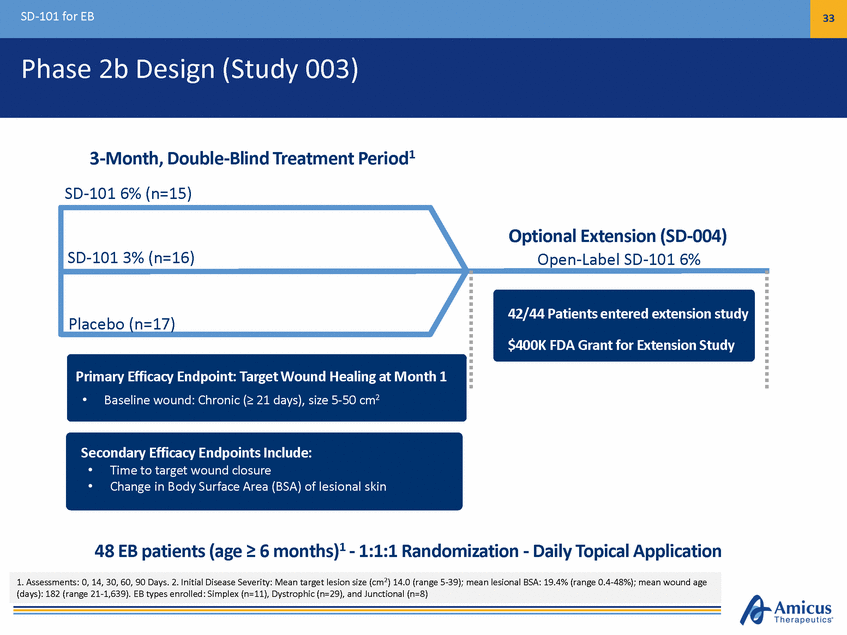
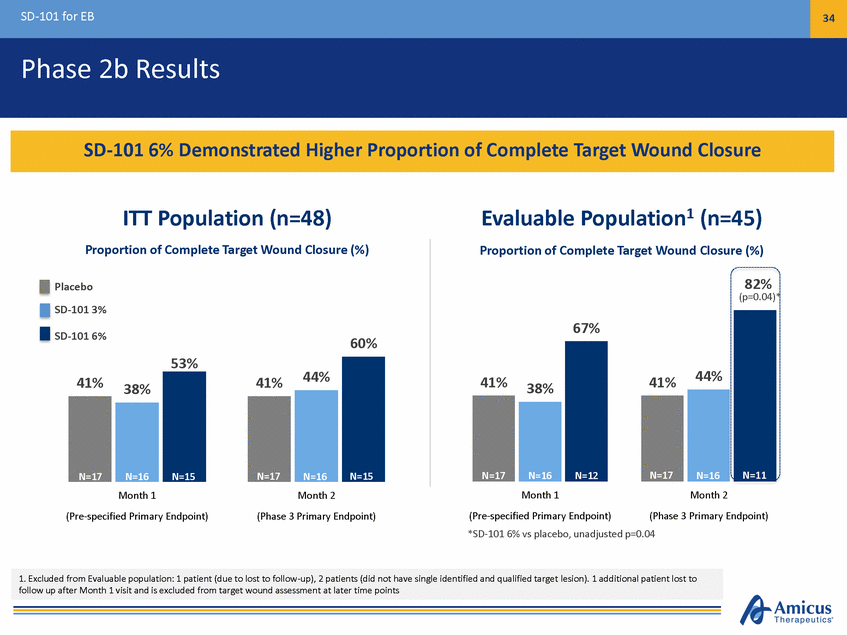
SD-101 for EB 34 Phase 2b Results Evaluable Population1 (n=45) Proportion of Complete Target Wound Closure (%) ITT Population (n=48) Proportion of Complete Target Wound Closure (%) 82% (p=0.04)* Placebo SD-101 3% 67% SD-101 6% 60% 53% 44% 44% 41% 41% 41% 41% 38% 38% N=11 Month 1 (Pre-specified Primary Endpoint) Month 2 (Phase 3 Primary Endpoint) Month 1 (Pre-specified Primary Endpoint) Month 2 (Phase 3 Primary Endpoint) *SD-101 6% vs placebo, unadjusted p=0.04 1. Excluded from Evaluable population: 1 patient (due to lost to follow-up), 2 patients (did not have single identified and qualified target lesion). 1 additional patient lost to follow up after Month 1 visit and is excluded from target wound assessment at later time points N=16 N=16 N=17 N=17 N=17 N=17 N=16 N=16 N=15 N=15 N=12 SD-101 6% Demonstrated Higher Proportion of Complete Target Wound Closure
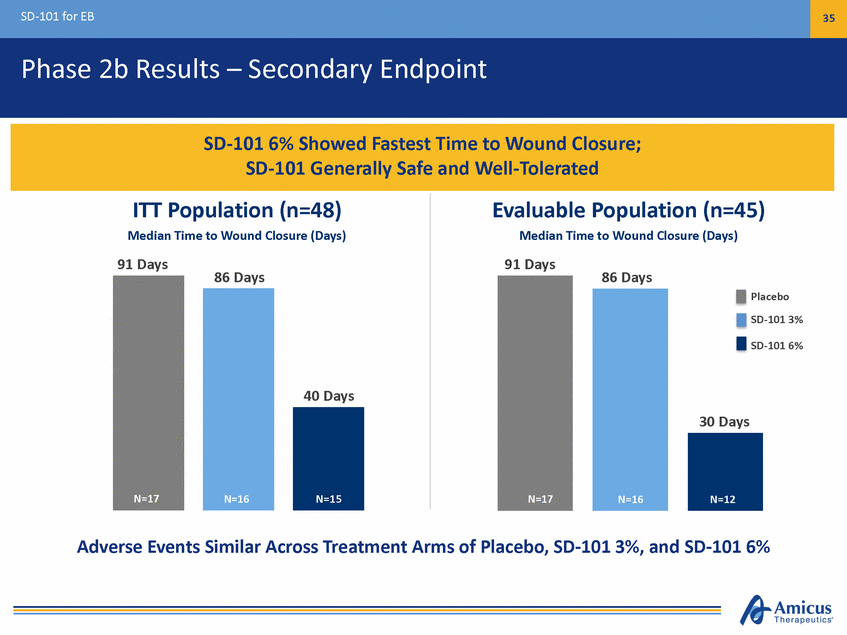
SD-101 for EB 35 Phase 2b Results – Secondary Endpoint 86 Days Adverse Events Similar Across Treatment Arms of Placebo, SD-101 3%, and SD-101 6% SD-101 6% Showed Fastest Time to Wound Closure; SD-101 Generally Safe and Well-Tolerated ITT Population (n=48) Median Time to Wound Closure (Days) 91 Days 86 Days 40 Days N=17N=16N=15 Evaluable Population (n=45) Median Time to Wound Closure (Days) 91 Days Placebo SD-101 3% SD-101 6% 30 Days N=17N=16N=12
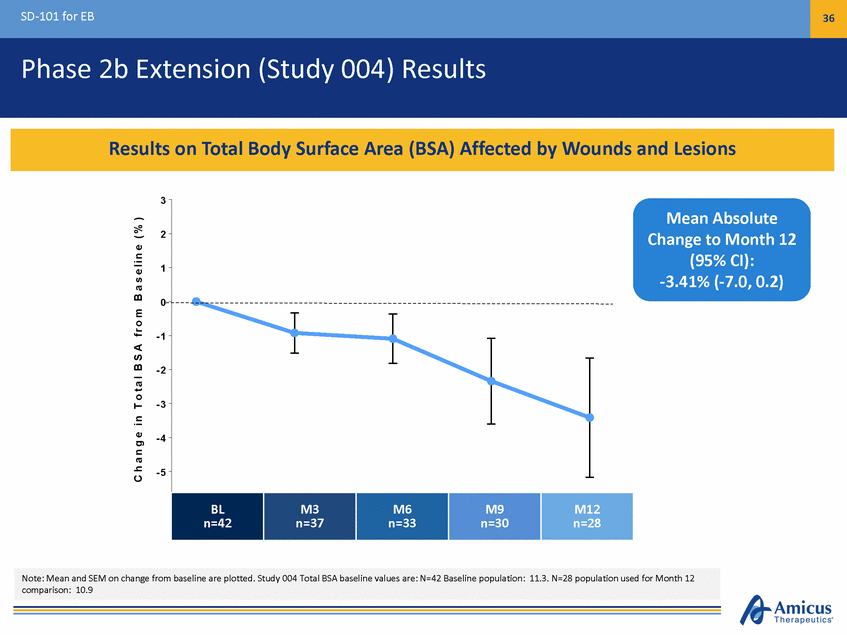
SD-101 for EB 36 Phase 2b Extension (Study 004) Results 3 Mean Absolute Change to Month 12 (95% CI): -3.41% (-7.0, 0.2) 2 1 0 - 1 - 2 - 3 - 4 - 5 n=2182 T i m e , M o n t h s C h a n g e i n T o t a l B S A f r o m B a s e l i n e ( % ) Note: Mean and SEM on change from baseline are plotted. Study 004 Total BSA baseline values are: N=42 Baseline population: 11.3. N=28 population used for Month 12 comparison: 10.9 BL B a s enl=i n4e2 M3 n3=37 M6 n=633 M9 n=390 M12 Results on Total Body Surface Area (BSA) Affected by Wounds and Lesions
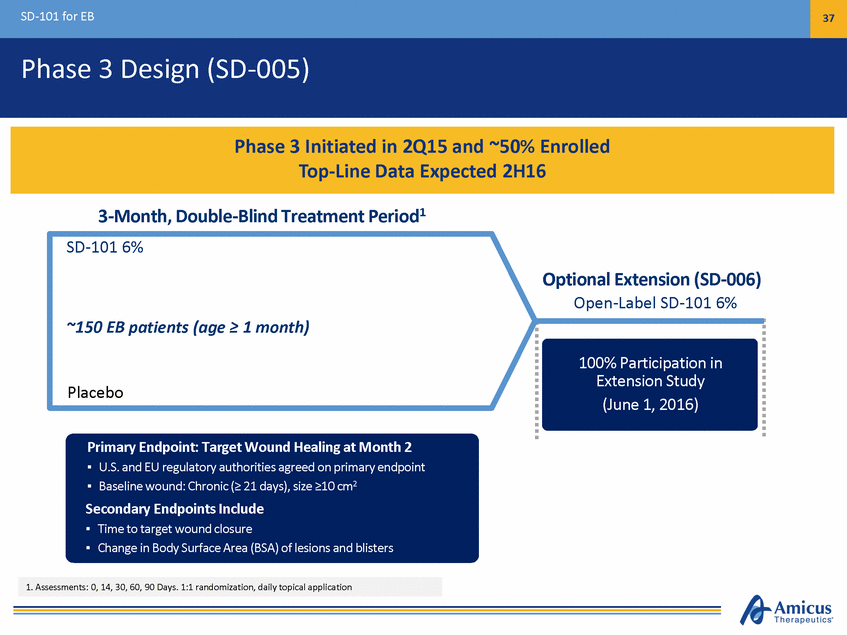
SD-101 for EB 37 Phase 3 Design (SD-005) 3-Month, Double-Blind Treatment Period1 SD-101 6% Optional Extension (SD-006) Open-Label SD-101 6% ~150 EB patients (age > 1 month) 100% Participation in tension Study (June 1, 2016) Placebo Primary Endpoint: Target Wound Healing at Month 2 P riUm.Sa. rayndEnEUdpreogiunlta:toTrayraguetthWoriotieusnadgrHeedaloingpraimt Maryoenntdhp2oint 2 UBaSsaelnindeEwUourengd:uClahtroonryica(>ut2h1odraityise),ssaizger>e1e0dcomn primary Seecnodnpdoairnyt Endpoints Include BTiamseeltionetawrgoetuwnodu: nCdhcrloonsuicre(> 21 days), size >10 cm2 Change in Body Surface Area (BSA) of lesions and blisters 1. Assessments: 0, 14, 30, 60, 90 Days. 1:1 randomization, daily topical application 44/44 Patients Have Continued in Open-Label Ex Extension (Jan. 8, 2015) Phase 3 Initiated in 2Q15 and ~50% Enrolled Top-Line Data Expected 2H16
SD-101 for EB 38 Phase 3 Design (SD-005) 3-Month, Double-Blind Treatment Period SD-101 6% Optimal concentration Optional Extension (SD-006) Open-Label SD-101 6% Sample Size (p < 0.05 if treatment difer) ~150 EB patients (age > 1 month) ference ~17% or great 100% Participation in tension Study (June 1, 2016) Placebo Primary Endpoint: Target Wound Healing at Month 2 P riUm.Sa. rayndEnEUdpreogiunlta:toTrayraguetthWoriotieusnadgrHeedaloingpraimt Maryoenntdhp2oint Increases Ability to Distinguish SD-101 vs. Placebo1 2 UBaSsaelnindeEwUourengd:uClahtroonryica(>ut2h1odraityise),ssaizger>e1e0dcomn primary Seecnodnpdoairnyt Endpoints Include BTiamseeltionetawrgoetuwnodu: nCdhcrloonsuicre(> 21 days), size >10 cm2 Change in Body Surface Area (BSA) of lesions and blisters 1. Complete target wound closure in patients with target wounds > 10 cm2 at Month 2 in Phase 2b: SD-101 6% - 50% (n= 4) vs. Placebo - 12.5% (n=8) 44/44 Patients Have Continued in Open-Label Ex Extension (Jan. 8, 2015) Study Design Incorporates Key Learnings from Phase 2b Study
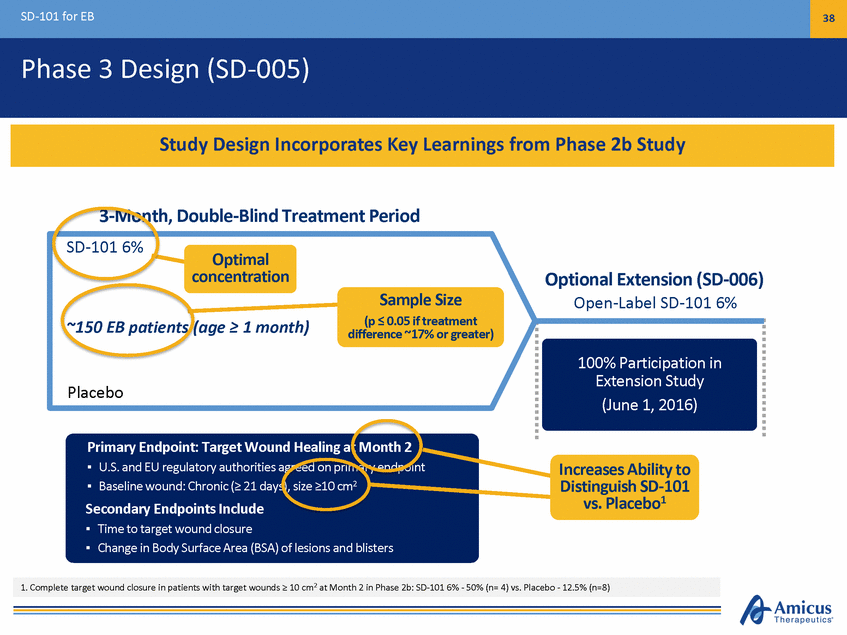
SD-101 for EB 39 Global Regulatory Strategy • • • EU orphan drug designation Approved Paediatric Investigation Plan (PIP) Defined regulatory pathway • U.S. Breakthrough Therapy designation (BTD) based on Phase 2 POC U.S. orphan drug designation Rolling NDA initiated 4Q15 • • • ROW regulatory strategy based on EMA and FDA submissions Positive FDA and EMA Feedback on Phase 3 Study Design
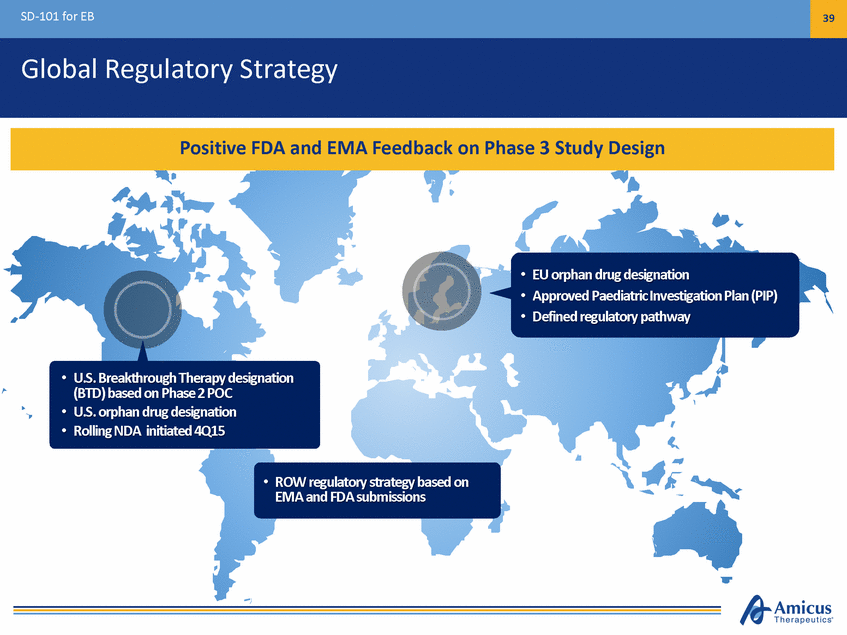
SD-101 for EB 40 $1B+ Commercial Potential Diagnosed EB Patients by Geography (U.S., EU3, Japan) • No approved treatments, opportunity for first-in-class Promising proof of concept in all EB types • Japan 13% • Physicians indicate usage in 100% patients Payers indicate support for broad reimbursement if approved U.S. 52% EU3 35% • • 30,000 – 40,000 diagnosed patients in major markets KOLs expect diagnosis rates to increase • Large Commercial Opportunity Strong Support Among Surveyed Stakeholders Significant Unmet Clinical Need KOL Feedback Supports Profound Unmet Medical Need and Broad Usage in All EB Types
FinancialSummary Strong Balance Sheet to Invest in Rare Disease Pipeline
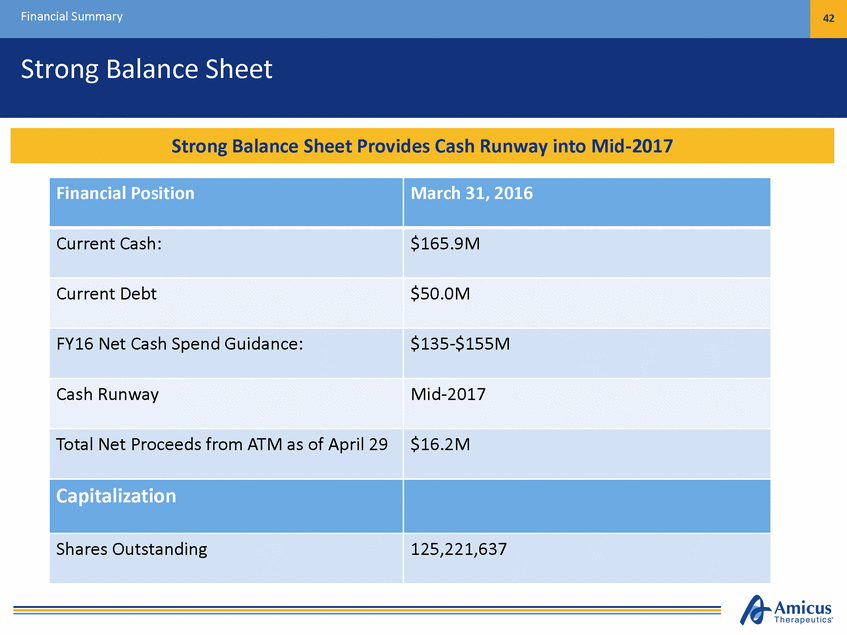
Financial Summary 42 Strong Balance Sheet Financial Position March 31, 2016 Current Cash: $165.9M Current Debt $50.0M FY16 Net Cash Spend Guidance: $135-$155M Cash Runway Mid-2017 Total Net Proceeds from ATM as of April 29 $16.2M Capitalization Shares Outstanding 125,221,637 Cash PosSittiroonnPgrBoavliadnecseRSuhneweat yPrUonvdideersCCuarrsehnRtuOnpwearaytiintgoPMlaind-i2n0to17mid-2017
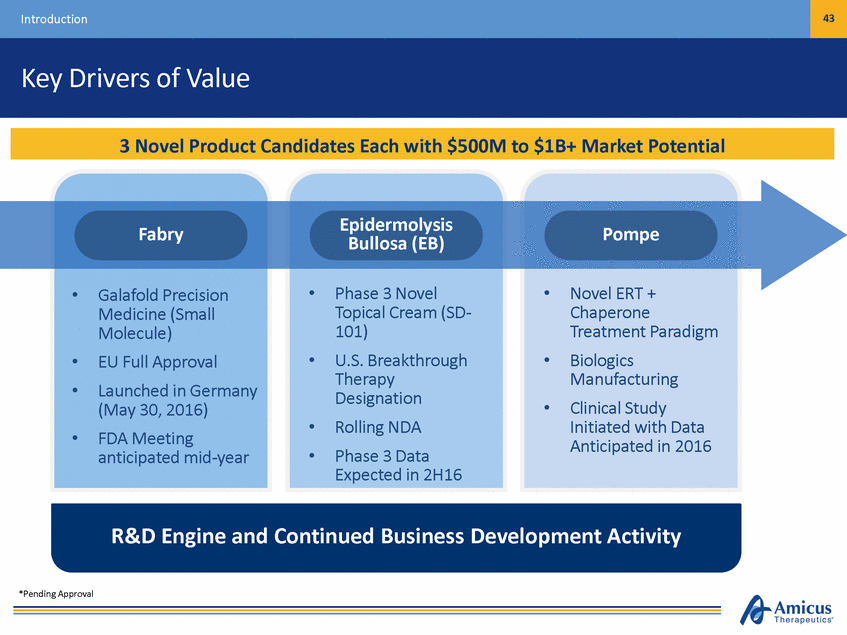
43 Introduction Key Drivers of Value Epidermolysis Bullosa (EB) Fabry Pompe • • Phase 3 Novel Topical Cream (SD-101) U.S. Breakthrough Therapy Designation Rolling NDA Phase 3 Data Expected in 2H16 Novel ERT + Chaperone Treatment Paradigm Biologics Manufacturing Clinical Study Initiated with Data Anticipated in 2016 • Galafold Precision Medicine (Small Molecule) EU Full Approval Launched in Germany (May 30, 2016) FDA Meeting anticipated mid-year • • • • • • • • R&D Engine and Continued Business Development Activity *Pending Approval 3 Novel Product Candidates Each with $500M to $1B+ Market Potential
Thank You © A M I C U S T H E R A P E U T I C S . C R A N B U R Y , NJ . 2 0 1 6

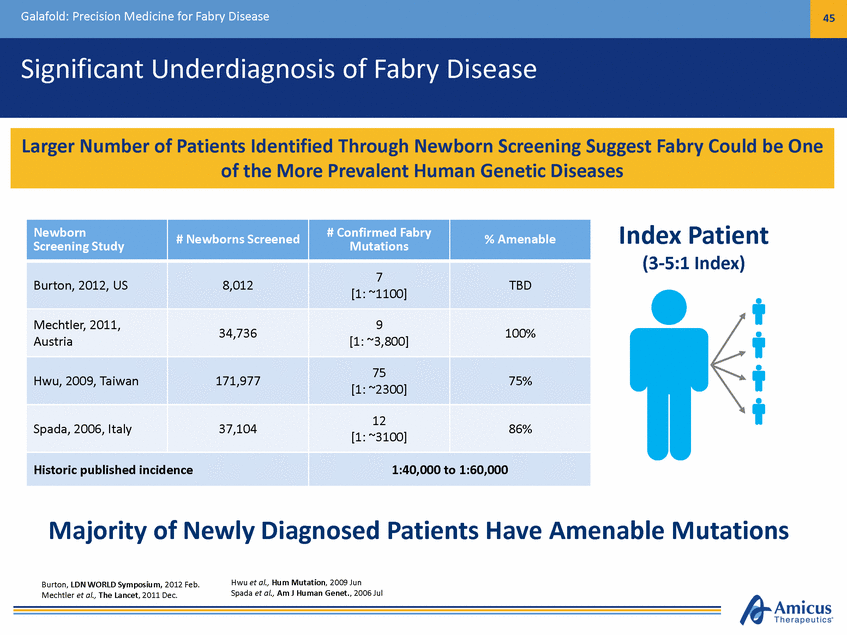
Galafold: Precision Medicine for Fabry Disease 45 Significant Underdiagnosis of Fabry Disease Index Patient (3-5:1 Index) Majority of Newly Diagnosed Patients Have Amenable Mutations Hwu et al., Hum Mutation, 2009 Jun Spada et al., Am J Human Genet., 2006 Jul Burton, LDN WORLD Symposium, 2012 Feb. Mechtler et al., The Lancet, 2011 Dec. Newborn Screening Study # Newborns Screened # Confirmed Fabry Mutations % Amenable Burton, 2012, US 8,012 7 [1: ~1100] TBD Mechtler, 2011, Austria 34,736 9 [1: ~3,800] 100% Hwu, 2009, Taiwan 171,977 75 [1: ~2300] 75% Spada, 2006, Italy 37,104 12 [1: ~3100] 86% Historic published incidence 1:40,000 to 1:60,000 Larger Number of Patients Identified Through Newborn Screening Suggest Fabry Could be One of the More Prevalent Human Genetic Diseases
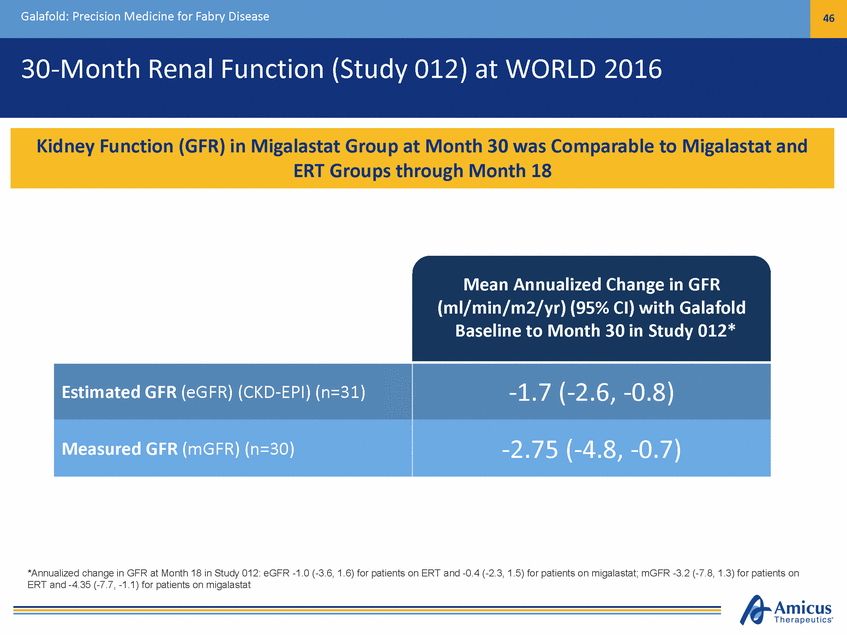
Galafold: Precision Medicine for Fabry Disease 46 30-Month Renal Function (Study 012) at WORLD 2016 Mean Annualized Change in GFR (ml/min/m2/yr) (95% CI) with Galafold Baseline to Month 30 in Study 012* *Annualized change in GFR at Month 18 in Study 012: eGFR -1.0 (-3.6, 1.6) for patients on ERT and -0.4 (-2.3, 1.5) for patients on migalastat; mGFR -3.2 (-7.8, 1.3) for patients on ERT and -4.35 (-7.7, -1.1) for patients on migalastat Estimated GFR (eGFR) (CKD-EPI) (n=31) -1.7 (-2.6, -0.8) Measured GFR (mGFR) (n=30) -2.75 (-4.8, -0.7) Kidney Function (GFR) in Migalastat Group at Month 30 was Comparable to Migalastat and ERT Groups through Month 18
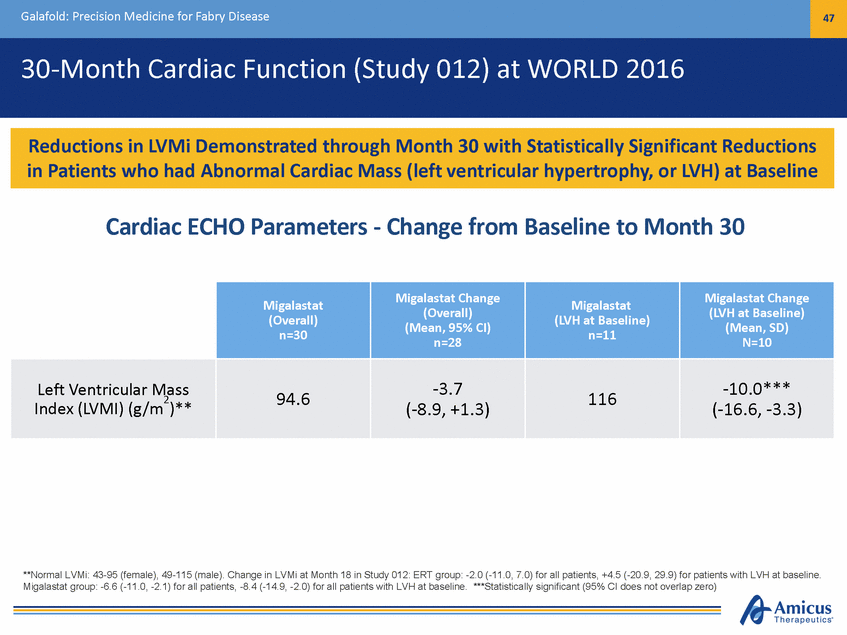
Galafold: Precision Medicine for Fabry Disease 47 30-Month Cardiac Function (Study 012) at WORLD 2016 Cardiac ECHO Parameters - Change from Baseline to Month 30 (LVH at Baseline) N=10 **Normal LVMi: 43-95 (female), 49-115 (male). Change in LVMi at Month 18 in Study 012: ERT group: -2.0 (-11.0, 7.0) for all patients, +4.5 (-20.9, 29.9) for patients with LVH at baseline. Migalastat group: -6.6 (-11.0, -2.1) for all patients, -8.4 (-14.9, -2.0) for all patients with LVH at baseline. ***Statistically significant (95% CI does not overlap zero) Migalastat (Overall) n=30 Migalastat Change (Overall) (Mean, 95% CI) n=28 Migalastat (LVH at Baseline) n=11 Migalastat Change (Mean, SD) Left Ventricular Mass 2 Index (LVMI) (g/m )** 94.6 -3.7 (-8.9, +1.3) 116 -10.0*** (-16.6, -3.3) Reductions in LVMi Demonstrated through Month 30 with Statistically Significant Reductions in Patients who had Abnormal Cardiac Mass (left ventricular hypertrophy, or LVH) at Baseline
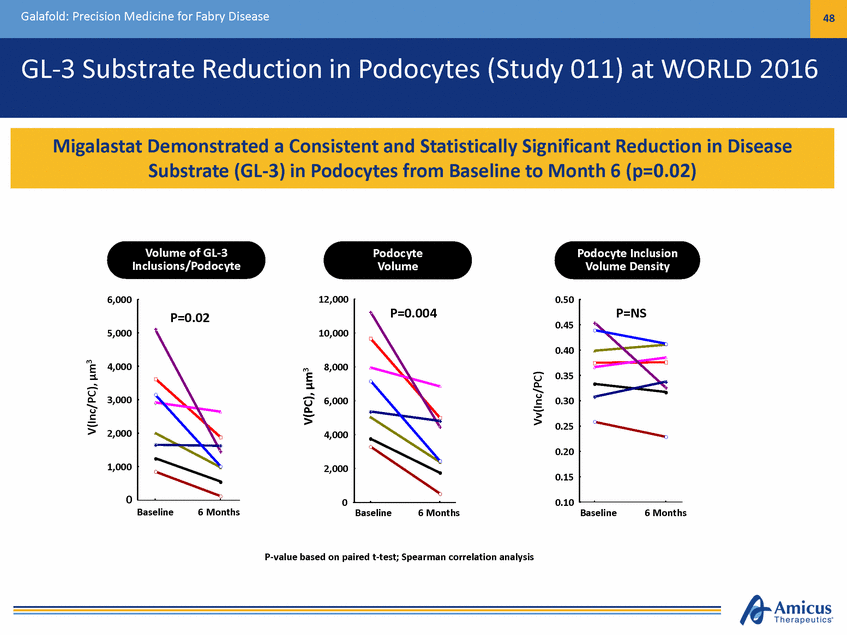
Galafold: Precision Medicine for Fabry Disease 48 GL-3 Substrate Reduction in Podocytes (Study 011) at WORLD 2016 Volume of GL-3 Inclusions/Podocyte Podocyte Volume Podocyte Inclusion Volume Density 6,000 12,000 0.50 0.45 5,000 10,000 0.40 4,000 8,000 0.35 3,000 6,000 0.30 0.25 2,000 4,000 0.20 1,000 2,000 0.15 0 0 0.10 Baseline 6 Months Baseline 6 Months Baseline 6 Months P-value based on paired t-test; Spearman correlation analysis V(Inc/PC), µm3 V(PC), µm3 Vv(Inc/PC) P=0.004 P=0.02 P=NS Migalastat Demonstrated a Consistent and Statistically Significant Reduction in Disease Substrate (GL-3) in Podocytes from Baseline to Month 6 (p=0.02)
