Attached files
| file | filename |
|---|---|
| EX-31.1 - EX-31.1 - UNIFIED GROCERS, INC. | d111620dex311.htm |
| EX-32.2 - EX-32.2 - UNIFIED GROCERS, INC. | d111620dex322.htm |
| EX-32.1 - EX-32.1 - UNIFIED GROCERS, INC. | d111620dex321.htm |
| EX-31.2 - EX-31.2 - UNIFIED GROCERS, INC. | d111620dex312.htm |
| EX-21 - EX-21 - UNIFIED GROCERS, INC. | d111620dex21.htm |
| EX-10.31 - EX-10.31 - UNIFIED GROCERS, INC. | d111620dex1031.htm |
| EX-10.30 - EX-10.30 - UNIFIED GROCERS, INC. | d111620dex1030.htm |
Table of Contents
United States
Securities and Exchange Commission
Washington, D.C. 20549
Form 10-K
(Mark One)
x Annual report pursuant to Section 13 or 15(d) of the Securities
Exchange Act of 1934 for the fiscal year ended October 3, 2015 or
¨ Transition report pursuant to Section 13 or 15(d) of the
Securities Exchange Act of 1934 for the transition period from to
Commission file number: 0-10815
Unified Grocers, Inc.
(Exact name of registrant as specified in its charter)
California
(State or other jurisdiction of incorporation or organization)
| I.R.S. Employer Identification No.: 95-0615250 | ||
| 5200 Sheila Street, Commerce, CA |
90040 | |
| (Address of principal executive offices) |
(Zip Code) | |
Registrant’s telephone number, including area code: (323) 264-5200
Securities registered pursuant to Section 12(b) of the Act: None
Securities registered pursuant to Section 12(g) of the Act:
| Title of each class | ||
| Class A Shares |
||
| Class B Shares |
||
| Class E Shares |
Indicate by check mark if the registrant is a well-known seasoned issuer, as defined in Rule 405 of the Securities Act. Yes ¨ No x
Indicate by check mark if the registrant is not required to file reports pursuant to Section 13 or Section 15(d) of the Act. Yes ¨ No x
Indicate by check mark whether the registrant (1) has filed all reports required to be filed by Section 13 or 15(d) of the Securities Exchange Act of 1934 during the preceding 12 months (or for such shorter period that the registrant was required to file such reports), and (2) has been subject to such filing requirements for the past 90 days. Yes ¨ No x
Indicate by check mark whether the registrant has submitted electronically and posted on its corporate Web site, if any, every Interactive Data File required to be submitted and posted pursuant to Rule 405 of Regulation S-T (§232.405 of this chapter) during the preceding 12 months (or for such shorter period that the registrant was required to submit and post such files). Yes ¨ No x
Indicate by check mark if disclosure of delinquent filers pursuant to Item 405 of Regulation S-K (§229.405) is not contained herein, and will not be contained, to the best of registrant’s knowledge, in definitive proxy or information statements incorporated by reference in Part III of this Form 10-K or any amendment to this Form 10-K. ¨
Indicate by check mark whether the registrant is a large accelerated filer, an accelerated filer, a non-accelerated filer, or a smaller reporting company. See definitions of “large accelerated filer,” “accelerated filer” and “smaller reporting company” in Rule 12b-2 of the Exchange Act. (Check one):
| Large accelerated filer ¨ | Accelerated filer ¨ | Non-accelerated filer x | Smaller reporting company ¨ | |||
| (Do not check if a smaller reporting company) | ||||||
Indicate by check mark whether the registrant is a shell company (as defined in Rule 12b-2 of the Exchange Act). Yes ¨ No x
State the aggregate market value of the voting and non-voting common equity held by non-affiliates computed by reference to the price at which the common equity was last sold, or the average bid and asked price of such common equity, as of the last business day of the registrant’s most recently completed second fiscal quarter. There is no public market for the Company’s voting and non-voting common equity.
The number of shares outstanding of each of the registrant’s classes of common stock, as of May 28, 2016, was as follows:
| Class A: 122,500 shares | Class B: 410,537 shares | Class C: 15 shares | Class E: 120,550 shares |
Documents Incorporated By Reference: None.
Table of Contents
Table of Contents
Part I
Unified Grocers, Inc. (referred to in this Form 10-K, together with its consolidated subsidiaries, as “Unified,” the “Company,” “we,” “us” or “our”) is filing this comprehensive Annual Report on Form 10-K for the fiscal years ended October 3, 2015 and September 27, 2014 and the quarterly periods ended December 27, 2014, March 28, 2015 and June 27, 2015 (the “Comprehensive Form 10-K”) as part of its efforts to become current in its filing obligations under the Securities Exchange Act of 1934, as amended (the “Exchange Act”). Although the Company has regularly made filings through Current Reports on Form 8-K when deemed appropriate, this Comprehensive Form 10-K is the Company’s first Annual Report on Form 10-K filed with the Securities and Exchange Commission (the “SEC”) since the filing of its Annual Report on Form 10-K for the year ended September 28, 2013. Included in this Comprehensive Form 10-K are the Company’s audited consolidated financial statements for the fiscal years ended October 3, 2015 and September 27, 2014, which have not been previously filed with the SEC, as well as the audited consolidated financial statements for the fiscal year ended September 28, 2013. In addition, the Company’s last Quarterly Report on Form 10-Q filed with the SEC was for the three months ended June 28, 2014. As a result, the Comprehensive Form 10-K includes selected, unaudited quarterly financial information of the Company for fiscal 2015 and 2014. It also includes selected financial data for the years ended September 28, 2013, September 29, 2012 and October 1, 2011.
Background
In its Notification of Late Filing on Form 12b-25 dated December 19, 2014 with respect to the Company’s Annual Report on Form 10-K for the year ended September 27, 2014, the Company announced that the Audit Committee of the Company’s Board of Directors (“Audit Committee”) was conducting, with the assistance of independent legal counsel, an investigation of issues relating to the setting of case reserves and management of claims by the Company’s former insurance subsidiaries and related matters (the “Audit Committee Investigation”).
As described further in Item 1, “Business—Audit Committee Investigation,” on or about November 2015, the Audit Committee Investigation concluded, and the Audit Committee determined, among other things, that:
| · | As described in Note 2, “Audit Committee Investigation,” in Part II, Item 8, “Financial Statements and Supplementary Data,” historical case reserving practices at the former insurance subsidiaries were not in compliance with policies and procedures of the former insurance subsidiaries, certain members of Unified and Springfield management were on notice of, but did not timely address, this lack of compliance, and such compliance issues led to errors in the historical accounting for insurance reserves. Management has determined that the quantitative effect and qualitative nature of the errors do not require restatement and re-issuance of previously issued financial statements. Certain current and former Company officers signed management representation letters and certifications attesting, to the best of each signatory’s knowledge, to the adequacy of internal controls and that all deficiencies in the design or operation of internal controls over financial reporting (“ICFR”) had been disclosed to the Company’s auditors and the Audit Committee. Over time, those officers became aware of deficiencies in case reserving and claims handling practices at Springfield Insurance Company (“SIC”). Management has now concluded that there were deficiencies in the Company’s ICFR environment (see Part II, Item 9A, “Controls and Procedures,” for further information regarding management’s assessment of internal controls over financial reporting, and related remediation efforts); |
| · | The disclosure language in the Company’s Form 10-K for the fiscal year ended September 27, 2013, in Item 7, “Management’s Discussion and Analysis of Financial Condition and Results of Operations,” which stated “[t]he increase is primarily due to increased claims development[,]” was arguably deficient. The disclosure language in the Company’s Quarterly Report on Form 10-Q for the 39-week period ending June 28, 2014, in Part I, Item 2, “Management’s Discussion and Analysis of Financial Condition and Results of Operations,” which stated “this increase was primarily due to an increase in workers’ compensation reserves for adverse claims development in the California workers’ compensation marketplace” was deficient and inaccurate (see Note 2, “Audit Committee Investigation,” in Part II, Item 8, “Financial Statements and Supplementary Data,” for further information on case reserving practices); |
1
Table of Contents
| · | Neither the Company nor SIC had adequate policies or procedures governing the review, approval, and disclosure of interested party transactions. SIC entered into a related party transaction in fiscal year 2012 (“the 2012 transaction”) that was not evaluated for further scrutiny or disclosure. Certain current and former officers of SIC and the Company signed management representation letters attesting, to the best of each signatory’s knowledge, that all related party transactions had been appropriately identified, recorded, and disclosed in the Company’s financial statements, even though they knew that the 2012 transaction (which was negotiated at arms-length and incorrectly not identified as a related party transaction) had not been disclosed. The Audit Committee has concluded that the 2012 transaction (i) was a related party transaction that should have been, but was not, presented for review and approval to the Unified Board of Directors, and (ii) should have been, but was not, disclosed as a related party transaction in the Company’s fiscal year 2012 Form 10-K. The Audit Committee determined the continuing deficiencies in the Company’s policies and procedures governing the initial identification, review, approval and disclosure of related party transactions require remediation. See Note 20, “Related Party Transactions,” in Part II, Item 8, “Financial Statements and Supplementary Data,” for further information on the 2012 transaction and Part II, Item 9A, “Controls and Procedures,” for further information regarding related remediation efforts; |
| · | Certain customers affiliated with directors experienced a degree of control with respect to administrative claims handling processes that was inconsistent with SIC policies. While the specific issues are related to the former insurance subsidiaries, the Company has concluded that this finding, taken together with those described above, require a review of the Company’s ethics and compliance program as part of its remediation efforts; and |
| · | No member of Company management purposefully engaged in any wrongful or fraudulent conduct in connection with the matters addressed by the Audit Committee Investigation. |
In conjunction with the findings of the Audit Committee Investigation, and in consultation with outside actuarial professionals engaged by the Audit Committee and by the Company, management has concluded that errors existed in the insurance reserves reported within the Company’s previously issued financial statements. Management has determined that the quantitative effect and qualitative nature of the errors do not require restatement and re-issuance of previously issued financial statements. As disclosed in Note 3, “Assets Held for Sale/Discontinued Operations,” in Part II, Item 8, “Financial Statements and Supplementary Data,” the Company’s Insurance segment was sold in October 2015 and will no longer be part of the Company’s continuing operations.
In order to correct the insurance reserves errors, the discontinued operations of SIC (one of the Company’s former insurance subsidiaries) for the fiscal year ended September 27, 2014, include cumulative additional expense for insurance reserves applicable to prior fiscal periods on a pre-tax and after tax basis of approximately $2.0 million and $1.9 million, respectively. Had this expense been recorded in the proper periods, pre-tax and after tax earnings (loss) from discontinued operations for fiscal 2014 would have been $4.2 million and $2.1 million higher, respectively; pre-tax and after tax earnings (loss) for fiscal 2013 would have been $2.9 million and 1.9 million higher respectively; and retained earnings as of September 30, 2012 would have been $6.0 million lower. This cumulative additional expense recorded in fiscal 2014 in discontinued operations was caused by the Company’s inconsistent application of its established policies for setting case reserves related to workers’ compensation claims in prior periods in conjunction with the failure to timely notify the actuaries of such inconsistent application.
In addition, as further explained in Note 20, “Related Party Transactions,” in Part II, Item 8, “Financial Statements and Supplementary Data,” an additional related party transaction with a member director occurring during fiscal year 2012 and involving the restructuring of a portfolio of workers compensation policies, has been disclosed.
Internal Control Considerations
In connection with the Audit Committee Investigation, management has evaluated the design and effectiveness of our disclosure controls and procedures and the effectiveness of the Company’s internal control over financial reporting as of the end of the period covered by this report. Based upon such evaluation, management has determined that the Company had material weaknesses in its internal control over financial reporting as of October 3, 2015 related to (i) the oversight and monitoring of subsidiary and operating unit compliance with accounting and reporting policies and procedures, and (ii) controls over ensuring accurate and complete
2
Table of Contents
disclosures in the Company’s financial statements and SEC reports. As a result, management has determined that the Company’s disclosure controls and procedures and internal control over financial reporting were not effective as of October 3, 2015.
Notwithstanding such material weaknesses, which are described below, our management has concluded that the consolidated financial statements included in this Form 10-K present fairly, in all material respects, our financial position, results of operations and cash flows for the periods presented in conformity with accounting principles generally accepted in the United States of America.
Company remediation efforts include assessment of and improvements to its policies and procedures over related party transactions, internal controls over financial reporting, oversight of subsidiaries and operating units, as well as its overall compliance and ethics program and related corporate culture. For further information regarding management’s assessment of internal controls over financial reporting, and related remediation efforts, see Part II, Item 9A, “Controls and Procedures,” in this Comprehensive Form 10-K.
The following information should be read in conjunction with the “Risk Factors” discussed in Item 1A of this Form 10-K for an understanding of the negative variables that can affect our business and results of operations.
Business Overview
Unified Grocers, Inc. is a California corporation organized in 1922 and incorporated in 1925. We are a retailer-owned, grocery wholesale cooperative serving supermarket, specialty, restaurant supply (through Cash & Carry Stores, LLC, a wholly-owned subsidiary of Smart & Final, Inc.) and convenience store operators located primarily in the western United States and the Pacific Rim. We sell a wide variety of products typically found in supermarkets, including dry grocery, frozen food, deli, ethnic, gourmet, specialty foods, natural and organic, general merchandise, health and beauty care, service deli, service bakery, meat, eggs, produce, bakery and dairy products. We also provide financing services to our customers, as well as various support services, including merchandising, retail pricing, advertising, promotional planning, retail technology, equipment purchasing and real estate services. The availability of specific products and services may vary by geographic region. We have three separate geographical and marketing regions: Southern California, Northern California and the Pacific Northwest.
Our customers are comprised of our owners (“Members”) and non-owners (“Non-Members”). Our focus is on our Members, but we also do business with Non-Member customers. Our Members operate grocery stores and supermarkets that range in size from single store operators to regional supermarket chains. Store sizes range from neighborhood stores of less than 10,000 square feet to large box format stores of over 80,000 square feet. Members are required to meet specific requirements, which include ownership of our capital shares and may include required cash deposits. Customers who purchase less than $1 million annually from us would not generally be considered for membership, while customers who purchase over $3 million annually from us are typically required to become Members. In addition, each Member must meet purchase requirements that may be modified from time to time at the discretion of our Board of Directors (the “Board”).
We distribute the earnings from patronage activities conducted by us, excluding our subsidiaries, with our Members (“Patronage Business”), in the form of patronage dividends. An entity that does not meet Member purchase requirements may conduct business with us as a Non-Member customer. We may also grant an entity that meets our Member purchase requirements the ability to conduct business with us as a Non-Member customer. We retain the earnings from our subsidiaries and from business conducted with Non-Members (collectively, “Non-Patronage Business”).
Recent Developments
Audit Committee Investigation. In September 2014, the Audit Committee of the Company’s Board of Directors announced that it was conducting, with the assistance of independent legal counsel, an investigation of issues
3
Table of Contents
relating to the setting of case reserves and management of claims by our former insurance subsidiaries and related matters (the “Audit Committee Investigation”). We incurred approximately $5.5 million in expenses through the fiscal year ended October 3, 2015 in connection with the Audit Committee Investigation. Approximately $0.7 million of these expenses were included in our loss on sale of our discontinued operations as further discussed below. For additional information on the Audit Committee Investigation, see “Explanatory Note” above, “Business—Audit Committee Investigation” and Part II, Item 9A, “Controls and Procedures.”
Haggen. In December 2014, Haggen, a Member, entered into an agreement to acquire 146 stores divested in the merger of Albertson’s LLC and Safeway, Inc. At that time, we entered into an agreement (the “Supply Agreement”) with Haggen to be its primary supplier in California, Arizona and Nevada (the “Pacific Southwest” stores) and a substantial supplier in Washington and Oregon. In addition, we agreed to provide Haggen with certain business services. As the new Haggen stores were converted, our weekly product shipments to Haggen reached approximately $11 million at their peak at the end of June 2015.
In September 2015, Haggen filed voluntary petitions for reorganization under Chapter 11 of the U.S. Bankruptcy Code. Prior to Haggen’s bankruptcy filing, we terminated our product supply agreement with Haggen and had already begun reducing our potential exposure including, but not limited to, arranging for payment in advance for product supplied to Haggen and reducing the amount of inventory we were carrying specifically for Haggen. In October 2015, we entered into a trade agreement (the “Trade Agreement”) with Haggen under which we continued to supply product to Haggen as a critical vendor during Haggen’s Chapter 11 case. Pursuant to the Trade Agreement, Haggen paid a substantial portion of our prepetition receivable in exchange for certain shipping terms from Unified. Haggen also agreed to stipulate to an allowed administrative expense priority claim under section 503(b)(9) of the Bankruptcy Code for the balance of our prepetition claim for goods shipped to Haggen. We also filed a proof of claim against Haggen for breach of contract damages related to the termination of the Supply Agreement and various ancillary agreements. Such claim would be treated as a general unsecured claim in the Haggen chapter 11 cases. Haggen has not yet filed a chapter 11 plan and projected recoveries on general unsecured claims are not yet determined in Haggen’s case.
Effective November 21, 2015, we ceased supplying product to Haggen’s Pacific Southwest stores. Accordingly, we do not expect the sales to Haggen to continue at the levels generated during the last half of fiscal 2015 or during the first quarter of fiscal 2016. Sales to Haggen’s Pacific Southwest stores were approximately $9.6 million for the first quarter of fiscal 2016. Pursuant to the Trade Agreement, we continued to supply Haggen’s Washington and Oregon stores with product during Haggen’s bankruptcy case.
Raley’s. In February 2015, we entered into an agreement with Raley’s Supermarkets (“Raley’s”) under which we subleased its existing Stockton, California facility for five years. We currently operate that facility to distribute general merchandise and health and beauty products to Raley’s under a five-year supply agreement. This facility also services our other customers, and has created the opportunity for Unified to consolidate and distribute all general merchandise and health and beauty care products from a single location.
Sale of Insurance Segment. In July 2014, our management and Board made a strategic determination to focus the Company’s efforts on our core grocery business operations in order to better serve Unified’s Members and customers. In conjunction with this decision, our management and Board determined that our insurance operations represented a significant non-core portion of our business, and accordingly began discussions with a previously unsolicited potential buyer to sell our Insurance segment. On October 7, 2015 (the “Closing Date”), we completed the sale, at a discount to Tangible Book Value (“TBV”) (as defined in the Stock Purchase Agreement discussed below), of all of the outstanding shares of our wholly owned subsidiary, Unified Grocers Insurance Services (“UGIS”), to AmTrust Financial Services, Inc. (“AmTrust”) pursuant to the terms of a Stock Purchase Agreement (the “Stock Purchase Agreement”) by and between the Company and AmTrust dated as of April 16, 2015. As of the Closing Date, UGIS owned all of the outstanding shares of the capital stock of Springfield Insurance Company and Springfield Insurance Company Limited (Bermuda). We refer to UGIS, Springfield Insurance Company and Springfield Insurance Company Limited (Bermuda) collectively as the “Acquired Companies.”
We received $26.2 million in cash proceeds for the Acquired Companies, representing an agreed-upon discount to the estimated TBV, which was calculated as defined in the Stock Purchase Agreement. In May 2016, AmTrust delivered to us a final closing statement, including its calculation of the TBV as of the Closing
4
Table of Contents
Date. The final purchase price was adjusted to reflect an increase in the purchase price of $0.4 million between the estimated TBV as of the Closing Date and the actual TBV as of the Closing Date. We utilized the net proceeds of this transaction to repay certain indebtedness.
We incurred a net loss of $6.9 million in conjunction with the sale of the Acquired Companies at the Closing Date, including a net operating loss from discontinued operations of $3.7 million and a $1.3 million impairment on our investment in the Acquired Companies, in addition to $1.9 million of charges related to the sale, primarily comprised of costs incurred by us directly attributable to the Audit Committee Investigation and to the preparation and consummation of the sale of the Acquired Companies to AmTrust. Our historical financial statements have been revised to present the operating results of the Acquired Companies as discontinued operations. See Note 3, “Assets Held For Sale/Discontinued Operations” in Part II, Item 8, “Financial Statements and Supplementary Data” for additional information. Our estimated net loss on sale resulted in a reduction of approximately $16 per share to our exchange value. See Part II, Item 5, “Market For Registrant’s Common Equity, Related Stockholder Matters And Issuer Purchases Of Equity Securities” and Part II, Item 6, “Selected Financial Data” for additional information on the calculation of the Exchange Value Per Share.
Market Centre. In fiscal 2015, our Market Centre subsidiary was dissolved as a legal entity and ceased operating as a wholly-owned subsidiary of the Company. Market Centre now conducts business as a separate division within our Wholesale Distribution segment. Additionally, beginning in fiscal 2015, earnings from sales of food products such as Hispanic, other ethnic, gourmet, natural, organic and other specialty foods sold to Members through our Market Centre division are included in patronage earnings and may be eligible for patronage distributions. Earnings from sales to Non-Member customers are retained by the Company.
Dairy Divisions. In July 2016, we will cease operating our Southern California Dairy Division manufacturing facility, but will continue offering fluid milk and other products, including our private label brands, to our Members and customers through a vendor direct arrangement with Alta-Dena Certified Dairy, LLC, a wholly-owned subsidiary of Dean Foods Company (“Dean Foods Company”). Coincident with this change, we will no longer pay patronage dividends on products supplied by Dean Foods Company. In conjunction with the changes to the Southern California Dairy Division, the Pacific Northwest Dairy Division will no longer pay patronage dividends on sales of dairy products beginning in June 2016.
Addition of New Supplier for Private Label Products. As discussed in “Business—Products—Corporate Brands,” we currently sell products under premium and value-oriented corporate brands. In February 2016, we joined Topco as a member. Topco is a privately held company that provides procurement, quality assurance, packaging and other services exclusively for its member-owners, which include supermarket retailers, food wholesalers and foodservice companies. Commencing in the fourth quarter of fiscal 2016, we will begin transitioning to Topco as our primary supplier for our Springfield premium brand and our value-oriented Special Value products. In addition, Topco will serve as our sole-source supplier for general merchandise and health and beauty care products under its TopCare label.
Early Extinguishment of Debt. As discussed in Part II, Item 7, “Management’s Discussion and Analysis of Financial Condition and Results of Operations—Credit Facilities” and “—Outstanding Debt and Other Financing Arrangements,” for the year ended October 3, 2015, we refinanced our revolving credit facility and also prepaid our senior secured notes. We recorded a loss on early extinguishment of debt in connection with the prepayment of our higher senior secured notes. This refinancing will position us for lower future interest payments.
Earnings Highlights—Fiscal 2015
Continuing Operations. Our net loss from continuing operations in the fiscal year ended October 3, 2015 was $14.6 million, as compared to a net loss from continuing operations of $0.4 million in the fiscal year ended September 27, 2014, an increase in our net loss from continuing operations of $14.2 million. The decrease in earnings was primarily due to reduced margins in both the perishable and non-perishable product lines as we continue to experience a shift in sales mix towards sales to large customers that tend to have reduced margins resulting from their higher purchase volume. In addition, our operating expenses increased primarily related to the new business discussed above and expenses incurred as a result of the Audit Committee Investigation. During our second quarter of fiscal 2015, we began servicing the new Haggen store conversions and Raley’s business. We
5
Table of Contents
incurred additional costs associated with preparations for supporting this new business, and we continued to incur additional costs during our third fiscal quarter as the store conversion process was completed. These costs included reconfiguring our facilities to accommodate increased itemization, as well as increased staffing and outside storage expenses. We also incurred additional costs in our fourth quarter to adjust our facilities and personnel as Haggen began to exit the acquired stores. These adverse impacts to net earnings were partially offset by lower pension and postretirement benefit expenses and general improvements in other operating expenses. See Part II, Item 7, “Management’s Discussion and Analysis of Financial Condition and Results of Operations—Company Overview—Results of Operations” and “—Continuing Operations” in this Comprehensive Form 10-K.
We also refinanced our debt during the first quarter of fiscal 2015 and recorded a loss on early extinguishment of debt in connection with the prepayment of our higher rate senior secured notes. See Part II, Item 7, “Management’s Discussion and Analysis of Financial Condition and Results of Operations—Liquidity and Capital Resources” of this Comprehensive Form 10-K and Item 1.01. “Entry into a Material Definitive Agreement—Amendment and Restatement of Credit Facility” of our Current Report on Form 8-K, filed on December 19, 2014, for additional information.
Discontinued Operations. As discussed above, on October 7, 2015, we completed the sale of our former Insurance segment to AmTrust pursuant to the terms of a Stock Purchase Agreement by and between Unified and AmTrust dated as of April 16, 2015.
We incurred a net loss of $6.9 million relative to the discontinued operations for the fiscal year ending October 3, 2015, comprised of the net operating loss of our former Insurance segment of $3.7 million in addition to a loss on the sale of the Insurance segment of $3.2 million.
Earnings Highlights—Fiscal 2014
Our net loss from continuing and discontinued operations in the fiscal year ended September 27, 2014 was $5.4 million, as compared to a net loss of $17.6 million in the fiscal year ended September 28, 2013, an improvement of $12.2 million, or 0.3% of total net sales. The decrease in our net loss was primarily due to an increase in net sales and reduced operating expenses in fiscal 2014 due to our continued focus on cost containment, as well as non-recurring expenses in the fiscal year ended September 28, 2013 related to early debt extinguishment and transition costs resulting from the consolidation of our Fresno dry warehouse facility into our facilities in Southern and Northern California that also occurred in the fiscal year ended September 28, 2013. Our net loss in the fiscal years ended September 27, 2014 and September 28, 2013 included $5.0 million and $5.1 million, respectively, of net loss attributable to our discontinued operations. In fiscal years 2014 and 2013, we increased workers’ compensation reserves in our former Insurance segment by $10.0 million and $9.1 million, respectively. See Part II, Item 7, “Management’s Discussion and Analysis of Financial Condition and Results of Operations” and “—Liquidity and Capital Resources” for additional information.
Company Structure and Organization
Overview
Our business includes a single reportable segment—Wholesale Distribution:
| · | Our Wholesale Distribution business includes the sale of perishable and non-perishable food and non-food products to both Members and Non-Members. Our Wholesale Distribution business provided nearly 100% of our consolidated net sales and approximately 75%, 100% and 96%, respectively, of our consolidated operating income for fiscal 2015, 2014 and 2013. The Wholesale Distribution segment represented approximately 84% of our consolidated total assets for each of fiscal year 2015, 2014 and 2013. The Wholesale Distribution business offers a broad range of branded and corporate brand products in nearly all product categories found in a typical supermarket. In addition, this business segment provides certain retail support services to our customers, including merchandising, retail pricing, advertising, promotional planning, retail technology, equipment purchasing and real estate services. Financing services are reported under All Other. |
6
Table of Contents
In fiscal 2015, 2014 and 2013, our business previously included the held-for-sale discontinued operations of our former Insurance segment as follows:
| · | Our former Insurance segment included two insurance subsidiaries (Springfield Insurance Company and Springfield Insurance Company Limited) that provided insurance and insurance-related products, including workers’ compensation and liability insurance policies, to both us and our Member and Non-Member customers and one insurance agency subsidiary (Unified Grocers Insurance Services) that placed business with insurance carriers, including our insurance subsidiaries. See Note 3, “Assets Held For Sale/Discontinued Operations” in Part II, Item 8, “Financial Statements and Supplementary Data” for additional information. |
We also have other support businesses, consisting primarily of our financing subsidiary that provides financing services to our Members.
The following table presents percentages of net sales by type of similar product:
| Percent of Consolidated Net Sales | ||||||||||||
| Fiscal Years Ended | ||||||||||||
| October 3, 2015 |
September 27, 2014 |
September 28, 2013 |
||||||||||
| Wholesale Distribution: |
||||||||||||
| Non-perishable products(1) |
65 | % | 65 | % | 66 | % | ||||||
| Perishable products(2) |
35 | % | 35 | % | 34 | % | ||||||
|
|
||||||||||||
| Total Wholesale Distribution net sales |
100 | % | 100 | % | 100 | % | ||||||
|
|
||||||||||||
| Other(3) |
— | % | — | % | — | % | ||||||
|
|
||||||||||||
| Total consolidated net sales |
100 | % | 100 | % | 100 | % | ||||||
|
|
||||||||||||
| (1) | Consists primarily of dry grocery, frozen food, deli, ethnic, gourmet, specialty foods, natural and organic, general merchandise and health and beauty care products. Also includes (a) retail support services and (b) products and shipping services provided to Non-Member customers. |
| (2) | Consists primarily of service deli, service bakery, meat, eggs, produce, bakery and dairy products. |
| (3) | Consists of revenues from our All Other support business activities, currently financing services. |
Wholesale Distribution Business
Overview
Our Wholesale Distribution business provides products and services through the following divisions and subsidiaries:
| · | Cooperative Division: Products sold through the Cooperative Division include dry grocery, frozen food, deli, meat, eggs, produce, bakery, service bakery, service deli, general merchandise and health and beauty care. We also provide retail support services including merchandising, retail pricing, advertising, promotional planning, technology support services, equipment purchasing services and real estate services. We have divided our Cooperative Division into three marketing regions to better serve the product and service needs of our customers: Southern California, Northern California and Pacific Northwest. |
| · | Southern California Dairy Division: The Southern California Dairy Division operates a milk processing plant in Los Angeles, California. Raw milk that is pasteurized and bottled at the plant is purchased from a third party dairy cooperative based in California. The Southern California Dairy also bottles water and various fruit punch drinks. In July 2016, we will cease operating our milk processing plant, but will continue offering fluid milk and other products, including our private label brands, to our Members and customers through a vendor direct arrangement with Dean Foods Company. |
7
Table of Contents
| · | Pacific Northwest Dairy Division: The Pacific Northwest Dairy Division generates earnings from sales of dairy and related products manufactured by third parties. Dairy and related products are distributed by our Milwaukie, Oregon and Seattle, Washington distribution facilities and by third parties directly to our customers in the Pacific Northwest region. |
| · | Market Centre: In fiscal 2015, our Market Centre subsidiary was dissolved as a legal entity and ceased operating as a wholly-owned subsidiary of the Company. Our Market Centre operation now conducts business as a separate division within Wholesale Distribution. We sell food products such as Hispanic, other ethnic, gourmet, natural, organic and other specialty foods through the Market Centre division. We also sell products carried in the Cooperative Division to small Non-Member customers through the Market Centre division. |
| · | Unified International, Inc.: We sell products and provide shipping services to Non-Member customers through our Unified International, Inc. subsidiary. |
Earnings from business conducted with Members in our Cooperative, Southern California Dairy, Pacific Northwest Dairy and Market Centre divisions are eligible for distribution in the form of patronage dividends. After June 2016 and May 2016, respectively, we will no longer pay patronage dividends on, and will retain the earnings from, business conducted with Members in the Southern California and Pacific Northwest Dairy Divisions. We retain the earnings from business conducted with Non-Members in our Cooperative, Southern California Dairy, Pacific Northwest Dairy and Market Centre divisions. We also retain the earnings from all business, with both Member and Non-Member customers, conducted by our subsidiaries, including Grocers Capital Company and Unified International, Inc.
Supply Agreements
During the normal course of business, we may enter into supply agreements with customers. These agreements typically require that a customer purchase a specified amount of its merchandise requirements from us and obligate us to supply such merchandise pursuant to agreed-upon terms and conditions relating to matters such as pricing (i.e., mark-up) and delivery. We may also enter into supply agreements with customers under which we make a loan or provide upfront money or other benefits to the customer, including funding store acquisitions or renovations, or providing more favorable pricing based on the customer’s purchasing volume commitments. The supply agreements vary with respect to terms and duration, with expiration dates often staggered among customers to mitigate risk. Approximately 59% of our net sales in the Wholesale Distribution segment in fiscal 2015 were to customers pursuant to the terms of a supply agreement, an increasing trend compared to 55% in fiscal 2014 and 47% in fiscal 2013. This trend reflects a shift in sales mix towards sales to larger customers that tend to have reduced margins resulting from their higher purchase volume. We have supply agreements with eight of our top ten customers. We recently renewed supply agreements containing multi-year commitments with four of our top ten customers that had contracts expiring during the last six months.
Products
National Brands
We supply approximately 98,000 national and regional brand items, which represented approximately 95% of our net sales in the Wholesale Distribution segment in fiscal 2015. National branded items range from small to large consumer goods companies such as Kraft Heinz Company, Nestle USA, Hain Celestial Group, Inc. and Tyson Foods, Inc. We believe that national and regional brands are attractive to chain accounts and other customers seeking consistent product availability throughout their retail operations. Our national brand strategy fosters close relationships with many national suppliers, which provide us with important sales and marketing support.
Corporate Brands
We sell an extensive line of food and non-food items under various corporate brands. Our two-tier corporate brand strategy emphasizes certain premium corporate brands as a direct alternative to national brand items and other value-oriented corporate brands as an alternative to lower cost regional labels. These corporate brands enable us to offer our customers an exclusive line of product alternatives across a wide range of price points. Sales of our corporate brand products represented approximately 5% of net sales in the Wholesale Distribution segment in
8
Table of Contents
fiscal 2015; however, these products represent approximately 12% of our grocery, frozen food and delicatessen business.
We currently offer approximately 5,400 corporate brand products in the following categories: dry grocery, frozen, delicatessen, general merchandise, ice cream, fluid milk, dairy and bakery. These products are sold under the premium corporate brands of Western Family, Springfield, Cottage Hearth and Natural Directions and the value-oriented corporate brands of Special Value and Golden Crème. Western Family and Natural Directions products are acquired from Western Family Holding Company, of which we hold a partial ownership interest. In response to increased consumer demand for natural and organic products, we expect to grow corporate brand sales, in part, through our Natural Directions products. We operate a bakery manufacturing facility and a milk, water and juice processing plant in Los Angeles, California and sell such products under the Springfield, Golden Crème and Cottage Hearth corporate brands. With the exception of certain bakery, milk, water and juice products, all of our corporate brand products are manufactured by third parties. In July 2016, we will cease operating our milk, water and juice processing plant in Los Angeles, California, but will continue offering our products, including our private label brands, to our Members and customers through a vendor direct arrangement with Dean Foods Company. In February 2016, we joined Topco as a member. Commencing in the fourth quarter of fiscal 2016, we will begin transitioning to Topco as our primary supplier for Springfield and Special Value products. In addition, Topco will serve as our sole-source supplier for general merchandise and health and beauty care products under its TopCare label. Other than Western Family and Natural Directions products, our other corporate brand products are developed, trademarked, owned and managed by us primarily through Topco. With respect to such products, we represent the brands as the owner, which allows us to direct the marketing and promotional aspects of this business in addition to our ability to negotiate cost directly with our corporate brand manufacturers. Corporate brand items tend to have slightly higher margins for both the retailer and Unified due to this ability to negotiate cost with manufacturers and influence product marketing and promotion.
Additional Products through Vendor Direct Arrangements
We make available to our customers additional products through vendor direct arrangements with certain preferred providers. For example, in June 2013 we entered into an agreement with Charlie’s Produce (“Charlie’s”) for Charlie’s to be our exclusive partner in all produce categories for serving our independent retail customers operating stores in the Pacific Northwest. In addition, in June 2016, Dean Foods Company will begin supplying our customers in Southern California with fluid milk and other products, including our private label brands. We also have similar arrangements for the supply of produce to our Northern California customers and the supply of branded ice cream to our Southern California customers. Vendor direct arrangements allow us to further enhance the product offerings to our customers beyond what we carry in our warehouses while maintaining the benefits, such as consolidated billing, volume discounts and service and support, of purchasing from Unified.
Facilities and Transportation
As of October 3, 2015, we operated approximately 4.8 million square feet of warehouse and manufacturing space throughout our marketing regions.
| · | Southern California: We own and operate a dry grocery warehouse in Commerce and a combined frozen foods/refrigerated warehouse in Santa Fe Springs. We also lease a perishable foods warehouse in Los Angeles. These facilities serve our customers in Southern California, Southern Nevada, Arizona, New Mexico, Texas and the Pacific Rim. We own and operate a bakery manufacturing facility and a milk, water and juice processing plant, both in Los Angeles. In July 2016, we will cease operating our milk, water and juice processing plant, but will continue offering our products to our Members and customers through a vendor direct arrangement with Dean Foods Company. |
| · | Northern California: We own a dry grocery and a combined frozen foods/refrigerated warehouse in Stockton. The Stockton facility provides dry grocery, frozen and refrigerated foods primarily to our customers in Northern California, Hawaii, Northern Nevada and the Pacific Rim. The Stockton facility also supplies gourmet, specialty, and natural and organic foods to all three of our marketing regions. |
Historically we distributed general merchandise and health and beauty care products through a leased dry warehouse in Fresno. Upon expiration of the lease on this facility and in the first quarter of fiscal 2013, we ceased distribution from this facility and consolidated distribution of these products into our facilities in Southern and Northern California.
9
Table of Contents
In February 2015, we entered into an agreement with Raley’s under which we subleased a Stockton, California facility for five years. We currently operate that facility to distribute general merchandise and health and beauty products to Raley’s under a five-year supply agreement. This facility also services our other customers, and has created the opportunity to consolidate and distribute all general merchandise and health and beauty products.
| · | Pacific Northwest: We own and operate a facility in Milwaukie, Oregon that provides dry grocery, frozen and refrigerated foods, as well as general merchandise and health and beauty care products. We also lease and operate a dry grocery, frozen and refrigerated warehouse in Seattle, Washington. During fiscal 2012, we extended our lease on our current Seattle location through April 30, 2018. These facilities serve our Pacific Northwest region, which includes Alaska, Oregon, Washington, Idaho, California and the Pacific Rim. |
We believe that our corporate offices, warehouses and manufacturing properties are generally in good condition, well maintained and both suitable and adequate to carry on our business as presently conducted.
Our customers may choose either of two delivery options for the distribution of our products: have us deliver orders to their stores or warehouses or pick up their orders from our distribution centers. We operate a fleet of 286 tractors and 910 trailers that we use to distribute products to our customers. Approximately 45% of our sales are delivered to customers by our own fleet of tractors and trailers. This percentage has been on a relatively steady decline from 60% or more in 2008 and earlier years as customers have increasingly utilized their own fleets or third-party carriers. Continuation of this trend may have a negative impact on our fleet efficiencies and increase our delivery cost to our remaining customers. If we are unable to offset the increased delivery costs, this may result in lower profitability for the Company.
Held-for-Sale Discontinued Insurance Operations
In July 2014, our management and Board made a strategic determination to focus the Company’s efforts on our core grocery business operations in order to better serve Unified’s Members and customers. In conjunction with this decision, our management and Board determined that our insurance operations represented a significant non-core portion of our business, and accordingly began discussions with a previously unsolicited potential buyer to sell our Insurance segment. Accordingly, we completed the sale of our insurance operations on October 7, 2015. See Note 3, “Assets Held For Sale/Discontinued Operations” in Part II, Item 8, “Financial Statements and Supplementary Data” for additional information. Our held-for-sale discontinued Insurance operations included two insurance subsidiaries that previously provided insurance and insurance-related products to both us and our Member and Non-Member customers in most of the states in which we formerly conducted our insurance business. Our held-for-sale discontinued Insurance business also included an insurance agency subsidiary that placed business with insurance carriers, including our former insurance subsidiaries. In fiscal 2015, the insurance and insurance-related products provided by our former insurance subsidiaries included workers’ compensation and liability insurance policies.
The held-for-sale discontinued Insurance segment represented approximately 13% of our consolidated total assets for each of fiscal 2015, 2014 and 2013. Net sales produced by our held-for-sale discontinued Insurance segment equated to approximately 1% of our consolidated net sales for each of fiscal year 2015, 2014 and 2013.
Other Support Businesses
Our other support businesses, consisting primarily of a financing entity, collectively accounted for less than 1% of our consolidated net sales and approximately 25%, 0% and 4%, respectively, of our consolidated operating income for fiscal 2015, 2014 and 2013. Our other support businesses represented approximately 3% of our consolidated total assets for each of fiscal year 2015, 2014 and 2013.
Employees
As of October 3, 2015, we employed approximately 2,807 employees, of whom approximately 60% are represented by labor unions under 24 collective bargaining agreements. The International Brotherhood of Teamsters represents
10
Table of Contents
a majority of employees covered by labor contracts. Collective bargaining agreements affecting our employees have various expiration dates ranging from 2016 through 2020. We believe our labor relations with the various local unions are good.
Industry Overview and the Company’s Operating Environment
Competition
The grocery industry, including the wholesale food distribution business, is highly competitive and characterized by high volume and low profit margins. In recent years, the grocery industry has consisted primarily of large, vertically integrated chain stores and has seen mergers and acquisitions among competing organizations to achieve economies of scale. In addition, the industry has seen increasing numbers of alternative format stores and large chain stores from other industries devote considerable square footage to enter and compete in the grocery industry. Going forward, the industry will face further competition from online retailers that may, for example, feature online ordering and direct delivery to consumers.
When independent retailers are acquired by large chains with self-distribution capacity, are driven from business by larger grocery chains, or become large enough to purchase directly from manufacturers or develop their own self-distribution capabilities, we may lose business. In addition, as a higher percentage of our sales go to larger customers, including through smaller independent retailers being acquired by larger independent retailers, our margins tend to be adversely affected as these larger customers typically receive discounts based upon the higher volume of their purchases.
We compete in the wholesale grocery industry with many regional and local grocery, general food, meat, produce, specialty, bakery and dairy wholesalers and distributors, such as KeHE Distributors, LLC, as well as with national food wholesalers, namely C&S Wholesale Grocers, Inc., Supervalu, Inc. and United Natural Foods, Inc. (UNFI). Many of our customers, including Members, buy from such competing wholesalers and distributors in addition to us, such that we are competing for business at the wholesale grocery level on a daily basis. This competition is intense with respect to, among other things, price, selection, availability and service.
Our customers include grocery retailers with a broad range of store sizes and types targeting a diverse range of consumers. Depending on the nature of their stores and consumer focus, our customers may compete directly with vertically integrated regional and national chains, such as Albertsons Companies, Inc. (including Safeway Inc., Vons and Pavilions), Kroger Co. (including Ralphs, Food 4 Less and QFC), Trader Joe’s Company and WinCo Foods, which operate traditional and specialty format full-service grocery stores. They may also compete with warehouse club stores and supercenters such as Costco Wholesale Corp., Sam’s Club and Wal-Mart Stores, Inc., hard discount stores such as ALDI, drug channel stores, alternative format stores such as Target Corp., and the various “dollar” stores, stores focused on upscale and natural and organic products such as Sprouts Farmers Markets, LLC and Whole Foods Market Inc., and various convenience stores. The marketplace in which our customers compete continues to evolve and present challenges. These challenges include such recent trends as the continued proliferation of discount stores, supercenters and warehouse club stores and the efforts of many of the non-traditional format stores to expand their offerings of product to cover a greater range of the products offered by the traditional format full-service grocery store.
The success of our customers in attracting consumers to shop at their stores, as opposed to any of their various competitors, has a direct and significant impact on our sales and earnings. For more information about the competitive environment we and our customers face, please refer to Part I, Item 1A, “Risk Factors.”
In helping our customers remain competitive, whether they operate a traditional full-service grocery store or a non-traditional format store targeting particular consumers, we emphasize providing a diverse line of high quality products, competitive pricing and timely and reliable deliveries. We also provide a wide range of other services, including merchandising, retail pricing support, advertising, financing and technology products and solutions, to further support our customers’ businesses.
11
Table of Contents
Economic and Other Factors Impacting Unified and the Grocery Industry
We and others in the grocery industry are impacted by changes in the overall economic environment, including such factors as consumer confidence and the employment rate, shifts in consumer tastes and buying patterns, and changes in government spending that supports grocery purchases. The slow pace of the economic recovery has produced a gradual improvement in consumer confidence and unemployment, conditions which have caused consumers to be highly price sensitive and seek lower-cost alternatives in their grocery purchases. These conditions have improved slowly in some of our operating markets; however, in other of our operating markets, these conditions have substantially improved and consumers, while continuing to seek value in their purchases, have increasingly opted for higher priced, higher quality products. The significant industry growth in sales of natural and organic products is an example of this trend. One trend that appears to be continuing in all market areas is the willingness of consumers to shop at multiple stores of various formats, for both greater selection and value, rather than obtaining all of their grocery needs from one full-service store. This trend has continued to benefit the various specialty, discount and other alternative format stores.
We are impacted by the level of inflation and deflation in a variety of areas, including, but not limited to, sales, cost of sales, employee wages and benefits, workers’ compensation insurance and energy and fuel costs. We typically experience significant volatility in the cost of certain commodities, the cost of ingredients for our manufactured breads and processed fluid milk, and the cost of packaged goods purchased from other manufacturers. Our operating programs are designed to give us the flexibility to pass these costs on to our customers; however, we may not always be able to pass such increases on to customers on a complete or timely basis. Any delay may result in our recovering less than all of a price increase. It is also difficult to predict the effect that possible future purchased or manufactured product cost decreases might have on our profitability. The effect of deflation in purchased or manufactured product costs would depend on the extent to which we had to lower selling prices of our products to respond to sales price competition in the market. Our earnings are impacted by inventory holding gains or losses, such that during inflationary periods we benefit from increased product pricing, while during periods of low inflation or deflation, these gains are reduced or eliminated. We are subject to changes in energy costs (excluding fuels) which we may not be able to pass along to customers. With respect to fuel costs, we assess a fuel surcharge on product shipments to address the potential volatility in fuel costs. The fuel surcharge is indexed to allow us to recover costs over a specified level. Our continual focus on cost control and operational efficiency improvements helps us mitigate other changes in operating costs.
Additionally, we are impacted by changes in prevailing interest rates or interest rates that have been negotiated in conjunction with our credit facilities. A lower interest rate (used, for example, to discount our pension and postretirement unfunded obligations) may increase certain expenses, particularly pension and postretirement benefit costs, while decreasing potential interest expense for our credit facilities. An increase in interest rates may have the opposite impact. Consequently, it is difficult for us to accurately predict the impact that inflation, deflation or changes in interest rates might have on our operations.
We invest in life insurance policies (reported at cash surrender value) and various publicly-traded mutual funds (reported at estimated fair value based on quoted market prices) to fund obligations pursuant to our Executive Salary Protection Plan III, Supplemental Executive Retirement Plan and deferred compensation plan (see Note 13 of Notes to Consolidated Financial Statements in Part II, Item 8, “Financial Statements and Supplementary Data” for additional discussion). Life insurance and mutual fund assets with values tied to the equity markets are impacted by overall market conditions. In fiscal 2015, net earnings and net comprehensive earnings experienced a decrease corresponding to the decrease in the value of life insurance and mutual fund assets, respectively. Our management has determined these declines to be temporary in nature.
Suppliers and Raw Materials Sources
The products we sell to our customers and the raw materials we use in our manufacturing operations are purchased from a number of sources. No single source of supply exceeds 5% of our business. We believe that alternative suppliers are available for substantially all of our products and that the loss of any one supplier would not have a material adverse effect on our business. We also believe the products and raw materials are generally available in sufficient supply to adequately meet customer demand.
12
Table of Contents
Seasonality and Backlog
Our business is not subject to significant seasonal fluctuations in demand. We do not typically experience a material backlog in sales orders or the fulfillment of customer orders.
Environmental Regulation
We own and operate various facilities for the manufacture, warehousing and distribution of products to our customers. Accordingly, we are subject to increasingly stringent federal, state and local laws, regulations and ordinances that (1) govern activities or operations that may have adverse environmental effects, such as discharges to air and water, as well as handling and disposal practices for solid and hazardous wastes and (2) impose liability for the costs of cleaning up, and certain damages resulting from past spills, disposals or other releases of hazardous materials. In particular, under applicable environmental laws, we may be responsible for remediation of environmental conditions and may be subject to associated liabilities (including liabilities resulting from lawsuits brought by private litigants) relating to our facilities and the land on which our facilities are situated, regardless of whether we lease or own the facilities or land in question and regardless of whether such environmental conditions were created by us or by a prior owner or tenant. We believe we are in compliance with all such laws and regulations and have established reserves for known and anticipated costs of remediation.
Customers
Approximately 61% of our net sales are conducted with Members on a patronage basis. Earnings resulting from our patronage sales are eligible to be distributed in the form of patronage dividends. Approximately 13% of our net sales are conducted with Members on a non-patronage basis, and 26% of our net sales are conducted with Non-Members. We retain earnings from all business activities transacted with Non-Members and Non-Patronage Business activities transacted with Members. Our Member and Non-Member customers are typically retail grocery store operators ranging in size from single store operators to regional supermarket chains.
During the period from fiscal 2013–2015, the characteristics of our membership base included the following with respect to Member store ownership in relation to the sales volume provided by such ownership: One to five store operators comprise approximately 87% of our Member count and 34% of our Member sales, while operators in excess of five stores comprise approximately 13% of our Member count and 66% of our Member sales.
We have experienced an overall decline in the number of Members every year since the end of fiscal 2008. Since then, the number of Members has declined from 520 to 345 at the end of fiscal 2015, an average decline of 5.7% per year in our membership base. Member gross billings for the comparable period experienced a reduction of approximately 1.2%. We believe this decline has been due to a number of factors, including smaller-volume retailers deciding to conduct business with us as Non-Members, Members discontinuing operations due to competition they face or challenging economic conditions, Members consolidating with other Members and Members choosing other wholesale distributors. However, this decline predominately reflects the loss of Members who own one to five stores that comprise approximately 34% of our Member sales, while Members who continue purchasing from us typically own in excess of five stores and provide approximately 66% of our sales. Accordingly, the reduction in the number of Members that have declined since 2008 is not solely reflective of a continuing negative trend in sales, as Members with higher store ownership have demonstrated they can provide additional sales volume to offset the loss of smaller Members.
We support our Member and Non-Member customers with go-to-market strategies serving many types of retail formats across our various geographic regions, including traditional, price impact, ethnic, natural and organic, and gourmet and specialty stores.
Our largest customer, Cash & Carry Stores, LLC, a wholly-owned subsidiary of Smart & Final, Inc., a Non-Member customer, accounted for 16%,15% and 14% of our total net sales, and our ten largest customers (including Cash & Carry Stores, LLC), taken together, accounted for 53%, 49% and 47% of our total net sales, for the fiscal years ended October 3, 2015, September 27, 2014 and September 28, 2013, respectively.
13
Table of Contents
Our ten customers with the largest accounts receivable balances accounted for approximately 43% and 40% of total accounts receivable at October 3, 2015 and September 27, 2014, respectively.
Competitive Strengths
We believe we have the following competitive strengths:
Full service provider of products for supermarkets
We provide nearly all product categories typically found in supermarkets, including dry grocery, frozen food, deli, ethnic, gourmet, specialty food, natural and organic, general merchandise, health and beauty care, service deli, service bakery, meat, eggs, produce, bakery and dairy products. Through our strategically located warehouses in Northern and Southern California and the Pacific Northwest and our extensive fleet of tractors and trailers, we are able to sell and/or deliver product to supermarkets, specialty grocery stores, restaurant supply stores and convenience stores located in the Western United States and the Pacific Rim. As a full service provider, we offer retailers the ability to centralize their purchasing and simplify their logistics.
Full service wholesaler with specialty division offering access to a broad range of diverse products
In addition to all the product categories typically found in supermarkets, we offer retailers access to a complete line of food products such as Hispanic, other ethnic, gourmet, natural, organic and other specialty foods through our Market Centre division. We also sell products carried in the Cooperative Division to small Non-Member customers through our Market Centre division. We emphasize providing a diverse line of high quality products, and are constantly seeking to expand and adjust our product offerings to help our customers remain competitive and anticipate shifts in consumer demand.
Large and diverse customer base enables competitive pricing and range of offerings
Our large and diverse customer base gives us the buying power, and enables us to maintain a scale of operations, necessary to purchase a diverse range of products from vendors at favorable prices and, in turn, sell and/or deliver such products to customers at competitive prices. Our scale also allows us to offer our customers access to vendor support, including promotional offerings, new items and other information, to help them be competitive and anticipate consumer demands. Further, we participate in buying consortiums with other non-competing wholesalers to help ensure that our retailers are given the necessary vendor support to help them be competitive with larger national chains.
Broad range of services to help retailers compete
We provide financing services to our customers, as well as various support services, including merchandising, retail pricing, advertising, promotional planning, retail technology, equipment purchasing and real estate services, to help our retailers compete. We also gather and disseminate industry information to keep our customers updated on consumer trends, products, and significant changes in laws and regulations, assisting them to identify and focus on opportunities for success. Our various services help our customers concentrate on their core business and give them essential business tools to compete against larger national chains.
Competitive Strategy
Our strategy is to provide our customers with the tools they need to be successful in serving consumers at the retail level. We are focused on continuing to provide a broad range of high quality products and services, at competitive prices, to enable our customers’ stores to attract and satisfy consumers. As consumer demands shift or technology creates new ways for retailers to reach consumers, we seek to be at the forefront of providing the new products and services our customers need to make the most of market opportunities. In addition, we seek to increase sales outside the traditional supermarket channel, expand our sales and service offerings into other geographic areas, including through partnerships with other regional wholesale distribution companies, and seize other business opportunities, such as logistics, warehousing and transportation services, that leverage our assets.
14
Table of Contents
Our strategic focus continues to emphasize providing our Members with the products, services and go-to-market support they need in order to be successful in our changing marketplace. For example, we have partnered with Members to access their front-end scan information. This data gives us the opportunity to work with our Members to analyze their retail sales trends and enhances our ability to supply them the products in demand by their customers. Our strategic focus in fiscal 2016 and beyond will be concentrated on the following areas:
| · | Growth in sales to our Members—we strive to be our Members’ full service provider across all category offerings and partner with them to increase sales at retail. |
| · | Improve our distribution network—we constantly seek to optimize our efficiencies and reduce logistics costs to us and our Members. |
| · | Product assortment—we look to continually provide products and services that our Members currently sell and assist them in addressing their retail challenges. |
| · | Business units—we seek to enhance the alignment of our business units to support our Members’ category management across all lines of product categorization. |
| · | Information technology strategy—we seek to provide flexible and nimble technology to support our strategic plans at the lowest possible cost. |
| · | Organizational strategy—we seek to enhance our organizational effectiveness to support our strategic focus and go to market strategies. |
Member Requirements
Our Members are both owners and customers of our company. A Member must (1) own 350 Class A Shares and a certain number of Class B Shares based upon the amount of such Member’s average weekly purchases of product from us, or as otherwise specified by the Board (see “—Capital Shares”); (2) be of approved financial standing; (3) be engaged in selling grocery and related products at retail or wholesale; (4) purchase products from us in amounts and in a manner that is established by the Board from time to time; (5) make application in such form as is prescribed by us; and (6) be accepted as a Member by Board action.
Our Members are typically required to satisfy a minimum purchase requirement of $1 million in annual purchases from us. This requirement may be modified from time to time by the Board, having been most recently changed in April 2008. Members at the time of this change, or who were shareholders or customers of Associated Grocers, Incorporated (“AG”) who became Members in connection with our purchase of certain assets and assumption of certain liabilities of AG and its subsidiaries, a retailer-owned grocery cooperative headquartered in Seattle, Washington (the “AG Acquisition”), remain subject to the earlier requirement of $5,000 per week in purchases from us.
A customer that does not meet the requirements to be a Member, or does not desire to become a Member, may conduct business with us as a Non-Member. However, any customer that purchases more than $3 million of product from us annually is typically required to be a Member.
Capital Shares
Ownership and Exchange of Shares
There is no established public trading market for our shares. Our Class A and Class B Shares are issued by us to our Members, and repurchased by us from our Members, a process we refer to as the exchange of shares, in accordance with our share purchase requirements and at a price (the “Exchange Value Per Share”) based on a formula approved by the Board. The Exchange Value Per Share, as currently calculated, is equal to Book Value (as defined below) divided by the number of Class A and Class B Shares outstanding at the end of the fiscal year, excluding shares tendered for redemption. “Book Value” is computed based on (1) the fiscal year end balance of Class A and Class B Shares, excluding the redemption value of unredeemed shares tendered for redemption, plus (2) retained earnings, excluding non-allocated retained earnings.
15
Table of Contents
The Exchange Value Per Share does not necessarily reflect the amount for which our net assets could be sold. If the Board decides in any year to retain a portion of our earnings from our Non-Patronage Business, and to not allocate those earnings to the Exchange Value Per Share, the redemption price of Class A and Class B Shares that are repurchased in the year of such retention and in future years will be reduced. Likewise, if the Board decides in any year to reverse prior allocations of earnings from our Non-Patronage Business and allocate such amounts to the Exchange Value Per Share, then the redemption price of Class A and Class B Shares that are repurchased in the year of such reversal and in future years will be increased. See Part II, Item 5, “MARKET FOR REGISTRANT’S COMMON EQUITY, RELATED STOCKHOLDER MATTERS AND ISSUER PURCHASES OF EQUITY SECURITIES” and Part II, Item 6, “SELECTED FINANCIAL DATA” for additional information on the calculation of the Exchange Value Per Share. Our Class C and Class E Shares are exchanged with our directors and Members, respectively, at a fixed stated value. See “—Classes of Shares—Class C Shares” and “—Classes of Shares—Class E Shares.” The Board each year may increase or decrease the amount of non-allocated retained earnings that are excluded from the Exchange Value Per Share. Our non-allocated retained earnings were $6.9 million in each of fiscal 2015, 2014 and 2013.
Classes of Shares
Class A Shares
Our Bylaws require that each Member own 350 Class A Shares. The Board may accept an affiliate of a Member without such affiliate holding any Class A Shares where the owners of the affiliate are the same, or sufficiently the same, as those of the Member, and the Member already holds the required number of Class A Shares. Holders of Class A Shares are entitled to one vote per share on all matters to be voted upon by the shareholders, and the holders of the Class A Shares are entitled to elect 80% of our authorized number of directors. If a person holding Class A Shares ceases to be a Member, the Class A Shares held by such outgoing Member are subject to redemption. See “—Redemption of Class A and Class B Shares and Repurchase of Class E Shares.”
Class B Shares
Our Bylaws require that each Member own such amount of Class B Shares as may be established by the Board. The holders of Class B Shares have the right to elect 20% of our authorized number of directors. Except as provided above or by California law, the holders of Class B Shares do not have any other voting rights. Any Class B Shares held by an outgoing Member or which are held by a Member in an amount in excess of that required by the Board are subject to redemption. See “—Redemption of Class A and Class B Shares and Repurchase of Class E Shares.”
Our Board currently requires each Member to hold Class B Shares having an issuance value equal to approximately twice the Member’s average weekly purchases from the Cooperative Division, except that as to meat and produce purchases the requirement is approximately one times the Member’s average weekly purchases from the Cooperative Division (the “Class B Share Requirement”). Member purchases from our Market Centre division are not included in the determination of the Class B Share Requirement. If purchases are not made weekly, the average weekly purchases are based on the number of weeks in which purchases were actually made. For purposes of determining whether a Member holds Class B Shares having an issuance value satisfying the Class B Share Requirement, the issuance value of each Class B Share held by the Member is deemed to be the Exchange Value Per Share in effect at the close of the fiscal year end prior to the issuance of such Class B Share.
One of the ways in which Members may acquire Class B Shares is through our payment of Cooperative Division patronage dividends at the end of our fiscal year. If a Member, at the time a patronage dividend is declared, does not satisfy its Class B Share Requirement, we may issue Class B Shares to such Member as a portion of the Cooperative Division patronage dividends paid. As Class B Shares are issued as part of a Member’s patronage dividend distribution, the issuance value of such Class B Shares adds to the amount of Class B Shares held by such Member for purposes of satisfying the Class B Share Requirement.
The Class B Share Requirement is determined twice a year, at the end of our second and fourth fiscal quarters, based on a Member’s purchases from the Cooperative Division during the preceding four quarters. If at the end of our second fiscal quarter, after giving effect to the value of Class B Shares estimated to be issued as part of the next Cooperative Division patronage dividend, a Member does not hold Class B Shares with a combined issuance
16
Table of Contents
value equal to the required amount of Class B Shares, we will typically require the Member to make a subordinated deposit (a “Required Deposit”) which may, at our option, be paid over a 26-week period. If at the end of our fourth fiscal quarter, after accounting for the issuance of Class B Shares as part of the Cooperative Division patronage dividend distribution declared for such fiscal year after the first year as a Member, a Member does not hold Class B Shares with a combined issuance value equal to the required amount of Class B Shares, then additional Class B Shares must be purchased by the Member in an amount sufficient to satisfy the requirement. The additional Class B Shares may be paid for by our charging the Member’s deposit fund in an amount equal to the issuance value of the additional Class B Shares or by direct purchase by the Member, which may be paid over a 26-week period. The Board may increase or otherwise change the Class B Share Requirement at its discretion.
In September 1999, we completed a merger (the “Merger”) with United Grocers, Inc. (“United”), a grocery cooperative headquartered in Milwaukie, Oregon. In October 2007, we purchased certain assets and assumed certain liabilities of AG and its subsidiaries. Certain Members, including former shareholders of United and AG, also may satisfy their Class B Share Requirement with respect to stores owned at the time of admission as a Member solely from their patronage dividend distributions by electing to receive Class B Shares in lieu of 80% of the Cooperative Division qualified cash patronage dividends the Member otherwise would receive in the future until the Class B Share Requirement is satisfied. In order to make the election to satisfy their Class B Share Requirement solely from patronage dividend distributions, former shareholders of AG were required to enter into supply agreements with us. During the build-up of its Class B Share Requirement, such a Member is not required to provide a Required Deposit with respect to stores owned at the time of admission as a Member. Satisfaction of the Class B Share Requirement of such Members relating to new stores or growth in the sales of existing stores may not be satisfied solely from their patronage dividend distributions, but is subject to the same payment requirements that apply to other Members.
New Members typically must satisfy their Class B Share Requirement in one of two ways: (1) the purchase of Class B Shares at the time of their admission as a Member such that the required amount is held at that time; or (2) the acquisition of Class B Shares over a five-year period commencing at the start of our first fiscal year after the Member’s admission, at the rate of 20% of the required amount per fiscal year, such that by the start of our sixth full fiscal year after the Member’s admission, the required amount is held. If a new Member elects to satisfy the Class B Share Requirement through the acquisition of shares over a five-year period, it is typically required to make a Required Deposit with us for the full required amount during the five-year build-up of the Class B Share Requirement. The Required Deposit may generally be paid either in full upon acceptance as a Member or 75% upon acceptance and the balance paid over a 26-week period.
Required Deposits for new stores, replacement stores or growth in the sales of existing stores can be paid either in full or with a 50% down payment and the balance paid over a 26-week period.
We may make modifications to the requirements as to the timing of the purchase of Class B Shares and the timing and amount of the Required Deposit on a case-by-case basis, based on the particular circumstances of a Member.
A reduced investment option in lieu of the standard Class B Share Requirement (“SBI”) described above is available if certain qualifications are met. A Member may apply for a reduced Class B Share requirement (“RBI”), which requires the Member to pay for its purchases electronically on the statement due date and demonstrate credit worthiness. The purpose of the RBI is to encourage Member growth by offering a reduced requirement if the qualifications are met and to provide a cap on the investment requirement at certain volume levels. The RBI is based on a sliding scale such that additional purchase volume marginally reduces the requirement as a percentage of purchase volume. Members who do not apply for the RBI remain on the SBI. However, once a Member has elected the RBI option, it must notify us in writing if it wishes to change its election. Generally, changes can only be made at the time of the second quarter recalculation of the Class B Share Requirement in March.
Class C Shares
Certain of our directors hold Class C Shares. Each of such directors purchased one Class C Share for its stated value. Class C Shares are non-voting director qualifying shares, with no rights as to dividends or other distributions, and share in liquidation at their stated value of $10 per share.
17
Table of Contents
Class E Shares
We issued Class E Shares as a portion of the Cooperative Division patronage dividends in fiscal years 2003 through 2009, and may issue them as a portion of the Cooperative Division patronage dividends in future periods, as determined annually at the discretion of the Board (see Part II, Item 7, “Management’s Discussion and Analysis of Financial Condition and Results of Operations—Equity Enhancement”). The Class E Shares have a stated value of $100 per share, are subject to repurchase by the Company at $100 per share, do not have the potential to appreciate over time, do not accrue interest, and have no voting rights except as required by law. The Board does not intend to declare ordinary dividends on Class E Shares in the future. Class E Shares are transferable only with our consent, which will normally be withheld except in connection with the transfer of a Member’s business to an existing or new Member for continuation of such business. Class E Shares become eligible for repurchase at the discretion of the Board ten years after their date of issuance, with the outstanding Class E Shares becoming eligible for repurchase between the end of fiscal 2013 and the end of fiscal 2018. Our redemption policy provides that Class E Shares will not be repurchased for at least ten years from their date of issuance unless approved by the Board or upon sale or liquidation of the Company. See “—Redemption of Class A and Class B Shares and Repurchase of Class E Shares.”
Redemption of Class A and Class B Shares and Repurchase of Class E Shares
Our Articles of Incorporation and Bylaws provide that the Board has the absolute discretion to repurchase, or not repurchase, any Class A, Class B or Class E Shares of any outgoing Member regardless of when the membership terminated, and any Class B Shares in excess of the Class B Share Requirement (“Excess Class B Shares”) held by a current Member, whether or not the shares have been tendered for repurchase and regardless of when the shares were tendered. The Board considers the redemption of eligible Class A Shares at each board meeting. All other shares eligible for redemption or repurchase are considered by the Board on an annual basis, usually in December. Class E Shares will only be repurchased upon approval of the Board or upon sale or liquidation of the Company, and the repurchase price for the Class E Shares is fixed at their stated value of $100 per share.
Excess Class B Shares may be redeemed at the sole discretion of the Board. If the Member tendering the shares for repurchase is current on all obligations owing to us, and no grounds exist for termination of membership, such redemption may be effected by paying cash to the Member or crediting the redemption price to the Member’s account. The redemption price for such shares shall be the same as would be provided on a termination of membership as of the date the shares were tendered for redemption. If the Member tendering the shares for repurchase is not current on all obligations owing to us, and no grounds exist for termination of membership, we may redeem such Excess Class B Shares and apply the proceeds against all amounts owing to us.
The right to deduct any amounts owing to us against the total redemption price for shares is solely at our option. Shareholders may not offset or recoup any obligations to us or otherwise refuse to pay any amounts owed to us.
Subject to the Board’s determination and approval, any redemption or repurchase of shares will be on the terms, and subject to the limitations and restrictions, if any, set forth in the following:
| · | The California General Corporation Law; |
| · | Our Articles of Incorporation and Bylaws; |
| · | Our redemption policy; and |
| · | Any credit agreements to which we are a party. |
California General Corporation Law
We are subject to the restrictions imposed by the California General Corporation Law (the “CGCL”). Section 501 of the CGCL prohibits any distribution that would be likely to result in a corporation being unable to meet its liabilities as they mature. In addition, Section 500 of the CGCL prohibits any distribution to shareholders for the purchase or redemption of shares unless the board has determined in good faith that either (a) the amount of retained earnings immediately prior thereto equals or exceeds the sum of (1) the amount of the proposed distribution plus (2) any preferential dividend arrears that must be paid in respect of any other class of shares prior to the proposed
18
Table of Contents
distribution, or (b) immediately after the proposed distribution, the value of the corporation’s assets would equal or exceed the sum of (1) its liabilities plus (2) the preferential rights of other classes of shares that would be required to be paid upon dissolution to holders of such shares prior to any distribution to the class of shares as to which the proposed distribution is being made. While we have generally maintained sufficient retained earnings for each fiscal year to accomplish our share repurchase program, there can be no assurance in the future that we will be able to redeem all shares tendered to us given the restrictions of the CGCL.
Articles of Incorporation and Bylaws
Our Articles of Incorporation and Bylaws contain certain restrictions on the redemption of our shares. In addition, our Bylaws contain our redemption policy (see below). The Board has the right to amend the redemption policy in our Bylaws at any time, including, but not limited to, changing the order in which repurchases will be made or suspending or further limiting the number of shares repurchased, except as otherwise may be expressly provided in the Articles of Incorporation.
Redemption Policy
The Board has the discretion to modify our redemption policy from time to time. All redemptions occur solely at the discretion of the Board. Our redemption policy currently provides that (1) Class A and Class B Shares held by a shareholder that is no longer a qualified or active Member and (2) Excess Class B Shares, may be redeemed at the Exchange Value Per Share at the close of the last fiscal year end prior to (A) termination of Member status or (B) the date of redemption, as applicable.
Our redemption policy currently provides that the number of Class B Shares that we may redeem in any fiscal year is limited to no more than 5% of the sum of:
| · | The number of Class B Shares outstanding at the close of the preceding fiscal year end; and |
| · | The number of Class B Shares issuable as a part of the patronage dividend distribution for the preceding fiscal year. |
During fiscal 2016, it is unlikely that we will redeem any Class B Shares that had been tendered for redemption as of the close of fiscal 2015, leaving 94,593 Class B Shares, or 23% of our outstanding Class B Shares at the close of fiscal 2015, which have been tendered for redemption but not yet redeemed. This percentage has steadily increased in recent years, from 21%, 17% and 16% of our outstanding Class B Shares at the close of fiscal 2014, 2013 and 2012, respectively, as we have (1) suspended redemptions of Class A Shares and Class B Shares because we had not been current in our periodic SEC filings, (2) had an increase in the number of shares our Members have sought to redeem and (3) redeemed less than the 5% limit in fiscal 2015, 2014, 2013 and 2012. Based on the current level of redemption as compared to the number of shares tendered for redemption, Members seeking to redeem shares may be required to wait a number of years. Members may have even less liquidity with respect to shares in Unified should the Board, in its discretion, cease or reduce redemptions of stock.
There is no assurance that our financial condition will enable us to redeem shares tendered for redemption. Even if redemption is permitted by legal requirements, it is likely under our redemption policy that a Member’s Class B Shares will not be fully, or even partially, redeemed in the year in which they are tendered for redemption. If we are not able to redeem all shares eligible for redemption in a given year, then the shares redeemed will be determined on a pro rata basis. See Part I, Item 1A, “Risk Factors—The requirement that Members invest in our shares and/or make Required Deposits, and the lack of liquidity with respect to such investments and Required Deposits, may make attracting new Members difficult and may cause existing Members to withdraw from membership,” Part II, Item 5, “Market For Registrant’s Common Equity, Related Shareholder Matters and Issuer Purchases of Equity Securities,” Part II, Item 8, “Financial Statements and Supplementary Data—Note 12” for recent redemption activity and the number of outstanding shares tendered for redemption but which have not yet been redeemed.
During the second quarter of fiscal 2016, we repurchased 78,745 Class E Shares at a price of $7.9 million that were eligible for repurchase in fiscal 2014 and 2015. As a result, 17,571 Class E Shares remain eligible for repurchase between the end of fiscal 2016 and the end of fiscal 2018 for an aggregate repurchase price of
19
Table of Contents
$1.8 million. There is no assurance that our financial condition will enable us to, or our Board will determine to, repurchase Class E shares in the fiscal year they become eligible for repurchase.
The Board has the absolute discretion to redeem Excess Class B Shares or to redeem Class A and Class B Shares or repurchase Class E Shares of any outgoing Member regardless of when the membership terminated or the Class B Shares were tendered. The Board also has the right to elect to redeem Excess Class B Shares or repurchase Class E Shares even though such redemption or repurchase has not been requested and without regard to each year’s five percent limit or any other provision of the redemption policy.
For information concerning our purchases of capital shares during fiscal 2014 and 2015, see Part II, Item 5, “Market For Registrant’s Common Equity, Related Stockholder Matters And Issuer Purchases Of Equity Securities.”
Credit Agreements
We are a party to credit agreements which provide that during any period where we are in breach of, or an event of default has occurred under, such credit agreements, we will be prohibited from redeeming or repurchasing Class A, Class B and Class E Shares. In addition, any redemptions/repurchases are subject to an excess availability test.
Patronage Dividends
We distribute patronage dividends to our Members based upon our patronage earnings during a fiscal year. Non-Member customers are not entitled to receive patronage dividends. The Board approves the payment of dividends and the form of such payment for our three patronage-earning divisions: the Southern California Dairy Division, the Pacific Northwest Dairy Division and the Cooperative Division. We track the volume of qualifying patronage sales in each of these patronage-earning divisions on an individual Member basis to determine each such Member’s share of such patronage dividends. Patronage dividends for each patronage-earning division are paid solely to Members who purchase products from such division.
| · | Cooperative Division. Patronage earnings attributable to the Cooperative Division are derived from all patronage activities of Unified, other than the Southern California and Pacific Northwest Dairy Divisions discussed below, regardless of geographic location. Patronage dividends for this division are paid based on the qualified patronage purchases of the following types of products: dry grocery, deli, health and beauty care, tobacco, general merchandise, frozen food, ice cream, meat, produce and bakery. Additionally, beginning in fiscal 2015, food products such as Hispanic, other ethnic, gourmet, natural, organic and other specialty foods sold to Members through our Market Centre division are included in patronage earnings and may be eligible for patronage distributions. We also sell products carried in the Cooperative Division to small Non-Member customers through our Market Centre division. We retain the earnings from such business with Non-Member customers and do not pay patronage dividends on those sales. |
| · | Southern California Dairy Division. Patronage earnings attributable to the Southern California Dairy Division have been derived primarily from sales of products manufactured at a milk, water and juice bottling plant located in Los Angeles, California. We will cease operating this facility in July 2016 but will continue offering fluid milk and other products, including our private label brands, to our Members and customers through a vendor direct arrangement with Alta-Dena Certified Dairy, LLC, a wholly-owned subsidiary of Dean Foods Company (“Dean Foods Company”). Coincident with this change, the Company will no longer pay patronage dividends on products supplied by Dean Foods Company. |
| · | Pacific Northwest Dairy Division. Patronage earnings attributable to the Pacific Northwest Dairy Division have been derived from sales of dairy products manufactured by third party suppliers located in Oregon and Washington. In conjunction with the changes to the Southern California Dairy Division discussed above, the Pacific Northwest Dairy Division will no longer pay patronage dividends on sales of dairy products beginning in June 2016. |
20
Table of Contents
The following table summarizes the patronage dividends distributed by us during the past three fiscal years.
| (dollars in thousands) | ||||||||||||
| Division | 2015 | 2014 | 2013 | |||||||||
| Cooperative Division |
$ | — | $ | — | $ | — | ||||||
| Southern California Dairy Division |
6,450 | 8,530 | 8,609 | |||||||||
| Pacific Northwest Dairy Division |
784 | 865 | 1,000 | |||||||||
|
|
||||||||||||
| Total |
$ | 7,234 | $ | 9,395 | $ | 9,609 | ||||||
|
|
||||||||||||
Patronage dividends have been negatively impacted during the 2015, 2014 and 2013 Periods. As a result, there were no Cooperative Division patronage earnings available for distribution. The loss in the Cooperative Division increased in the 2015 Period due to reduced margins in both the perishable and non-perishable product lines as we continued to experience a shift in sales mix towards sales to large customers that tend to have reduced margins resulting from their higher purchase volume. In addition, we incurred higher operating expenses to accommodate the additional business from Haggen and Raley’s (including additional costs in our fourth quarter to adjust our facilities and personnel as Haggen began to exit its acquired stores), as well as non-recurring expenses in the 2015 Period related to early debt extinguishment. We experienced lower earnings in the Southern California Dairy Division due to reduced margins and higher operating expenses and in the Pacific Northwest Dairy Division due to a decline in Member sales volume.
See additional discussion in Part II, Item 7, “Management’s Discussion and Analysis of Financial Condition and Results of Operations—Wholesale Distribution Segment.” Total patronage earnings are based on the combined results of the Cooperative Division, the Southern California Dairy Division and the Pacific Northwest Dairy Division. In the event of a loss in one division, the Board will make an equitable decision with respect to the treatment of the loss. During the 2015, 2014 and 2013 Periods, the Cooperative Division experienced losses that were recognized in net earnings, thereby reducing our Exchange Value Per Share.
Our Bylaws provide that patronage dividends may be distributed in cash or in any other form that constitutes a written notice of allocation under Section 1388 of the Internal Revenue Code. Section 1388 defines the term “written notice of allocation” to mean any capital share, revolving fund certificate, retain certificate, certificate of indebtedness, letter of advice, or other written notice, that discloses to the recipient the stated dollar amount allocated to the recipient by Unified and the portion thereof, if any, which constitutes a patronage dividend. Written notices of allocation may be in the form of qualified written notices of allocation or non-qualified written notices of allocation. To constitute a qualified written notice of allocation, a patronage dividend must be paid at least 20% in cash and the balance in a form which constitutes a written notice of allocation and which the recipient has agreed to take into income for tax purposes in the year of receipt. If at least 20% of the patronage dividend is not paid in cash, the entire amount of the distribution not paid in cash, whether in the form of share, subordinated patronage dividend certificates or other debt instrument, constitutes a non-qualified written notice of allocation.
Patronage dividends for the Cooperative Division are calculated annually and distributed to Members following each fiscal year in proportion to the qualified patronage sales during such fiscal year. Historically the Company has distributed patronage dividends in cash, Class B and Class E shares and patronage dividend certificates. For fiscal 2015, 2014 and 2013, there were no Cooperative Division patronage earnings available for distribution.
Patronage dividends for our dairy divisions are calculated quarterly and have been historically distributed to Members in cash on a quarterly basis in proportion to the qualified patronage sales during the quarter.
Customer Deposits
Each of our customers may be required to maintain a deposit fund with us, which may include one or both of the following:
| · | Required Deposit. Members who do not satisfy the Class B Share Requirement solely from their holdings of Class B Shares are generally required to make a Required Deposit with us. See “—Capital Shares—Classes of Shares—Class B Shares.” |
21
Table of Contents
| · | Credit Deposit. Member and Non-Member customers may be required to provide us a Credit Deposit in order to purchase products on credit terms established by us. “Credit Deposit” means any non-subordinated deposit that is required to be maintained by a Member or Non-Member customer in accordance with levels established by our credit office from time to time in excess of the amount of the Required Deposit set by the Board. |
We do not pay interest on Required Deposits or Credit Deposits; however, interest is paid at the prime rate for deposits in excess of a Member’s Required Deposit or Credit Deposit (an “Excess Deposit”).
At any given time, our required cash deposits may be less than otherwise would be required (referred to as a “Deposit Fund Deficiency”) as a result of Members having been approved to build deposits in their deposit fund over time or in cases where their Required Deposits are waived. Deposit Fund Deficiencies typically occur when Members do not maintain sufficient Required Deposits to meet the Class B Share Requirement. The Deposit Fund Deficiency was approximately $1.6 million, $2.9 million and $1.7 million at October 3, 2015, September 27, 2014 and September 28, 2013, respectively, consisting of approximately $1.4 million, $2.7 million and $1.4 million, respectively, due to Members that were approved to build deposit fund requirements over time and approximately $0.2 million, $0.2 million and $0.3 million, respectively, due to former United members that elected to assign at least 80% of the Cooperative Division qualified cash patronage dividends to fulfill deposit fund requirements.
Required Deposits of Members are contractually subordinated and subject to the prior payment in full of certain of our senior indebtedness. As a condition of becoming a Member, each Member is required to execute a subordination agreement providing for the subordination of the Member’s rights with respect to its Required Deposits and its rights in respect of Patronage Dividend Certificates. Generally, the subordination is such that no payment can be made by us with respect to the Required Deposits in the event of an uncured default by us with respect to our senior indebtedness, or in the event of our dissolution, liquidation or insolvency or other similar proceedings, until all of our senior indebtedness has been paid in full.
If membership status is terminated, upon request, we will return the amount in a Member’s deposit fund that is an Excess Deposit, less any amounts owed to us, provided that the Member is not in default on any other of its obligations to us. The return of a Member’s Required Deposit is governed by, and will be returned only to the extent permitted by, the subordination agreement executed by the Member. We do not permit a Member to offset any obligations owing to us against the Required Deposit.
Pledge of Shares and Guarantees
We require our Members to pledge to us, as collateral, all Class A, Class B and Class E Shares, all other shares and securities issued from time to time to Members by us, all deposits and deposit accounts with us and all distributions thereon and products and proceeds thereof, to secure their obligations to us. Such security is also pledged to us to secure the prohibition against the transfer of their collateral and to secure our rights to repurchase any of our shares held by them. Upon termination of membership of a Member or any affiliate of a Member, or default by a Member or any affiliate of a Member of any agreement with us, we are under no obligation to return any collateral pledged to us, or any proceeds thereof, so long as there are any matured or unmatured, contingent or unliquidated amounts owed by the Member to, or obligations that remain to be performed by the Member for the benefit of, us. We do not permit a Member to offset or recoup any obligations owing to us or otherwise refuse to pay any amounts owed to us. However, we retain all rights of offset and recoupment and furthermore, pledge agreement provides that we have the right to offset and recoup any obligations owed by a Member to us.
As part of the credit evaluation process, individual shareholders of corporate Members, including those who became Members from AG, may be required to guarantee the obligations of the corporate Member, except that former shareholders of United who were, at the date of the United Merger, in compliance with their obligations to United are not required to provide individual guarantees in the absence of financing transactions.
Tax Matters
We are a California corporation operating on a cooperative basis. We are subject to federal, state, franchise and other taxes applicable to corporations, such as sales, excise, real and personal property taxes. We file consolidated annual income tax returns with our subsidiaries.
22
Table of Contents
As a corporation operating on a cooperative basis, we are subject to Subchapter T of the Internal Revenue Code and regulations promulgated thereunder. Under Subchapter T, we generally must distribute patronage dividends to our Members. In order to qualify as a patronage dividend, distributions are made on the basis of the relative value of the business done with or for Members, under a pre-existing obligation to make such payment, and with reference to the net earnings from business done with or for the cooperative’s Members. Patronage dividends are paid in cash or in any form that constitutes a written notice of allocation. A written notice of allocation is distributed to the Member and provides notice of the amount allocated to the Member by Unified and the portion thereof which constitutes a patronage dividend.
Under Subchapter T regulations, we may deduct for the fiscal year to which they relate the amount of patronage dividends paid in cash and qualified written notices of allocation or other property (except a nonqualified written notice of allocation) within 8-1/2 months after the end of the fiscal year to which the patronage dividends relate. A written notice of allocation will be qualified if we pay at least 20% of the patronage dividend in cash, and the Member consents to take the stated dollar amount of the written notice into income in the year in which it is received. Members sign a consent form at the time of membership to satisfy the consent requirement. Members are required to consent to include in their gross income, in the year received, all cash as well as the stated dollar amount of all qualified written notices of allocation, including the Exchange Value Per Share of the Class B Shares distributed to them as part of the qualified written notices of allocation. Class B Shares distributed as part of the qualified written notices of allocation may also be subject to state income taxes.
We are subject to federal income tax and various state taxes on the net earnings of the business with or for Members that are not distributed as qualified written notices of allocation and on the net earnings derived from Non-Patronage Business. In fiscal 2002, as part of our equity enhancement initiative, we issued nonqualified written notices of allocation in the form of Class B Shares and subordinated patronage dividend certificates. In fiscal 2003 through 2005, we issued nonqualified written notices of allocation in the form of Class B and Class E Shares. In fiscal 2006 through 2009, we issued qualified and nonqualified written notices of allocation in the form of Class B and Class E Shares, respectively. For fiscal 2010 through 2015, we distributed 100% of the patronage dividend in cash. The Member does not include a nonqualified written notice of allocation, whether in Class B Shares, Class E Shares or subordinated patronage dividend certificates, as taxable income in the year of receipt, and we are not entitled to an income tax deduction in the year of issuance. When the nonqualified written notice of allocation is redeemed for cash or property, the Member will have ordinary taxable income and we will have an income tax deduction to the extent that the stated dollar amount of such written notice of allocation exceeds its basis.
Members are urged to consult their tax advisors with respect to the applicability of U.S. federal income, state or local tax rules on the ownership and disposition of Class A, Class B and Class E Shares and the receipt of subordinated patronage dividend certificates with respect to their own tax status.
Availability of SEC Filings
We make available, free of charge, through our website (http://www.unifiedgrocers.com) our Forms 10-K, 10-Q and 8-K, as well as our registration statements, proxy statements and all amendments to those reports, as soon as reasonably practicable after those reports are filed electronically with the Securities and Exchange Commission (the “SEC”). Due to the delay in the preparation of our audited financial statements as described in the Explanatory Note to this Form 10-K, we did not file our Annual Report on Form 10-K for the year ended September 27, 2014, and we did not file any Quarterly Reports on Form 10-Q for the quarters ended December 27, 2014, March 28, 2015 and June 27, 2015. A copy of any of the reports filed with the SEC can be obtained from the SEC’s Public Reference Room at 100 F Street, N.E., Washington, D.C. 20549. A copy may also be obtained by calling the SEC at 1-800-SEC-0330. All reports filed electronically with the SEC are available on the SEC’s website at http://www.sec.gov.
23
Table of Contents
Audit Committee Investigation
On December 19, 2014, the Company announced that the Audit Committee was conducting, with the assistance of independent legal counsel, an investigation of issues relating to the setting of case reserves and management of claims by the Company’s former insurance subsidiaries and related matters, including:
| · | SIC case reserving practices and the potential effect on the adequacy of overall insurance reserves; |
| · | Degree of involvement by certain customers affiliated with directors over administrative claims handling processes; |
| · | An interested director transaction; and |
| · | Overall Company oversight of the insurance subsidiaries’ claims handling and management review processes, setting of insurance loss reserves and related matters. |
The Audit Committee Investigation scope included the consideration of relevant information obtained from interviews of employees and Company advisors and the review of electronic data and documents; and also included the significant assistance of outside actuarial advisors.
As noted in the Explanatory Note to this Form 10-K, the Audit Committee investigation concluded with the following findings:
| · | As described in Note 2, “Audit Committee Investigation,” in Part II, Item 8, “Financial Statements and Supplementary Data,” historical case reserving practices at the former insurance subsidiaries were not in compliance with policies and procedures, Unified and Springfield management were on notice of, but did not timely address, this lack of compliance, and such compliance issues led to errors in the historical accounting for insurance reserves. Management has determined that the quantitative effect and qualitative nature of the errors do not require restatement and re-issuance of previously issued financial statements. Certain current and former Company officers signed management representation letters and certifications attesting, to the best of each signatory’s knowledge, to the adequacy of internal controls and that all deficiencies in the design or operation of internal controls over financial reporting (“ICFR”) had been disclosed to the Company’s auditors and the Audit Committee. Over time, those officers became aware of deficiencies in case reserving and claims handling practices at Springfield Insurance Company (“SIC”). Management has now concluded that there were deficiencies in the Company’s ICFR environment (see Part II, Item 9A, “Controls and Procedures,” for further information regarding management’s assessment of internal controls over financial reporting, and related remediation efforts); |
| · | The disclosure language in the Company’s Form 10-K for the fiscal year ended September 27, 2013, in Item 7, “Management’s Discussion and Analysis of Financial Condition and Results of Operations,” which stated “[t]he increase is primarily due to increased claims development[,]” was arguably deficient. The disclosure language in the Company’s Quarterly Report on Form 10-Q for the 39-week period ending June 28, 2014, in Part I, Item 2, “Management’s Discussion and Analysis of Financial Condition and Results of Operations,” which stated “this increase was primarily due to an increase in workers’ compensation reserves for adverse claims development in the California workers’ compensation marketplace” was deficient and inaccurate (see Note 2, “Audit Committee Investigation,” in Part II, Item 8, “Financial Statements and Supplementary Data,” for further information on case reserving practices); |
| · | Neither the Company nor SIC had adequate policies or procedures governing the review, approval, and disclosure of interested party transactions. SIC entered into a related party transaction in fiscal year 2012 (“the 2012 transaction”) that was not evaluated for further scrutiny or disclosure. Certain current and former officers of SIC and the Company signed management representation letters attesting, to the best of each signatory’s knowledge, that all related party transactions had been appropriately identified, recorded, and disclosed in the Company’s financial statements, even though they knew that the 2012 transaction (which was negotiated at arms-length and incorrectly not identified as a related party transaction) had not been disclosed. The Audit Committee has concluded that the 2012 transaction (i) was a related party transaction that should have been, but was not, presented for review and approval to the Unified Board of Directors, and (ii) should have been, but was not, disclosed as a related party transaction in the Company’s fiscal year 2012 Form 10-K. The Audit Committee determined the continuing |
24
Table of Contents
| deficiencies in the Company’s policies and procedures governing the initial identification, review, approval and disclosure of related party transactions require remediation. See Note 20, “Related Party Transactions,” in Part II, Item 8, “Financial Statements and Supplementary Data,” for further information on the 2012 transaction and Part II, Item 9A, “Controls and Procedures,” for further information regarding related remediation efforts; |
| · | Certain customers affiliated with directors experienced a degree of control with respect to administrative claims handling processes that was inconsistent with SIC policies. While the specific issues are related to the former insurance subsidiaries, the Company has concluded that this finding, taken together with those described above, require a review of the Company’s ethics and compliance program as part of its remediation efforts; and |
| · | No member of Company management purposefully engaged in any wrongful or fraudulent conduct in connection with the matters addressed by the Audit Committee Investigation. |
See Note 2, “Audit Committee Investigation,” in Part II, Item 8, “Financial Statements and Supplementary Data,” for discussion of the impact of case reserving practices that led to errors in the historical financial statements, Note 20, “Related Party Transactions,” in Part II, Item 8, “Financial Statements and Supplementary Data,” for disclosure of the aforementioned related party transaction and Part II, Item 9A, “Controls and Procedures,” for conclusions as to the effectiveness of the Company’s disclosure controls and procedures and internal control over financial reporting.
The risks and uncertainties described below are those that we believe are the material risks related to our business. If any of the following risks occur, our business, prospects, financial condition, operating results and cash flows could be adversely affected in amounts that could be material.
Risks Related to the Audit Committee Investigation, the State of the Company’s Internal Control Over Financial Reporting, Our Failure to Timely File Periodic Reports with the SEC and Related Matters
Expenses relating to or arising from the Audit Committee Investigation, including diversion of management’s time and attention, may adversely affect our business and results of operations. As discussed in the Explanatory Note to this Form 10-K, in its Notification of Late Filing on Form 12b-25 dated December 19, 2014, with respect to the Company’s Annual Report on Form 10-K for the year ended September 27, 2014, the Company announced that the Audit Committee of the Company’s Board of Directors (“Audit Committee”) was conducting, with the assistance of independent legal counsel, an investigation of issues relating to the setting of case reserves and management of claims by the Company’s former insurance subsidiaries and related matters (“Audit Committee Investigation”). As a result of the Audit Committee Investigation, the filing of our Annual Reports on Form 10-K for fiscal year 2014 and 2015, as well as the Quarterly Reports on Form 10-Q for fiscal year 2015 and the first and second quarters of fiscal year 2016 were delayed until May 2016.
As a result of the Audit Committee Investigation, we have incurred significant expenses to date related to legal, accounting, and other professional services in connection with the investigation and related remediation efforts, and we may continue to incur significant additional expense with regard to our remediation efforts. In addition, senior management has committed, and continues to commit, substantial amounts of time and effort in connection with the remediation efforts and related matters. The significant amount of time and effort spent by our management team on these matters may divert their attention from the operation of our business. The expenses incurred, and expected to be incurred, on the remediation efforts and related matters, and the diversion of the attention of the management team could have a material adverse effect on our business, financial condition, results of operations or cash flows.
Our management has identified material weaknesses in the Company’s internal control over financial reporting which could, if not remediated, result in material misstatements in our financial statements. We may not be able to fully address the material weaknesses in our internal controls or provide assurance that remediation efforts will prevent future material weaknesses. Our management is responsible for establishing and maintaining
25
Table of Contents
adequate internal control over financial reporting, and the Sarbanes-Oxley Act of 2002 and SEC rules require that our management report annually on the effectiveness of the Company’s internal control over financial reporting and our disclosure controls and procedures. Among other things, our management must conduct an assessment of the Company’s internal control over financial reporting to allow management to report on the effectiveness of the Company’s internal control over financial reporting, as required by Section 404 of the Sarbanes-Oxley Act. As disclosed in Part II, Item 9A, “Controls and Procedures,” our management has determined that we have material weaknesses in the Company’s internal control over financial reporting as of October 3, 2015 related to (i) the oversight and monitoring of subsidiary and operating unit compliance with accounting and reporting policies and procedures and (ii) controls over ensuring accurate and complete financial statement disclosures.
A “material weakness” is a deficiency, or a combination of deficiencies, in internal control over financial reporting, such that there is a reasonable possibility that a material misstatement of our annual or interim financial statements will not be prevented or detected on a timely basis. We are actively engaged in implementing a remediation plan designed to address such material weaknesses. However, future additional material weaknesses in the Company’s internal control over financial reporting may be identified in the future. Any failure to implement or maintain required new or improved controls, or any difficulties we encounter in their implementation, could result in additional material weaknesses, or could result in material misstatements in our consolidated financial statements. The possibility of such future additional misstatements could cause us to delay filing our consolidated financial statements on a timely basis and result in noncompliance with covenants in our credit facilities, which could limit or suspend our access to working capital, which in turn could cause us to curtail or cease doing business altogether. Any such future misstatements in our publicly filed financial statements may impose upon us a requirement to restate such financial results. In addition, if we are unable to remediate successfully the material weaknesses in our internal controls or if we are unable to produce accurate and timely financial statements, our Members may lose confidence in our ability to effectively protect their investments in us, which in turn could lead Members to seek to withdraw such investments and to seek other sources to fulfill their supply needs. There is also the possibility that one or more Members or a regulatory agency could commence civil litigation against us as a result of any such future misstatement. Any such future misstatement or occurrence could result in increased audit, legal and any investigation-related fees, which could severely adversely affect our operations and financial results.
Although we are working to remedy the ineffectiveness of the Company’s internal control over financial reporting, there can be no assurance as to when the remediation plan will be fully implemented, the aggregate cost of implementation or whether the remediation plan will be adequate and effective. Until our remediation plan is fully implemented, our management will continue to devote significant time and attention to these efforts. If we do not complete our remediation in a timely fashion, or at all, or if our remediation plan is inadequate or ineffective, there also will continue to be an increased risk that we will be unable to timely file future periodic reports with the SEC and that our future consolidated financial statements could contain errors that will be undetected. Further and continued determinations that there are material weaknesses in the effectiveness of the Company’s internal control over financial reporting could also adversely affect our ability to attract new Members and their associated investments, as well as severely adversely affect our ability to retain existing financing or obtain, if at all, future financing on reasonable or acceptable terms. The failure to obtain acceptable or any financing could cause our existing Members to request the redemption of their shares which, depending upon the magnitude and extent of any such redemption, could have a material adverse effect on our business.
For more information relating to the Company’s internal control over financial reporting (and disclosure controls and procedures) and the remediation plan undertaken by us, see Part II, Item 9A, “Controls and Procedures.”
The markets in which we operate are highly competitive, characterized by high volume, low profit margins and industry consolidation, and many of our competitors have greater financial resources than us which could place us at a competitive disadvantage and adversely affect our financial performance. The grocery distribution business is generally characterized by a relatively high volume of sales with relatively low profit margins. Price competition among food wholesalers is intense. In addition, we compete with such food wholesalers with regard to quality, variety and availability of products offered, strength of corporate brand labels offered, schedule and reliability of deliveries and the range and quality of services provided.
Some of our competitors, including C&S Wholesale Grocers, Inc., Supervalu, Inc. and United Natural Foods, Inc. (UNFI), are significantly larger and have greater financial resources than us. In addition, industry consolidation has
26
Table of Contents
in the past increased, and may continue in the future to increase, the number of large competitors that we face. These large national distributors have the resources to compete aggressively on price and may be able to offer customers a wider range of products and services and a wider area of distribution than we do. We also face intense competition from regional or specialized distributors and, from time to time, new entrants in various niche markets, with such competitors often able to compete very aggressively in such niches with unique or highly tailored products and services.
To compete effectively, we must keep our costs down to maintain margins while simultaneously increasing sales by offering the right products and services at competitive prices, with the expected quality, variety and availability, to appeal to consumers. If we are unable to compete effectively in our highly competitive industry, we may suffer reduced net sales and/or reduced margins and profitability, or suffer a loss, and our business, financial condition and results of operations could suffer.
We may experience reduced sales and earnings if Members lose market share to larger, often fully integrated traditional full-service grocery store chains or to warehouse club stores, supercenters and discount stores, many of which have greater financial resources than our Members or us. Our Members face intense competition from large, often fully integrated traditional full-service grocery store chains. Most of these store chains have greater resources than our Members and us and benefit from local or national brand name recognition and efficiencies of scale from a fully integrated distribution network, standardization across stores, concentrated buying power and shared overhead costs. In addition, traditional format full-service grocery stores, which include most of our customers, have in recent years faced intense competition from, and lost market share to, non-traditional format stores, including warehouse club stores, supercenters, discount stores and specialty or niche stores focused on upscale and natural and organic products. Many of these non-traditional format stores are very large, with considerable resources, national brand names and economies of scale. This competition from non-traditional format stores has been particularly intense, and significant market share has been lost, with respect to categories of non-perishable products that we sell. Traditional format grocery stores, including our customers, have tended to move to expand their offerings and sales of perishable products, which generally have lower margins for us than non-perishable products. A continued decline in our sales of non-perishable products may adversely affect our profitability.
The market share of non-traditional format stores may grow in the future, potentially resulting in continued losses of sales volume and reduced earnings for our Members and, in turn, for us. Continued losses of market share by our Members, whether to other traditional full-service grocery store chains or to non-traditional format stores, could reduce our net sales, margins and profitability, or cause us to incur losses. As a result, our business, financial condition and results of operations could suffer.
We have an increasingly concentrated customer base, which has in the past reduced, and may continue in the future to reduce, our margins and expose us to an increase in risk concentration, including in the areas of credit risk and the sudden loss of significant customer business. Our operating results are highly dependent upon maintaining or growing our sales to our customers. Our largest customer, Cash & Carry Stores, LLC, a wholly-owned subsidiary of Smart & Final, Inc., a Non-Member customer, constituted approximately 16% of our total net sales for fiscal 2015. In recent years, we have seen our sales become increasingly concentrated with our large customers, with our top ten customers having increased from 42% of our total net sales in fiscal 2008 to 53% of our total net sales in fiscal 2015. A significant loss in membership or volume by one of our larger customers could have a sudden and material adverse effect on our operating results. For example, in the third quarter of fiscal 2011, we lost one of our top ten customers who represented $144.9 million in net sales for the fifty-two weeks immediately preceding the date they ceased purchasing from us. Between fiscal 2011 and fiscal 2012, this resulted in a loss of $87.2 million in annual net sales, or 2% of total net sales in fiscal 2012. We have also experienced an overall decline in the number of Members every year since the end of fiscal 2008. Since then, the number of Members has declined from 520 to 345 at the end of fiscal 2015, an average decline of 5.7% per year in our membership base. We believe this decline has been due to a number of factors, including smaller-volume retailers deciding to conduct business with us as Non-Members, Members discontinuing operations due to competition they face or challenging economic conditions, Members consolidating with other Members and Members choosing other wholesale distributors.
Any such loss of a large customer, the loss of a number of smaller customers or the continued erosion of our membership base, could have a material and adverse effect on our net sales. In addition, to the extent we have
27
Table of Contents
suffered and may in the future suffer a decline in net sales, our margins and profitability have been and will be further negatively impacted to the extent we are unable to correspondingly reduce our fixed costs, such as warehouses, equipment and headcount. As it is difficult to quickly make significant reductions in fixed costs, if we were to suffer a significant and rapid decline in our net sales, such as from the loss of one or more significant customers, our margins and profitability may be adversely impacted, we may incur losses and our business, financial condition and results of operations could suffer.
We will continue to be subject to the risks associated with consolidation within the grocery industry. When independent retailers are acquired by large chains with self-distribution capacity, are driven from business by larger grocery chains, or become large enough to purchase directly from manufacturers or develop their own self-distribution capabilities, we will lose distribution volume. Members may also select other wholesale providers. Reduced volume is normally injurious to profitable operations since fixed costs must be spread over a lower sales volume if the volume cannot be replaced. In addition, as a higher percentage of our sales go to larger customers, our margins tend to be adversely affected as these larger customers typically receive discounts based upon the higher volume of their purchases, which may adversely impact our profitability.
We are also exposed to concentrations of credit risk related primarily to trade receivables, notes receivable and lease guarantees for certain Members. Additionally, we are exposed to risk to master landlords if subtenants default under their subleases with us. Our ten customers with the largest accounts receivable balances accounted for approximately 43% and 40% of total accounts receivable at October 3, 2015 and September 27, 2014, respectively. These concentrations of credit risk may be affected by changes in economic or other conditions affecting the western United States, particularly Arizona, California, Nevada, Oregon and Washington. We could suffer losses as a result of our concentrated credit risk in the event of a significant adverse change in economic or other conditions.
We may experience reduced sales if Members purchase directly from manufacturers or decide to self-distribute. Increased industry competitive pressure is causing some of our Members that can qualify to purchase directly from manufacturers to increase their level of direct purchases from manufacturers and expand their self-distribution activities. Our operating results could be adversely affected if a significant reduction in distribution volume occurred in the future as a result of such a shift to direct purchases and self-distribution by our customers.
The requirement that Members invest in our shares and/or make Required Deposits, and the lack of liquidity with respect to such investments and Required Deposits, may make attracting new Members difficult and may cause existing Members to withdraw from membership. Members are required to meet specific requirements, which include ownership of our capital shares and may include required cash deposits. These investments by Members are a principal source of our capital, and in fiscal 2015, approximately 74% of our net sales were to Members. We compete with other wholesale suppliers who are not structured as cooperatives and therefore have no investment requirements for customers. Our requirements to purchase shares or maintain cash deposits may become an obstacle to retaining existing business and attracting new business. For a discussion of required Member equity investments and deposits, see Part I, Item 1, “Business—Capital Shares” and Part I, Item 1, “Business—Customer Deposits.”
Our Bylaws give the Board complete discretion with respect to the redemption of shares held by terminated Members and excess shares held by Members. Our redemption policy currently provides that the number of Class B Shares that we may redeem in any fiscal year is limited to no more than 5% of the outstanding Class B Shares (after patronage dividends payable in Class B Shares). During fiscal 2016, it is unlikely that we will redeem any Class B Shares that had been tendered for redemption as of the close of fiscal 2015, leaving 94,593 Class B Shares, or 23% of our outstanding Class B Shares at the close of fiscal 2015, which have been tendered for redemption but not yet redeemed. This percentage has steadily increased in recent years, from 21%, 17% and 16% of our outstanding Class B Shares at the close of fiscal 2014, 2013 and 2012, respectively, as we have (1) suspended redemptions of Class A Shares and Class B Shares because we had not been current in our periodic SEC filings, (2) had an increase in the number of shares our Members have sought to redeem and (3) redeemed less than the 5% limit in fiscal 2015, 2014, 2013 and 2012. The increase in the number of shares our Members have sought to redeem has been driven by our having an overall decline in the number of Members every year since the end of fiscal 2008. Since then, the number of Members has declined from 520 to 345 at the end of fiscal 2015, an average decline of 5.7% per year in our membership base. Our annual redemption rate has been less
28
Table of Contents
than the 5% limit in recent years due in significant part to our Board deciding to conserve capital during years of limited profit or a net loss. Based on our recent history of redemptions as compared to the number of shares tendered for redemption, Members seeking to redeem shares may be required to wait a number of years. Members may have even less liquidity with respect to shares in Unified should the Board, in its discretion, cease or reduce redemptions of stock. See Part II, Item 8, “Financial Statements and Supplementary Data—Note 12” for recent redemption activity and the number of outstanding shares tendered for redemption but which have not yet been redeemed. Furthermore, required cash deposits are contractually subordinated and subject to the prior payment in full of our senior indebtedness. For a discussion of the limitations on the redemption of capital shares and the subordination of cash deposits, see Part I, Item 1, “Business—Capital Shares—Redemption of Class A and Class B Shares and Repurchase of Class E Shares,” Part I, Item 1, “Business—Customer Deposits” and Part I, Item 1, “Business—Pledge of Shares and Guarantees.” These limitations on our obligation to redeem capital shares or repay the cash deposits of Members may cause Members to withdraw from membership or potential Members to not become Members.
We are vulnerable to changes in general economic conditions. We are affected by certain economic factors that are beyond our control, including changes in the overall economic environment. In recent periods, we have experienced significant volatility in the cost of certain commodities, the cost of ingredients for our manufactured breads and processed fluid milk and the cost of packaged goods purchased from other manufacturers. An inflationary economic period could impact our operating expenses in a variety of areas, including, but not limited to, employee wages and benefits, workers’ compensation insurance and energy and fuel costs. A portion of the risk related to employee wages and benefits is mitigated by bargaining agreements that contractually determine the amount of inflationary increases. General economic conditions also impact our pension plan liabilities, as the assets funding or supporting these liabilities are invested in securities that are subject to interest rate and stock market fluctuations. A portion of our debt is at floating interest rates and an inflationary economic cycle typically results in higher interest costs. We operate in a highly competitive marketplace and passing on such cost increases to customers could be difficult. It is also difficult to predict the effect that possible future purchased or manufactured product cost decreases might have on our profitability. A lack of inflation in the cost of food products may also adversely impact our margins when we are unable to take advantage of forward buying opportunities whereby we purchase product at a lower price and, by the time we sell the product, the market price and the price at which we are able to sell the product has risen to a higher price as a result of inflation. The effect of deflation in purchased or manufactured product costs would depend on the extent to which we had to lower selling prices of our products to respond to sales price competition in the market. Additionally, we are impacted by changes in prevailing interest rates or interest rates that have been negotiated in conjunction with our credit facilities. A lower interest rate (used, for example, to discount our pension and postretirement unfunded obligations) may increase certain expenses, particularly pension and postretirement benefit costs, while decreasing potential interest expense for our credit facilities. An increase in interest rates may have the opposite impact. Consequently, it is difficult for us to accurately predict the impact that inflation, deflation or changes in interest rates might have on our operations. To the extent we are unable to mitigate increasing costs, or retain the benefits from decreases in costs, patronage dividends may be reduced and/or the Exchange Value Per Share of our Class A and Class B Shares may decrease.
Changes in the economic environment could adversely affect our customers’ ability to meet certain obligations to us or leave us exposed for obligations we have guaranteed. Loans to Members, trade receivables, Member compliance with subleases and lease guarantees could be at risk in a sustained economic downturn. We establish reserves for notes receivable, trade receivables and lease commitments for which the customer may be at risk for default. Under certain circumstances, we would be required to foreclose on assets provided as collateral or assume payments for leased locations for which we have guaranteed payment. Although we believe our reserves to be adequate, our operating results could be adversely affected in the event that actual losses exceed available reserves.
We may on occasion hold investments in the common and/or preferred stock of Members and suppliers. These investments are generally held at cost or the equity method and are periodically evaluated for impairment. As a result, changes in the economic environment that adversely affect the business of these Members and suppliers could result in the write-down of these investments. This risk is unique to a cooperative form of business in that investments are made to support Members’ businesses, and those economic conditions that adversely affect the Members can also reduce the value of our investment, and hence the Exchange Value Per Share of our Class A and Class B Shares. We do not currently hold any equity investments in our Members.
29
Table of Contents
Legal proceedings could lead to unexpected losses. From time to time during the normal course of carrying on our business, we may be a party to various legal proceedings through private actions, class actions, administrative proceedings, regulatory actions or other litigations or proceedings. The outcome of litigation, particularly class action lawsuits and regulatory actions, is difficult to assess or quantify. In the event that management determines that the likelihood of an adverse judgment in a pending litigation is probable and that the exposure can be reasonably estimated, appropriate reserves are recorded at that time pursuant to the Financial Accounting Standards Board’s (“FASB”) Accounting Standards Codification (“ASC”) Topic 450, “Contingencies.” The final outcome of any litigation could adversely affect operating results if the actual settlement amount exceeds established reserves and insurance coverage.
We are subject to existing and changing environmental, health, food safety and safety laws and regulations. We own and operate various facilities and equipment for the manufacture, warehousing and distribution of products to our customers. We are subject to increasingly stringent federal, state and local laws, regulations and ordinances that (1) govern activities or operations that may have adverse effects on the environment, health and safety (e.g., discharges to air and water and handling and disposal practices for solid and hazardous waste), and (2) impose liability for the costs of cleaning up, and certain damages resulting from, past or present spills, disposals or other releases of hazardous materials. In particular, under applicable environmental laws, we may be responsible for remediation of environmental conditions and may be subject to associated liabilities (including liabilities resulting from lawsuits brought by private litigants) relating to our facilities and the land on which our facilities are situated, regardless of whether we lease or own the facilities or land in question and regardless of whether such environmental conditions were created by us or by a prior owner or tenant. In addition, we may be subject to pending federal and state legislation that if ultimately passed, may require us to incur costs to improve facilities and equipment to reduce emissions in order to comply with regulatory limits or to mitigate the financial consequences of a “cap and trade” regime. We are unable to predict the ultimate outcome of such legislation; however, should such legislation require us to incur significant expenditures, our business, results of operations and financial condition may be adversely affected.
We (and our customers) are subject to changes in laws and regulations. Our business is subject to various federal, state and local laws, regulations and administrative practices. We must comply with numerous provisions regulating, among other things, health and sanitation standards, food labeling and safety, equal employment opportunity, and licensing for the sale of food and other products. Changes in federal, state or local minimum wage and overtime laws could cause the Company to incur additional wage costs, which could adversely affect the profitability of our business and that of our customers. The Patient Protection and Affordable Care Act (the “PPACA”) may impact our ability to operate profitably, as the full extent of the impact of the PPACA, if any, cannot be determined until all regulations are promulgated under the PPACA (or changed as a result of ongoing litigation) and additional interpretations of the PPACA become available. We cannot predict future laws, regulations, interpretations, administrative orders, or the effect they will have on our operations. Additional requirements or restrictions could be imposed on the products that we sell, or require that we discontinue or recall the sale of certain products, make substantial changes to our facilities or operations, or otherwise change the manner in which we operate our business. Any of these events could significantly increase the cost of doing business, which could adversely impact our operations and financial condition. The occurrence of any of these events could have a similar impact on the operations and financial condition of our customers, which could adversely impact our business, operations, and financial condition.
We may engage in merger and acquisition activity from time to time and may not achieve the contemplated benefits from such activity. Achieving the contemplated benefits from such activity may be subject to a number of significant challenges and uncertainties, including integration issues, coordination between geographically separate organizations, and competitive factors in the marketplace. We could also encounter unforeseen transaction and integration-related costs or other circumstances such as unforeseen liabilities or other issues. Any of these circumstances could result in increased costs, decreased revenue, decreased synergies and the diversion of management time and attention. If we are unable to achieve our objectives within the anticipated time frame, or at all, the expected benefits may not be realized fully or at all, or may take longer to realize than expected, which could have an adverse effect on our business, financial condition and results of operations, or cash flows.
We are exposed to potential product liability claims and potential negative publicity surrounding any assertion that our products caused illness or injury. The packaging, marketing and distribution of food products purchased
30
Table of Contents
from others or manufactured by us involves an inherent risk of product liability, product recall and adverse publicity. Such products may contain contaminants that may be inadvertently distributed or redistributed by us. These contaminants may result in illness, injury or death if such contaminants are not eliminated. Product liability claims in excess of insurance coverage, as well as the negative publicity surrounding any assertion that our products caused illness, injury or death could have a material adverse effect on our reputation, business, financial condition, results of operations and cash flows.
We will owe money to AmTrust if our insurance reserves for certain policies increase. Our former insurance subsidiaries were subject to the rules and regulations promulgated by various regulatory agencies, including, but not limited to, the California Department of Insurance and the Commonwealth of Bermuda. Historically, our established policy was to record insurance reserves based on estimates made by management and validated by third party actuaries to ensure such estimates were within acceptable ranges. Actuarial estimates were based on detailed analyses of health care cost trends, claims history, demographics, industry trends and federal and state law. As a result, the amount of reserve and related expense has been significantly affected by the outcome of these studies. In addition, our former Insurance segment has in the past experienced significant volatility in its reserves based on actuarial estimates, including volatility resulting from its relatively small size and concentration of business in the California workers’ compensation marketplace.
Significant and adverse changes in the experience of claims settlement and other underlying assumptions have negatively impacted our operating results. For example, in fiscal 2013, we increased reserves in our former Insurance segment by $9.1 million due to a combination of adverse development and case reserving practices and related accounting within the insurance subsidiaries that deviated from the established policy of setting case reserves at the best estimate of ultimate cost. Thereafter, in fiscal 2014, we further increased the workers’ compensation reserves in our former Insurance segment by an additional $10.0 million. See Note 2, “Audit Committee Investigation,” in Part II, Item 8, “Financial Statements and Supplementary Data,” for additional information.
Under the terms of the Stock Purchase Agreement with AmTrust, if during the five-year period following the Closing Date of the sale of the Insurance segment, the insurance reserves in respect of any accident arising prior to the closing and covered by an insurance policy written by an insurance subsidiary prior to January 1, 2015 increase as a result of adverse development, we must pay AmTrust for the amount of the increase, up to $1 million in the aggregate and offset up to $2 million from future Earn-Out Payments (as defined in the Stock Purchase Agreement) due to us under the Stock Purchase Agreement. See Item 1.01, “Entry into a Material Definitive Agreement,” including Exhibit 99.1, “Stock Purchase Agreement by and between Unified Grocers, Inc. and AmTrust Financial Services, Inc. dated as of April 16, 2015” thereto, of our Current Report on Form 8-K, filed on April 22, 2015, and Item 2.01, “Completion of Acquisition or Disposition of Assets,” including Exhibit 99.2, “Master Services Agreement by and between Unified Grocers, Inc. and AmTrust Financial Services, Inc. dated as of October 7, 2015” thereto, of our Current Report on Form 8-K, filed on October 14, 2015, for additional information.
We may not have adequate financial resources to fund our operations. We rely primarily upon cash flow from our operations and Member investments to fund our operating activities. In the event that these sources of cash are not sufficient to meet our requirements, additional sources of cash are expected to be obtained from our credit facilities to fund our daily operating activities. Our credit agreement, which matures on June 28, 2018, requires compliance with various covenants. See Note 7 of Notes to Consolidated Financial Statements in Part II, Item 8, “Financial Statements and Supplementary Data” for additional information. While we are currently in compliance with all required covenants and expect to remain in compliance, this does not guarantee we will remain in compliance in future periods.
As of October 3, 2015, we believe we have sufficient cash flow from operations and availability under the credit agreement to meet our operating needs, capital spending requirements and required debt repayments through June 28, 2018. However, if access to operating cash or to the credit agreement becomes restricted, we may be compelled to seek alternate sources of cash. We cannot assure that alternate sources will provide cash on terms favorable to us or at all. Consequently, the inability to access alternate sources of cash on terms similar to our existing agreement could adversely affect our operations.
The value of our benefit plan assets and liabilities is based on estimates and assumptions, which may prove inaccurate. Our non-union employees participate in a Company sponsored defined benefit pension plan and
31
Table of Contents
Company sponsored postretirement benefit plans. Certain eligible union employees participate in a separate plan providing payouts for unused sick leave. Our officers also participate in a Company sponsored Executive Salary Protection Plan III (“ESPPIII”), which provides additional post-termination retirement income based on each participant’s salary and years of service as an officer of the Company. The postretirement plans provide medical benefits for retired non-union employees, life insurance benefits for retired non-union employees for which active non-union employees are no longer eligible and lump-sum payouts for unused sick days covering certain eligible union employees. Liabilities for the ESPPIII and postretirement plans are not funded. We account for these benefit plans in accordance with ASC Topic 715, “Compensation—Retirement Benefits” and ASC Topic 712, “Compensation—Nonretirement Postemployment Benefits,” which require us to make actuarial assumptions that are used to calculate the carrying value of the related assets, where applicable, and liabilities and the amount of expenses to be recorded in our consolidated financial statements. Assumptions include the expected return on plan assets, discount rates, health care cost trend rate, projected life expectancies of plan participants and anticipated salary increases. While we believe the underlying assumptions are appropriate, the carrying value of the related assets and liabilities and the amount of expenses recorded in the consolidated financial statements could differ if other assumptions are used. See Notes 13 and 14 of Notes to Consolidated Financial Statements in Part II, Item 8, “Financial Statements and Supplementary Data” for additional information.
The credit and liquidity crisis in the United States and throughout the global financial system in 2008-2009 triggered substantial volatility in the world financial markets and banking system. As a result, the investment portfolio of the Unified Cash Balance Plan incurred a significant decline in the fair value of plan assets during fiscal 2008. The value of the plan’s investment portfolio increased during fiscal 2009 and 2010, declined in fiscal 2011, increased in fiscal 2012, 2013 and 2014 and declined in fiscal 2015. Management has determined these declines to be temporary in nature. The values of the plan’s individual investments have and will fluctuate in response to changing market conditions, and the amount of gains or losses that will be recognized in subsequent periods, if any, cannot be determined.
Authoritative accounting guidance may necessitate companies who issue and redeem shares based on book value to redefine the method used to value their shares. Authoritative accounting guidance that requires adjustments to shareholders’ equity has the potential to impact companies whose equity securities are issued and redeemed at book value (“book value companies”) disproportionately more than companies whose share values are market-based (“publicly traded”). While valuations of publicly traded companies are primarily driven by their income statement and cash flows, the traded value of the shares of book value companies, however, may be immediately impacted by adjustments affecting shareholders’ equity upon implementation. Therefore, such guidance may necessitate companies who issue and redeem shares based on book value to redefine the method used to value their shares. As such, we modified our Exchange Value Per Share calculation to exclude accumulated other comprehensive earnings (loss) from Book Value (see Part II, Item 6,“Selected Financial Data” for additional information on the calculation of the Exchange Value Per Share), thereby excluding the potentially volatile impact that (1) ASC Topic 715-20, “Compensation—Retirement Benefits—Defined Benefit Plans—General” and (2) changes in unrealized gains and losses, net of taxes, on available for sale investments would have on shareholders’ equity and Exchange Value Per Share.
A system failure or breach of system or network security could delay or interrupt services to our customers or subject us to significant liability. We have implemented security measures such as firewalls, virus protection, intrusion detection and access controls to address the risk of computer viruses and unauthorized access. A business continuity plan has been developed focusing on the offsite restoration of computer hardware and software applications. We have also developed business resumption plans, which include procedures to ensure the continuation of business operations in response to the risk of damage from energy blackouts, natural disasters, terrorism, war and telecommunication failures, and we have implemented change management procedures and quality assurance controls designed to ensure that new or upgraded business management systems operate as intended. However, there can be no assurances that any of these efforts will be adequate to prevent a system failure, accident or security breach, any of which could result in a material disruption to our business. In addition, substantial costs may be incurred to remedy the damages caused by any such disruptions.
Our success depends on our retention of our executive officers and senior management, and our ability to hire and retain additional key personnel. Our success depends on the skills, experience and performance of our executive officers, senior management and other key personnel. The loss of service of one or more of our executive officers, senior management or other key employees could have a material adverse effect on our business,
32
Table of Contents
prospects, financial condition, operating results and cash flows. Our future success also depends on our continuing ability to attract and retain highly qualified technical, sales and managerial personnel. Competition for these personnel is intense, and there can be no assurance that we can retain our key employees or that we can attract, assimilate or retain other highly qualified technical, sales and managerial personnel in the future.
We depend on third parties for the supply of products and raw materials and for marketing and promotional programs. We depend upon third parties for the supply of products, including corporate brand products, and raw materials. Any disruption in the services provided by any of these suppliers, or any failure by them to handle current or higher volumes of activity, could have a material adverse effect on our business, prospects, financial condition, operating results and cash flows.
We participate in various marketing and promotional programs to increase sales volume and reduce merchandise costs. Failure to continue these relationships on terms that are acceptable to us, or to obtain adequate marketing relationships, could have a material adverse effect on our business, prospects, financial condition, operating results and cash flows.
Increased electricity, diesel fuel and gasoline costs could reduce our profitability. Our operations require and are dependent upon the continued availability of substantial amounts of electricity, diesel fuel and gasoline to manufacture, store and transport products. Our trucking operations are extensive and diesel fuel storage capacity represents approximately two weeks average usage. The prices of electricity, diesel fuel and gasoline fluctuate significantly over time. Given the competitive nature of the grocery industry, we may not be able to pass on increased costs of production, storage and transportation to our customers. As a result, either a shortage or significant increase in the cost of electricity, diesel fuel or gasoline could disrupt distribution activities and negatively impact our business and results of operations.
A strike or work stoppage by employees could disrupt our business and/or we could face increased operating costs from higher wages or benefits we must pay our employees. Approximately 60% of our employees are covered by collective bargaining agreements, which have various expiration dates ranging from 2016 through 2020. If we are unable to negotiate acceptable contracts with labor unions representing our unionized employees, we may be subject to a strike or work stoppage that disrupts our business and/or increased operating costs resulting from higher wages or benefits paid to union members or replacement workers. Any such outcome could have a material adverse effect on our operations and financial results.
If we fail to maintain an effective system of internal controls, we may not be able to detect fraud or report our financial results accurately, which could harm our business and subject us to regulatory scrutiny. Pursuant to Section 404 of the Sarbanes-Oxley Act of 2002, we perform an annual evaluation of our internal controls over financial reporting. Although we believe our internal controls are operating effectively, we cannot guarantee that we will not have any material weaknesses in the future. In addition, any failure to implement required new or improved controls, or difficulties encountered in their implementation, could harm our operating results or cause us to fail to meet our reporting obligations.
A loss of our cooperative tax status could increase tax liability. Subchapter T of the Internal Revenue Code sets forth rules for the tax treatment of cooperatives. As a cooperative, we are allowed to offset patronage earnings with patronage dividends that are paid in cash or through qualified written notices of allocation. However, we are taxed as a typical corporation on the remainder of our earnings from our Member business and on earnings from our Non-Member business. If we are not entitled to be taxed as a cooperative under Subchapter T, our revenues would be taxed when earned by us and the Members would be taxed when dividends are distributed. The Internal Revenue Service can challenge the tax status of cooperatives. The Internal Revenue Service has not challenged our tax status, and we would vigorously defend any such challenge. However, if we were not entitled to be taxed as a cooperative, taxation at both the Company and the Member level could have a material adverse impact on us and our Members.
Each method used to meet the Class B Share Requirement has its own tax consequences. Class B Shares required to be held by a new Member may be purchased directly at the time of admission as a Member or may be acquired over the five consecutive fiscal years commencing with the first year after admission as a Member at the rate of 20% per year. In addition, certain Members, including former shareholders of United Grocers, Inc. or
33
Table of Contents
Associated Grocers, Incorporated, may satisfy their Class B Share Requirement only with respect to stores owned at the time of admission as a Member solely from their patronage dividend distributions. Each of these purchase alternatives may have tax consequences which are different from those applicable to other purchase alternatives. Members and prospective Members are urged to consult their tax advisers with respect to the application of U.S. federal income, state or local tax rules to the purchase method selected.
Members’ Class A, Class B and Class E Shares are subject to risk of loss. Class A and Class B Shares are purchased and sold at purchase prices equal to the Exchange Value Per Share at the close of the last fiscal year end prior to the date the shares are purchased or tendered for redemption. Class E Shares become eligible for repurchase at the discretion of the Board at a price of $100 per share ten years after their issuance date, with the outstanding Class E Shares becoming eligible for repurchase between the end of fiscal 2013 and the end of fiscal 2018. There is no assurance that our financial condition will enable us to, or our Board will determine to, redeem or repurchase Class A, Class B or Class E Shares at such time they become eligible for redemption or repurchase, or ever. During fiscal 2016, it is unlikely that the Company will redeem any Class B Shares that had been tendered for redemption as of the close of fiscal 2015. Accordingly, Members may lose all or a portion of their investment in the Class A, Class B or Class E Shares. See “The requirement that Members invest in our shares and/or make Required Deposits, and the lack of liquidity with respect to such investments and Required Deposits, may make attracting new Members difficult and may cause existing Members to withdraw from membership.”
If the Board decides in any year to retain a portion of our earnings from our Non-Patronage Business, and not to allocate those earnings to the Exchange Value Per Share, the redemption price of Class A and Class B Shares that are repurchased in the year of such retention and in future years will be reduced.
Severe weather, natural disasters and adverse climate changes may adversely affect our financial condition and results of operations. Severe weather conditions, such as hurricanes or tornadoes, or natural disasters, such as earthquakes or fires, in areas in which we have distribution facilities, in which customers’ stores are located or from which we obtain products may adversely affect our results of operations. Such conditions may cause physical damage to our properties, closure of one or more of our distribution facilities, closure of customers’ stores, lack of an adequate work force in a market, temporary disruption in the supply of products, disruption in the transport of goods, delays in the delivery of goods to our distribution centers or customer stores or a reduction in the availability of products we offer. In addition, adverse climate conditions and adverse weather patterns, such as droughts and floods, impact growing conditions and the quantity and quality of crops yielded by food producers and may adversely affect the availability or cost of certain products within the grocery supply chain. Our business resumption plans may not be effective in a timely manner and a significant disruption to our business could occur in the event of a natural disaster, terrorism or war. In addition, while we carry insurance to cover business interruption and damage to buildings and equipment, some of the insurance carries high deductibles. Any of these factors may disrupt our business and adversely affect our financial condition and results of operations.
Item 1B. UNRESOLVED STAFF COMMENTS
Not applicable.
Our corporate offices, warehouses and manufacturing facilities as of October 3, 2015 are as follows:
| Approximate Square Footage |
||||||||
| Description | Owned | Leased | ||||||
| Corporate offices(1) |
73,567 | 287,789 | ||||||
| Dry warehouses |
2,165,123 | 980,989 | ||||||
| Refrigerated warehouses |
744,336 | 338,327 | ||||||
| Manufacturing facilities |
181,206 | — | ||||||
| (1) | Includes corporate offices for both our Wholesale Distribution and Insurance segments. |
34
Table of Contents
These properties are located in California, Oregon and Washington. We consider our corporate offices, warehouses and manufacturing properties to be generally in good condition, well maintained, suitable, and adequate to carry on our business as presently conducted. Certain of our real and personal property is pledged as collateral to secure our credit agreement with Wells Fargo Bank, National Association, and the other lenders who are party to the existing Amended and Restated Credit Agreement dated as of June 28, 2013, as amended on December 18, 2014 by a second amendment. See Note 7 of Notes to Consolidated Financial Statements in Part II, Item 8, “Financial Statements and Supplementary Data” for additional information.
We are a party to various litigation, claims and disputes, some of which are for substantial amounts, arising in the ordinary course of business. While the ultimate effect of such actions cannot be predicted with certainty, we believe the outcome of these matters will not have a material adverse effect on our financial condition or results of operations.
Item 4. MINE SAFETY DISCLOSURES
Not applicable.
Additional Item. EXECUTIVE OFFICERS OF THE REGISTRANT
Please refer to the information under Part III, Item 10, “Directors and Executive Officers of the Registrant” for information regarding the executive officers of the Registrant.
35
Table of Contents
Part II
Item 5. MARKET FOR REGISTRANT’S COMMON EQUITY, RELATED STOCKHOLDER MATTERS AND ISSUER PURCHASES OF EQUITY SECURITIES
There is no established public trading market for our Class A, Class B, Class C or Class E Shares. As of April 30, 2016, our Class A Shares (122,500 shares outstanding) were held of record by 350 shareholders, Class B Shares (410,537 shares outstanding) were held of record by 516 shareholders, Class C Shares were held of record, one share each, by 15 directors of Unified, and our Class E Shares (120,768 shares outstanding) were held of record by 660 shareholders.
The Company has previously reported its purchases of its capital shares in periods up to and including the third quarter of fiscal 2014 in previously filed Forms 10-Q and 10-K. The table below summarizes the Company’s purchases of its capital shares in each quarter from the fourth quarter of fiscal 2014 through the fourth quarter of fiscal 2015 as follows:
Company Purchases of Capital Shares
| Period |
Total Number of Shares |
Average Price Paid Per Share |
||||||
| June 29, 2014 – September 27, 2014 (Class A shares) |
2,450 | $ | 279.50 | |||||
| September 28, 2014 – December 27, 2014 |
— | — | ||||||
| December 28, 2014 – March 28, 2015 (Class A Shares) |
3,500 | $ | 279.50 | |||||
| March 29, 2015 – June 27, 2015 (Class A Shares) |
1,050 | $ | 279.50 | |||||
| June 28, 2015 – October 3, 2015 (Class A Shares) |
2,450 | $ | 279.50 | |||||
| June 28, 2015 – October 3, 2015 (Class B Shares) |
2,985 | $ | 292.19 | |||||
| June 28, 2015 – October 3, 2015 (Class E Shares) |
2,809 | $ | 100.00 | |||||
|
|
||||||||
| Total |
15,244 | $ | 248.91 | |||||
|
|
||||||||
The redemption or repurchase of Class A, Class B or Class E Shares is solely at the discretion of the Board. Our revolving credit agreement imposes financial conditions on us redeeming or repurchasing any of our Class A Shares, Class B Shares and Class E Shares, and prohibits distributions to shareholders and any redemption or repurchase of shares when an event of default (as defined in our credit agreement) has occurred and is continuing.
Dividends
Cash dividends are not generally paid by us, and we currently do not intend to pay cash dividends in the foreseeable future, as we intend to retain any earnings for use in our business. No cash dividends were paid during fiscal 2015, 2014 and 2013. Our revolving credit agreement imposes financial conditions on our paying cash dividends on Class E Shares (other cash dividends being generally prohibited). The payment of dividends is within the sole discretion of our Board of Directors, and will depend upon, among other things, financial condition, capital requirements, and general business conditions. See Note 12, “Capital Shares” of Notes to Consolidated Financial Statements in Part II, Item 8, “Financial Statements and Supplementary Data” for additional information.
Performance Graph
The following graph sets forth the five-year cumulative total shareholder return on our shares as compared to the cumulative total shareholder return for the same period of our Peer Group and the S&P 500 Index. Our Peer Group consists of SpartanNash Company, United Natural Foods, Inc. (“UNFI”) and Supervalu, Inc. We added UNFI as a replacement for Nash Finch Company, which merged with Spartan Stores in November, 2013. The merged company, SpartanNash Company, remains in the Peer Group. These companies were selected on the basis that the companies, although unlike Unified in that they are not structured as cooperative organizations, have certain operational characteristics that are similar to Unified. For example, each of the companies is a full-line distributor of grocery products. While all shares of the companies included in the Peer Group are publicly traded, our shares
36
Table of Contents
are privately held. We exchange our Class A and Class B Shares with our Members at the Exchange Value Per Share (see Part I, Item 1, “Business—Capital Shares”). The Exchange Value Per Share, as currently calculated, is equal to Book Value (as defined below) divided by the number of Class A and Class B Shares outstanding at the end of the fiscal year, excluding shares tendered for redemption. “Book Value” is computed based on (1) the fiscal year end balance of Class A and Class B Shares, excluding the redemption value of unredeemed shares tendered for redemption, plus (2) retained earnings excluding non-allocated retained earnings.
The graphical presentation of the cumulative total return of the companies included in the Peer Group reflects the incremental change in book value of the shares of those companies. The book value of the members of the Peer Group have been computed based on total equity, less other accumulated comprehensive income, divided by the number of outstanding shares for the years 2011 through 2015.
The comparison assumes $100 was invested on October 1, 2010 in the shares of the Company, the shares of the Peer Group and in the foregoing index through October 3, 2015. The historical cost performance on the following graph is not necessarily indicative of future cost performance.
This graph shall not be deemed incorporated by reference by any general statement incorporating by reference this Annual Report on Form 10-K into any filing under the Securities Act of 1933 or the Securities Exchange Act of 1934, except to the extent that we specifically incorporate this information by reference, and shall not otherwise be deemed filed under such Acts.
Comparison of Five Year* Cumulative Total Return
Among Unified Grocers, Inc., S&P 500 Index and Peer Group
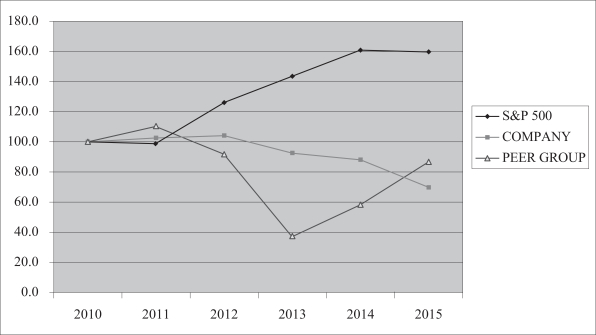
| * | Fiscal years ended October 1, 2011, September 29, 2012, September 28, 2013, September 27, 2014 and October 3, 2015. |
37
Table of Contents
Item 6. SELECTED FINANCIAL DATA
The selected financial information below has been compiled from the audited consolidated financial statements of Unified for the fiscal years ended October 3, 2015, September 27, 2014, September 28, 2013, September 29, 2012 and October 1, 2011. The following selected consolidated financial data should be read in conjunction with our consolidated financial statements and the notes thereto (see Part II, Item 8, “Financial Statements and Supplementary Data”) and the information contained in Part II, Item 7, “Management’s Discussion and Analysis of Financial Condition and Results of Operations.” Historical results are not necessarily indicative of future results.
| (dollars in thousands, except Exchange Value Per Share) | ||||||||||||||||||||
| Fiscal Year Ended†(a) | October
3, (53 Weeks) |
September
27, (52 Weeks)(d)(e) |
September 28, (52 Weeks)(d) |
September 29, (52 Weeks)(d) |
October 1, (52 Weeks) |
|||||||||||||||
| Net sales(c) |
$ | 4,027,620 | $ | 3,753,560 | $ | 3,672,459 | $ | 3,742,245 | $ | 3,799,229 | ||||||||||
| Operating income |
1,816 | 21,675 | 12,206 | 21,654 | 37,433 | |||||||||||||||
| (Loss) earnings before patronage dividends and income taxes |
(11,362 | ) | 10,478 | (10,370 | ) | 9,109 | 25,091 | |||||||||||||
| Patronage dividends |
7,234 | 9,395 | 9,609 | 10,787 | 12,431 | |||||||||||||||
| Net loss (earnings) from continuing operations |
(14,645 | ) | (425 | ) | (12,484 | ) | (285 | ) | 7,387 | |||||||||||
| Net (loss) earnings from discontinued operations |
(6,874 | ) | (4,981 | ) | (5,160 | ) | 2,238 | — | ||||||||||||
| Net (loss) earnings |
(21,519 | ) | (5,406 | ) | (17,644 | ) | 1,953 | 7,387 | ||||||||||||
| Total assets |
964,325 | 928,217 | 916,606 | 923,208 | 923,678 | |||||||||||||||
| Long-term notes payable |
261,585 | 231,029 | 231,531 | 196,484 | 226,162 | |||||||||||||||
| Exchange Value Per Share(b) |
218.27 | 267.69 | 279.50 | 316.11 | 312.31 | |||||||||||||||
|
|
||||||||||||||||||||
| † | Our fiscal year ends on the Saturday nearest September 30. |
| (a) | The following items are not included within Selected Financial Data because they are not applicable to our operations: income from continuing operations per common share, redeemable preferred stock (within long-term obligations), and cash dividends per common share. |
| (b) | We exchange our Class A and Class B Shares with our Members at the Exchange Value Per Share (see Part I, Item 1, “Business—Capital Shares”). The Exchange Value Per Share, as currently calculated, is equal to Book Value (as defined below) divided by the number of Class A and Class B Shares outstanding at the end of the fiscal year, excluding shares tendered for redemption. “Book Value” is computed based on (1) the fiscal year end balance of Class A and Class B Shares, excluding the redemption value of unredeemed shares tendered for redemption, plus (2) retained earnings, excluding non-allocated retained earnings. |
Exchange Value Per Share does not necessarily reflect the amount for which our net assets could be sold or the dollar amount that would be required to replace them. If the Board decides in any year to retain a portion of our earnings from our Non-Patronage Business, and to not allocate those earnings to the Exchange Value Per Share, the redemption price of Class A and Class B Shares that are repurchased in the year of such retention and in future years will be reduced. Likewise, if the Board decides in any year to reverse prior allocations of earnings from our Non-Patronage Business and allocate such amounts to the Exchange Value Per Share, then the redemption price of Class A and Class B Shares that are repurchased in the year of such reversal and in future years will be increased. See Part II, Item 5, “Market For Registrant’s Common Equity, Related Stockholder Matters And Issuer Purchases Of Equity Securities” for additional information on the calculation of the Exchange Value Per Share. Our Class C and Class E Shares are exchanged with our directors and Members, respectively, at a fixed stated value. See “—Classes of Shares—Class C Shares” and “—Classes of Shares—Class E Shares.”
The Board each year may increase or decrease the amount of non-allocated retained earnings that are excluded from the Exchange Value Per Share. The Board set aside non-allocated retained earnings for fiscal 2010, in the amount of $3.7 million, increased the amount to $6.9 million for fiscal 2011 and held the amount constant at $6.9 million for fiscal 2012, 2013, 2014 and 2015. As a result, the Exchange Value Per Share was approximately $13, $14, $14, $15 and $16 lower for fiscal 2011, 2012, 2013, 2014 and 2015, respectively, than it would have been had the non-allocated retained earnings been allocated to our share price.
38
Table of Contents
| (c) | Certain transactions involving vendor direct arrangements are presented on a net basis within net sales to conform to ASC 605-45-45. We have included a reconciliation of “Net sales” to “Gross billings” in the following table. Transactions involving vendor direct arrangements are comprised principally of sales of produce in the Pacific Northwest and Northern California and sales of branded ice cream in Southern California. Financial measures used by us may differ from similar measures used by other companies, even when similar terms are used to identify such measures. “Gross billings” is a metric used by management and believed to be useful to investors to assess our operating performance from the perspective of total sales reach to customers. |
| Fiscal Year Ended | October 3, 2015 |
September 27, 2014(d) |
September 28, 2013(d) |
September 29, 2012(d) |
October 1, 2011 |
|||||||||||||||
| Net sales |
$ | 4,027,620 | $ | 3,753,560 | $ | 3,672,459 | $ | 3,742,245 | $ | 3,799,229 | ||||||||||
| Add: Gross billings through vendor direct arrangements |
117,021 | 112,406 | 51,142 | 35,075 | 48,546 | |||||||||||||||
|
|
||||||||||||||||||||
| Gross billings |
$ | 4,144,641 | $ | 3,865,966 | $ | 3,723,601 | $ | 3,777,320 | $ | 3,847,775 | ||||||||||
|
|
||||||||||||||||||||
Based on the foregoing information, gross billings increased 7.2% for the year ended October 3, 2015 compared to the year ended September 27, 2014, while net sales increased 7.3% for the same periods.
| (d) | Amounts for the fiscal years ending September 27, 2014, September 28, 2013 and September 29, 2012 have been re-cast to reflect the presentation of our held-for-sale discontinued operations of our former Insurance segment on a comparable basis to the fiscal year ended October 3, 2015. |
| (e) | As discussed in the Explanatory Note to this Form 10-K, the financial statements presented for the fiscal year ended September 27, 2014 within this filing include an error correction on a pre-tax and an after tax basis of approximately $2.0 million and $1.9 million, respectively, of cumulative additional expense for insurance reserves applicable to prior fiscal periods. Management has determined that the quantitative effect and qualitative nature of the errors do not require restatement and re-issuance of previously issued financial statements. The correction is reflected in the discontinued operations of Springfield Insurance Company (one of the Company’s former insurance subsidiaries). As disclosed in Note 3, “Assets Held for Sale/Discontinued Operations,” in Part II, Item 8, “Financial Statements and Supplementary Data,” the Company’s Insurance segment was sold on October 7, 2015 and is no longer part of the Company’s continuing operations. See Part II, Item 7, “Management’s Discussion and Analysis of Financial Condition and Results of Operations,” and Note 2, “Audit Committee Investigation,” in Part II, Item 8, “Financial Statements and Supplementary Data,” for further information about the error corrections contained within the financial statements presented. |
39
Table of Contents
| Item 7. | MANAGEMENT’S DISCUSSION AND ANALYSIS OF FINANCIAL CONDITION AND RESULTS OF OPERATIONS |
Forward-Looking Information
This report contains “forward-looking statements” within the meaning of the Private Securities Litigation Reform Act of 1995. These statements relate to expectations concerning matters that (a) are not historical facts, (b) predict or forecast future events or results, or (c) embody assumptions that may prove to have been inaccurate. These forward-looking statements involve risks, uncertainties and assumptions. When we use words such as “believe,” “expect,” “anticipate” or similar expressions, we are making forward-looking statements. Although we believe that the expectations reflected in such forward-looking statements are reasonable, we cannot give readers any assurance that such expectations will prove correct. The actual results may differ materially from those anticipated in the forward-looking statements as a result of numerous factors, many of which are beyond our control. Important factors that could cause actual results to differ materially from our expectations include, but are not limited to, the factors discussed in the sections entitled Item 1A, “Risk Factors” and “Critical Accounting Policies and Estimates” within “Management’s Discussion and Analysis of Financial Condition and Results of Operations.” All forward-looking statements attributable to us are expressly qualified in their entirety by the factors that may cause actual results to differ materially from anticipated results. Readers are cautioned not to place undue reliance on these forward-looking statements, which reflect management’s opinion only as of the date hereof. We undertake no duty or obligation to revise or publicly release the results of any revision to these forward-looking statements. Readers should carefully review the risk factors described in Item 1A of this document as well as in other documents we file from time to time with the SEC for an understanding of the negative variables that can affect our business and results of operations.
As discussed in the Explanatory Note to this Form 10-K, as well as in Note 2 to our audited consolidated financial statements, which accompany the financial statements in Item 8 of this report, as a result of the Audit Committee Investigation, management concluded that errors related to the accounting for insurance reserves existed in the historical financial statements. Management has determined that the quantitative effect and qualitative nature of the errors do not require restatement and re-issuance of previously issued financial statements.
Company Overview
About the Company
Unified, a California corporation organized in 1922 and incorporated in 1925, is a retailer-owned, grocery wholesale cooperative serving supermarket, specialty, restaurant supply and convenience store operators primarily located in the western United States and the Pacific Rim. Our customers include our Members and Non-Members and range in size from single store operators to regional supermarket chains.
We sell a wide variety of products typically found in supermarkets, as well as a variety of specialty products. We also provide support services to our customers, including financing, merchandising, retail pricing, advertising, promotional planning, retail technology, equipment purchasing and real estate services. Support services constitute less than 1% of total net sales. We report all product sales and support services (other than financing) under Wholesale Distribution. Finance activities are reported as All Other. The availability of specific products and services may vary by geographic region. We have three separate geographical and marketing regions: Southern California, Northern California and the Pacific Northwest.
Recent Developments
Audit Committee Investigation. In September 2014, the Audit Committee of the Company’s Board of Directors announced that it was conducting, with the assistance of independent legal counsel, an investigation of issues relating to the setting of case reserves and management of claims by our former insurance subsidiaries and related matters (the “Audit Committee Investigation”). We incurred approximately $5.5 million in expenses through the fiscal year ended October 3, 2015 in connection with the Audit Committee Investigation. Approximately $0.7 million of these expenses were included in our loss on sale of our discontinued operations as further discussed below. For additional information on the Audit Committee Investigation, see Part I, “Explanatory Note,” Part I, Item 1, “Business—Audit Committee Investigation” and Part II, Item 9A, “Controls and Procedures.”
40
Table of Contents
Haggen. In December 2014, Haggen, a Member, entered into an agreement to acquire 146 stores divested in the merger of Albertson’s LLC and Safeway, Inc. At that time, we entered into an agreement (the “Supply Agreement”) with Haggen to be its primary supplier in California, Arizona and Nevada (the “Pacific Southwest” stores) and a substantial supplier in Washington and Oregon. In addition, we agreed to provide Haggen with certain business services. As the new Haggen stores were converted, our weekly product shipments to Haggen reached approximately $11 million at their peak at the end of June 2015.
In September 2015, Haggen filed voluntary petitions for reorganization under Chapter 11 of the U.S. Bankruptcy Code. Prior to Haggen’s bankruptcy filing, we terminated our product supply agreement with Haggen and had already begun reducing our potential exposure including, but not limited to, arranging for payment in advance for product supplied to Haggen and reducing the amount of inventory we were carrying specifically for Haggen. In October 2015, we entered into a trade agreement (the “Trade Agreement”) with Haggen under which we continued to supply product to Haggen as a critical vendor during Haggen’s Chapter 11 case. Pursuant to the Trade Agreement, Haggen paid a substantial portion of our prepetition receivable in exchange for certain shipping terms from Unified. Haggen also agreed to stipulate to an allowed administrative expense priority claim under section 503(b)(9) of the Bankruptcy Code for the balance of our prepetition claim for goods shipped to Haggen. We also filed a proof of claim against Haggen for breach of contract damages related to the termination of the Supply Agreement and various ancillary agreements. Such claim would be treated as a general unsecured claim in the Haggen chapter 11 cases. Haggen has not yet filed a chapter 11 plan and projected recoveries on general unsecured claims are not yet determined in Haggen’s case.
Effective November 21, 2015, we ceased supplying product to Haggen’s Pacific Southwest stores. Accordingly, we do not expect the sales to Haggen to continue at the levels generated during the last half of fiscal 2015 or during the first quarter of fiscal 2016. Sales to Haggen’s Pacific Southwest stores were approximately $9.6 million for the first quarter of fiscal 2016. Pursuant to the Trade Agreement, we continued to supply Haggen’s Washington and Oregon stores with product during Haggen’s bankruptcy case.
Raley’s. In February 2015, we entered into an agreement with Raley’s Supermarkets (“Raley’s”) under which we subleased its existing Stockton, California facility for five years. We currently operate that facility to distribute general merchandise and health and beauty products to Raley’s under a five-year supply agreement. This facility also services our other customers, and has created the opportunity for Unified to consolidate and distribute all general merchandise and health and beauty care products from a single location.
Sale of Insurance Segment. In July 2014, our management and Board made a strategic determination to focus the Company’s efforts on our core grocery business operations in order to better serve Unified’s Members and customers. In conjunction with this decision, our management and Board determined that our insurance operations represented a significant non-core portion of our business, and accordingly began discussions with a previously unsolicited potential buyer to sell our Insurance segment. On October 7, 2015 (the “Closing Date”), we completed the sale, at a discount to Tangible Book Value (“TBV”) (as defined in the Stock Purchase Agreement discussed below), of all of the outstanding shares of our wholly owned subsidiary, Unified Grocers Insurance Services (“UGIS”), to AmTrust Financial Services, Inc. (“AmTrust”) pursuant to the terms of a Stock Purchase Agreement (the “Stock Purchase Agreement”) by and between the Company and AmTrust dated as of April 16, 2015. At the Closing Date, UGIS owned all of the outstanding shares of the capital stock of Springfield Insurance Company and Springfield Insurance Company Limited (Bermuda). We refer to UGIS, Springfield Insurance Company and Springfield Insurance Company Limited (Bermuda) collectively as the “Acquired Companies.”
We received $26.2 million in cash proceeds for the Acquired Companies, representing an agreed-upon discount to the estimated TBV, which was calculated as defined in the Stock Purchase Agreement. In May 2016, AmTrust delivered to us a final closing statement, including its calculation of the TBV as of the Closing Date. The final purchase price was adjusted to reflect an increase in the purchase price of $0.4 million between the estimated TBV as of the Closing Date and the actual TBV as of the Closing Date.
We incurred a net loss of $6.9 million in conjunction with the sale of the Acquired Companies at the Closing Date, including a net operating loss from discontinued operations of $3.7 million and a $1.3 million impairment on our investment in the Acquired Companies, in addition to $1.9 million of charges related to the sale, primarily comprised of costs incurred by us directly attributable to the Audit Committee Investigation and to the preparation
41
Table of Contents
and consummation of the sale of the Acquired Companies to AmTrust. Our historical financial statements have been revised to present the operating results of the Acquired Companies as discontinued operations. See Note 3, “Assets Held For Sale/Discontinued Operations” in Part II, Item 8, “Financial Statements and Supplementary Data” for additional information. Our estimated net loss on sale resulted in a reduction of approximately $16 per share to our Exchange Value Per Share. See Part II, Item 5, “Market For Registrant’s Common Equity, Related Stockholder Matters And Issuer Purchases Of Equity Securities” and Part II, Item 6, “Selected Financial Data” for additional information on the calculation of the Exchange Value Per Share.
Market Centre. In fiscal 2015, our Market Centre subsidiary was dissolved as a legal entity and ceased operating as a wholly-owned subsidiary of the Company. Market Centre now conducts business as a separate division within our Wholesale Distribution segment. Additionally, beginning in fiscal 2015, earnings from sales of food products such as Hispanic, other ethnic, gourmet, natural, organic and other specialty foods sold to Members through our Market Centre division are included in patronage earnings and may be eligible for patronage distributions. Earnings from sales to Non-Member customers are retained by the Company.
Dairy Divisions. In July 2016, we will cease operating our Southern California Dairy Division manufacturing facility, but will continue offering fluid milk and other products, including our private label brands, to our Members and customers through a vendor direct arrangement with Alta-Dena Certified Dairy, LLC, a wholly-owned subsidiary of Dean Foods Company (“Dean Foods Company”). Coincident with this change, we will no longer pay patronage dividends on products supplied by Dean Foods Company. In conjunction with the changes to the Southern California Dairy Division, the Pacific Northwest Dairy Division will no longer pay patronage dividends on sales of dairy products beginning in June 2016.
Addition of New Supplier for Private Label Products. As discussed in “Business—Products—Corporate Brands,” we currently sell products under premium and value-oriented corporate brands. In February 2016, we joined Topco as a member. Topco is a privately held company that provides procurement, quality assurance, packaging and other services exclusively for its member-owners, which include supermarket retailers, food wholesalers and foodservice companies. Commencing in the fourth quarter of fiscal 2016, we will begin transitioning to Topco as our primary supplier for our Springfield premium brand and our value-oriented Special Value products. In addition, Topco will serve as our sole-source supplier for general merchandise and health and beauty care products under its TopCare label.
Early Extinguishment of Debt. As discussed in “Management’s Discussion and Analysis of Financial Condition and Results of Operations—Credit Facilities” and “—Outstanding Debt and Other Financing Arrangements,” for the year ended October 3, 2015, we refinanced our revolving credit facility and also prepaid our senior secured notes. We recorded a loss on early extinguishment of debt in connection with the prepayment of our higher senior secured notes. This refinancing will position us for lower future interest payments.
Impact of Economic and Competitive Environment. We were impacted by the weak economic environment that continues to persist in some of our operating markets during fiscal 2016, including price volatility associated with the costs of certain commodities, ingredients used in our manufactured products, and packaged goods purchased from suppliers. See Part I, Item 1, “Business—Industry Overview and the Company’s Operating Environment—Economic Factors,” for a discussion of how we are impacted by changes in overall economic conditions. We were also impacted by the continued highly competitive nature of the grocery industry, including the typically high volume and low profit margins and trends towards both vertical and horizontal integration, an increasing number of competitive format grocery stores that are adding square footage devoted to food and non-food products (including warehouse club stores, supercenters, discount stores and other alternate format stores) and mergers and acquisitions among competing organizations. See Part I, Item 1, “Business—Industry Overview and the Company’s Operating Environment—Competition,” for a discussion of the highly competitive nature of the grocery industry.
42
Table of Contents
Results of Operations
Overview. The following table sets forth our selected consolidated financial data expressed as a percentage of net sales for the periods indicated below and the percentage dollar increase (decrease) of such items from period to period:
| Percentage Dollar Increase (Decrease) |
||||||||||||||||||||
| Fiscal Year Ended | October 3, 2015 |
September 27, 2014 |
September 28, 2013 |
FY’13 to FY’14 |
FY’14 to FY’15 |
|||||||||||||||
| Net sales |
100.0 | % | 100.0 | % | 100.0 | % | 2.2 | % | 7.3 | % | ||||||||||
| Cost of sales |
93.0 | 92.4 | 92.1 | 2.5 | 8.0 | |||||||||||||||
| Distribution, selling and administrative expenses |
7.0 | 7.0 | 7.6 | (4.4 | ) | 6.2 | ||||||||||||||
|
|
||||||||||||||||||||
| Operating income |
0.0 | 0.6 | 0.3 | 77.6 | (91.6 | ) | ||||||||||||||
| Interest expense |
(0.2 | ) | (0.3 | ) | (0.3 | ) | (12.4 | ) | (10.9 | ) | ||||||||||
| Loss on early extinguishment of debt |
(0.1 | ) | — | (0.3 | ) | (100.0 | ) | * | ||||||||||||
| Patronage dividends |
(0.2 | ) | (0.3 | ) | (0.3 | ) | (2.2 | ) | (23.0 | ) | ||||||||||
| Income taxes |
0.1 | — | 0.2 | (120.1 | ) | (362.0 | ) | |||||||||||||
| Net loss on discontinued operations |
(0.2 | ) | (0.1 | ) | (0.1 | ) | (3.5 | ) | 38.0 | |||||||||||
|
|
||||||||||||||||||||
| Net (loss) earnings |
(0.6 | )% | (0.1 | )% | (0.5 | )% | (69.4 | )% | 298.1 | % | ||||||||||
|
|
||||||||||||||||||||
| * | % change not meaningful |
Fiscal 2015 Compared to Fiscal 2014. The following summarizes our results of operations for fiscal year 2015:
| · | Net sales increased $274.1 million, or 7.3%, to $4.028 billion for fiscal 2015, as compared to $3.754 billion for fiscal 2014, primarily due to the addition of new customers, the Haggen store conversions, the additional 53rd week of sales in fiscal 2015, the new Raley’s business, and commodity price inflation in perishables during the first half of the fiscal year, which were partially offset by the loss of sales due to store closures by existing customers. |
| · | Cost of sales increased $277.4 million, or 8.0%, to $3.744 billion for fiscal 2015, as compared to $3.467 billion for fiscal 2014. As a percentage of Wholesale Distribution net sales, cost of sales increased 0.6% to 93.0% in 2015 from 92.4% in 2014, primarily due to a shift in sales mix towards sales to large customers that tend to have reduced margins as a result of their higher purchase volume and a shift in product mix from non-perishable products to perishable products that tend to have reduced margins. |
| · | Distribution, selling and administrative expenses increased $16.5 million, or 6.2%, to $281.5 million for fiscal 2015, as compared to $265.0 million for fiscal 2014, primarily due to costs related to the new Haggen business and expenses incurred relative to the Audit Committee Investigation, partially offset by general reductions in other expenses. |
| · | Interest expense decreased $1.2 million to $10.0 million in fiscal 2015, as compared to $11.2 million in fiscal 2014, primarily due to a decrease in our effective borrowing rate on our revolving line of credit and the replacement of our remaining senior secured notes with variable rate term debt, partially offset by higher outstanding debt used to fund debt extinguishment costs and increases in net working capital in support of our growth. |
| · | Our consolidated operating income decreased $19.9 million to $1.8 million in fiscal 2015, as compared to $21.7 million in fiscal 2014, primarily due to the reduction in margins and the increase in operating expenses. |
| · | Our net loss from continuing operations for fiscal 2015 was $14.6 million, as compared to a net loss from continuing operations of $0.4 million for fiscal 2014, an increase of $14.2 million. |
| · | We incurred a net loss of $6.9 million from discontinued operations in fiscal 2015, comprised of the net operating loss of our former Insurance segment of $3.7 million in addition to a loss on the sale of the Insurance segment of $3.2 million, which includes $1.9 million of costs primarily related to the Audit Committee Investigation and to the preparation and consummation of the sale of the Insurance segment. |
43
Table of Contents
| · | Patronage dividends for fiscal 2015 were $7.2 million, as compared to $9.4 million in fiscal 2014, a decrease of 23.0%. Patronage dividends for fiscal 2015 and 2014 consisted of, respectively, patronage earnings of $6.4 million and $8.5 million in the Southern California Dairy Division and $0.8 million and $0.9 million in the Pacific Northwest Dairy Division, and a $14.8 million loss and a $4.7 million loss in the Cooperative Division. In July 2016, we will cease operating our Southern California Dairy Division manufacturing facility but will continue offering fluid milk and other products, including our private label brands, to our Members and customers through a vendor direct arrangement with Dean Foods Company. Coincident with this change, we will no longer pay patronage dividends on sales of products from both the Southern California Dairy Division and Pacific Northwest Dairy Division. |
Fiscal 2014 Compared to Fiscal 2013. The following summarizes our results of operations for fiscal year 2014:
| · | Net sales increased $81.1 million, or 2.2%, to $3.754 billion for fiscal 2014, as compared to $3.672 billion for fiscal 2013, primarily due to the addition of new customers and commodity price inflation in perishables during the first half of the fiscal year, which were partially offset by the loss of sales due to store closures by existing customers. |
| · | Cost of sales increased $83.7 million, or 2.5%, to $3.467 billion for fiscal 2014, as compared to $3.383 billion for fiscal 2013. As a percentage of Wholesale Distribution net sales, cost of sales increased 0.2% to 92.4% in 2014 from 92.2 % in 2013, primarily due to a shift in sales mix towards sales to large customers that tend to have reduced margins as a result of their higher purchase volume and a shift in product mix from non-perishable products to perishable products that tend to have reduced margins. |
| · | Distribution, selling and administrative expenses decreased $12.1 million, or 4.4%, to $265.0 million for fiscal 2014, as compared to $277.1 million for fiscal 2013, primarily due to a decline in employee pension and postretirement benefit expenses and decreased consulting expense, partially offset by an increase in lease reserves and equipment disposal expense related to facilities and equipment. |
| · | Interest expense decreased $1.5 million to $11.3 million in fiscal 2014, as compared to $12.8 million in fiscal 2013, primarily due to a decrease in our effective borrowing rate on our revolving line of credit and the replacement of a portion of our senior secured notes with variable rate term debt, partially offset by higher outstanding debt used to fund debt extinguishment costs and increases in net working capital in support of our growth. |
| · | Our consolidated operating income increased $9.5 million to $21.7 million in fiscal 2014, as compared to $12.2 million in fiscal 2013, primarily due to the decrease in operating expenses. |
| · | Our net loss from continuing operations for fiscal 2014 was $0.4 million, as compared to a net loss from continuing operations of $12.5 million for fiscal 2013, a decrease of $12.1 million. |
| · | We incurred a net loss of $5.0 million from discontinued operations in fiscal 2014, which was comprised of the net operating loss of our former Insurance segment. |
| · | Patronage dividends for fiscal 2014 were $9.4 million, as compared to $9.6 million in fiscal 2013, a decrease of 2.2%. Patronage dividends for fiscal 2014 and 2013 consisted of, respectively, patronage earnings of $8.5 million and $8.6 million in the Southern California Dairy Division and $0.9 million and $1.0 million in the Pacific Northwest Dairy Division, and a $4.7 million loss and an $11.3 million loss in the Cooperative Division. |
The accompanying “Management’s Discussion and Analysis of Financial Condition and Results of Operations” provides an annual comparison for the previously unreported consolidated financial statements for the years ended October 3, 2015 and September 27, 2014. In addition, an annual comparison of the previously unreported consolidated financial statements for the year ended September 27, 2014 and the previously reported consolidated financial statements for the year ended September 28, 2013 is presented. Each of these years has been re-cast to give effect to our held-for-sale discontinued Insurance operations. For additional information and a detailed discussion of the held-for-sale discontinued operations, see Note 3, “Assets Held For Sale/Discontinued Operations” to the Notes to Consolidated Financial Statements included in this Annual Report under the caption Item 8, “Financial Statements and Supplementary Data.”
44
Table of Contents
The accompanying “Management’s Discussion and Analysis of Financial Condition and Results of Operations” also presents the previously unreported consolidated condensed financial statements for the quarterly and year to date periods ended December 27, 2014, March 28, 2015 and June 27, 2015 and the quarterly period ended October 3, 2015. Each of these quarters, and the quarterly and year to date comparable periods for the prior year, has been re-cast to give effect to our held-for-sale discontinued Insurance operations. For additional information and presentation of our re-cast quarterly consolidated condensed financial statements, see Note 22, “Quarterly Financial Information (Unaudited)” to the Notes to Consolidated Financial Statements included in this Annual Report under the caption Item 8, “Financial Statements and Supplementary Data.”
Continuing Operations
Fiscal Year Ended October 3, 2015 (“2015 Period”) Compared to Fiscal Year Ended September 27, 2014 (“2014 Period”)
The following tables summarize the performance of each business segment for the 2015 and 2014 Periods.
Wholesale Distribution Segment
| (dollars in thousands) | ||||||||||||
| 2015 | 2014 | Difference | ||||||||||
| Gross billings1 |
$ | 4,143,540 | $ | 3,865,071 | $ | 278,469 | ||||||
| Less: Gross billings through vendor direct arrangements |
(117,021 | ) | (112,406 | ) | (4,615 | ) | ||||||
| Inter-segment eliminations |
— | — | — | |||||||||
|
|
||||||||||||
| Net sales |
4,026,519 | 3,752,665 | 273,854 | |||||||||
| Cost of sales |
3,744,335 | 3,466,897 | 277,438 | |||||||||
| Distribution, selling and administrative expenses |
280,829 | 264,103 | 16,726 | |||||||||
|
|
||||||||||||
| Operating income |
$ | 1,355 | $ | 21,665 | $ | (20,310 | ) | |||||
|
|
||||||||||||
All Other
| (dollars in thousands) | ||||||||||||
| 2015 | 2014 | Difference | ||||||||||
| Gross sales |
$ | 1,544 | $ | 1,119 | $ | 425 | ||||||
| Inter-segment eliminations |
(443 | ) | (224 | ) | (219 | ) | ||||||
|
|
||||||||||||
| Net sales |
1,101 | 895 | 206 | |||||||||
| Selling and administrative expenses |
640 | 885 | (245 | ) | ||||||||
|
|
||||||||||||
| Operating income |
$ | 461 | $ | 10 | $ | 451 | ||||||
|
|
||||||||||||
| 1 | We present sales and cost of sales related to certain transactions involving vendor direct arrangements on a net basis to conform to ASC 605-45-45. Transactions involving vendor direct arrangements are comprised principally of sales of produce in the Pacific Northwest and Northern California and sales of branded ice cream in Southern California. Gross billings through vendor direct arrangements increased as a percentage of our total gross billings due to our produce business with independent retail customers in the Pacific Northwest having shifted in July 2013 from direct sales by Unified to sales through vendor direct arrangements. Our consolidated “Gross billings,” a financial metric that adds back gross billings through vendor direct arrangements to net sales and is used by management to assess our operating performance, were $4.145 billion for the 2015 Period as compared to $3.866 billion in the 2014 Period, an increase of $278.7 million, or 7.2%. By comparison, consolidated net sales (which do not include gross billings through vendor direct arrangements) increased 7.3% for the same periods. See Footnote (c) to the table in Item 6, “Selected Financial Data” for further discussion regarding this financial metric and its reconciliation to net sales. |
45
Table of Contents
Net sales. Consolidated net sales increased $274.1 million, or 7.3%, to $4.028 billion in the 2015 Period compared to $3.754 billion for the 2014 Period. Factors impacting net sales are as follows:
| · | Wholesale Distribution Segment: Wholesale Distribution gross billings increased $278.5 million, or 7.2%, to $4.144 billion in the 2015 Period compared to $3.865 billion for the 2014 Period. The table below illustrates the key changes in gross billings from the 2014 Period to the 2015 Period: |
| (dollars in millions) | ||||
| Key Gross Billings Changes | Increase (Decrease) | |||
| New customers |
$ | 23.9 | ||
| Increase in gross billings to continuing customers |
202.8 | |||
| Increase in gross billings due to 53rd week in fiscal 2015 |
75.9 | |||
| Store closures |
(24.1 | ) | ||
|
|
||||
| Change in gross billings |
$ | 278.5 | ||
|
|
||||
We increased gross billings through the addition of new customers and higher sales to continuing customers (including the new Haggen store conversions and Raley’s business), due in part to commodity price inflation in perishables during the first half of our fiscal year, and the additional week of sales in the 2015 Period compared to the 2014 Period, which were partially offset by the loss of sales due to store closures of existing customers. Our customer base continues to be impacted by consumers who are highly price sensitive, seek lower-cost alternatives in their grocery purchases, and have shown a willingness to shop at multiple stores for grocery products, including discounters and other non-traditional format stores. This trend continues to have an adverse impact on gross billings as well as pressuring profit margins.
| · | All Other: Net sales increased $0.2 million to $1.1 million in the 2015 Period compared to $0.9 million for the 2014 Period. |
Cost of sales. Consolidated cost of sales increased $277.4 million to $3.744 billion for the 2015 Period compared to $3.467 billion for the 2014 Period and comprised 93.0% and 92.4% of consolidated net sales for the 2015 and 2014 Periods, respectively. Factors impacting cost of sales were as follows:
| · | Wholesale Distribution Segment: Cost of sales increased by $277.4 million to $3.744 billion in the 2015 Period compared to $3.467 billion in the 2014 Period. As a percentage of Wholesale Distribution net sales, cost of sales was 93.0% and 92.4% for the 2015 and 2014 Periods, respectively. |
| · | The change in customer sales mix and change in product mix between perishable and non-perishable products resulted in a 0.6% increase in cost of sales as a percent of Wholesale Distribution net sales in the 2015 Period compared to the 2014 Period. |
| · | Vendor related activity resulted in no change in cost of sales as a percent of Wholesale Distribution net sales in the 2015 Period compared to the 2014 Period. |
Distribution, selling and administrative expenses. Consolidated distribution, selling and administrative expenses increased $16.5 million to $281.5 million for the 2015 Period compared to $265.0 million for the 2014 Period and comprised 7.0% of consolidated net sales for each of the 2015 and 2014 Periods. Factors impacting distribution, selling and administrative expenses were as follows:
| · | Wholesale Distribution Segment: Distribution, selling and administrative expenses increased $16.7 million to $280.8 million in the 2015 Period compared to $264.1 million in the 2014 Period. These expenses comprised 7.0% of Wholesale Distribution net sales for each of the 2015 and 2014 Periods. The increase in expenses was primarily due to expenses related to the new Haggen store conversions and the new Raley’s business. We incurred additional costs in preparing to support this new business in our first three fiscal quarters as the store conversion process was completed. These costs included reconfiguring our facilities to accommodate increased itemization, as well as increased staffing and outside storage expenses. We also incurred additional costs in our fourth quarter to adjust our facilities and personnel as Haggen began to exit the acquired stores. In addition, we incurred $4.2 million of expenses associated with the investigation of issues relating to the setting of case reserves and management of claims by our former insurance subsidiaries. See Part I, “Business—Audit Committee Investigation,” for additional information. These increased costs were partially offset by lower pension and postretirement benefit expenses and general improvement in other operating expenses. |
46
Table of Contents
| · | All Other: Selling and administrative expenses for our All Other business activities were $0.6 million for the 2015 Period compared to $0.9 million for the 2014 Period. |
Interest. Interest expense decreased $1.2 million to $10.0 million in the 2015 Period compared to $11.2 million in the 2014 Period and comprised 0.2% and 0.3% of consolidated net sales for the 2015 and 2014 Periods, respectively. Factors contributing to the decrease in interest expense are as follows:
| · | Interest expense on our primary debt instruments (as described below) decreased $0.8 million to $9.6 million in the 2015 Period compared to $10.4 million in the 2014 Period. |
| · | Interest Rates: Interest expense decreased $1.9 million from the 2014 Period as a result of lower borrowing rates. Our effective borrowing rate for the combined primary debt, made up of the revolving lines of credit for Unified and Grocers Capital Company (“GCC”), the term loan and senior secured notes, was 3.1% and 3.7% for the 2015 and 2014 Periods, respectively. The rate decrease was due to lower effective rates on Unified’s revolving line of credit and the debt refinancing in December 2014, which replaced the remaining senior secured notes with variable rate term debt. |
| · | Weighted Average Borrowings: Interest expense increased $1.1 million in the 2015 Period from the 2014 Period as a result of higher outstanding debt. Weighted average borrowings increased by $29.8 million primarily due to amounts used to fund debt extinguishment costs and increases in net working capital in support of our growth during the 2015 Period. |
Borrowings under Unified’s credit agreement are subject to market rate fluctuations. A 25 basis point change in the market rate of interest over the 2015 Period would have resulted in a $0.7 million increase or decrease in corresponding interest expense.
| · | Interest expense on all our other outstanding debt instruments was $0.4 and $0.8 million in the 2015 and 2014 Periods, respectively. |
Loss on early extinguishment of debt. As discussed in “Credit Facilities” and “Outstanding Debt and Other Financing Arrangements,” for the year ended October 3, 2015, we incurred a Make-Whole Amount of $3.0 million in conjunction with the prepayment of $48.5 million of our senior secured notes pursuant to our Amended and Restated Note Purchase Agreement dated as of January 3, 2006, as amended, with the then-current noteholders and John Hancock Life Insurance Company (U.S.A.), acting in its capacity as collateral agent for the then-current noteholders. As a result of the prepayment of the senior secured notes, we recorded a loss on early debt extinguishment of $3.2 million during the first quarter of fiscal year 2015. This amount is comprised of the $3.0 million Make-Whole Amount plus the write-off of unamortized fees associated with the prepayment of the senior secured notes of $0.2 million.
Patronage dividends. Patronage dividends for the 2015 Period were $7.2 million, compared to $9.4 million in the 2014 Period, a decrease of 23.4%. Patronage dividends for the 2015 and 2014 Periods consisted of patronage earnings from the Southern California Dairy Division and the Pacific Northwest Dairy Division. For the 2015 and 2014 Periods, respectively, we had patronage earnings of $6.4 million and $8.5 million in the Southern California Dairy Division, $0.8 million and $0.9 million in the Pacific Northwest Dairy Division, and a $14.8 million loss for the 2015 Period compared to a $4.7 million loss for the 2014 Period in the Cooperative Division. The loss in the Cooperative Division increased in the 2015 Period due to reduced margins in both the perishable and non-perishable product lines as we continued to experience a shift in sales mix towards sales to large customers that tend to have reduced margins resulting from their higher purchase volume. In addition, we incurred higher operating expenses to accommodate the additional business from Haggen and Raley’s (including additional costs in our fourth quarter to adjust our facilities and personnel as Haggen began to exit the acquired stores), as well as additional expenses associated with the Audit Committee Investigation and non-recurring expenses in the 2015 Period related to early debt extinguishment.
Income taxes. Income taxes reflected a combined $4.0 million benefit for the 2015 Period compared to a $1.5 million provision for the 2014 Period. Our effective income tax rate was 21.2% for the 2015 Period compared to 139.2% for the 2014 Period. The lower than statutory rate for the 2015 Period was due to the recording of a valuation allowance which reduced the overall deferred tax assets and partially offset the tax benefit for the 2015 Period. The higher than statutory rate for the 2014 period was due to recording a valuation allowance to reduce state credits and the overall deferred tax assets which increased the provision for the 2014 Period. The Company
47
Table of Contents
recorded valuation allowances to reduce its deferred tax assets to a level that can be sustained by future carryback claims and tax planning.
Other Comprehensive (Loss) Earnings, Net of Income Taxes (“OCI”). Our OCI net loss was $38.2 million in the 2015 Period compared to a net loss of $21.8 million in the 2014 Period (see Note 19 to “Notes to Consolidated Financial Statements” in Part II, Item 8, “Financial Statements and Supplementary Data”). OCI is excluded from the calculation of Exchange Value Per Share (see Note 12 to “Notes to Consolidated Financial Statements” in Part II, Item 8, “Financial Statements and Supplementary Data”).
| · | Unrealized Net Holding (Loss) Gain on Investments: Our investments were primarily comprised of mutual funds supporting our Executive Salary Protection Plan III and Deferred Compensation Plan II benefit plans. We experienced an unrealized loss of $0.7 million in the 2015 Period compared to an unrealized loss of $0.4 million in the 2014 Period. |
| · | Defined Benefit Pension Plans and Other Postretirement Benefit Plans: This component of OCI primarily represents the non-cash amount to record the ultimate future liability for pension obligations net of the value of our pension fund assets pursuant to ASC Topic 715-20, “Compensation—Retirement Benefits—Defined Benefits Plans—General.” We experienced a $24.1 million loss in the 2015 Period compared to a $15.2 million loss in the 2014 Period, due primarily to changes in demographic experience, including assumption changes, and investment returns on plan assets that were lower than assumed. For the fiscal year end 2015 valuation, we changed our mortality assumption subsequent to the release of two mortality reports issued by the Society of Actuaries’ Retirement Plans Experience Committee. These factors caused our funded position to deteriorate. Partially offsetting these factors was an increase in interest rates used to discount the liabilities for pension and other postretirement benefits. In addition, $13.4 million and $6.2 million, respectively, of our 2015 Period and 2014 Period tax valuation allowances associated with our defined benefit pension plans and other postretirement benefit plans as well as certain other deferred tax assets has been allocated to other comprehensive income as prescribed by ASC 740, “Income Taxes.” See Note 10 “Income Taxes”, Note 13 “Benefit Plans” and Note 14 “Postretirement Benefit Plans Other Than Pensions” of Notes to Consolidated Financial Statements in Part II, Item 8, “Financial Statements and Supplementary Data” for more information. |
Fiscal Year Ended September 27, 2014 (“2014 Period”) Compared to Fiscal Year Ended September 28, 2013 (“2013 Period”)
The following tables summarize the performance of each business segment for the 2014 and 2013 Periods.
Wholesale Distribution Segment
| (dollars in thousands) | ||||||||||||
| 2014 | 2013 | Difference | ||||||||||
| Gross billings |
$ | 3,865,071 | $ | 3,722,387 | $ | 142,684 | ||||||
| Less: Gross billings through vendor direct arrangements |
(112,406 | ) | (51,142 | ) | (61,264 | ) | ||||||
| Inter-segment eliminations |
— | — | — | |||||||||
|
|
||||||||||||
| Net sales |
3,752,665 | 3,671,245 | 81,420 | |||||||||
| Cost of sales |
3,466,897 | 3,383,190 | 83,707 | |||||||||
| Distribution, selling and administrative expenses |
264,103 | 276,294 | (12,191 | ) | ||||||||
|
|
||||||||||||
| Operating income |
$ | 21,665 | $ | 11,761 | $ | 9,904 | ||||||
|
|
||||||||||||
48
Table of Contents
All Other
| (dollars in thousands) | ||||||||||||
| 2014 | 2013 | Difference | ||||||||||
| Gross sales |
$ | 1,119 | $ | 1,356 | $ | (237 | ) | |||||
| Inter-segment eliminations |
(224 | ) | (142 | ) | (82 | ) | ||||||
|
|
||||||||||||
| Net sales |
895 | 1,214 | (319 | ) | ||||||||
| Selling and administrative expenses |
885 | 769 | 116 | |||||||||
|
|
||||||||||||
| Operating income |
$ | 10 | $ | 445 | $ | (435 | ) | |||||
|
|
||||||||||||
Net sales. Consolidated net sales increased $81.1 million, or 2.2%, to $3.754 billion in the 2014 Period compared to $3.672 billion for the 2013 Period. Factors impacting net sales are as follows:
| · | Wholesale Distribution Segment: Wholesale Distribution gross billings increased $142.7 million, or 3.8%, to $3.865 billion in the 2014 Period compared to $3.722 billion for the 2013 Period. The table below illustrates the key changes in gross billings from the 2013 Period to the 2014 Period: |
| (dollars in millions) | ||||
| Key Gross Billings Changes | Increase (Decrease) | |||
| New customers |
$ | 24.7 | ||
| Increase in gross billings to continuing customers |
198.3 | |||
| Lost customers (former customers currently serviced by competitors) |
(13.6 | ) | ||
| Store closures |
(66.7 | ) | ||
|
|
||||
| Change in gross billings |
$ | 142.7 | ||
|
|
||||
Our customer base continues to be impacted by consumers who are highly price sensitive, seek lower-cost alternatives in their grocery purchases, and have shown a willingness to shop at multiple stores for grocery products, including discounters and other non-traditional format stores. Although we increased sales through the addition of new customers and higher sales to continuing customers, this trend continues to have an adverse impact on gross billings as well as pressuring profit margins.
| · | All Other: Net sales decreased $0.3 million to $0.9 million in the 2014 Period compared to $1.2 million for the 2013 Period. |
Cost of sales. Consolidated cost of sales increased $83.7 million to $3.467 billion for the 2014 Period compared to $3.383 billion for the 2013 Period and comprised 92.4% and 92.1% of consolidated net sales for the 2014 and 2013 Periods, respectively. Factors impacting cost of sales were as follows:
| · | Wholesale Distribution Segment: Cost of sales increased by $83.7 million to $3.467 billion in the 2014 Period compared to $3.383 billion in the 2013 Period. As a percentage of Wholesale Distribution net sales, cost of sales was 92.4% and 92.2% for the 2014 and 2013 Periods, respectively. |
| · | The change in customer sales mix and change in product mix between perishable and non-perishable products resulted in a 0.3% increase in cost of sales as a percent of Wholesale Distribution net sales in the 2014 Period compared to the 2013 Period. |
| · | Vendor related activity contributed to a 0.1% decrease in cost of sales as a percent of Wholesale Distribution net sales in the 2014 Period compared to the 2013 Period. This change was primarily driven by an increase in inventory holding gains (realized upon sale) resulting from vendor price increases partially offset by a change in sales mix towards products with reduced or no vendor promotional funding support. |
49
Table of Contents
Distribution, selling and administrative expenses. Consolidated distribution, selling and administrative expenses decreased $12.1 million to $265.0 million for the 2014 Period compared to $277.1 million for the 2013 Period and comprised 7.1% and 7.5% of consolidated net sales for the 2014 and 2013 Periods, respectively. Factors impacting distribution, selling and administrative expenses were as follows:
| · | Wholesale Distribution Segment: Distribution, selling and administrative expenses decreased $12.2 million to $264.1 million in the 2014 Period compared to $276.3 million in the 2013 Period. These expenses comprised 7.0% and 7.5% of Wholesale Distribution net sales for the 2014 and 2013 Periods, respectively. Factors impacting distribution, selling and administrative expenses are as follows: |
| · | Employee Pension and Postretirement Benefits: During the 2014 Period, we experienced a decline of $8.7 million, or 0.2% as a percent of Wholesale Distribution net sales, in employee pension and postretirement benefit expenses, primarily due to expense reductions resulting from the amendment of several of our employee benefit plans in fiscal 2013 and the termination of our non-union sick leave postretirement benefit plan in fiscal 2014, as well as an increase in interest rates used to discount our benefit plan liabilities at September 30, 2013. See Note 13 of “Notes to Consolidated Financial Statements” in Part II, Item 8. “Financial Statements and Supplementary Data” of this Annual Report on Form 10-K for additional discussion. |
| · | Consulting Expense: During the 2014 Period, we experienced a decline in consulting expense of $1.6 million, or 0.1% as a percent of Wholesale Distribution net sales. This decrease in expense is primarily due to lower consulting services utilized during the period. |
| · | Lease Reserves and Equipment Disposal Expenses: During the 2013 Period, we recorded $2.0 million, or 0.1% as a percent of Wholesale Distribution net sales, for lease reserves and equipment disposal costs related to facilities and equipment. There were no comparable reserves recorded or disposal costs incurred during the 2014 Period. |
| · | General Expenses: During the 2014 Period, general expenses increased $0.1 million, but decreased 0.1% as a percent of Wholesale Distribution net sales due to the leveraging effect of increased sales. Expenses related to employee incentive plans increased in the current period, but were partially offset by the benefit in the 2014 Period of reduced expenses resulting from a consolidation of warehouses in the 2013 Period, as well as a continued focus on cost reductions in the current period. The 2013 Period had been negatively impacted by the costs of the consolidation. |
| · | All Other: Selling and administrative expenses for our All Other business activities were $0.9 million for the 2014 Period compared to $0.7 million for the 2013 Period. |
Interest. Interest expense decreased $1.5 million to $11.3 million in the 2014 Period compared to $12.8 million in the 2013 Period and comprised 0.3% of consolidated net sales for both the 2014 and 2013 Periods. Factors contributing to the decrease in interest expense are as follows:
| · | Interest expense on our primary debt instruments (as described below) decreased $1.5 million to $10.4 million in the 2014 Period compared to $11.9 million in the 2013 Period. |
| · | Interest Rates: Interest expense decreased $3.1 million from the 2013 Period as a result of lower borrowing rates. Our effective borrowing rate for the combined primary debt, made up of the revolving lines of credit for Unified and Grocers Capital Company (“GCC”), the term loan and senior secured notes, was 3.7% and 4.8% for the 2014 and 2013 Periods, respectively. The rate decrease was due to lower effective rates on Unified’s revolving line of credit and the term loan which replaced portions of the senior secured notes. |
| · | Weighted Average Borrowings: Interest expense increased by $1.6 million from the 2013 Period as a result of higher outstanding debt. Weighted average borrowings increased by $33.0 million primarily due to amounts used to fund debt extinguishment costs and increased inventory levels in support of our growth during the 2014 Period. |
Borrowings under Unified’s credit agreement are subject to market rate fluctuations. A 25 basis point change in the market rate of interest over the 2014 Period would result in a $0.1 million increase or decrease in corresponding interest expense.
| · | Interest expense on all our other outstanding debt instruments was $0.9 million in both the 2014 and 2013 Periods. |
50
Table of Contents
Loss on early extinguishment of debt. As discussed in “Outstanding Debt and Other Financing Arrangements,” for the year ended September 28, 2013, we incurred a Make-Whole Amount of $9.4 million in conjunction with the prepayment of $50 million of Senior Secured Notes held by the Noteholders and John Hancock, acting in its capacity as collateral agent for the Noteholders. As a result of the partial prepayment of the Senior Secured Notes, we recorded a loss on early debt extinguishment of $9.8 million during the third quarter of fiscal year 2013. This amount was comprised of the $9.4 million Make-Whole Amount plus a pro-rata portion (percentage of early debt prepayment to total debt) of (1) the write-off of unamortized fees associated with the prepayment of the Senior Secured Notes ($0.2 million) and (2) new fees of $0.2 million related to amending the note agreement between the Company, the Noteholders and John Hancock.
Patronage dividends. Patronage dividends for the 2014 Period were $9.4 million, compared to $9.6 million in the 2013 Period, a decrease of 2.2%. Patronage dividends for the 2014 and 2013 Periods consisted of patronage earnings from the Southern California Dairy Division and the Pacific Northwest Dairy Division. For the 2014 and 2013 Periods, respectively, we had patronage earnings of $8.5 million and $8.6 million in the Southern California Dairy Division, $0.9 million and $1.0 million in the Pacific Northwest Dairy Division, and a $4.7 million loss for the 2014 Period compared to an $11.3 million loss for the 2013 Period in the Cooperative Division. Although the 2014 Period had no Cooperative Division patronage earnings, the Cooperative Division experienced improvement in the 2014 Period due to higher net sales, lower employee pension and postretirement benefit expenses and reduced operating expenses, partially offset by a change in sales mix towards perishable products that tend to have lower margins than our other products, as well as non-recurring expenses in the 2013 Period related to early debt extinguishment and transition costs resulting from the consolidation of our Fresno dry warehouse facility into our facilities in Southern and Northern California that also occurred in the 2013 Period.
Income taxes. Income taxes reflected a $1.5 million provision for the 2014 Period compared to a $7.5 million benefit for the 2013 Period. Our effective income tax rate was 139.2% for the 2014 Period compared to 37.5% for the 2013 Period. The higher than statutory rate for the 2014 Period was due to recording a valuation allowance to reduce state credits and the overall deferred tax assets that can be sustained by future carryback claims and tax planning. The rate for the 2013 Period approximates our statutory rate due to offsetting tax adjustments.
Other Comprehensive (Loss) Earnings, Net of Income Taxes (“OCI”). Our OCI net loss was $21.8 million in the 2014 Period compared to a net gain of $47.9 million in the 2013 Period (see Note 19 to “Notes to Consolidated Financial Statements” in Part II, Item 8, “Financial Statements and Supplementary Data”). OCI is excluded from the calculation of Exchange Value Per Share (see Note 12 to “Notes to Consolidated Financial Statements” in Part II, Item 8, “Financial Statements and Supplementary Data”).
| · | Unrealized Net Holding (Loss) Gain on Investments: Our investments were primarily made up of bonds in our former Insurance segment portfolio. We experienced an unrealized loss of $0.4 million in the 2014 Period compared to an unrealized loss of $1.1 million in the 2013 Period. |
| · | Defined Benefit Pension Plans and Other Postretirement Benefit Plans: This component of OCI primarily represents the non-cash amount to record the ultimate future liability for pension obligations net of the value of our pension fund assets pursuant to ASC Topic 715-20, “Compensation—Retirement Benefits—Defined Benefits Plans—General.” We experienced a $15.2 million loss in the 2014 Period compared to a $49.0 million gain in the 2013 Period, due primarily to a decrease in interest rates used to discount the liabilities for pension and other postretirement benefits. In addition, $6.2 million of our 2014 Period tax valuation allowance associated with our defined benefit pension plans and other postretirement benefit plans has been allocated to other comprehensive income as prescribed by ASC 740, “Income Taxes.” See Note 10 “Income Taxes”, Note 13 “Benefit Plans” and Note 14 “Postretirement Benefit Plans Other Than Pensions” of Notes to Consolidated Financial Statements in Part II, Item 8, “Financial Statements and Supplementary Data” for more information. |
Discontinued Insurance Operations
In July 2014, our management and Board made a strategic determination to focus the Company’s efforts on our core grocery business operations in order to better serve Unified’s Members and customers. In conjunction with this decision, our management and Board determined that our insurance operations represented a significant non-core portion of our business, and accordingly began discussions with a previously unsolicited potential buyer to sell our Insurance segment. Subsequently, we completed the sale of our insurance operations on October 7, 2015. See
51
Table of Contents
Note 3, “Assets Held For Sale/Discontinued Operations” in Part II, Item 8, “Financial Statements and Supplementary Data” for additional information.
| (dollars in thousands) | ||||||||||||
| 2015 | 2014 | Difference | ||||||||||
| Net sales—premiums earned and investment income |
$ | 12,151 | $ | 17,178 | $ | (5,027 | ) | |||||
| Cost of sales (including underwriting expenses) |
9,117 | 18,152 | (9,035 | ) | ||||||||
| Selling and administrative expenses |
6,649 | 6,831 | (182 | ) | ||||||||
|
|
||||||||||||
| Operating loss |
$ | (3,615 | ) | $ | (7,805 | ) | $ | 4,190 | ||||
|
|
||||||||||||
| (dollars in thousands) | ||||||||||||
| 2014 | 2013 | Difference | ||||||||||
| Net sales—premiums earned and investment income |
$ | 17,178 | $ | 19,105 | $ | (1,927 | ) | |||||
| Cost of sales (including underwriting expenses) |
18,152 | 19,850 | (1,698 | ) | ||||||||
| Selling and administrative expenses |
6,831 | 6,987 | (156 | ) | ||||||||
|
|
||||||||||||
| Operating loss |
$ | (7,805 | ) | $ | (7,732 | ) | $ | (73 | ) | |||
|
|
||||||||||||
Fiscal Year Ended October 3, 2015 (“2015 Period”) Compared to Fiscal Year Ended September 27, 2014 (“2014 Period”)
Net sales. Net sales, consisting principally of premium revenues and investment income, decreased $5.0 million to $12.2 million in the 2015 Period compared to $17.2 million in the 2014 Period. The decrease is primarily due to a decrease in workers’ compensation premium revenue, resulting from a decline in workers’ compensation policies written partially offset by an increase in renewal premiums. The decrease in premium revenue was partially offset by an increase in investment income.
Cost of sales (including underwriting expenses). Cost of sales primarily consists of claims loss and loss adjustment expenses, underwriting expenses, commissions, premium taxes and regulatory fees. Cost of sales decreased $9.0 million to $9.1 million in the 2015 Period compared to $18.1 million in the 2014 Period. This reduction is primarily due to $8.3 million of loss reserve adjustments in the 2014 Period that did not recur in the 2015 Period. These adjustments occurred due to a combination of adverse development and case reserving practices and related accounting within the former insurance subsidiaries that deviated from the established policy of setting case reserves at the best estimate of ultimate cost. Historically, the cost of insurance and the adequacy of loss reserves have been impacted by actuarial estimates based on a detailed analysis of health care cost trends, claims history, demographics and industry trends. See Explanatory Note in Part I, Item 1, “Business” for further discussion regarding the setting of case reserves and management of claims by our former insurance subsidiaries and related matters pertaining to the Audit Committee Investigation. See Note 2, “Audit Committee Investigation,” in Item 8, “Financial Statements and Supplementary Data,” for discussion of the impact of case reserving practices that led to errors in the historical financial statements.
Distribution, selling and administrative expenses. Selling and administrative expenses for the Insurance segment decreased $0.2 million to $6.6 million for the 2015 Period compared to $6.8 million for the 2014 Period.
Fiscal Year Ended September 27, 2014 (“2014 Period”) Compared to Fiscal Year Ended September 28, 2013 (“2013 Period”)
Net sales. Net sales, consisting principally of premium revenues and investment income, decreased $1.9 million to $17.2 million in the 2014 Period compared to $19.1 million in the 2013 Period. The decrease is primarily due to a decrease in workers’ compensation premium revenue, resulting from a decline in workers’ compensation policies written partially offset by an increase in renewal premiums. The decrease in premium revenue was partially offset by an increase in investment income.
Cost of sales (including underwriting expenses). Cost of sales primarily consists of claims loss and loss adjustment expenses, underwriting expenses, commissions, premium taxes and regulatory fees. Cost of sales
52
Table of Contents
decreased $1.7 million to $18.1 million in the 2014 Period compared to $19.8 million in the 2013 Period. We experienced decreases in incurred losses and variable underwriting expenses resulting from the decrease in premiums earned. These decreases were partially offset by an increase in loss reserve adjustments for workers’ compensation policies of $10.0 million and $9.1 million for the 2014 and 2013 Periods, respectively. These adjustments occurred due to a combination of adverse development and case reserving practices and related accounting within the former insurance subsidiaries that deviated from the established policy of setting case reserves at the best estimate of ultimate cost. Historically, the cost of insurance and the adequacy of loss reserves have been impacted by actuarial estimates based on a detailed analysis of health care cost trends, claims history, demographics and industry trends. See Explanatory Note in Part I, Item 1, “Business” for further discussion regarding the setting of case reserves and management of claims by our former insurance subsidiaries and related matters pertaining to the Audit Committee Investigation.
Distribution, selling and administrative expenses. Selling and administrative expenses for the Insurance segment decreased $0.2 million to $6.8 million for the 2014 Period compared to $7.0 million for the 2013 Period.
Quarterly Discussion and Analysis
Selected Quarterly Financial Data
The following table sets forth selected financial data for each of the periods indicated. Amounts are computed independently each quarter and, therefore, the sum of the quarterly amounts may not equal the total amount for the respective year due to rounding.
| Fiscal Quarters Ended | Percentage Increase/(Decrease) | |||||||||||||||||||||||||||||||||||||||||||||||
| (dollars in 000’s) |
October
3, (Q4 ) |
June
27, (Q3) |
March 28, 2015 (Q2) |
December 27, (Q1) |
September 27, (Q4) |
June 28, 2014 (Q3) |
March 29, 2014 (Q2) |
December 28, (Q1) |
Q4 Q4 |
Q3 2015 vs. Q3 2014 |
Q2 Q2 |
Q1 Q1 |
||||||||||||||||||||||||||||||||||||
| Net sales |
$ | 1,114,842 | $ | 1,038,615 | $ | 906,395 | $ | 967,768 | $ | 967,019 | $ | 947,395 | $ | 889,603 | $ | 949,543 | 15.3 | % | 9.6 | % | 1.9 | % | 1.9 | % | ||||||||||||||||||||||||
| Cost of sales |
1,037,781 | 965,638 | 842,876 | 898,040 | 895,458 | 876,222 | 818,753 | 876,464 | 15.9 | 10.2 | 2.9 | 2.5 | ||||||||||||||||||||||||||||||||||||
| Distribution, selling and administrative expenses |
77,335 | 70,710 | 68,498 | 64,926 | 67,210 | 64,992 | 68,392 | 64,394 | 15.1 | 8.8 | 0.2 | 0.8 | ||||||||||||||||||||||||||||||||||||
|
|
||||||||||||||||||||||||||||||||||||||||||||||||
| Operating (loss) income |
(274 | ) | 2,267 | (4,979 | ) | 4,802 | 4,351 | 6,181 | 2,458 | 8,685 | (106.3 | ) | (63.3 | ) | (302.6 | ) | (44.7 | ) | ||||||||||||||||||||||||||||||
| Interest expense |
(2,470 | ) | (2,477 | ) | (2,313 | ) | (2,718 | ) | (2,748 | ) | (2,847 | ) | (2,768 | ) | (2,834 | ) | (10.1 | ) | (13.0 | ) | (16.4 | ) | (4.1 | ) | ||||||||||||||||||||||||
| Loss on early extinguishment of debt |
— | — | — | (3,200 | ) | — | — | — | — | — | — | — | * | |||||||||||||||||||||||||||||||||||
| Estimated patronage dividends |
(2,742 | ) | (1,636 | ) | (1,364 | ) | (1,492 | ) | (2,014 | ) | (2,510 | ) | (2,483 | ) | (2,388 | ) | 36.1 | (34.8 | ) | (45.1 | ) | (37.5 | ) | |||||||||||||||||||||||||
| Income taxes |
4,244 | (66 | ) | (1,302 | ) | 1,075 | (1,401 | ) | (1 | ) | 955 | (1,061 | ) | (402.9 | ) | * | (236.3 | ) | 201.3 | |||||||||||||||||||||||||||||
| Net (loss) earnings from discontinued operations |
(5,945 | ) | (518 | ) | (707 | ) | 296 | (795 | ) | (4,700 | ) | 127 | 387 | 647.8 | (89.0 | ) | (656.7 | ) | (23.5 | ) | ||||||||||||||||||||||||||||
|
|
||||||||||||||||||||||||||||||||||||||||||||||||
| Net loss |
$ | (7,187 | ) | $ | (2,430 | ) | $ | (10,665 | ) | $ | (1,237 | ) | $ | (2,607 | ) | $ | (3,877 | ) | $ | (1,711 | ) | $ | 2,789 | 175.7 | % | (37.3 | )% | 523.3 | % | (144.4 | )% | |||||||||||||||||
|
|
||||||||||||||||||||||||||||||||||||||||||||||||
| * | % change not meaningful |
53
Table of Contents
Fiscal Quarter Ended October 3, 2015 (“Q4 2015”) Compared to Fiscal Quarter Ended September 27, 2014 (“Q4 2014”)
Continuing Operations
Wholesale Distribution Segment
| (dollars in thousands) | ||||||||||||||||||||
| Thirteen Weeks Ended October 3, 2015 |
Thirteen Weeks Ended September 27, 2014 |
|||||||||||||||||||
| Amounts in 000’s |
Percent to Net Sales |
Amounts in 000’s |
Percent to Net Sales |
Difference | ||||||||||||||||
| Gross billings |
$ | 1,148,459 | — | $ | 997,135 | — | $ | 151,324 | ||||||||||||
| Less: Gross billings through vendor direct arrangements |
(33,911 | ) | — | (30,372 | ) | — | (3,539 | ) | ||||||||||||
| Inter-segment eliminations |
— | — | — | — | — | |||||||||||||||
|
|
||||||||||||||||||||
| Net sales |
1,114,548 | 100.0 | % | 966,763 | 100.0 | % | 147,785 | |||||||||||||
| Cost of sales |
1,037,781 | 93.1 | 895,458 | 92.6 | 142,323 | |||||||||||||||
| Distribution, selling and administrative expenses |
77,164 | 6.9 | 67,073 | 7.0 | 10,091 | |||||||||||||||
|
|
||||||||||||||||||||
| Operating (loss) income |
$ | (397 | ) | 0.0 | % | $ | 4,232 | 0.4 | % | $ | (4,629 | ) | ||||||||
|
|
||||||||||||||||||||
All Other
| (dollars in thousands) | ||||||||||||||||||||
| Thirteen Weeks Ended October 3, 2015 |
Thirteen Weeks Ended September 27, 2014 |
|||||||||||||||||||
| Amounts in 000’s |
Percent to Net Sales |
Amounts in 000’s |
Percent to Net Sales |
Difference | ||||||||||||||||
| Gross sales |
$ | 385 | — | $ | 343 | — | $ | 42 | ||||||||||||
| Inter-segment eliminations |
(91 | ) | — | (87 | ) | — | (4 | ) | ||||||||||||
|
|
||||||||||||||||||||
| Net sales |
294 | 100.0 | % | 256 | 100.0 | % | 38 | |||||||||||||
| Selling and administrative expenses |
171 | 58.2 | 137 | 53.5 | 34 | |||||||||||||||
|
|
||||||||||||||||||||
| Operating income |
$ | 123 | 41.8 | % | $ | 119 | 46.5 | % | $ | 4 | ||||||||||
|
|
||||||||||||||||||||
Net sales. Consolidated net sales increased $147.8 million, or 15.3%, to $1.115 billion in Q4 2015 compared to $0.967 billion for Q4 2014. Factors impacting net sales are as follows:
| · | Wholesale Distribution Segment: Wholesale Distribution net sales increased $147.8 million, or 15.3% as a percent of Wholesale Distribution net sales, to $1.115 billion in Q4 2015 compared to $0.967 billion for Q4 2014. We increased net sales through the addition of new customers and higher sales to continuing customers (including the new Haggen store conversions and Raley’s business), which were partially offset by the loss of sales due to store closures of existing customers. Effective November 21, 2015, we are no longer supplying product to Haggen’s California, Arizona and Nevada stores. Accordingly, we do not expect the sales to Haggen to continue at the levels generated during the last half of fiscal 2015 or during the first quarter of fiscal 2016. Our customer base continues to be impacted by consumers who are highly price sensitive, seek lower-cost alternatives in their grocery purchases, and have shown a willingness to shop at multiple stores for grocery products, including discounters and other non-traditional format stores. This trend continues to have an adverse impact on gross billings and net sales as well as pressuring profit margins. |
| · | All Other: Net sales were $0.3 million in both Q4 2015 and Q4 2014. |
54
Table of Contents
Cost of sales. Consolidated cost of sales increased $142.3 million to $1.038 billion in Q4 2015 compared to $0.896 billion in Q4 2014 and comprised 93.1% and 92.6% of consolidated net sales for Q4 2015 and Q4 2014, respectively. Factors impacting cost of sales are as follows:
| · | Wholesale Distribution Segment: Cost of sales increased by $142.3 million to $1.038 billion in Q4 2015 compared to $0.896 billion in Q4 2014. As a percentage of Wholesale Distribution net sales, cost of sales was 93.1% and 92.6% for Q4 2015 and Q4 2014, respectively. |
| · | The change in customer sales mix and change in product mix between perishable and non-perishable products resulted in a 0.7% increase in cost of sales as a percent of Wholesale Distribution net sales in Q4 2015 compared to Q4 2014. |
| · | Vendor related activity contributed to a 0.2% decrease in cost of sales as a percent of Wholesale Distribution net sales in Q4 2015 compared to Q4 2014. The decrease was primarily driven by an increase in inventory holding gains (realized upon sale) resulting from vendor price increases partially offset by a change in sales mix towards products with reduced or no vendor promotional funding support. |
Distribution, selling and administrative expenses. Consolidated distribution, selling and administrative expenses increased $10.1 million to $77.3 million in Q4 2015 compared to $67.2 million for Q4 2014 and comprised 6.9% and 7.0% of consolidated net sales for Q4 2015 and Q4 2014, respectively. Factors impacting distribution, selling and administrative expenses are as follows:
| · | Wholesale Distribution Segment: Distribution, selling and administrative expenses increased $10.1 million to $77.2 million in Q4 2015 compared to $67.1 million in Q4 2014. These expenses comprised 6.9% and 7.0% of Wholesale Distribution net sales for Q4 2015 and Q4 2014, respectively. Factors impacting distribution, selling and administrative expenses are as follows: |
| · | General Expenses: During Q4 2015, general expenses increased $10.1 million, but decreased 0.1% as a percent of Wholesale Distribution net sales due to the leveraging effect of increased sales. The increase in general expenses was primarily due to activities related to the Haggen new business project and expenses incurred in relation to the Audit Committee Investigation, partially offset by general improvements in other expenses. |
| · | All Other: Selling and administrative expenses for our All Other business activities were $0.1 million for Q4 2015 compared to $0.1 million for Q4 2014. |
Interest. Interest expense decreased $0.3 million to $2.5 million in Q4 2015 compared to $2.8 million in Q4 2014 and comprised 0.2% and 0.3% of consolidated net sales for Q4 2015 and Q4 2014, respectively. Factors contributing to the decrease in interest expense are as follows:
| · | Interest expense on our primary debt instruments (as described below) decreased $0.2 million to $2.4 million in Q4 2015 compared to $2.6 million in Q4 2014. |
| · | Interest Rates: Interest expense decreased $0.7 million from Q4 2014 as a result of lower borrowing rates. Our effective borrowing rate for the combined primary debt, made up of the revolving lines of credit for Unified and GCC, the term loan and senior secured notes (Q4 2014 only), was 3.0% and 3.8% for Q4 2015 and Q4 2014, respectively. The rate decrease was due to lower effective rates on Unified’s revolving line of credit and the debt refinancing in December 2014, which replaced the senior secured notes with variable rate term debt. |
| · | Weighted Average Borrowings: Interest expense increased $0.5 million in Q4 2015 compared to Q4 2014 as a result of higher outstanding debt. Weighted average borrowings increased by $52.8 million primarily due to amounts used to fund increases in net working capital in support of our growth during Q4 2015. |
Borrowings under Unified’s credit agreement are subject to market rate fluctuations. A 25 basis point change in the market rate of interest over the 2015 Period would have resulted in a $0.2 million increase or decrease in corresponding interest expense.
| · | Interest expense on all our other outstanding debt instruments was $0.1 million and $0.2 million in Q4 2015 and Q4 2014, respectively. |
55
Table of Contents
Estimated patronage dividends. Estimated patronage dividends for Q4 2015 were $2.7 million, compared to $2.0 million in Q4 2014, an increase of 36.1%. Estimated patronage dividends for Q4 2015 and Q4 2014 consisted of patronage earnings from the Southern California Dairy Division and the Pacific Northwest Dairy Division. For Q4 2015 and Q4 2014, respectively, we had patronage earnings of $2.5 million and $1.8 million in the Southern California Dairy Division, $0.2 million and $0.2 million in the Pacific Northwest Dairy Division, and patronage earnings of $0.9 million in Q4 2015 compared to a $0.5 million loss for Q4 2014 in the Cooperative Division. The improvement in the Cooperative Division for Q4 2015 compared to Q4 2014 was due primarily to the additional business from Haggen and Raley’s.
Income taxes. Income taxes from continuing and discontinued operations reflected a combined $4.2 million benefit in Q4 2015 compared to a $0.7 million provision in Q4 2014. Our effective income tax rate was 36.6% for Q4 2015 compared to (34.5)% for Q4 2014. The effective tax rate for Q4 2015 approximates our statutory rate. The negative tax rate for Q4 2014 is due to the recording of valuation allowances which reduced state credits and the overall deferred tax assets to a level that can be sustained by future carryback claims and tax planning.
Discontinued Insurance Operations
Discontinued Operations
| (dollars in thousands) | ||||||||||||||||||||
|
Thirteen Weeks Ended October 3, 2015 |
Thirteen Weeks Ended September 27, 2014 |
|||||||||||||||||||
| Amounts in 000’s |
Percent to Net Sales |
Amounts in 000’s |
Percent to Net Sales |
Difference | ||||||||||||||||
| Net sales – premiums earned and investment income |
$ | 2,723 | 100.0 | % | $ | 4,060 | 100.0 | % | $ | (1,337 | ) | |||||||||
| Cost of sales – underwriting expenses |
4,569 | 167.8 | 3,778 | 93.1 | 791 | |||||||||||||||
| Selling and administrative expenses |
1,655 | 60.8 | 1,787 | 44.0 | (132 | ) | ||||||||||||||
|
|
||||||||||||||||||||
| Operating loss |
$ | (3,501 | ) | (128.6 | )% | $ | (1,505 | ) | (37.1 | )% | $ | (1,996 | ) | |||||||
|
|
||||||||||||||||||||
Net sales. Net sales, consisting principally of premium revenues and investment income, decreased $1.3 million to $2.7 million in Q4 2015 compared to $4.0 million in Q4 2014. The decrease is primarily due to a decrease in workers’ compensation premium revenue, resulting from a decline in workers’ compensation policies written partially offset by an increase in renewal premiums. The decrease in premium revenue was partially offset by an increase in investment income.
Cost of sales (including underwriting expenses). Cost of sales primarily consists of claims loss and loss adjustment expenses, underwriting expenses, commissions, premium taxes and regulatory fees. Cost of sales increased $0.8 million to $4.6 million in Q4 2015 compared to $3.8 million in Q4 2014. This increase is primarily due to $0.8 million of additional loss reserve adjustments recorded in Q4 2015 compared to Q4 2014. Loss reserve adjustments in Q4 2015 totaled $3.3 million compared to $2.5 million in Q4 2014. Loss reserve adjustments in Q4 2015 were due to reserve increases required by the Stock Purchase Agreement in conjunction with the sale of the former insurance subsidiaries to AmTrust. Loss reserve adjustments were necessitated in Q4 2014 due to a combination of adverse development and case reserving practices and related accounting within the former insurance subsidiaries that deviated from the established policy of setting case reserves at the best estimate of ultimate cost. Historically, the cost of insurance and the adequacy of loss reserves have been impacted by actuarial estimates based on a detailed analysis of health care cost trends, claims history, demographics and industry trends. See Explanatory Note in Part I, Item 1, “Business” for further discussion regarding the setting of case reserves and management of claims by our former insurance subsidiaries and related matters pertaining to the Audit Committee Investigation.
Distribution, selling and administrative expenses. Selling and administrative expenses for the discontinued Insurance operations decreased $0.1 million to $1.7 million in Q4 2015 compared to $1.8 million in Q4 2014.
56
Table of Contents
Fiscal Quarter Ended June 27, 2015 (“Q3 2015”) Compared to Fiscal Quarter Ended June 28, 2014 (“Q3 2014”)
Continuing Operations
Wholesale Distribution Segment
| (dollars in thousands) | ||||||||||||||||||||
| Thirteen Weeks Ended June 27, 2015 |
Thirteen Weeks Ended June 28, 2014 |
|||||||||||||||||||
| Amounts in 000’s |
Percent to Net Sales |
Amounts in 000’s |
Percent to Net Sales |
Difference | ||||||||||||||||
| Gross billings |
$ | 1,069,320 | — | $ | 979,036 | — | $ | 90,284 | ||||||||||||
| Less: Gross billings through vendor direct arrangements |
(30,972 | ) | — | (31,898 | ) | — | 926 | |||||||||||||
| Inter-segment eliminations |
— | — | — | — | — | |||||||||||||||
|
|
||||||||||||||||||||
| Net sales |
1,038,348 | 100.0 | % | 947,138 | 100.0 | % | 91,210 | |||||||||||||
| Cost of sales |
965,638 | 93.0 | 876,222 | 92.5 | 89,416 | |||||||||||||||
| Distribution, selling and administrative expenses |
70,552 | 6.8 | 64,804 | 6.8 | 5,748 | |||||||||||||||
|
|
||||||||||||||||||||
| Operating income |
$ | 2,158 | 0.2 | % | $ | 6,112 | 0.7 | % | $ | (3,954 | ) | |||||||||
|
|
||||||||||||||||||||
All Other
| (dollars in thousands) | ||||||||||||||||||||
| Thirteen Weeks Ended June 27, 2015 |
Thirteen Weeks Ended June 28, 2014 |
|||||||||||||||||||
| Amounts in 000’s |
Percent to Net Sales |
Amounts in 000’s |
Percent to Net Sales |
Difference | ||||||||||||||||
| Gross sales |
$ | 379 | — | $ | 313 | — | $ | 66 | ||||||||||||
| Inter-segment eliminations |
(112 | ) | — | (56 | ) | — | (56 | ) | ||||||||||||
|
|
||||||||||||||||||||
| Net sales |
267 | 100.0 | % | 257 | 100.0 | % | 10 | |||||||||||||
| Selling and administrative expenses |
158 | 59.2 | 189 | 73.5 | (31 | ) | ||||||||||||||
|
|
||||||||||||||||||||
| Operating income |
$ | 109 | 40.8 | % | $ | 68 | 26.5 | % | $ | 41 | ||||||||||
|
|
||||||||||||||||||||
Net sales. Consolidated net sales increased $91.2 million, or 9.6%, to $1.038 billion in Q3 2015 compared to $0.947 billion for Q3 2014. Factors impacting net sales are as follows:
| · | Wholesale Distribution Segment: Wholesale Distribution net sales increased $91.2 million, or 9.6% as a percent of Wholesale Distribution net sales, to $1.038 billion in Q3 2015 compared to $0.947 billion for Q3 2014. We increased net sales through the addition of new customers and higher sales to continuing customers (including the new Haggen store conversions and Raley’s business), which were partially offset by the loss of sales due to store closures of existing customers. Sales to Haggen during the fourth quarter of fiscal 2015 and going forward may not reach the levels originally anticipated by us. Our customer base continues to be impacted by consumers who are highly price sensitive, seek lower-cost alternatives in their grocery purchases, and have shown a willingness to shop at multiple stores for grocery products, including discounters and other non-traditional format stores. This trend continues to have an adverse impact on gross billings and net sales as well as pressuring profit margins. |
| · | All Other: Net sales were $0.3 million in both Q3 2015 and Q3 2014. |
Cost of sales. Consolidated cost of sales increased $89.4 million to $965.6 million in Q3 2015 compared to $876.2 million in Q3 2015 and comprised 93.0% and 92.5% of consolidated net sales for Q3 2015 and Q3 2014, respectively. Factors impacting cost of sales are as follows:
| · | Wholesale Distribution Segment: Cost of sales increased by $89.4 million to $965.6 billion in Q3 2015 compared to $876.2 million in Q3 2014. As a percentage of Wholesale Distribution net sales, cost of sales was 93.0% and 92.5% for Q3 2015 and Q3 2014, respectively. |
57
Table of Contents
| · | We experienced reduced margins in the perishable and non-perishable product lines resulting from increased product costs and a change in customer sales mix, resulting in a 0.5% increase in cost of sales as a percent of Wholesale Distribution net sales in Q3 2015 compared to Q3 2014. |
| · | Vendor related activity resulted in no change in cost of sales as a percent of Wholesale Distribution net sales in Q3 2015 compared to Q3 2014. |
Distribution, selling and administrative expenses. Consolidated distribution, selling and administrative expenses increased $5.7 million to $70.7 million in Q3 2015 compared to $65.0 million for Q3 2014 and comprised 6.8% and 6.9% of consolidated net sales for Q3 2015 and Q3 2014, respectively. Factors impacting distribution, selling and administrative expenses are as follows:
| · | Wholesale Distribution Segment: Distribution, selling and administrative expenses increased $5.7 million to $70.5 million in Q3 2015 compared to $64.8 million in Q3 2014. These expenses comprised 6.8% of Wholesale Distribution net sales for each of Q3 2015 and Q3 2014. Factors impacting distribution, selling and administrative expenses are as follows: |
| · | Audit Committee Investigation: During Q3 2015, we experienced an increase of $1.4 million, or 0.1% as a percent of Wholesale Distribution net sales, in expenses associated with the investigation of issues relating to the setting of case reserves and management of claims by our former insurance subsidiaries. See Part I, “Business—Audit Committee Investigation,” for additional information. |
| · | Employee Pension and Postretirement Benefits: During Q3 2015, we experienced a decline of $0.9 million, or 0.1% as a percent of Wholesale Distribution net sales, in employee pension and postretirement benefit expenses, primarily due to changes in our non-represented employee pension and postretirement benefit plans. |
| · | General Expenses: During Q3 2015, general expenses increased $5.2 million, but remained flat as a percent of Wholesale Distribution net sales due to the leveraging effect of increased sales. The increase in general expenses was primarily due to activities related to the Haggen new business project, partially offset by general improvements in other expenses. |
| · | All Other: Selling and administrative expenses for our All Other business activities were $0.2 million for both Q3 2015 and Q3 2014. |
Interest. Interest expense decreased $0.4 million to $2.5 million in Q3 2015 compared to $2.9 million in Q3 2014 and comprised 0.2% and 0.3% of consolidated net sales for Q3 2015 and Q3 2014, respectively. Factors contributing to the decrease in interest expense are as follows:
| · | Interest expense on our primary debt instruments (as described below) decreased $0.3 million to $2.4 million in Q3 2015 compared to $2.7 million in Q3 2014. |
| · | Interest Rates: Interest expense decreased $0.6 million from Q3 2014 as a result of lower borrowing rates. Our effective borrowing rate for the combined primary debt, made up of the revolving lines of credit for Unified and GCC, the term loan and senior secured notes (Q3 2014 only), was 2.9% and 3.6% for Q3 2015 and Q3 2014, respectively. The rate decrease was due to lower effective rates on Unified’s revolving line of credit and the debt refinancing in December 2014, which replaced the senior secured notes with term debt. |
| · | Weighted Average Borrowings: Interest expense increased $0.3 million in Q3 2015 compared to Q3 2014 as a result of higher outstanding debt. Weighted average borrowings increased by $36.2 million primarily due to amounts used to fund increases in net working capital in support of our growth during Q3 2015. |
Borrowings under Unified’s credit agreement are subject to market rate fluctuations. A 25 basis point change in the market rate of interest over Q3 2014 would have resulted in a $0.2 million increase or decrease in corresponding interest expense.
| · | Interest expense on all our other outstanding debt instruments was $0.1 million and $0.2 million in Q3 2015 and Q3 2014, respectively. |
58
Table of Contents
Estimated patronage dividends. Estimated patronage dividends for Q3 2015 were $1.6 million, compared to $2.5 million in Q3 2014, a decrease of 34.8%. Estimated patronage dividends for Q3 2015 and Q3 2014 consisted of patronage earnings from the Southern California Dairy Division and the Pacific Northwest Dairy Division. For Q3 2015 and Q3 2014, respectively, we had patronage earnings of $1.4 million and $2.3 million in the Southern California Dairy Division, $0.2 million and $0.2 million in the Pacific Northwest Dairy Division, and no patronage earnings in the Cooperative Division. The Southern California Dairy Division experienced lower patronage earnings due to reduced margins in addition to higher operating expenses during Q3 2015 compared to Q3 2014. The Cooperative Division experienced a loss in Q3 2015 due primarily to reduced margins in both the perishable and non-perishable product lines, increased costs preparing for the new Haggen business and costs incurred related to the Audit Committee Investigation. The Cooperative Division incurred a loss in Q3 2014 due primarily to a change in sales mix towards products with lower margins, partially offset by lower employee pension and postretirement benefit expenses and reduced operating expenses.
Income taxes. Income taxes from continuing and discontinued operations reflected a combined effective income tax rate of (2.9)% for Q3 2015 compared to 38.4% for Q3 2014. The negative effective rate for Q3 2015 is due to a valuation allowance provided to offset the income tax benefit associated with the Q3 2015 pre-tax loss. The effective rate for Q3 2014 approximates our statutory rate.
Discontinued Insurance Operations
Discontinued Operations
| (dollars in thousands) | ||||||||||||||||||||
| Thirteen Weeks Ended June 27, 2015 |
Thirteen Weeks Ended June 28, 2014 |
|||||||||||||||||||
| Amounts in 000’s |
Percent to Net Sales |
Amounts in 000’s |
Percent to Net Sales |
Difference | ||||||||||||||||
| Net sales – premiums earned and investment income |
$ | 2,627 | 100.0 | % | $ | 3,937 | 100.0 | % | $ | (1,310 | ) | |||||||||
| Cost of sales – underwriting expenses |
849 | 32.3 | 9,329 | 236.9 | (8,480 | ) | ||||||||||||||
| Selling and administrative expenses |
1,760 | 67.0 | 1,707 | 43.4 | 53 | |||||||||||||||
|
|
||||||||||||||||||||
| Operating income (loss) |
$ | 18 | 0.7 | % | $ | (7,099 | ) | (180.3 | )% | $ | 7,117 | |||||||||
|
|
||||||||||||||||||||
Net sales. Net sales, consisting principally of premium revenues and investment income, decreased $1.3 million to $2.6 million in Q3 2015 compared to $3.9 million in Q3 2014. The decrease is primarily due to a decrease in workers’ compensation premium revenue and a decrease in investment income.
Cost of sales (including underwriting expenses). Cost of sales primarily consists of claims loss and loss adjustment expenses, underwriting expenses, commissions, premium taxes and regulatory fees. Cost of sales decreased $8.5 million to $0.8 million in Q3 2015 compared to $9.3 million in Q3 2014. This reduction is primarily due to $7.5 million of loss reserve adjustments in Q3 2014 that did not recur in Q3 2015. These adjustments occurred due to a combination of adverse development and case reserving practices and related accounting within the former insurance subsidiaries that deviated from the established policy of setting case reserves at the best estimate of ultimate cost. Historically, the cost of insurance and the adequacy of loss reserves have been impacted by actuarial estimates based on a detailed analysis of health care cost trends, claims history, demographics and industry trends. See Explanatory Note in Part I, Item 1, “Business” for further discussion regarding the setting of case reserves and management of claims by our former insurance subsidiaries and related matters pertaining to the Audit Committee Investigation.
Distribution, selling and administrative expenses. Selling and administrative expenses for the discontinued Insurance operations increased $0.1 million to $1.8 million in Q3 2015 compared to $1.7 million in Q3 2014.
59
Table of Contents
Fiscal Quarter Ended March 28, 2015 (“Q2 2015”) Compared to Fiscal Quarter Ended March 29, 2014 (“Q2 2014”)
Continuing Operations
Wholesale Distribution Segment
| (dollars in thousands) | ||||||||||||||||||||
| Thirteen Weeks Ended March 28, 2015 |
Thirteen Weeks Ended March 29, 2014 |
|||||||||||||||||||
| Amounts in 000’s |
Percent to Net Sales |
Amounts in 000’s |
Percent to Net Sales |
Difference | ||||||||||||||||
| Gross billings |
$ | 931,460 | — | $ | 915,120 | — | $ | 16,340 | ||||||||||||
| Less: Gross billings through vendor direct arrangements |
(25,361 | ) | — | (25,702 | ) | — | 341 | |||||||||||||
| Inter-segment eliminations |
— | — | — | — | — | |||||||||||||||
|
|
||||||||||||||||||||
| Net sales |
906,099 | 100.0 | % | 889,418 | 100.0 | % | 16,681 | |||||||||||||
| Cost of sales |
842,876 | 93.0 | 818,753 | 92.1 | 24,123 | |||||||||||||||
| Distribution, selling and administrative expenses |
68,339 | 7.6 | 68,084 | 7.6 | 255 | |||||||||||||||
|
|
||||||||||||||||||||
| Operating (loss) income |
$ | (5,116 | ) | (0.6 | )% | $ | 2,581 | 0.3 | % | $ | (7,697 | ) | ||||||||
|
|
||||||||||||||||||||
All Other
| (dollars in thousands) | ||||||||||||||||||||
| Thirteen Weeks Ended March 28, 2015 |
Thirteen Weeks Ended March 29, 2014 |
|||||||||||||||||||
| Amounts in 000’s |
Percent to Net Sales |
Amounts in 000’s |
Percent to Net Sales |
Difference | ||||||||||||||||
| Gross sales |
$ | 359 | — | $ | 221 | — | $ | 138 | ||||||||||||
| Inter-segment eliminations |
(63 | ) | — | (36 | ) | — | (27 | ) | ||||||||||||
|
|
||||||||||||||||||||
| Net sales |
296 | 100.0 | % | 185 | 100.0 | % | 111 | |||||||||||||
| Selling and administrative expenses |
159 | 53.7 | 308 | (166.5 | ) | (149 | ) | |||||||||||||
|
|
||||||||||||||||||||
| Operating income (loss) |
$ | 137 | 46.3 | % | $ | (123 | ) | (66.5 | )% | $ | 260 | |||||||||
|
|
||||||||||||||||||||
Net sales. Consolidated net sales increased $16.8 million, or 1.9%, to $906.4 million in Q2 2015 compared to $889.6 million for Q2 2014. Factors impacting net sales are as follows:
| · | Wholesale Distribution Segment: Wholesale Distribution net sales increased $16.7 million, or 1.9% as a percent of Wholesale Distribution net sales, to $906.1 million in Q2 2015 compared to $889.4 million for Q2 2014. We increased sales through the addition of new customers and higher sales to continuing customers, primarily due to commodity price inflation in perishables. However, gross billings and net sales continue to be adversely impacted by consumers in our customer base who are willing to shop at multiple stores for grocery products, including discounters and other non-traditional format stores. This trend also continues to pressure our profit margins. |
| · | All Other: Net sales were $0.3 million and $0.2 million in Q2 2015 and Q2 2014, respectively. |
Cost of sales. Consolidated cost of sales increased $24.1 million to $842.9 million in Q2 2015 compared to $818.8 million in Q2 2015 and comprised 93.0% and 92.0% of consolidated net sales for Q2 2015 and Q2 2014, respectively. Factors impacting cost of sales are as follows:
| · | Wholesale Distribution Segment: Cost of sales increased by $24.1 million to $842.9 million in Q2 2015 compared to $818.8 million in Q2 2014. As a percentage of Wholesale Distribution net sales, cost of sales was 93.0% and 92.1% for Q2 2015 and Q2 2014, respectively. |
| · | We experienced reduced margins in the perishable and non-perishable product lines resulting from increased product costs, as well as a change in customer sales mix and a change in product mix |
60
Table of Contents
| between perishable and non-perishable products, resulting in a 0.7% increase in cost of sales as a percent of Wholesale Distribution net sales in Q2 2015 compared to Q2 2014. |
| · | Vendor related activity resulted in a 0.2% increase in cost of sales as a percent of Wholesale Distribution net sales in Q2 2015 compared to Q2 2014. This was due primarily to a change in sales mix towards products with reduced or no vendor promotional funding support in addition to a reduction in vendor holding gains (realized upon sale) resulting from lower vendor price increases as compared to Q2 2014. |
Distribution, selling and administrative expenses. Consolidated distribution, selling and administrative expenses increased $0.1 million to $68.5 million in Q2 2015 compared to $68.4 million for Q2 2014 and comprised 7.6% and 7.7% of consolidated net sales for Q2 2015 and Q2 2014, respectively. Factors impacting distribution, selling and administrative expenses are as follows:
| · | Wholesale Distribution Segment: Distribution, selling and administrative expenses increased $0.2 million to $68.3 million in Q2 2015 compared to $68.1 million in Q2 2014. These expenses comprised 7.6% of Wholesale Distribution net sales for each of Q2 2015 and Q2 2014. Factors impacting distribution, selling and administrative expenses are as follows: |
| · | Audit Committee Investigation: During Q2 2015, we experienced an increase of $2.0 million, or 0.2% as a percent of Wholesale Distribution net sales, in expenses associated with the investigation of issues relating to the setting of case reserves and management of claims by our former insurance subsidiaries. See Part I, “Business—Audit Committee Investigation,” for additional information. |
| · | Employee Pension and Postretirement Benefits: During Q2 2015, we experienced a decline of $2.1 million, or 0.2% as a percent of Wholesale Distribution net sales, in employee pension and postretirement benefit expenses, primarily due to changes in our non-represented employee pension and postretirement benefit plans. |
| · | General Expenses: During Q2 2015, general expenses increased $0.3 million, but remained constant as a percent of Wholesale Distribution net sales due to the leveraging effect of increased sales. The increase in general expenses was primarily due to activities related to the Haggen new business project, partially offset by general improvements in other expenses. |
| · | All Other: Selling and administrative expenses for our All Other business activities were $0.2 million and $0.3 million for Q2 2015 and Q2 2014, respectively. |
Interest. Interest expense decreased $0.5 million to $2.3 million in Q2 2015 compared to $2.8 million in Q2 2014 and comprised 0.3% of consolidated net sales for both Q2 2015 and Q2 2014. Factors contributing to the decrease in interest expense are as follows:
| · | Interest expense on our primary debt instruments (as described below) decreased $0.4 million to $2.2 million in Q2 2015 compared to $2.6 million in Q2 2014. |
| · | Interest Rates: Interest expense decreased $0.5 million from Q2 2014 as a result of lower borrowing rates. Our effective borrowing rate for the combined primary debt, made up of the revolving lines of credit for Unified and GCC, the term loan and senior secured notes (Q2 2014 only), was 3.1% and 3.7% for Q2 2015 and Q2 2014, respectively. The rate decrease was due to lower effective rates on Unified’s revolving line of credit and the debt refinancing in December 2014, which replaced the remaining senior secured notes with variable rate term debt. |
| · | Weighted Average Borrowings: Interest expense increased $0.1 million in Q2 2015 compared to Q2 2014 as a result of higher outstanding debt. Weighted average borrowings increased by $14.6 million primarily due to amounts used to fund debt extinguishment costs and increases in net working capital in support of our growth during Q2 2015. |
Borrowings under Unified’s credit agreement are subject to market rate fluctuations. A 25 basis point change in the market rate of interest over Q2 2014 would have resulted in a $0.2 million increase or decrease in corresponding interest expense.
| · | Interest expense on all our other outstanding debt instruments was $0.1 million and $0.2 million in Q2 2015 and Q2 2014, respectively. |
61
Table of Contents
Estimated patronage dividends. Estimated patronage dividends for Q2 2015 were $1.4 million, compared to $2.5 million in Q2 2014, a decrease of 45.1%. Estimated patronage dividends for Q2 2015 and Q2 2014 consisted of patronage earnings from the Southern California Dairy Division and the Pacific Northwest Dairy Division. For Q2 2015 and Q2 2014, respectively, we had patronage earnings of $1.2 million and $2.3 million in the Southern California Dairy Division, $0.2 million and $0.2 million in the Pacific Northwest Dairy Division, and no patronage earnings in the Cooperative Division. The Southern California Dairy Division experienced lower patronage earnings due to higher cost of goods during Q2 2015 compared to Q2 2014. The Cooperative Division experienced a loss in Q2 2015 due primarily to reduced margins in both the perishable and non-perishable product lines and increased costs preparing for the new Haggen business. The Cooperative Division incurred a loss in Q2 2014 due primarily to a change in sales mix towards products with lower margins, partially offset by lower employee pension and postretirement benefit expenses and reduced operating expenses.
Income taxes. Income taxes from continuing and discontinued operations reflected a combined effective income tax rate of (10.0%) for Q2 2015 compared to 34.3% for Q2 2014. The negative effective rate for Q2 2015 is due to a valuation allowance provided to offset the income tax benefit associated with the Q2 2015 pre-tax loss. The effective rate for Q2 2014 approximates our statutory rate.
Discontinued Insurance Operations
Discontinued Operations
| (dollars in thousands) | ||||||||||||||||||||
| Thirteen Weeks Ended March 28, 2015 |
Thirteen Weeks Ended March 29, 2014 |
|||||||||||||||||||
| Amounts in 000’s |
Percent to Net Sales |
Amounts in 000’s |
Percent to Net Sales |
Difference | ||||||||||||||||
| Net sales – premiums earned and investment income |
$ | 1,932 | 100.0 | % | $ | 4,005 | 100.0 | % | $ | (2,073 | ) | |||||||||
| Cost of sales – underwriting expenses |
1,148 | 59.4 | 2,147 | 53.6 | (999 | ) | ||||||||||||||
| Selling and administrative expenses |
1,619 | 83.8 | 1,648 | 41.2 | (29 | ) | ||||||||||||||
|
|
||||||||||||||||||||
| Operating (loss) income |
$ | (835 | ) | (43.2 | )% | $ | 210 | 5.2 | % | $ | (1,045 | ) | ||||||||
|
|
||||||||||||||||||||
Net sales. Net sales, consisting principally of premium revenues and investment income, decreased $2.1 million to $1.9 million in Q2 2015 compared to $4.0 million in Q2 2014. The decrease is primarily due to a decrease in workers’ compensation premium revenue and a decrease in investment income.
Cost of sales (including underwriting expenses). Cost of sales primarily consists of claims loss and loss adjustment expenses, underwriting expenses, commissions, premium taxes and regulatory fees. Cost of sales decreased $1.0 million to $1.1 million in Q2 2015 compared to $2.1 million in Q2 2014. This reduction is primarily due to decreases in incurred losses and variable underwriting expenses resulting from the decrease in premiums earned. Historically, the cost of insurance and the adequacy of loss reserves have been impacted by actuarial estimates based on a detailed analysis of health care cost trends, claims history, demographics and industry trends. See Explanatory Note in Part I, Item 1, “Business” for further discussion regarding the setting of case reserves and management of claims by our former insurance subsidiaries and related matters pertaining to the Audit Committee Investigation.
Distribution, selling and administrative expenses. Selling and administrative expenses for the discontinued Insurance operations were $1.6 million in both Q2 2015 and Q2 2014.
62
Table of Contents
Fiscal Quarter Ended December 27, 2014 (“Q1 2015”) Compared to Fiscal Quarter Ended December 28, 2013 (“Q1 2014”)
Continuing Operations
Wholesale Distribution Segment
| (dollars in thousands) | ||||||||||||||||||||
| Thirteen Weeks Ended December 27, 2014 |
Thirteen Weeks Ended December 28, 2013 |
|||||||||||||||||||
| Amounts in 000’s |
Percent to Net Sales |
Amounts in 000’s |
Percent to Net Sales |
Difference | ||||||||||||||||
| Gross billings |
$ | 994,301 | — | $ | 973,780 | — | $ | 20,521 | ||||||||||||
| Less: Gross billings through vendor direct arrangements |
(26,777 | ) | — | (24,434 | ) | — | (2,343 | ) | ||||||||||||
| Inter-segment eliminations |
(29 | ) | — | — | — | (29 | ) | |||||||||||||
|
|
||||||||||||||||||||
| Net sales |
967,495 | 100.0 | % | 949,346 | 100.0 | % | 18,149 | |||||||||||||
| Cost of sales |
898,040 | 92.8 | 876,464 | 92.3 | 21,576 | |||||||||||||||
| Distribution, selling and administrative expenses |
64,774 | 6.7 | 64,143 | 6.8 | 631 | |||||||||||||||
|
|
||||||||||||||||||||
| Operating income |
$ | 4,681 | 0.5 | % | $ | 8,739 | 0.9 | % | $ | (4,058 | ) | |||||||||
|
|
||||||||||||||||||||
All Other
| (dollars in thousands) | ||||||||||||||||||||
| Thirteen Weeks Ended December 27, 2014 |
Thirteen Weeks Ended December 28, 2013 |
|||||||||||||||||||
| Amounts in 000’s |
Percent to Net Sales |
Amounts in 000’s |
Percent to Net Sales |
Difference | ||||||||||||||||
| Gross sales |
$ | 421 | — | $ | 242 | — | $ | 179 | ||||||||||||
| Inter-segment eliminations |
(148 | ) | — | (45 | ) | — | (103 | ) | ||||||||||||
|
|
||||||||||||||||||||
| Net sales |
273 | 100.0 | % | 197 | 100.0 | % | 76 | |||||||||||||
| Selling and administrative expenses |
152 | 55.7 | 251 | (127.4 | ) | (99 | ) | |||||||||||||
|
|
||||||||||||||||||||
| Operating income (loss) |
$ | 121 | 44.3 | % | $ | (54 | ) | (27.4 | )% | $ | 175 | |||||||||
|
|
||||||||||||||||||||
Net sales. Consolidated net sales increased $18.2 million, or 1.9%, to $967.8 million in Q1 2015 compared to $949.6 million for Q1 2014. Factors impacting net sales are as follows:
| · | Wholesale Distribution Segment: Wholesale Distribution net sales increased $18.1 million, or 1.9% as a percent of Wholesale Distribution net sales, to $967.5 million in Q1 2015 compared to $949.4 million for Q1 2014. We increased sales through the addition of new customers and higher sales to continuing customers, primarily due to commodity price inflation in perishables, which were partially offset by the loss of sales due to lost customers and store closures. However, gross billings and net sales continue to be adversely impacted by consumers in our customer base who are willing to shop at multiple stores for grocery products, including discounters and other non-traditional format stores. This trend also continues to pressure our profit margins. |
| · | All Other: Net sales were $0.3 million and $0.2 million in Q1 2015 and Q1 2014, respectively. |
Cost of sales. Consolidated cost of sales increased $21.5 million to $898.0 million in Q1 2015 compared to $876.5 million in Q1 2015 and comprised 92.8% and 92.3% of consolidated net sales for Q1 2015 and Q1 2014, respectively. Factors impacting cost of sales are as follows:
| · | Wholesale Distribution Segment: Cost of sales increased by $21.5 million to $898.0 million in Q1 2015 compared to $876.5 million in Q1 2014. As a percentage of Wholesale Distribution net sales, cost of sales was 92.8% and 92.3% for Q1 2015 and Q1 2014, respectively. |
| · | We experienced reduced margins in the perishable and non-perishable product lines resulting from increased product costs, as well as a change in customer sales mix and a change in product mix |
63
Table of Contents
| between perishable and non-perishable products, resulting in a 0.5% increase in cost of sales as a percent of Wholesale Distribution net sales in Q1 2015 compared to Q1 2014. |
| · | The impact of vendor related activity was neutral in cost of sales as a percent of Wholesale Distribution net sales in Q1 2015 compared to Q1 2014. Increases in vendor holding gains (realized upon sale) resulting from vendor price increases were offset by a change in sales mix towards products with reduced or no vendor promotional funding support as compared to Q1 2014. |
Distribution, selling and administrative expenses. Consolidated distribution, selling and administrative expenses increased $0.5 million to $64.9 million in Q1 2015 compared to $64.4 million for Q1 2014 and comprised 6.7% and 6.8% of consolidated net sales for Q1 2015 and Q1 2014, respectively. Factors impacting distribution, selling and administrative expenses are as follows:
| · | Wholesale Distribution Segment: Distribution, selling and administrative expenses increased $0.6 million to $64.7 million in Q1 2015 compared to $64.1 million in Q1 2014. These expenses comprised 6.7% and 6.8% of Wholesale Distribution net sales for Q1 2015 and Q1 2014, respectively. Factors impacting distribution, selling and administrative expenses are as follows: |
| · | General Expenses: During Q1 2015, general expenses increased $0.6 million, but decreased 0.1% as a percent of Wholesale Distribution net sales due to the leveraging effect of increased sales. The increase in general expenses was primarily due to increased consulting and legal expenses resulting from activities related to the Haggen and Raley’s new business projects; however, the increase was partially offset by a reduction in expenses related to employee pension and postretirement benefits. |
| · | All Other: Selling and administrative expenses for our All Other business activities were $0.2 million and $0.3 million for Q1 2015 and Q1 2014, respectively. |
Interest. Interest expense decreased $0.1 million to $2.7 million in Q1 2015 compared to $2.8 million in Q1 2014 and comprised 0.3% of consolidated net sales for both Q1 2015 and Q1 2014. Factors contributing to the decrease in interest expense are as follows:
| · | Interest expense on our primary debt instruments (as described below) remained stable at $2.6 million in both Q1 2015 and Q1 2014. |
| · | Interest Rates: Interest expense decreased $0.1 million from Q1 2014 as a result of lower borrowing rates. Our effective borrowing rate for the combined primary debt, made up of the revolving lines of credit for Unified and GCC, the term loan and the senior secured notes, was 3.6% and 3.7% for Q1 2015 and Q1 2014, respectively. The rate decrease was due to lower effective rates on Unified’s revolving line of credit and the debt refinancing in December 2014, which replaced the remaining senior secured notes with variable rate term debt. |
| · | Weighted Average Borrowings: Interest expense increased $0.1 million in Q1 2015 compared to Q1 2014 as a result of higher outstanding debt. Weighted average borrowings increased by $13.7 million primarily due to amounts used to fund debt extinguishment costs and increases in net working capital in support of our growth during Q1 2015. |
Borrowings on Unified’s revolving credit agreement are subject to market rate fluctuations. A 25 basis point change in the market rate of interest over Q1 2014 would have resulted in a $0.1 million increase or decrease in corresponding interest expense.
| · | Interest expense on all our other outstanding debt instruments was $0.1 million and $0.2 million in Q1 2015 and Q1 2014, respectively. |
Loss on early extinguishment of debt. As discussed in “Credit Facilities” and “Outstanding Debt and Other Financing Arrangements,” in Q1 2015, we incurred a Make-Whole Amount of $3.0 million in conjunction with the prepayment of $48.5 million of our senior secured notes pursuant to our Amended and Restated Note Purchase Agreement dated as of January 3, 2006, as amended, with the then-current noteholders and John Hancock Life Insurance Company (U.S.A.), acting in its capacity as collateral agent for the then-current noteholders. As a result of the prepayment of the senior secured notes, we recorded a loss on early debt extinguishment of $3.2 million
64
Table of Contents
during Q1 2015. This amount is comprised of the $3.0 million Make-Whole Amount plus the write-off of unamortized fees associated with the prepayment of the senior secured notes of $0.2 million.
Estimated patronage dividends. Estimated patronage dividends for Q1 2015 were $1.5 million, compared to $2.4 million in Q1 2014, a decrease of 37.5%. Estimated patronage dividends for Q2 2015 and Q2 2014 consisted of the patronage activities from our three patronage earnings divisions: the Southern California Dairy Division, the Pacific Northwest Dairy Division and the Cooperative Division. For Q1 2015 and Q1 2014, respectively, we had patronage earnings of $1.3 million and $2.1 million in the Southern California Dairy Division, $0.2 million and $0.2 million in the Pacific Northwest Dairy Division, and no patronage earnings in the Cooperative Division for Q1 2015 compared to $0.1 million of estimated patronage earnings for Q1 2014. The Southern California Dairy Division experienced lower patronage earnings due to higher cost of goods during Q1 2015 compared to Q1 2014. The Cooperative Division experienced a loss in Q1 2015 due primarily to a loss on early debt extinguishment and reduced margins in both the perishable and non-perishable product lines resulting from increased product costs, in addition to a change in sales mix towards perishable products that tend to have lower margins than our other products.
Income taxes. Income taxes from continuing and discontinued operations reflected a combined effective income tax rate of 40.5% for Q1 2015 compared to 30.8% for Q1 2014. The lower rate for Q1 2014 was due to favorable returns from our corporate-owned life insurance. The effective rate for Q1 2015 approximated our statutory rate.
Discontinued Insurance Operations
Discontinued Operations
| (dollars in thousands) | ||||||||||||||||||||
| Thirteen Weeks Ended December 27, 2014 |
Thirteen Weeks Ended December 28, 2013 |
|||||||||||||||||||
| Amounts in 000’s |
Percent to Net Sales |
Amounts in 000’s |
Percent to Net Sales |
Difference | ||||||||||||||||
| Net sales – premiums earned and investment income |
$ | 4,869 | 100.0 | % | $ | 5,176 | 100.0 | % | $ | (307 | ) | |||||||||
| Cost of sales – underwriting expenses |
2,551 | 52.4 | 2,898 | 56.0 | (347 | ) | ||||||||||||||
| Selling and administrative expenses |
1,615 | 33.2 | 1,688 | 32.6 | (73 | ) | ||||||||||||||
|
|
||||||||||||||||||||
| Operating income |
$ | 703 | 14.4 | % | $ | 590 | 11.4 | % | $ | 113 | ||||||||||
|
|
||||||||||||||||||||
Net sales. Net sales, consisting principally of premium revenues and investment income, decreased $0.3 million to $4.9 million in Q1 2015 compared to $5.2 million in Q1 2014. The decrease is primarily due to a decrease in investment income partially offset by an increase in workers’ compensation premium revenue.
Cost of sales (including underwriting expenses). Cost of sales primarily consists of claims loss and loss adjustment expenses, underwriting expenses, commissions, premium taxes and regulatory fees. Cost of sales decreased $0.3 million to $2.6 million in Q1 2015 compared to $2.9 million in Q1 2014. This reduction is primarily a result of decreases in incurred losses. Historically, the cost of insurance and the adequacy of loss reserves are impacted by actuarial estimates based on a detailed analysis of health care cost trends, claims history, demographics and industry trends. See Explanatory Note in Part I, Item 1, “Business” for further discussion regarding the setting of case reserves and management of claims by our former insurance subsidiaries and related matters pertaining to the Audit Committee Investigation.
Distribution, selling and administrative expenses. Selling and administrative expenses for the discontinued Insurance operations were $1.6 million and $1.7 million in Q1 2015 and Q1 2014, respectively.
Liquidity and Capital Resources
We finance our capital needs through a combination of internal and external sources. These sources include cash from operations, Member capital and other Member investments, bank borrowings, various types of long-term debt and lease financing.
65
Table of Contents
The acquisition, holding and redemption of our shares and making of deposits, including Required Deposits, by our Members, and our policies with respect to such matters, can significantly affect our liquidity and capital resources. Our Bylaws, which may be changed by the Board at its discretion, currently require that each Member own 350 Class A Shares. In addition, we currently require each Member to own such amount of Class B Shares as may be established by the Board. This requirement to own Class B Shares is referred to as the “Class B Share Requirement.” Members who do not satisfy the Class B Share Requirement solely from their holdings of Class B Shares are generally required to make a subordinated deposit (a “Required Deposit”) with us. Member and Non-Member customers may be required to provide us a Credit Deposit in order to purchase products on credit terms established by us. “Credit Deposit” means any non-subordinated deposit that is required to be maintained by a Member or Non-Member customer in accordance with levels established by our credit office from time to time in excess of the amount of the Required Deposit set by the Board. We do not pay interest on Required Deposits or Credit Deposits; however, interest is paid at the prime rate for deposits in excess of a Member’s Required Deposit or Credit Deposit (an “Excess Deposit”). See Part I, Item 1, “Business—Capital Shares,” Part I, Item 1, “Business—Customer Deposits” and Part I, Item 1, “Business—Pledge of Shares and Guarantees” for additional information.
At October 3, 2015, we had $0.5 million of tendered Class A Shares and $28.2 million of tendered Class B Shares pending redemption, whose redemption is subject to final approval by the Board, and in the case of Class B Shares, subject to the 5% limitation on redemptions contained in our redemption policy (see Part I, Item 1, “Business—Capital Shares—Redemption of Class A and Class B Shares and Repurchase of Class E Shares—Redemption Policy” for further information).
Our obligations to repay a Member’s Required Deposit on termination of Member status (once the Member’s obligations to us have been satisfied) is reported as a long-term liability within “Members’ and Non-Members’ deposits” on our consolidated balance sheets. Excess Deposits are not subordinated to our other obligations and are reported as short-term liabilities within “Members’ deposits and declared patronage dividends” on our consolidated balance sheets. At October 3, 2015 and September 27, 2014, we had $8.0 million and $8.4 million, respectively, in “Members’ and Non-Members’ deposits” and $10.2 million and $11.6 million, respectively, in “Members’ deposits and declared patronage dividends” (of which $8.3 million and $10.8 million, respectively, represented Excess Deposits). See Part I, Item 1, “Business—Capital Shares,” Part I, Item 1, “Business—Patronage Dividends,” Part I, Item 1, “Business—Customer Deposits,” and Note 19 of Notes to Consolidated Financial Statements in Part II, Item 8, “Financial Statements and Supplementary Data.”
We believe that the combination of cash flows from operations, current cash balances, and available lines of credit, will be sufficient to service our debt, redeem or repurchase Members’ capital shares, make income tax payments and meet our anticipated needs for working capital and capital expenditures through at least the next two fiscal years.
Cash Flow
We generated positive cash flow from financing activities during the 2015 Period. Cash from financing activities was used for operating and investing activities, including investing in our infrastructure and supporting increased sales.
As a result of these activities, net cash, consisting of cash and cash equivalents, increased by $1.8 million to $3.0 million as of October 3, 2015, compared to $1.2 million as of September 27, 2014.
The following table summarizes the impact of operating, investing and financing activities on our cash flows for the 2015 and 2014 Periods related to our continuing operations:
| (dollars in thousands) | ||||||||||||
| Summary of Net Decrease in Total Cash and Cash Equivalents | 2015 | 2014 | Difference | |||||||||
| Cash (utilized) provided by operating activities |
$ | (2,156 | ) | $ | 25,939 | $ | (28,095 | ) | ||||
| Cash utilized by investing activities |
(24,041 | ) | (16,321 | ) | (7,720 | ) | ||||||
| Cash provided (utilized) provided by financing activities |
28,046 | (9,974 | ) | 38,020 | ||||||||
|
|
||||||||||||
| Total increase (decrease) in cash and cash equivalents |
$ | 1,849 | $ | (356 | ) | $ | 2,205 | |||||
|
|
||||||||||||
66
Table of Contents
Net cash from operating, investing and financing activities increased by $2.2 million to an increase of $1.8 million for the 2015 Period compared to a decrease of $0.4 million for the 2014 Period. The increase in net cash for the 2015 Period consisted of improvements in cash provided from financing activities of $38.0 million, offset by increases in cash utilized by operating activities of $28.1 million and investing activities of $7.7 million. The primary factors contributing to the changes in cash flow are discussed below. Working capital was $139.5 million and $150.2 million, and the current ratio was 1.4 and 1.5 at October 3, 2015 and September 27, 2014, respectively.
Net cash utilized by operating activities increased by $28.1 million to $2.2 million utilized in the 2015 Period compared to $25.9 million provided in the 2014 Period. The decrease in cash provided by operating activities compared to the 2014 Period was attributable primarily to (1) an increase between the periods related to net cash flows related inventories of $16.2 million, (2) a decrease in net earnings between the periods of $14.2 million, (3) an increase in deferred taxes of $10.1 million, (4) a decrease between the periods related to long-term liabilities of $5.5 million and (5) an increase between the periods related to prepaid expenses of $5.2 million. Additionally, we incurred a loss on the sale of our insurance subsidiaries of $3.2 million. The foregoing increases of $54.4 million in cash utilized were partially offset by (1) a decrease between the periods in cash used to fund pension plan contributions of $8.4 million, (2) a decrease in adjustments between the periods to reconcile net (loss) earnings to net cash provided by operating activities of $4.8 million related to depreciation and provision of allowance for doubtful accounts, (3) a decrease between the periods in net cash flows related to accounts receivable of $3.7 million, (4) an increase between the periods in net cash flows related to accounts payable and accrued liabilities of $6.2 million, and (5) an adjustment in the 2014 Period to reconcile net (loss) earnings to net cash provided by operating activities of $3.2 million related to the loss on early extinguishment of debt.
Investing Activities: Net cash used by investing activities increased by $7.7 million to $24.0 million for the 2015 Period compared to $16.3 million in the 2014 Period. The increase in cash used by investing activities during the 2015 Period as compared to the 2014 Period was due mainly to (1) an increase in other investments of $9.8 million related to one of our former insurance subsidiaries and (2) an increase in notes receivable activities between the periods of $1.5 million, reflecting normal fluctuation in loan activity to Members for their inventory and equipment financing. The foregoing increases in cash used of $11.3 million were partially offset by (1) a decrease in capital expenditures between the periods of $0.8 million and (2) a decrease in other assets of $2.8 million. Spending on investing activities is expected to be funded by existing cash balances, cash generated from operations or additional borrowings.
Financing Activities: Net cash provided by financing activities was $28.0 million for the 2015 Period compared to $10.0 million utilized in the 2014 Period. The net increase of $38.0 million in cash provided by financing activities for the 2015 Period as compared to the 2014 Period was due to an increase in cash provided of $37.5 million related to lower revolver and term loan borrowings, partially offset by lower notes payable repayments and payments of deferred financing fees in the 2015 Period. Additionally, the 2015 Period included payments of debt extinguishment costs. See “Outstanding Debt and Other Financing Arrangements” for further discussion regarding our credit facilities and financing arrangements. Additionally, net cash provided by Member investment and share activity increased $0.5 million due to reduced share activity in the 2015 Period compared to the 2014 Period. Future cash used by financing activities to meet capital spending requirements is expected to be funded by our continuing operating cash flow or additional borrowings.
Equity Enhancement
In fiscal 2003, we introduced a new class of capital share, denominated “Class E Shares,” as part of an equity enhancement initiative designed to build equity in the Company for future investment in the business and other infrastructure improvements. This initiative contemplated issuing Class E Shares as part of the patronage dividends issued in fiscal years 2003 through 2009 for the Cooperative Division. Class E Shares are available to be issued in future years at the discretion of the Board.
At the end of fiscal 2014 and 2013, Class E Shares issued as a portion of fiscal 2004 and 2003 patronage dividends became eligible for repurchase in fiscal 2015 and 2014. During fiscal 2015 and 2014, respectively, we repurchased 2,809 and 42,890 Class E Shares at a price of $0.3 million and $4.3 million. During the second quarter of fiscal 2016, we repurchased 78,745 Class E Shares at a price of $7.9 million that were eligible for
67
Table of Contents
repurchase in fiscal 2014 and 2015. As a result, 17,571 Class E Shares remain eligible for repurchase between the end of fiscal 2016 and the end of fiscal 2018 for an aggregate repurchase price of $1.8 million. See Note 12, “Capital Shares,” of Notes to Consolidated Financial Statements in Part II, Item 8, “Financial Statements and Supplementary Data.”
Credit Facilities
Secured Credit Agreement
We are party to an Amended and Restated Credit Agreement dated as of June 28, 2013, as amended by the First Amendment and Consent dated as of June 27, 2014 and as further amended by the Second Amendment, Consent and Lender Joinder dated as of December 18, 2014 and the Consent dated as of June 26, 2015 (as so amended, the “Credit Agreement”), among the Company, the lenders party thereto, Wells Fargo Bank, National Association (“N.A.”), as administrative agent (“Administrative Agent”), and the other agents party thereto. The Credit Agreement originally provided for a revolving credit facility with total commitments in the principal amount of $275 million and a term loan in the amount of $40.9 million. Certain capitalized terms used in this description of the Credit Agreement have the meanings given to them in the Credit Agreement.
On June 27, 2014, we entered into a First Amendment and Consent (the “First Amendment”) with Wells Fargo Bank, N.A., as Administrative Agent and the lenders party thereto, modifying the Credit Agreement. The First Amendment provided for a modification of the excess availability calculations under the Credit Agreement to accommodate normal seasonal working capital needs in the period from June 27, 2014 to January 15, 2015. The First Amendment did not change the $275 million maximum amount that could have been borrowed under the Credit Agreement, but did provide additional flexibility under certain provisions of the Credit Agreement and increased the aggregate amount of permitted credit facilities of our finance and former insurance subsidiaries from $25 million to $30 million. The Amendment, except as expressly stated, did not modify the Credit Agreement and other loan documents, which remained unmodified and in full force and effect.
On December 18, 2014, we entered into a Second Amendment, Consent and Lender Joinder (the “Second Amendment”) among the Company (excluding our wholly-owned finance subsidiary and our former insurance subsidiaries), the lenders party thereto, and the Administrative Agent. The Second Amendment amends the existing Credit Agreement among the Company, the lenders party thereto, and the Administrative Agent.
The Credit Agreement, as amended by the Second Amendment, provides for a revolving credit facility (the “Revolver”) with total commitments (“Revolving Loan Commitments”) in the principal amount of $370 million (increased by the Second Amendment from $275 million) (as such amount may be increased by any increases in the Revolving Loan Commitments and decreased by any reductions in the Revolving Loan Commitments, in each case pursuant to the Credit Agreement) (the “Maximum Revolver Amount”) and a term loan in the amount of $100 million (increased by the Second Amendment from $40.9 million) (the “Term Loan”). Borrowings under the Revolver may be made as revolving loans, swing line loans or letters of credit.
The aggregate Revolving Loan Commitments under the Credit Agreement may be increased from time to time, either through any of the existing lenders increasing its commitment or by means of the addition of new lenders, up to a maximum commitment of $450 million (increased by the Second Amendment from $400 million). While the consent of the lenders as a group is not required to any such increase, no lender is required to increase its own Revolving Loan Commitment.
The Second Amendment adds a “first-in last-out” tranche (the “FILO Facility”) to the Revolver, with all other revolving loans constituting the “Tranche A Facility.” The maximum amount of the FILO Facility (the “FILO Maximum Revolver Amount”) is $21.4 million, reduced by $0.6 million per month from the first anniversary of the Second Amendment to the second anniversary of the Second Amendment, reduced by $1.2 million per month from the second anniversary of the Second Amendment to the third anniversary of the Second Amendment, and reduced to zero on the third anniversary of the Second Amendment. The maximum amount of the Tranche A Facility (the “Tranche A Maximum Revolver Amount”) is the Maximum Revolver Amount (as defined above) minus the FILO Maximum Revolver Amount.
68
Table of Contents
The Credit Agreement matures June 28, 2018. The purpose of the Revolver is to finance working capital and other general corporate needs, which may include capital expenditures and Permitted Acquisitions (as defined in the Credit Agreement). The purpose of the Term Loan was for prepayment of the entire remaining balance of our senior secured notes pursuant to our Amended and Restated Note Purchase Agreement dated as of January 3, 2006, as amended (the “Senior Note Agreement”), with the then-current noteholders and John Hancock Life Insurance Company (U.S.A.) (“John Hancock”), acting in its capacity as collateral agent for the then-current noteholders (the “Hancock Debt”), and for payment of fees and expenses related to the repayment of the Hancock Debt, and (to the extent of any proceeds of the Term Loan remaining after payment of the Hancock Debt) for the same purposes as the Revolver. The Term Loan is subject to prepayment, if any appraisal of the Term Loan Real Estate shows the outstanding balance of the Term Loan exceeds 60% of the appraised value of the Term Loan Real Estate, in the amount of such excess. The Second Amendment adds to the Term Loan Real Estate certain real property of the Company that had secured the Hancock Debt. The principal of the Term Loan is to be repaid monthly beginning January 31, 2015, in an amount per month of $0.8 million (changed by the Second Amendment from an amount per month of $0.4 million, payment of which was due beginning July 31, 2013).
Our obligations under the Credit Agreement are guaranteed by certain of our subsidiaries, excluding our finance and former insurance subsidiaries, and are secured by grants of security interests in our accounts receivable, inventory, deposit accounts and certain related collateral (subject to exceptions) and the guarantor subsidiaries, and in the Term Loan Real Estate. The obligations are also senior to the rights of our Members with respect to Partially Subordinated Patrons’ Deposit Accounts and patronage dividend certificates, if any.
Borrowings under the Revolver may be made as revolving loans, swing line loans or letters of credit. The Revolver provides for loans up to the sum of (i) the lesser of (A) the Tranche A Maximum Revolver Amount less the sum of any outstanding letter of credit usage plus swing line loans plus reserves as may be established by the Administrative Agent and (B) the amount equal to the Tranche A Borrowing Base at such date (based upon the most recent Borrowing Base Certificate delivered by us to the Administrative Agent) less the sum of any outstanding letter of credit usage plus any outstanding swing line loans (“Tranche A Availability”), and (ii) the lesser of (A) the FILO Maximum Revolver Amount and (B) the amount equal to the FILO Borrowing Base as of such date (based upon the most recent Borrowing Base Certificate delivered by us to the Administrative Agent) (“FILO Availability”). The Tranche A Borrowing Base is calculated as 85% of all Eligible Accounts (primarily accounts receivable) less any Dilution Reserve, plus the lesser of (a) 70% of Eligible Inventory or (b) 90% of the Net Recovery Percentage of Eligible Inventory, less reserves, if any, established by the Administrative Agent. The FILO Borrowing Base is calculated as 5% of all Eligible Accounts, plus the lesser of (a) 5% of Eligible Inventory or (b) 5% of the Net Recovery Percentage of Eligible Inventory. All Revolving Loans at any time outstanding are allocated first to the FILO Revolving Loan Commitments up to the amount of FILO Availability, and then to the Tranche A Revolving Loan Commitments.
Borrowings under the Revolving Loan Commitment and Term Loan bear interest at an interest rate determined by reference either to the Base Rate or to the Eurodollar Rate with the rate election made by the Company at the time of the borrowing or at any time the Company elects to continue or convert a Loan or Loans, while swing loan borrowings bear interest at an interest rate determined by reference to the Base Rate. Tranche A Revolving Loans that are Base Rate Loans will bear interest margins of between 0.50% per annum and 1.00% per annum, dependent upon our Average Excess Availability for the most recently completed month for which a Borrowing Base Certificate has been delivered. Tranche A Revolving Loans that are Eurodollar Rate Loans will bear interest margins of between 1.50% per annum and 2.00% per annum, based upon our Average Excess Availability for the most recently completed month for which a Borrowing Base Certificate has been delivered. FILO Revolving Loans that are Base Rate Loans will bear interest margins of between 1.75% per annum and 2.25% per annum, dependent upon our Average Excess Availability for the most recently completed month for which a Borrowing Base Certificate has been delivered. FILO Revolving Loans that are Eurodollar Rate Loans will bear interest margins of between 2.75% per annum and 3.25% per annum, based upon our Average Excess Availability for the most recently completed month for which a Borrowing Base Certificate has been delivered. Amounts of the Term Loan that are Base Rate Loans will bear an interest margin of 1.00% per annum; amounts of the Term Loan that are Eurodollar Loans will bear an interest margin of 2.00% per annum. Swing line loans will bear interest at the Base Rate plus the interest margin for Tranche A Revolving Loans, or at such other rate as the Swing Line Lender offers in its discretion. Amounts available under Letters of Credit bear fees of 0.125% per annum plus the applicable Eurodollar Rate Margin for Tranche A Revolving Loans. If the Consolidated Fixed Charge Coverage Ratio for any period is less than 1.00 to 1.00, then the Base Rate Margin and the Eurodollar Rate Margin shall automatically increase by
69
Table of Contents
0.50%. Undrawn portions of the commitments under the Credit Agreement bear commitment fees at a rate of either 0.25% per annum or 0.375% per annum, also dependent upon our Average Excess Availability. We may reduce the Revolving Loan Commitments at any time on five Business Days’ written notice, but not below the Total Utilization of Revolving Commitments, in a minimum amount of $2,500,000 and multiples of $100,000 in excess of that amount. We may reduce the FILO Revolving Loan Commitments at any time on five Business Days’ written notice in any amount that will not result in an Overadvance, in a minimum amount of $2,500,000 and multiples of $100,000 in excess of that amount.
We are subject to a financial covenant during the occurrence of a Financial Covenant Period. A Financial Covenant Period (a) commences when (i) an Event of Default occurs, (ii) Excess Availability is less than the greater of (A) $47.1 million (increased by the Second Amendment from $35 million) and (B) 12.7272% of the Maximum Revolver amount for a period of five consecutive Business Days or (iii) Excess Availability is less than the greater of (A) $40.4 million (increased by the Second Amendment from $30 million) and (B) 10.9090% of the Maximum Revolver Amount at any time and (b) continues until a period of 30 consecutive Business Days has elapsed during which at all times (i) no Event of Default exists and (ii) Excess Availability is equal to or greater than the greater of (A) $47.1 million (increased by the Second Amendment from $35 million) and (B) 12.7272% of the Maximum Revolver Amount. During a Financial Covenant Period, we are obligated to maintain a Consolidated Fixed Charge Coverage Ratio of not less than 1.15 to 1.0, measured as of the end of the most recent Fiscal Month for which financial statements have been delivered prior to the date on which a Financial Covenant Period first begins and as of each Fiscal Month end while the Financial Covenant Period is in effect.
The Credit Agreement imposes financial conditions on us redeeming any of our Class A Shares and Class B Shares and repurchasing Class E Shares and paying cash dividends on Class E Shares (other cash dividends being generally prohibited), and prohibits distributions to shareholders and any repurchase of shares when an Event of Default has occurred and is continuing. The Credit Agreement also places certain restrictions on the payment of patronage dividends should an Event of Default occur. Events of Default include, but are not limited to, the failure to pay amounts due to lenders, violation of covenants, the making of false representations and warranties and specified insolvency-related events, subject to specified thresholds, cure periods and/or exceptions.
We are subject to negative covenants limiting permitted indebtedness, contingent obligations, liens, investments, acquisitions, restricted payments and certain other matters.
Our outstanding revolver borrowings under the Credit Agreement increased to $161.8 million (Eurodollar and Base Rate Loans at a blended average rate of 1.99% per annum) at October 3, 2015 from $145.0 million (Eurodollar and Base Rate Loans at a blended average rate of 1.93% per annum) at September 27, 2014, with access to approximately $141.0 million of additional capital available under the Credit Agreement (based on the amounts indicated above and subject to applicable reserves and borrowing base limitations) to fund our continuing operations and capital spending requirements for the foreseeable future. Our outstanding term loan borrowings under the Credit Agreement were $92.5 million at October 3, 2015 (Eurodollar and Base Rate Loans at a blended average rate of 2.20% per annum) and $36.1 million at September 27, 2014 (Eurodollar and Base Rate Loans at a blended average rate of 2.18% per annum). Our outstanding FILO borrowings under the Credit Agreement were $20.7 million at October 3, 2015 (Eurodollar and Base Rate Loans at a blended average rate of 3.20% per annum) and zero at September 27, 2014. As of October 3, 2015, we are in compliance with all applicable covenants of the Credit Agreement. While we are currently in compliance with all required covenants and expect to remain in compliance, this does not guarantee that we will remain in compliance in future periods.
On December 28, 2015, we entered into a consent and waiver (the “Consent”) in which the Administrative Agent and the Lenders consented to the extension to June 30, 2016 (previously December 31, 2015 pursuant to the consent and waiver dated June 26, 2015) of the deadline for delivery of the annual financial statements required pursuant to the Credit Agreement and certain certificates and information required by the Credit Agreement to be delivered with financial statements required pursuant to the Credit Agreement.
The Consent also sets forth the lenders’ waiver of specified Defaults and Events of Default (as those terms are defined in the Credit Agreement) to the extent arising out of any revision or other modification which may be necessitated by determinations made as a result of the Audit Committee Investigation to any writing previously delivered (or which may be delivered prior to June 30, 2016) by a Loan Party (as that term is defined in the Credit
70
Table of Contents
Agreement) in accordance with the applicable loan documents, or the effect or consequence of any such revision or other modification.
Subsidiary Financing Arrangement
Our wholly-owned finance subsidiary, GCC, is party to an Amended and Restated Loan and Security Agreement, dated as of September 26, 2014 as amended by Amendment Number One dated as of June 26, 2015 (as so amended, the “GCC Loan Agreement”), by and among GCC, the lenders party thereto, and California Bank & Trust (“CBT”), as Arranger and Administrative Agent. The GCC Loan Agreement amended and restated the existing loan agreement dated as of September 24, 2010, as amended or otherwise modified from time to time prior to September 26, 2014. The GCC Loan Agreement provides for a revolving credit facility with total commitments in the principal amount of $25.0 million. Borrowings under the GCC Loan Agreement may not exceed the amount equal to the Borrowing Base at such date (based upon the most recent Borrowing Base Certificate delivered by GCC to the Administrative Agent). The Borrowing Base is calculated as 80% of GCC’s eligible notes receivable (certain notes receivable restricted to 50%), less any reserves as may be established by the Administrative Agent. The GCC Loan Agreement matures on September 30, 2016. Certain capitalized terms used in this description of the GCC Loan Agreement have the meanings given to them in the GCC Loan Agreement. Borrowings under the GCC Loan Agreement are utilized to fund loans to our customers and for GCC’s general corporate purposes, including customary financing and operating activities.
GCC entered into Amendment Number One to Amended and Restated Loan and Security Agreement (the “GCC Amendment”), dated as of June 26, 2015, by and among GCC, the lenders that are signatories thereto, and CBT, as Arranger and Administrative agent. The GCC Amendment amends the GCC Loan Agreement to modify certain provisions relating to borrowing procedures and number of loan requests, as well as to permit CBT to fund as sole lender certain short term advances thereunder. See Item 1.01. “Entry into a Material Definitive Agreement—Grocers Capital Company Amended and Restated Loan and Security Agreement” and Item 2.03. “Creation of a Direct Financial Obligation or an Obligation under an Off-Balance Sheet Arrangement of a Registrant” of our Current Report on Form 8-K, filed on July 2, 2015, for additional information.
On December 28, 2015, GCC received consent from CBT for the GCC Loan Agreement to extend the due date of the covenant requirement to deliver our consolidated audited financial statements, which was previously December 31, 2015, to June 30, 2016. See Item 1.01. “Entry into a Material Definitive Agreement—Amendment of Amended and Restated Credit Agreement” and “—Grocers Capital Company Amended and Restated Loan and Security Agreement” of the Company’s Current Report on Form 8-K, filed on December 29, 2015, for additional information.
The GCC Loan Agreement provides for revolving loans. At the election of GCC, revolving loans shall bear interest at the LIBOR Rate or the Base Rate, plus an interest rate margin. The interest rate margin for LIBOR Rate loans is 3.00% per annum. The interest rate margin for Base Rate loans is 0.75% per annum. Undrawn portions of the commitments under the GCC Loan Agreement bear commitment fees at the rate of 0.25% per annum. GCC had revolving loan borrowings of zero and $6.5 million, bearing an interest rate of 4.00% (3.25% prime plus 0.75% interest rate margin), outstanding at October 3, 2015 and September 27, 2014, respectively.
GCC must maintain a minimum of $0.3 million in average, monthly, combined balances at CBT. In addition, GCC shall maintain at least $0.3 million in a blocked and restricted account at CBT, as cash collateral subject to the terms of the Pledge Agreement. Upon GCC’s conversion to an independent billing system, to the satisfaction of CBT, as evidenced by a written confirmation from CBT to GCC, such Cash Collateral Account shall be closed and the funds therein returned to GCC, and GCC shall no longer be obligated to maintain such Cash Collateral Account, and the Pledge Agreement shall terminate.
GCC is subject to negative covenants limiting permitted indebtedness, liens, investments, acquisitions, restricted payments and certain other matters. As of October 3, 2015, we are not in violation of any applicable covenants of the GCC Loan Agreement. While we are currently not in violation of any required covenants and expect to remain in compliance, this does not guarantee that we will remain in compliance in future periods.
71
Table of Contents
Long-Term Incentive Plan
Effective June 1, 2013, we implemented the Unified Grocers, Inc. Long-Term Incentive Plan (“LTIP”) to align, motivate and reward executives for their contributions to our long-term financial success and growth. This long-term plan, in conjunction with the short-term focus of our annual bonus plan, is designed to link long-term value creation for our member shareholders with our short-term annual performance.
The LTIP is offered to a select group of our officers, Vice-President and higher (the “Participants”), and participation may be further constrained or increased at the discretion of our Compensation Committee. Participants are awarded with a certain number of Units (defined below) on an annual basis (the “Award”); however, an Award in one year does not ensure that a Participant will receive an Award in subsequent years. Each Award participates in a four-year cycle (“Performance Cycle”), which is based on consecutive fiscal years of Unified, and the amount paid to a Participant, if any, is determined at the end of the Award’s Performance Cycle and is payable prior to December 31st of the year in which the Performance Cycle ends. In fiscal 2015, 2014 and 2013, LTIP Awards were offered to certain officers of the position of Vice-President or higher. A Participant’s Award vests over the Performance Cycle based on the Participant’s continuous employment with us during the Award’s Performance Cycle.
There are two types of units that are granted as part of an Award: Appreciation Units and Full-Value Units (collectively, “Units”). Effective for fiscal 2016, the LTIP was amended to expand the Awards that may be granted thereunder to include Full-Value Units. A “Full-Value Unit” entitles the award recipient the “maturity value” on the units at the end of the Performance Cycle assigned to the units. The “maturity value” for a Full-Value Unit is our Exchange Value Per Share for a share of the Class A or Class B stock of the Company as calculated from our financial statements (see Part I, Item 1. “Business—Capital Shares” for additional information), plus cumulative cooperative division patronage dividends (see Part I, Item 1, “Business—Patronage Dividends” for additional discussion), cash dividends and non-allocated retained earnings attributable to such share Exchange Value Per Share, as calculated from our financial statements for the fiscal year end that coincides with the end of the Performance Cycle. An “Appreciation Unit” refers to a notional unit that grants Participants the contractual right to receive the positive difference, if any, between the Maturity Value of the unit on its Maturity Date and the Base Value (capitalized terms defined below) assigned to the unit at the beginning of the Performance Cycle. The Base Value is equal to the Exchange Value Per Share for the fiscal year ending immediately prior to the Performance Cycle. The Maturity Value is equal to the Exchange Value Per Share plus Cumulative Co-op Patronage Dividends (defined below), plus Cumulative Cash Dividends (the total of cash dividends paid, excluding patronage dividends, as reported in our fiscal year-end financial statements), plus Cumulative Non-allocated Retained Earnings (defined below), as calculated from our financial statements for the Performance Cycle assigned to the Appreciation Unit. The difference is then multiplied by the number of vested Appreciation Units awarded for the Performance Cycle that remain outstanding on the Maturity Date. Cumulative Co-op Patronage Dividends are the sum of the Cooperative Division’s patronage earnings divided by the number of Class A and B Shares used in the calculation of the Exchange Value Per Share for each year in the Performance Cycle. Cumulative Co-op Patronage Dividends do not include Dairy Division patronage dividend amounts. The Cumulative Non-allocated Retained Earnings amount is the sum of the total increase or decrease in non-allocated retained earnings for a fiscal year divided by the number of Class A and B Shares used in the calculation of the Exchange Value Per Share for each year in the Performance Cycle.
For additional information on the LTIP, please refer to the LTIP documents incorporated by reference in our Current Report on Form 8-K, filed on May 14, 2013. For additional information on the amendment to the LTIP that became effective for fiscal 2016, please see Item 5.02, “Compensatory Arrangements of Certain Officers—2016 Long-Term Incentive Awards” in our Current Report on Form 8-K, filed on December 30, 2015, and Exhibit 99.4 thereto, “Long-Term Incentive Plan, as amended and restated effective October 4, 2015, dated as of December 28, 2015.”
Based on our calculations relative to the 2013, 2014 and 2015 Performance Cycles, we determined there was no LTIP compensation expense for the Performance Cycles to be recorded in fiscal 2015. Based on our calculations relative to the 2013 and 2014 Performance Cycles, we determined there was no LTIP compensation expense for the Performance Cycles to be recorded in fiscal 2014.
72
Table of Contents
Pension, Retirement and Other Benefit Plans
Overview
Our liquidity and capital resources have been or may be impacted by the following benefit plans we sponsor:
Defined Benefit Pension Plans
| · | Cash Balance Plan (the “Unified Cash Balance Plan”)(1) |
| · | Multiemployer defined benefit pension plans |
| · | Executive Salary Protection Plan III (the “ESPPIII” plan)(2) |
Defined Contribution Retirement Plan
| · | Supplemental Executive Retirement Plan (the “SERP”)(4) |
| · | Sheltered Savings Plan |
| · | Deferred Compensation Plan II |
| · | Employee Savings Plan |
Postretirement Benefit Plans
| · | Retiree Medical Plan (the “RMP”)(2) |
| · | Officer Retiree Medical Plan (the “ORMP”), including the Executive Medical Reimbursement Plan (the “EMRP”)(2) |
| · | Executive Insurance Plan (the “EIP”)(3) |
| · | Life Plan |
| · | Sick Leave Plan—Union |
| · | Sick Leave Plan—Non-Union(5) |
| (1) | Amended in December 2014—frozen and closed to new participants—see discussion under plan’s respective heading below. |
(2) Amended in December 2012—see discussion under each plan’s respective heading below.
(3) Amended in December 2012 and May 2013—see discussion under plan’s respective heading below.
(4) Implemented June 2013—see discussion under plan’s respective heading below.
(5) Terminated effective September 2014—see discussion below and under plan’s respective heading.
Our net periodic benefit plan expense (credit) for our combined defined benefit pension plans (excluding multiemployer defined benefit pension plans) and postretirement benefit plans was approximately $(7.7) million for fiscal 2015 compared to $(3.0) million (including a one-time termination gain of $2.5 million related to our non-union sick leave plan as discussed below) for fiscal 2014. This additional reduction in our combined defined benefit pension and postretirement benefit plan expense was primarily a result of benefit plan amendments implemented in fiscal 2014 and 2013 as further discussed below. During fiscal 2013, we froze the ESPPIII, a defined benefit pension plan for our executive officers, and replaced it with the SERP, a defined contribution retirement plan as described below, and the LTIP (described above). In fiscal 2015 and 2014, we accrued $1.2 million and $1.2 million, respectively, related to the SERP and no LTIP compensation expense for the 2015 and 2014 Performance Cycles. During fiscal 2013, we also curtailed benefits and froze participation under the RMP and froze participation in the ORMP.
In fiscal 2014, in conjunction with the implementation of a paid time-off (“PTO”) program for non-union employees that increased our benefit expenses by $1.8 million, we terminated one of our postretirement benefit plans, a non-union sick leave plan, resulting in a $1.4 million reduction in the associated long-term liability and a $1.1 million pre-tax reduction in accumulated other comprehensive earnings, resulting in the recognition of a one-time pre-tax termination gain of $2.5 million, which was recorded in addition to the net periodic postretirement benefit cost in our accompanying consolidated statements of earnings (loss).
Assuming a long-term rate of return on plan assets of 8.00%, weighted average discount rates of 4.45% (benefit obligation) and 3.64% (interest cost) for the Unified Cash Balance Plan, weighted average discount rates of 3.25% (benefit obligation), 2.57% (interest cost) and 3.47% (service cost) for the ESPPIII, and certain other assumptions, we estimate that our combined pension expense (benefit) for the Unified Cash Balance Plan and ESPPIII for fiscal 2016 will be approximately $(1.9) million. Future pension expense (benefit) will be affected by future investment
73
Table of Contents
performance, discount rates and other variables such as expected rate of compensation increases and mortality rates relating to plan participants. Decreasing only the discount rate assumptions by 0.5% would increase our projected fiscal 2016 pension benefit for the Unified Cash Balance Plan by approximately $5 thousand. Decreasing only the discount rate assumptions by 0.5% would decrease our projected fiscal 2016 pension expense for the ESPPIII by approximately $47 thousand. Lowering the expected long-term rate of return on our plan assets (for the Unified Cash Balance Plan) by 0.50% from 8.00% to 7.50% would have decreased our pension benefit for fiscal 2015 by approximately $1.0 million. Similarly, lowering the expected long-term rate of return on our plan assets (for the Unified Cash Balance Plan) by 0.50% (from 8.00% to 7.50%) would decrease our projected fiscal 2016 pension benefit by approximately $0.9 million.
Assuming weighted average discount rates of 3.91% (benefit obligation), 3.01% (interest cost) and 4.25% (service cost) and certain other assumptions, we estimate that postretirement benefit plan expense (benefit) for fiscal 2016 will be approximately $(0.6) million. Future postretirement benefit plan expense (benefit) will be affected by discount rates and other variables such as expected rate of compensation increases and projected health care trend rates.
During fiscal year 2010, comprehensive health care reform legislation under the Patient Protection and Affordable Care Act (HR 3590) and the Health Care Education and Affordability Reconciliation Act (HR 4872) (collectively, the “Acts”) was passed and signed into law. The Acts contain provisions that could impact our retiree medical benefits in future periods, including the related accounting for such benefits, such as the 40% excise tax beginning in 2020 that will be imposed on the value of health insurance benefits exceeding a certain threshold. However, the full extent of the impact of the Acts, if any, cannot be determined until all regulations are promulgated under the Acts (or changed as a result of ongoing litigation) and additional interpretations of the Acts become available. We will continue to assess the accounting implications of the Acts as related regulations and interpretations of the Acts become available. In addition, we may consider plan amendments in future periods that may have accounting implications. See Note 14 “Postretirement Benefit Plans Other Than Pensions” of Notes to Consolidated Financial Statements in Part II, Item 8, “Financial Statements and Supplementary Data” for additional discussion.
The following sections describe in further detail the defined benefit pension plans, defined contribution retirement plan and postretirement benefit plans sponsored by us.
Defined Benefit Pension Plans
Cash Balance Plan
We sponsor a noncontributory defined benefit pension plan (the “Unified Cash Balance Plan”) covering substantially all our employees who are not subject to a collective bargaining agreement. Under the Unified Cash Balance Plan, participants are credited with an annual accrual based on their years of service with us. The Unified Cash Balance Plan receives an annual interest credit, currently tied to the 30-year Treasury rate that is in effect the previous November, but in no event shall the rate be less than 5%. On retirement, participants will receive a lifetime annuity based on the total hypothetical cash balance in their account. Benefits under the Unified Cash Balance Plan are provided through a trust. Our funding policy is to make contributions to the Unified Cash Balance Plan in amounts that are at least sufficient to meet the minimum funding requirements of applicable laws and regulations, but no more than amounts deductible for federal income tax purposes. Through December 31, 2014, all of our qualifying employees who are not subject to a collective bargaining agreement accrue benefits pursuant to the Unified Cash Balance Plan. Prior to September 27, 2014, the Board approved an amendment to the Unified Cash Balance Plan, effective as of December 31, 2014, closing entry into the plan. In addition, effective December 31, 2014, the plan was frozen such that current participants in the plan will no longer be credited with any future benefit accruals based on their years of service and pensionable compensation after that date.
During July 2012, legislation to provide pension funding relief was enacted as part of the 2012 student loan and transportation legislation titled “Moving Ahead for Progress in the 21st Century” (“MAP-21”). Funding relief was achieved through changes in the methodology employed to determine interest rates used to calculate required funding contributions. The funding relief applies to single-employer pension plans subject to the funding requirements of the Employee Retirement Income Security Act (“ERISA”) that base pension liability calculations on interest rates determined pursuant to the Pension Protection Act of 2006.
74
Table of Contents
During August 2014, legislation to extend the pension funding relief included in MAP-21 was enacted as part of the Highway and Transportation Funding Act of 2014 (“HATFA”). As a result, our contributions to the Unified Cash Balance Plan for fiscal 2014 were reduced by $2.9 million from our originally estimated amounts. During fiscal 2015, we had no additional required contributions for the 2014 plan year, and there were no contributions required for the 2015 plan year. Accordingly, the Company made no contributions to the Unified Cash Balance Plan during fiscal 2015. Due to the plan’s funded status, quarterly contributions will not be required in fiscal 2016 for the 2016 plan year. At our discretion, we may contribute in excess of the minimum (zero) requirement. Additional contributions, if any, will be based, in part, on future actuarial funding calculations and the performance of plan investments. Contributions for the 2015 and 2016 plan years, if any, will be due by September 15, 2016 and September 15, 2017, respectively.
Multiemployer Defined Benefit Pension Plans
We contribute to a number of multiemployer defined benefit pension plans that provide retirement benefits for retired union employees under terms of our collective bargaining agreements (“Union Participants”). These multiemployer plans generally provide retirement benefits to Union Participants based on their service to contributing employers.
We made contributions of $14.6 million and $14.1 million for fiscal years 2015 and 2014, respectively, to collectively bargained, multiemployer defined benefit pension plans in accordance with the provisions of negotiated labor contracts.
Executive Salary Protection Plan III
We sponsor an Executive Salary Protection Plan III (“ESPPIII”) for our executive officers that provides supplemental post-termination retirement income based on each participant’s salary and years of service as an officer with us. As discussed below, this plan was amended in December 2012 to close the plan to new entrants as of September 30, 2012. We have informally funded our obligation to plan participants in a rabbi trust (not considered plan assets for valuation purposes) comprised primarily of life insurance policies tied to underlying investments in the equity market (reported at cash surrender value) and mutual fund assets consisting of various publicly-traded mutual funds (reported at estimated fair value based on quoted market prices). See Note 13 “Benefit Plans” of Notes to Consolidated Financial Statements in Part II, Item 8, “Financial Statements and Supplementary Data” for additional discussion.
In December 2012, we amended the ESPPIII for executive officers to close the eligibility provisions of the ESPPIII to new entrants as of September 30, 2012 (the “Freeze Date”); accordingly, no employee that is either hired or becomes an officer on or after the Freeze Date can become a participant or recommence participation in the ESPPIII. Additionally, benefit accruals under the ESPPIII were frozen for officers who have already attained a 65% gross benefit accrual as of September 30, 2012; accordingly, no such officers will accrue further gross benefits under the ESPPIII after the Freeze Date. For officers participating in the ESPPIII as of the Freeze Date who had less than a 65% gross benefit accrual, such officers will continue to accrue gross benefits under the ESPPIII until they reach a 65% gross benefit accrual. Lastly, a participant’s gross accrued benefit will not consider any compensation earned by the participant after the Freeze Date, which effectively freezes the final pay and final average pay formulas under the plan at the September 30, 2012 levels. See Item 5.02. “Compensatory Arrangements of Certain Officers” of our Current Report on Form 8-K, filed on January 7, 2013, for additional information.
We made benefit payments of $3.8 million to participants in the ESPPIII during fiscal 2015. At this time, we expect to make benefit payments of $3.6 million to participants in the ESPPIII in fiscal 2016.
Defined Contribution Retirement Plans
Supplemental Executive Retirement Plan
Effective June 1, 2013, we implemented a supplemental retirement plan for a select group of management or highly compensated employees that are at the Vice President level and above of the Company under the Unified Grocers, Inc. Supplemental Executive Retirement Plan (the “SERP”). This plan was established to replace the
75
Table of Contents
ESPPIII, which has been frozen. The SERP provides participating officers with supplemental retirement income in addition to the benefits provided under the Unified Cash Balance Plan and our 401(k) plans.
The SERP is a non-qualified defined contribution plan under which benefits are derived based on a notional account balance to be funded by us for each participating officer. The account balance will be credited each year with a Company contribution based on the officer’s compensation, calculated as base salary plus bonus, earned during a fiscal year and the officer’s executive level at the end of the fiscal year. Plan participants may select from a variety of investment options (referred to as “Measurement Funds” in the plan document) concerning how the contributions are hypothetically invested. Assets of the SERP (i.e., the participants’ account balances) will not be physically invested in the investments selected by the participants; rather, the Measurement Funds are utilized “for the purpose of debiting or crediting additional amounts” to each participant’s account. We informally fund our obligation to plan participants in a rabbi trust, comprised of mutual fund assets consisting of various publicly-traded mutual funds reported at estimated fair value based on quoted market prices. Mutual funds reported at their estimated fair value of $2.0 million and $0.8 million at October 3, 2015 and September 27, 2014, respectively, are included in other assets in our consolidated balance sheets.
Upon separation, plan participants will receive a benefit based upon the vested amount accrued in their account, which includes our contributions plus or minus the increase or decrease in the fair market value of the hypothetical investments (Measurement Funds) selected by the participant. Benefit expense for the SERP has been accrued under the assumption that all participants in the SERP will achieve full vesting (five years of service). As of October 3, 2015 and September 27, 2014, we accrued $1.2 million and $1.2 million, respectively, in SERP expense (recorded in long-term liabilities, other in our consolidated balance sheets). See Item 5.02. “Compensatory Arrangements of Certain Officers” of our Current Report on Form 8-K, filed on May 14, 2013, for additional discussion.
Sheltered Savings Plan
The Company has a Sheltered Savings Plan (“SSP”), which is a defined contribution plan, adopted pursuant to Section 401(k) of the Internal Revenue Code for substantially all of its nonunion employees. Prior to December 31, 2014, the Company matched, after an employee’s one year of service, each dollar deferred up to 4% of each participant’s eligible compensation and, at its discretion, matched 40% of amounts deferred between 4% and 8% of each participant’s eligible compensation. In response to changes in the Company’s Unified Cash Balance Plan (discussed previously herein), the Company amended the SSP on December 31, 2014. Commencing January 1, 2015, the Company increased its matching portion from 40% to 50% of a participant’s contributions over 4% and up to 8% of each participant’s eligible compensation. In addition, for each of the respective SSP plan years beginning January 1, 2015, January 1, 2016 and January 1, 2017, the Company will make an additional contribution on behalf of eligible participants (those who were participants in the Unified Cash Balance Plan as of December 31, 2014) from 1% up to 5% of a participant’s annual eligible compensation. At the end of each plan year, the Company may also contribute an amount equal to 2% of the compensation of those participants employed at that date. Participants are immediately 100% vested in the Company’s contribution.
The Company contributed approximately $5.1 million, $4.8 million and $5.1 million related to its SSP in the fiscal years ended October 3, 2015, September 27, 2014 and September 28, 2013, respectively.
Deferred Compensation Plan II
The Company has a nonqualified Deferred Compensation Plan (“DCPII”), which allows eligible employees to defer and contribute to an account a percentage of compensation on a pre-tax basis, as defined in the plan, in excess of amounts contributed to the SSP pursuant to IRS limitations, the value of which is measured by the fair value of the underlying investments. The Company informally funds its deferred compensation liability with assets held in a rabbi trust consisting of life insurance policies reported at cash surrender value and mutual fund assets consisting of various publicly-traded mutual funds reported at estimated fair value based on quoted market prices. The assets held in the rabbi trust are not available for general corporate purposes. Participants can direct the investment of their deferred compensation plan accounts in several investment funds as permitted by the DCPII. Gains or losses on investments are fully allocable to the plan participants. The cash surrender value of life insurance policies and mutual funds reported at their estimated fair value are included in other assets in the Company’s consolidated
76
Table of Contents
balance sheets because they remain assets of the Company until paid out to the participants. The cash surrender value of the life insurance policies was $12.3 million and $13.2 million at October 3, 2015 and September 27, 2014, respectively. The estimated fair value of the mutual funds was negligible at October 3, 2015 and September 27, 2014. The liability to participants ($12.5 million and $12.7 million at October 3, 2015 and September 27, 2014, respectively) is included in long-term liabilities, other in the Company’s consolidated balance sheets. The rabbi trust is subject to the Company’s creditors’ claims in the event of its insolvency.
Employee Savings Plan
The Company has an Employee Savings Plan, which is a defined contribution plan, adopted pursuant to Section 401(k) of the Internal Revenue Code for substantially all of its union employees. The Company does not match any employee deferrals into the plan, and therefore, there is no related vesting schedule. No expense was incurred in the periods presented.
Postretirement Benefit Plans
Retiree Medical Plan
We sponsor a postretirement benefit plan that provides certain medical coverage to retired non-union employees who are eligible to participate in the Unified Grocers, Inc. Retiree Medical Plan (the “RMP”). The RMP is contributory for non-union employees retiring after January 1, 1990, with the retiree contributions adjusted annually. This plan is not funded.
In December 2012, we amended the RMP to modify the eligibility requirements for the RMP. Effective as of the end of the first quarter of fiscal 2013, only employees of Unified who had reached 49 years of age with at least 15 years of continuous service with us as of the end of the first quarter of fiscal 2013 remained eligible to participate in the RMP. To receive benefits under the RMP, those employees who remain eligible must remain in continuous service with us through their retirement following the attainment of at least 55 years of age. We also reduced the benefits for those who remained eligible. Previously this was a lifetime benefit for the employee and their spouse. This was changed to a 15-year benefit for the employee only.
Officer Retiree Medical Plan
Officers who are at least 55 years of age and have seven years of service with us as an officer are eligible to participate in the Officer Retiree Medical Plan (the “ORMP”), which includes our Executive Medical Reimbursement Plan (the “EMRP”), following termination of employment. Pursuant to the EMRP, retired officers will be eligible for payment by the insurance plan of the portion of eligible expenses not covered under our health insurance plan.
Benefits under the ORMP are the same as under the RMP offered to non-union employees but with no annual premium caps, plus dental and vision benefits, continuation of the EMRP during retirement and extension of benefits for eligible dependents following the officer’s death. During retirement, officers are required to pay 25% of the ORMP premium to maintain coverage. Effective December 31, 2012, the eligibility provisions of the ORMP were frozen effective September 30, 2012; accordingly, no employee that is either hired or becomes an officer on or after such date can become a participant or recommence participation in the ORMP. We also reduced the benefits for those who remained eligible. Previously this was a lifetime benefit for the employee and their spouse. This was changed to a 15-year benefit for the employee only.
Executive Insurance Plan
We provide for the cost of life insurance on behalf of current and qualifying former officers of Unified through a split-dollar Executive Insurance Plan (the “EIP”) arrangement. As discussed below, this plan was amended in December 2012 to close the plan to new entrants as of September 30, 2012. Accordingly, no employee that is either hired or becomes an officer on or after such date can become a participant or recommence participation in the EIP. This plan is not funded.
In May 2013, the EIP was amended and restated effective as of June 1, 2013. For officers who were active on or after June 1, 2013, the EIP, as amended, provides a life insurance benefit of one and one-half times their annual
77
Table of Contents
salary (previously three times their annual salary) up to $1.2 million (reducing to 50% of the original amount at age 70) through group term life insurance. The group term life insurance coverage terminates upon retirement or termination. For active officers who were covered by the EIP at the time it was closed as of September 30, 2012, the EIP, as amended, also provides an additional fixed life insurance benefit amount, payable upon the participant’s death to their designated beneficiaries, based on such participant’s position with us as of June 1, 2013 as follows: $1,000,000 for the chief executive officer, $500,000 for executive vice president, $400,000 for senior vice presidents and $300,000 for vice presidents. Such fixed life insurance benefit amounts will not be adjusted for future promotions or increases in salary.
Life Plan
A certain group of retired non-union employees currently participate in a plan providing life insurance benefits for which active non-union employees are no longer eligible. This life insurance plan is noncontributory and is not funded.
Sick Leave Union Plan
Certain eligible union employees have a separate plan providing a lump-sum payout for unused days in the sick leave bank. The sick leave payout plan is noncontributory and is not funded.
Sick Leave Non-Union Plan
Prior to September 21, 2014, certain eligible non-union employees participated in a separate plan providing a lump-sum payout for unused days in the sick leave bank. Effective in fiscal 2014, in conjunction with the implementation of a PTO program for non-union employees, this plan was terminated and we recognized a one-time pre-tax gain of $2.5 million.
Off-Balance Sheet Arrangements
As of the date of this report, we do not participate in transactions that generate relationships with unconsolidated entities or financial partnerships, such as entities often referred to as structured finance or special purpose entities, which would have been established for the purpose of facilitating off-balance sheet arrangements or other contractual, narrow or limited purposes.
Contractual Obligations and Commercial Commitments
Our contractual obligations at October 3, 2015 are summarized as follows:
| (dollars in thousands) | ||||||||||||||||||||
| Payments due by period | ||||||||||||||||||||
| Contractual Obligations | Total | Less than 1 year |
1-3 years | 4-5 years | More than 5 years |
|||||||||||||||
| Revolver borrowings |
$ | 161,800 | $ | — | $ | 161,800 | $ | — | $ | — | ||||||||||
| Term loan borrowings |
92,500 | 10,000 | 82,500 | — | — | |||||||||||||||
| FILO loan borrowings |
20,714 | 5,874 | 14,840 | — | — | |||||||||||||||
| Operating lease obligations |
73,714 | 20,900 | 33,672 | 13,915 | 5,227 | |||||||||||||||
| Capital lease obligations |
2,097 | 409 | 844 | 844 | — | |||||||||||||||
| Other debt agreements |
1,434 | 677 | 757 | — | — | |||||||||||||||
| Projected interest on contractual obligations(1) |
25,559 | 8,039 | 17,501 | 19 | — | |||||||||||||||
|
|
||||||||||||||||||||
| Total contractual obligations |
$ | 377,818 | $ | 45,899 | $ | 311,914 | $ | 14,778 | $ | 5,227 | ||||||||||
|
|
||||||||||||||||||||
| (1) | The projected interest component on our contractual obligations was estimated based on the prevailing or contractual interest rates for the respective obligations over the period of the agreements (see Note 7 of Notes to Consolidated Financial Statements in Part II, Item 8, “Financial Statements and Supplementary Data”). |
78
Table of Contents
Our commercial commitments at October 3, 2015 are summarized as follows:
| (dollars in thousands) | ||||||||||||||||||||
| Payments due by period | ||||||||||||||||||||
| Other Commercial Commitments | Total | Less than 1 year |
1-3 years | 4-5 years | More than 5 years |
|||||||||||||||
| Lease guarantees(1) |
$ | 845 | $ | 507 | $ | 338 | $ | — | $ | — | ||||||||||
| Standby letters of credit(2) |
645 | 645 | — | — | — | |||||||||||||||
| Loan commitments |
1,600 | 1,600 | — | — | — | |||||||||||||||
|
|
||||||||||||||||||||
| Total commercial commitments |
$ | 3,090 | $ | 2,752 | $ | 338 | $ | — | $ | — | ||||||||||
|
|
||||||||||||||||||||
| (1) | We are contingently liable with respect to one lease guarantee for a Member with a commitment expiring in 2017. We believe the location underlying this lease is marketable and, accordingly, that we will be able to recover a substantial portion of the guaranteed amount in the event we are required to satisfy our obligation under the guarantee. |
| (2) | We guarantee standby letters of credit to certain beneficiaries to secure various bank, insurance and vendor obligations. We would be obligated under the standby letters of credit to the extent of any amount utilized by the beneficiaries. |
The following items have been excluded from the foregoing tables:
| · | Projected funding obligations for the Unified Cash Balance Plan and ESPPIII (zero and $3.6 million, respectively, projected through fiscal 2016); and |
| · | Long-term liabilities for asset retirement obligations ($1.7 million at October 3, 2015). |
The items above have been excluded from the foregoing tables based on the following:
| · | Projected pension funding obligations—a reasonably reliable estimate of the timing and amount of future funding obligations cannot be determined beyond fiscal 2016 due to the uncertainty and variability of actuarial assumptions upon which the determination of such amounts is dependent. |
| · | Long-term liabilities for asset retirement obligations—a reasonably reliable estimate of the timing of future asset retirements and related incurrence of expense cannot be determined. |
Obligations under our Unified Cash Balance Plan and ESPPIII are disclosed in Note 12 of Notes to Consolidated Financial Statements in Part II, Item 8, “Financial Statements and Supplementary Data.” Asset retirement obligations are included in long-term liabilities, other in the accompanying consolidated balance sheets as of October 3, 2015 and September 27, 2014.
Outstanding Debt and Other Financing Arrangements
Our notes payable and scheduled maturities are summarized as follows:
| (dollars in thousands) | ||||||||
| October 3, 2015 |
September 27, 2014 |
|||||||
| Secured revolver borrowings under credit agreements |
$ | 161,800 | $ | 151,500 | ||||
| Secured term loan borrowings under credit agreement |
92,500 | 36,119 | ||||||
| Secured FILO borrowings under credit agreement |
20,714 | — | ||||||
| Senior secured notes |
— | 48,817 | ||||||
| Obligations under capital leases |
2,097 | — | ||||||
| Other debt agreements |
1,434 | 2,095 | ||||||
|
|
||||||||
| Total notes payable |
278,545 | 238,531 | ||||||
| Less portion due within one year |
16,960 | 7,502 | ||||||
|
|
||||||||
| $ | 261,585 | $ | 231,029 | |||||
|
|
||||||||
79
Table of Contents
Secured Credit Agreements—Credit Agreement and GCC Loan Agreement
As discussed in “Credit Facilities” we are party to both the Credit Agreement and GCC Loan Agreement. Our outstanding revolver borrowings under the Credit Agreement increased to $161.8 million (Eurodollar and Base Rate Loans at a blended average rate of 1.99% per annum) at October 3, 2015 from $145.0 million (Eurodollar and Base Rate Loans at a blended average rate of 1.93% per annum) at September 27, 2014. Our outstanding term loan borrowings under the Credit Agreement were $92.5 million at October 3, 2015 (Eurodollar and Base Rate Loans at a blended average rate of 2.20% per annum) and $36.1 million (Eurodollar and Base Rate Loans at a blended average rate of 2.18% per annum) at September 27, 2014. Our outstanding FILO borrowings under the Credit Agreement were $20.7 million at October 3, 2015 (Eurodollar and Base Rate Loans at a blended average rate of 3.20% per annum) and zero at September 27, 2014. GCC had revolving loan borrowings of zero and $6.5 million, bearing an interest rate of 4.00% (3.25% prime plus 0.75% interest rate margin), outstanding at October 3, 2015 and September 27, 2014, respectively.
Senior Secured Notes
Prior to December 18, 2014, we were party to a Senior Note Agreement with the then-current Noteholders and John Hancock, acting in its capacity as collateral agent for the then-current noteholders, collectively referred to herein as the “Hancock Debt,” which originally consisted of three tranches of senior debt: $46.0 million, $40.0 million and $25.0 million with interest rates of 6.421%, 7.157% and 6.82%, respectively. On June 28, 2013, we entered into the seventh amendment (“Seventh Amendment”) to the Senior Note Agreement. Certain capitalized terms used in this description of the Seventh Amendment have the meanings given to them in the Seventh Amendment. The Seventh Amendment released the liens held by the Noteholders on certain of our real properties (the mechanized distribution center in Commerce, California and the dairy facility in Los Angeles, California), and provided for modifications to and deletions of certain financial covenants, including the deletion of a financial covenant that had been previously provided for relating to the maximum permitted Indebtedness to Consolidated EBITDAP Ratio. The released properties now are collateral security for the lenders party to the Credit Agreement. In exchange, we paid the Noteholders $50 million plus all accrued and unpaid interest on the prepayment and paid the applicable Make-Whole Amount of $9.4 million, as calculated per the Senior Note Agreement, as well as an amendment fee of 0.5% of the outstanding principal balance of the Hancock Debt after giving effect to the prepayment contemplated by the Seventh Amendment. The prepayment was applied first to the Tranche C Notes (paid in full) with the remainder applied to the Tranche B Notes. The Seventh Amendment increased the fixed interest rate, effective July 1, 2013, for the Tranche A Notes to 7.907% per annum until the January 1, 2016 maturity date. The fixed interest rate for the unpaid portion of the Tranche B Notes, effective July 1, 2013, increased to 7.171% per annum until the January 1, 2016 maturity date. At the January 1, 2016 maturity date, a balloon payment of $45.6 million was due.
On December 18, 2014, we prepaid in full the Hancock Debt. We prepaid principal and interest on the Hancock Debt in the amount of $48.5 million, and paid the applicable Make-Whole Amount of $3.0 million, as calculated per the Senior Note Agreement, in connection with the prepayment. See Item 1.01. “Entry into a Material Definitive Agreement—Amendment and Restatement of Credit Facility” of our Current Report on Form 8-K, filed on December 19, 2014, for additional information.
We had a total of zero and $48.8 million outstanding at October 3, 2015 and September 27, 2014, respectively, in Hancock Debt.
Capital Lease Agreements
During fiscal 2015, we entered into three capital lease agreements for equipment purchases. Two of the capital lease agreements bear an interest rate of 2.09% and one capital lease agreement bears an interest rate of 2.26%. The three capital lease agreements mature in fiscal 2020. At October 3, 2015, the outstanding loan balance under the three capital leases totaled $2.1 million.
Other Debt Agreements
During fiscal 2013, we entered into three secured credit facilities to finance our purchase of tractors. These agreements bear interest at a rate of 2.2% and mature in fiscal 2018. At October 3, 2015 and September 27, 2014, the outstanding loan balance under these three agreements totaled $1.4 million and $2.1 million, respectively.
80
Table of Contents
Critical Accounting Policies and Estimates
The preparation of our consolidated financial statements in conformity with accounting principles generally accepted in the United States of America requires us to make estimates, assumptions and judgments that affect the amount of assets and liabilities reported in the consolidated financial statements, the disclosure of contingent assets and liabilities as of the date of the consolidated financial statements and reported amounts of revenues and expenses during the year. We believe our estimates and assumptions to be reasonable; however, future results could differ from those estimates under different assumptions or conditions.
We believe the following discussion addresses our most critical accounting policies, which are those that are most important to the portrayal of our financial condition and results and requires management’s most difficult, subjective and complex judgments, often as a result of the need to make estimates about the effect of matters that are inherently uncertain. Our critical accounting policies and important accounting practices are described below.
Insurance Reserves. As disclosed in Note 3, “Assets Held for Sale/Discontinued Operations,” in Part II, Item 8, “Financial Statements and Supplementary Data,” our Insurance segment was sold in October 2015 and is no longer part of our continuing operations. The former insurance subsidiaries provided various types of insurance products to our Members and us, including workers’ compensation, general liability and auto. One of the former insurance subsidiaries, Springfield Insurance Company, is regulated by the California Department of Insurance and is subject to the rules and regulations promulgated by the California Department of Insurance. There are many factors that contribute to the variability in estimating insurance loss reserves and related costs. Changes in state regulations may have a direct impact on workers’ compensation cost and reserve requirements. The cost of insurance and the sufficiency of loss reserves are also impacted by actuarial estimates based on a detailed analysis of health care cost trends, claims history, demographics and industry trends. As a result, the amount of the loss reserve and the related expense is significantly affected by these variables, as well as the periodic changes in state and federal law. We regularly assessed the sufficiency of our loss reserves, which represent potential future claims and settlements to policyholders. Insurance reserves are recorded based on estimates and assumptions made by management using data available at the valuation date and are validated by third party actuaries to ensure such estimates are within acceptable ranges. We maintain appropriate reserves to cover anticipated payments up to the excess coverage amount. For additional discussion related to our accounting for insurance reserves, See Note 2, “Audit Committee Investigation,” in Part II, Item 8, “Financial Statements and Supplementary Data,” for additional information. Insurance reserves maintained by our former insurance subsidiaries and our reserve for projected payouts totaled approximately $64.5 million as of October 3, 2015 and $65.2 million as of September 27, 2014, net of anticipated reinsurance recoveries of $26.4 million and $20.4 million, respectively. These reserves are included in liabilities held for sale—current in our consolidated balance sheets at October 3, 2015 and September 27, 2014.
Revenue Recognition. We recognize revenue in accordance with U.S. GAAP and with SEC issued Staff Accounting Bulletin Topic 13, “Revenue Recognition,” which clarifies certain existing accounting principles for the timing of revenue recognition and classification of revenues in the financial statements. Revenue is recognized when persuasive evidence of an arrangement exists, delivery has occurred, the price is fixed or determinable, and collectability is reasonably assured. Revenue generated from our Wholesale Distribution segment is not recognized until title and risk of loss is transferred to the customer, which occur upon delivery of the products. Provisions for discounts, rebates to customers, and returns are provided for at the time the related sales are recorded, and are reflected as a reduction of sales. Service revenues are recognized when such services have been rendered. Taxes collected from our customers and remitted to governmental authorities are reported on a net basis.
We make available to our customers additional products through vendor direct arrangements with certain preferred providers. Revenues and costs from these vendors are recorded gross when we are the primary obligor in a transaction, are subject to inventory or credit risk, have latitude in establishing price and selecting suppliers, or have several, but not all, of these indicators. If we are not the primary obligor and amounts earned have little or no inventory or credit risk, revenue is recorded net when earned.
Allowance for Uncollectible Accounts and Notes Receivable. The preparation of our consolidated financial statements requires management to make estimates of the collectability of its accounts and notes receivable. Our trade and short-term notes receivable, net was approximately $192.3 million and $187.8 million (including approximately $4.3 million and $5.4 million of short-term notes receivable) at October 3, 2015 and September 27,
81
Table of Contents
2014, respectively. Our long-term notes receivable, net was approximately $17.5 million and $16.3 million at October 3, 2015 and September 27, 2014, respectively. We regularly analyze our accounts and notes receivable for changes in the credit-worthiness of customers, economic trends and other variables that may affect the adequacy of recorded reserves for potential bad debt. In determining the appropriate level of reserves to establish, we utilize several techniques including specific account identification, percentage of aged receivables and historical collection and write-off trends. In addition, we consider in our reserve calculations collateral such as Member shareholdings, cash deposits and personal guarantees. A bankruptcy or financial loss associated with a major customer could have a material adverse effect on our sales and operating results. Our allowance for doubtful accounts for trade and short-term notes receivable was approximately $4.2 million and $3.3 million at October 3, 2015 and September 27, 2014, respectively, and zero for long-term notes receivable at both October 3, 2015 and September 27, 2014.
Goodwill and Intangible Assets. The Merger with United and the Acquisition of AG resulted in the recording of goodwill, representing the excess of the purchase price over the fair value of the net assets of the acquired businesses. The carrying value of the goodwill was $37.8 million at both October 3, 2015 and September 27, 2014. Although the sales volume and customer base of the combined entity remains strong, significant reductions in our distribution volume in the future could potentially impair the carrying amount of goodwill, necessitating a write-down of this asset.
During fiscal 2013, the actual cost of an exit plan for one of our Seattle facilities was determined to be $1.2 million less than the amount originally accrued. The reduction of this liability was recognized along with a corresponding reduction in goodwill; as such costs were accrued as purchase accounting exit cost liabilities and included in goodwill as part of the Acquisition, which was accounted for under FASB Statement No. 141, “Business Combinations” (“FAS 141”). The guidance under FAS 141 remains applicable to us given that the Acquisition date occurred prior to the effective date of the adoption of FASB Statement No. 141(R), “Business Combinations (Revised 2007)”—(now codified in ASC 805), which we adopted in the first quarter of fiscal 2010.
We evaluate our goodwill for impairment pursuant to ASC Topic 350-20 “Intangibles—Goodwill and other—Goodwill” (“ASC Topic 350-20”) which provides that goodwill and other intangible assets with indefinite lives are not amortized but tested for impairment annually, or more frequently if circumstances indicate potential impairment. For the annual goodwill impairment test, entities have the option of first performing a qualitative assessment to test goodwill for impairment on a reporting-unit-by-reporting-unit basis. If after performing the qualitative assessment, an entity concludes that it is more likely than not that the fair value of a reporting unit is less than its carrying amount, the entity would perform the two-step goodwill impairment test described in ASC Topic 350-20. An entity that does not elect to use the qualitative analysis and proceeds directly to step one would not need to evaluate the qualitative factors as part of the annual impairment analysis. The two-step impairment test process consists of the following: (1) a reporting unit’s fair value is compared to its carrying value; if the fair value is less than its carrying value, impairment is indicated; and (2) if impairment is indicated in the first step, it is measured by comparing the implied fair value of goodwill to its carrying value at the reporting unit level. When performing a quantitative assessment, we estimate the fair value of our reporting units using a weighting of the income and market approaches. Under the income approach, we use a discounted cash flow methodology, which requires us to make significant estimates and assumptions related to forecasted revenues, gross profit margins, operating income margins, working capital cash flow, growth rates, and discount rates, among others. For the market approach, we utilize information from comparable publicly traded companies with similar operating and investment characteristics as the reporting units, to create valuation multiples that are applied to the operating performance of the reporting unit being tested, in order to obtain their respective fair values. Our estimates are based upon assumptions believed to be reasonable, but which are inherently uncertain and unpredictable. Future changes in the estimates and assumptions above could materially affect the results of our reviews for impairment of goodwill. We evaluate our goodwill for impairment at the end of the third quarter for each fiscal year. Accordingly, we tested our goodwill using a qualitative assessment and noted no impairment for the fiscal quarter ended June 27, 2015.
In addition to the annual goodwill impairment test required under ASC Topic 350-20, during fiscal 2015 and 2014, we assessed whether events or circumstances occurred that potentially indicate that the carrying amount of goodwill may not be recoverable. We concluded that there were no such events or changes in circumstances during fiscal 2015 and 2014. Consequently, no impairment charges were recorded in fiscal 2015 and 2014.
Intangible assets with indefinite lives are tested for impairment at least annually and between annual tests if events occur or circumstances change that would indicate that the value of the asset may be impaired. In
82
Table of Contents
accordance with ASU No. 2012-02, “Intangibles—Goodwill and Other (Topic 350): Testing Indefinite-Lived Intangible Assets for Impairment” (“ASU No. 2012-02”), we analyzed several qualitative factors to determine whether it was more likely than not that an indefinite-lived intangible asset was impaired as a basis for determining whether it is necessary to perform the quantitative impairment test. Impairment would be measured as the difference between the fair value of the asset and its carrying value. We concluded that there were no material events or significant changes in circumstances that led to impairment during fiscal 2015 and 2014.
Intangible assets with finite lives are tested for impairment whenever events or changes in circumstances indicate that the carrying value may not be recoverable. Cash flows expected to be generated by the related assets are estimated over the asset’s useful life based on updated projections. If the evaluation indicates that the carrying amount of the asset may not be recoverable, the potential impairment is measured based on a projected discounted cash flow model. We concluded that there were no material events or significant changes in circumstances that led to impairment during fiscal 2015 and 2014.
Long-lived Asset Groups. In accordance with ASC Topic 360-10 “Property, Plant and Equipment—Overall” (“ASC Topic 360-10”) we assess the impairment of long-lived asset groups when events or changes in circumstances indicate that the carrying value may not be recoverable. An asset group is the unit of accounting for a long-lived asset or assets to be held and used, which represents the lowest level for which identifiable cash flows are largely independent of the cash flows of other groups of assets and liabilities. Recoverability is measured by comparing the carrying amount of an asset group to expected future net cash flows generated by the asset group. If the carrying amount of an asset group exceeds its estimated future undiscounted cash flows, an impairment charge is recognized to the extent of the difference between fair value as determined by discounting cash flows at an appropriate discount rate and the carrying value. ASC Topic 360-10 requires companies to separately report discontinued operations, including components of an entity that either have been disposed of (by sale, abandonment or in a distribution to owners) or classified as held for sale. Asset groups to be disposed of are reported at the lower of the carrying amount or fair value less costs to sell.
Factors that we consider important which could individually or in combination trigger an impairment review include the following:
| · | Significant underperformance relative to expected historical or projected future operating results; |
| · | Significant changes in our business strategies, legal factors and/or negative industry or economic trend; |
| · | Significant decreases in the market price of the long-lived asset group; |
| · | Significant adverse change in the extent or manner in which a long-lived asset group is being used or in its physical condition; and |
| · | Expectation that, more likely than not, a long-lived asset group will be sold or otherwise disposed of significantly before the end of its previously estimated useful life. |
If we determine that the carrying value of long-lived asset groups may not be recoverable based upon the existence of one or more of the above indicators of impairment, we will measure any impairment based on a projected discounted cash flow method using a discount rate commensurate with the risks associated with the estimated cash flows of the asset groups.
On a quarterly basis, we assess whether events or changes in circumstances occur that potentially indicate the carrying value of long-lived asset groups may not be recoverable. We concluded that there were no material events or significant changes in circumstances that led to impairment during fiscal 2015 and 2014.
Tax Valuation Allowances. We account for income taxes in accordance with ASC Topic 740, “Income Taxes” (“ASC Topic 740”), which requires that deferred tax assets and liabilities be recognized using enacted tax rates for the effect of temporary differences between the book and tax bases of recorded assets and liabilities. ASC Topic 740 also requires that deferred tax assets be reduced by a valuation allowance if it is more likely than not that some portion or all of the net deferred tax asset will not be realized. We had approximately $40.4 million and $37.0 million in net deferred tax assets at October 3, 2015 and September 27, 2014, respectively. We evaluated the available positive and negative evidence in assessing our ability to realize the benefits of the net deferred tax assets at October 3, 2015 and September 27, 2014. As of October 3, 2015 and September 27, 2014,
83
Table of Contents
respectively, we determined that a valuation allowance of $29.3 million and $9.7 million was required to reduce the net deferred tax assets to a sustainable level. The remaining net deferred tax assets should be realized through future operating results, tax planning and the reversal of temporary differences. While we have considered future taxable income and ongoing prudent and feasible tax planning strategies in assessing the need for a valuation allowance, in the event we were to determine that we would not be able to realize all or part of our net deferred tax asset in the future, an adjustment to the deferred tax asset would be a charge to income in the period such determination was made. Of the net deferred tax assets, $9.2 million and $9.0 million are classified as current assets in deferred income taxes and $31.2 million and $28.0 million are included in other assets in the accompanying consolidated balance sheets (see Part II, Item 8, “Financial Statements and Supplementary Data”) as of October 3, 2015 and September 27, 2014, respectively.
Pension and Postretirement Benefit Plans. Our non-union employees participate in Company sponsored defined benefit pension and postretirement benefit plans. Certain eligible union employees participate in a separate plan providing payouts for unused sick leave. Officers of the Company also participate in a Company sponsored ESPPIII, which provides supplemental post-termination retirement income based on each participant’s salary and years of service as an officer of the Company. We account for these benefit plans in accordance with ASC Topic 715, “Compensation—Retirement Benefits” and ASC Topic 712, “Compensation—Nonretirement Postemployment Benefits” and ASC Topic 715-20, “Compensation—Retirement Benefits—Defined Benefits Plans—General”, which require us to make actuarial assumptions that are used to calculate the carrying value of the related assets and liabilities and the amount of expenses to be recorded in our consolidated financial statements. Assumptions include the expected return on plan assets, discount rates, projected life expectancies of plan participants, anticipated salary increases and health care cost trends. The assumptions are regularly evaluated by management in consultation with outside actuaries. While we believe the underlying assumptions are appropriate, the carrying value of the related liabilities and the amount of expenses recorded in the consolidated financial statements could differ if other assumptions are used.
Pursuant to ASC Topic 715-20, “Compensation—Retirement Benefits—Defined Benefits Plans—General” (“ASC Topic 715-20”), we (1) recognize the funded status of pension and other postretirement benefit plans on our balance sheet and (2) measure plan assets and obligations at our year-end balance sheet date.
We contribute to collectively-bargained, multiemployer defined benefit pension plans in accordance with the provisions of negotiated labor contracts. The amount of our contribution is determined according to provisions of collective bargaining agreements.
Vendor Funds. We receive funds from many of the vendors whose products we buy for resale to our Members. These vendor funds are provided to increase the sell-through of the related products. We receive funds for a variety of merchandising activities: placement of vendors’ products in the Members’ advertising; placement of vendors’ products in prominent locations in the Members’ stores; introduction of new products into our distribution system and Members’ stores; exclusivity rights in certain categories that have slower-turning products; and to compensate for temporary price reductions offered to customers on products held for sale at Members’ stores.
Vendor funds are reflected as a reduction of inventory costs or as an offset to cost incurred on behalf of the vendor for which we are being reimbursed in accordance with ASC Topic 605, “Revenue Recognition,” Amounts due from vendors upon achievement of certain milestones, such as minimum purchase volumes, are accrued prior to the achievement of the milestone if we believe it is probable the milestone will be achieved, and the amounts to be received are reasonably estimable.
We adhere to ASC Topic 605, “Revenue Recognition,” which requires manufacturers’ sales incentives offered directly to consumers that do not meet certain criteria to be reflected as a reduction of revenue in the financial statements of a reseller. Accordingly, certain discounts and allowances negotiated by us on behalf of our Members are classified as a reduction in cost of sales with a corresponding reduction in net sales. Vendor funds that offset costs incurred on behalf of the vendor are classified as a reduction in distribution, selling and administrative expenses.
Recently Adopted and Recently Issued Authoritative Accounting Guidance
See Note 1 of Notes to Consolidated Financial Statements in Part II, Item 8, “Financial Statements and Supplementary Data” for information regarding our adoption of new and recently issued authoritative accounting guidance.
84
Table of Contents
Item 7A. QUANTITATIVE AND QUALITATIVE DISCLOSURES ABOUT MARKET RISK
The following discussion of the market risks we face contains forward-looking statements. Forward-looking statements are subject to risks and uncertainties. Actual results could differ materially from those discussed in the forward-looking statements.
We are subject to interest rate changes on certain of our notes payable under our credit agreements that may affect the fair value of the notes payable, as well as cash flow and earnings. Based on the notes payable outstanding at October 3, 2015 and the current market conditions, a one percent change in the applicable interest rates would impact our annual cash flow and pretax earnings by approximately $2.8 million. See Note 18 of Notes to Consolidated Financial Statements in Part II, Item 8, “Financial Statements and Supplementary Data” for additional discussion regarding the fair value of notes payable.
We are exposed to credit risk on accounts receivable through the ordinary course of business and we perform ongoing credit evaluations. Concentration of credit risk with respect to accounts receivable is limited due to the nature of our customer base (i.e., primarily Members). We currently believe our allowance for doubtful accounts to be sufficient to cover customer credit risks.
Investments held by our Wholesale Distribution segment consist primarily of Western Family Holding Company (“Western Family”) common stock. Western Family is a private cooperative located in Oregon from which we purchase food and general merchandise products. Investments held by our other support businesses consist primarily of an investment by our wholly-owned finance subsidiary in National Consumer Cooperative Bank (“NCB”). NCB operates as a cooperative and therefore its participants are required to own its Class B common stock.
Life insurance and mutual fund assets with values tied to the equity markets are impacted by overall market conditions. In fiscal 2015, net earnings and net comprehensive earnings experienced an increase corresponding to the increase in life insurance and mutual fund assets, respectively.
85
Table of Contents
Item 8. FINANCIAL STATEMENTS AND SUPPLEMENTARY DATA
Report of Independent Registered Public Accounting Firm
To the Board of Directors and Shareholders of
Unified Grocers, Inc.:
We have audited the accompanying consolidated balance sheets of Unified Grocers, Inc. and Subsidiaries (the “Company”) as of October 3, 2015, and September 27, 2014, and the related consolidated statements of earnings (loss), comprehensive earnings (loss), shareholders’ equity, and cash flows for each of the three years in the period ended October 3, 2015. Our audits also included the financial statement schedule listed in the index at Part IV, Item 15(a)(2). These consolidated financial statements and the financial statement schedule are the responsibility of the Company’s management. Our responsibility is to express an opinion on these consolidated financial statements and financial statement schedule based on our audits.
We conducted our audits in accordance with the standards of the Public Company Accounting Oversight Board (United States). Those standards require that we plan and perform the audits to obtain reasonable assurance about whether the consolidated financial statements are free of material misstatement. The Company is not required to have, nor were we engaged to perform, an audit of its internal control over financial reporting. Our audits included consideration of internal control over financial reporting as a basis for designing audit procedures that are appropriate in the circumstances, but not for the purpose of expressing an opinion on the effectiveness of the Company’s internal control over financial reporting. Accordingly, we express no such opinion. An audit also includes examining, on a test basis, evidence supporting the amounts and disclosures in the consolidated financial statements, assessing the accounting principles used and significant estimates made by management, as well as evaluating the overall consolidated financial statement presentation. We believe that our audits provide a reasonable basis for our opinion.
In our opinion, the consolidated financial statements referred to above present fairly, in all material respects, the consolidated financial position of Unified Grocers, Inc. and Subsidiaries as of October 3, 2015, and September 27, 2014, and the consolidated results of its operations and its cash flows for each of the three years in the period ended October 3, 2015, in conformity with accounting principles generally accepted in the United States of America. Also, in our opinion, the related financial statement schedule, when considered in relation to the basic consolidated financial statements taken as a whole, presents fairly, in all material respects, the information set forth therein.
/s/ MOSS ADAMS LLP
Los Angeles, California
June 1, 2016
86
Table of Contents
Unified Grocers, Inc. and Subsidiaries
Consolidated Balance Sheets
(dollars in thousands)
| October 3, 2015 |
September 27, 2014 |
|||||||
| Assets |
||||||||
| Current Assets: |
||||||||
| Cash and cash equivalents |
$ | 3,056 | $ | 1,207 | ||||
| Accounts and current portion of notes receivable, net of allowances of $4,171 and $3,301 at October 3, 2015 and September 27, 2014, respectively |
191,744 | 187,802 | ||||||
| Inventories |
279,576 | 257,325 | ||||||
| Prepaid expenses and other current assets |
10,814 | 8,204 | ||||||
| Deferred income taxes |
9,210 | 8,971 | ||||||
| Assets held for sale – current |
125,904 | 123,729 | ||||||
|
|
||||||||
| Total current assets |
620,304 | 587,238 | ||||||
| Properties and equipment, net |
163,808 | 161,871 | ||||||
| Investments |
13,069 | 13,269 | ||||||
| Notes receivable, less current portion and net of allowances of $54 and $44 at October 3, 2015 and September 27, 2014, respectively |
17,523 | 16,296 | ||||||
| Goodwill |
37,846 | 37,846 | ||||||
| Other assets, net |
111,775 | 111,697 | ||||||
|
|
||||||||
| Total Assets |
$ | 964,325 | $ | 928,217 | ||||
|
|
||||||||
| Liabilities and Shareholders’ Equity |
||||||||
| Current Liabilities: |
||||||||
| Accounts payable |
$ | 281,478 | $ | 248,854 | ||||
| Accrued liabilities |
46,287 | 45,366 | ||||||
| Current portion of notes payable |
16,960 | 7,502 | ||||||
| Members’ deposits and declared patronage dividends |
10,175 | 11,609 | ||||||
| Liabilities held for sale – current |
99,682 | 96,350 | ||||||
|
|
||||||||
| Total current liabilities |
454,582 | 409,681 | ||||||
| Notes payable, less current portion |
261,585 | 231,029 | ||||||
| Long-term liabilities, other |
161,180 | 137,431 | ||||||
| Members’ and Non-Members’ deposits |
7,995 | 8,412 | ||||||
| Commitments and contingencies |
||||||||
| Shareholders’ equity: |
||||||||
| Class A Shares: 500,000 shares authorized, 122,500 and 129,500 shares outstanding at October 3, 2015 and September 27, 2014, respectively |
23,088 | 24,371 | ||||||
| Class B Shares: 2,000,000 shares authorized, 410,537 and 413,522 shares outstanding at October 3, 2015 and September 27, 2014, respectively |
75,198 | 75,670 | ||||||
| Class E Shares: 2,000,000 shares authorized, 205,704 and 208,513 shares outstanding at October 3, 2015 and September 27, 2014, respectively |
20,570 | 20,851 | ||||||
| Retained earnings—allocated |
25,748 | 48,340 | ||||||
| Retained earnings—non-allocated |
6,864 | 6,864 | ||||||
|
|
||||||||
| Total retained earnings |
32,612 | 55,204 | ||||||
| Receivable from sale of Class A Shares to Members |
(255 | ) | (383 | ) | ||||
| Accumulated other comprehensive loss |
(72,230 | ) | (34,049 | ) | ||||
|
|
||||||||
| Total shareholders’ equity |
78,983 | 141,664 | ||||||
|
|
||||||||
| Total Liabilities and Shareholders’ Equity |
$ | 964,325 | $ | 928,217 | ||||
|
|
||||||||
The accompanying notes are an integral part of these statements.
87
Table of Contents
Unified Grocers, Inc. and Subsidiaries
Consolidated Statements of Earnings (Loss)
(dollars in thousands)
| Fiscal Years Ended | ||||||||||||
| October 3, (53 weeks) |
September 27, (52 weeks) |
September 28, (52 weeks) |
||||||||||
| Net sales (gross billings including vendor direct arrangements were $4,144,641, $3,865,966 and $3,723,601 for fiscal years fiscal years ended October 3, 2015, September 27, 2014 and September 28, 2013, respectively) |
$ | 4,027,620 | $ | 3,753,560 | $ | 3,672,459 | ||||||
| Cost of sales |
3,744,335 | 3,466,897 | 3,383,190 | |||||||||
| Distribution, selling and administrative expenses |
281,469 | 264,988 | 277,063 | |||||||||
|
|
||||||||||||
| Operating income |
1,816 | 21,675 | 12,206 | |||||||||
| Interest expense |
(9,978 | ) | (11,197 | ) | (12,788 | ) | ||||||
| Loss on early extinguishment of debt |
(3,200 | ) | — | (9,788 | ) | |||||||
|
|
||||||||||||
| (Loss) earnings before patronage dividends and income taxes |
(11,362 | ) | 10,478 | (10,370 | ) | |||||||
| Patronage dividends |
(7,234 | ) | (9,395 | ) | (9,609 | ) | ||||||
|
|
||||||||||||
| (Loss) earnings before income taxes |
(18,596 | ) | 1,083 | (19,979 | ) | |||||||
| Income tax benefit (provision) |
3,951 | (1,508 | ) | 7,495 | ||||||||
|
|
||||||||||||
| Net loss from continuing operations |
(14,645 | ) | (425 | ) | (12,484 | ) | ||||||
|
|
||||||||||||
| Discontinued operations: |
||||||||||||
| Loss from discontinued operations, net of income tax benefit of $0, $2,914 and $2,587 for fiscal years ended October 3, 2015, September 27, 2014 and September 28, 2013, respectively |
(3,701 | ) | (4,981 | ) | (5,160 | ) | ||||||
| Loss on pending sale of discontinued operations |
(3,173 | ) | — | — | ||||||||
|
|
||||||||||||
| Net loss from discontinued operations |
(6,874 | ) | (4,981 | ) | (5,160 | ) | ||||||
|
|
||||||||||||
| Net loss |
$ | (21,519 | ) | $ | (5,406 | ) | $ | (17,644 | ) | |||
|
|
||||||||||||
The accompanying notes are an integral part of these statements.
88
Table of Contents
Unified Grocers, Inc. and Subsidiaries
Consolidated Statements of Comprehensive Earnings (Loss)
(dollars in thousands)
| Fiscal Years Ended | ||||||||||||
| October 3, (53 weeks) |
September 27, (52 weeks) |
September 28, (52 weeks) |
||||||||||
| Net loss |
$ | (21,519 | ) | $ | (5,406 | ) | $ | (17,644 | ) | |||
|
|
||||||||||||
| Other comprehensive (loss) earnings, net of income taxes: |
||||||||||||
| Unrealized net holding (loss) gain on investments, net of income tax benefit of $(364), $(189) and $(608) for fiscal years ended October 3, 2015, September 27, 2014 and September 28, 2013, respectively |
(683 | ) | (351 | ) | (1,155 | ) | ||||||
| Defined benefit pension plans and other postretirement benefit plans: Unrecognized prior service credits and gains arising during the period, and accelerated recognition of existing unrecognized prior service credit and unrecognized gains and losses, as a result of curtailment, net of income tax (benefit) expense of $(13,157), $(8,357) and $25,812 for fiscal years ended October 3, 2015, September 27, 2014 and September 28, 2013, respectively |
(24,087 | ) | (15,242 | ) | 49,028 | |||||||
| Deferred tax asset valuation allowance allocated to defined benefit pension plans and other postretirement benefit plans |
(13,411 | ) | (6,176 | ) | — | |||||||
|
|
||||||||||||
| Comprehensive (loss) earnings |
$ | (59,700 | ) | $ | (27,175 | ) | $ | 30,229 | ||||
|
|
||||||||||||
The accompanying notes are an integral part of these statements.
89
Table of Contents
Unified Grocers, Inc. and Subsidiaries
Consolidated Statements of Shareholders’ Equity
(dollars in thousands)
| For the fiscal years ended October 3,
2015, September 27, 2014 and September 28, 2013 |
Class A | Class B | Class E | Retained Earnings |
Receivable from sale of Class A Shares |
Accumulated Other Comprehensive Earnings (Loss) |
Total | |||||||||||||||||||||||||||||||||
| Shares | Amount | Shares | Amount | Shares | Amount | |||||||||||||||||||||||||||||||||||
| Balance, September 29, 2012 |
149,450 | 27,922 | 434,598 | 78,411 | 251,808 | 25,181 | 84,229 | (661 | ) | (60,153 | ) | 154,929 | ||||||||||||||||||||||||||||
| Class A Shares issued |
350 | 111 | 111 | |||||||||||||||||||||||||||||||||||||
| Class A Shares redeemed |
(11,900 | ) | (2,275 | ) | (1,478 | ) | (3,753 | ) | ||||||||||||||||||||||||||||||||
| Class A Shares converted to Class B Shares |
(350 | ) | (86 | ) | 350 | 86 | — | |||||||||||||||||||||||||||||||||
| Class B Shares issued |
5,656 | 1,633 | 1,633 | |||||||||||||||||||||||||||||||||||||
| Class B Shares redeemed |
(9,567 | ) | (1,576 | ) | (1,338 | ) | (2,914 | ) | ||||||||||||||||||||||||||||||||
| Class E Shares repurchased |
(405 | ) | (41 | ) | 4 | (37 | ) | |||||||||||||||||||||||||||||||||
| Net loss – allocated |
(17,644 | ) | (17,644 | ) | ||||||||||||||||||||||||||||||||||||
| Decrease in receivable due to payment for Class A Shares by members |
448 | 448 | ||||||||||||||||||||||||||||||||||||||
| Net unrealized loss on depreciation of investments (net of deferred tax asset of $608) |
(1,155 | ) | (1,155 | ) | ||||||||||||||||||||||||||||||||||||
| Defined benefit pension plans and other postretirement benefit plans: Net unrecognized prior service credit, and accelerated recognition of existing unrecognized prior service credit and unrecognized gains and losses, as a result of curtailment and gains (losses) arising during period (net of deferred tax liability of $25,812) |
49,028 | 49,028 | ||||||||||||||||||||||||||||||||||||||
|
|
||||||||||||||||||||||||||||||||||||||||
| Balance, September 28, 2013 |
137,550 | 25,672 | 431,037 | 78,554 | 251,403 | 25,140 | 63,773 | (213 | ) | (12,280 | ) | 180,646 | ||||||||||||||||||||||||||||
| Class A Shares issued |
1,400 | 391 | 391 | |||||||||||||||||||||||||||||||||||||
| Class A Shares redeemed |
(9,800 | ) | (1,748 | ) | (1,017 | ) | (2,765 | ) | ||||||||||||||||||||||||||||||||
| Class B Shares converted to Class A Shares |
350 | 56 | (350 | ) | (56 | ) | — | |||||||||||||||||||||||||||||||||
| Class B Shares issued |
2,102 | 587 | 587 | |||||||||||||||||||||||||||||||||||||
| Class B Shares redeemed |
(19,267 | ) | (3,415 | ) | (2,146 | ) | (5,561 | ) | ||||||||||||||||||||||||||||||||
| Class E Shares repurchased |
(42,890 | ) | (4,289 | ) | — | (4,289 | ) | |||||||||||||||||||||||||||||||||
| Net loss – allocated |
(5,406 | ) | (5,406 | ) | ||||||||||||||||||||||||||||||||||||
| Increase in receivable due to subscription for Class A Shares by members |
(170 | ) | (170 | ) | ||||||||||||||||||||||||||||||||||||
| Net unrealized loss on depreciation of investments (net of deferred tax asset of $189) |
(351 | ) | (351 | ) | ||||||||||||||||||||||||||||||||||||
| Defined benefit pension plans and other postretirement benefit plans: Changes in unrecognized prior service costs (credits) arising during the period, and changes in unrecognized gains and losses arising during the period (net of deferred tax asset of $8,357) |
(15,242 | ) | (15,242 | ) | ||||||||||||||||||||||||||||||||||||
| Deferred tax asset valuation allowance allocated to defined benefit pension plans and other postretirement benefit plans |
(6,176 | ) | (6,176 | ) | ||||||||||||||||||||||||||||||||||||
|
|
||||||||||||||||||||||||||||||||||||||||
| Balance, September 27, 2014 |
129,500 | $ | 24,371 | 413,522 | $ | 75,670 | 208,513 | $ | 20,851 | $ | 55,204 | $ | (383 | ) | $ | (34,049 | ) | $ | 141,664 | |||||||||||||||||||||
| Class A Shares issued |
— | — | — | |||||||||||||||||||||||||||||||||||||
| Class A Shares redeemed |
(7,000 | ) | (1,283 | ) | (673 | ) | (1,956 | ) | ||||||||||||||||||||||||||||||||
| Class B Shares converted to Class A Shares |
— | — | — | — | — | |||||||||||||||||||||||||||||||||||
| Class B Shares issued |
— | — | — | |||||||||||||||||||||||||||||||||||||
| Class B Shares redeemed |
(2,985 | ) | (472 | ) | (400 | ) | (872 | ) | ||||||||||||||||||||||||||||||||
| Class E Shares repurchased |
(2,809 | ) | (281 | ) | — | (281 | ) | |||||||||||||||||||||||||||||||||
| Net loss – allocated |
(21,519 | ) | (21,519 | ) | ||||||||||||||||||||||||||||||||||||
| Decrease in receivable due to payment for Class A Shares by members |
128 | 128 | ||||||||||||||||||||||||||||||||||||||
| Net unrealized loss on depreciation of investments (net of deferred tax asset of $364) |
(683 | ) | (683 | ) | ||||||||||||||||||||||||||||||||||||
| Defined benefit pension plans and other postretirement benefit plans: Changes in unrecognized prior service costs (credits) arising during the period, and changes in unrecognized gains and losses arising during the period (net of deferred tax asset of $13,157) |
(24,087 | ) | (24,087 | ) | ||||||||||||||||||||||||||||||||||||
| Deferred tax asset valuation allowance allocated to defined benefit pension plans and other postretirement benefit plans |
(13,411 | ) | (13,411 | ) | ||||||||||||||||||||||||||||||||||||
|
|
||||||||||||||||||||||||||||||||||||||||
| Balance, October 3, 2015 |
122,500 | $ | 23,088 | 410,537 | $ | 75,198 | 205,704 | $ | 20,570 | $ | 32,612 | $ | (255 | ) | $ | (72,230 | ) | $ | 78,983 | |||||||||||||||||||||
|
|
||||||||||||||||||||||||||||||||||||||||
The accompanying notes are an integral part of these statements.
90
Table of Contents
Unified Grocers, Inc. and Subsidiaries
Consolidated Statements of Cash Flows
(dollars in thousands)
| Fiscal Years Ended | ||||||||||||
| October 3, (53 weeks) |
September 27, (52 weeks) |
September 28, (52 weeks) |
||||||||||
| Cash flows from operating activities: |
||||||||||||
| Net loss |
$ | (21,519 | ) | $ | (5,406 | ) | $ | (17,644 | ) | |||
| Less: Net loss from discontinued operations |
(3,701 | ) | (4,981 | ) | (5,160 | ) | ||||||
| Less: Loss on pending sale of discontinued operations |
(3,173 | ) | — | — | ||||||||
|
|
||||||||||||
| Net loss from continuing operations |
(14,645 | ) | (425 | ) | (12,484 | ) | ||||||
| Adjustments to reconcile net (loss) earnings to net cash provided by operating activities: |
||||||||||||
| Depreciation and amortization |
31,041 | 27,850 | 25,186 | |||||||||
| Provision for doubtful accounts |
1,942 | 207 | 1,268 | |||||||||
| (Gain) loss on sale of properties and equipment |
(192 | ) | (104 | ) | 596 | |||||||
| Gain on curtailment of other postretirement benefit plans |
— | — | (2,685 | ) | ||||||||
| Loss on early extinguishment of debt |
3,200 | — | 9,788 | |||||||||
| Deferred income taxes |
(3,719 | ) | 6,413 | (8,951 | ) | |||||||
| Pension contributions |
— | (8,378 | ) | (7,355 | ) | |||||||
| (Increase) decrease in assets: |
||||||||||||
| Accounts receivable |
(12,204 | ) | (15,936 | ) | (1,623 | ) | ||||||
| Inventories |
(22,251 | ) | (6,082 | ) | (3,976 | ) | ||||||
| Prepaid expenses and other current assets |
(2,503 | ) | 2,682 | 493 | ||||||||
| Increase (decrease) in liabilities: |
||||||||||||
| Accounts payable |
35,760 | 25,363 | 1,982 | |||||||||
| Accrued liabilities |
(1,929 | ) | 2,305 | (4,209 | ) | |||||||
| Long-term liabilities, other |
(13,483 | ) | (7,956 | ) | 4,021 | |||||||
|
|
||||||||||||
| Net cash provided by continuing operating activities |
1,017 | 25,939 | 2,051 | |||||||||
| Net cash utilized for pending sale of discontinued operations |
(3,173 | ) | — | — | ||||||||
|
|
||||||||||||
| Net cash (utilized) provided by continuing operating activities |
(2,156 | ) | 25,939 | 2,051 | ||||||||
| Net cash provided by discontinued operating activities |
5,820 | 7,924 | 2,711 | |||||||||
|
|
||||||||||||
| Net cash provided by operating activities |
3,664 | 33,863 | 4,762 | |||||||||
|
|
||||||||||||
| Cash flows from investing activities: |
||||||||||||
| Purchases of properties and equipment |
(9,221 | ) | (9,938 | ) | (10,194 | ) | ||||||
| Purchases of securities and other investments |
(10,000 | ) | — | — | ||||||||
| Proceeds from maturities or sales of securities and other investments |
200 | — | — | |||||||||
| Origination of notes receivable |
(1,973 | ) | (1,138 | ) | (7,982 | ) | ||||||
| Collection of notes receivable |
4,424 | 5,100 | 4,486 | |||||||||
| Proceeds from sales of properties and equipment |
192 | 112 | 315 | |||||||||
| Increase in other assets |
(7,663 | ) | (10,457 | ) | (12,766 | ) | ||||||
|
|
||||||||||||
| Net cash utilized by continuing investing activities |
(24,041 | ) | (16,321 | ) | (26,141 | ) | ||||||
| Net cash utilized by discontinued investing activities |
(4,488 | ) | (8,238 | ) | (3,843 | ) | ||||||
|
|
||||||||||||
| Net cash utilized by investing activities |
(28,529 | ) | (24,559 | ) | (29,984 | ) | ||||||
|
|
||||||||||||
| Cash flows from financing activities: |
||||||||||||
| Net revolver (repayments) borrowings under secured credit agreements |
10,300 | 3,000 | 53,000 | |||||||||
| Borrowings of notes payable |
86,262 | — | 44,209 | |||||||||
| Repayments of notes payable |
(58,678 | ) | (7,287 | ) | (54,753 | ) | ||||||
| Payment of deferred financing fees |
(1,983 | ) | (341 | ) | (3,207 | ) | ||||||
91
Table of Contents
Unified Grocers, Inc. and Subsidiaries
Consolidated Statements of Cash Flows (Continued)
(dollars in thousands)
| Fiscal Years Ended | ||||||||||||
| October 3, (53 weeks) |
September 27, (52 weeks) |
September 28, (52 weeks) |
||||||||||
| Payment of debt extinguishment costs |
(3,023 | ) | — | (9,608 | ) | |||||||
| Decrease in Members’ deposits and declared patronage dividends |
(1,434 | ) | (83 | ) | (417 | ) | ||||||
| (Decrease) increase in Members’ and Non-Members’ deposits |
(417 | ) | 2,623 | (1,686 | ) | |||||||
| Decrease (increase) in receivable from sale of Class A Shares to Members, net |
128 | (170 | ) | 448 | ||||||||
| Repurchase of shares from Members |
(3,109 | ) | (8,694 | ) | (6,704 | ) | ||||||
| Issuance of shares to Members |
— | 978 | 1,744 | |||||||||
|
|
||||||||||||
| Net cash provided (utilized) by continuing financing activities |
28,046 | (9,974 | ) | 23,026 | ||||||||
| Net cash utilized by discontinued financing activities |
— | — | — | |||||||||
|
|
||||||||||||
| Net cash provided (utilized) by financing activities |
28,046 | (9,974 | ) | 23,026 | ||||||||
|
|
||||||||||||
| Net increase (decrease) in cash and cash equivalents from continuing operations |
1,849 | (356 | ) | (1,064 | ) | |||||||
| Cash and cash equivalents at beginning of year |
1,207 | 1,563 | 2,627 | |||||||||
|
|
||||||||||||
| Cash and cash equivalents at end of year |
$ | 3,056 | $ | 1,207 | $ | 1,563 | ||||||
|
|
||||||||||||
| Supplemental disclosure of cash flow information: |
||||||||||||
| Interest paid during the year |
$ | 8,538 | $ | 10,317 | $ | 11,171 | ||||||
| Income taxes paid during the year |
$ | 114 | $ | 213 | $ | 9 | ||||||
|
|
||||||||||||
| Supplemental disclosure of non-cash items: |
||||||||||||
| Capital leases |
$ | 2,130 | $ | — | $ | — | ||||||
| Write-down of exit cost liability associated with acquisition of Associated Grocers, Inc. |
$ | — | $ | — | $ | 1,151 | ||||||
| Write-off of unamortized deferred financing fees due to debt extinguishment |
$ | 177 | $ | — | $ | 180 | ||||||
| Conversion of Class A Shares to Class B Shares |
$ | — | $ | — | $ | 86 | ||||||
| Conversion of Class B Shares to Class A Shares |
$ | $ | 57 | $ | — | |||||||
| Assets received, net of liabilities assumed, from conversion of receivables |
$ | $ | 3,920 | $ | — | |||||||
| Shares redeemed for settlement of receivables |
$ | $ | (3,920 | ) | $ | — | ||||||
|
|
||||||||||||
The accompanying notes are an integral part of these statements.
92
Table of Contents
Notes to Consolidated Financial Statements
Fiscal Years Ended October 3, 2015, September 27, 2014 and September 28, 2013
1. Basis of Presentation and Summary of Significant Accounting Policies
Nature of Business. Unified Grocers, Inc. (“Unified” or the “Company”) is a retailer-owned, grocery wholesale cooperative serving supermarket, specialty and convenience store operators located primarily in the western United States and the Pacific Rim. The Company’s customers range in size from single store operators to regional supermarket chains. The Company sells a wide variety of products typically found in supermarkets. The Company’s customers include its owners (“Members”) and non-owners (“Non-Members”). The Company sells products through Unified or through its specialty food division (Market Centre) and international sales subsidiary (Unified International, Inc.). The Company reports all product sales in its Wholesale Distribution segment. The Company also provides support services to its customers through the Wholesale Distribution segment, including promotional planning, retail technology, equipment purchasing services and real estate services, and through separate subsidiaries, including insurance (until the sale of the Insurance segment on October 7, 2015) and financing. Insurance activities are reported in Unified’s discontinued operations, while finance activities are grouped within Unified’s All Other business activities. The availability of specific products and services may vary by geographic region. Members affiliated with directors of the Company purchase groceries and related products and services from the Company in the ordinary course of business pursuant to published terms or according to the provisions of individually negotiated supply agreements.
Principles of Consolidation. The consolidated financial statements include the accounts of the Company and all of its subsidiaries required to be consolidated in accordance with accounting principles generally accepted in the United States of America (“U.S. GAAP”) as established by the Financial Accounting Standards Board (“FASB”). Intercompany accounts and transactions between the consolidated companies have been eliminated in consolidation.
Investments in companies in which Unified has significant influence, or ownership between 20% and 50% of the investee, are accounted for using the equity method. Under the equity method, the investment is originally recorded at cost and adjusted to recognize the Company’s share of net earnings or losses of the investee. The adjustment is limited to the extent of the Company’s investment in and advances to the investee and financial guarantees made on behalf of the investee.
Fiscal Year End. The Company’s fiscal year ends on the Saturday nearest September 30. Fiscal 2015 is comprised of 53 weeks, while 2014 and 2013 each were comprised of 52 weeks.
Use of Estimates. The preparation of the financial statements in accordance with U.S. GAAP requires management to make estimates and assumptions that affect the amounts reported in the consolidated financial statements and accompanying notes. On an ongoing basis, management evaluates its estimates. These estimates are based on historical experience and on various other factors that management believes to be reasonable under the circumstances, the results of which form the basis for making judgments about the carrying value of assets and liabilities that are not readily apparent from other sources. Actual results could differ from those estimates. These estimates and assumptions include, but are not limited to, assessing the following: the recoverability of accounts and notes receivable, investments, goodwill and other intangible assets, and deferred tax assets; the benefits related to uncertain tax positions; assumptions related to pension and other postretirement benefit expenses; and estimated losses related to insurance claims.
Cash Equivalents. The Company considers all highly liquid debt investments with maturities of three months or less when purchased to be cash equivalents.
The Company’s banking arrangements allow the Company to fund outstanding checks when presented for payment to the financial institutions utilized by the Company for disbursements. This cash management practice frequently results in total issued checks exceeding available cash balances at a single financial institution. The Company’s policy is to record its cash disbursement accounts with a cash book overdraft in accounts payable. At October 3, 2015 and September 27, 2014, the Company had book overdrafts of $88.1 million and $82.4 million, respectively, classified in accounts payable and included in cash provided by operating activities.
93
Table of Contents
Inventories. Inventories are valued at the lower of cost or market. Cost is determined on the first-in, first-out method. Inventory is primarily comprised of products available for sale.
Depreciation. Depreciation is computed using the straight-line method over the estimated useful lives of the assets, which range from 2 to 40 years as follows: buildings (10 – 40 years), computer equipment and software (3 – 4 years), machinery and equipment (2 – 10 years) and furniture and fixtures (5 – 10 years). Leasehold improvements and equipment under capital leases are amortized on a straight-line basis over the shorter of the remaining lease term or their estimated useful lives. Expenditures for replacements or major improvements are capitalized; expenditures for normal maintenance and repairs are charged to operations as incurred. Upon the sale or retirement of properties, the cost and accumulated depreciation are removed from the accounts, and any gain or loss is included in the results of operations.
Investments. Investments in equity securities and other fixed maturity securities are classified as investments available for sale. Unrealized gains and losses, net of taxes, on available for sale investments are recorded as a separate component of accumulated other comprehensive earnings (loss) unless impairment is determined to be other-than-temporary.
Equity securities that do not have readily determinable fair values are accounted for using the cost or equity methods of accounting. The Company reviews the carrying value of its cost and equity method investments for impairment each reporting period unless (i) the investment’s fair value has not been estimated for any purpose, including estimates of fair value used to satisfy other financial reporting requirements, and (ii) there are no impairment indicators present for the investment during the period under review which would indicate there has been an event or change in circumstances that could have a negative effect on the investment’s fair value.
When an impairment test demonstrates that the fair value of an investment is less than its carrying value, the Company’s management will determine whether the impairment is either temporary or other-than-temporary. Examples of factors which may be indicative of an other-than-temporary impairment include (i) the length of time and extent to which market value has been less than cost, (ii) the financial condition and near-term prospects of the issuer, and (iii) the intent and ability of the Company to retain its investment in the issuer for a period of time sufficient to allow for any anticipated recovery in market value.
If the decline in fair value is determined by management to be other-than-temporary, the carrying value of the investment is written down to its estimated fair value as of the balance sheet date of the reporting period in which the assessment is made. This fair value becomes the investment’s new carrying value, which is not changed for subsequent recoveries in fair value. Any recorded impairment write-down will be included in earnings as a realized loss in the period such write-down occurs.
Fair Value Measurements. The Company evaluates the fair value of its assets and liabilities in accordance with Accounting Standards Codification (“ASC”) Topic 820, “Fair Value Measurements and Disclosures” (“ASC Topic 820”) and ASC Topic 825, “Financial Instruments” (“ASC Topic 825”).
Management has evaluated its assets and liabilities valued at fair value as follows:
| · | Level 1 – Quoted prices (unadjusted) in active markets for identical assets or liabilities. |
| · | Level 2 – Inputs other than quoted prices included in Level 1 that are either directly or indirectly observable. These inputs include quoted prices for similar assets or liabilities other than quoted prices in Level 1, quoted prices in markets that are not active, or other inputs that are observable or can be derived principally from or corroborated by observable market data for substantially the full term of the assets or liabilities. |
| · | Level 3 – Unobservable inputs in which little or no market activity exists, therefore requiring an entity to develop its own assumptions about the assumptions that market participants would use in pricing. |
The Company records marketable securities at fair value in accordance with ASC Topic 320, “Investments—Debt and Equity Securities.” These assets are held by the Company’s Insurance segment. The Company’s Wholesale Distribution segment holds insurance contracts and mutual funds valued at fair value in support of certain employee benefits.
94
Table of Contents
See Note 18 “Fair Value of Financial Instruments”for further information.
Goodwill and Intangible Assets. Goodwill, arising from business combinations, represents the excess of the purchase price over the estimated fair value of net assets acquired. In accordance with the provisions of ASC Topic 350-20 “Intangibles—Goodwill and other—Goodwill” (“ASC Topic 350-20”), goodwill and intangible assets deemed to have indefinite lives are not amortized but are subject to annual impairment tests. Other intangible assets are amortized over their estimated useful lives. ASC Topic 350-20 requires that goodwill and certain intangible assets be assessed for impairment on an annual basis and between annual tests, when circumstances or events have occurred that may indicate a potential impairment, using fair value measurement techniques. For purposes of financial reporting and impairment testing in accordance with ASC Topic 350-20, the Company operates in two principal reporting segments, Wholesale Distribution and Insurance.
For the annual goodwill impairment test, entities have the option of first performing a qualitative assessment to test goodwill for impairment on a reporting-unit-by reporting-unit basis. If after performing the qualitative assessment, an entity concludes that it is more likely than not that the fair value of a reporting unit is less than its carrying amount, the entity would perform the two-step goodwill impairment test described in ASC Topic 350. An entity that does not elect to use the qualitative analysis and proceeds directly to step one would not need to evaluate the qualitative factors as part of the annual impairment analysis.
The two-step impairment test process consists of the following: In the first step, the estimated fair value of each reporting unit is compared to the carrying value of the respective reporting unit. If the estimated fair value exceeds the carrying value, the goodwill is considered not to be impaired and no additional steps are necessary. If the carrying value exceeds the estimated fair value, the second step of the impairment test is performed to determine the amount of impairment loss. The second step involves comparing the carrying amount of the reporting unit’s goodwill with its implied fair value. If the carrying amount of goodwill exceeds the respective reporting unit’s implied fair value, an impairment loss would be recognized in an amount equal to the excess.
The Company evaluates goodwill (reported entirely within the Wholesale Distribution segment) for impairment at the end of the third quarter of each fiscal year. In addition to the annual goodwill impairment test required under ASC Topic 350-20, during fiscal 2015 and 2014, the Company assessed whether events or circumstances occurred that potentially indicate that the carrying amount of goodwill and intangible assets may not be recoverable. The Company concluded that there were no such events or changes in circumstances during fiscal 2015 and 2014. Consequently, no impairment charges were recorded in fiscal 2015 and 2014.
On September 30, 2007, the Company completed the purchase of certain assets and assumed certain liabilities and obligations related to the operation of Associated Grocers, Incorporated (“AG”) and its subsidiaries of Seattle, Washington (the “AG Acquisition”). The Company estimated costs incurred to exit facilities acquired as part of the AG Acquisition, and such costs were accrued as purchase accounting exit cost liabilities and included in goodwill as part of the AG Acquisition, which was accounted for under FASB Statement No. 141, “Business Combinations” (“FAS 141”). The guidance under FAS 141 remains applicable to the Company given that the AG Acquisition date occurred prior to the effective date of the adoption of FASB Statement No. 141(R), “Business Combinations (Revised 2007)”—(now codified in ASC 805), which was adopted by the Company in the first quarter of fiscal 2010. During fiscal 2013, the actual cost of the exit plan for one of the Seattle facilities was determined to be $1.2 million less than the amount originally accrued, and the reduction in the exit cost liability was recognized with a corresponding reduction in goodwill.
Intangible assets, excluding goodwill, are included in other assets in the consolidated balance sheets. Intangible assets, other than goodwill and trademarks, are recorded at cost, less accumulated amortization. Amortization of intangible assets with finite lives is provided over their estimated useful lives ranging from 3 to 144 months on a
95
Table of Contents
straight-line or accelerated basis. As of October 3, 2015 and September 27, 2014, balances of intangible assets with finite lives, net of accumulated amortization, goodwill and trademarks were as follows:
| (dollars in thousands) | ||||||||||||||||
| October 3, 2015 | Remaining Amortization Period |
Historical Cost |
Accumulated Amortization |
Net | ||||||||||||
| Intangible assets subject to amortization: |
||||||||||||||||
| Customer contracts |
3-91 months | $ | 28,236 | $ | 19,731 | $ | 8,505 | |||||||||
| Customer relationships |
144 months | 7,180 | 4,526 | 2,654 | ||||||||||||
| Label redesign costs |
52-60 months | 1,836 | 235 | 1,601 | ||||||||||||
| Goodwill and Intangible assets not subject to amortization: |
||||||||||||||||
| Goodwill |
$ | 37,846 | ||||||||||||||
| Trademarks |
3,010 | |||||||||||||||
|
(dollars in thousands) |
||||||||||||||||
| September 27, 2014 | Remaining Amortization Period |
Historical Cost |
Accumulated Amortization |
Net | ||||||||||||
| Intangible assets subject to amortization: |
||||||||||||||||
| Customer contracts |
3-81 months | $ | 23,500 | $ | 12,173 | $ | 11,327 | |||||||||
| Customer relationships |
156 months | 7,180 | 4,080 | 3,100 | ||||||||||||
| Label redesign costs |
60 months | 469 | — | 469 | ||||||||||||
| Goodwill and Intangible assets not subject to amortization: |
||||||||||||||||
| Goodwill |
$ | 37,846 | ||||||||||||||
| Trademarks |
3,010 | |||||||||||||||
Amortization expense for other intangible assets was $10.6 million, $7.6 million and $5.4 million for the fiscal years ended October 3, 2015, September 27, 2014 and September 28, 2013, respectively. Amortization expense for other intangible assets is estimated to be $5.7 million in fiscal 2016, $2.2 million in fiscal 2017, $1.4 million in fiscal 2018, $1.4 million in fiscal 2019, $0.9 million in fiscal 2020 and $1.2 million thereafter.
Capitalized Software Costs. The Company capitalizes costs associated with the development of software for internal use pursuant to ASC Topic 350-40 “Intangibles—Goodwill and Other—Internal use software” and amortizes the costs over a 3 to 5-year period. These costs were $12.4 million and $10.7 million (net of accumulated amortization of $56.8 million and $51.9 million) at October 3, 2015 and September 27, 2014, respectively, and are included in other assets in the consolidated balance sheets. Costs incurred in planning, training and post-implementation activities are expensed as incurred.
Long-Lived Asset Groups. The Company reviews long-lived asset groups for impairment whenever events or changes in circumstances indicate that the carrying amount of an asset may not be recoverable. An asset group is the unit of accounting for a long-lived asset or assets to be held and used, which represents the lowest level for which identifiable cash flows are largely independent of the cash flows of other groups of assets and liabilities. Recoverability of asset groups to be held and used is measured by a comparison of the carrying amount of an asset group to expected future cash flows generated by the asset group. If the carrying amount of an asset group exceeds its estimated undiscounted future cash flows, the carrying amount is compared to fair value and an impairment charge is recognized to the extent of the difference. On a quarterly basis, the Company assesses whether events or changes in circumstances have occurred that potentially indicate the carrying amount of long-lived asset groups may not be recoverable. The Company concluded that there were no material events or significant changes in circumstances that led to impairment during fiscal 2015 and 2014.
Lease and Loan Guarantees. The Company evaluates lease and loan guarantees pursuant to ASC Topic 460 “Guarantees” (“ASC Topic 460”). Guarantees meeting the characteristics described in the interpretation are initially recorded at fair value. The Company is contingently liable for certain leases guaranteed for certain Members (See Notes 9 and 20).
Income Taxes. Unified operates primarily as a grocery wholesaler serving independent supermarket operators. In addition, the Company has several wholly-owned subsidiaries providing support services to its customers. These services are provided on a non-patronage basis and any earnings from these activities are taxable. In addition, the
96
Table of Contents
Company conducts wholesale business with Non-Member customers on a non-patronage basis and such earnings are retained by the Company and are taxable. The earnings of the Company’s subsidiaries and the business conducted with Non-Member customers are collectively referred to as “Non-Patronage Business.” Otherwise, the Company principally operates as a non-exempt cooperative owned by the Members for income tax purposes. Earnings from business (other than Non-Patronage Business) conducted with its Members are distributed to its Members in the form of patronage dividends. This allows the Company to deduct, for federal and certain state income tax purposes, the patronage dividends paid to Members made in the form of qualified written notices of allocation based on their proportionate share of business done with the cooperative.
Income taxes are accounted for under the asset and liability method. Deferred tax assets and liabilities are recognized for the future tax consequences attributable to differences between the financial statement carrying amounts of existing assets and liabilities and their respective tax bases and operating loss and tax credit carry-forwards. Deferred tax assets and liabilities are measured using enacted tax rates expected to apply to taxable income in the years in which those temporary differences are expected to be recovered or settled. The Company’s ability to realize the deferred tax asset is assessed throughout the year and a valuation allowance is established accordingly.
Revenue Recognition. The Company recognizes revenue in accordance with U.S. GAAP and with Securities and Exchange Commission (“SEC”) issued Staff Accounting Bulletin Topic 13, “Revenue Recognition,” which clarifies certain existing accounting principles for the timing of revenue recognition and classification of revenues in the financial statements. Revenue is recognized when persuasive evidence of an arrangement exists, delivery has occurred, the price is fixed or determinable, and collectability is reasonably assured. Revenue generated from the Company’s Wholesale Distribution segment is not recognized until title and risk of loss is transferred to the customer, which occur upon delivery of the products. Provisions for discounts, rebates to customers, and returns are provided for at the time the related sales are recorded, and are reflected as a reduction of sales. Service revenues are recognized when such services have been rendered. Taxes collected from customers and remitted to governmental authorities are reported on a net basis.
We make available to our customers additional products through vendor direct arrangements with certain preferred providers. Revenues and costs from these vendors are recorded gross when the Company is the primary obligor in a transaction, is subject to inventory or credit risk, has latitude in establishing price and selecting suppliers, or has several, but not all of these indicators. If the Company is not the primary obligor and amounts earned have little or no inventory or credit risk, revenue is recorded net when earned.
The Company’s vendor direct arrangements (recorded net) totaled $117.0 million, $112.4 million and $51.1 million for the years ended October 3, 2015, September 27, 2014 and September 28, 2013, respectively.
Vendor Funds. The Company receives funds from many of the vendors whose products the Company buys for resale to its Members. These vendor funds are provided to increase the sell-through of the related products. The Company receives funds for a variety of merchandising activities: placement of vendors’ products in the Members’ advertising; placement of vendors’ products in prominent locations in the Members’ stores; introduction of new products into the Company’s distribution system and Members’ stores; exclusivity rights in certain categories that have slower-turning products; and to compensate for temporary price reductions offered to customers on products held for sale at Members’ stores.
Consideration received from the Company’s vendors is reflected as a reduction of inventory costs or as an offset to service costs incurred on behalf of the vendor for which the Company is being reimbursed. Amounts recorded as a reduction of inventory costs at the time of purchase are recognized in cost of sales upon the sale of the product and amounts received as reimbursement of specific incremental costs to sell the vendor’s products by the Company on behalf of the vendor are recognized as a reduction in distribution, selling and administrative expenses. Amounts due from vendors upon achievement of certain milestones, such as minimum purchase volumes, are accrued prior to the achievement of the milestone if the Company believes it is probable the milestone will be achieved, and the amounts to be received are reasonably estimable.
As the Company provides sales incentives to its customers, the Company adheres to ASC Topic 605, “Revenue Recognition,” which requires vendors’ (and resellers’) sales incentives, paid in the form of cash consideration to customers, to be reflected as a reduction of revenue in the financial statements of a reseller.
97
Table of Contents
Shipping and Handling Costs. Costs for shipping and handling are included as a component of distribution, selling and administrative expenses. Shipping and handling costs were $245.1 million, $224.9 million and $231.5 million for the fiscal years ended October 3, 2015, September 27, 2014 and September 28, 2013, respectively.
Environmental Costs. The Company expenses, on a current basis, certain recurring costs incurred in complying with environmental regulations and remediating environmental pollution. The Company also reserves for certain non-recurring future costs required to remediate environmental pollution for which the Company may be liable whenever, by diligent legal and technical investigation, the scope or extent of pollution has been determined, the Company’s contribution to the pollution has been ascertained, remedial measures have been specifically identified as practical and viable, and the cost of remediation and the Company’s proportionate share can be reasonably estimated.
Comprehensive Earnings (Loss). Comprehensive earnings (loss) are net earnings, plus certain other items that are recorded by the Company directly to accumulated other comprehensive earnings (loss), bypassing net earnings. See Note 19 “Accumulated Other Comprehensive Earning (Loss)” for further information.
Recently Adopted and Recently Issued Authoritative Accounting Guidance
In February 2016, the FASB issued Accounting Standards Update (“ASU”) No. 2016-02, “Leases (Topic 842)” (“ASU No. 2016-02”). The principle objective of ASU No. 2016-02 is to increase transparency and comparability among organizations by recognizing lease assets and lease liabilities on the balance sheet. ASU No. 2016-02 continues to retain a distinction between finance and operating leases but requires lessees to recognize a right-of-use asset representing its right to use the underlying asset for the lease term and a corresponding lease liability on the balance sheet for all leases with terms greater than twelve months. ASU No. 2016-02 is effective for fiscal years and interim periods beginning after December 15, 2018. Early adoption of ASU No. 2016-02 is permitted. The Company will adopt ASU No. 2016-02 commencing in the first quarter of fiscal 2020. The Company is currently assessing the impact this standard may have on its financial statements and the related expansion of its footnote disclosures.
In January 2016, the FASB issued ASU No. 2016-01, “Financial Instruments—Overall (Subtopic 825-10): Recognition and Measurement of Financial Assets and Financial Liabilities” (“ASU No. 2016-01”). The principle objective of ASU No. 2016-01 is to improve the reporting of financial instruments in order to provide users of financial statements with more decision-useful information. ASU No. 2016-01 requires equity investments (except those accounted for under the equity method of accounting or those that result in consolidation of the investee) to be measured at fair value with changes in fair value recognized in net income. The amendment also affects the presentation and disclosure requirements for financial instruments. ASU No. 2016-01 is effective for fiscal years, and interim periods within those fiscal years, beginning after December 15, 2017. The Company will adopt ASU No. 2016-01 commencing in the first quarter of fiscal 2019. The Company is currently assessing the impact this standard may have on its financial statements and the related expansion of its footnote disclosures.
In November 2015, the FASB issued ASU No. 2015-17, “Income Taxes (Topic 740): Balance Sheet Classification of Deferred Taxes,” which changes how deferred taxes are classified on organizations’ balance sheets.
ASU No. 2015-17 eliminates the current requirement for organizations to present deferred tax liabilities and assets as current and noncurrent in a classified balance sheet. Instead, organizations will be required to classify all deferred tax assets and liabilities as noncurrent.
The amendments apply to all organizations that present a classified balance sheet. The amendments are effective for financial statements issued for annual periods beginning after December 15, 2016, and interim periods within those annual periods. The Company will adopt ASU No. 2015-17 commencing in the first quarter of fiscal 2018. The Company does not believe this standard will have a material impact on its consolidated financial statements or the related footnote disclosures.
In July 2015, the FASB issued ASU No. 2015-12, Plan Accounting – Defined Benefit Pension Plans (Topic 960), Defined Contribution Pension Plans (Topic 962), Health and Welfare Benefit Plans (Topic 965) – (Part I) Fully Benefit-Responsive Investment Contracts, (Part II) Plan Investment Disclosures, (Part III) Measurement Date Practical Expedient” (“ASU No. 2015-12”). ASU No. 2015-12 covers three distinct items. Item I removes the
98
Table of Contents
requirement to disclose fully benefit-responsive investment contracts at their fair value with a reconciliation to their contract value. A fully benefit-responsive investment contract’s relevant measure is the contract amount as that is the amount a participant would receive upon disbursement. Item II eliminates the current requirement to disclose (1) individual investments that represent 5% or more of net assets available for benefits and (2) the net appreciation or depreciation for investments by general type for investments that are participant-directed or non-participant directed investments. Companies are still required to disclose the net appreciation or depreciation of investments in the aggregate for the period, but are no longer required to present the information disaggregated by general type. Item III amends each of the above topics to allow a practical expedient for measurement of plan assets on a month-end date that is nearest to the Company’s fiscal year-end. ASU No. 2015-12 is effective for fiscal years, and interim periods within those years, beginning after December 15, 2015. Retrospective application is required for items I and II; however, only prospective application is allowed for item III. Early adoption of ASU No. 2015-12 is permitted. The Company early adopted ASU No. 2015-12 beginning with the Company’s fiscal year-end 2015. ASU No. 2015-12 did not have an impact on the Company’s financial statements and had a minimal impact on the related footnote disclosures.
In July 2015, the FASB issued ASU No. 2015-11, “Inventory (Topic 330)—Simplifying the Measurement of Inventory” (“ASU No. 2015-11”). ASU No. 2015-11 requires entities to measure most inventory at the “lower of cost and net realizable value” and options that currently exist for “market value” will be eliminated. The ASU defines net realizable value as the “estimated selling prices in the ordinary course of business, less reasonably predictable costs of completion, disposal, and transportation.” ASU No. 2015-11 will not apply to inventories that are measured by using either the last-in, first-out (LIFO) method or the retail inventory method (RIM). No other changes were made to the current guidance on inventory measurement. ASU No. 2015-11 is effective for interim and annual periods beginning after December 15, 2016. Early application is permitted and should be applied prospectively. The Company will adopt ASU No. 2015-11 commencing in the first quarter of fiscal 2018. The Company does not believe this standard will have a material impact on its consolidated financial statements or the related footnote disclosures.
In May 2015, the FASB issued ASU No. 2015-07, “Fair Value Measurement (Topic 820)—Disclosures for Investments in Certain Entities That Calculate Net Asset Value per Share (or Its Equivalent)” (“ASU No. 2015-07”). ASU No. 2015-07 removes the requirement to categorize within the fair value hierarchy investments for which fair value is measured using the net asset value per share practical expedient and instead requires disclosure of sufficient information about these investments to permit reconciliation of the fair value of investments categorized within the fair value hierarchy to the investments presented in the consolidated balance sheet. ASU No. 2015-07 is effective for fiscal years, and interim periods within those years, beginning after December 15, 2015. Retrospective application is required. Early application of ASU No. 2015-07 is permitted. The Company anticipates that it will elect early adoption of ASU No. 2015-07 coincident with the Company’s fiscal year end 2016. Other than the reduction of certain disclosures for its defined benefit plan investments that use the net asset value per share practical expedient, the Company does not believe this standard will have a material impact on its consolidated financial statements or the related footnote disclosures.
In April 2015, the FASB issued ASU No. 2015-04, “Compensation—Retirement Benefits (Topic 715)—Practical Expedient for the Measurement Date of an Employer’s Defined Benefit Obligation and Plan Assets” (“ASU No. 2015-04”). ASU No. 2015-04 provides an entity whose fiscal year does not coincide with a calendar month-end to utilize a practical expedient for the measurement of the entity’s defined benefit plan assets. The practical expedient allows an entity to measure its plan assets as of the nearest calendar month-end that is closest to the entity’s fiscal year-end. The month-end selected must be consistently used amongst all plans if an entity has more than one plan and must be applied consistently from year to year. ASU No. 2015-04 also provides guidance for significant events that occur between the entity’s fiscal year-end and the month-end selected for measurement. If the event is an entity-initiated event that results in a plan remeasurement, then the plan assets must also be revalued (there is a practical expedient allowed similar to the overall practical expedient). If the event is out of the entity’s control (for example, changes in market prices or interest rates), the entity is not required to remeasure the assets. An entity must disclose the practical expedient election and the date used to measure the assets and obligations. ASU No. 2015-04 is effective for fiscal years, and interim periods within those years, beginning after December 15, 2015. The Company will adopt ASU No. 2015-04 commencing in the first quarter of fiscal 2017. The Company does not believe this standard will have a material impact on its consolidated financial statements or the related footnote disclosures.
99
Table of Contents
In April 2015, the FASB issued ASU No. 2015-03, “Interest—Imputation of Interest (Subtopic 835-30)—Simplifying the Presentation of Debt Issuance Costs” (“ASU No. 2015-03”). ASU No. 2015-03 requires that debt issuance costs related to a recognized debt liability be presented in the balance sheet as a direct deduction from the carrying amount of that debt liability, consistent with debt discounts. The recognition and measurement guidance for debt issuance costs are not affected by the amendments in ASU No. 2015-03. Entities should apply the amendments in ASU No. 2015-03 on a retrospective basis, wherein the balance sheet of each individual period presented should be adjusted to reflect the period-specific effects of applying the new guidance.
Since the issuance of ASU No. 2015-03, it has been unclear whether and, if so, how ASU No. 2015-03 applies to revolving debt arrangements. At the Emerging Issues Task Force’s June 18, 2015 meeting, the SEC staff clarified that ASU No. 2015-03 does not address debt issuance costs associated with such arrangements and announced that it would “not object to an entity deferring and presenting such costs as an asset and subsequently amortizing the costs ratably over the term of the revolving debt arrangement.” The Company anticipates that it will elect to apply the accounting policy outlined by the SEC staff as stated above. Under that policy, an entity presents remaining unamortized debt issuance costs associated with a revolving debt arrangement as an asset even if the entity currently has a recognized debt liability for amounts outstanding under the arrangement. Further, such costs are amortized over the life of the arrangement even if the entity repays previously drawn amounts.
For public entities, ASU No. 2015-03 is effective for fiscal years, and interim periods within those years, beginning after December 15, 2015. The Company will adopt ASU No. 2015-03 commencing in the first quarter of fiscal 2017. The Company does not believe this standard will have a material impact on its consolidated financial statements or the related footnote disclosures.
In May 2014, the FASB issued ASU No. 2014-09, “Revenue from Contracts with Customers (Topic 606)” (“ASU No. 2014-09”). The FASB indicated that ASU No. 2014-09 clarifies the principles for recognizing revenue and develops a common revenue standard for U.S. GAAP and International Financial Reporting Standards that (1) removes inconsistencies and weaknesses in revenue requirements; (2) provides a more robust framework for addressing revenue issues; (3) improves comparability of revenue recognition practices across entities, industries, jurisdictions, and capital markets; (4) provides more useful information to users of financial statements through improved disclosure requirements; and (5) simplifies the preparation of financial statements by reducing the number of requirements to which an entity must refer. The core principle of the guidance is that an entity should recognize revenue to depict the transfer of promised goods or services to customers in an amount that reflects the consideration to which the entity expects to be entitled in exchange for those goods or services. The original effective date for ASU No. 2014-09 would have required the Company to adopt commencing in the first quarter of fiscal 2018. In August 2015, the FASB issued ASU No. 2015-14, which deferred the effective date of ASU No. 2014-09 for an additional year and provided the option to elect early adoption of ASU No. 2014-09 on the original effective date. In March 2016, the FASB issued ASU No. 2016-08, “Revenue from Contracts with Customers (Topic 606)—Principal versus Agent Considerations (Reporting Revenue Gross versus Net)” (“ASU No. 2016-08”). ASU No. 2016-08 does not change the core principle of the guidance under ASU No. 2014-09; however, it does clarify the implementation guidance on principal versus agent considerations and includes indicators to assist in evaluating whether an entity controls the good or the service before it is transferred to the customer. In April 2016, the FASB issued ASU No. 2016-10 “Revenue from Contracts with Customers (Topic 606)—Identifying Performance Obligations and Licensing” (“ASU No. 2016-10”). ASU No. 2016-10 does not change the core principle of the guidance under ASU No. 2014-09; however, it does clarify the implementation guidance on identifying performance obligations and licensing while retaining the related principles for those areas. The new revenue standard may be applied retrospectively to each prior period presented or retrospectively with the cumulative effect recognized as of the date of adoption. Accordingly, the Company will adopt ASU No. 2014-09 commencing in the first quarter of fiscal 2019. The Company is currently assessing the impact this standard may have on its consolidated financial statements and the related expansion of its footnote disclosures.
In July 2013, the FASB issued ASU No. 2013-11, “Income Taxes (Topic 740): Presentation of an Unrecognized Tax Benefit When a Net Operating Loss Carryforward, a Similar Tax Loss, or a Tax Credit Carryforward Exists” (“ASU No. 2013-11”). ASU No. 2013-11 requires that an unrecognized tax benefit, or a portion of an unrecognized tax benefit, be presented in the financial statements as a reduction to a deferred tax asset for a net operating loss carryforward, a similar tax loss, or a tax credit carryforward if such asset is available. The assessment of whether a deferred tax asset is available is based on the unrecognized tax benefit and deferred tax asset that exist at the
100
Table of Contents
reporting date and should be made presuming disallowance of the tax position at the reporting date. ASU No. 2013-11 is effective for fiscal years, and interim periods within those years, beginning after December 15, 2013. The Company adopted ASU No. 2013-11 in fiscal 2015. The adoption of ASU No. 2013-11 did not have a material impact on the Company’s consolidated financial statements or the related footnote disclosures.
2. Audit Committee Investigation
Background
In its Notification of Late Filing on Form 12b-25 dated December 19, 2014, with respect to the Company’s Annual Report on Form 10-K for the year ended September 27, 2014, the Company announced that the Audit Committee of the Company’s Board of Directors (“Audit Committee”) was conducting, with the assistance of independent legal counsel, an investigation of issues relating to the setting of case reserves and management of claims by the Company’s former insurance subsidiaries and related matters (the “Audit Committee Investigation”).
In conjunction with the findings of the Audit Committee Investigation, and in consultation with outside actuarial professionals engaged by the Audit Committee and by the Company, management has concluded that errors existed in the insurance reserves reported within the Company’s previously issued financial statements. Management has determined that the quantitative effect and qualitative nature of the errors do not require restatement and re-issuance of previously issued financial statements. As noted in Note 3, “Assets Held for Sale/Discontinued Operations,” the Company’s Insurance segment was sold on October 7, 2015 and is no longer part of the Company’s continuing operations.
Case Reserve Practices
The Company has determined, in conjunction with the findings of the Audit Committee Investigation that during fiscal year 2014 and the prior periods presented in this Form 10-K, the case reserving practices and related accounting within the former insurance subsidiaries deviated from the established policy of setting case reserves at the best estimate of ultimate cost. The lack of compliance with the former insurance subsidiaries’ policy and inconsistent practices over time introduced errors into the actuarial models which determined overall loss reserves, and thus management has concluded that a portion of the increases of required reserves experienced in 2013 and 2014 should have been accounted for in prior periods.
Extensive actuarial analysis was performed in order to estimate the error component of the insurance reserves, and the resulting calculation of the cumulative pre-tax and after tax error. In order to correct the insurance reserves errors, the discontinued operations of Springfield Insurance Company (one of the Company’s former insurance subsidiaries) for the fiscal year ended September 27, 2014, include cumulative additional expense for insurance reserves applicable to prior fiscal periods on a pre-tax and after tax basis of approximately $2.0 million and $1.9 million, respectively. Had this expense been recorded in the proper periods, pre-tax and after tax earnings (loss) from discontinued operations for fiscal 2014 would have been $4.2 million and $2.1 million higher, respectively; pre-tax and after tax earnings (loss) for fiscal 2013 would have been $2.9 million and 1.9 million higher, respectively; and retained earnings as of September 30, 2012 would have been $6.0 million lower. Management has determined that the quantitative effect and qualitative nature of the errors do not require restatement and re-issuance of previously issued financial statements.
Disclosures
In addition, the Audit Committee Investigation concluded that a related party transaction that occurred at our former insurance subsidiaries in fiscal year 2012 was not properly reviewed and approved, and was not properly disclosed. The transaction involved changes to the deductible structure and other characteristics of a portfolio of workers compensation policies held by the former insurance subsidiaries. The portfolio contains policies for employees of a customer affiliated with a Member- Director. See Note 20, “Related Party Transactions,” for further information on this transaction.
101
Table of Contents
3. Assets Held For Sale/ Discontinued Operations
On October 7, 2015 (the “Closing Date”), the Company completed the sale of all of the outstanding shares of the Company’s wholly owned subsidiary, Unified Grocers Insurance Services (“UGIS”), to AmTrust Financial Services, Inc. (“AmTrust” or the “Buyer”) pursuant to the terms of a Stock Purchase Agreement (the “Stock Purchase Agreement”) by and between the Company and AmTrust dated as of April 16, 2015. As of the Closing Date, UGIS owned all of the outstanding shares of the capital stock of Springfield Insurance Company (“SIC”) and Springfield Insurance Company Limited (Bermuda) (“SICL,” and collectively with UGIS and SIC, the “Acquired Companies”). For additional information, see Item 1.01. “Entry into a Material Definitive Agreement,” including Exhibit 99.1, “Stock Purchase Agreement by and between Unified Grocers, Inc. and AmTrust Financial Services, Inc. dated as of April 16, 2015” thereto, of the Company’s Current Report on Form 8-K, filed on April 22, 2015 and Item 2.01. “Completion of Acquisition of Disposition of Assets,” including Exhibit 99.2 “Master Services Agreement by and between Unified Grocers, Inc. and AmTrust Financial Services, Inc. dated as of October 7, 2015” thereto, of the Company’s Current Report on Form 8-K, filed on October 14, 2015. The Acquired Companies were previously reported by the Company as a segment identified as the Insurance Segment (“Insurance”).
The estimated purchase price received for the Acquired Companies was approximately $26.2 million in cash proceeds, representing an agreed-upon discount to the Tangible Book Value (“TBV”), which was calculated as defined in the Stock Purchase Agreement. In May 2016, AmTrust delivered to the Company a final closing statement, including its calculation of the TBV as of the Closing Date. The final purchase price was adjusted to reflect an increase in the purchase price of $0.4 million between the estimated TBV as of the Closing Date and the actual TBV as of the Closing Date.
At the Closing Date, AmTrust and the Company also entered into a Master Services Agreement for a term of five (5) years, pursuant to which, among other things, each party agreed to provide the other with certain transition services relating to the business of the Acquired Companies. AmTrust has also agreed to pay the Company an annual payment following each of the first five years (ended December 31) of the term of the Master Services Agreement (each, an “Earn-Out Payment”). Each Earn-Out Payment will be equal to four and one-half percent (4.5%) of gross written premium in respect of each of these first five years. For purposes of such payments, gross written premium will be based on premiums written on or attributable to all insurance policies purchased during the applicable year by members or customers of the Company, issued by SIC or SICL or any other affiliate of AmTrust, to the extent that such policies were purchased from or through UGIS or by a different sales channel if there is a change in UGIS.
Based on agreed upon terms with AmTrust, the Company recorded a $1.3 million impairment on the Company’s investment in Acquired Companies. Additionally, the Company wrote-off $0.7 million in expenses related to the Audit Committee Investigation and incurred $1.2 million in selling costs related to the Acquired Companies. The Acquired Companies incurred an operating loss of $3.7 million for the fiscal year ended October 3, 2015.
Under the terms of the Stock Purchase Agreement with AmTrust, if during the five-year period following the Closing Date of the sale of the Insurance segment, the insurance reserves in respect of any accident arising prior to the closing and covered by an insurance policy written by an insurance subsidiary prior to January 1, 2015 increase as a result of adverse development, we must pay AmTrust for the amount of the increase, up to $1 million in the aggregate and offset up to $2 million from future Earn-Out Payments (as defined in the Stock Purchase Agreement) due to us under the Stock Purchase Agreement. See Item 1.01, “Entry into a Material Definitive Agreement,” including Exhibit 99.1, “Stock Purchase Agreement by and between Unified Grocers, Inc. and AmTrust Financial Services, Inc. dated as of April 16, 2015” thereto, of our Current Report on Form 8-K, filed on April 22, 2015, and Item 2.01, “Completion of Acquisition or Disposition of Assets,” including Exhibit 99.2, “Master Services Agreement by and between Unified Grocers, Inc. and AmTrust Financial Services, Inc. dated as of October 7, 2015” thereto, of our Current Report on Form 8-K, filed on October 14, 2015, for additional information.
The Company’s historical financials have been revised to present the operating results of the Acquired Companies as discontinued operations.
102
Table of Contents
Summarized results of the discontinued operations are as follows for the years ended October 3, 2015, September 27, 2014 and September 28, 2013:
| (dollars in thousands) | October 3, 2015 |
September 27, 2014 |
September 28, 2013 |
|||||||||
| Revenue |
$ | 12,151 | $ | 17,178 | $ | 19,105 | ||||||
| Loss from discontinued operations |
(3,701 | ) | (7,895 | ) | (7,747 | ) | ||||||
| Provision (benefit) for income taxes |
— | (2,914 | ) | (2,587 | ) | |||||||
|
|
||||||||||||
| Loss from discontinued operations net of tax |
$ | (3,701 | ) | $ | (4,981 | ) | $ | (5,160 | ) | |||
|
|
||||||||||||
The operating results of the Acquired Companies were historically reported as the results of operations included in the Insurance segment.
Assets and liabilities identifiable within the Acquired Companies are reported as “Assets held for sale—current” and “Liabilities held for sale—current,” respectively, in the Company’s consolidated balance sheets. The major classes of assets and liabilities of the held-for-sale discontinued operations as of October 3, 2015 and September 27, 2014 are as follows:
| (dollars in thousands) | October 3, 2015 |
September 27, 2014 |
||||||
| Cash |
$ | 8,429 | $ | 7,097 | ||||
| Accounts receivable, net of allowance for bad debt |
2,715 | 11,574 | ||||||
| Prepaid expenses |
676 | 595 | ||||||
| Property, plant & equipment, net |
1,351 | 5,798 | ||||||
| Investments |
85,052 | 77,898 | ||||||
| Other assets |
27,681 | 20,767 | ||||||
|
|
||||||||
| Assets held for sale - current |
$ | 125,904 | $ | 123,729 | ||||
|
|
||||||||
| Accounts payable |
$ | 592 | $ | 725 | ||||
| Accrued liabilities |
97,619 | 94,625 | ||||||
| Debt |
— | 1,000 | ||||||
| Other reserves |
1,471 | — | ||||||
|
|
||||||||
| Liabilities held for sale - current |
$ | 99,682 | $ | 96,350 | ||||
|
|
||||||||
103
Table of Contents
Statements of Cash Flows for the discontinued operations for the last three fiscal years:
| Fiscal Years Ended | ||||||||||||
| October 3, 2015 (53 weeks) |
September 27, 2014 (52 weeks) |
September 28, 2013 (52 weeks) |
||||||||||
| Cash flows from discontinued operating activities: |
||||||||||||
| Net loss |
$ | (3,701 | ) | $ | (4,981 | ) | $ | (5,160 | ) | |||
| Adjustments to reconcile net loss to net cash provided by discontinued operating activities: |
||||||||||||
| Depreciation and amortization |
289 | 263 | 386 | |||||||||
| (Increase) decrease in assets: |
||||||||||||
| Accounts receivable |
7,452 | 266 | (550 | ) | ||||||||
| Prepaid expenses and other current assets |
(81 | ) | (73 | ) | (240 | ) | ||||||
| Increase (decrease) in liabilities: |
||||||||||||
| Accounts payable |
(133 | ) | 148 | (1,013 | ) | |||||||
| Accrued liabilities |
(1,319 | ) | (340 | ) | 4,096 | |||||||
| Long-term liabilities, other |
3,313 | 12,641 | 5,193 | |||||||||
|
|
||||||||||||
| Net cash provided by discontinued operating activities |
5,820 | 7,924 | 2,712 | |||||||||
|
|
||||||||||||
| Cash flows from investing activities: |
||||||||||||
| Purchases of properties and equipment |
— | — | (224 | ) | ||||||||
| Purchases of securities and other investments |
(34,507 | ) | (61,292 | ) | (49,831 | ) | ||||||
| Proceeds from maturities or sales of securities and other investments |
37,032 | 63,420 | 45,768 | |||||||||
| (Increase) decrease in other assets |
(7,013 | ) | (10,366 | ) | 444 | |||||||
|
|
||||||||||||
| Net cash utilized by discontinued investing activities |
(4,488 | ) | (8,238 | ) | (3,843 | ) | ||||||
|
|
||||||||||||
| Cash flows from financing activities: |
||||||||||||
|
|
||||||||||||
| Net cash provided by discontinued financing activities |
— | — | — | |||||||||
|
|
||||||||||||
| Net increase (decrease) in cash and cash equivalents from discontinued operations |
1,332 | (314 | ) | (1,131 | ) | |||||||
| Cash and cash equivalents at beginning of year |
7,097 | 7,411 | 8,542 | |||||||||
|
|
||||||||||||
| Cash and cash equivalents at end of year |
$ | 8,429 | $ | 7,097 | $ | 7,411 | ||||||
|
|
||||||||||||
4. Properties and Equipment
Properties and equipment, stated at cost, consisted of the following:
| (dollars in thousands) | ||||||||
| October 3, 2015 |
September 27, 2014 |
|||||||
| Land |
$ | 59,753 | $ | 58,894 | ||||
| Buildings and leasehold improvements |
143,692 | 138,641 | ||||||
| Equipment |
127,715 | 121,898 | ||||||
| Equipment under capital leases |
2,130 | — | ||||||
|
|
||||||||
| 333,290 | 319,433 | |||||||
| Less accumulated depreciation and amortization |
169,482 | 157,562 | ||||||
|
|
||||||||
| $ | 163,808 | $ | 161,871 | |||||
|
|
||||||||
Consolidated depreciation and amortization expense related to properties and equipment was $14.0 million, $13.8 million and $14.4 million for the years ended October 3, 2015, September 27, 2014 and September 28, 2013, respectively.
Amortization expense related to capital leases was $0.1 million for the year ended October 3, 2015. There was no amortization expense related to capital leases for the fiscal years ended September 27, 2014 and September 28, 2013.
104
Table of Contents
5. Investments
The amortized cost and fair value of investments are as follows:
| (dollars in thousands) | ||||||||||
| October 3, 2015 | Amortized Cost |
Gross Unrealized Gains |
Gross Unrealized Losses |
Fair Value | ||||||
| Common stock, at cost |
$ | 13,069 | ||||||||
|
|
||||||||||
| Total investments |
$ | 13,069 | ||||||||
|
|
||||||||||
| (dollars in thousands) | ||||||||||
| September 27, 2014 | Amortized Cost |
Gross Unrealized Gains |
Gross Unrealized Losses |
Fair Value | ||||||
| Common stock, at cost |
$ | 13,269 | ||||||||
|
|
||||||||||
| Total investments |
$ | 13,269 | ||||||||
|
|
||||||||||
During the fiscal years ended October 3, 2015 and September 27, 2014, the Company did not hold any trading or held-to-maturity securities.
Net investment income, which is included in net sales, is summarized as follows:
| (dollars in thousands) | ||||||||||||
| Fiscal Years Ended | ||||||||||||
| October 3, 2015 |
September 27, 2014 |
September 28, 2013 |
||||||||||
| Dividend income |
$ | 6 | $ | — | $ | — | ||||||
|
|
||||||||||||
| 6 | — | — | ||||||||||
| Less investment expenses |
— | — | — | |||||||||
|
|
||||||||||||
| $ | 6 | $ | — | $ | — | |||||||
|
|
||||||||||||
Equity investments held by the Company that do not have readily determinable fair values are accounted for using the cost or equity methods of accounting. The Company evaluated its equity investments for impairment as of October 3, 2015 and September 27, 2014, and the Company did not consider any of these equity investments to be impaired.
The Company held investments in Western Family Holding Company (“Western Family”) common stock of $9.0 million and $9.2 million at October 3, 2015 and September 27, 2014, respectively. Western Family is a private cooperative located in Oregon from which the Company purchases food and general merchandise products. The investment represents approximately a 17.2% and 18% ownership interest at October 3, 2015 and September 27, 2014, respectively. The Company’s ownership percentage in Western Family is based, in part, on the volume of purchases transacted with Western Family. The investment is accounted for using the equity method of accounting.
The Company’s wholly-owned finance subsidiary, Grocers Capital Company (“GCC”), has an investment in National Consumer Cooperative Bank (“NCB”), which operates as a cooperative and therefore its participants are required to own its Class B common stock. The investment in the Class B common stock of NCB, accounted for using the cost method of accounting, aggregated $4.1 million at both October 3, 2015 and September 27, 2014. The Company recognized $6 thousand of dividend income from NCB in fiscal year 2015. The Company did not recognize dividend income from NCB in fiscal years 2014 or 2013.
105
Table of Contents
6. Accrued Liabilities
Accrued liabilities are summarized as follows:
| (dollars in thousands) | ||||||||
| October 3, 2015 |
September 27, 2014 |
|||||||
| Accrued wages, current portion of retirement benefits and related taxes |
$ | 32,156 | $ | 31,656 | ||||
| Accrued income and other taxes payable |
2,185 | 2,262 | ||||||
| Accrued promotional liabilities |
2,588 | 1,305 | ||||||
| Other accrued liabilities |
9,358 | 10,143 | ||||||
|
|
||||||||
| $ | 46,287 | $ | 45,366 | |||||
|
|
||||||||
7. Notes Payable
The Company’s notes payable and scheduled maturities are summarized as follows:
| (dollars in thousands) | ||||||||
| October 3, 2015 |
September 27, 2014 |
|||||||
| Secured revolver borrowings under credit agreements |
$ | 161,800 | $ | 151,500 | ||||
| Secured term loan borrowings under credit agreement |
92,500 | 36,119 | ||||||
| Secured FILO borrowings under credit agreement |
20,714 | — | ||||||
| Senior secured notes |
— | 48,817 | ||||||
| Obligations under capital leases |
2,097 | — | ||||||
| Other debt agreements |
1,434 | 2,095 | ||||||
|
|
||||||||
| Total notes payable |
278,545 | 238,531 | ||||||
| Less portion due within one year |
16,960 | 7,502 | ||||||
|
|
||||||||
| $ | 261,585 | $ | 231,029 | |||||
|
|
||||||||
Maturities of notes payable as of October 3, 2015 are:
| (dollars in thousands) | ||||
| Fiscal year | ||||
| 2016 |
$ | 16,960 | ||
| 2017 |
24,209 | |||
| 2018 |
236,532 | |||
| 2019 |
436 | |||
| 2020 |
408 | |||
| Thereafter |
— | |||
|
|
||||
| $ | 278,545 | |||
|
|
||||
Secured Credit Agreements
Credit Agreement
The Company is party to an Amended and Restated Credit Agreement dated as of June 28, 2013, as amended by the First Amendment and Consent dated as of June 27, 2014 and as further amended by the Second Amendment, Consent and Lender Joinder dated as of December 18, 2014 and the Consent dated as of June 26, 2015 (as so amended, the “Credit Agreement”), among the Company, the lenders party thereto, Wells Fargo Bank, National Association (“N.A.”), as administrative agent (“Administrative Agent”), and the other agents party thereto. The Credit Agreement originally provided for a revolving credit facility with total commitments in the principal amount of $275 million and a term loan in the amount of $40.9 million. Certain capitalized terms used in this description of the Credit Agreement have the meanings given to them in the Credit Agreement.
106
Table of Contents
On June 27, 2014, the Company entered into a First Amendment and Consent (the “First Amendment”) with Wells Fargo Bank, N.A., as Administrative Agent and the lenders party thereto, modifying the Credit Agreement. The First Amendment provided for a modification of the excess availability calculations under the Credit Agreement to accommodate normal seasonal working capital needs in the period from June 27, 2014 to January 15, 2015. The First Amendment did not change the $275 million maximum amount that could have been borrowed under the Credit Agreement, but did provide additional flexibility under certain provisions of the Credit Agreement and increased the aggregate amount of permitted credit facilities of the Company’s finance and former insurance subsidiaries from $25 million to $30 million. The Amendment, except as expressly stated, did not modify the Credit Agreement and other loan documents, which remained unmodified and in full force and effect.
On December 18, 2014, the Company entered into a Second Amendment, Consent and Lender Joinder (the “Second Amendment”) among the Company (excluding our wholly-owned finance subsidiary and our former insurance subsidiaries), the lenders party thereto, and the Administrative Agent. The Second Amendment amends the existing Credit Agreement among the Company, the lenders party thereto, and the Administrative Agent.
The Credit Agreement, as amended by the Second Amendment, provides for a revolving credit facility (the “Revolver”) with total commitments (“Revolving Loan Commitments”) in the principal amount of $370 million (increased by the Second Amendment from $275 million) (as such amount may be increased by any increases in the Revolving Loan Commitments and decreased by any reductions in the Revolving Loan Commitments, in each case pursuant to the Credit Agreement) (the “Maximum Revolver Amount”) and a term loan in the amount of $100 million (increased by the Second Amendment from $40.9 million) (the “Term Loan”). Borrowings under the Revolver may be made as revolving loans, swing line loans or letters of credit.
The aggregate Revolving Loan Commitments under the Credit Agreement may be increased from time to time, either through any of the existing lenders increasing its commitment or by means of the addition of new lenders, up to a maximum commitment of $450 million (increased by the Second Amendment from $400 million). While the consent of the lenders as a group is not required to any such increase, no lender is required to increase its own Revolving Loan Commitment.
The Second Amendment adds a “first-in last-out” tranche (the “FILO Facility”) to the Revolver, with all other revolving loans constituting the “Tranche A Facility.” The maximum amount of the FILO Facility (the “FILO Maximum Revolver Amount”) is $21.4 million, reduced by $0.6 million per month from the first anniversary of the Second Amendment to the second anniversary of the Second Amendment, reduced by $1.2 million per month from the second anniversary of the Second Amendment to the third anniversary of the Second Amendment, and reduced to zero on the third anniversary of the Second Amendment. The maximum amount of the Tranche A Facility (the “Tranche A Maximum Revolver Amount”) is the Maximum Revolver Amount (as defined above) minus the FILO Maximum Revolver Amount.
The Credit Agreement matures June 28, 2018. The purpose of the Revolver is to finance working capital and other general corporate needs, which may include capital expenditures and Permitted Acquisitions (as defined in the Credit Agreement). The purpose of the Term Loan was for prepayment of the entire remaining balance of the Company’s senior secured notes pursuant to its Amended and Restated Note Purchase Agreement dated as of January 3, 2006, as amended (the “Senior Note Agreement”), with the then-current noteholders and John Hancock Life Insurance Company (U.S.A.) (“John Hancock”), acting in its capacity as collateral agent for the then-current noteholders (the “Hancock Debt”), and for payment of fees and expenses related to the repayment of the Hancock Debt, and (to the extent of any proceeds of the Term Loan remaining after payment of the Hancock Debt) for the same purposes as the Revolver. The Term Loan is subject to prepayment, if any appraisal of the Term Loan Real Estate shows the outstanding balance of the Term Loan exceeds 60% of the appraised value of the Term Loan Real Estate, in the amount of such excess. The Second Amendment adds to the Term Loan Real Estate certain real property of the Company that had secured the Hancock Debt. The principal of the Term Loan is to be repaid monthly beginning January 31, 2015, in an amount per month of $0.8 million (changed by the Second Amendment from an amount per month of $0.4 million, payment of which was due beginning July 31, 2013).
The Company’s obligations under the Credit Agreement are guaranteed by certain of the Company’s subsidiaries, excluding its finance and former insurance subsidiaries, and are secured by grants of security interests in the accounts receivable, inventory, deposit accounts and certain related collateral (subject to exceptions) of the
107
Table of Contents
Company and the guarantor subsidiaries, and in the Term Loan Real Estate. The obligations are also senior to the rights of the Company’s Members with respect to Partially Subordinated Patrons’ Deposit Accounts and patronage dividend certificates, if any.
Borrowings under the Revolver may be made as revolving loans, swing line loans or letters of credit. The Revolver provides for loans up to the sum of (i) the lesser of (A) the Tranche A Maximum Revolver Amount less the sum of any outstanding letter of credit usage plus swing line loans plus reserves as may be established by the Administrative Agent and (B) the amount equal to the Tranche A Borrowing Base at such date (based upon the most recent Borrowing Base Certificate delivered by the Company to the Administrative Agent) less the sum of any outstanding letter of credit usage plus any outstanding swing line loans (“Tranche A Availability”), and (ii) the lesser of (A) the FILO Maximum Revolver Amount and (B) the amount equal to the FILO Borrowing Base as of such date (based upon the most recent Borrowing Base Certificate delivered by the Company to the Administrative Agent) (“FILO Availability”). The Borrowing Base is calculated as 85% of all Eligible Accounts (primarily accounts receivable) less any Dilution Reserve, plus the lesser of (a) 70% of Eligible Inventory or (b) 90% of the Net Recovery Percentage of Eligible Inventory, less reserves, if any, established by the Administrative Agent. The FILO Borrowing Base is calculated as 5% of all Eligible Accounts, plus the lesser of (a) 5% of Eligible Inventory or (b) 5% of the Net Recovery Percentage of Eligible Inventory. All Revolving Loans at any time outstanding are allocated first to the FILO Revolving Loan Commitments up to the amount of FILO Availability, and then to the Tranche A Revolving Loan Commitments.
Borrowings under the Revolving Loan Commitment and Term Loan bear interest at an interest rate determined by reference either to the Base Rate or to the Eurodollar Rate with the rate election made by the Company at the time of the borrowing or at any time the Company elects to continue or convert a Loan or Loans, while swing loan borrowings bear interest at an interest rate determined by reference to the Base Rate. Tranche A Revolving Loans that are Base Rate Loans will bear interest margins of between 0.50% per annum and 1.00% per annum, dependent upon the Company’s Average Excess Availability for the most recently completed month for which a Borrowing Base Certificate has been delivered. Tranche A Revolving Loans that are Eurodollar Rate Loans will bear interest margins of between 1.50% per annum and 2.00% per annum, based upon the Company’s Average Excess Availability for the most recently completed month for which a Borrowing Base Certificate has been delivered. FILO Revolving Loans that are Base Rate Loans will bear interest margins of between 1.75% per annum and 2.25% per annum, dependent upon the Company’s Average Excess Availability for the most recently completed month for which a Borrowing Base Certificate has been delivered. FILO Revolving Loans that are Eurodollar Rate Loans will bear interest margins of between 2.75% per annum and 3.25% per annum, based upon the Company’s Average Excess Availability for the most recently completed month for which a Borrowing Base Certificate has been delivered. Amounts of the Term Loan that are Base Rate Loans will bear an interest margin of 1.00% per annum; amounts of the Term Loan that are Eurodollar Loans will bear an interest margin of 2.00% per annum. Swing line loans will bear interest at the Base Rate plus the interest margin for Tranche A Revolving Loans, or at such other rate as the Swing Line Lender offers in its discretion. Amounts available under Letters of Credit bear fees of 0.125% per annum plus the applicable Eurodollar Rate Margin for Tranche A Revolving Loans. If the Consolidated Fixed Charge Coverage Ratio for any period is less than 1.00 to 1.00, then the Base Rate Margin and the Eurodollar Rate Margin shall automatically increase by 0.50%. Undrawn portions of the commitments under the Credit Agreement bear commitment fees at a rate of either 0.25% per annum or 0.375% per annum, also dependent upon the Company’s Average Excess Availability. The Company may reduce the Revolving Loan Commitments at any time on five Business Days’ written notice, but not below the Total Utilization of Revolving Commitments, in a minimum amount of $2,500,000 and multiples of $100,000 in excess of that amount. The Company may reduce the FILO Revolving Loan Commitments at any time on five Business Days’ written notice in any amount that will not result in an Overadvance, in a minimum amount of $2,500,000 and multiples of $100,000 in excess of that amount.
The Company is subject to a financial covenant during the occurrence of a Financial Covenant Period. A Financial Covenant Period (a) commences when (i) an Event of Default occurs, (ii) Excess Availability is less than the greater of (A) $47.1 million (increased by the Second Amendment from $35 million) and (B) 12.7272% of the Maximum Revolver amount for a period of five consecutive Business Days or (iii) Excess Availability is less than the greater of (A) $40.4 million (increased by the Second Amendment from $30 million) and (B) 10.9090% of the Maximum Revolver Amount at any time and (b) continues until a period of 30 consecutive Business Days has elapsed during which at all times (i) no Event of Default exists and (ii) Excess Availability is equal to or greater than the greater of (A) $47.1 million (increased by the Second Amendment from $35 million) and (B) 12.7272% of the Maximum
108
Table of Contents
Revolver Amount. During a Financial Covenant Period, the Company is obligated to maintain a Consolidated Fixed Charge Coverage Ratio of not less than 1.15 to 1.0, measured as of the end of the most recent Fiscal Month for which financial statements have been delivered prior to the date on which a Financial Covenant Period first begins and as of each Fiscal Month end while the Financial Covenant Period is in effect.
The Credit Agreement imposes financial conditions on the Company redeeming any of its Class A Shares and Class B Shares and repurchasing Class E Shares and paying cash dividends on Class E Shares (other cash dividends being generally prohibited), and prohibits distributions to shareholders and any repurchase of shares when an Event of Default has occurred and is continuing. The Credit Agreement also places certain restrictions on the payment of patronage dividends should an Event of Default occur. Events of Default include, but are not limited to, the failure to pay amounts due to lenders, violation of covenants, the making of false representations and warranties and specified insolvency-related events, subject to specified thresholds, cure periods and/or exceptions.
The Company is subject to negative covenants limiting permitted indebtedness, contingent obligations, liens, investments, acquisitions, restricted payments and certain other matters.
The Credit Agreement is an amended and restated agreement of the previous credit agreement dated as of October 8, 2010, as amended, restated, supplemented or otherwise modified from time to time prior to June 28, 2013. Therefore, in accordance with ASC section 470-50-40 Debt—Modification and Extinguishments—Derecognition (“ASC 470”), the Company in fiscal 2013 accounted for the Credit Agreement as a modification of debt. Accordingly, unamortized deferred financing fees pertaining to the previous credit agreement ($1.4 million) are being amortized through the maturity date of the Credit Agreement (June 28, 2018).
The Company’s outstanding revolver borrowings under the Credit Agreement increased to $161.8 million at October 3, 2015 (Eurodollar and Base Rate Loans at a blended average rate of 1.99% per annum) from $145.0 million at September 27, 2014 (Eurodollar and Base Rate Loans at a blended average rate of 1.93% per annum). The Company’s outstanding term loan borrowings under the Credit Agreement were $92.5 million at October 3, 2015 (Eurodollar and Base Rate Loans at a blended average rate of 2.20% per annum) and $36.1 million at September 27, 2014 (Eurodollar and Base Rate Loans at a blended average rate of 2.18% per annum). The Company’s outstanding FILO borrowings under the Credit Agreement were $20.7 million at October 3, 2015 (Eurodollar and Base Rate Loans at a blended average rate of 3.20% per annum) and zero at September 27, 2014. As of October 3, 2015, the Company was in compliance with all applicable financial covenants of the Credit Agreement.
On December 28, 2015, we entered into a consent and waiver (the “Consent”) in which the Administrative Agent and the Lenders consented to the extension to June 30, 2016 (previously December 31, 2015 pursuant to the consent and waiver dated June 26, 2015) of the deadline for delivery of the annual financial statements required pursuant to the Credit Agreement and certain certificates and information required by the Credit Agreement to be delivered with financial statements required pursuant to the Credit Agreement.
The Consent also sets forth the lenders’ waiver of specified Defaults and Events of Default (as those terms are defined in the Credit Agreement) to the extent arising out of any revision or other modification which may be necessitated by determinations made as a result of the Audit Committee Investigation to any writing previously delivered (or which may be delivered prior to June 30, 2016) by a Loan Party (as that term is defined in the Credit Agreement) in accordance with the applicable loan documents, or the effect or consequence of any such revision or other modification.
Subsidiary Financing Arrangement
The Company’s wholly-owned finance subsidiary, GCC, is party to an Amended and Restated Loan and Security Agreement, dated as of September 26, 2014 as amended by Amendment Number One dated as of June 26, 2015 (as so amended, the “GCC Loan Agreement”), by and among GCC, the lenders party thereto, and California Bank & Trust (“CBT”), as Arranger and Administrative Agent. The GCC Loan Agreement amended and restated the existing loan agreement dated as of September 24, 2010, as amended or otherwise modified from time to time prior to September 26, 2014. The GCC Loan Agreement provides for a revolving credit facility with total commitments in the principal amount of $25.0 million. Borrowings under the GCC Loan Agreement may not exceed the amount equal to
109
Table of Contents
the Borrowing Base at such date (based upon the most recent Borrowing Base Certificate delivered by GCC to the Administrative Agent). The Borrowing Base is calculated as 80% of GCC’s eligible notes receivable (certain notes receivable restricted to 50%), less any reserves as may be established by the Administrative Agent. The GCC Loan Agreement matures on September 30, 2016. Certain capitalized terms used in this description of the GCC Loan Agreement have the meanings given to them in the GCC Loan Agreement. Borrowings under the GCC Loan Agreement are utilized to fund loans to the Company’s customers and for GCC’s general corporate purposes, including customary financing and operating activities.
GCC entered into Amendment Number One to Amended and Restated Loan and Security Agreement (the “GCC Amendment”), dated as of June 26, 2015, by and among GCC, the lenders that are signatories thereto, and CBT, as Arranger and Administrative agent. The GCC Amendment amends the GCC Loan Agreement to modify certain provisions relating to borrowing procedures and number of loan requests, as well as to permit CBT to fund as sole lender certain short term advances thereunder. See Item 1.01. “Entry into a Material Definitive Agreement—Grocers Capital Company Amended and Restated Loan and Security Agreement” and Item 2.03. “Creation of a Direct Financial Obligation or an Obligation under an Off-Balance Sheet Arrangement of a Registrant” of our Current Report on Form 8-K, filed on July 2, 2015, for additional information.
On December 28, 2015, GCC received consent from CBT for the GCC Loan Agreement to extend the due date of the covenant requirement to deliver the Company’s consolidated audited financial statements, which was previously December 31, 2015, to June 30, 2016. See Item 1.01. “Entry into a Material Definitive Agreement—Amendment of Amended and Restated Credit Agreement” and “—Grocers Capital Company Amended and Restated Loan and Security Agreement” of the Company’s Current Report on Form 8-K, filed on December 29, 2015, for additional information.
The GCC Loan Agreement provides for revolving loans. At the election of GCC, revolving loans shall bear interest at the LIBOR Rate or the Base Rate, plus an interest rate margin. The interest rate margin for LIBOR Rate loans is 3.00% per annum. The interest rate margin for Base Rate loans is 0.75% per annum. Undrawn portions of the commitments under the GCC Loan Agreement bear commitment fees at the rate of 0.25% per annum. GCC had revolving loan borrowings of zero and $6.5 million under the GCC Loan Agreement bearing an interest rate of 4.00% (3.25% prime plus 0.75% interest rate margin), outstanding at October 3, 2015 and September 27, 2014, respectively.
GCC must maintain a minimum of $0.3 million in average, monthly, combined balances at CBT. In addition, GCC shall maintain at least $0.3 million in a blocked and restricted account at CBT, as cash collateral subject to the terms of the Pledge Agreement. Upon GCC’s conversion to an independent billing system, to the satisfaction of CBT, as evidenced by a written confirmation from CBT to GCC, such Cash Collateral Account shall be closed and the funds therein returned to GCC, and GCC shall no longer be obligated to maintain such Cash Collateral Account, and the Pledge Agreement shall terminate.
GCC is subject to negative covenants limiting permitted indebtedness, liens, investments, acquisitions, restricted payments and certain other matters. As of October 3, 2015, the Company was not in violation of any applicable financial covenants of the GCC Loan Agreement.
Senior Secured Notes
Prior to December 18, 2014, the Company was party to a Senior Note Agreement with the then-current noteholders and John Hancock, acting in its capacity as collateral agent for the then-current noteholders, collectively referred to herein as the “Hancock Debt,” which originally consisted of three tranches of senior debt: $46.0 million, $40.0 million and $25.0 million with interest rates of 6.421%, 7.157% and 6.82%, respectively. On June 28, 2013, the Company entered into the seventh amendment (“Seventh Amendment”) to the Senior Note Agreement. Certain capitalized terms used in this description of the Seventh Amendment have the meanings given to them in the Seventh Amendment. The Seventh Amendment released the liens held by the Noteholders on certain real properties (the mechanized distribution center in Commerce, California and the dairy facility in Los Angeles, California) of the Company, and provided for modifications to and deletions of certain financial covenants, including the deletion of a financial covenant that had been previously provided for relating to the maximum permitted Indebtedness to Consolidated EBITDAP Ratio. The released properties now are collateral security for the lenders party to the Credit Agreement. In exchange, the Company paid the Noteholders $50 million plus all accrued and unpaid interest on the prepayment and paid the applicable Make-Whole Amount of $9.4 million, as calculated per
110
Table of Contents
the Senior Note Agreement, as well as an amendment fee of 0.5% of the outstanding principal balance of the Hancock Debt after giving effect to the prepayment contemplated by the Seventh Amendment. The prepayment was applied first to the Tranche C Notes (paid in full) with the remainder applied to the Tranche B Notes. The Seventh Amendment increased the fixed interest rate, effective July 1, 2013, for the Tranche A Notes to 7.907% per annum until the January 1, 2016 maturity date. The fixed interest rate for the unpaid portion of the Tranche B Notes, effective July 1, 2013, increased to 7.171% per annum until the January 1, 2016 maturity date. At the January 1, 2016 maturity date, a balloon payment of $45.6 million was due.
On December 18, 2014, the Company prepaid in full the Hancock Debt. The Company prepaid principal and interest on the Hancock Debt in the amount of $48.5 million, and paid the applicable Make-Whole Amount of $3.0 million, as calculated per the Senior Note Agreement, in connection with the prepayment. See Item 1.01. “Entry into a Material Definitive Agreement—Amendment and Restatement of Credit Facility” of the Company’s Current Report on Form 8-K, filed on December 19, 2014, for additional information.
The Company had a total of zero and $48.8 million outstanding at October 3, 2015 and September 27, 2014, respectively, in Hancock Debt.
Other Debt Agreements
During fiscal 2013, the Company entered into three secured credit facilities to finance our purchase of tractors. These agreements bear interest at a rate of 2.2% and mature in fiscal 2018. At October 3, 2015 and September 27, 2014, the outstanding loan balance under these three agreements totaled $1.4 million and $2.1 million, respectively.
Standby Letters of Credit
The Company had $1.5 million in standby letters of credit outstanding at October 3, 2015 and September 27, 2014 to secure various bank, insurance and vendor obligations.
8. Long-term Liabilities, Other
Long-term liabilities, other are summarized as follows:
| (dollars in thousands) | ||||||||
| October 3, 2015 |
September 27, 2014 |
|||||||
| Pension and postretirement benefit liabilities |
$ | 154,257 | $ | 129,486 | ||||
| Other long-term liabilities |
6,923 | 7,945 | ||||||
|
|
||||||||
| $ | 161,180 | $ | 137,431 | |||||
|
|
||||||||
9. Leases
Capital and Operating Leases
The Company has entered into operating leases and non-cancelable capital leases for warehouse, transportation and data processing equipment.
The Company has also entered into operating leases for approximately 23 retail supermarkets. The majority of these locations are subleased to various Members of the Company. The operating leases and subleases are non-cancelable, renewable in certain instances, include purchase options that are not bargain purchase options, and require payment of real estate taxes, insurance and maintenance.
Rent expense for operating leases was $18.1 million, $18.3 million and $21.8 million for the fiscal years ended October 3, 2015, September 27, 2014 and September 28, 2013, respectively. Sublease rental income was $3.9 million, $4.1 million and $5.2 million for the fiscal years ended October 3, 2015, September 27, 2014 and September 28, 2013, respectively.
111
Table of Contents
Minimum rentals on equipment under capital leases and properties leased by the Company, including properties subleased to third parties, as of October 3, 2015, are summarized as follows:
| (dollars in thousands) | ||||||||
| Fiscal year | Capital Leases |
Operating Leases |
||||||
| 2016 |
$ | 409 | $ | 20,900 | ||||
| 2017 |
417 | 19,096 | ||||||
| 2018 |
427 | 14,576 | ||||||
| 2019 |
436 | 9,019 | ||||||
| 2020 |
408 | 4,896 | ||||||
| Thereafter |
— | 5,227 | ||||||
|
|
||||||||
| Total minimum lease payments |
2,097 | $ | 73,714 | |||||
|
|
|
|||||||
| Less: amount representing interest |
— | |||||||
|
|
||||||||
| Present value of net minimum lease payments |
2,097 | |||||||
| Less: current installments of obligations under capital leases |
(409 | ) | ||||||
|
|
||||||||
| Obligations of capital leases excluding current installments |
$ | 1,688 | ||||||
|
|
||||||||
Future minimum sublease rental income on operating leases as of October 3, 2015 is summarized as follows:
| (dollars in thousands) | ||||
| Fiscal year | Operating Leases |
|||
| 2016 |
$ | 6,178 | ||
| 2017 |
4,931 | |||
| 2018 |
3,569 | |||
| 2019 |
2,910 | |||
| 2020 |
2,178 | |||
| Thereafter |
4,442 | |||
|
|
||||
| Total future minimum sublease income |
$ | 24,208 | ||
|
|
||||
Lease Guarantees
At October 3, 2015, the Company was contingently liable with respect to one (1) lease guarantee for a Member with a commitment expiring in 2017. The Company believes the location underlying this lease is marketable and, accordingly, that it will be able to recover a substantial portion of the guaranteed amount in the event the Company is required to satisfy its obligation under the guarantee.
The Company’s guarantee of this lease as of October 3, 2015 is summarized in the table below.
| (dollars in thousands) | ||||
| Remaining Lease Term | Guaranteed Leases |
|||
| Less than 1 year |
$ | 507 | ||
| 1-3 years |
338 | |||
| 4-5 years |
— | |||
| More than 5 years |
— | |||
|
|
||||
| Total lease guarantees |
$ | 845 | ||
|
|
||||
In consideration of lease guarantees and subleases, the Company typically receives a monthly fee equal to 5% of the monthly rent under the lease guarantees and subleases. Obligations of Members to the Company, including lease guarantees, are generally supported by the Company’s right of offset, upon default, against the Members’ cash deposits and shareholdings, as well as in certain instances, personal guarantees and reimbursement and indemnification agreements.
112
Table of Contents
10. Income Taxes
The significant components of income tax (benefit) expense are summarized as follows:
| (dollars in thousands) | ||||||||||||
| Fiscal Years Ended | ||||||||||||
| October 3, 2015 |
September 27, 2014 |
September 28, 2013 |
||||||||||
| Federal: |
||||||||||||
| Current |
$ | (635 | ) | $ | (7,842 | ) | $ | (1,821 | ) | |||
| Deferred |
(3,245 | ) | 7,399 | (6,299 | ) | |||||||
|
|
||||||||||||
| Total federal |
(3,880 | ) | (443 | ) | (8,120 | ) | ||||||
|
|
||||||||||||
| State: |
||||||||||||
| Current |
101 | 262 | 14 | |||||||||
| Deferred |
(172 | ) | 1,689 | 611 | ||||||||
|
|
||||||||||||
| Total state |
(71 | ) | 1,951 | 625 | ||||||||
|
|
||||||||||||
| Income taxes |
$ | (3,951 | ) | $ | 1,508 | $ | (7,495 | ) | ||||
|
|
||||||||||||
The effects of temporary differences and other items that give rise to deferred tax assets and liabilities are presented below:
| (dollars in thousands) | ||||||||
| October 3, 2015 |
September 27, 2014 |
|||||||
| Deferred tax assets: |
||||||||
| Accounts receivable |
$ | 1,636 | $ | 1,460 | ||||
| Accrued benefits |
59,513 | 55,820 | ||||||
| Lease reserves |
897 | 2,745 | ||||||
| Insurance reserves |
3,405 | 3,540 | ||||||
| Net operating loss carry forwards |
17,772 | 8,824 | ||||||
| Deferred patronage loss |
10,714 | 4,807 | ||||||
| Non-qualified written notice of allocation |
10,989 | 11,107 | ||||||
| Deferred loss on pending sale of discontinued operations |
527 | |||||||
| Inventory reserve |
1,801 | 583 | ||||||
| Credits |
3,316 | 3,278 | ||||||
| Interest capitalization |
250 | 315 | ||||||
| Deferred revenue |
185 | 91 | ||||||
| Other |
1,853 | 624 | ||||||
|
|
||||||||
| Total gross deferred tax assets |
$ | 112,858 | $ | 93,194 | ||||
| Less: Valuation allowance |
(29,322 | ) | (9,665 | ) | ||||
|
|
||||||||
| Total deferred tax assets net of valuation allowance |
$ | 83,536 | $ | 83,529 | ||||
| Deferred tax liabilities: |
||||||||
| Depreciation of properties and equipment |
$ | 36,202 | $ | 39,434 | ||||
| Market value adjustment |
1,031 | 1,821 | ||||||
| Capitalized software |
4,520 | 4,318 | ||||||
| Deferred state taxes |
681 | 616 | ||||||
| Other |
698 | 354 | ||||||
|
|
||||||||
| Total gross deferred tax liabilities |
$ | 43,132 | $ | 46,543 | ||||
|
|
||||||||
| Net deferred tax assets |
$ | 40,404 | $ | 36,986 | ||||
|
|
||||||||
The Company had net deferred tax assets of $40.4 million and $37.0 million, of which $9.2 million and $9.0 million are classified as deferred income taxes in current assets and $31.2 million and $28.0 million are included in other assets in the consolidated balance sheets as of October 3, 2015 and September 27, 2014, respectively.
113
Table of Contents
A valuation allowance is required to be provided to reduce the deferred tax assets to a level which, more likely than not, will be realized. The Company’s net deferred tax assets of approximately $40.4 million and $37.0 million were reduced by tax valuation allowances of $29.3 million and $9.7 million at October 3, 2015 and September 27, 2014, respectively. Management evaluated the available positive and negative evidence in determining the realizability of the net deferred tax assets at October 3, 2015 and September 27, 2014 and concluded it is more likely than not that the remaining deferred tax assets after applying the valuation allowances should be realized through future operating results, the reversal of taxable temporary differences, and tax planning strategies.
ASC 220, “Comprehensive Income,” requires an entity to disclose the amount of income tax expense or benefit allocated to each component of other comprehensive income (“OCI”) where these components are displayed. ASC 740, “Income Taxes,” prescribes an accounting model known as “intraperiod tax allocation” for allocating an entity’s annual income tax provision among continuing operations and other components, including OCI and discontinued operations. Pursuant to this guidance, the difference between total income tax expense or benefit from all components and the income tax expense or benefit from continuing operations is the incremental effect of items other than income from continuing operations. When a change in valuation allowance is directly attributable to an item of income or loss other than continuing operations, the tax consequence may be allocated to that other category of income or loss. Accordingly, $13.4 million and $6.2 million of valuation allowance have been recorded in OCI as of the fiscal years ended October 3, 2015 and September 27, 2014, respectively. Additionally, $2.2 million of valuation allowance has been recorded to discontinued operations as of the fiscal year ended October 3, 2015.
The Company had federal net operating loss carryforwards of approximately $15.9 million and $8.1 million and state net operating loss carryforwards of approximately $1.9 million and $0.7 million as of the fiscal years ended October 3, 2015 and September 27, 2014, respectively. A portion of the federal net operating loss is being carried forward under Internal Revenue Code Section 382 and expires in fiscal 2019 for federal income taxes. The remaining federal net operating loss carryforwards begin to expire in fiscal 2033. The state net operating loss carryforwards begin to expire in fiscal 2017.
The (benefit) provision for income taxes at the Company’s effective tax rate differed from the provision for income taxes at the federal statutory rate (34%, 34% and 34% in 2015, 2014 and 2013, respectively) as follows:
| (dollars in thousands) | ||||||||||||
| Fiscal Years Ended | ||||||||||||
| October 3, 2015 |
September 27, 2014 |
September 28, 2013 |
||||||||||
| Federal income tax (benefit) expense at the statutory rate |
$ | (6,323 | ) | $ | 368 | $ | (6,792 | ) | ||||
| State income taxes, net of federal income tax benefit |
(47 | ) | 1,288 | 412 | ||||||||
| Life insurance |
539 | (423 | ) | (901 | ) | |||||||
| Adjustment to prior year tax liabilities |
(104 | ) | 442 | (21 | ) | |||||||
| Meals and entertainment |
85 | 122 | 170 | |||||||||
| Valuation allowance |
2,436 | — | — | |||||||||
| Liability for unrecognized tax benefits |
(418 | ) | (458 | ) | (183 | ) | ||||||
| Other, net |
(119 | ) | 169 | (180 | ) | |||||||
|
|
||||||||||||
| (Benefit) provision for income taxes |
$ | (3,951 | ) | $ | 1,508 | $ | (7,495 | ) | ||||
|
|
||||||||||||
At October 3, 2015, management is currently unaware of any issues under review that could result in significant payments, accruals or material deviations from its recognized tax positions. The Company continues to recognize interest and penalties accrued related to unrecognized tax benefits and penalties within its provision for income taxes. The Company had no material interest and penalties accrued at October 3, 2015.
As of October 3, 2015, the Company is subject to income tax examinations for its U.S. federal income taxes for fiscal years 2012 and thereafter and for state and local income taxes for fiscal years 2011 and thereafter. The Company is currently not under audit for any of its income tax jurisdictions.
114
Table of Contents
11. Patronage Dividends
Unified distributes patronage dividends to its Members based upon its patronage earnings during a fiscal year. Non-Member customers are not entitled to receive patronage dividends. The Board approves the payment of patronage dividends and the form of such payment for the Company’s three patronage earnings divisions: the Southern California Dairy Division, the Pacific Northwest Dairy Division and the Cooperative Division.
| · | Southern California Dairy Division: Patronage earnings attributable to the Southern California Dairy Division are produced from sales of products primarily manufactured at a milk and fruit drink bottling plant located in Los Angeles, California. Patronage dividends for this division are paid solely to Members who purchase dairy and other related products from the Southern California Dairy Division. We will cease operating this facility in July 2016 but will continue offering fluid milk and other products, including our private label brands, to our Members and customers through a vendor direct arrangement with Alta-Dena Certified Dairy, LLC, a wholly-owned subsidiary of Dean Foods Company. Coincident with this change, the Company will no longer pay patronage dividends on products supplied by Dean Foods Company. |
| · | Pacific Northwest Dairy Division: Patronage earnings attributable to the Pacific Northwest Dairy Division are produced from sales of dairy products manufactured by third party suppliers located in Oregon. Patronage dividends for this division are paid solely to Members who purchase dairy products from the Pacific Northwest Dairy Division. In conjunction with the changes to the Southern California Dairy Division discussed above, the Pacific Northwest Dairy Division will no longer pay patronage dividends on sales of dairy products beginning in June 2016. |
| · | Cooperative Division: Patronage earnings attributable to the Cooperative Division are produced from all patronage activities of Unified other than the Southern California and Pacific Northwest Dairy Divisions regardless of geographic location. Patronage dividends for this division are paid based on the qualified patronage purchases of the following types of products: dry grocery, deli, health and beauty care, tobacco, general merchandise, frozen food, ice cream, meat, produce and bakery. Additionally, beginning in fiscal 2015, food products such as Hispanic, other ethnic, gourmet, natural, organic and other specialty foods sold to Members through our Market Centre division are included in patronage earnings and may be eligible for patronage distributions. Historically the Company has distributed patronage dividends in cash, Class B and Class E shares and patronage dividend certificates. We also sell products carried in the Cooperative Division to small Non-Member customers through our Market Centre division. We retain the earnings from such business with Non-Member customers and do not pay patronage dividends on those sales. |
The following table summarizes the patronage dividend earnings of Unified during the past three fiscal years.
| (dollars in thousands) | ||||||||||||
| Division | 2015 | 2014 | 2013 | |||||||||
| Cooperative |
$ | — | $ | — | $ | — | ||||||
| Southern California Dairy |
6,450 | 8,530 | 8,609 | |||||||||
| Pacific Northwest Dairy |
784 | 865 | 1,000 | |||||||||
|
|
||||||||||||
| Total |
$ | 7,234 | $ | 9,395 | $ | 9,609 | ||||||
|
|
||||||||||||
For fiscal 2015, 2014 and 2013, there were no Cooperative Division patronage earnings available for distribution.
The financial statements reflect patronage dividends earned by Members as of the fiscal year ended October 3, 2015.
Patronage dividends produced by the dairy divisions are paid quarterly and have historically been paid in cash.
12. Capital Shares
Member Requirements
Members of Unified are both owners and customers of the Company. A Member must (1) own 350 Class A Shares and a number of Class B Shares based upon the amount of such Member’s average weekly purchases of product
115
Table of Contents
from the Company, or as otherwise specified by the Board; (2) be of approved financial standing; (3) be engaged in selling grocery and related products at retail or wholesale; (4) purchase products from the Company in amounts and in a manner that is established by the Board; (5) make application in such form as is prescribed by the Company; and (6) be accepted as a Member by Board action.
Members of Unified are typically required to satisfy a minimum purchase requirement of $1 million in annual purchases from the Company. This requirement may be modified from time to time by the Board, having been most recently changed in April 2008 at the time of the AG Acquisition. Members at the time of this change, or who were shareholders or customers of AG who became Members in connection with the AG Acquisition, remain subject to the earlier requirement of $5,000 per week in purchases from the Company.
A customer that does not meet the requirements to be a Member, or does not desire to become a Member, may conduct business with the Company as a Non-Member. However, any customer that purchases more than $3 million of product from the Company annually is typically required to be a Member.
Ownership and Exchange of Shares
The Class A and Class B Shares are issued by Unified to its Members, and repurchased by the Company from its Members, a process referred to as the exchange of shares, in accordance with the Company’s share purchase requirements and at a price (the “Exchange Value Per Share”) based on a formula approved by the Board. The Exchange Value Per Share, as currently calculated, is equal to Book Value (as defined below) divided by the number of Class A and Class B Shares outstanding at the end of the fiscal year, excluding shares tendered for redemption. “Book Value” is computed based on (1) the fiscal year end balance of Class A and Class B Shares, excluding the redemption value of unredeemed shares tendered for redemption, plus (2) retained earnings, excluding non-allocated retained earnings. The Exchange Value Per Share, as currently calculated, is equal to Book Value (as defined below) divided by the number of Class A and Class B Shares outstanding at the end of the fiscal year, excluding shares tendered for redemption. “Book Value” is computed based on (1) the fiscal year end balance of Class A and Class B Shares, excluding the redemption value of unredeemed shares tendered for redemption, plus (2) retained earnings, excluding non-allocated retained earnings.
Exchange Value Per Share does not necessarily reflect the amount for which the net assets of the Company could be sold or the dollar amount that would be required to replace them.
The Non-Allocated Earnings Program authorizes the Board, in its sole discretion, to retain a portion of the Company’s annual earnings from its Non-Patronage Business and not allocate those earnings to the Exchange Value Per Share. The Company retained zero of fiscal 2015, fiscal 2014 and fiscal 2013 non-patronage earnings under the Non-Allocated Earnings Program. The amount retained is not included in computing the issuance and redemption prices of the Class A or Class B Shares. In addition, the Non-Allocated Earnings Program grants the Board the authority to reallocate the non-allocated earnings back to the Exchange Value Per Share. The Non-Allocated Earnings Program authorizes the Board to establish a category of non-allocated equity, but does not restrict the uses of that non-allocated equity. The Board intends to use the non-allocated equity authorized by the Non-Allocated Earnings Program for the same general purposes as the Board uses the Company’s retained earnings, including support of the growth of its business, other than the payment of the redemption price of Class A and Class B Shares.
The Class C and Class E Shares are exchanged with the Company’s directors and Members, respectively, at a fixed stated value.
Classes of Shares
Class A Shares
The Company’s Bylaws require that each Member own 350 Class A Shares, though in certain instances the Board may accept for membership an affiliate of a Member without such affiliate holding any Class A Shares where the owners of such affiliate are the same, or sufficiently the same, as those of the Member, and the Member already
116
Table of Contents
holds the required number of Class A Shares. Holders of Class A Shares are entitled to one vote per share on all matters to be voted upon by the shareholders, and the holders of the Class A Shares are entitled to elect 80% of the Company’s authorized number of directors. If a person holding Class A Shares ceases to be a Member, the Class A Shares held by such outgoing Member are subject to redemption. See “—Redemption of Class A and Class B Shares and Repurchase of Class E Shares.”
Such persons or entities who from time to time may be accepted as new Members of Unified will be required to purchase or subscribe for the purchase of the number of Class A Shares in the manner set forth in the preceding paragraph. The price for these shares is the Exchange Value Per Share of the Company’s outstanding shares at the close of the fiscal year end prior to purchase. At October 3, 2015 and September 27, 2014, the Exchange Value Per Share was $218.27 and $267.69, respectively.
Class B Shares
The Company’s Bylaws require that each Member own such amount of Class B Shares as may be established by the Board. The holders of Class B Shares have the right to elect 20% of the Company’s authorized number of directors. Except as provided above or by California law, the holders of Class B Shares do not have any other voting rights. Any Class B Shares held by an outgoing Member or which are held by a Member in an amount in excess of that required by the Board are subject to redemption. See “—Redemption of Class A and Class B Shares and Repurchase of Class E Shares.”
The Company’s Board currently requires each Member to hold Class B Shares having an issuance value equal to approximately twice the Member’s average weekly purchases from the Cooperative Division, except that as to meat and produce purchases the requirement is approximately one times the Member’s average weekly purchases from the Cooperative Division (the “Class B Share Requirement”). If purchases are not made weekly, the average weekly purchases are based on the number of weeks in which purchases were actually made. For purposes of determining whether a Member holds Class B Shares having an issuance value satisfying the Class B Share Requirement, the issuance value of each Class B Share held by the Member is deemed to be the Exchange Value Per Share in effect at the close of the fiscal year end prior to the issuance of such Class B Share.
One of the ways in which Members may acquire Class B Shares is through the Company’s payment of Cooperative Division patronage dividends at the end of the Company’s fiscal year. If a Member, at the time a patronage dividend is declared, has not satisfied its Class B Share Requirement, the Company may issue Class B Shares to such Member as a portion of the Cooperative Division patronage dividends paid. As Class B Shares are issued as part of a Member’s patronage dividend distribution, the issuance value of such Class B Shares adds to the amount of Class B Shares held by such Member for purposes of satisfying the Class B Share Requirement.
The Class B Share Requirement is determined twice a year, at the end of the Company’s second and fourth fiscal quarters, based on a Member’s purchases from the Cooperative Division during the preceding four quarters. If at the end of the Company’s second fiscal quarter, after giving effect to the value of Class B Shares estimated to be issued as part of the next Cooperative Division patronage dividend, a Member does not hold Class B Shares with a combined issuance value equal to the required amount of Class B Shares, the Company will typically require the Member to make a subordinated deposit (a “Required Deposit”) which may, at the Company’s option, be paid over a 26-week period. If at the end of the Company’s fourth fiscal quarter, after accounting for the issuance of Class B Shares as part of the Cooperative Division patronage dividend distribution declared for such fiscal year after the first year as a Member, a Member does not hold Class B Shares with a combined issuance value equal to the required amount of Class B Shares, then additional Class B Shares must be purchased by the Member in an amount sufficient to satisfy the requirement. The additional Class B Shares may be paid for by the Company charging the Member’s deposit fund in an amount equal to the issuance value of the additional Class B Shares or by direct purchase by the Member, which may be paid over a 26-week period. The Board may increase or otherwise change the Class B Share Requirement at its discretion.
In September 1999, the Company completed a merger (the “United Merger”) with United Grocers, Inc. (“United”), a grocery cooperative headquartered in Milwaukie, Oregon. In October 2007, the Company purchased certain assets and assumed certain liabilities of AG and its subsidiaries. Certain Members, including former shareholders of United and AG, also may satisfy their Class B Share Requirement with respect to stores owned at the time of
117
Table of Contents
admission as a Member solely from their patronage dividend distributions by electing to receive Class B Shares in lieu of 80% of the Cooperative Division qualified cash patronage dividends the Member otherwise would receive in the future until the Class B Share Requirement is satisfied. In order to make the election to satisfy their Class B Share Requirement solely from patronage dividend distributions, former shareholders of AG were required to enter into supply agreements with us. During the build-up of its Class B Share Requirement, such a Member is not required to provide a Required Deposit with respect to stores owned at the time of admission as a Member. Satisfaction of the Class B Share Requirement of such Members relating to new stores or growth in the sales of existing stores may not be satisfied solely from their patronage dividend distributions, but is subject to the same payment requirements that apply to other Members.
New Members typically must satisfy their Class B Share Requirement in one of two ways: (1) the purchase of Class B Shares at the time of their admission as a Member such that the required amount is held at that time; or (2) the acquisition of Class B Shares over a five-year period commencing at the start of the Company’s first fiscal year after the Member’s admission, at the rate of 20% of the required amount per fiscal year, such that by the start of the Company’s sixth full fiscal year after the Member’s admission, the required amount is held. If a new Member elects to satisfy the Class B Share Requirement through the acquisition of shares over a five-year period, it is typically required to make a Required Deposit with the Company for the full required amount during the five-year build-up of the Class B Share Requirement. The Required Deposit may generally be paid either in full upon acceptance as a Member or 75% upon acceptance and the balance paid over a 26-week period.
Required Deposits for new stores, replacement stores or growth in the sales of existing stores can be paid either in full or with a 50% down payment and the balance paid over a 26-week period.
The Company may make modifications to the requirements as to the timing of the purchase of Class B Shares and the timing and amount of the Required Deposit on a case-by-case basis, based on the particular circumstances of a Member.
A reduced investment option in lieu of the standard Class B Share Requirement (“SBI”) described above is available if certain qualifications are met. A Member may apply for a reduced Class B Share requirement (“RBI”), which requires the Member to pay for its purchases electronically on the statement due date and demonstrate credit-worthiness. The purpose of the RBI is to encourage Member growth by offering a reduced requirement if the qualifications are met and to provide a cap on the investment requirement at certain volume levels. The RBI is based on a sliding scale such that additional purchase volume marginally reduces the requirement as a percentage of purchase volume. Members who do not apply for the RBI remain on the SBI. However, once a Member has elected the RBI option, it must notify the Company in writing if it wishes to change its election. Generally, changes can only be made at the time of the second quarter recalculation of the Class B Share Requirement in March.
Class C Shares
Certain of the Company’s directors hold Class C Shares. Each of such directors purchased one Class C Share for its stated value. Class C Shares are non-voting director qualifying shares, with no rights as to dividends or other distributions, and share in liquidation at their stated value of $10 per share. There are 24 authorized Class C Shares, of which 15 were outstanding as of October 3, 2015 and September 27, 2014.
Class E Shares
Class E Shares were issued as a portion of the Cooperative Division patronage dividends in fiscal years 2003 through 2009, and may be issued as a portion of the Cooperative Division patronage dividends in future periods, as determined annually at the discretion of the Board. The Class E Shares have a stated value of $100 per share are subject to repurchase by the Company at $100 per share, do not have the potential to appreciate over time, do not accrue interest, and have no voting rights except as required by law. The Board does not intend to declare ordinary dividends on Class E Shares in the future. Class E Shares are transferable only with the consent of the Company, which will normally be withheld except in connection with the transfer of a Member’s business to an existing or new Member for continuation of such business. Class E Shares become eligible for repurchase at the discretion of the Board ten years after their date of issuance. Pursuant to the Company’s redemption policy, Class E Shares will not be repurchased for ten years from their date of issuance unless approved by the Board or
118
Table of Contents
upon sale or liquidation of the Company, with the outstanding Class E Shares becoming eligible for repurchase between the end of fiscal 2013 and the end of fiscal 2018. Thereafter, shares may be repurchased by the Company subject to the limitations of California General Corporation Law, credit agreements, the Articles of Incorporation and Bylaws, redemption policy and approval by the Board.
Redemption of Class A and Class B Shares and Repurchase of Class E Shares
Unified’s Articles of Incorporation and Bylaws provide that the Board has the absolute discretion to repurchase, or not repurchase, any Class A, Class B or Class E Shares of any outgoing Member regardless of when the membership terminated, and any Class B Shares in excess of the Class B Share Requirement (“Excess Class B Shares”) held by a current Member, whether or not the shares have been tendered for repurchase and regardless of when the shares were tendered. The Board considers the redemption of eligible Class A Shares at each board meeting. All other shares eligible for redemption are considered by the Board on an annual basis, usually in December. Class E Shares will only be repurchased upon approval of the Board or upon sale or liquidation of the Company, and the repurchase price for the Class E Shares is fixed at their stated value of $100 per share.
Excess Class B Shares may be redeemed at the sole discretion of the Board. If the Member tendering the shares for repurchase is current on all obligations owing to the Company, and no grounds exist for termination of membership, such redemption may be affected by paying cash to the Member or crediting the redemption price to the Member’s account. The redemption price for such shares shall be the same as provided on the termination of membership. If the Member tendering the shares for repurchase is not current on all obligations owing to the Company, and no grounds exist for termination of membership, the Company may redeem such Excess Class B Shares and apply the proceeds against all amounts owing to the Company.
The right to deduct any amounts owing to the Company against the total redemption price for shares is solely at the Company’s option. Shareholders may not offset or recoup any obligations to the Company or otherwise refuse to pay any amounts owed to the Company.
The Company’s redemption policy currently provides that the number of Class B Shares that Unified may redeem in any fiscal year is limited to no more than 5% of the sum of:
| · | The number of Class B Shares outstanding at the close of the preceding fiscal year end; and |
| · | The number of Class B Shares issuable as a part of the patronage dividend distribution for the preceding fiscal year. |
Unified’s Board has the absolute discretion to redeem Excess Class B Shares or to redeem Class A and Class B or repurchase Class E Shares of any outgoing Member regardless of when the membership terminated or the Class B Shares were tendered. The Board also has the right to elect to redeem Excess Class B or repurchase Class E Shares even though such redemption or repurchase has not been requested and without regard to each year’s five percent limit or any other provision of the redemption policy.
Subject to the Board’s determination and approval, any redemption or repurchase of shares will be on the terms and, subject to the limitations and restrictions, if any, set forth in the California General Corporation Law, the Company’s Articles of Incorporation and Bylaws, credit agreements to which the Company is a party, and the Company’s redemption policy, which is subject to change at the sole discretion of the Board.
The following tables summarize the Class A and Class B Shares tendered for redemption, shares converted, shares redeemed, and the remaining number of shares and their aggregated redemption value pending redemption at the fiscal year end of each of the following periods:
| (dollars in thousands) | ||||||||||||||||||||
| Class A Shares | Tendered | Converted(a) | Redeemed | Remaining | Redemption Fiscal year end |
|||||||||||||||
| Fiscal 2012 |
2,450 | $ | 765 | |||||||||||||||||
| Fiscal 2013 |
10,500 | (350 | ) | 11,900 | 700 | $ | 221 | |||||||||||||
| Fiscal 2014 |
10,500 | 9,800 | 1,400 | $ | 391 | |||||||||||||||
| Fiscal 2015 |
7,350 | 7,000 | 1,750 | $ | 489 | |||||||||||||||
|
|
||||||||||||||||||||
119
Table of Contents
| (dollars in thousands) | ||||||||||||||||
| Class B Shares | Tendered | Redeemed | Remaining |
Redemption Fiscal year end |
||||||||||||
| Fiscal 2012 |
78,309 | $ | 23,837 | |||||||||||||
| Fiscal 2013 |
10,034 | 9,567 | 78,776 | $ | 24,207 | |||||||||||
| Fiscal 2014 |
29,534 | 19,267 | 89,043 | $ | 26,841 | |||||||||||
| Fiscal 2015 |
8,535 | 2,985 | 94,593 | $ | 28,226 | |||||||||||
|
|
||||||||||||||||
| (a) | Typically, a conversion of Class A Shares to Class B Shares occurs when Members combine or a Member purchases another Member, and in order to avoid duplicative holding of Class A Shares, the additional Class A Shares acquired as a result of such activities are converted into Class B Shares. |
At the end of fiscal 2014 and 2013, Class E Shares issued as a portion of fiscal 2004 and 2003 patronage dividends became eligible for repurchase in fiscal 2015 and 2014. During fiscal 2015 and 2014, respectively, the Company repurchased 2,809 and 42,890 Class E Shares at a price of $0.3 million and $4.3 million.
13. Benefit Plans
The Company sponsors a cash balance plan (“Unified Cash Balance Plan”). The Unified Cash Balance Plan is a noncontributory defined benefit pension plan covering substantially all employees of the Company who are not subject to a collective bargaining agreement. Under the Unified Cash Balance Plan, participants are credited with an annual accrual based on years of service with the Company. The Unified Cash Balance Plan balance receives an annual interest credit, currently tied to the 30-year Treasury rate that is in effect the previous November, but in no event shall the rate be less than 5%. On retirement, participants will receive a lifetime annuity based on the total hypothetical cash balance in their account. Benefits under the Unified Cash Balance Plan are provided through a trust. Prior to the end of fiscal 2014, the Company amended the Unified Cash Balance Plan to close the plan to new entrants effective December 31, 2014. In addition, the plan was frozen at December 31, 2014 such that current participants will no longer accrue salary-based service credits based on years of service with the Company and pensionable compensation after that date. The annual interest credit as described above will continue for participants active in the plan as of December 31, 2014. Selected groups of vested terminated participants were each given one-time opportunities to elect a lump sum distribution of their benefits or immediate receipt of an annuity as of December 2015 and December 2014. As a result, benefit payments of $8.7 million and $7.9 million, respectively, were distributed from the plan’s assets to those participants who elected such option prior to the end of each of the Company’s first quarters ended January 2, 2016 and December 27, 2014.
The Company also sponsors an Executive Salary Protection Plan III (“ESPPIII”) that provides supplemental post-termination retirement income based on each participant’s salary and years of service as an officer of the Company. Depending on when the officer became a participant in the ESPPIII, final salary is defined as the highest compensation of the last three years preceding employment separation or the average of the highest five years of compensation out of the last ten years preceding employment separation. The Company has informally funded its obligation to plan participants in a rabbi trust (not considered plan assets for valuation purposes), comprised primarily of life insurance policies reported at cash surrender value and mutual fund assets consisting of various publicly-traded mutual funds reported at estimated fair value based on quoted market prices. In accordance with ASC Topic 710, “Compensation – General”, the assets and liabilities of a rabbi trust must be accounted for as if they are assets and liabilities of the Company. The assets held in the rabbi trust are not available for general corporate purposes. In addition, all earnings and expenses of the rabbi trust are reported in the Company’s consolidated statement of earnings. The cash surrender value of such life insurance policies aggregated $20.8 million and $21.1 million at October 3, 2015 and September 27, 2014, respectively, and are included in other assets in the Company’s consolidated balance sheets. Mutual funds reported at their estimated fair value of $10.5 million and $14.7 million at October 3, 2015 and September 27, 2014, respectively, are included in other assets in the Company’s consolidated balance sheets. The related accrued benefit cost (representing the Company’s benefit obligation to participants) of $40.7 million and $42.0 million at October 3, 2015 and September 27, 2014, respectively, is recorded in long-term liabilities, other in the Company’s consolidated balance sheets. The rabbi trust is subject to the Company’s creditors’ claims in the event of its insolvency. The ESPPIII accrued benefit cost is included in the pension tables below. However, the trust assets are excluded from ESPPIII plan assets as they do not qualify as plan assets under ASC Topic 715, “Compensation – Retirement Benefits”.
120
Table of Contents
Pension (benefit) expense for the Unified Cash Balance Plan and ESPPIII totaled $(0.8) million, $5.9 million and $12.5 million for the fiscal years ended October 3, 2015, September 27, 2014 and September 28, 2013, respectively.
The components of net periodic cost for the Unified Cash Balance Plan and ESPPIII consist of the following (measured at September 30, 2015, 2014 and 2013 for fiscal 2015, 2014 and 2013, respectively):
| (dollars in thousands) | ||||||||||||
| Fiscal Years Ended | ||||||||||||
| Unified Cash Balance Plan | October 3, 2015 |
September 27, 2014 |
September 28, 2013 |
|||||||||
| Service cost |
$ | 1,289 | $ | 4,993 | $ | 6,417 | ||||||
| Interest cost |
10,711 | 11,689 | 10,387 | |||||||||
| Expected return on plan assets |
(16,553 | ) | (16,185 | ) | (14,645 | ) | ||||||
| Amortization of prior service cost |
— | 11 | 10 | |||||||||
| Actuarial loss |
994 | 1,384 | 6,196 | |||||||||
| Curtailment loss |
— | 34 | — | |||||||||
|
|
||||||||||||
| Net periodic (benefit) cost |
$ | (3,559 | ) | $ | 1,926 | $ | 8,365 | |||||
|
|
||||||||||||
| (dollars in thousands) | ||||||||||||
| Fiscal Years Ended | ||||||||||||
| ESPPIII | October 3, 2015 |
September 27, 2014 |
September 28, 2013 |
|||||||||
| Service cost |
$ | 987 | $ | 1,241 | $ | 1,878 | ||||||
| Interest cost |
1,409 | 1,457 | 1,318 | |||||||||
| Amortization of prior service cost (credit) |
(27 | ) | (27 | ) | (20 | ) | ||||||
| Recognized actuarial loss |
434 | 1,349 | 930 | |||||||||
|
|
||||||||||||
| Net periodic cost |
$ | 2,803 | $ | 4,020 | $ | 4,106 | ||||||
|
|
||||||||||||
The Company’s fiscal 2015 pension expense includes an approximate $1.4 million charge for the Unified Cash Balance Plan and ESPPIII plan combined as a result of amortizing net prior service credits of $27 thousand and an actuarial loss of $1.4 million from accumulated other comprehensive income into pension expense over the 2015 fiscal year.
The Company’s projected fiscal 2016 pension expense includes an approximate $2.1 million charge for the Unified Cash Balance Plan and ESPPIII plan combined which are expected to be recognized as a result of amortizing projected net prior service credits of $7 thousand and a projected actuarial loss of $2.1 million from accumulated other comprehensive income into pension expense over the 2016 fiscal year.
The combined projected plan benefit obligation for the Unified Cash Balance Plan and ESPPIII is $305.6 million and $306.0 million at the end of the year for fiscal 2015 and 2014, respectively.
121
Table of Contents
The following table sets forth the change in benefit obligation for the Unified Cash Balance Plan and ESPPIII (measured at September 30, 2015 and 2014 for fiscal 2015 and 2014, respectively):
| (dollars in thousands) | ||||||||||||||||
| Unified Cash Balance Plan | ESPPIII | |||||||||||||||
| October 3, 2015 |
September 27, 2014 |
October 3, 2015 |
September 27, 2014 |
|||||||||||||
| Benefit obligation at beginning of year |
$ | 263,999 | $ | 238,935 | $ | 41,961 | $ | 43,334 | ||||||||
| Service cost |
1,289 | 4,993 | 987 | 1,241 | ||||||||||||
| Interest cost |
10,711 | 11,689 | 1,409 | 1,457 | ||||||||||||
| Plan amendments |
— | — | — | — | ||||||||||||
| Actuarial loss (gain)(a) |
6,090 | 23,013 | 121 | (641 | ) | |||||||||||
| Benefits paid |
(17,199 | ) | (9,541 | ) | (3,780 | ) | (3,430 | ) | ||||||||
| Curtailment |
— | (5,090 | ) | — | — | |||||||||||
|
|
||||||||||||||||
| Benefit obligation at end of year |
$ | 264,890 | $ | 263,999 | $ | 40,698 | $ | 41,961 | ||||||||
|
|
||||||||||||||||
| (a) | The actuarial loss in fiscal 2015 for the Unified Cash Balance Plan was primarily due to demographic experience, including assumption changes, and investment returns on plan assets that were lower than assumed. For the fiscal year end 2015 valuation, as further described below, the Company changed its mortality assumption subsequent to the release of two mortality reports issued by the Society of Actuaries’ Retirement Plans Experience Committee. This change caused the funded position to deteriorate. Partially offsetting the mortality assumption change was an increase in the discount rate (from 4.25% to 4.45%). The actuarial loss in fiscal 2014 for the Unified Cash Balance Plan was primarily due to the change in the discount rate (from 5.00% to 4.25%). The actuarial loss in fiscal 2015 for the ESPPIII includes losses of approximately $0.3 million resulting from a decrease in the prescribed PBGC rate used to convert the normal form of benefit payment (15-year certain) into the optional forms of payment (5 or 10-year certain), partially offset by demographic gains (such as delayed retirements compared to projected retirements) of approximately $0.2 million. The actuarial gain in fiscal 2014 for the ESPPIII includes gains of approximately $0.3 million resulting from an increase in the prescribed PBGC rate used to convert the normal form of benefit payment (15-year certain) into the optional forms of payment (5 or 10-year certain), as well as demographic gains (such as delayed retirements compared to projected retirements) of approximately $0.3 million. |
The following table sets forth the change in plan assets for the Unified Cash Balance Plan and ESPPIII (measured at September 30, 2015 and 2014 for fiscal 2015 and 2014, respectively):
| (dollars in thousands) | ||||||||||||||||
| Unified Cash Balance Plan | ESPPIII | |||||||||||||||
| October 3, 2015 |
September 27, 2014 |
October 3, 2015 |
September 27, 2014 |
|||||||||||||
| Fair value of plan assets at beginning of year |
$ | 218,895 | $ | 202,708 | $ | — | $ | — | ||||||||
| Actual return on plan assets |
(6,750 | ) | 17,350 | — | — | |||||||||||
| Employer contribution |
— | 8,378 | 3,780 | 3,430 | ||||||||||||
| Benefits paid |
(17,199 | ) | (9,541 | ) | (3,780 | ) | (3,430 | ) | ||||||||
|
|
||||||||||||||||
| Fair value of plan assets at end of year |
$ | 194,946 | $ | 218,895 | $ | — | $ | — | ||||||||
|
|
||||||||||||||||
The accrued pension and other benefit costs recognized for the Unified Cash Balance Plan and ESPPIII in the consolidated balance sheets are computed as follows:
| (dollars in thousands) | ||||||||||||||||
| Unified Cash Balance Plan | ESPPIII | |||||||||||||||
| October 3, 2015 |
September 27, 2014 |
October 3, 2015 |
September 27, 2014 |
|||||||||||||
| Funded status at September 30, 2015 and 2014, respectively (under-funded) |
$ | (69,944 | ) | $ | (45,104 | ) | $ | (40,698 | ) | $ | (41,961 | ) | ||||
|
|
||||||||||||||||
| Net amount recognized |
$ | (69,944 | ) | $ | (45,104 | ) | $ | (40,698 | ) | $ | (41,961 | ) | ||||
|
|
||||||||||||||||
122
Table of Contents
The following table sets forth the amounts recognized in the consolidated balance sheets for the Unified Cash Balance Plan and ESPPIII (measured at September 30, 2015 and 2014 for fiscal 2015 and 2014, respectively):
| (dollars in thousands) | ||||||||||||||||
| Unified Cash Balance Plan | ESPPIII | |||||||||||||||
| October 3, 2015 |
September 27, 2014 |
October 3, 2015 |
September 27, 2014 |
|||||||||||||
| Prepaid (accrued) benefit cost |
$ | 11,261 | $ | 7,702 | $ | (35,466 | ) | $ | (36,443 | ) | ||||||
| Accumulated other comprehensive loss |
(81,205 | ) | (52,806 | ) | (5,232 | ) | (5,518 | ) | ||||||||
|
|
||||||||||||||||
| Net amount recognized |
$ | (69,944 | ) | $ | (45,104 | ) | $ | (40,698 | ) | $ | (41,961 | ) | ||||
|
|
||||||||||||||||
Total net accrued benefit costs of $110.6 million and $87.0 million at October 3, 2015 and September 27, 2014, respectively, are included in the consolidated balance sheets as follows: $107.0 million and $83.6 million are included in long-term liabilities, other and $3.6 million and $3.4 million are included in accrued liabilities at October 3, 2015 and September 27, 2014, respectively.
The following table reconciles the change in net periodic benefit cost, plan assets, benefit obligation and accumulated other comprehensive (income) loss (and components thereof) for the Unified Cash Balance Plan:
| (dollars in thousands) | ||||||||||||||||||||||||||||
| Unified Cash Balance Plan | Accumulated Other Comprehensive Income Components |
|||||||||||||||||||||||||||
| October 3, 2015 | Annual Cost (benefit) |
Fiscal 2009 ASC 715-20 Measurement Date Adjustments to Retained Earnings |
Plan Assets |
Benefit Obligation |
Accumulated Other Comprehensive (Income)/Loss |
Deferred
Plan Amendment (Unrecognized Prior Service Cost) |
Deferred Actuarial (Gains)/ Losses |
|||||||||||||||||||||
| Beginning balance |
$ | 673 | $ | 218,895 | $ | (263,999 | ) | $ | 52,806 | $ | — | $ | 52,806 | |||||||||||||||
| Service cost |
$ | 1,289 | — | — | (1,289 | ) | — | — | — | |||||||||||||||||||
| Interest cost |
10,711 | — | — | (10,711 | ) | — | — | — | ||||||||||||||||||||
| Actual return loss/(gain) |
6,750 | — | (6,750 | ) | — | — | — | — | ||||||||||||||||||||
|
|
|
|||||||||||||||||||||||||||
| Basic annual cost |
18,750 | — | — | — | — | — | — | |||||||||||||||||||||
| Contributions |
— | — | — | — | — | — | — | |||||||||||||||||||||
| Benefits paid |
— | — | (17,199 | ) | 17,199 | — | — | — | ||||||||||||||||||||
| Deferrals |
||||||||||||||||||||||||||||
| Unexpected return adjustment |
(23,303 | ) | — | — | — | 23,303 | — | 23,303 | ||||||||||||||||||||
| Unrecognized actuarial loss/(gain) |
— | — | — | (6,090 | ) | 6,090 | — | 6,090 | ||||||||||||||||||||
| Plan Amendments – curtailment |
— | — | — | |||||||||||||||||||||||||
| Amortization |
||||||||||||||||||||||||||||
| Prior service cost |
— | — | — | — | — | — | — | |||||||||||||||||||||
| Unrecognized actuarial loss/(gain) |
994 | — | — | — | (994 | ) | — | (994 | ) | |||||||||||||||||||
| Curtailment loss |
— | — | — | — | — | — | ||||||||||||||||||||||
|
|
|
|
||||||||||||||||||||||||||
| Ending balance |
$ | (3,559 | ) | $ | 673 | $ | 194,946 | $ | (264,890 | ) | $ | 81,205 | $ | — | $ | 81,205 | ||||||||||||
|
|
||||||||||||||||||||||||||||
123
Table of Contents
The following table reconciles the change in net periodic benefit cost, plan assets, benefit obligation and accumulated other comprehensive (income) loss (and components thereof) for the ESPPIII:
| (dollars in thousands) | ||||||||||||||||||||||||||||
| ESPPIII Plan | Accumulated Other Comprehensive Income Components |
|||||||||||||||||||||||||||
| October 3, 2015 | Annual Cost |
Fiscal 2009 ASC 715-20 Measurement Date Adjustments to Retained Earnings |
Plan Assets |
Benefit Obligation |
Accumulated Other Comprehensive (Income)/Loss |
Deferred Prior Service (Credit)/ Cost |
Deferred Actuarial (Gains)/ Losses |
|||||||||||||||||||||
| Beginning balance |
$ | 958 | $ | — | $ | (41,961 | ) | $ | 5,518 | $ | (33 | ) | $ | 5,551 | ||||||||||||||
| Service cost |
$ | 987 | — | — | (987 | ) | — | — | — | |||||||||||||||||||
| Interest cost |
1,409 | — | — | (1,409 | ) | — | — | — | ||||||||||||||||||||
|
|
|
|||||||||||||||||||||||||||
| Basic annual cost |
2,396 | — | — | — | — | — | — | |||||||||||||||||||||
| Contributions |
— | — | 3,780 | — | — | — | — | |||||||||||||||||||||
| Benefits paid |
— | — | (3,780 | ) | 3,780 | — | — | — | ||||||||||||||||||||
| Deferrals |
||||||||||||||||||||||||||||
| Plan amendments |
— | — | — | — | — | |||||||||||||||||||||||
| Unrecognized actuarial loss/(gain) |
— | — | — | (121 | ) | 121 | — | 121 | ||||||||||||||||||||
| Amortization |
||||||||||||||||||||||||||||
| Prior service (credit)/cost |
(27 | ) | — | — | — | 27 | 27 | — | ||||||||||||||||||||
| Unrecognized actuarial loss/(gain) |
434 | — | — | — | (434 | ) | — | (434 | ) | |||||||||||||||||||
|
|
|
|
||||||||||||||||||||||||||
| Ending balance |
$ | 2,803 | $ | 958 | $ | — | $ | (40,698 | ) | $ | 5,232 | $ | (6 | ) | $ | 5,238 | ||||||||||||
|
|
||||||||||||||||||||||||||||
The weighted-average assumptions used in computing the preceding information for the Unified Cash Balance Plan and the ESPPIII as of September 30, 2015, 2014 and 2013 (the annual plan measurement dates) were as follows:
| Unified Cash Balance Plan | 2015 | 2014 | 2013 | |||||||||
| Benefit obligations: |
||||||||||||
| Discount rate for benefit obligation(a) |
4.45 | % | 4.25 | % | 5.00 | % | ||||||
| Discount rate for interest cost(a) |
3.64 | % | 4.25 | % | 5.00 | % | ||||||
| Rate of compensation increase(b) |
3.00 | % | 3.00 | % | 3.00 | % | ||||||
| Net periodic cost: |
||||||||||||
| Discount rate for net periodic benefit cost |
4.25 | % | 5.00 | % | 4.00 | % | ||||||
| Expected long-term return on plan assets |
8.00 | % | 8.00 | % | 8.25 | % | ||||||
| Rate of compensation increase (b) |
3.00 | % | 3.00 | % | 3.00 | % | ||||||
| ESPPIII | 2015 | 2014 | 2013 | |||||||||
| Benefit obligations: |
||||||||||||
| Discount rate for benefit obligation(c) |
3.25 | % | 3.50 | % | 3.50 | % | ||||||
| Discount rate for interest cost(c) |
2.57 | % | 3.50 | % | 3.50 | % | ||||||
| Discount rate for service cost(c) |
3.47 | % | 3.50 | % | 3.50 | % | ||||||
| Rate of compensation increase |
N/A | N/A | N/A | |||||||||
| Net periodic cost: |
||||||||||||
| Discount rate for net periodic benefit cost |
3.50 | % | 3.50 | % | 3.25 | % | ||||||
| Expected long-term return on plan assets |
N/A | N/A | N/A | |||||||||
| Rate of compensation increase(d) |
N/A | N/A | 2.25 | % | ||||||||
| (a) | The discount rate used to determine the benefit obligation changed from 4.25% at the September 30, 2014 measurement date to the September 2015 yield curve at the September 30, 2015 measurement date. The single weighted average rate used in determining the benefit obligation was 4.45%. Similarly, the single weighted average rate used to determine the fiscal 2016 interest cost was 3.64% (based on changing to the September 2015 yield curve at the September 30, 2015 measurement date). |
124
Table of Contents
| (b) | The rate of compensation increase for the Unified Cash Balance Plan was 3.00% for the first quarter of fiscal 2015. Since the plan was frozen at December 31, 2014, current participants will no longer accrue salary-based service credits based on years of service with the Company, and the rate of compensation increase will be zero commencing January 1, 2015. |
| (c) | The discount rate used to determine the benefit obligation changed from 3.50% at the September 30, 2014 measurement date to the September 2015 yield curve at the September 30, 2015 measurement date. The single weighted average rate used in determining the benefit obligation was 3.25%. Similarly, the single weighted average rates used to determine the fiscal 2016 interest cost and service cost were 2.57% and 3.47%, respectively (based on changing to the September 2015 yield curve at the September 30, 2015 measurement date). |
| (d) | The rate of compensation increase for the ESPPIII was 2.25% at the beginning of fiscal year 2013. A remeasurement of this plan occurred as of December 31, 2012 using a discount rate of 3.00% and a 0% salary increase rate. |
The Company’s fiscal 2015 and fiscal 2014 pension expense was calculated based upon a number of actuarial assumptions, including an expected long-term rate of return on plan assets of 8.00% and 8.00%, respectively. In developing the long-term rate of return assumption, the Company evaluated historical asset class returns based on broad equity and bond indices. The expected long-term rate of return on plan assets for fiscal 2015 assumes an asset allocation of approximately 60% equity, 25% fixed income financial instruments, 12.5% alternative investments, and 2.5% real asset investments (see description under “Plan Assets” below). The Company regularly reviews with its third party advisors the asset allocation and periodically rebalances the investment mix to achieve certain investment goals when considered appropriate (see further discussion and related table under “Plan Assets” below). Actuarial assumptions, including the expected rate of return, are reviewed at least annually, and are adjusted as necessary. Lowering the expected long-term rate of return on the Company’s plan assets (for the Unified Cash Balance Plan in fiscal 2015 and fiscal 2014) by 0.50% (from 8.00% to 7.50% for fiscal 2015 and from 8.00% to 7.50% for fiscal 2014) would have increased its pension expense for fiscal 2015 and fiscal 2014 by approximately $0.9 million and $1.0 million, respectively.
For the Company’s 2015 fiscal year end actuarial valuation, the Company elected an alternative approach for using discount rates to measure the components of net periodic benefit cost for the Unified Cash Balance Plan and ESPPIII pursuant to ASC 715, “Compensation – Retirement Benefits”. Specifically, the alternative approach focuses on measuring the service cost and interest cost components of net periodic benefit cost by using individual spot rates derived from an acceptable high quality corporate bond yield curve, matched with separate cash flows for each future year. The Company elected to use such an approach instead of the single weighted-average discount rate approach that was employed in prior years’ actuarial valuations. The change in approach does not alter the measurement of the related benefit obligations as of the reporting date. The Company has elected to treat this change in approach as a change in accounting estimate. Measuring service cost and interest cost by applying individual spot rates to each year’s cash flows produces a more precise measure of each plan’s service cost and interest cost. This approach uses discount rates that are more granular than the weighted average discount rate previously used to develop discount rates. For the Company’s 2015 fiscal year end actuarial valuation, the discount rates derived utilizing this approach were as follows: (1) For the Unified Cash Balance Plan, the equivalent weighted average discount rate used to measure the pension benefit obligation and interest cost components was 4.45% and 3.64%, respectively; and (2) For the ESPPIII, the equivalent weighted average discount rate used to measure the pension benefit obligation, interest cost and service cost components was 3.25%, 2.57% and 3.47%, respectively. The discount rate that was utilized for determining the Company’s fiscal 2014 pension obligation and fiscal 2015 net periodic benefit cost for the Unified Cash Balance Plan and the ESPPIII was selected to reflect the rates of return currently available on high quality fixed income securities whose cash flows (via coupons and maturities) match the timing and amount of future benefit payments of the plan. Bond information was provided by a recognized rating agency for all high quality bonds receiving one of the two highest ratings. As a result of this modeling process, the discount rate was 4.25% for the Unified Cash Balance Plan and 3.50% for the ESPPIII at September 30, 2014.
In October 2014, the Society of Actuaries’ Retirement Plans Experience Committee released two mortality reports after a comprehensive review of recent mortality experience of uninsured private retirement plans in the United States. As a result, the mortality assumption that was utilized for determining the Company’s fiscal 2015 pension
125
Table of Contents
obligation and projected fiscal 2016 net periodic benefit cost for the Unified Cash Balance Plan and the ESPPIII was changed. The Company changed from the prescribed IRC §430(h)(3)(A) mortality table for pension funding to separate rates for non-annuitants, based on RP-2014 “Employees” table adjusted to remove post-2007 improvement projections, and annuitants, based on RP-2014 “Healthy Annuitants” table adjusted to remove post-2007 improvement projections, both with the following mortality improvement scale: MP-2014 scale, modified to use a 10-year convergence period to a long-term improvement rate of 1.0% by 2017.
Plan Assets
The Company’s Unified Cash Balance Plan weighted-average asset allocation at October 3, 2015 and September 27, 2014, by asset category is as follows:
| (dollars in thousands) | ||||||||
| October 3, 2015 |
September 27, 2014 |
|||||||
| Asset Category: |
||||||||
| Equity securities |
$ | 104,070 | $ | 139,409 | ||||
| Debt securities (mutual funds comprised of investment grade bonds) |
44,980 | 28,163 | ||||||
| Alternative investments |
42,590 | 48,610 | ||||||
| Other |
3,306 | 2,713 | ||||||
|
|
||||||||
| Total |
$ | 194,946 | $ | 218,895 | ||||
|
|
||||||||
The assets of the Unified Cash Balance Plan are invested to provide safety through diversification in a portfolio of common stocks, bonds, cash equivalents and other investments that may reflect varying rates of return. The overall return objective for the portfolio is a reasonable rate consistent with the risk levels established by the Company’s Benefits Committee. The investments are to be diversified within asset classes (e.g., equities should be diversified by economic sector, industry, quality and size).
The long-term target asset allocation for the investment portfolio at October 3, 2015 is divided into five asset classes as follows:
| Asset Classes | Maximum % | Minimum % | Target % | |||||||||
| Equities |
80 | % | 40 | % | 60 | % | ||||||
| Fixed Income |
40 | % | 20 | % | 25 | % | ||||||
| Alternative Investments |
20 | % | 0 | % | 12.5 | % | ||||||
| Real Assets |
10 | % | 0 | % | 2.5 | % | ||||||
| Cash Equivalents |
30 | % | 0 | % | 0 | % | ||||||
The equity segment is further diversified by exposure to domestic and international, small and large capitalization, and growth and value stocks. The fixed income segment is subject to quality and duration targets, and is invested in core fixed income and high yield sectors. The purpose of using alternative investments is to reduce the volatility of the overall portfolio and to provide an alternative source of return from that of the domestic capital markets. Alternative investment strategies are defined as investment programs that offer the portfolios access to strategies that have low relative correlation to the domestic equity and fixed income markets. They may include alternative asset classes such as real estate, venture or private capital as well as a variety of investment strategies using marketable securities that seek to generate absolute positive returns regardless of the direction of the capital markets. The purpose of the real asset segment is to provide a level of protection against inflation as well as capitalize on rising commodity prices. Real assets represent investments in items that have intrinsic value because they are consumable or used in production, such as commodities, real estate, infrastructure, precious metals and global natural resources. The percentage of total assets allocated to cash equivalents should be sufficient to assure liquidity to meet disbursements and general operational expenses. Cash equivalents may also be used as an alternative to other investments when the investment manager believes that other asset classes carry higher than normal risk.
126
Table of Contents
The credit and liquidity crisis in the United States and throughout the global financial system in 2008-2009 triggered substantial volatility in the world financial markets and banking system. As a result of continuing volatility in the financial markets, the investment portfolio of the Unified Cash Balance Plan incurred a decline in the fair value of plan assets during fiscal 2015 but increased in fiscal 2013 and 2014. The values of the Unified Cash Balance Plan’s individual investments have and will fluctuate in response to changing market conditions, and the amount of gains or losses that will be recognized in subsequent periods, if any, cannot be determined.
The value of each plan’s investments has a direct impact on its funded status. The actual impact, if any, and future required contributions cannot be determined at this time.
The Unified Cash Balance Plan’s investments are recorded at fair value in accordance with ASC Topic 820. See Note 1, “Basis of Presentation and Summary of Significant Accounting Policies” and Note 16, “Fair Value of Financial Instruments” for further discussion of ASC Topic 820.
The Company, as the Unified Cash Balance Plan sponsor, determines the classification of financial asset groups within the fair value hierarchy based on the lowest level of input that is significant into each group’s asset valuation.
Equities (comprised of common and preferred stocks and mutual funds) are valued at their fair value and are determined by the quoted market price on the last business day of the fiscal year.
Cash equivalents are valued at cost, which approximates fair value. Cash equivalents include cash in bank and short-term investment funds. Interest income on short-term investment funds is recorded on an accrual basis as earned.
The Unified Cash Balance Plan’s alternative investments, which include limited partnership funds and closely held investments, are valued at their estimated fair value. Estimated fair value is based on the Unified Cash Balance Plan’s pro-rata share of the investment’s net asset value as reported by the investee. The investee’s strategies include maximization of returns for investors through investment in public and non-public securities with a goal of identifying mis-priced and value-priced securities.
The Unified Cash Balance Plan currently holds seven limited partnership fund investments with funding commitments extending through 2016. One fund was started in 2008, three funds were started in 2011, two funds were started in 2012 and one fund was started in 2013. The Unified Cash Balance Plan’s remaining unfunded commitments to limited partnership fund investments as of October 3, 2015 was $6.7 million out of total original commitments of $14.0 million. While shares in the limited partnership fund investments are not redeemable, the Company expects to recover the Unified Cash Balance Plan’s investments in the limited partnership funds through investee distributions as the investee liquidates the underlying assets. The limited partnership fund investments have maturity dates through 2023.
The Unified Cash Balance Plan may redeem shares in its other closely held investments by submitting a request, generally 30 to 90 days prior to a period-end. There are no unfunded commitments for the other closely held investments.
127
Table of Contents
The following table represents the Unified Cash Balance Plan’s financial instruments recorded at fair value and the hierarchy of those assets as of October 3, 2015:
| (dollars in thousands) | ||||||||||||||||
| Level 1 | Level 2 | Level 3 | Total | |||||||||||||
| Equities (including mutual funds): |
||||||||||||||||
| Investment grade bonds |
$ | 44,980 | $ | — | $ | — | $ | 44,980 | ||||||||
| Growth—foreign |
19,783 | — | — | 19,783 | ||||||||||||
| Growth—large cap |
17,885 | — | — | 17,885 | ||||||||||||
| Communication & technology |
15,078 | — | — | 15,078 | ||||||||||||
| Retail & industrial goods |
13,013 | — | — | 13,013 | ||||||||||||
| Financial & insurance |
14,449 | — | — | 14,449 | ||||||||||||
| Emerging markets |
7,767 | — | — | 7,767 | ||||||||||||
| Utilities, energy & extractive industries |
3,657 | — | — | 3,657 | ||||||||||||
| Medical & pharmaceutical |
8,693 | — | — | 8,693 | ||||||||||||
| Other |
3,745 | — | — | 3,745 | ||||||||||||
|
|
||||||||||||||||
| Total equities |
149,050 | — | — | 149,050 | ||||||||||||
|
|
||||||||||||||||
| Cash equivalents |
3,306 | — | — | 3,306 | ||||||||||||
| Alternative investments |
— | — | 42,590 | 42,590 | ||||||||||||
|
|
||||||||||||||||
| Total |
$ | 152,356 | $ | — | $ | 42,590 | $ | 194,946 | ||||||||
|
|
||||||||||||||||
The table below sets forth a summary of changes in the fair value of the Unified Cash Balance Plan’s level 3 assets for the year ended October 3, 2015:
| (dollars in thousands) | ||||
| Total Alternative Investments |
||||
| Estimated fair value, beginning of year |
$48,610 | |||
| Purchases |
3,922 | |||
| Net investment loss |
(912) | |||
| Distributions |
(9,030) | |||
|
|
||||
| Estimated fair value, end of year |
$42,590 | |||
|
|
||||
The following table represents the Unified Cash Balance Plan’s financial instruments recorded at fair value and the hierarchy of those assets as of September 27, 2014:
| (dollars in thousands) | ||||||||||||||||
| Level 1 | Level 2 | Level 3 | Total | |||||||||||||
| Equities (including mutual funds): |
||||||||||||||||
| Investment grade bonds |
$ | 45,453 | $ | — | $ | — | $ | 45,453 | ||||||||
| Growth—foreign |
24,850 | — | — | 24,850 | ||||||||||||
| Growth—large cap |
14,135 | — | — | 14,135 | ||||||||||||
| Communication & technology |
16,179 | — | — | 16,179 | ||||||||||||
| Retail & industrial goods |
19,007 | — | — | 19,007 | ||||||||||||
| Financial & insurance |
13,522 | — | — | 13,522 | ||||||||||||
| Emerging markets |
10,841 | — | — | 10,841 | ||||||||||||
| Utilities, energy & extractive industries |
5,132 | — | — | 5,132 | ||||||||||||
| Medical & pharmaceutical |
12,191 | — | — | 12,191 | ||||||||||||
| Other |
6,262 | — | — | 6,262 | ||||||||||||
|
|
||||||||||||||||
| Total equities |
167,572 | — | — | 167,572 | ||||||||||||
|
|
||||||||||||||||
| Cash equivalents |
2,713 | — | — | 2,713 | ||||||||||||
| Alternative investments |
— | — | 48,610 | 48,610 | ||||||||||||
|
|
||||||||||||||||
| Total |
$ | 170,285 | $ | — | $ | 48,610 | $ | 218,895 | ||||||||
|
|
||||||||||||||||
128
Table of Contents
The table below sets forth a summary of changes in the fair value of the Unified Cash Balance Plan’s level 3 assets for the year ended September 27, 2014:
| (dollars in thousands) | ||||
| Total Alternative Investments |
||||
| Estimated fair value, beginning of year |
$ | 37,893 | ||
| Purchases |
13,287 | |||
| Net investment gain |
3,371 | |||
| Distributions |
(5,941 | ) | ||
|
|
||||
| Estimated fair value, end of year |
$ | 48,610 | ||
|
|
||||
Contributions
Unified Cash Balance Plan and ESPPIII
Contributions to the Unified Cash Balance Plan are made in amounts that are at least sufficient to meet the minimum funding requirements of applicable laws and regulations, but no more than amounts deductible for federal income tax purposes.
During July 2012, legislation to provide pension funding relief was enacted as part of the 2012 student loan and transportation legislation titled “Moving Ahead for Progress in the 21st Century” (“MAP-21”). Funding relief was achieved through changes in the methodology employed to determine interest rates used to calculate required funding contributions. The funding relief applied to single-employer pension plans subject to the funding requirements of the Employee Retirement Income Security Act (“ERISA”) that base pension liability calculations on interest rates determined pursuant to the Pension Protection Act of 2006.
During August 2014, legislation to extend the pension funding relief included in MAP-21 was enacted as part of the Highway and Transportation Funding Act of 2014 (“HATFA”). As a result, the Company’s contributions to the Unified Cash Balance Plan for fiscal 2014 were reduced by $2.9 million from our originally estimated amounts. During fiscal 2015, we had no additional required contributions for the 2014 plan year, and there were no contributions required for the 2015 plan year. Accordingly, the Company made no contributions to the Unified Cash Balance Plan during fiscal 2015. Due to the plan’s funded status, quarterly contributions will not be required in fiscal 2016 for the 2016 plan year. At its discretion, the Company may contribute in excess of the minimum (zero) requirement. Additional contributions, if any, will be based, in part, on future actuarial funding calculations and the performance of plan investments. Contributions for the 2015 and 2016 plan years, if any, will be due by September 15, 2016 and September 15, 2017, respectively.
The Company made benefit payments of $3.8 million to participants in the ESPPIII during fiscal 2015. The Company expects to make benefit payments of $3.6 million to participants in the ESPPIII in fiscal 2016.
Multiemployer Pension Plans
The Company also contributes to a number of multiemployer defined benefit pension plans that provide defined benefit payments for retired employees under terms of the Company’s collective bargaining agreements (“Union Participants”). These multiemployer plans generally provide retirement benefits to Union Participants based on their service to contributing employers. The plans’ benefits are paid from assets held in trusts for this purpose and are administered by trustees that are appointed by participating employers and union parties.
The risks of participating in these multiemployer plans are different from the risks associated with single-employer plans in the following respects:
| · | Assets contributed to the multiemployer plan by one employer may be used to provide benefits to employees of other participating employers. |
129
Table of Contents
| · | If a participating employer stops contributing to the plan, the unfunded obligations of the plan may be borne by the remaining participating companies. |
| · | If the Company stops participating in some or all of its multiemployer plans, and continues in business, the Company could be required to pay an amount, referred to as a withdrawal liability, based on the funded status of the plan. The Company has no intention of stopping its participation in any multiemployer plans. |
The Company made contributions of $14.6 million, $14.1 million and $13.5 million for the fiscal years ended October 3, 2015, September 27, 2014 and September 28, 2013, respectively, to its participating multiemployer plans. The following table provides information regarding the Company’s participation in these multiemployer plans. The table provides the following information:
| · | The EIN/Pension Plan Number column provides the Employee Identification Number (“EIN”) and the three-digit plan number, if applicable. |
| · | Unless otherwise noted, the most recent Pension Protection Act (“PPA”) zone status available in 2015 and 2014 relates to the plans’ two most recent fiscal year-ends. The zone status is based on information that the Company received from the plan and is certified by each plan’s actuary. Among other factors, red zone status plans are generally less than 65 percent funded and are considered in critical status, plans in yellow zone or orange zone status are less than 80 percent funded and are considered endangered or seriously endangered status, and green zone plans are at least 80 percent funded. |
| · | For plans that are in the red zone, it is indicated whether a Rehabilitation Plan (“RP”) is either pending or has been implemented by the trustees of each plan. Since none of the Company’s plans are considered to be in endangered (yellow zone) or seriously endangered (orange zone) status, disclosure of whether a Financial Improvement Plan (“FIP”) is either pending or has been implemented is not applicable and therefore is omitted from the table. |
| · | The table also includes the current expiration date(s) for the collective bargaining agreement(s) under which the plans are associated and contributions to the plans for the last three years. |
| (dollars in thousands) | ||||||||||||||||||||||||||
| EIN |
Plan End Date |
PPA Zone Status | RP
Status Implemented |
Range of Dates |
Contributions(d) |
|||||||||||||||||||||
| Pension Fund | 2014 | 2013 | 2015 | 2014 | 2013 | |||||||||||||||||||||
| Western Conference of Teamsters Pension Trust |
916145047 -001 |
12/31 | Green | Green | No | 4/23/16 – 7/15/17(c) |
$ | 13,286 | $ | 12,760 | $ | 12,520 | ||||||||||||||
| Bakery & Confectionery Union and Industry International Pension Fund(b) |
526118572 -001 |
12/31 | Red | Red | Implemented | 7/6/16 | 1,024 | 1,029 | 743 | |||||||||||||||||
| Washington Meat Industry Pension Trust(b) |
916134141 -001 |
9/30 | Red | Red | Implemented | 9/30/17 | 71 | 71 | 74 | |||||||||||||||||
| Other plans(a) |
243 | 232 | 219 | |||||||||||||||||||||||
|
|
||||||||||||||||||||||||||
| Total |
$ | 14,624 | $ | 14,092 | $ | 13,556 | ||||||||||||||||||||
|
|
||||||||||||||||||||||||||
| (a) | Other plans consist of two plans (each with a PPA zone status of green) that have been aggregated in the foregoing table, as the contributions to each of these plans are not individually material. |
| (b) | The Company is subject to critical status surcharge contributions that are imposed for plans that are in the red zone. |
| (c) | The Company has 18 collective bargaining agreements participating in the Western Conference of Teamsters Pension Trust. Approximately 17% of the participants covered by this plan are subject to collective bargaining agreements that expire on April 23, 2016. |
| (d) | None of the Company’s collective bargaining agreements require that a minimum contribution be made to these plans. None of the Company’s contributions exceed 5% of the total contributions to any of the plans. |
130
Table of Contents
Defined Contribution Retirement Plans
Supplemental Executive Retirement Plan
Effective June 1, 2013, the Company implemented a supplemental retirement plan for a select group of management or highly compensated employees that are at the Vice President level and above of the Company under the Unified Grocers, Inc. Supplemental Executive Retirement Plan (the “SERP”). This plan was established to replace the ESPPIII, which has been frozen. The SERP provides participating officers with supplemental retirement income in addition to the benefits provided under the Company’s Cash Balance and 401(k) plans.
The SERP is a non-qualified defined contribution type plan under which benefits are derived based on a notional account balance to be funded by the Company for each participating officer. The account balance will be credited each year with a Company contribution based on the officer’s compensation, calculated as base salary plus bonus, earned during a fiscal year and the officer’s executive level at the end of the fiscal year. Plan participants may select from a variety of investment options (referred to as “Measurement Funds” in the plan document) concerning how the contributions are hypothetically invested. Assets of the SERP (i.e., the participants’ account balances) will not be physically invested in the investments selected by the participants; rather, the Measurement Funds are utilized “for the purpose of debiting or crediting additional amounts” to each participant’s account. The Company informally funds its obligation to plan participants in a rabbi trust, comprised of mutual fund assets consisting of various publicly-traded mutual funds reported at estimated fair value based on quoted market prices. Mutual funds reported at their estimated fair value of $2.0 million and $0.8 million at October 3, 2015 and September 27, 2014, respectively, are included in other assets in the Company’s consolidated balance sheets.
Upon termination of employment or death, the participant’s vested account balance will be payable over a period of from 5 to 15 years, or immediately following a change in control, as elected by the participant upon entry into the SERP. Vesting is based on years of service as an officer at the rate of 20% per year. After 5 years of service as an officer or following a change in control, the account will be 100% vested. An account may be forfeited in the event a participant is terminated for cause or engages in activity in competition with the Company. For those participants active in the ESPPIII at September 29, 2012 who were selected to participate in the SERP, they will receive one year of vesting credit for each year of service credited in the ESPPIII plus an additional eight months for the period from September 30, 2012 to June 1, 2013.
The SERP is accounted for pursuant to FASB ASC section 715-70, Compensation – Retirement Benefits – Defined Contribution Plans (“ASC 715-70”). SERP participants are credited with a contribution to an account and will receive, upon separation, a benefit based upon the vested amount accrued in their account, which includes the Company’s contributions plus or minus the increase or decrease in the fair market value of the hypothetical investments (Measurement Funds) selected by the participant. ASC 715-70 requires companies to record, on a periodic basis, that portion of a company’s contribution earned during the period by the participants (the “Expense”). The Company is accruing the Expense under the assumption that all participants in the SERP will achieve full vesting (five years of service). As of October 3, 2015 and September 27, 2014, the Company accrued $1.2 million and $1.2 million, respectively, in related benefit cost recorded in long-term liabilities, other in the Company’s consolidated balance sheets.
Sheltered Savings Plan
The Company has a Sheltered Savings Plan (“SSP”), which is a defined contribution plan, adopted pursuant to Section 401(k) of the Internal Revenue Code for substantially all of its nonunion employees. Prior to December 31, 2014, the Company matched, after an employee’s one year of service, each dollar deferred up to 4% of each participant’s eligible compensation and, at its discretion, matched 40% of amounts deferred between 4% and 8% of each participant’s eligible compensation. In response to changes in the Company’s Unified Cash Balance Plan (discussed previously herein), the Company amended the SSP on December 31, 2014. Commencing January 1, 2015, the Company increased its matching portion from 40% to 50% of a participant’s contributions over 4% and up to 8% of each participant’s eligible compensation. In addition, for each of the respective SSP plan years beginning January 1, 2015, January 1, 2016 and January 1, 2017, the Company will make an additional contribution on behalf of eligible participants (those who were participants in the Unified Cash Balance Plan as of December 31, 2014) from 1% up to 5% of a participant’s annual eligible compensation. At the end of each plan year, the Company may also contribute an amount equal to 2% of the compensation of those participants employed at that date. Participants are immediately 100% vested in the Company’s contribution.
131
Table of Contents
The Company contributed approximately $5.1 million, $4.8 million and $5.1 million related to its SSP in the fiscal years ended October 3, 2015, September 27, 2014 and September 28, 2013, respectively.
Deferred Compensation Plan II
The Company has a nonqualified Deferred Compensation Plan (“DCPII”), which allows eligible employees to defer and contribute to an account a percentage of compensation on a pre-tax basis, as defined in the plan, in excess of amounts contributed to the SSP pursuant to IRS limitations, the value of which is measured by the fair value of the underlying investments. The Company informally funds its deferred compensation liability with assets held in a rabbi trust consisting of life insurance policies reported at cash surrender value and mutual fund assets consisting of various publicly-traded mutual funds reported at estimated fair value based on quoted market prices. The assets held in the rabbi trust are not available for general corporate purposes. Participants can direct the investment of their deferred compensation plan accounts in several investment funds as permitted by the DCPII. Gains or losses on investments are fully allocable to the plan participants. The cash surrender value of life insurance policies and mutual funds reported at their estimated fair value are included in other assets in the Company’s consolidated balance sheets because they remain assets of the Company until paid out to the participants. The cash surrender value of the life insurance policies was $12.3 million and $13.2 million at October 3, 2015 and September 27, 2014, respectively. The estimated fair value of the mutual funds was negligible at October 3, 2015 and September 27, 2014. The liability to participants ($12.5 million and $12.7 million at October 3, 2015 and September 27, 2014, respectively) is included in long-term liabilities, other in the Company’s consolidated balance sheets. The rabbi trust is subject to the Company’s creditors’ claims in the event of its insolvency.
Employee Savings Plan
The Company has an Employee Savings Plan, which is a defined contribution plan, adopted pursuant to Section 401(k) of the Internal Revenue Code for substantially all of its union employees. The Company does not match any employee deferrals into the plan, and therefore, there is no related vesting schedule. No expense was incurred in the periods presented.
Other Benefit Plans
Long-Term Incentive Plan
Effective June 1, 2013, the Company implemented the Unified Grocers, Inc. Long-Term Incentive Plan (“LTIP”) to align, motivate and reward executives for their contributions to the long-term financial success and growth of the Company. This long-term plan, in conjunction with the short-term focus of the Company’s annual bonus plan, is designed to link long-term value creation for the Company’s member shareholders with the short-term annual performance by the Company. The LTIP also serves as an additional component to a competitive total compensation package designed to attract and retain talented executives.
The LTIP is offered to a select group of officers of the Company, Vice-President and higher (the “Participants”), and participation may be further constrained or increased at the discretion of the Company’s Compensation Committee. Participants are awarded with a certain number of Units (defined below) on an annual basis (the “Award”); however, an Award in one year does not ensure that a Participant will receive an Award in subsequent years. Each Award participates in a four-year cycle (“Performance Cycle”), which is based on consecutive fiscal years of the Company, and the amount paid to a Participant, if any, is determined at the end of the Award’s Performance Cycle and is payable prior to December 31st of the year in which the Performance Cycle ends (“Maturity Date”). The Maturity Date is the date on which a Participant’s vested Unit is deemed to mature, which is the earlier of (a) the last day of the Performance Cycle or (b) a change in control of the Company. In fiscal 2015, 2014 and 2013, LTIP Awards were offered to certain officers of the position of Vice-President or higher. The Participant’s Award is vested based on the Participant’s continuous employment with the Company during the Award’s Performance Cycle.
There are two types of units that are granted as part of an Award: Appreciation Units and Full-Value Units (collectively, “Units”). Effective for fiscal 2016, the LTIP was amended to expand the Awards that may be granted thereunder to include Full-Value Units. A “Full-Value Unit” entitles the award recipient to the “maturity value” on the Units at the end of the Performance Cycle assigned to the Units. The “maturity value” for a Full-Value Unit is the
132
Table of Contents
Company’s Exchange Value Per Share for a share of the Class A or Class B stock of the Company as calculated from the Company’s financial statements (see Part I, Item 1. “Business – Capital Shares” for additional information), plus cumulative cooperative division patronage dividends, cash dividends and non-allocated retained earnings attributable to such share Exchange Value Per Share, as calculated from the Company’s financial statements for the fiscal year end that coincides with the end of the Performance Cycle. An “Appreciation Unit” refers to a notional unit that grants Participants the contractual right to receive the positive difference, if any, between the Maturity Value of the Unit on its Maturity Date and the Base Value (capitalized terms defined below) assigned to the Unit at the beginning of the Performance Cycle. The Base Value is equal to the Exchange Value Per Share for the fiscal year ending immediately prior to the Performance Cycle. The Maturity Value is equal to the Exchange Value Per Share plus Cumulative Co-op Patronage Dividends (defined below), plus Cumulative Cash Dividends (the total of cash dividends paid, excluding patronage dividends, as reported in the Company’s fiscal year-end financial statements), plus Cumulative Non-allocated Retained Earnings (defined below), as calculated from the Company’s financial statements for the Performance Cycle assigned to the Appreciation Unit. The difference is then multiplied by the number of vested Appreciation Units awarded for the Performance Cycle that remain outstanding on the Maturity Date. Cumulative Co-op Patronage Dividends are the sum of the Cooperative Division’s patronage earnings divided by the number of Class A and B Shares used in the calculation of the Exchange Value Per Share for each year in the Performance Cycle. Cumulative Co-op Patronage Dividends do not include Dairy Division patronage dividend amounts. The Cumulative Non-allocated Retained Earnings amount is the sum of the total increase or decrease in non-allocated retained earnings for a fiscal year divided by the number of Class A and B Shares used in the calculation of the Exchange Value Per Share for each year in the Performance Cycle.
The Company determines the number of Units to be awarded by first starting with a targeted compensation gap that the awards are designed to fill for each officer. The targeted compensation gap is the value the Units (cumulative Full-Value and Appreciation Units) are targeted to have when they are paid out to the officer at the end of the Performance Cycle. To calculate the number of Full-Value and Appreciation Units to be awarded at the start of the Performance Cycle such that those Full-Value and Appreciation Units achieve the targeted compensation gap, the Compensation Committee uses an assumed potential compound annual growth rate (“CAGR”) of the Appreciation Units over the Performance Cycle plus the Full-Value Units. If the actual CAGR of the Appreciation Units over the Performance Cycle ends up being higher than the assumed potential CAGR used by the Compensation Committee in making the award, which may happen if, for example, the Company’s Exchange Value Per Share, dividends and non-allocated retained earnings exceed expectation, then the actual value of the Appreciation Units at the end of the Performance Cycle may exceed the targeted compensation gap. If, on the other hand, the actual CAGR of the Appreciation Units over the Performance Cycle ends up being lower than the assumed potential CAGR used by the Compensation Committee in making the award, which may happen if, for example, the Company’s Exchange Value Per Share, dividends and non-allocated retained earnings fall short of expectation, then the actual value of the Appreciation Units at the end of the Performance Cycle may not meet the targeted compensation gap.
For the 2013 – 2015 Performance Cycles, all Units awarded were Appreciation Units. For the 2016 Performance Cycle, an officer’s LTIP award is comprised of Full-Value Units, equaling 25% of the targeted compensation gap, and Appreciation Units, equaling 75% of the targeted compensation gap. Based on the Company’s calculations relative to the 2013, 2014 and 2015 Performance Cycles, the Company determined there was no LTIP compensation expense for the Performance Cycles to be recorded in fiscal 2015. Based on the Company’s calculations relative to the 2013 and 2014 Performance Cycles, the Company determined there was no LTIP compensation expense for the Performance Cycles to be recorded in fiscal 2014.
133
Table of Contents
Estimated Future Benefit Payments
The following benefit payments, which reflect expected future service, as appropriate, are expected to be paid in fiscal years:
| (dollars in thousands) | ||||||||
|
Unified Cash Balance Plan |
ESPPIII | |||||||
| 2016 |
$ | 19,666 | $ | 3,580 | ||||
| 2017 |
11,229 | 3,912 | ||||||
| 2018 |
11,657 | 4,331 | ||||||
| 2019 |
12,094 | 4,331 | ||||||
| 2020 |
12,577 | 4,551 | ||||||
| Thereafter |
70,610 | 19,496 | ||||||
|
|
||||||||
| Total |
$ | 137,833 | $ | 40,201 | ||||
|
|
||||||||
14. Postretirement Benefit Plans Other Than Pensions
The Company sponsors the following postretirement benefit plans:
Retiree Medical Plan
The Company sponsors a postretirement benefit plan that provides certain medical coverage to retired non-union employees who are eligible to participate in the Unified Grocers, Inc. Retiree Medical Plan (the “RMP”). The RMP is contributory for non-union employees retiring after January 1, 1990, with the retiree contributions adjusted annually. This plan is not funded.
In December 2012, the Company amended the RMP to modify the eligibility requirements for the RMP. Effective as of the end of the first quarter of fiscal 2013, only employees of Unified who have reached 49 years of age with at least 15 years of continuous service with the Company as of the end of the first quarter of fiscal 2013 will remain eligible to participate in the RMP. To receive benefits under the RMP, those employees who remain eligible must remain in continuous service with the Company through their retirement following the attainment of at least 55 years of age. We also reduced the benefits for those who remained eligible. Previously this was a lifetime benefit for the employee and their spouse. This was changed to a 15-year benefit for the employee only.
Officer Retiree Medical Plan
Officers who are at least 55 years of age and have seven years of service with the Company as an officer are eligible to participate in the Officer Retiree Medical Plan (the “ORMP”), which includes the Company’s Executive Medical Reimbursement Plan (the “EMRP”), following termination of employment. Pursuant to the EMRP, officers will be eligible for payment by the insurance plan of the portion of eligible expenses not covered under the Company’s health insurance plan.
Benefits under the ORMP are the same as under the RMP offered to non-union employees but with no annual premium caps, plus dental and vision benefits, continuation of the EMRP during retirement and extension of benefits for eligible dependents following the officer’s death. Active officers will continue to be obligated to pay the regular premium for the Company health insurance plan they have selected. During retirement, officers are required to pay 25% of the ORMP premium to maintain coverage. Effective December 31, 2012, the eligibility provisions of the ORMP were frozen effective September 30, 2012; accordingly, no employee that is either hired or becomes an officer on or after such date can become a participant or recommence participation in the ORMP. We also reduced the benefits for those who remained eligible. Previously this was a lifetime benefit for the employee and their spouse. This was changed to a 15-year benefit for the employee only.
134
Table of Contents
Executive Insurance Plan
The Company provides for the cost of life insurance on behalf of current and qualifying former officers of Unified through a split-dollar Executive Insurance Plan (the “EIP”) arrangement. As discussed below, this plan was amended in December 2012 to close the plan to new entrants as of September 30, 2012. Accordingly, no employee that is either hired or becomes an officer on or after such date can become a participant or recommence participation in the EIP. This plan is not funded.
In May 2013, the EIP was amended and restated effective as of June 1, 2013. The EIP previously provided a life insurance benefit under the current whole life insurance policy for covered, active officers of three times their annual salary. For officers who were active on or after June 1, 2013, the EIP, as amended, provides a life insurance benefit of one and one-half times their annual salary up to $1.2 million (reducing to 50% of the original amount at age 70) through group term life insurance. The group term life insurance coverage terminates upon retirement or termination. For active officers who were covered by the EIP at the time it was closed as of September 30, 2012, the EIP, as amended, also provides an additional fixed life insurance benefit amount, payable upon the participant’s death to their designated beneficiaries, based on such participant’s position with the Company as of June 1, 2013 as follows: $1,000,000 for the chief executive officer, $500,000 for executive vice president, $400,000 for senior vice presidents and $300,000 for vice presidents. Such fixed life insurance benefit amounts will not be adjusted for future promotions or increases in salary. Eligible participants who were covered by the whole life insurance policy and retired prior to June 1, 2013 are unaffected by the amendment and are covered under the prior formula of one and one-half times their annual salary in their final year of employment.
The Company concluded that the modifications to the EIP did not warrant remeasurement of the EIP during the third quarter of fiscal year 2013. The EIP was remeasured as part of the Company’s year-end actuarial valuation, and the resulting adjustments to the accumulated postretirement benefit obligation reduced our long-term liability associated with the EIP by $1.7 million, which was offset by an increase in other comprehensive earnings of $1.1 million (net of income tax of $0.6 million) as of the fiscal year ended September 28, 2013.
Life Plan
A certain group of retired non-union employees currently participate in a plan providing life insurance benefits for which active non-union employees are no longer eligible. This life insurance plan is noncontributory and is not funded.
Sick Leave Union Plan
Certain eligible union employees have a separate plan providing a lump-sum payout for unused days in the sick leave bank. The sick leave payout plan is noncontributory and is not funded.
Plan Amendments
Effective September 2014, in conjunction with the implementation of a paid time-off (“PTO”) program for non-union employees that increased our benefit expenses by $1.8 million, we terminated our non-union sick leave plan, resulting in a $1.4 million reduction in the associated long-term liability and a $1.1 million pre-tax reduction in accumulated other comprehensive earnings, resulting in the recognition of a one-time pre-tax termination gain of $2.5 million, which is recorded in addition to the net periodic postretirement benefit cost in our accompanying consolidated statements of earnings (loss).
In December 2012, the Company amended several of its employee benefit plans. The Company amended the EIP and the ORMP to close the plans to new entrants as of September 30, 2012. Accordingly, no employee that is either hired or becomes an officer on or after such date can become a participant or recommence participation in either plan. The Company also amended the ESPPIII for executive officers to close the eligibility provisions of the ESPPIII to new entrants as of September 30, 2012 (the “Freeze Date”); accordingly, no employee that is either hired or becomes an officer on or after the Freeze Date can become a participant or recommence participation in the ESPPIII. Additionally, benefit accruals under the ESPPIII were frozen for officers who have already attained a 65% gross benefit accrual (generally attained after fifteen (15) or more years of service under the ESPPIII) as of
135
Table of Contents
September 30, 2012; accordingly, no such officers will accrue further gross benefits under the ESPPIII after the Freeze Date. For officers participating in the ESPPIII as of the Freeze Date who had less than a 65% gross benefit accrual, such officers will continue to accrue gross benefits under the ESPPIII until they reach a 65% gross benefit accrual. Lastly, in connection with freezing the benefit accrual under the ESPPIII, a participant’s gross accrued benefit will not consider any compensation earned by the participant after the Freeze Date, which effectively freezes the final pay and final average pay formulas under the plan at the September 30, 2012 levels.
In December 2012, the Company also amended the RMP to modify the eligibility requirements for the RMP. Effective as of the end of the first quarter of fiscal 2013, only employees of the Company who have reached 49 years of age with at least 15 years of continuous service with Unified as of the end of the first quarter of fiscal 2013 will remain eligible to participate in the RMP. To receive benefits under the RMP, those employees who remain eligible must remain in continuous service with Unified through their retirement following the attainment of at least 55 years of age. We also reduced the benefits for those who remained eligible. Previously this was a lifetime benefit for the employee and their spouse. This was changed to a 15-year benefit for the employee only.
As a result of the foregoing benefit plan amendments, the Company remeasured the projected pension and accumulated postretirement benefit obligations associated with the respective plans as of the end of the first quarter of fiscal 2013. Such remeasurement resulted in a $29.7 million reduction in the Company’s long-term liabilities associated with the foregoing plans. These reductions were offset by an increase in other comprehensive earnings of $17.5 million (net of income tax of $9.5 million) and the recognition of a one-time curtailment gain of $2.7 million, related to the RMP, which is recorded in addition to the net periodic postretirement benefit cost in the Company’s accompanying consolidated statements of earnings (loss).
The components of net periodic benefit cost consist of the following (for all postretirement benefit plans described above, not including the ESPPIII, which is disclosed in Note 13, “Benefit Plans”):
| (dollars in thousands) | ||||||||||||
| Fiscal Years Ended | ||||||||||||
| October 3, 2015 |
September 27, 2014 |
September 28, 2013 |
||||||||||
| Service cost |
$ | 57 | $ | 173 | $ | 546 | ||||||
| Interest cost |
1,212 | 1,383 | 1,631 | |||||||||
| Amortization of prior service credit |
(8,326 | ) | (8,561 | ) | (6,642 | ) | ||||||
| Recognized actuarial loss/(gain) |
104 | 562 | 1,037 | |||||||||
| Plan termination and curtailment gains |
— | (2,472 | ) | (2,685 | ) | |||||||
|
|
||||||||||||
| Net periodic benefit |
$ | (6,953 | ) | $ | (8,915 | ) | $ | (6,113 | ) | |||
|
|
||||||||||||
The change in the benefit obligations consists of the following:
| (dollars in thousands) | ||||||||
| October 3, 2015 |
September 27, 2014 |
|||||||
| Benefit obligation at beginning of year |
$ | 33,833 | $ | 34,444 | ||||
| Service cost |
57 | 173 | ||||||
| Interest cost |
1,212 | 1,383 | ||||||
| Plan amendments |
— | — | ||||||
| Actuarial loss (gain)(a) |
879 | 1,220 | ||||||
| Benefits paid |
(1,819 | ) | (1,960 | ) | ||||
| Non-union sick plan termination benefits and settlement |
— | (1,427 | ) | |||||
|
|
||||||||
| Benefit obligation at end of year |
$ | 34,162 | $ | 33,833 | ||||
|
|
||||||||
| (a) | The actuarial loss in fiscal 2015 for the postretirement benefit plans reflects demographic experience different from assumed for the year, including assumption changes. As previously disclosed (see Note 13), the Company changed its mortality assumption subsequent to the release of two mortality reports issued by the Society of Actuaries’ Retirement Plans Experience Committee. This change caused the funded position to |
136
Table of Contents
| deteriorate. Partially offsetting the mortality assumption change was an increase in the discount rate applicable to the component plans. The actuarial loss in fiscal 2014 for the postretirement benefit plans includes a loss of approximately $1.5 million due to the change in the discount rate (from 4.25% to 3.75%), partially offset by demographic gains (i.e., delayed retirements) of approximately $0.3 million. |
The change in the plan assets during the year is:
| (dollars in thousands) | ||||||||
| October 3, 2015 |
September 27, 2014 |
|||||||
| Fair value of plan assets at beginning of year |
$ | — | $ | — | ||||
| Employer contribution |
1,819 | 1,960 | ||||||
| Benefits paid |
(1,819 | ) | (1,960 | ) | ||||
|
|
||||||||
| Fair value of plan assets at end of year |
$ | — | $ | — | ||||
|
|
||||||||
The funded status of the plans is:
| (dollars in thousands) | ||||||||
| October 3, 2015 |
September 27, 2014 |
|||||||
| Funded status at September 30, 2015 and 2014 (under-funded) |
$ | (34,162 | ) | $ | (33,833 | ) | ||
|
|
||||||||
| Net amount recognized |
$ | (34,162 | ) | $ | (33,833 | ) | ||
|
|
||||||||
Total accrued benefit costs of $34.2 million and $33.8 million at October 3, 2015 and September 27, 2014, respectively, are included in the consolidated balance sheets as follows: $31.2 million and $30.8 million are included in long-term liabilities, other and $3.0 million and $3.0 million are included in accrued liabilities at October 3, 2015 and September 27, 2014, respectively.
The following table reconciles the change in net periodic benefit cost, plan assets, benefit obligation and accumulated other comprehensive (income) loss (and components thereof) for the Company’s postretirement benefit plans:
| (dollars in thousands) | ||||||||||||||||||||||||||||||
| Postretirement Benefit Plans | Accumulated Other Comprehensive Income Components |
|||||||||||||||||||||||||||||
| October 3, 2015 | Annual Cost |
Retained Earnings |
Plan Assets |
Benefit Obligation |
Accumulated Other Comprehensive (Income)/Loss |
Deferred Prior Service (Credit)/ Cost |
Deferred Actuarial (Gains)/ Losses |
|||||||||||||||||||||||
| Beginning balance |
— | $ | 3,260 | $ | — | $ | (33,833 | ) | $ | (15,173 | ) | $ | (11,993 | ) | $ | (3,180 | ) | |||||||||||||
| Service cost |
$ | 57 | — | — | (57 | ) | — | — | — | |||||||||||||||||||||
| Interest cost |
1,212 | — | — | (1,212 | ) | — | — | — | ||||||||||||||||||||||
|
|
|
|||||||||||||||||||||||||||||
| Basic annual cost |
1,269 | — | — | — | — | — | ||||||||||||||||||||||||
| Contributions |
— | — | 1,819 | — | — | — | — | |||||||||||||||||||||||
| Benefits paid |
— | — | (1,819 | ) | 1,819 | — | — | — | ||||||||||||||||||||||
| Deferrals |
||||||||||||||||||||||||||||||
| Plan amendments |
— | — | — | — | — | — | — | |||||||||||||||||||||||
| Unrecognized actuarial (gain)/loss |
— | — | — | (879 | ) | 879 | — | 879 | ||||||||||||||||||||||
| Amortization |
||||||||||||||||||||||||||||||
| Prior service credit |
(8,326 | ) | — | — | — | 8,326 | 8,326 | — | ||||||||||||||||||||||
| Recognized actuarial loss/(gain) |
104 | — | — | — | (104 | ) | — | (104 | ) | |||||||||||||||||||||
|
|
|
|
||||||||||||||||||||||||||||
| Ending balance |
$ | (6,953 | ) | $ | 3,260 | $ | — | $ | (34,162 | ) | $ | (6,072 | ) | $ | (3,667 | ) | $ | (2,405 | ) | |||||||||||
|
|
|
|
||||||||||||||||||||||||||||
137
Table of Contents
The Company’s fiscal 2015 postretirement expense includes an approximate $8.2 million credit for its postretirement benefit plans as a result of amortizing prior service credits of $8.3 million and actuarial losses of $0.1 million from accumulated other comprehensive income into postretirement expense over the 2015 fiscal year.
The Company’s projected fiscal 2016 postretirement expense includes an approximate $1.7 million credit for its postretirement benefit plans which is expected to be recognized as a result of amortizing projected prior service credits of $1.2 million and a projected actuarial gain of $0.5 million from accumulated other comprehensive income into postretirement expense over the 2016 fiscal year.
Benefit payments, including those amounts to be paid out of corporate assets and reflecting future expected service as appropriate, are expected to be paid in fiscal years:
| (dollars in thousands) | ||||
| Postretirement Benefit Plans |
||||
| 2016 |
$ | 2,983 | ||
| 2017 |
2,292 | |||
| 2018 |
2,313 | |||
| 2019 |
2,357 | |||
| 2020 |
2,347 | |||
| Thereafter |
3,729 | |||
|
|
||||
| Total |
$ | 16,021 | ||
|
|
||||
The weighted-average assumptions as of September 30, 2015, 2014 and 2013 are as follows:
| Postretirement Benefit Plans |
||||||||||||
| 2015 | 2014 | 2013 | ||||||||||
| Benefit obligations: |
||||||||||||
| Discount rate for benefit obligation(a) |
3.91 | % | 3.75 | % | 4.25 | % | ||||||
| Discount rate for interest cost(a) |
3.01 | % | 3.75 | % | 4.25 | % | ||||||
| Discount rate for service cost(a) |
4.25 | % | 3.75 | % | 4.25 | % | ||||||
| Rate of compensation increase(b) |
3.00 | % | 3.00 | % | 3.00 | % | ||||||
| Net periodic benefit cost: |
||||||||||||
| Discount rate for net periodic benefit cost(c) |
3.75 | % | 4.25 | % | 4.00 | % | ||||||
| Rate of compensation increase(b) |
3.00 | % | 3.00 | % | 3.00 | % | ||||||
| (a) | For plans other than the Officer Retiree Medical Plan and split-dollar Executive Insurance Plan, the discount rate used to determine the benefit obligation changed from 3.75% at the September 30, 2014 measurement date to the September 2015 yield curve at the September 30, 2015 measurement date. The single weighted average rate used in determining the benefit obligation was 3.91%. Similarly, the single weighted average rates used to determine the fiscal 2016 interest cost and service cost were 3.01% and 4.25%, respectively (based on changing to the September 2015 yield curve at the September 30, 2015 measurement date). |
| The discount rate used to determine the benefit obligation for the Officer Retiree Medical Plan changed from 3.75% and 4.25% at the September 30, 2014 and September 30, 2013 measurement dates, respectively, to the September 2015 yield curve at the September 30, 2015 measurement date. The single weighted average rate used in determining the benefit obligation was 3.93%. Similarly, the single weighted average rates used to determine the fiscal 2016 interest cost and service cost were 3.08% and 3.88%, respectively (based on changing to the September 2015 yield curve at the September 30, 2015 measurement date). The comparable rate for each of these costs was 3.75% and 4.25% for fiscal 2014 and 2013, respectively. |
| The discount rate used to determine the benefit obligation for the split-dollar Executive Insurance Plan changed from 3.75% and 4.25% at the September 30, 2014 and September 30, 2013 measurement dates, respectively, to the September 2015 yield curve at the September 30, 2015 measurement date. The single weighted average rate used in determining the benefit obligation was 4.54%. Similarly, the single weighted average rate used to determine the fiscal 2016 interest cost was 3.91% (based on changing to the September 2015 yield curve at the September 30, 2015 measurement date). The comparable rate for this cost was 3.75% and 4.25% for fiscal 2014 and 2013, respectively. |
138
Table of Contents
| (b) | The rate of compensation increase for the fiscal 2015 union sick pay plan and fiscal 2014 and fiscal 2013 union and non-union sick pay plans is 3.00%. This assumption is not applicable for the other postretirement benefit plans. |
| (c) | The discount rate for the split-dollar Executive Insurance Plan is 3.75%, 4.25% and 4.00% for fiscal 2015, 2014 and 2013, respectively. The discount rate for the Officer Retiree Medical Plan is 3.75%, 4.25% and 4.00% for fiscal 2015, 2014 and 2013, respectively. The discount rate of 4.00% was the rate at the beginning of fiscal year 2013. A remeasurement occurred as of December 31, 2012 for the RMP and ORMP using a discount rate of 3.50% and 3.75%, respectively. |
For measurement purposes, the following table sets forth the assumed health care trend rates:
| October 3, 2015 |
September 27, 2014 |
|||||||
| Pre-age 65 health care cost trend rate assumed for 2015 and 2014(a) |
8.00 | % | 8.00 | % | ||||
| Pre-age 65 rate to which the cost trend rate is assumed to decline (the ultimate trend rate)(b) |
5.00 | % | 5.00 | % | ||||
| Pre-age 65 year that the rate reaches the ultimate trend rate |
2021 | 2021 | ||||||
| Post-age 65 health care cost trend rate assumed for 2015 and 2014(a) |
5.50 | % | 5.50 | % | ||||
| Post-age 65 rate to which the cost trend rate is assumed to decline (the ultimate trend rate)(c) |
4.75 | % | 4.75 | % | ||||
| Post-age 65 year that the rate reaches the ultimate trend rate |
2020 | 2020 | ||||||
| (a) | The annual rate of increase in the per capita cost of covered health care benefits. |
| (b) | The valuation trend assumption was projected as follows: A rate of 8.00% in 2015, 7.50% in 2016, 7.00% in 2017, 6.50% in 2018, 6.00% in 2019, 5.50% in 2020, 5.00% in 2021, and 5.00% in 2022 and beyond. The initial trend rate reflects the Company’s recent cost experience, healthcare cost survey data, Patient Protection and Affordable Care Act fee estimates, and the Company’s expected insurance market cost increases over the next year. The ultimate rate was set to reflect general inflation plus added medical inflation. The grading period is an estimate of the length of time it will take for health care costs to become more stable as a percentage of the Gross Domestic Product. |
| (c) | The valuation trend assumption was projected as follows: 5.50% in 2015, 5.25% in 2016, 5.25% in 2017, 5.00% in 2018, 5.00% in 2019, 4.75% in 2020, and 4.75% in 2021 and beyond. The initial trend rate reflects recent experience in the individual Medicare supplement market. The ultimate rate was set to reflect general inflation plus added medical inflation for Medicare supplemental coverage. |
Assumed health care cost trend rates have a significant effect on the amounts reported for the health care plans. A one-percentage-point change in assumed health care cost trend rates for the RMP and ORMP would have the following effects as of October 3, 2015:
| (dollars in thousands) | ||||||||
| 1-Percentage-Point Increase | 1-Percentage-Point Decrease | |||||||
| Effect on total of service and interest cost |
$ | 35 | $ | (31 | ) | |||
| Effect on accumulated postretirement benefit obligation |
$ | 880 | $ | (793 | ) | |||
The Company’s union employees participate in a multiemployer plan that provides health care benefits for retired union employees. Amounts contributed to the multiemployer plan for these union employees totaled $0.3 million in fiscal 2015, $5.0 million in fiscal 2014 and $5.4 million in fiscal 2013. Information from the plans’ administrators is not available to permit the Company to determine its proportionate share of termination liability, if any.
Patient Protection and Affordable Care Act
During fiscal year 2010, comprehensive health care reform legislation under the Patient Protection and Affordable Care Act (HR 3590) and the Health Care Education and Affordability Reconciliation Act (HR 4872) (collectively, the “Acts”) was passed and signed into law. The Acts contain provisions that could impact the Company’s retiree medical benefits in future periods, including the related accounting for such benefits, such as the 40% excise tax beginning in 2020 that will be imposed on the value of health insurance benefits exceeding a certain threshold.
139
Table of Contents
However, the full extent of the impact of the Acts, if any, cannot be determined until all regulations are promulgated under the Acts (or changed as a result of ongoing litigation) and additional interpretations of the Acts become available. Elements of the Acts, the impact of which are currently not determinable, include the elimination of lifetime limits on retiree medical coverage and reduction of the existing insurance coverage gap for prescription drug benefits that are actuarially equivalent to benefits available to retirees under the Medicare Prescription Drug Improvement and Modernization Act of 2003. On June 28, 2012, the U.S. Supreme Court upheld the constitutionality of the Acts; however, provisions in the Acts requiring each state to expand its Medicaid program or lose all federal Medicaid funds were struck down. The U.S. Supreme Court did not invalidate the Acts’ expansion of Medicaid for states that voluntarily participate; it only held that a state’s entire Medicaid funding cannot be withheld due to its failure to participate in the expansion. The Company will continue to assess the accounting implications of the Acts as related regulations and interpretations of the Acts become available. In addition, the Company may consider plan amendments in future periods that may have accounting implications.
15. Contingencies
The Company is party to various litigation, claims and disputes, some of which are for substantial amounts, arising in the ordinary course of business. While the ultimate effect of such actions cannot be predicted with certainty, the Company believes the outcome of these matters will not result in a material effect on its financial condition or results of operations.
16. Segment Reporting
Management identifies segments based on the information monitored by the Company’s chief operating decision maker to manage the business and, accordingly, has the following two reportable segments:
| · | The Wholesale Distribution segment includes the results of operations from the sale of groceries and general merchandise products to both Members and Non-Members, including a broad range of branded and corporate brand products in nearly all the categories found in a typical supermarket, including dry grocery, frozen food, deli, meat, dairy, eggs, produce, bakery, ethnic, gourmet, specialty foods, natural and organic, general merchandise and health and beauty care products. Support services (other than insurance and financing), including merchandising, retail pricing, advertising, promotional planning, retail technology, equipment purchasing and real estate services, are reported in the Wholesale Distribution segment. As of October 3, 2015, the Wholesale Distribution segment represents nearly 100% of the Company’s total net sales and 84% of total assets. |
Non-perishable products consist primarily of dry grocery, frozen food, deli, ethnic, gourmet, specialty foods, natural and organic, general merchandise and health and beauty care products. They also include (1) retail support services and (2) products and shipping services provided to Non-Member customers through Unified International, Inc. Perishable products consist primarily of service deli, service bakery, meat, eggs, produce, bakery, and dairy products. Net sales within the Wholesale Distribution segment include $2.6 billion, $2.4 billion and $2.4 billion, or 65%, 65% and 66% of total Wholesale Distribution segment net sales for fiscal years ended October 3, 2015, September 27, 2014 and September 28, 2013, respectively, attributable to sales of non-perishable products, and $1.4 billion, $1.3 billion and $1.2 billion, or 35%, 35% and 34% of total Wholesale Distribution segment net sales for the fiscal years ended October 3, 2015, September 27, 2014 and September 28, 2013, respectively, attributable to sales of perishable products. Wholesale Distribution segment net sales also include revenues attributable to the Company’s retail support services, which comprise less than 1% of total Wholesale Distribution segment net sales, for each of the foregoing respective periods.
Transactions involving vendor direct arrangements are comprised principally of sales of produce in the Pacific Northwest and Northern California and sales of branded ice cream in Southern California. “Gross billings,” a financial metric that adds back gross billings through vendor direct arrangements to net sales and is used by management to assess our operating performance, was $4.144 billion, $3.865 billion and $3.722 billion for the fiscal years ended October 3, 2015, September 27, 2014 and September 28, 2013, respectively.
| · | The Company’s former Insurance segment included the results of operations for the Acquired Companies (Unified Grocers Insurance Services and the Company’s two insurance subsidiaries, Springfield Insurance |
140
Table of Contents
| Company and Springfield Insurance Company, Limited). As of October 3, 2015, the Company’s former Insurance discontinued operations collectively account for approximately 13% of total assets. |
The All Other category includes the results of operations for the Company’s other support businesses, including its wholly-owned finance subsidiary, whose services are provided to a common customer base, none of which individually meets the quantitative thresholds of a reportable segment. As of October 3, 2015, the All Other category collectively accounts for less than 1% of the Company’s total net sales and 3% of total assets.
Information about the Company’s operating segments is as follows:
| (dollars in thousands) | ||||||||||||
| Fiscal Years Ended | ||||||||||||
| October 3, 2015 |
September 27, 2014 |
September 28, 2013 |
||||||||||
| Net sales |
||||||||||||
| Wholesale distribution: Gross billings |
$ | 4,143,540 | $ | 3,865,071 | $ | 3,722,387 | ||||||
| Less: Gross billings through vendor direct arrangements |
(117,021 | ) | (112,406 | ) | (51,142 | ) | ||||||
|
|
||||||||||||
| Wholesale distribution: Net sales |
4,026,519 | 3,752,665 | 3,671,245 | |||||||||
| All other |
1,544 | 1,119 | 1,356 | |||||||||
| Intersegment eliminations |
(443 | ) | (224 | ) | (142 | ) | ||||||
|
|
||||||||||||
| Total net sales |
$ | 4,027,620 | $ | 3,753,560 | $ | 3,672,459 | ||||||
|
|
||||||||||||
| Operating income (loss) |
||||||||||||
| Wholesale distribution |
$ | 1,355 | $ | 21,665 | $ | 11,761 | ||||||
| All other |
461 | 10 | 445 | |||||||||
|
|
||||||||||||
| Total operating income |
1,816 | 21,675 | 12,206 | |||||||||
|
|
||||||||||||
| Interest expense |
(9,978 | ) | (11,197 | ) | (12,788 | ) | ||||||
| Loss on early extinguishment of debt |
(3,200 | ) | — | (9,788 | ) | |||||||
| Patronage dividends |
(7,234 | ) | (9,395 | ) | (9,609 | ) | ||||||
| Income taxes |
3,951 | (1,508 | ) | 7,495 | ||||||||
|
|
||||||||||||
| Net loss from continuing operations |
$ | (14,645 | ) | $ | (425 | ) | $ | (12,484 | ) | |||
|
|
||||||||||||
| Loss from discontinued operations, net |
(3,701 | ) | (4,981 | ) | (5,160 | ) | ||||||
| Loss on pending sale of discontinued operations |
(3,173 | ) | — | — | ||||||||
|
|
||||||||||||
| Net loss |
$ | (21,519 | ) | $ | (5,406 | ) | $ | (17,644 | ) | |||
|
|
||||||||||||
| Depreciation and amortization |
||||||||||||
| Wholesale distribution |
$ | 30,955 | $ | 27,847 | $ | 25,126 | ||||||
| All other |
86 | 3 | 56 | |||||||||
|
|
||||||||||||
| Total depreciation and amortization |
$ | 31,041 | $ | 27,850 | $ | 25,182 | ||||||
|
|
||||||||||||
| Capital expenditures |
||||||||||||
| Wholesale distribution |
$ | 9,221 | $ | 9,938 | $ | 10,194 | ||||||
| Held-for-sale discontinued operations |
— | — | 224 | |||||||||
| All other |
— | — | — | |||||||||
|
|
||||||||||||
| Total capital expenditures |
$ | 9,221 | $ | 9,938 | $ | 10,418 | ||||||
|
|
||||||||||||
| Identifiable assets at respective year end date |
||||||||||||
| Wholesale distribution |
$ | 812,341 | $ | 781,438 | $ | 767,295 | ||||||
| Assets held for sale – discontinued operations |
125,904 | 123,729 | 119,338 | |||||||||
| All other |
26,080 | 23,050 | 29,973 | |||||||||
|
|
||||||||||||
| Total identifiable assets at respective fiscal year end date |
$ | 964,325 | $ | 928,217 | $ | 916,606 | ||||||
|
|
||||||||||||
141
Table of Contents
17. Concentration of Credit Risk
Financial instruments which potentially expose the Company to concentrations of credit risk consist primarily of trade receivables, notes receivable, and lease guarantees for certain Members. These concentrations of credit risk may be affected by changes in economic or other conditions affecting the western United States, particularly Arizona, California, Nevada, Oregon and Washington. However, management believes that receivables are well diversified, and the allowances for doubtful accounts are sufficient to absorb estimated losses. However, if the actual uncollected amounts of accounts and notes receivable significantly exceed the estimated allowances, the Company’s operating results would be significantly adversely affected. Obligations of Members to the Company, including lease guarantees, are generally supported by the Company’s right of offset, upon default, against the Members’ cash deposits and shareholdings, as well as personal guarantees and reimbursement and indemnification agreements.
The Company’s largest customer, Cash & Carry Stores, LLC, a wholly-owned subsidiary of Smart & Final, Inc., accounted for 16%, 15% and 14% of total net sales for the fiscal years ended October 3, 2015, September 27, 2014 and September 28, 2013, respectively. The Company’s ten largest customers (including Cash & Carry Stores, LLC) combined accounted for 53%, 49% and 47% of total net sales for the fiscal years ended October 3, 2015, September 27, 2014 and September 28, 2013, respectively.
The Company’s ten customers with the largest accounts receivable balances accounted for approximately 43% and 40% of total accounts receivable at October 3, 2015 and September 27, 2014, respectively.
18. Fair Value of Financial Instruments
The following methods and assumptions were used to estimate the fair value of each class of financial instruments for which it is practicable to estimate that value (these values represent an approximation of possible value and may never actually be realized):
Cash and cash equivalents. The carrying amount approximates fair value due to the short maturity of these instruments.
Accounts receivable and notes receivable. The carrying amount of accounts receivable approximates its fair value due to its short-term maturity. Other than discussed below, the carrying amount of notes receivable approximates its fair value based principally on the underlying interest rates and terms, maturities, collateral and credit status of the receivables and after consideration of recorded allowances.
As of September 28, 2013, there were indicators of impairment related to certain receivables. During the Company’s third quarter of fiscal 2014, the Company restructured these receivables as part of a troubled debt restructuring and recorded an immaterial impairment. The fair values of assets received, net of liabilities assumed, as part of the restructuring of these receivables were derived from models utilizing unobservable inputs that fall within Level 3 of the fair value hierarchy.
Investments. Generally, the fair values for investments are readily determinable based on actively traded securities in the marketplace. Investments that are not actively traded are valued based upon inputs including quoted prices for identical or similar assets. Equity securities that do not have readily determinable fair values are accounted for using the cost or equity methods of accounting. The Company regularly evaluates securities carried at cost to determine whether there has been any diminution in value that is deemed to be other than temporary and adjusts the value accordingly.
The following table represents the Company’s financial instruments recorded at fair value and the hierarchy of those assets as of October 3, 2015:
| (dollars in thousands) | ||||||||||||||||
| Level 1 | Level 2 | Level 3 | Total | |||||||||||||
| Mutual funds |
$ | 12,546 | — | — | $ | 12,546 | ||||||||||
|
|
||||||||||||||||
| Total |
$ | 12,546 | $ | — | $ | — | $ | 12,546 | ||||||||
|
|
||||||||||||||||
142
Table of Contents
The following table represents the Company’s financial instruments recorded at fair value and the hierarchy of those assets as of September 27, 2014:
| (dollars in thousands) | ||||||||||||||||
| Level 1 | Level 2 | Level 3 | Total | |||||||||||||
| Mutual funds |
$ | 15,443 | — | — | 15,443 | |||||||||||
|
|
||||||||||||||||
| Total |
$ | 15,443 | $ | — | $ | — | $ | 15,443 | ||||||||
|
|
||||||||||||||||
Mutual funds are valued by the Company based on information received from a third party. These assets are valued based on quoted prices in active markets (Level 1 inputs). At October 3, 2015 and September 27, 2014, respectively, $12.5 million and $15.4 million of mutual funds are included in other assets in the Company’s consolidated balance sheets. For assets traded in active markets, the assets are valued at quoted bond market prices (Level 1 inputs). For assets traded in inactive markets, the service’s pricing methodology uses observable inputs (such as bid/ask quotes) for identical or similar assets. Assets considered to be similar will have similar characteristics, such as: duration, volatility, prepayment speed, interest rates, yield curves, and/or risk profile and other market corroborated inputs (Level 2 inputs). The Company determines the classification of financial asset groups within the fair value hierarchy based on the lowest level of input into each group’s asset valuation.
The Company did not have any significant transfers into and out of Levels 1 and 2 during fiscal 2015 and 2014.
Notes payable. The fair values of borrowings under the Company’s revolving credit facilities are estimated to approximate their carrying amounts due to the short maturities of those obligations. The fair values for other notes payable are based primarily on rates currently available to the Company for debt with similar terms and remaining maturities.
The fair value of notes payable was $278.8 million and $234.5 million compared to their carrying value of $278.5 million and $238.5 million at October 3, 2015 and September 27, 2014, respectively. These values were based on estimates of market conditions, estimates using present value and risks existing at that time (Level 2 inputs).
143
Table of Contents
19. Accumulated Other Comprehensive Earnings (Loss)
The balance and components of the change in accumulated other comprehensive earnings (loss), net of taxes, are as follows:
| (dollars in thousands) | ||||||||||||
| Unrealized Net Holding Gain (Loss) on Investments |
Defined Benefit Pension Plans and Other Postretirement Benefit Plans Items |
Total | ||||||||||
| Balance, September 29, 2012 |
1,656 | (61,809 | ) | (60,153 | ) | |||||||
| Other comprehensive earnings (loss) before reclassifications |
165 | 49,815 | 49,980 | |||||||||
| Reclassification adjustment for gains included in net earnings |
(1,320 | ) | (787 | ) | (2,107 | ) | ||||||
|
|
||||||||||||
| Net current period other comprehensive earnings (loss) |
(1,155 | ) | 49,028 | 47,873 | ||||||||
|
|
||||||||||||
| Balance, September 28, 2013 |
501 | (12,781 | ) | (12,280 | ) | |||||||
| Other comprehensive earnings (loss) before reclassifications |
593 | (10,199 | ) | (9,606 | ) | |||||||
| Reclassification adjustment for gains included in net earnings |
(944 | ) | (5,043 | ) | (5,987 | ) | ||||||
| Deferred tax asset valuation allowance allocated to defined benefit pension plans and other postretirement benefit plans |
— | (6,176 | ) | (6,176 | ) | |||||||
|
|
||||||||||||
| Net current period other comprehensive earnings (loss) |
(351 | ) | (21,418 | ) | (21,769 | ) | ||||||
|
|
||||||||||||
| Balance, September 27, 2014 |
150 | (34,199 | ) | (34,049 | ) | |||||||
| Other comprehensive earnings (loss) before reclassifications |
(698 | ) | (19,676 | ) | (20,374 | ) | ||||||
| Reclassification adjustment for gains included in net earnings |
15 | (4,411 | ) | (4,396 | ) | |||||||
| Deferred tax asset valuation allowance allocated to defined benefit pension plans and other postretirement benefit plans |
— | (13,411 | ) | (13,411 | ) | |||||||
|
|
||||||||||||
| Net current period other comprehensive earnings (loss) |
(683 | ) | (37,498 | ) | (38,181 | ) | ||||||
|
|
||||||||||||
| Balance, October 3, 2015 |
$ | (533 | ) | $ | (71,697 | ) | $ | (72,230 | ) | |||
|
|
||||||||||||
144
Table of Contents
The reclassifications out of accumulated other comprehensive earnings (loss) were as follows:
| (dollars in thousands) | ||||||||||||||
| Amount Reclassified from Accumulated Other Comprehensive Earnings (Loss) |
Affected Line Item in the Consolidated Statements of Earnings (Loss) | |||||||||||||
| Fiscal Year Ended | ||||||||||||||
| October 3, 2015 |
September 27, 2014 |
September 28, 2013 |
||||||||||||
| Unrealized net holding gain on investments: |
||||||||||||||
| Realized gains—Insurance segment |
$ | — | $ | 1,049 | $ | 1,200 | Net sales | |||||||
| Realized (losses) gains—Wholesale Distribution segment |
(21 | ) | 390 | 816 | Distribution, selling and administrative expenses | |||||||||
|
| ||||||||||||||
| (21 | ) | 1,439 | 2,016 | Earnings (loss) before income taxes | ||||||||||
| 6 | (495 | ) | (696 | ) | Income taxes | |||||||||
|
| ||||||||||||||
| $ | (15 | ) | $ | 944 | $ | 1,320 | Net earnings (loss) | |||||||
| Defined benefit pension plans and other postretirement benefit plans items: |
||||||||||||||
| Amortization of unrecognized prior service credits |
8,352 | 8,577 | 6,651 | (a) | ||||||||||
| Amortization of actuarial losses |
(1,532 | ) | (3,253 | ) | (8,121 | ) | (a) | |||||||
| Gain on termination of non-union sick leave plan |
— | 2,472 | — | |||||||||||
| Gain on curtailment of retiree medical plan |
— | — | 2,686 | (a) | ||||||||||
|
| ||||||||||||||
| 6,820 | 7,796 | 1,216 | Earnings (loss) before income taxes | |||||||||||
| (2,409 | ) | (2,753 | ) | (429 | ) | Income taxes | ||||||||
|
| ||||||||||||||
| $ | 4,411 | $ | 5,043 | $ | 787 | Net earnings (loss) | ||||||||
|
| ||||||||||||||
| Total reclassifications for the period |
$ | 4,396 | $ | 5,987 | $ | 2,107 | Net earnings (loss) | |||||||
|
| ||||||||||||||
| (a) | These accumulated other comprehensive earnings (loss) components are included in the computation of net periodic benefit cost for pension and postretirement benefit plans. See Notes 13 and 14 for further information. |
The following table indicates the benefit plans that comprise the adjustment to accumulated other comprehensive earnings (loss) as of October 3, 2015 for the impact of ASC Topic 715-20 “Compensation—Retirement Benefits—Defined Benefits Plans—General” (“ASC Topic 715-20”):
| (dollars in thousands) | ||||||||||||
| Description of Benefit Plan | Pre-tax Adjustment for Impact of ASC Topic 715-20 (charge)/credit |
Deferred Tax Benefit (Liability) |
Adjustment for Impact of ASC Topic 715-20, Net of Taxes (charge)/credit |
|||||||||
| Cash Balance Plan |
$ | (81,205 | ) | $ | 28,775 | $ | (52,430 | ) | ||||
| Executive Salary Protection Plan |
(5,232 | ) | 1,848 | (3,384 | ) | |||||||
| Postretirement benefit plans |
6,072 | (2,667 | ) | 3,405 | ||||||||
| Postemployment benefit plans |
463 | (164 | ) | 299 | ||||||||
| Deferred tax asset valuation allowance allocated to defined benefit pension plans and other postretirement benefit plans |
— | (19,587 | ) | (19,587 | ) | |||||||
|
|
||||||||||||
| Total, October 3, 2015 |
$ | (79,902 | ) | $ | 8,205 | $ | (71,697 | ) | ||||
|
|
||||||||||||
145
Table of Contents
The following table indicates the benefit plans that comprise the adjustment to accumulated other comprehensive earnings (loss) as of September 27, 2014 for the impact of ASC Topic 715-20 “Compensation—Retirement Benefits—Defined Benefits Plans—General” (“ASC Topic 715-20”):
| (dollars in thousands) | ||||||||||||
| Description of Benefit Plan | Pre-tax Adjustment for Impact of ASC Topic 715-20 (charge)/credit |
Deferred Tax Benefit (Liability) |
Adjustment for Impact of ASC Topic 715-20, Net of Taxes (charge)/credit |
|||||||||
| Cash Balance Plan |
$ | (52,806 | ) | $ | 18,744 | $ | (34,062 | ) | ||||
| Executive Salary Protection Plan |
(5,518 | ) | 1,949 | (3,569 | ) | |||||||
| Postretirement benefit plans |
15,173 | (5,884 | ) | 9,289 | ||||||||
| Postemployment benefit plans |
493 | (174 | ) | 319 | ||||||||
| Deferred tax asset valuation allowance allocated to defined benefit pension plans and other postretirement benefit plans |
— | (6,176 | ) | (6,176 | ) | |||||||
|
|
||||||||||||
| Total, September 27, 2014 |
$ | (42,658 | ) | $ | 8,459 | $ | (34,199 | ) | ||||
|
|
||||||||||||
The following table indicates the benefit plans that comprise the adjustment to accumulated other comprehensive earnings (loss) as of September 28, 2013 for the impact of ASC Topic 715-20 “Compensation—Retirement Benefits—Defined Benefits Plans—General” (“ASC Topic 715-20”):
| (dollars in thousands) | ||||||||||||
| Description of Benefit Plan | Pre-tax Adjustment for Impact of ASC Topic 715-20 (charge)/credit |
Deferred Tax Benefit (Liability) |
Adjustment for Impact of ASC Topic 715-20, Net of Taxes (charge)/credit |
|||||||||
| Cash Balance Plan |
$ | (37,477 | ) | $ | 13,330 | $ | (24,147 | ) | ||||
| Executive Salary Protection Plan |
(7,481 | ) | 2,642 | (4,839 | ) | |||||||
| Postretirement benefit plans |
25,437 | (9,531 | ) | 15,906 | ||||||||
| Postemployment benefit plans |
461 | (162 | ) | 299 | ||||||||
|
|
||||||||||||
| Total, September 28, 2013 |
$ | (19,060 | ) | $ | 6,279 | $ | (12,781 | ) | ||||
|
|
||||||||||||
20. Related Party Transactions
Members affiliated with directors of the Company make purchases of merchandise from the Company and also may receive benefits and services that are of the type generally offered by the Company to similarly situated eligible Members.
Since the programs listed below are only available to Members of the Company, it is not possible to assess whether transactions with Members of the Company, including entities affiliated with directors of the Company, are less favorable to the Company than similar transactions with unrelated third parties. However, management believes such transactions are on terms that are generally consistent with terms available to other Members similarly situated.
A brief description of related party transactions with Members affiliated with directors of the Company and transactions with executive officers follows.
Loans to Members
Unified provides loan financing to its Members. The Company had the following loans outstanding at October 3, 2015 to a Member affiliated with a director of the Company:
| (dollars in thousands) | ||||||||||||
| Director | Interest Rate |
Aggregate Loan Balance |
Maturity Date |
|||||||||
| Michael S. Trask |
4.25 | % | $ | 157 | 2018 | |||||||
146
Table of Contents
Lease Guarantees and Subleases
The Company provides lease guarantees and subleases to its Members. The Company has executed lease guarantees or subleases to Members affiliated with directors of the Company at October 3, 2015 as follows:
| (dollars in thousands) | ||||||||||||||||
| Director | No. of Stores |
Total Current Annual Rent |
Total Guaranteed Rent |
Expiration Date(s) |
||||||||||||
| John Berberian |
3 | 469 | 778 | 2017-2018 | ||||||||||||
| Mimi Song |
1 | 430 | 3,189 | 2023 | ||||||||||||
In March 2015, a store location subleased to Super A Foods, Inc., a customer affiliated with Louis Amen, a Unified Member-Director and Chairman of the Board, Super A Foods, Inc., was assigned (via Assignment Of Sublease) to a customer affiliated with John Berberian, a Unified Member-Director and President, Berberian Enterprises, Inc.
Supply Agreements
During the course of its business, the Company enters into individually negotiated supply agreements with its Members. These agreements typically require the Member to purchase certain agreed amounts of its merchandise requirements from the Company and obligate the Company to supply such merchandise under agreed terms and conditions relating to such matters as pricing and delivery. The Company has executed supply agreements with Members affiliated with directors of the Company at October 3, 2015 as follows:
| Director | Expiration Date |
|||
| Vache Fermanian |
2016 | |||
| Oscar Gonzalez |
2015-2017 | |||
| Mark Kidd |
2020 | |||
| Jay T. McCormack |
2015 | |||
| Mimi Song |
2016 | |||
| Michael S. Trask |
*2018 | |||
| * | The supply agreement with Michael S. Trask will expire in the later of April 2018 or one year following payment in full of all loan obligations. |
Loan to Executive Officer
In December 2000, to facilitate a senior executive’s relocation to Southern California, the Company loaned to this executive, pursuant to a note, $0.1 million with interest of 7.0% per annum payable quarterly and principal due at the option of the holder. This loan was paid in full in the first quarter of the Company’s fiscal 2015.
Workers’ Compensation Loss Portfolio Purchased from a Customer Affiliated with a Member-Director
As discussed in Note 2, a related party transaction in fiscal 2012 with K.V. Mart Co., a customer affiliated with Darioush Khaledi, a Unified Member-Director and Chairman of the Board and Chief Executive Officer of K.V. Mart Co., was not presented for review and approval to the Unified Board of Directors, and was not disclosed. The transaction involved changes to the deductible structure and other characteristics of a portfolio of workers compensation policies held by the Company’s former Insurance segment. This high-deductible loss portfolio contained policies for employees of K.V. Mart Co. and was assumed by the Company in conjunction with a payment of $3.6 million by K.V. Mart Co. In fiscal 2013, the Company experienced an increase in its cost of sales due, in part, to increased reserve requirements of $2.0 million associated with this portfolio.
21. Subsequent Events
Subsequent events have been evaluated by the Company through the date financial statements were issued.
147
Table of Contents
22. Quarterly Financial Data (Unaudited)
As further described in Part I, “Explanatory Note,” to this comprehensive Annual Report on Form 10-K for the fiscal years ended October 3, 2015 and September 27, 2014 and the quarterly periods ended December 27, 2014, March 28, 2015 and June 27, 2015 (the “Comprehensive Form 10-K”), in lieu of filing Quarterly Reports on Form 10-Q for fiscal 2015, quarterly financial data for fiscal 2015 and fiscal 2014 (as re-casted to give effect to the Company’s held-for-sale discontinued operations) is included in this Comprehensive Form 10-K in the tables that follow. Amounts are computed independently each quarter; therefore, the sum of the quarterly amounts may not equal the total amount for the respective years due to rounding.
148
Table of Contents
Unified Grocers, Inc. and Subsidiaries
Quarterly Consolidated Balance Sheets (Unaudited)
(dollars in thousands)
| June 27, 2015 |
March 28, 2015 |
December 27, 2014 |
||||||||||
| Assets |
||||||||||||
| Current Assets: |
||||||||||||
| Cash and cash equivalents |
$ | 2,194 | $ | 2,542 | $ | 2,924 | ||||||
| Accounts and current portion of notes receivable, net of allowances of $4,188, $3,865 and $3,484 at June 27, 2015, March 28, 2015 and December 27, 2014, respectively |
204,599 | 185,020 | 190,987 | |||||||||
| Inventories |
298,591 | 276,228 | 240,617 | |||||||||
| Prepaid expenses and other current assets |
9,627 | 6,624 | 8,672 | |||||||||
| Deferred income taxes |
8,971 | 8,971 | 8,971 | |||||||||
| Assets held for sale—current |
137,372 | 123,318 | 120,896 | |||||||||
|
|
||||||||||||
| Total current assets |
661,354 | 602,703 | 573,067 | |||||||||
| Properties and equipment, net |
159,897 | 159,273 | 159,626 | |||||||||
| Investments |
13,063 | 13,064 | 13,063 | |||||||||
| Notes receivable, less current portion and net of allowances of $76, $97 and $60 at June 27, 2015, March 28, 2015 and December 27, 2014, respectively |
15,578 | 16,337 | 16,111 | |||||||||
| Goodwill |
37,846 | 37,846 | 37,846 | |||||||||
| Other assets, net |
108,585 | 117,019 | 112,960 | |||||||||
|
|
||||||||||||
| Total Assets |
$ | 996,323 | $ | 946,242 | $ | 912,673 | ||||||
|
|
||||||||||||
| Liabilities and Shareholders’ Equity |
||||||||||||
| Current Liabilities: |
||||||||||||
| Accounts payable |
$ | 292,218 | $ | 278,367 | $ | 220,933 | ||||||
| Accrued liabilities |
47,324 | 44,645 | 41,993 | |||||||||
| Current portion of notes payable |
15,757 | 13,852 | 11,253 | |||||||||
| Members’ deposits and declared patronage dividends |
8,676 | 8,666 | 10,761 | |||||||||
| Liabilities held for sale—current |
93,675 | 95,511 | 93,046 | |||||||||
|
|
||||||||||||
| Total current liabilities |
457,650 | 441,041 | 377,986 | |||||||||
| Notes payable, less current portion |
275,757 | 234,807 | 249,331 | |||||||||
| Long-term liabilities, other |
133,089 | 135,673 | 138,546 | |||||||||
| Members’ and Non-Members’ deposits |
7,447 | 7,500 | 7,451 | |||||||||
| Commitments and contingencies |
||||||||||||
| Shareholders’ equity: |
||||||||||||
| Class A Shares: 500,000 shares authorized, 124,950, 126,000 and 129,500 shares outstanding at June 27, 2015, March 28, 2015 and December 27, 2014, respectively |
23,506 | 23,715 | 24,371 | |||||||||
| Class B Shares: 2,000,000 shares authorized, 413,522 shares outstanding at June 27, 2015, March 28, 2015 and December 27, 2014 |
75,670 | 75,670 | 75,670 | |||||||||
| Class E Shares: 2,000,000 shares authorized, 208,513 shares outstanding at June 27, 2015, March 28, 2015 and December 27, 2014 |
20,851 | 20,851 | 20,851 | |||||||||
| Retained earnings—allocated |
33,602 | 36,115 | 47,104 | |||||||||
| Retained earnings—non-allocated |
6,864 | 6,864 | 6,864 | |||||||||
|
|
||||||||||||
| Total retained earnings |
40,466 | 42,979 | 53,968 | |||||||||
| Receivable from sale of Class A Shares to Members |
(286 | ) | (318 | ) | (348 | ) | ||||||
| Accumulated other comprehensive loss |
(37,827 | ) | (35,676 | ) | (35,153 | ) | ||||||
|
|
||||||||||||
| Total shareholders’ equity |
122,380 | 127,221 | 139,359 | |||||||||
|
|
||||||||||||
| Total Liabilities and Shareholders’ Equity |
$ | 996,323 | $ | 946,242 | $ | 912,673 | ||||||
|
|
||||||||||||
149
Table of Contents
Unified Grocers, Inc. and Subsidiaries
Quarterly Consolidated Balance Sheets (Unaudited)
(dollars in thousands)
| June 28, 2014 |
March 29, 2014 |
December 28, 2013 |
||||||||||
| Assets |
||||||||||||
| Current Assets: |
||||||||||||
| Cash and cash equivalents |
$ | 10,904 | $ | 2,742 | $ | 5,529 | ||||||
| Accounts and current portion of notes receivable, net of allowances of $3,505 $3,708 and $3,590 at June 28, 2014, March 29, 2014 and December 28, 2013, respectively |
187,178 | 173,042 | 180,885 | |||||||||
| Inventories |
239,436 | 250,550 | 234,962 | |||||||||
| Prepaid expenses and other current assets |
14,666 | 8,827 | 7,966 | |||||||||
| Deferred income taxes |
5,558 | 5,558 | 5,558 | |||||||||
| Assets held for sale—current |
121,591 | 123,479 | 121,840 | |||||||||
|
|
||||||||||||
| Total current assets |
579,333 | 564,198 | 556,740 | |||||||||
| Properties and equipment, net |
163,680 | 163,098 | 163,983 | |||||||||
| Investments |
13,269 | 13,260 | 13,260 | |||||||||
| Notes receivable, less current portion and net of allowances of $53, $0 and $39 at June 28, 2014, March 29, 2014 and December 28, 2013, respectively |
17,294 | 17,131 | 21,898 | |||||||||
| Goodwill |
37,846 | 37,846 | 37,846 | |||||||||
| Other assets, net |
117,160 | 123,490 | 113,550 | |||||||||
|
|
||||||||||||
| Total Assets |
$ | 928,582 | $ | 919,023 | $ | 907,277 | ||||||
|
|
||||||||||||
| Liabilities and Shareholders’ Equity |
||||||||||||
| Current Liabilities: |
||||||||||||
| Accounts payable |
$ | 230,209 | $ | 201,020 | $ | 195,857 | ||||||
| Accrued liabilities |
43,344 | 41,895 | 42,455 | |||||||||
| Current portion of notes payable |
22,149 | 19,392 | 11,338 | |||||||||
| Members’ deposits and declared patronage dividends |
12,424 | 12,578 | 12,080 | |||||||||
| Liabilities held for sale—current |
93,169 | 90,960 | 89,475 | |||||||||
|
|
||||||||||||
| Total current liabilities |
401,295 | 365,845 | 351,205 | |||||||||
| Notes payable, less current portion |
231,494 | 251,008 | 239,776 | |||||||||
| Long-term liabilities, other |
123,051 | 126,034 | 127,966 | |||||||||
| Members’ and Non-Members’ deposits |
9,118 | 6,936 | 6,642 | |||||||||
| Commitments and contingencies |
||||||||||||
| Shareholders’ equity: |
||||||||||||
| Class A Shares: 500,000 shares authorized, 130,550, 134,400 and 136,150 shares outstanding at June 28, 2014, March 29, 2014 and December 28, 2013, respectively |
24,402 | 25,098 | 25,424 | |||||||||
| Class B Shares: 2,000,000 shares authorized, 412,125, 411,420 and 431,037 shares outstanding at June 28, 2014, March 29, 2014 and December 28, 2013, respectively |
75,280 | 75,083 | 78,554 | |||||||||
| Class E Shares: 2,000,000 shares authorized, 208,513, 212,498 and 251,403 shares outstanding at June 28, 2014, March 29, 2014 and December 28, 2013, respectively |
20,851 | 21,250 | 25,140 | |||||||||
| Retained earnings—allocated |
51,209 | 55,467 | 59,543 | |||||||||
| Retained earnings—non-allocated |
6,864 | 6,864 | 6,864 | |||||||||
|
|
||||||||||||
| Total retained earnings |
58,073 | 62,331 | 66,407 | |||||||||
| Receivable from sale of Class A Shares to Members |
(136 | ) | (152 | ) | (181 | ) | ||||||
| Accumulated other comprehensive loss |
(14,846 | ) | (14,410 | ) | (13,656 | ) | ||||||
|
|
||||||||||||
| Total shareholders’ equity |
163,624 | 169,200 | 181,688 | |||||||||
|
|
||||||||||||
| Total Liabilities and Shareholders’ Equity |
$ | 928,582 | $ | 919,023 | $ | 907,277 | ||||||
|
|
||||||||||||
150
Table of Contents
Unified Grocers, Inc. and Subsidiaries
Quarterly Consolidated Statements of Earnings (Loss) (Unaudited)
(dollars in thousands)
| Fiscal Quarters Ended | Year to Date | Fiscal Quarter Ended |
Year to Date | Fiscal Quarter Ended |
||||||||||||||||||||
| December 27, (First Quarter) |
March 28, (Second Quarter) |
March 28, (26 weeks) |
June 27, 2015 (Third Quarter) |
June 27, (39 weeks) |
October 3, (Fourth Quarter) |
|||||||||||||||||||
| Net sales (gross billings including vendor direct arrangements were $994,545, $931,756, $1,069,587 and $1,148,753 for fiscal quarters ended December 27, 2014, March 28, 2015, June 27, 2015 and October 3, 2015, respectively) |
$ | 967,768 | $ | 906,395 | $ | 1,874,163 | $ | 1,038,615 | $ | 2,912,778 | $ | 1,114,842 | ||||||||||||
| Cost of sales |
898,040 | 842,876 | 1,740,916 | 965,638 | 2,706,554 | 1,037,781 | ||||||||||||||||||
| Distribution, selling and administrative expenses |
64,926 | 68,498 | 133,424 | 70,710 | 204,134 | 77,335 | ||||||||||||||||||
|
|
||||||||||||||||||||||||
| Operating income (loss) |
4,802 | (4,979 | ) | (177 | ) | 2,267 | 2,090 | (274 | ) | |||||||||||||||
| Interest expense |
(2,718 | ) | (2,313 | ) | (5,031 | ) | (2,477 | ) | (7,508 | ) | (2,470 | ) | ||||||||||||
| Loss on early extinguishment of debt |
(3,200 | ) | — | (3,200 | ) | — | (3,200 | ) | — | |||||||||||||||
|
|
||||||||||||||||||||||||
| (Loss) earnings before patronage dividends and income taxes |
(1,116 | ) | (7,292 | ) | (8,408 | ) | (210 | ) | (8,618 | ) | (2,744 | ) | ||||||||||||
| Patronage dividends |
(1,492 | ) | (1,364 | ) | (2,856 | ) | (1,636 | ) | (4,492 | ) | (2,742 | ) | ||||||||||||
|
|
||||||||||||||||||||||||
| (Loss) earnings before income taxes |
(2,608 | ) | (8,656 | ) | (11,264 | ) | (1,846 | ) | (13,110 | ) | (5,486 | ) | ||||||||||||
| Income tax benefit (provision) |
1,075 | (1,302 | ) | (227 | ) | (66 | ) | (293 | ) | 4,244 | ||||||||||||||
|
|
||||||||||||||||||||||||
| Net (loss) earnings from continuing operations |
(1,533 | ) | (9,958 | ) | (11,491 | ) | (1,912 | ) | (13,403 | ) | (1,242 | ) | ||||||||||||
|
|
||||||||||||||||||||||||
| Discontinued operations: |
||||||||||||||||||||||||
| Earnings (loss) from discontinued operations, net of income tax benefit (provision) of $(235), $329, $(2) and $(92) for fiscal quarters ended December 27, 2014, March 28, 2015, June 27, 2015 and October 3, 2015, respectively |
446 | (528 | ) | (82 | ) | (6 | ) | (88 | ) | (3,613 | ) | |||||||||||||
| Loss on pending sale of discontinued operations |
(150 | ) | (179 | ) | (329 | ) | (512 | ) | (841 | ) | (2,332 | ) | ||||||||||||
|
|
||||||||||||||||||||||||
| Net earnings (loss) from discontinued operations |
296 | (707 | ) | (411 | ) | (518 | ) | (929 | ) | (5,945 | ) | |||||||||||||
|
|
||||||||||||||||||||||||
| Net loss |
$ | (1,237 | ) | $ | (10,665 | ) | $ | (11,902 | ) | $ | (2,430 | ) | $ | (14,332 | ) | $ | (7,187 | ) | ||||||
|
|
||||||||||||||||||||||||
151
Table of Contents
Unified Grocers, Inc. and Subsidiaries
Quarterly Consolidated Statements of Earnings (Loss) (Unaudited)
(dollars in thousands)
| Fiscal Quarters Ended | Year to Date | Fiscal Quarter Ended |
Year to Date | Fiscal Quarter Ended |
||||||||||||||||||||
| December 28, (First Quarter) |
March 29, 2014 (Second Quarter) |
March 29, (26 weeks) |
June 28, 2014 (Third Quarter) |
June 28, 2014 (39 weeks) |
September 27, (Fourth Quarter) |
|||||||||||||||||||
| Net sales (gross billings including vendor direct arrangements were $973,977, $915,305, $979,293 and $997,391 for fiscal quarters ended December 28, 2013, March 29, 2014, June 28, 2014 and September 27, 2014, respectively) |
$ | 949,543 | $ | 889,603 | $ | 1,839,146 | $ | 947,395 | $ | 2,786,541 | $ | 967,019 | ||||||||||||
| Cost of sales |
876,464 | 818,753 | 1,695,217 | 876,222 | 2,571,439 | 895,458 | ||||||||||||||||||
| Distribution, selling and administrative expenses |
64,394 | 68,392 | 132,786 | 64,992 | 197,778 | 67,210 | ||||||||||||||||||
|
|
||||||||||||||||||||||||
| Operating income (loss) |
8,685 | 2,458 | 11,143 | 6,181 | 17,324 | 4,351 | ||||||||||||||||||
| Interest expense |
(2,834 | ) | (2,768 | ) | (5,602 | ) | (2,847 | ) | (8,449 | ) | (2,748 | ) | ||||||||||||
| Loss on early extinguishment of debt |
— | — | — | — | — | — | ||||||||||||||||||
|
|
||||||||||||||||||||||||
| Earnings (loss) before patronage dividends and income taxes |
5,851 | (310 | ) | 5,541 | 3,334 | 8,875 | 1,603 | |||||||||||||||||
| Patronage dividends |
(2,388 | ) | (2,483 | ) | (4,871 | ) | (2,510 | ) | (7,381 | ) | (2,014 | ) | ||||||||||||
|
|
||||||||||||||||||||||||
| Earnings (loss) before income taxes |
3,463 | (2,793 | ) | 670 | 824 | 1,494 | (411 | ) | ||||||||||||||||
| Income tax (provision) benefit |
(1,061 | ) | 955 | (106 | ) | (1 | ) | (107 | ) | (1,401 | ) | |||||||||||||
|
|
||||||||||||||||||||||||
| Net earnings (loss) from continuing operations |
2,402 | (1,838 | ) | 564 | 823 | 1,387 | (1,812 | ) | ||||||||||||||||
|
|
||||||||||||||||||||||||
| Discontinued operations: |
||||||||||||||||||||||||
| Earnings (loss) from discontinued operations, net of income tax (provision) benefit of $(180), $(61), $2,422 and $733 for fiscal quarters ended December 28, 2013, March 29, 2014, June 28, 2014 and September 27, 2014, respectively |
387 | 127 | 514 | (4,700 | ) | (4,186 | ) | (795 | ) | |||||||||||||||
| Loss on pending sale of discontinued operations |
— | — | — | — | — | — | ||||||||||||||||||
|
|
||||||||||||||||||||||||
| Net earnings (loss) from discontinued operations |
387 | 127 | 514 | (4,700 | ) | (4,186 | ) | (795 | ) | |||||||||||||||
|
|
||||||||||||||||||||||||
| Net earnings (loss) |
$ | 2,789 | $ | (1,711 | ) | $ | 1,078 | $ | (3,877 | ) | $ | (2,799 | ) | $ | (2,607 | ) | ||||||||
|
|
||||||||||||||||||||||||
152
Table of Contents
Unified Grocers, Inc. and Subsidiaries
Consolidated Statements of Cash Flows (Unaudited)
(dollars in thousands)
| Fiscal Quarters Ended | ||||||||||||
| June 27, (39 weeks) |
March 28, (26 weeks) |
December 27, (13 weeks) |
||||||||||
| Cash flows from operating activities: |
||||||||||||
| Net loss |
$ | (14,332 | ) | $ | (11,902 | ) | $ | (1,237 | ) | |||
| Less: Net (loss) earnings from discontinued operations |
(88 | ) | (82 | ) | 446 | |||||||
| Less: Loss on pending sale of discontinued operations |
(841 | ) | (329 | ) | (150 | ) | ||||||
|
|
||||||||||||
| Net loss from continuing operations |
(13,403 | ) | (11,491 | ) | (1,533 | ) | ||||||
| Adjustments to reconcile net (loss) earnings to net cash provided by operating activities: |
||||||||||||
| Depreciation and amortization |
22,089 | 14,479 | 7,242 | |||||||||
| Provision for doubtful accounts |
1,064 | 671 | 317 | |||||||||
| (Gain) loss on sale of properties and equipment |
(192 | ) | (190 | ) | (190 | ) | ||||||
| Loss on early extinguishment of debt |
3,200 | 3,200 | 3,200 | |||||||||
| Deferred income taxes |
— | — | — | |||||||||
| (Increase) decrease in assets: |
||||||||||||
| Accounts receivable |
(21,486 | ) | (2,143 | ) | (5,397 | ) | ||||||
| Inventories |
(41,266 | ) | (18,903 | ) | 16,708 | |||||||
| Prepaid expenses and other current assets |
(1,511 | ) | 1,630 | (369 | ) | |||||||
| Increase (decrease) in liabilities: |
||||||||||||
| Accounts payable |
44,297 | 30,645 | (27,030 | ) | ||||||||
| Accrued liabilities |
3,650 | 209 | (2,860 | ) | ||||||||
| Long-term liabilities, other |
(9,458 | ) | (5,170 | ) | (567 | ) | ||||||
|
|
||||||||||||
| Net cash (utilized) provided by continuing operating activities |
(13,016 | ) | 12,937 | (10,479 | ) | |||||||
| Net cash utilized for pending sale of discontinued operations |
(841 | ) | (329 | ) | (150 | ) | ||||||
|
|
||||||||||||
| Net cash (utilized) provided by continuing operating activities |
(13,857 | ) | 12,608 | (10,629 | ) | |||||||
| Net cash provided (utilized) by discontinued operating activities |
4,367 | 4,813 | (408 | ) | ||||||||
|
|
||||||||||||
| Net cash (utilized) provided by operating activities |
(9,490 | ) | 17,421 | (11,037 | ) | |||||||
|
|
||||||||||||
| Cash flows from investing activities: |
||||||||||||
| Purchases of properties and equipment |
(7,199 | ) | (3,254 | ) | (845 | ) | ||||||
| Purchases of securities and other investments |
(10,000 | ) | — | — | ||||||||
| Proceeds from maturities or sales of securities and other investments |
206 | 206 | 206 | |||||||||
| Origination of notes receivable |
(1,215 | ) | (1,172 | ) | (275 | ) | ||||||
| Collection of notes receivable |
2,971 | 2,073 | 939 | |||||||||
| Proceeds from sales of properties and equipment |
192 | 190 | 190 | |||||||||
| Increase in other assets |
(12,301 | ) | (9,714 | ) | (3,478 | ) | ||||||
|
|
||||||||||||
| Net cash utilized by continuing investing activities |
(27,346 | ) | (11,671 | ) | (3,263 | ) | ||||||
| Net cash utilized by discontinued investing activities |
(2,894 | ) | (6,159 | ) | (212 | ) | ||||||
|
|
||||||||||||
| Net cash utilized by investing activities |
(30,240 | ) | (17,830 | ) | (3,475 | ) | ||||||
|
|
||||||||||||
| Cash flows from financing activities: |
||||||||||||
| Net revolver borrowings (repayments) under secured credit agreements |
20,500 | (23,100 | ) | (14,205 | ) | |||||||
| Borrowings of notes payable |
86,262 | 86,262 | 86,262 | |||||||||
| Repayments of notes payable |
(54,500 | ) | (53,034 | ) | (50,004 | ) | ||||||
| Payment of deferred financing fees |
(1,977 | ) | (1,938 | ) | (1,647 | ) | ||||||
| Payment of debt extinguishment costs |
(3,023 | ) | (3,023 | ) | (3,023 | ) | ||||||
| Decrease in Members’ deposits and declared patronage dividends |
(2,933 | ) | (2,943 | ) | (848 | ) | ||||||
| (Decrease) increase in Members’ and Non-Members’ deposits |
(965 | ) | (912 | ) | (961 | ) | ||||||
| Decrease (increase) in receivable from sale of Class A Shares to Members, net |
97 | 65 | 35 | |||||||||
| Repurchase of shares from Members |
(1,271 | ) | (979 | ) | — | |||||||
| Issuance of shares to Members |
— | — | — | |||||||||
|
|
||||||||||||
| Net cash provided by continuing financing activities |
42,190 | 398 | 15,609 | |||||||||
| Net cash utilized by discontinued financing activities |
— | — | — | |||||||||
|
|
||||||||||||
| Net cash provided by financing activities |
42,190 | 398 | 15,609 | |||||||||
|
|
||||||||||||
| Net increase in cash and cash equivalents from continuing operations |
987 | 1,335 | 1,717 | |||||||||
| Cash and cash equivalents at beginning of year |
1,207 | 1,207 | 1,207 | |||||||||
|
|
||||||||||||
| Cash and cash equivalents at end of period |
$ | 2,194 | $ | 2,542 | $ | 2,924 | ||||||
|
|
||||||||||||
| Supplemental disclosure of cash flow information: |
||||||||||||
| Interest paid during the period |
$ | 6,409 | $ | 4,294 | $ | 2,341 | ||||||
| Income taxes paid during the period |
$ | 89 | $ | 54 | $ | — | ||||||
|
|
||||||||||||
| Supplemental disclosure of non-cash items: |
||||||||||||
| Capital leases |
$ | 721 | $ | — | $ | — | ||||||
| Write-off of unamortized deferred financing fees due to debt extinguishment |
$ | 177 | $ | 177 | $ | 177 | ||||||
| Conversion of Class B Shares to Class A Shares |
$ | — | $ | — | $ | — | ||||||
| Assets received, net of liabilities assumed, from conversion of receivables |
$ | — | $ | — | $ | — | ||||||
| Shares redeemed for settlement of receivables |
$ | — | $ | — | $ | — | ||||||
153
Table of Contents
Unified Grocers, Inc. and Subsidiaries
Consolidated Statements of Cash Flows (Unaudited)
(dollars in thousands)
| Fiscal Quarters Ended | ||||||||||||
| June 28, (39 weeks) |
March 29, (26 weeks) |
December 28, (13 weeks) |
||||||||||
| Cash flows from operating activities: |
||||||||||||
| Net (loss) earnings |
$ | (2,799 | ) | $ | 1,078 | $ | 2,789 | |||||
| Less: Net (loss) earnings from discontinued operations |
(4,186 | ) | 514 | 387 | ||||||||
| Less: Loss on pending sale of discontinued operations |
— | — | — | |||||||||
|
|
||||||||||||
| Net earnings (loss) from continuing operations |
1,387 | 564 | 2,402 | |||||||||
| Adjustments to reconcile net (loss) earnings to net cash provided by operating activities: |
||||||||||||
| Depreciation and amortization |
20,526 | 13,220 | 6,586 | |||||||||
| Provision for doubtful accounts |
669 | 512 | 281 | |||||||||
| (Gain) loss on sale of properties and equipment |
(95 | ) | (35 | ) | — | |||||||
| Gain on curtailment of other postretirement benefit plans |
— | — | — | |||||||||
| Loss on early extinguishment of debt |
— | — | — | |||||||||
| Deferred income taxes |
— | — | — | |||||||||
| Pension contributions |
(5,995 | ) | (3,612 | ) | (1,806 | ) | ||||||
| (Increase) decrease in assets: |
||||||||||||
| Accounts receivable |
(19,122 | ) | (5,698 | ) | (5,783 | ) | ||||||
| Inventories |
11,807 | 693 | 16,281 | |||||||||
| Prepaid expenses and other current assets |
(3,827 | ) | 2,110 | 3,040 | ||||||||
| Increase (decrease) in liabilities: |
||||||||||||
| Accounts payable |
8,531 | (20,494 | ) | (24,904 | ) | |||||||
| Accrued liabilities |
4,355 | 2,281 | 2,450 | |||||||||
| Long-term liabilities, other |
(10,673 | ) | (8,239 | ) | (4,823 | ) | ||||||
|
|
||||||||||||
| Net cash provided (utilized) by continuing operating activities |
7,563 | (18,698 | ) | (6,276 | ) | |||||||
| Net cash provided by discontinued operating activities |
5,853 | 9,808 | 1,355 | |||||||||
|
|
||||||||||||
| Net cash provided (utilized) by operating activities |
13,416 | (8,890 | ) | (4,921 | ) | |||||||
|
|
||||||||||||
| Cash flows from investing activities: |
||||||||||||
| Purchases of properties and equipment |
(8,284 | ) | (4,222 | ) | (1,476 | ) | ||||||
| Purchases of securities and other investments |
— | — | — | |||||||||
| Proceeds from maturities or sales of securities and other investments |
— | — | — | |||||||||
| Origination of notes receivable |
(1,138 | ) | (699 | ) | (415 | ) | ||||||
| Collection of notes receivable |
3,842 | 2,743 | 1,171 | |||||||||
| Proceeds from sales of properties and equipment |
95 | 34 | — | |||||||||
| Decrease (increase) in other assets |
377 | (999 | ) | 1,918 | ||||||||
|
|
||||||||||||
| Net cash (utilized) provided by continuing investing activities |
(5,108 | ) | (3,143 | ) | 1,198 | |||||||
| Net cash (utilized) provided by discontinued investing activities |
(8,397 | ) | (7,290 | ) | 2,609 | |||||||
|
|
||||||||||||
| Net cash (utilized) provided by investing activities |
(13,505 | ) | (10,433 | ) | 3,807 | |||||||
|
|
||||||||||||
| Cash flows from financing activities: |
||||||||||||
| Net revolver borrowings (repayments) under secured credit agreements |
16,269 | 31,200 | 10,100 | |||||||||
| Borrowings of notes payable |
— | — | — | |||||||||
| Repayments of notes payable |
(5,444 | ) | (3,618 | ) | (1,804 | ) | ||||||
| Payment of deferred financing fees |
(264 | ) | (122 | ) | (122 | ) | ||||||
| Payment of debt extinguishment costs |
— | — | — | |||||||||
| Increase (decrease) in Members’ deposits and declared patronage dividends |
732 | 886 | 388 | |||||||||
| Increase (decrease) in Members’ and Non-Members’ deposits |
3,329 | 1,147 | 853 | |||||||||
| Decrease (increase) in receivable from sale of Class A Shares to Members, net |
77 | 61 | 32 | |||||||||
| Repurchase of shares from Members |
(8,010 | ) | (6,534 | ) | (403 | ) | ||||||
| Issuance of shares to Members |
197 | — | — | |||||||||
|
|
||||||||||||
| Net cash provided by continuing financing activities |
6,886 | 23,020 | 9,044 | |||||||||
| Net cash provided (utilized) by discontinued financing activities |
— | — | — | |||||||||
|
|
||||||||||||
| Net cash provided by financing activities |
6,886 | 23,020 | 9,044 | |||||||||
|
|
||||||||||||
| Net increase in cash and cash equivalents from continuing operations |
9,341 | 1,179 | 3,966 | |||||||||
| Cash and cash equivalents at beginning of year |
1,563 | 1,563 | 1,563 | |||||||||
|
|
||||||||||||
| Cash and cash equivalents at end of period |
$ | 10,904 | $ | 2,742 | $ | 5,529 | ||||||
|
|
||||||||||||
| Supplemental disclosure of cash flow information: |
||||||||||||
| Interest paid during the period |
$ | 7,892 | $ | 5,225 | $ | 2,808 | ||||||
| Income taxes paid during the period |
$ | 182 | $ | 145 | $ | 100 | ||||||
|
|
||||||||||||
| Supplemental disclosure of non-cash items: |
||||||||||||
| Capital leases |
$ | — | $ | — | $ | — | ||||||
| Write-off of unamortized deferred financing fees due to debt extinguishment |
$ | — | $ | — | $ | — | ||||||
| Conversion of Class B Shares to Class A Shares |
$ | 57 | $ | 57 | $ | — | ||||||
| Assets received, net of liabilities assumed, from conversion of receivables |
$ | 3,920 | $ | 3,920 | $ | — | ||||||
| Shares redeemed for settlement of receivables |
$ | (3,920 | ) | $ | (3,920 | ) | $ | — | ||||
154
Table of Contents
Item 9. CHANGES IN AND DISAGREEMENTS WITH ACCOUNTANTS ON ACCOUNTING AND FINANCIAL DISCLOSURE
None.
Item 9A. CONTROLS AND PROCEDURES
Disclosure controls and procedures. Disclosure controls are controls and procedures designed to reasonably assure that information required to be disclosed in our reports filed under the Securities Exchange Act of 1934, such as this Annual Report, is recorded, processed, summarized and reported within the time periods specified in the Securities and Exchange Commission’s rules and forms. Disclosure controls are also designed to reasonably assure that such information is accumulated and communicated to our management, including the Chief Executive Officer (“CEO”) and Chief Financial Officer (“CFO”), as appropriate, to allow timely decisions regarding required disclosure. Disclosure controls and procedures, no matter how well designed and implemented, can provide only reasonable assurance of achieving an entity’s disclosure objectives. The likelihood of achieving such objectives is affected by limitations inherent in disclosure controls and procedures. These include the fact that human judgment in decision-making can be faulty and that breakdowns in internal control can occur because of human failures such as simple errors, mistakes or intentional circumvention of the established processes.
At the end of the period covered by this report, our management, with the participation of our CEO and CFO, carried out an evaluation of the effectiveness of our disclosure controls and procedures (as defined in Rule 13a-15(e) and 15d-15(e) under the Securities Exchange Act of 1934).
Background of Audit Committee Investigation
As discussed in the Explanatory Note to this Form 10-K, in its Notification of Late Filing on Form 12b-25 dated December 19, 2014 with respect to the Company’s Annual Report on Form 10-K for the year ended September 27, 2014, the Company announced that the Audit Committee was conducting, with the assistance of independent legal counsel, an investigation of issues relating to the setting of case reserves and management of claims by the Company’s former insurance subsidiaries and related matters (the “Audit Committee Investigation”).
In conjunction with the findings of the Audit Committee Investigation, and in consultation with outside actuarial professionals engaged by the Audit Committee and by the Company, management has concluded that errors existed in the insurance reserves reported within the Company’s previously issued financial statements. Management has determined that the quantitative effect and qualitative nature of the errors do not require restatement and re-issuance of previously issued financial statements.
See the Explanatory Note to this Form 10-K for further information on the quantitative effect of these errors, as well as Item 6, “Selected Financial Data,” and Item 7, “Management’s Discussion and Analysis of Financial Condition and Results of Operations.” As disclosed in Note 3, “Assets Held for Sale/Discontinued Operations,” in Part II, Item 8, “Financial Statements and Supplementary Data,” the Company’s Insurance segment was sold in October 2015 and is no longer part of the Company’s continuing operations.
Evaluation of Disclosure Controls and Procedures
As discussed in the Explanatory Note to this Form 10-K, in connection with the Audit Committee Investigation, management has evaluated the design and effectiveness of our disclosure controls and procedures and the effectiveness of the Company’s internal control over financial reporting as of the end of the period covered by this report. As described below, management has identified material weaknesses in our internal control over financial reporting, which is an integral component of our disclosure controls and procedures. As a result of these material weaknesses, we have concluded that our disclosure controls and procedures were not effective as of October 3, 2015.
Management’s annual report on internal control over financial reporting. Our management is responsible for establishing and maintaining adequate internal control over financial reporting (as defined in Rule 13a-15(f) under the Securities Exchange Act of 1934). Our internal control over financial reporting is a process designed by, or
155
Table of Contents
under the supervision of, our CEO and CFO and implemented by the Board, management and other personnel to provide reasonable assurance regarding the reliability of financial reporting and the preparation of financial statements for external purposes in accordance with generally accepted accounting principles in the United States of America.
The Company’s internal control over financial reporting includes those policies and procedures that (i) pertain to the maintenance of records that, in reasonable detail, accurately and fairly reflect the transactions and dispositions of the assets of the Company; (ii) provide reasonable assurance that transactions are recorded as necessary to permit preparation of financial statements in accordance with GAAP, and that receipts and expenditures of the Company are being made only in accordance with authorizations of management and directors of the Company; and (iii) provide reasonable assurance regarding the prevention or timely detection of unauthorized acquisition, use or disposition of the Company’s assets that could have a material effect on the financial statements.
Internal control over financial reporting is designed to provide reasonable assurance to the Company’s management and board of directors regarding the preparation of reliable financial statements for external purposes in accordance with generally accepted accounting principles. Because of the inherent limitations in any internal control, no matter how well designed, misstatements may occur and not be prevented or detected. Accordingly, even effective internal control over financial reporting can provide only reasonable assurance with respect to financial statement preparation. Further, the evaluation of the effectiveness of internal control over financial reporting was made as of a specific date, and continued effectiveness in future periods is subject to the risks that controls may become inadequate because of changes in conditions or that the degree of compliance with the policies and procedures may decline.
Under the supervision and with the participation from management, including our CEO and CFO, we conducted an evaluation of the effectiveness of our internal control over financial reporting based on the framework and criteria established in Internal Control – Integrated Framework issued in 1992 by the Committee of Sponsoring Organizations of the Treadway Commission (“COSO”). In connection with the preparation and filing of this Form 10-K, and in conjunction with the findings of the Audit Committee Investigation described above, the Company’s management has evaluated the effectiveness of our internal control over financial reporting as of October 3, 2015 and concluded that, because of the material weaknesses described below, our internal control over financial reporting was not effective as of October 3, 2015.
Notwithstanding such material weaknesses, which are described herein, our management has concluded that the consolidated financial statements included in this Form 10-K present fairly, in all material respects, our financial position, results of operations and cash flows for the periods presented in conformity with accounting principles generally accepted in the United States of America.
A “material weakness” is a deficiency, or a combination of deficiencies, in internal control over financial reporting, such that there is a reasonable possibility that a material misstatement of our annual or interim financial statements will not be prevented or detected on a timely basis. Based upon such evaluation, management has determined that the Company had material weaknesses in its internal control over financial reporting as of October 3, 2015 related to:
| · | The oversight and monitoring of subsidiary and operating unit compliance with accounting and reporting policies and procedures. We have concluded that the former insurance subsidiaries’ lack of compliance with policies and procedures related to insurance case reserves led to the occurrence of accounting errors as described above. Specifically, while these entities were included in oversight activities similar to our other subsidiaries and operating units, we believe the design of our controls and procedures did not adequately address the additional risks associated with the entities, including the specialized and complex nature of the underlying accounting. In addition to its review of the former insurance subsidiaries, the Company evaluated its controls around its ongoing oversight of other subsidiaries and/or separately managed operating entities and has determined that its deficiencies in oversight controls regarding subsidiaries and separately managed operating entities are considered to be a material weakness requiring remediation. Our subsidiary oversight was insufficiently designed to prevent or timely detect material misstatement of financial information. |
| · | Controls over ensuring accurate and complete financial statement disclosures. The design of our controls over disclosures related to the insurance reserves was not adequate to ensure accurate and complete |
156
Table of Contents
| disclosure related to those financial statement items. In addition, we have concluded that a related party transaction that occurred at our former insurance subsidiaries in fiscal year 2012 was not properly reviewed and approved, and was not properly disclosed. Based upon the above findings, management has concluded that a material weakness exists in its controls over the completeness and accuracy of required disclosures within its financial statements and SEC filings. |
As a result, management has determined that the Company’s disclosure controls and procedures and internal control over financial reporting were not effective as of October 3, 2015.
Plans for Remediation
Our management has worked, and continues to work, to strengthen our disclosure controls and procedures and internal control over financial reporting in connection with the material weaknesses that have been described above. We intend to continue taking measures, including engaging outside professionals, as may be necessary and advisable, to assist us as we continue to address and rectify the foregoing material weaknesses.
We are committed to maintaining an effective control environment and making changes necessary to enhance effectiveness. This commitment has been, and will continue to be, communicated to and reinforced throughout our organization. We are in the process of implementing a plan for remediation of the ineffective internal control over financial reporting described above. In addition, we have designed and plan to implement, and in some cases have already implemented, the specific remediation initiatives described below.
The oversight and monitoring of subsidiary and operating unit compliance with accounting and reporting policies and procedures.
The Company has designed a remediation plan related to oversight of subsidiaries and operating units that imposes a more formalized approach to the oversight of financial results of subsidiaries and operating units, ensuring that management’s authority and accountability is documented through policies and procedures, and that those policies and procedures establish transparency of subsidiary and operating unit transactions. The plan includes the establishment or enhancement of:
| · | Required subsidiary/operating unit reporting timelines to ensure adequate time for management and, if needed, board level review; |
| · | Standard analytical procedures for financial results with explanations required for trends; and |
| · | Documentation of process owners at the corporate and accounting level, and a formalized process for each reporting period by which process owners are able to inquire of subsidiary/operating unit personnel about the financial results and underlying transactions. |
Controls over ensuring accurate and complete financial statement disclosures.
The Company is implementing a disclosure controls and procedures remediation plan that supplements the steps outlined above by requiring the following:
| · | Update and re-issuance of the management disclosure committee charter, as well as assessment of disclosure committee membership; |
| · | Create or enhance a formalized set of policies and procedures related to the periodic disclosure activities, which will include: |
| · | Creation of formal timelines and meeting structures/content; |
| · | Incorporation of assessment and inquiry regarding substantive items within the financial statement in addition to edits and number tie-outs; |
| · | Defined parameters for items to be addressed by the disclosure committee, such as material occurrences; |
| · | Preparation and dissemination of formal minutes for each disclosure committee meeting; and |
157
Table of Contents
| · | Formalized process for reporting out to CEO and CFO of disclosure committee conclusions and recommendations. |
| · | Implement a formal set of policies and procedures over the identification, review, approval and disclosure of related party transactions. |
Overall Control Environment
Based upon the various internal controls deficiencies and resulting material weaknesses discussed above, Management and the Audit Committee determined that incorporating certain broad-based remediation efforts would be necessary to provide the most effective results going forward. The deficiencies constituting the material weaknesses affect key higher level corporate activities such as compliance and risk monitoring. In addition the processes and procedures, and related communications, around capture and assessment of information required for disclosure and identification of potential inaccuracies in financial reporting and related party disclosures were found to have deficiencies. As a result, the Company and the Audit Committee determined that certain improvements to the overall control infrastructure are warranted:
| · | Provide additional resources and structure to enhance the current internal audit function; and |
| · | Assess the Company’s ethics and compliance program and provide additional resources and structure to areas such as the risk assessment process and reporting mechanisms such as the ethics hotline. |
None.
158
Table of Contents
Part III
Item 10. DIRECTORS, EXECUTIVE OFFICERS AND CORPORATE GOVERNANCE
We have adopted a Code of Financial Ethics that applies to our principal executive officer, principal financial officer, principal accounting officer or controller and all employees of the Company performing similar functions. The Code of Financial Ethics has been posted to our Internet website at http://www.unifiedgrocers.com/EN/AboutUs/Documents. The Company intends to satisfy disclosure requirements regarding amendments to, or waivers from, any provisions of its Code of Financial Ethics on its website.
The Articles of Incorporation of the Company provide that the number of directors shall not be less than fifteen nor more than twenty-four, with the exact number to be fixed by the Board. The Board has fixed the number of directors at twenty.
At the Annual Meeting, twenty directors (constituting the entire Board) are to be elected to serve until the next annual meeting and until their successors are elected and qualified, subject to his or her earlier death, resignation, disqualification or removal. Sixteen directors are to be elected by the holders of the Company’s Class A Shares, and four directors are to be elected by the holders of the Company’s Class B Shares.
Pursuant to the Company’s Bylaws, as amended, all of the directors of the Company, except up to six directors elected by the Class A Shares, are required to be Shareholder-Related Directors (as defined above).
| Name | Age as of 4/30/16 |
Year First Elected |
Principal Occupation During Last 5 Years | |||
| NOMINEES FOR ELECTION BY CLASS A SHARES |
||||||
| Bradley Alford(1) |
59 | 2014(5) | Chairman and Chief Executive Officer, Nestlé USA from 2006 to 2013; Member of the Board of Directors of Avery Dennison, and member of its Compensation and Corporate Governance Committees, since 2010. | |||
| Louis A. Amen |
86 | 1974 | Chairman of the Board, Super A Foods, Inc. since 1971. | |||
| John Berberian |
65 | 1991 | President, Berberian Enterprises, Inc. since 1977. | |||
| Vache Fermanian |
47 | 2015(6) | Co-Owner & Vice President, B & V Enterprises Inc. since 1993 | |||
| Richard E. Goodspeed(1) |
79 | 2007 | Principal, Goodspeed & Associates since 1998. | |||
| Paul Kapioski |
58 | 2007 | President, CAP Food Services Co. since 1988. | |||
| Mark Kidd |
65 | 1992(2) | President, Mar-Val Food Stores, Inc. since 1984. | |||
| John D. Lang(1) |
62 | 2003 | President and Chief Executive Officer, Epson America, Inc. since 2002. | |||
| Roger M. Laverty(1) |
68 | 2014(5) | President and Chief Executive Officer, Farmer Bros. from 2007 to 2011; Member of the Board of Directors of Grandpoint Bank, and member of its Audit and Venture Debt Investment Committees, since 2009. | |||
| Jay T. McCormack(7) |
65 | 1993 | President, Rio Ranch Markets since 1986. | |||
| G. Robert McDougall (8) |
58 | 2015(6) | President and Chief Executive Officer, Gelson’s Markets since 2014; President from 2012 to 2014; Executive Vice President of Operations, Perishables and Marketing from 2010 to 2012. | |||
| John Najjar |
59 | 2007 | President, Cardiff Seaside Market, Inc. since 1985. | |||
| Gregory A. Saar |
61 | 2015(6) | President and Chief Executive Officer, Saar’s Inc. since 1988. | |||
159
Table of Contents
| Name | Age as of 4/30/16 |
Year First Elected |
Principal Occupation During Last 5 Years | |||
| Thomas S. Sayles (1) |
65 | 2003 | Senior Vice President, University Relations, University of Southern California (“USC”) since 2011; Vice President, Government and Community Relations, USC, from 2009 to 2011; Senior Vice President, Corporate Communications and Government Affairs, Rentech, Inc. from 2007 to 2009. | |||
| Michael S. Trask |
61 | 2007 | President, Stanlar Foods, Inc. since 1999. | |||
| Kenneth R. Tucker |
68 | 1999 | President, Evergreen Markets, Inc. since 1989. | |||
| Richard L. Wright |
78 | 1999 | Chairman of the Board, Market of Choice since 2008. | |||
| NOMINEES FOR ELECTION BY CLASS B SHARES |
||||||
| Oscar Gonzalez |
46 | 2007 | Co-owner, Northgate Gonzalez Markets, Inc. since 1989. | |||
| Darioush Khaledi |
70 | 1989(3) | Chairman of the Board and Chief Executive Officer, K.V. Mart Co. since 1977. | |||
| Mimi R. Song |
58 | 1998(4) | President and Chief Executive Officer, Super Center Concepts, Inc. since1995. | |||
| (1) | Messrs. Alford, Goodspeed, Lang, Laverty and Sayles are non-Shareholder-Related Directors. |
| (2) | Mr. Kidd was first elected to the Board in 1992 and served until 2003. He was re-elected in 2006 and has served continuously since |
| (3) | Mr. Khaledi was first elected to the Board in 1989 and served until 1991. He was re-elected in 1993 and has served continuously since. |
| (4) | Ms. Song was first elected to the Board in 1998 and served until 2006. She was re-elected in 2010 and has served continuously since. |
| (5) | Messrs. Alford and Laverty were appointed to the Board in 2014 and are standing for election at the next Annual Meeting of the Shareholders of the Company. |
| (6) | Messrs. Fermanian, McDougall and Saar were appointed to the Board in 2015 and are standing for election at the next Annual Meeting of the Shareholders of the Company. |
| (7) | Shares owned by RRM LLC, parent corporation of Rio Ranch Markets. Mr. McCormack disclaims beneficial ownership of these shares. |
| (8) | Shares owned by Arden-Mayfair Inc., parent corporation of Gelson’s Markets. Mr. McDougall disclaims beneficial ownership of these shares. |
None of the directors, nominees for director or executive officers were selected pursuant to any arrangement or understanding, other than with the directors and executive officers of the Company acting within their capacity as such. There are no family relationships among directors or executive officers of the Company and, as of the date hereof, no directorships are held by any director in a company which has a class of securities registered pursuant to Section 12 of the Securities Exchange Act of 1934, as amended (the “Exchange Act”), or subject to the requirements of Section 15(d) of the Exchange Act or any company registered as an investment company under the Investment Company Act of 1940. Officers serve at the discretion of the Board.
160
Table of Contents
The following table sets forth certain information about our executive officers as of the filing date:
| Officer’s Name | Age | Business Experience During Last Five Years | ||||
| Robert M. Ling, Jr. |
59 | President and Chief Executive Officer since May 2013; President and General Counsel September 2012 to May 2013; President, General Counsel and Secretary June 2011 to September 2012; Executive Vice President, General Counsel and Secretary November 1999 to June 2011. | ||||
| Michael F. Henn |
67 | Executive Vice President, Chief Financial Officer since October 2015; Managing Director of R.E. Stangeland Enterprises, a family trust company, from 2003 to October 2015. | ||||
| Richard J. Martin |
70 | Executive Vice President, since October 2015; Executive Vice President, Finance & Administration and Chief Financial Officer since November 1999. | ||||
| Leon G. Bergmann |
48 | Executive Vice President, Sales and Procurement since January 2015; Senior Vice President, Sales December 2012 to December 2014; President, Independent Business division, Supervalu, Inc., a wholesale distributor to independent retail customers, August 2011 to October 2012; Group Vice President, Independent Sales, Marketing and Merchandising, Supervalu, Inc. January 2011 to July 2011; Senior Vice President, Sales and Customer Service, C&S Wholesale Grocers, Inc., a wholesale grocery supply company, July 2008 to January 2011. | ||||
| Susan M. Klug |
56 | Executive Vice President, Marketing and Chief Marketing Officer since January 2015; Senior Vice President, Marketing and Chief Marketing Officer December 2012 to December 2014; President, Southern California division, Albertsons, a food and drug retailer, a division of Supervalu, Inc. October 2007 to April 2012. | ||||
| Daniel J. Murphy |
69 | Executive Vice President, Fresh Programs and Manufacturing since January 2015; Senior Vice President, Fresh Programs and Manufacturing December 2012 to December 2014; Senior Vice President, Retail Support Services and Perishables July 2001 to December 2012. | ||||
| Joseph L. Falvey |
55 | Executive Vice President and President, Market Centre since January 2015; Senior Vice President and President, Market Centre, a division of Unified, May 2012 to December 2014; Senior Vice President, Sales from August 2007 to May 2012. | ||||
| Dick E. Gonzales |
69 | Senior Vice President, Chief Human Resources Officer since April 2016; Principal AG Trivalley, a graphic design and print production company, October 2009 to April 2016. | ||||
| Mark Harding |
56 | Senior Vice President, Operations since May 2016; Independent consultant from July 2014 to May 2016; Senior Vice President, Operations, Farmer Bros. Coffee March 2010 to July 2014. | ||||
| Mary M. Kasper |
55 | Senior Vice President, General Counsel & Secretary since July, 2015; Fresh & Easy, LLC, Senior Vice President, General Counsel & Secretary from September 2014 to May 2015; Fresh & Easy Neighborhood Market Inc., Vice President, General Counsel and Secretary from January, 2007 to September 2014. | ||||
| Christine Neal |
62 | Senior Vice President, Finance and Treasurer since January 2009; Vice President and Treasurer March 2003 to January 2009. | ||||
Section 16(a) Beneficial Ownership Reporting Compliance. Under the securities laws of the United States, our directors, executive officers and any persons holding more than 10 percent of our common stock (collectively “reporting persons”) are required to report their ownership of common stock and any changes in that ownership, to the SEC within two business days of a reportable event. Based on our review of such reports and written representations furnished to us, all such required reports were filed on a timely basis in 2014. Mr. McCormack, a Shareholder-Related Director of the Company, did not timely file Forms 4 related to transactions by an affiliated Member in our Class A, Class B and Class E Shares in 2015. Additionally, the following Shareholder-Related Directors did not timely file Forms 4 required in connection with the Company’s repurchase of Class E Shares owned by their affiliated Members in 2016: Mr. Amen, Mr. Berberian, Mr. Khaledi, Mr. Kidd, Mr. McCormack, Ms. Song, Mr. Tucker, and Mr. Wright.
161
Table of Contents
The Company has adopted a Code of Financial Ethics that applies to its principal executive officer and senior financial officers as required by the rules promulgated by the SEC. The Code of Financial Ethics has been posted to the Company’s Internet website at www.unifiedgrocers.com/EN/AboutUs/Documents. The Company intends to satisfy disclosure requirements by posting amendments to, or waivers from, any provisions of its Code of Financial Ethics on its website. There were no amendments to, or waivers from, its Code of Financial Ethics during fiscal 2013-2015.
The Company has a Compensation Committee that presently consists of nine directors, Thomas S. Sayles (Chairman), Bradley Alford, Louis A. Amen, John Berberian, Darioush Khaledi, John D. Lang, Roger Laverty, Mimi Song, and Richard L. Wright. Richard E. Goodspeed, Chairman of the Board, is an ex officio member of the Compensation Committee. Each of the Compensation Committee members served on the Compensation Committee throughout the year. Messrs. Amen, Berberian, Khaledi and Wright and Ms. Song are shareholders, partners or owners of companies that own the Company’s stock and are identified by the Company as related parties, see Item 13 “CERTAIN RELATIONSHIPS AND RELATED TRANSACTIONS, AND DIRECTOR INDEPENDENCE” for a discussion of the relationship. The Board has determined that each member of the Committee is “independent” as that term is defined under the rules of the NYSE with the exception of those Shareholder-Related Directors discussed above under “Independence.” The Compensation Committee meets as often as necessary to perform its duties and responsibilities. The Committee held five (5) meetings during fiscal 2015 that at times included executive sessions without management.
Role of the Compensation Committee
The Compensation Committee’s purpose is to:
| · | determine the Company’s performance goals and personal objectives relevant to the compensation of each corporate officer; |
| · | evaluate the performance of each corporate officer in light of those goals and objectives; |
| · | determine the compensation of each corporate officer based on this evaluation; |
| · | make recommendations to the Board with respect to incentive compensation plans; |
| · | make recommendations to the Board with respect to compensation and performance goals for the Chief Executive Officer; |
| · | make recommendations to the Board with respect to compensation of the directors; and |
| · | monitor and review the Company’s qualified and non-qualified benefit plans and make recommendations to the Board with respect to such plans. |
The Company has an Audit Committee (“Audit Committee”) that presently consists of John D. Lang, Committee Chairman, Bradley Alford, Oscar Gonzalez, Paul Kapioski, Roger M. Laverty, Jay T. McCormack, Kenneth R. Tucker, and Richard L. Wright. Richard E. Goodspeed, Chairman of the Board, is an ex officio member of the Audit Committee. Messrs. Lang, Wright and Goodspeed are considered by the Board to be “audit committee financial experts” as defined by the rules promulgated by the Securities and Exchange Commission (the “SEC”). The Audit Committee, which met eleven (11) times during fiscal 2015, is primarily responsible for (i) overseeing the integrity of the financial statements and financial disclosures, (ii) overseeing the qualification and independence of the independent registered public accounting firm and the internal audit function, (iii) overseeing the performance of the independent registered public accounting firm and the internal audit function, (iv) providing an avenue of communication among the independent registered public accounting firm, management, the internal audit function, and the Board, and (v) overseeing the system of disclosure controls and the system of internal controls regarding finance, accounting, legal compliance, and ethics that management and the Board have established. The Audit Committee performs its duties in accordance with the Charter for the Audit Committee as adopted by the Board.
162
Table of Contents
Item 11. EXECUTIVE COMPENSATION
Compensation Discussion and Analysis
Introduction
This Compensation Discussion and Analysis (“CD&A”) explains the Company’s compensation objectives and philosophy, as well as how and why compensation decisions were made in fiscal 2015 for each person who served as the Company’s principal executive officer and principal financial officer during 2015 and the Company’s three other most highly compensated executive officers during fiscal 2015 (collectively, the “NEOs” or “named executive officer” or “Named Executive Officers”). This CD&A also provides perspective on the executive compensation information contained in the tables that appear below under the caption “Executive Compensation.” The Company holds its executive officers responsible for its performance and for a strong culture of ethical behavior.
For fiscal 2015, our NEOs were:
| · | Robert M. Ling, Jr., President and Chief Executive Officer (principal executive officer) |
| · | Richard J. Martin, Executive Vice President (principal financial officer for fiscal 2015) |
| · | Michael F. Henn, Executive Vice President and Chief Financial Officer for fiscal 2016 (principal financial officer for fiscal 2016) |
| · | Leon G. Bergmann, Executive Vice President, Sales and Procurement |
| · | Susan M. Klug, Executive Vice President, Chief Marketing Officer |
| · | Daniel J. Murphy, Executive Vice President, Fresh Programs and Manufacturing |
Fiscal 2014 and 2015 Compensation Highlights
For fiscal 2015, upon the recommendation of the Board’s Compensation Committee (the “Compensation Committee”), the Company determined that no bonuses would be paid to senior management because certain of the financial targets established by the Board for the year were not achieved. The Compensation Committee also determined that the base salary for the Company’s senior management will increase in fiscal 2016 as compared to fiscal 2015, except that the base salary for the Company’s Chief Executive Officer will remain at the same amount as fiscal 2015. The annual executive bonus plan criteria structure remains unchanged from fiscal 2015 to fiscal 2016 except for the changes to target percentage of salary and amendments to the Unified Grocers, Inc. Long Term Incentive Plan (“LTIP”) for fiscal 2016 as discussed below.
During fiscal 2016, Mr. Richard J. Martin, Chief Financial Officer, retired from the position of Chief Financial Officer of the Company effective October 27, 2015; he continued as an officer of the Company until May 2, 2016. The Board appointed Mr. Michael F. Henn as Executive Vice President and Chief Financial Officer effective on October 27, 2015. Mr. Henn did not receive any compensation from the Company during fiscal 2015.
Effective December 28, 2015, the Company amended the LTIP to further motivate and reward executives for their contributions to our long-term financial success and growth. This long-term plan, in conjunction with the short-term focus of the annual bonus plan, is designed to link long-term value creation for our member shareholders with our short-term annual performance. See the description of the LTIP below under “Long-Term or Equity Incentives.”
Compensation Committee Process
Annual Evaluation
The Compensation Committee meets near the beginning of each fiscal year to:
| (i) | evaluate the performance of all corporate officers, including the named executive officers, |
| (ii) | determine their annual bonuses for the prior fiscal year, |
| (iii) | establish their base salaries for the current fiscal year, and |
163
Table of Contents
| (iv) | with input from the Chief Executive Officer as described below, establish the Company’s performance goals and each officer’s personal objectives for the current fiscal year. |
The evaluation process includes the Compensation Committee’s consideration of each officer based on numerous criteria, including their relative importance to the Company and the relative difficulty of the officer’s assigned responsibilities and objectives, the achievement of those responsibilities and objectives, the officer’s experience, the relative value of the officer’s contribution to the success of the Company, and the overall financial results of the Company for the most recent fiscal year. The Company tracks the performance of individual initiatives throughout the year, and the results are part of the evaluation process. In addition, the Company’s performance goals are incorporated into the Company’s annual budget that is approved by the Board. Typically, the President and Chief Executive Officer of the Company are present during the evaluation process except when the Compensation Committee discusses the performance of such individual. The determinations of the Compensation Committee with respect to the compensation of the Chief Executive Officer are subject to the approval of the Board.
Say-on-Pay Vote
At the Company’s 2014 annual meeting, approximately 73% of the votes cast supported the Company’s say-on-pay resolution. The Compensation Committee considered the results of the advisory vote and input from members of the Board, who represent some of the Company’s largest shareholders, who expressed no significant concerns about the Company’s compensation practices. While the Compensation Committee did not change its fiscal 2015 or 2016 compensation programs as a result of the 2014 say-on-pay vote, its shareholder engagement had been one of the factors driving its adoption of the long-term incentive plan in fiscal 2013 to better link long-term compensation to the long-term financial performance of the Company.
Management’s Role in Determining Executive Compensation
At the request of the Compensation Committee, the President and Chief Executive Officer provides the Compensation Committee with an evaluation of each officer’s performance for the prior year and a recommendation for such officer’s personal objectives, target bonus and salary for the current fiscal year, except for matters related to the President and Chief Executive’s own evaluation and compensation.
Compensation Consultant and Periodic Competitive Assessments of Total Compensation
In performing its compensation evaluations, from time to time the Compensation Committee engages the services of an independent compensation consultant to review and provide recommendations with respect to the compensation of executive officers in order to assist the Compensation Committee in its assessment of the competitiveness of the Company’s compensation arrangements. In 2008, Pearl Meyer & Partners, LLC (“Pearl Meyer”) was selected by the Compensation Committee as its compensation consultant after a process that considered several qualified firms. At the Compensation Committee’s request, Pearl Meyer conducted a comprehensive review of executive compensation levels and structure in fiscal years 2011 and 2015 (the “2011 Compensation Survey” and the “2015 Compensation Survey”). Pearl Meyer is engaged directly by, and reports directly to, the Compensation Committee. Other than its role as consultant to the Compensation Committee, Pearl Meyer performs no other work for the Company.
In accordance with its charter, the Compensation Committee analyzed whether the work of Pearl Meyer as a compensation consultant has raised any conflict of interest, taking into consideration the following factors: (i) the provision of other services to the Company by Pearl Meyer; (ii) the amount of fees from the Company paid to Pearl Meyer as a percentage of the firm’s total revenue; (iii) Pearl Meyer’s policies and procedures that are designed to prevent conflicts of interest; (iv) any business or personal relationship of Pearl Meyer or the individual compensation advisors employed by the firm with an executive officer of the Company; (v) any business or personal relationship of the individual compensation advisors with any member of the Compensation Committee; and (vi) any stock of the Company owned by Pearl Meyer or the individual compensation advisors employed by the firm. The Committee has determined, based on its analysis of the above factors, that the work of Pearl Meyer and the individual compensation advisors employed by Pearl Meyer as compensation consultants to the Company has not created any conflict of interest.
164
Table of Contents
As part of its reviews, Pearl Meyer conducted interviews with the Compensation Committee members and selected executives to gather information and perspectives regarding the Company and its compensation and benefit programs. While Pearl Meyer interacted with management during the course of the reviews to gather information, data and perspectives, its study results and recommendations were developed and reported by Pearl Meyer directly to the Compensation Committee. Pearl Meyer attended Compensation Committee meetings to present results, answer questions and advise the Committee with respect to its reviews.
During fiscal 2012, the Compensation Committee consulted with Pearl Meyer regarding developments and best practices in executive compensation matters. Such consultations were educational in nature. In addition, during fiscal 2011, Pearl Meyer was engaged to examine the Company’s officer retirement programs and incentive plans. The engagement continued into fiscal 2012, with the result of that engagement being the adoption by the Company of the long-term incentive program described below for application in fiscal 2013 and subsequent years.
The Compensation Committee referred to the 2011 Compensation Survey when the Compensation Committee reviewed and approved executive compensation for fiscal 2012 through 2015. The Compensation Committee referred to the 2015 Compensation Survey when the Compensation Committee reviewed and approved executive compensation for fiscal 2016. The Compensation Committee’s reason for not revising the compensation survey every year is that the Compensation Committee believes that the executive compensation benchmarks or the comparable companies (the “Peer Group”) are not likely to have significant changes every year.
Due to the lack of public information concerning wholesale grocery cooperatives comparable in size to the Company, when conducting the 2011 Compensation Survey Pearl Meyer established a Peer Group of 19 companies (see list below) in the distribution, wholesale and retail grocery industries with annual revenues between $2.3 billion and $9.0 billion for determining the competitiveness of executive compensation. Peer Group information was supplemented with information from published and private compensation surveys and other data developed by Pearl Meyer. In selecting the industries represented in the Peer Group, Pearl Meyer considered the fact that the Company often recruits its executives from these industries. The Peer Group for the 2011 Compensation Survey was as follows:
| 2011 Compensation Survey - Peer Companies |
||||||
| The Andersons, Inc. |
Nash Finch Company |
|||||
| Associated Wholesale Grocers |
The Pantry, Inc. |
|||||
| BJ’s Wholesale Club, Inc. |
Ruddick Corp. |
|||||
| Casey’s General Stores, Inc. |
Spartan Stores, Inc. |
|||||
| Chiquita Brands International, Inc. |
Stater Bros. Holdings Inc. |
|||||
| Core-Mark Holding Co. Inc. |
United Natural Foods, Inc. |
|||||
| Del Monte Foods Company |
Wakefern Foods |
|||||
| Dole Food Company, Inc. |
Weis Markets, Inc. |
|||||
| Flowers Foods Inc. |
Whole Foods Market, Inc. |
|||||
| Ingles Markets, Inc. |
||||||
Pearl Meyer determined from the results of the 2011 Compensation Survey that, at the time, the Company’s total direct compensation (as defined below) for the executive positions surveyed was at or below the 25th percentile of the market levels (comprised of data from the Peer Group and general survey data) on both an actual and target basis. The 2011 Compensation Survey found total remuneration was between the 25th and 50th percentile after including other compensation and change in pension values (as defined below). The 2011 Compensation Survey also found the following with respect to the individual elements of total compensation: base salaries (50th percentile); total cash compensation (“TCC”), defined as salaries plus actual bonuses (50th percentile); total direct compensation (“TDC”), defined as base salary plus bonus plus long term incentive (25th percentile); and benefits plus perquisites (above the 75th percentile). In conducting the 2011 Compensation Survey, Pearl Meyer noted that certain officers bear responsibilities in addition to those borne by officers in the Peer Group with similar titles. In conducting the 2011 Compensation Survey, Pearl Meyer noted that the absence of a long-term or equity incentive plan for the officers resulted in the below market TDC, and that the Executive Salary Protection Plan, as amended (“ESPP”), served only as a partial substitute for a long-term incentive plan, which resulted in the findings with respect to benefits and total remuneration. As part of the 2011 Compensation Survey, Pearl Meyer conducted an
165
Table of Contents
extensive re-examination of the extent to which total direct compensation is below the targeted 50th percentile due to the lack of a long-term or equity incentive plan and presented to the Compensation Committee options for a potential long-term incentive plan. The Compensation Committee extended its engagement of Pearl Meyer for the purpose of further analyzing the elements of the Company’s compensation practices, including continuing work with respect to developing a long-term incentive plan. In December 2012, the Compensation Committee adopted the LTIP described below for executive officers for utilization in fiscal 2013 and subsequent years.
When conducting the 2015 Compensation Survey, Pearl Meyer established a Peer Group of 14 companies in the distribution, wholesale and retail grocery industries with annual revenues between $2 billion and $18 billion for determining the competitiveness of executive compensation. Consistent with the 2011 Compensation Survey, Peer Group information was supplemented with information from published and private compensation surveys and other data developed by Pearl Meyer. In selecting the industries represented in the Peer Group, Pearl Meyer considered the fact that the Company often recruits its executives from these industries. The Peer Group for the 2015 Compensation Survey was as follows:
| 2015 Compensation Survey - Peer Companies |
||||||
| The Andersons, Inc. |
SpartanNash Company |
|||||
| Casey’s General Stores, Inc. |
Sprouts Farmers Market, Inc. |
|||||
| Core-Mark Holding Co. Inc. |
SUPERVALU Inc. |
|||||
| Flowers Foods Inc. |
United Natural Foods, Inc. |
|||||
| Ingles Markets, Inc. |
Weis Markets, Inc. |
|||||
| Pinnacle Foods, Inc. |
The WhiteWave Foods Company |
|||||
| Smart & Final Stores, Inc. |
Whole Foods Market, Inc. |
|||||
The 2015 Compensation Survey found total direct compensation (as defined below) for the executive positions surveyed was between the 25th and 50th percentile market levels. The 2015 Compensation Survey also found the following with respect to the individual elements of total compensation: base salaries (37th percentile); total cash compensation (“TCC”), defined as salaries plus actual bonuses (33rd percentile); total direct compensation (“TDC”), defined as base salary plus bonus plus long term incentives (28th percentile).
In making compensation decisions for all executive officers, including the named executive officers, the Compensation Committee considered the findings and recommendations of the Pearl Meyer (i) 2011 Compensation Survey for fiscal 2013, 2014, 2015 and (ii) 2015 Compensation Survey for fiscal 2016.
Compensation Philosophy
The Compensation Committee’s compensation philosophy is that compensation of executive officers should encourage creation of shareholder value and the achievement of strategic corporate objectives by attracting, retaining and motivating executives critical to the Company’s long-term growth and profitability. In support of this philosophy, the Compensation Committee believes that:
| · | the total compensation of each executive should be competitive with the total compensation paid to executives with comparable duties by other companies in the Company’s peer groups, taking into account relative company size, performance and geographic location as well as individual responsibilities and performance; |
| · | generally, total compensation for executive officers should be targeted to the 50th percentile of the total compensation paid to officers with comparable duties by companies in an appropriate peer group; |
| · | the bonus program should motivate each executive to achieve specific Company performance goals and personal objectives established by the Committee, without encouraging undue or unreasonable risk-taking by employees; and |
| · | the bonuses and long-term compensation program should serve to align the executive’s interests with those of the Company’s shareholders. |
166
Table of Contents
Following its consideration of the executive compensation review discussed above, the Compensation Committee affirmed this compensation philosophy.
Elements of Executive Compensation
Our executive compensation philosophy is to provide a complementary set of compensation programs to our NEOs with attractive, flexible and market-based total compensation tied to annual and long-term relative performance and aligned with the interests of our shareholders/members. The key elements of our executive compensation programs for our NEOs are summarized below.
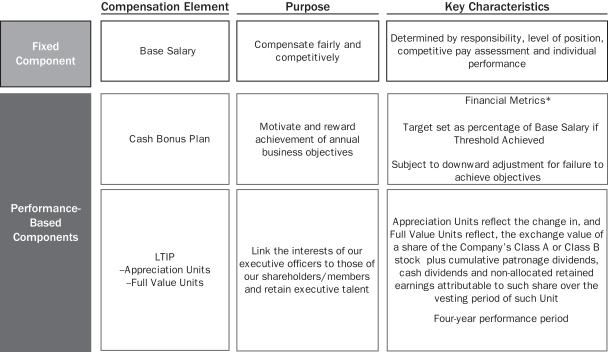
| * | These financial metrics are non-GAAP financial measures. For more information, see “Cash Bonus Plan” below. |
167
Table of Contents
Base Salaries
The chart below shows the breakdown between fixed pay through the NEO’s base salaries and variable performance-based pay and other compensation for fiscal 2013, 2014 and 2015:
| Name | Title | Year | Base Salary (%) |
Non-Equity Incentive Plan (%) |
All Other Compensation (%) |
|||||||||||||
| Robert M. Ling, Jr. | President and Chief Executive Officer | 2015 | 69 | 0 | 31 | |||||||||||||
| 2014 | 37 | 36 | 27 | |||||||||||||||
| 2013 | 66 | 0 | 34 | |||||||||||||||
| Richard J. Martin | Executive Vice President(1) | 2015 | 69 | 0 | 31 | |||||||||||||
| 2014 | 50 | 25 | 25 | |||||||||||||||
| 2013 | 71 | 0 | 29 | |||||||||||||||
| Michael F. Henn(2) | Executive Vice President, Chief Financial Officer(2) | 2015 | — | — | — | |||||||||||||
| Leon G. Bergmann | Executive Vice President, Sales and Procurement | 2015 | 72 | 0 | 28 | |||||||||||||
| 2014 | 51 | 25 | 24 | |||||||||||||||
| 2013 | 78 | 0 | 22 | |||||||||||||||
| Susan M. Klug | Executive Vice President, Chief marketing Officer | 2015 | 71 | 0 | 29 | |||||||||||||
| 2014 | 61 | 18 | 21 | |||||||||||||||
| 2013 | 76 | 0 | 24 | |||||||||||||||
| Daniel J. Murphy | Executive Vice President, Fresh Programs and Manufacturing | 2015 | 70 | 0 | 30 | |||||||||||||
| 2014 | 50 | 24 | 26 | |||||||||||||||
| 2013 | 73 | 0 | 27 | |||||||||||||||
| (1) | Mr. Martin retired from the position of Chief Financial Officer of the Company effective October 27, 2015. He continued as an officer of the Company until May 2, 2016. |
| (2) | Mr. Henn was appointed Chief Financial Officer effective October 27, 2015. Mr. Henn began employment after the end of fiscal 2015 and, therefore is not eligible for the 2015 Cash Incentive Plan. |
Incentive Compensation
In recognition of the correlation between the Company’s performance and the enhancement of shareholder value, the Company’s officers may earn annual cash bonuses. The Company has established a plan (the “Cash Bonus Plan”) for senior management under which each of the Company’s officers is eligible to earn an annual cash bonus. For fiscal 2013, the Company adopted a supplemental executive bonus plan which was subsequently terminated for fiscal 2014 and future years. In 2013, the Company also adopted the LTIP for executive officers to provide long-term incentive compensation and amended the LTIP in fiscal year 2016 related to awards issued for fiscal 2015 and future years.
Cash Bonus Plan
Under the Cash Bonus Plan at the beginning of each fiscal year a target bonus and a maximum bonus, each expressed as a percentage of the officer’s annual base salary are established for each officer, as well as a minimum performance threshold. The target bonus, maximum bonus and performance threshold are established by the Compensation Committee for each executive officer other than the President and Chief Executive Officer and by the Board upon the recommendation of the Compensation Committee for the President and Chief Executive Officer. For fiscal 2013 to 2015, the bonus target as a percentage of annual base salary was set at 100% for the President and Chief Executive Officer, 50% for the President and Executive Vice Presidents and 30% for Senior Vice
168
Table of Contents
Presidents. If the performance of the Company does not reach the minimum performance threshold, no bonus is earned. If the Company exceeds or falls short of the target performance threshold, the bonus percentage will be adjusted accordingly. Additionally, the Compensation Committee may adjust any bonus payable under the Cash Bonus Plan in its sole discretion.
For fiscal 2013 through 2015, the minimum performance threshold consisted of one component: the pre-bonus Earnings Before Interest, Taxes, Depreciation, Amortization and Patronage Dividends (“EBITDAP”). EBITDAP must be at least 80% of the budget approved by the Board. If that minimum performance threshold was met, the performance level of each officer was then dependent upon the achievement of certain Company performance goals based on the annual budget approved by the Board. The achievement of the Company performance goals were weighted 40% based on pre-bonus EBITDAP, 40% based on sales and 20% based on expense ratio. The expense ratio is defined as distribution, selling and administrative expenses (less bonus expense) divided by gross sales. Generally, the Compensation Committee sets the target level such that the relative difficulty of achieving the target level is consistent from year to year. For fiscal 2013 and 2015, the minimum threshold for the EBITDAP was not met; therefore, no bonuses were awarded for fiscal 2013 and 2015. The minimum threshold was attained for fiscal 2014 and cash bonuses were awarded for senior management totaling approximately $1,992,725.
In evaluating the Chief Executive Officer, the Compensation Committee considers evaluations of the Chief Executive Officer by each member of the Board. For fiscal 2013, 2014 and 2015, the Company performance goals used for determining the annual bonus of the Chief Executive Officer were the same as the Company performance goals used for determining the annual bonuses of the other named executive officers under the Cash Bonus Plan. For these years, the Chief Executive Officer’s personal objectives included the Chief Executive Officer’s effectiveness in planning and implementing the strategy of the Company, the Chief Executive Officer’s business management skills including setting clear goals and objectives and setting a good example for ethics and compliance issues, the Chief Executive Officer’s talent management including mentoring senior executives, building team spirit and motivating the employees, and the Chief Executive Officer’s personal effectiveness, including the Chief Executive Officer’s relationship with the Board and the Board committees and his communication skills.
The minimum performance threshold for fiscal 2016 will be the same as for fiscal 2015. However, for fiscal 2016, the bonus target as a percentage of base salary is set at 100% for the President and Chief Executive Officer, 55% for the President and Executive Vice Presidents and 40% for Senior Vice Presidents.
The tables below contain information relating to the targets and actual results of each performance goal and bonus awarded under the Cash Bonus Plan to the named executive officers in fiscal 2015.
| Performance Goal | Minimum Threshold | Actual | ||||||
| Pre-bonus EBITDAP, as a percentage of budget |
80.0% | 58.9% | ||||||
|
|
||||||||
| Approved Budget | Actual | Bonus Weight Percentage |
Bonus Percentage |
|||||||||||||
| Company goals (amounts in thousands, except for percentages) | ||||||||||||||||
| Pre-bonus EBITDAP |
$ | 62,726 | $ | 36,944 | 40.0 | 0.0 | ||||||||||
| Gross Billings |
$ | 4,061,831 | $ | 4,144,641 | 40.0 | 48.2 | ||||||||||
| Expense ratio |
7.32% | 6.69% | 20.0 | 30.0 | ||||||||||||
|
|
||||||||||||||||
| Total Company goals |
78.2 | |||||||||||||||
| Individual goals |
0 | |||||||||||||||
|
|
||||||||||||||||
| Cash Bonus Plan rate |
78.2 | |||||||||||||||
|
|
||||||||||||||||
169
Table of Contents
The bonus awarded for fiscal 2015 to each of the named executive officers is set forth in the Summary Compensation Table below.
| Name | 2015 Base Salary |
Bonus Target Percentage of Base Salary |
Total Bonus Percentage of Target Achieved for Fiscal 2015 |
Bonus awarded for Fiscal 2015 |
||||||||||||
| Robert M. Ling, Jr. |
$ | 850,000 | 100 | % | 0.0 | % | $ | 0 | ||||||||
| Richard J. Martin(1) |
450,000 | 50 | 0.0 | 0 | ||||||||||||
| Michael F. Henn(2) |
— | 50 | 0.0 | 0 | ||||||||||||
| Leon G. Bergmann |
425,000 | 50 | 0.0 | 0 | ||||||||||||
| Susan M. Klug |
375,000 | 50 | 0.0 | 0 | ||||||||||||
| Daniel J. Murphy |
390,000 | 50 | 0.0 | 0 | ||||||||||||
|
|
||||||||||||||||
| (1) | Mr. Martin retired from the position of Chief Financial Officer of the Company effective October 27, 2015; he continued as an officer of the Company until May 2, 2016. |
| (2) | Mr. Henn began employment after the end of fiscal 2015 and therefore was not eligible for a bonus for fiscal 2015 under the Cash Bonus Plan. |
The Company did not achieve performance in excess of the target level for two of the three prior fiscal years. The average approximate payout of bonuses as a percentage of annual base salaries for the named executive officers over the past three fiscal years has been 15%.
Incentive Compensation Recoupment Policy
In fiscal 2008, the Company adopted an Incentive Compensation Recoupment Policy. Under this policy, the Board will, to the extent permitted by applicable law, in all appropriate cases, require reimbursement of any bonus or incentive compensation paid to an employee after January 1, 2009 if and to the extent that: (a) the amount of incentive compensation was calculated based upon the achievement of certain financial results that subsequently are reduced due to a restatement; (b) the Board or an appropriate committee determines that the employee engaged in any fraud or willful misconduct that caused or contributed to the need for the restatement; and (c) the amount of the bonus or incentive compensation that would have been awarded to the employee had the financial results been properly reported would have been lower than the amount actually awarded; provided that the Company will not seek to recover bonuses or incentive compensation paid more than three years prior to the date the applicable restatement is disclosed. The Compensation Committee re-affirmed this policy for fiscal 2016.
Long-Term or Equity Incentives (“LTIP”)
Prior to fiscal 2013, the Company had not provided long-term or equity incentive awards. For fiscal 2013, the Company adopted the LTIP for senior management to align officers’ interests with those of shareholders by linking compensation to the long-term financial success of and value creation at the Company, provide a balance to the short-term focus of the annual cash bonuses and help the Company attract and retain executive talent by making the Company’s total compensation offerings to officers more competitive. Under the LTIP, each year, eligible officers will receive appreciation units. The LTIP was amended on December 28, 2015, to expand the awards that may be granted under the LTIP to include full-value Units. Full-value units and appreciation units are collectively referred to as “Units.” The President and Chief Executive Officer, and Executive and Senior Vice Presidents are eligible to receive Units. Vice Presidents of the Company may be awarded Units at the discretion of the Compensation Committee.
Under the LTIP, each Appreciation Unit has a value equal to the increase, or appreciation, in the Company’s exchange value per share for a share of the Class A or Class B stock of the Company, plus cumulative cooperative patronage dividends, cash dividends and non-allocated retained earnings attributable to such share over the vesting period of the Appreciation Units. The Appreciation Units will vest in equal monthly installments over a period of four fiscal years (the “Performance Cycle”) and be paid out at the end of the Performance Cycle. For example, the Appreciation Units awarded for fiscal 2013 will vest over the Performance Cycle starting on September 30, 2012 and ending on October 1, 2016 and be paid out shortly thereafter, subject to the review and approval of the Compensation Committee and deferral elections of participants.
170
Table of Contents
Under the LTIP, each Full-Value Unit entitles the award recipient to receive the “maturity value” of the Full-Value Units at the end of the Performance Cycle assigned to the Full-Value Units. The “maturity” value for a Full-Value Unit is the Company’s exchange value per share for a share of the Class A or Class B stock of the Company, plus cumulative cooperative division patronage dividends, cash dividends and non-allocated retained earnings attributable to such share exchange value per share, as calculated from the Company’s financial statements for the fiscal year end that coincides with the end of their Performance Cycle assigned to the Full-Value Units. The vesting and payment policy for Full-Value Units is the same as for Appreciation Units.
The Compensation Committee determines the number of Units to be awarded by starting with a targeted compensation gap that the awards are designed to fill for each officer. The Units are targeted to have a value equal to the targeted compensation gap when they are paid out to the officer after the end of the Performance Cycle. To calculate the number of Units to be awarded at the start of the Performance Cycle such that the value of those Units will fill the targeted compensation gap, the Compensation Committee uses an assumed compound annual growth rate (“CAGR”) of the Units over the Performance Cycle. If the actual CAGR of the Units over the Performance Cycle ends up being higher than the assumed CAGR used by the Compensation Committee in making the award, which may happen if, for example, the Company’s exchange value per share, dividends and non-allocated retained earnings exceed expectation, then the actual value of the Units at the end of the Performance Cycle may exceed the targeted compensation gap. If, on the other hand, the actual CAGR of the Units over the Performance Cycle ends up being lower than the assumed CAGR used by the Compensation Committee in making the award, which may happen if, for example, the Company’s exchange value per share, dividends and non-allocated retained earnings fall short of expectation, then the actual value of the Units at the end of the Performance Cycle may not meet the targeted compensation gap.
The assumed CAGR recommended by Pearl Meyers in the design of the LTIP for fiscal 2013 and used by the Compensation Committee in determining the number of Units to be awarded for fiscal 2013, 2014, and 2015 to fill the targeted compensation gap was 5.7%. For fiscal 2016, the assumed CAGR used by the Compensation Committee in determining the number of Units to be awarded for fiscal 2016 to fill the targeted compensation gap was 4.2%. For reference, as of the end of fiscal 2012 and 2013, the historical 4-year CAGRs were 5.5% and .06%, respectively, and the historical 8-year CAGRs were 10.9% and 7.6%, respectively. The Compensation Committee may use a different CAGR for determining awards in future years.
The following table sets forth the following for each of fiscal 2013, 2014, 2015 and 2016 and for each of the named executive officers and all executive officers as a group:
| · | The targeted compensation gap the LTIP award was designed to fill at the time the award was made; |
| · | The number and type of Units awarded; and |
| · | Three hypothetical potential values of the Units calculated using three assumed potential CAGRs for the remainder of the Performance Cycle. For the fiscal 2013 awards, for which the Performance Cycle ends at the end of fiscal 2017, the actual performance of the Units in fiscal 2013 is used for the three years of the Performance Cycle and the assumed potential CAGRs are used for the remaining year of the Performance Cycle. For the fiscal 2014 awards, for which the Performance Cycle ends at the end of fiscal 2018, the actual performance is used for the two years of the Performance Cycle and the assumed potential CAGRs are used for the remaining two years of the Performance Cycle. For the fiscal 2015 awards, for which the Performance Cycle ends at the end of fiscal 2019, the actual performance is used for the first year of the Performance Cycle and the assumed potential CAGRs are used for the remaining |
171
Table of Contents
| three years of the Performance Cycle. For the 2016 awards, for which the Performance Cycle ends at the end of fiscal 2020, the assumed potential CAGRs are used for all four years of the Performance Cycle. |
| Targeted Compensation Gap When Units were Awarded($) |
Potential Value of Units at End of Four- Year Performance-Cycle |
|||||||||||||||||||||||||||
| Name | Title | Award Year |
Appreciation Units Awarded |
Full Value Units Awarded |
2.5 % CAGR ($)(2) |
5.0 % CAGR ($)(2) |
7.5 % CAGR($)(2) |
|||||||||||||||||||||
| Robert M. Ling, Jr |
President & Chief Executive Officer | 2016 2015 2014 2013 |
|
1,467,000 1,200,000 1,110,000 1,200,000 |
|
|
31,450 25,000 16,000 15,200 |
|
|
1,875 — — — |
|
|
1,042,054 694,742 464,000 0 |
|
|
1,769,145 1,442,222 963,744 113,182 |
|
|
2,389,453 2,245,043 1,500,218 472,902 |
| ||||||||
|
|
||||||||||||||||||||||||||||
| Richard J. Martin |
Executive Vice President, (1) | 2016 2015 2014 2013 |
|
— 300,000 278,000 300,000 |
|
|
— 6,300 4,000 3,800 |
|
|
— — — — |
|
|
— 175,075 116,063 0 |
|
|
— 363,440 240,936 28,296 |
|
|
— 565,751 375,054 118,226 |
| ||||||||
|
|
||||||||||||||||||||||||||||
| Michael F. Henn |
Executive Vice President, Chief Financial Officer (2) | 2016 | — | — | — | — | — | |||||||||||||||||||||
|
|
||||||||||||||||||||||||||||
| Leon Bergmann |
Executive Vice President, Sales and Procurement | 2016 2015 2014 2013 |
|
333,333 300,000 278,000 150,000 |
|
|
7,150 6,300 4,000 1,900 |
|
|
425 — — — |
|
|
236,631 175,075 116,063 0 |
|
|
401,904 363,440 240,936 14,148 |
|
|
542,905 565,751 375,054 59,113 |
| ||||||||
|
|
||||||||||||||||||||||||||||
| Susan M. Klug |
Executive Vice President, Chief Marketing Officer | 2016 2015 2014 2013 |
|
333,333 300,000 278,000 150,000 |
|
|
7,150 6,300 2,000 1,900 |
|
|
425 — — — |
|
|
236,631 175,075 58,032 0 |
|
|
401,904 363,440 120,468 14,148 |
|
|
542,905 565,751 187,527 59,113 |
| ||||||||
|
|
||||||||||||||||||||||||||||
| Daniel J. Murphy |
Executive Vice President, Fresh Programs and Manufacturing | 2016 2015 2014 2013 |
|
333,333 300,000 278,000 150,000 |
|
|
7,150 6,300 4,000 1,900 |
|
|
425 — — — |
|
|
236,631 175,075 116,063 0 |
|
|
401,904 363,440 240,936 14,148 |
|
|
542,905 565,751 375,054 59,113 |
| ||||||||
|
|
||||||||||||||||||||||||||||
| All executive officers as a group(3) |
2016 2015 2014 2013 |
|
1,561,379 3,825,000 2,358,000 2,475,000 |
|
|
32,195 80,125 34,000 28,500 |
|
|
1,895 — — — |
|
|
1,061,474 2,226,648 1,218,660 0 |
|
|
1,805,256 4,622,321 2,529,828 240,512 |
|
|
2,439,804 7,195,364 3,938,072 1,004,917 |
| |||||||||
|
|
||||||||||||||||||||||||||||
| (1) | Mr. Martin retired from the position of Chief Financial Officer of the Company effective October 27, 2015; he continued as an officer of the Company until May 2, 2016, however, he was not awarded Units for the 2016 Performance Cycle. |
| (2) | Mr. Henn began employment after the end of fiscal 2015 and has waived participation in the LTIP. |
| (3) | Includes only current executive officers. |
The LTIP provides that in the event of an officer’s termination, (i) if such termination is voluntary by an officer with less than four years of service as an officer of the Company or is by the Company for cause, all outstanding Units for active Performance Cycles (i.e., Performance Cycles that have not ended) will be forfeited, and (ii) if such termination is voluntary by an officer with more than four years of service as an officer of the Company, is for death or disability of an officer or is by the Company without cause, Units awarded for active Performance Cycles will vest only as to the number of full months worked during such Performance Cycles and payment for such vested Units shall be made following the end of such Performance Cycles, subject to compliance with non-competition restrictions. In the event of a change in control of the Company, all unvested Units will immediately vest in full and be paid out based on the exchange value per share upon the closing of the change in control transaction.
Termination and Severance Benefits
The Company has executed severance agreements with the Company’s President and Chief Executive Officer, the Executive Vice-President and Chief Financial Officer, and Executive and certain Senior Vice-Presidents of the Company. Please see descriptions of the severance agreements below in “Compensation of Directors and Executive Officers—Executive Employment, Termination and Severance Agreements.”
Pension Benefits
Consistent with the Company’s objective to attract and retain qualified personnel, the Company provides pension benefits to employees, including officers, pursuant to the Company’s defined benefit pension plan. Through the end
172
Table of Contents
of fiscal 2012, the Company also provided supplemental retirement benefits to its officers pursuant to an Executive Salary Protection Plan, as amended (the “ESPPIII”), which was frozen as of the end of fiscal 2012. The Company replaced the ESPPIII with a Supplemental Executive Retirement Plan (“SERP”) starting in fiscal 2013. Prior to the end of fiscal 2014, the Company amended the Unified Cash Balance Plan (“Cash Balance Plan”) to close the plan to new entrants effective December 31, 2014. In addition, the Cash Balance Plan was frozen at December 31, 2014 such that current participants will no longer be credited with any future benefit accruals based on their years of service and pensionable compensation after that date. Each of these retirement benefits are described under “Compensation of Directors and Executive Officers—Pension Benefits” below.
Deferred Compensation Plans
Employees, including officers, may defer income from their earnings through voluntary contributions to the Company’s Sheltered Savings Plan (the “SSP”) adopted pursuant to Section 401(k) of the Internal Revenue Code. Certain highly compensated employees, including, but not limited to, officers, may also defer income from their earnings through voluntary contributions to the Company’s Amended and Restated Deferred Compensation Plan, which is a nonqualified plan. In the case of those employees who elect to defer income under these plans, the Company makes additional contributions for their benefit pursuant to a contribution and “matching” component of the Company’s plans. The contribution and matching components of the plans are subject to limitations set forth in regulations applicable to Section 401(k) plans generally and the Company’s plans specifically. The amount of these additional contributions made during fiscal 2013 for the benefit of the named executive officers is set forth in the footnotes to the Summary Compensation Table below. Both plans are described under “Nonqualified Deferred Compensation” below.
Additional Benefits
Executive officers are entitled to a supplemental officer health insurance benefit and an officer retiree medical benefit, which are described under “Compensation of Directors and Executive Officers—Officer Health Insurance Plan” below, and a supplemental disability insurance benefit, which is described under “Officer Disability Insurance” below.
Compensation Decisions for Fiscal 2015 and Fiscal 2016
Fiscal 2015
During fiscal 2015, the Compensation Committee continued to apply the compensation philosophy described above in determining the compensation of the named executive officers. With consideration given to the 2011 Compensation Survey and the Company’s performance objectives, personal performance objectives, internal pay equity and other factors, including the recent and ongoing economic conditions nationally and in the markets in which the Company operates and the Company’s response to those challenges, the Compensation Committee, on the recommendation of the Chief Executive Officer, determined that base salaries for Mr. Ling and all other officers of the Company, including all of the named executive officers, would be increased for fiscal 2015.
The base salary for Mr. Ling was increased to $850,000 during fiscal 2015 from $800,000 during fiscal 2014. Mr. Ling’s salary increased to $750,000 as of May 1, 2013, the date he became Chief Executive Officer. Mr. Ling’s base salary was $550,000 during fiscal 2013 prior to May 1, 2013, during which period he was President and General Counsel. Mr. Ling did not receive a bonus in 2015 or 2014. Mr. Ling has received an increase in base salary, prior to the adjustment of his salary in fiscal 2013, in two of the past three years, averaging 6% per year, and has not received a bonus in the past three years. For a description of Mr. Ling’s employment agreement, see “Compensation of Directors and Executive Officers—Executive Employment, Termination and Severance Agreements” below.
In determining Mr. Ling’s total compensation for fiscal 2015, the Compensation Committee considered the following:
| · | Company performance: The Company’s performance was below the targeted amount for pre-bonus EBITDAP, slightly above the targeted amount of sales and an expense ratio slightly better than the target. |
173
Table of Contents
| The Compensation Committee noted the failure of the Company to achieve the pre-bonus EBITDAP as the basis for its decision not to award a bonus to Mr. Ling for the fiscal year, just as none of the Company’s other officers earned a bonus for that fiscal year. |
| · | Individual performance: Mr. Ling’s achievement of certain personal objectives, including effectively planning and implementing the strategy of the Company, setting clear goals and objectives, setting a good example for ethics and compliance issues, mentoring senior executives, building team spirit, motivating the employees, establishing a good relationship with the Board and Board Committees, and demonstrating effective communication skills. |
| · | Internal pay equity: The relationship between each element of Mr. Ling’s compensation, on the one hand, and the compensation of each of the Company’s other executive officers, on the other hand; and the relationship between the aggregate value of Mr. Ling’s compensation, on the one hand, and the median compensation of the Company’s other executive officers, on the other hand. |
| · | Other factors: The results of the 2011 Compensation Survey and input from individual directors. |
The Compensation Committee increased the base salary for the other named executive officers in fiscal 2015. The base salaries for fiscal 2015 were as follows: Richard J. Martin, Executive Vice President, Finance and Administration and Chief Financial Officer, $450,000; Leon Bergmann, Executive Vice President, Sales and Procurement, $425,000; Daniel J. Murphy, Executive Vice President, Fresh Programs and Manufacturing, $390,000; and Susan M. Klug, Executive Vice President, Chief Marketing Officer, $375,000. Mr. Martin retired from the position of Executive Vice President, Finance and Administration and Chief Financial Officer effective October 27, 2015 and continued as an officer of the Company until May 2, 2016. He was succeeded by Mr. Michael F. Henn effective October 27, 2015.
The Compensation Committee’s philosophy is that each executive officer’s bonus should be designed to motivate that executive to achieve the specific Company performance goals and personal objectives established by the Compensation Committee and to align the interests of the executive officer with those of shareholders. Since the Company’s performance was below the targeted amount for pre-bonus EBITDAP, the Compensation Committee determined not to award cash bonuses to the Company’s officers for fiscal 2015. Overall, for 2015, the other named executive officers received a 6% increase in base salary from 2014 and no cash bonuses in fiscal 2015. The other named executive officers have received an increase in base salaries in two of the past three years, averaging 4% per year, and received no aggregate bonuses in the past three years. In determining each of the other named executive officers’ total compensation package, the Compensation Committee considered the following:
| · | Company performance: The Company’s performance was below the targeted amount for pre-bonus EBITDAP, slightly above the targeted amount of sales and an expense ratio better than the target. |
| · | Individual performance: The officer’s responsibilities, experience, individual performance, and past and potential contributions to the Company’s business, and achievement of specific personal objectives. |
| · | Other factors: The deductibility of the compensation, and the results of the 2011 Compensation Survey. |
Fiscal 2016
For fiscal 2016, the Compensation Committee, upon Mr. Ling’s recommendation for the other executive officers, decided that base salaries should be increased from their levels at the end of fiscal 2015. Accordingly, for fiscal 2016, Mr. Bergmann’s base salary will be $450,000, with a target bonus of 55% of base salary, Mr. Murphy’s base salary will be $400,000, with a target bonus of 55% of base salary; Ms. Klug’s base salary will be $385,000, with a target bonus of 55% of base salary. The Compensation Committee determined that Mr. Ling’s base salary will remain $850,000, with a target bonus of 100% of base salary for fiscal 2016.
The Compensation Committee agreed that the Company will pay Mr. Henn a weekly amount based on an annual base salary of $500,000 plus an annual car allowance of $31,558.80. Additionally, Mr. Henn is eligible to participate in the Unified Grocers’ Officer Annual Incentive Plan (the Compensation Committee has established a target bonus of 55% of base salary for fiscal 2016), Unified’s Sheltered Savings Plan and employee health insurance plans. Mr. Henn has waived participation in the Company’s Deferred Compensation Plan, Supplemental Executive Retirement Plan and Long Term Incentive Plan.
174
Table of Contents
Tax and Accounting Implications
Deductibility of Compensation
Under Section 162(m) of the Internal Revenue Code of 1986, as amended (the “Code”), a company that is an SEC registrant generally will not be entitled to a deduction for non-performance-based compensation paid to the chief executive officer and the three most highly compensated executive officers (other than the chief financial officer) to the extent such compensation exceeds $1.0 million paid in a fiscal year. Special rules apply for “performance-based” compensation, including the approval of the performance goals by the shareholders of the Company.
We generally intend to qualify executive compensation for deductibility without limitation under Section 162(m) of the Code. Except for the President and Chief Executive Officer, the non-performance based compensation paid in fiscal 2015 to any of our executive officers, as calculated for purposes of Section 162(m) of the Code, did not exceed the $1.0 million limit, and, with the exception of the Chief Executive Officer, we do not expect that the non-performance based compensation to be paid in fiscal 2016 to any of our executive officers will exceed the $1.0 million limit.
Nonqualified Deferred Compensation
On October 22, 2004, the American Jobs Creation Act of 2004 was signed into law, changing the tax rules applicable to nonqualified deferred compensation arrangements. The Company believes that it is in compliance with the statutory provisions and regulations promulgated thereunder. A more detailed discussion of the Company’s nonqualified deferred compensation arrangements is provided under the heading “Nonqualified Deferred Compensation” below.
Conclusion
The Compensation Committee believes that the Compensation Committee’s compensation policies encourage creation of shareholder value and achievement of strategic corporate objectives. The Compensation Committee believes that for fiscal 2016 the total cash compensation for each of the named executive officers is competitive with the total cash compensation paid to executives of other companies in the Company’s Peer Group that are of similar size and performance. In addition, the Compensation Committee believes that the Cash Bonus Plan and the LTIP motivates the executives to achieve specific Company performance goals and personal objectives established by the Board and the Compensation Committee and align the executive’s interests with those of the Company’s shareholders.
REPORT OF THE COMPENSATION COMMITTEE ON EXECUTIVE COMPENSATION
The Report of the Compensation Committee of the Board shall not be deemed incorporated by reference by any general statement incorporating by reference this proxy statement into any filing under the Securities Act of 1933 or under the Securities Exchange Act of 1934, except to the extent that the Company specifically incorporates this information by reference, and shall not otherwise be deemed filed under such Acts.
The Compensation Committee is responsible for, among other things, reviewing and approving compensation for the executive officers, establishing the performance goals on which the compensation plans are based and setting the overall compensation principles that guide the committee’s decision-making. The Compensation Committee has reviewed the Compensation Discussion and Analysis required by Item 402(b) of Regulation S-K and discussed it with management. Based on the review and the discussions with management, the Compensation Committee recommended to the Board that the CD&A be included in the 2015 Annual Report on Form 10-K for the year ended October 3, 2015 filed with the Securities and Exchange Commission. The Board has approved that recommendation.
175
Table of Contents
Dated: May 31, 2016
Compensation Committee Members
Thomas S. Sayles, Chairman
Richard E. Goodspeed, Ex Officio Member
Bradley Alford
Louis A. Amen
John Berberian
Darioush Khaledi
John D. Lang
Roger Laverty
Mimi R. Song
Richard L. Wright
Executive Officer Compensation
The following table summarizes the compensation paid to or earned by the Chief Executive Officer (Principal Executive Officer), the Executive Vice President, Finance and Administration and Chief Financial Officer (Principal Financial Officer) and the three other most highly compensated executive officers of the Company (collectively, the “Named Executive Officers”) for services to the Company in all capacities for the last three fiscal years.
In reviewing the Summary Compensation Table, the following information should be considered:
| · | Salary and Bonus data includes amounts deferred by the Named Executive Officers under the Company’s Sheltered Savings Plan adopted pursuant to Section 401(k) of the Internal Revenue Code and amounts deferred by the Named Executive Officers under the Company’s non-qualified Amended and Restated Deferred Compensation Plan. See the discussion of these plans below in “Qualified and Nonqualified Deferred Compensation Plans.” |
| · | “Change in Pension Value” represents the actuarial increases in the present value of the pension plans available to each Named Executive Officer. Such plans include the Company’s defined benefits plans and the ESPPIII. See discussion of these plans below in “Pension Benefits.” The determination of the change in pension value is highly dependent upon the discount rate utilized, which may change from year to year, thereby impacting the reported change in pension value from year to year. |
| · | “Nonqualified Deferred Compensation Earnings” represent the earnings or (losses) on the amounts deferred by the Named Executive Officer pursuant to the deferred compensation plans that are above market or interest on amounts deferred in excess of 120% of the applicable federal long-term rate as prescribed by the Internal Revenue Code. There were no Nonqualified Deferred Compensation Earnings, as defined above, for the Named Executive Officers during the last three fiscal years. This column has been omitted from the table below. |
176
Table of Contents
The Components of “All Other Compensation” are set forth in the table that appears in footnote (3) of the Summary Compensation Table.
2015 Summary Compensation Table
| Name and Principal Position | Year | Salary($) | Equity Incentive Plan Compensation ($)(1) |
Non-Equity Incentive Plan Compensation ($) |
Change ($)(2) |
All Other Compensation ($)(3) |
Total($) | |||||||||||||||||||||
| Robert M. Ling, Jr. President and Chief Executive Officer (Principal Executive Officer) |
|
2015 2014 2013 |
|
|
852,885 786,539 633,077 |
|
|
— — — |
|
|
— 762,720 — |
|
|
577,964 338,765 93,040 |
|
|
392,162 578,570 320,050 |
|
|
1,823,011 2,466,594 1,046,167 |
| |||||||
|
|
||||||||||||||||||||||||||||
| Richard J. Martin Executive Vice President (Principal Financial Officer) (4) |
|
2015 2014 2013 |
|
|
454,615 430,961 420,000 |
|
|
— — — |
|
|
— 207,365 — |
|
|
26,306 58,297 245,464 |
|
|
190,302 215,875 168,244 |
|
|
671,223 912,398 833,709 |
| |||||||
|
|
||||||||||||||||||||||||||||
| Michael F. Henn Executive Vice President Chief Financial Officer (Principal Financial Officer) (4) |
2015 | — | — | — | — | — | — | |||||||||||||||||||||
|
|
||||||||||||||||||||||||||||
| Leon G. Bergmann Executive Vice President, Sales and Procurement |
|
2015 2014 2013 |
|
|
426,442 393,269 310,096 |
|
|
— — — |
|
|
— 190,680 — |
|
|
(921 27,768 — |
)
|
|
165,087 180,305 88,814 |
|
|
590,608 792,022 398,910 |
| |||||||
|
|
||||||||||||||||||||||||||||
| Susan M. Klug Executive Vice President, Chief Marketing Officer |
|
2015 2014 2013 |
|
|
372,789 335,961 268,750 |
|
|
— — — |
|
|
— 97,247 — |
|
|
3,117 26,696 — |
|
|
149,493 121,692 86,579 |
|
|
525,399 581,596 355,329 |
| |||||||
|
|
||||||||||||||||||||||||||||
| Daniel J. Murphy Executive Vice President, Fresh Programs and Manufacturing |
|
2015 2014 2013 |
|
|
393,462 363,423 332,000 |
|
|
— — — |
|
|
— 178,763 — |
|
|
764,527 409,003 217,398 |
|
|
170,229 188,549 122,010 |
|
|
1,328,218 1,139,738 671,408 |
| |||||||
|
|
||||||||||||||||||||||||||||
| (1) | The aggregate grant date fair value of the LTIP grants, as computed under FASB ASC Topic 718-30, “Compensation – Stock Compensation – Awards Classified as Liabilities” (“ASC 718-30”), is zero based on the non-public intrinsic value. See “Long-Term or Equity Incentives (“LTIP”)” under “Compensation Discussion and Analysis” above for a full discussion of the LTIP and the compensation gap these awards are intended to fill. The amounts in LTIP are not payable until the conclusion of the respective Performance Cycles. |
| (2) | The change in pension value represents compensation to the executive in the form of an increase in the value of the executive’s pension over the fiscal year. It is based on a number of factors, including changes in employee compensation, discount rates and years of service. The change in pension value is highly sensitive to changes in the discount rate applied. The discount rates used in determining the change in pension value were 4.45%, 4.25% and 5.00% in 2015, 2014 and 2013, respectively, for the pension plan and 3.25%, 3.50% and 3.50% in 2015, 2014 and 2013, respectively, for the ESPPIII. The discount rate used to determine the benefit obligation under the pension plan changed from 4.25% at the September 30, 2014 measurement date to the September 2015 yield curve at the September 30, 2015 measurement date. The single weighted average rate used in determining the benefit obligation was 4.45%. The discount rate used to determine the benefit obligation for the ESPPIII changed from 3.50% at the September 30, 2014 measurement date to the September 2015 yield curve at the September 30, 2015 measurement date. The single weighted average rate used in determining the benefit obligation was 3.25%. The Cash Balance Plan was frozen effective December 31, 2014. See discussion above in “Pension Benefits” under Compensation Discussion and Analysis. The changes in pension values are not current cash compensation paid to the executive. |
177
Table of Contents
| (3) | All Other Compensation includes the following amounts: |
| Name | Automobile Allowance ($) |
Company’s Contribution to SSP($)(a) |
Company’s Contribution to SERP($)(b) |
Company’s Contribution to Deferred Compensation Plan($) |
Company Paid Premium on the Executive Life Plan ($) |
Company Paid Premium for the Executive Medical Reimbursement Plan(c) |
Tax Gross Ups ($)(d) |
Total($) | ||||||||||||||||||||||||||||
| Robert M. Ling, Jr. |
2015 | 34,480 | 18,758 | 255,866 | 47,404 | 5,200 | 15,795 | 14,659 | 392,162 | |||||||||||||||||||||||||||
| 2014 | 31,870 | 17,477 | 465,066 | 41,688 | 4,004 | 15,795 | 2,670 | 578,570 | ||||||||||||||||||||||||||||
| 2013 | 28,897 | 17,275 | 225,000 | 29,723 | 2,016 | 15,795 | 1,344 | 320,050 | ||||||||||||||||||||||||||||
|
|
||||||||||||||||||||||||||||||||||||
| Richard J. Martin(4) |
2015 | 31,839 | 18,747 | 90,923 | 14,341 | 9,350 | 15,795 | 9,307 | 190,302 | |||||||||||||||||||||||||||
| 2014 | 30,030 | 17,441 | 127,723 | 13,082 | 7,082 | 15,795 | 4,722 | 215,875 | ||||||||||||||||||||||||||||
| 2013 | 28,897 | 11,742 | 84,000 | 20,036 | 4,665 | 15,795 | 3,110 | 168,244 | ||||||||||||||||||||||||||||
|
|
||||||||||||||||||||||||||||||||||||
| Michael F. Henn(5) |
2015 | — | — | — | — | — | — | — | — | |||||||||||||||||||||||||||
|
|
||||||||||||||||||||||||||||||||||||
| Leon G. Bergmann |
2015 | 31,839 | 27,538 | 85,288 | 3,219 | — | 15,795 | 1,408 | 165,087 | |||||||||||||||||||||||||||
| 2014 | 29,374 | 17,469 | 116,886 | 781 | — | 15,795 | — | 180,305 | ||||||||||||||||||||||||||||
| 2013 | 22,034 | — | 56,250 | — | — | 10,530 | — | 88,814 | ||||||||||||||||||||||||||||
|
|
||||||||||||||||||||||||||||||||||||
| Susan M. Klug |
2015 | 31,157 | 16,028 | 74,558 | 11,074 | — | 15,795 | 881 | 149,493 | |||||||||||||||||||||||||||
| 2014 | 27,523 | 9,871 | 65,025 | 3,478 | — | 15,795 | — | 121,692 | ||||||||||||||||||||||||||||
| 2013 | 22,034 | — | 48,750 | — | — | 15,795 | — | 86,579 | ||||||||||||||||||||||||||||
|
|
||||||||||||||||||||||||||||||||||||
| Daniel J. Murphy |
2015 | 31,839 | 18,705 | 78,692 | 11,304 | 6,768 | 15,795 | 7,126 | 170,229 | |||||||||||||||||||||||||||
| 2014 | 29,374 | 17,434 | 108,603 | 8,815 | 5,117 | 15,795 | 3,411 | 188,549 | ||||||||||||||||||||||||||||
| 2013 | 26,484 | 17,298 | 49,800 | 6,985 | 3,389 | 15,795 | 2,259 | 122,010 | ||||||||||||||||||||||||||||
|
|
||||||||||||||||||||||||||||||||||||
| (a) | Unified Grocers, Inc. Sheltered Savings Plan (“SSP”). |
| (b) | Unified Grocers, Inc. Supplemental Executive Retirement Plan (“SERP”). |
| (c) | This amount includes the Executive Medical Reimbursement Plan premiums paid while Named Executive Officers are active. The Named Executive Officers may be entitled to additional benefits under the Officer Retiree Medical Plan upon termination of employment (please refer to the potential payments tables under termination, retirement and change in control for present values of such benefits). |
| (d) | Tax gross ups represent the taxes paid on the face value of the executive life insurance policies. |
| (4) | Mr. Martin retired from the position of Chief Financial Officer of the Company effective October 27, 2015; he continued as an officer of the Company until May 2, 2016. |
| (5) | Mr. Henn began employment after the end of fiscal 2015 and therefore did not receive any compensation prior to fiscal 2016. |
Stock-Based Compensation
The Company does not offer any stock-based compensation to its employees or directors, other than the LTIP, which is a cash amount determined with reference to the exchange value of a share of the Company’s Class A or Class B stock, plus cumulative patronage dividends, cash dividends and non-allocated retained earnings attributable to such share over the vesting period of such Unit.
Pension Benefits
Defined Benefit Plans and Executive Salary Protection Plan
The Company sponsors a cash balance plan (“Unified Cash Balance Plan”). The Unified Cash Balance Plan is a noncontributory defined benefit pension plan covering substantially all employees (both executive and non-executive) of the Company who are not subject to a collective bargaining agreement. Under the Unified Cash Balance Plan, participants are credited with an annual accrual based on years of service with the Company. The Unified Cash Balance Plan balance receives an annual interest credit, currently tied to the 30-year Treasury rate
178
Table of Contents
that is in effect the previous November, but in no event shall the rate be less than 5%. On retirement, participants will receive a lifetime annuity based on the total cash balance in their account. Benefits under the Unified Cash Balance Plan are provided through a trust. Prior to the end of fiscal 2014, the Company amended the Unified Cash Balance Plan to close the plan to new entrants effective December 31, 2014. In addition, the plan was frozen at December 31, 2014 such that current participants will no longer accrue salary-based service credits based on years of service with the Company. The annual interest credit as described above will continue for participants active in the plan as of December 31, 2014.
The Company’s Executive Salary Protection Plan, as amended (the “ESPPIII”), provides supplemental post-termination retirement income based on each participant’s final salary and years of service as an officer of the Company. The financing of this benefit is facilitated through the purchase of life insurance policies, the premiums of which are paid by the Company. The eligibility provisions of the ESPPIII were frozen on September 30, 2012 (the “ESPPIII Freeze”), and accordingly no employee that is either hired or becomes an officer on or after such date can become a participant or recommence participation in the ESPPIII.
The ESPPIII is generally designed to provide eligible officers with retirement benefits when they reach age 62. The combination of payments under the ESPPIII and the Unified Cash Balance Plan is designed to provide pension benefits equal to approximately 65% of the participant’s final pay (defined as the highest annualized base salary and car allowance received in the three years prior to separation or retirement). Previously, employees became eligible to participate in the ESPP after three years of service as an officer of the Company in the position of Vice President or higher. Upon eligibility, officers received credit for years of service with the Company at the rate of 5% of final pay for each year of service up to a maximum of 13 years. In the event of the occurrence of a change in control, the participant shall be vested 100% and credited with an additional three (3) years of service, or as provided in a participant’s employment agreement or severance agreement, whichever is greater, for purposes of calculating the participants benefits under the ESPPIII. Officers first elected after January 1, 1999 receive credit only for years of service as an officer. Payments under the ESPPIII are discounted for executives who elect to receive benefits prior to age 62. In May 2003, the Board approved amendments to the ESPPIII (the “Plan Amendments”). The Plan Amendments maintain the eligibility features described above, except that an officer must complete three years of service as an officer to be eligible and five years of service as an officer to be fully vested in the plan. In addition, officers receive 1% of final pay for each year of service in excess of 13 years. The Plan Amendments also provide that officers elected after the effective date of the Plan Amendments receive service credit for years of service as an officer of the Company at the rate of 4.33% of final average pay (defined as the average of the five highest years of base salary, car allowance and bonus compensation received in the ten years prior to separation or retirement) up to a maximum of 15 years. Thereafter, officers receive an additional 1% of final average pay for each year of service in excess of 15 years. As of December 31, 2015, credited years of service under the ESPPIII for Named Executive Officers were: Mr. Ling, 16 years; Mr. Martin, 15 years; and Mr. Murphy, 15 years. Officers employed as of the effective date of the Plan Amendments shall receive benefits equal to the greater of the amount calculated pursuant to either the ESPPIII, as it existed prior to the Plan Amendments (with the additional 1% of final pay for each year in excess of 13), or as amended.
As a result of the ESPPIII Freeze, officers with fifteen (15) years of service or more under the ESPPIII accrue no further benefits under the ESPPIII, and officers participating in the ESPPIII as of the Plan Freeze who had less than fifteen (15) years of service continue to accrue benefits under the ESPPIII until they have fifteen (15) years of service under the ESPPIII. In addition, the compensation used to determine benefits under the ESPPIII does not consider any compensation earned after September 30, 2012, effectively freezing the final pay and final average pay as defined by the plan at the level on September 30, 2012.
The following table provides information with respect to each pension plan that provides for payments or other benefits at, following or in connection with retirement. The amounts below are based upon the present value of accumulated benefits as of September 30, 2015, the measurement date of the Company as required by accounting principles generally accepted in the United States of America (“GAAP”). Please see the Company’s discussion in Item 8 of our audited consolidated financial statements included in this Annual Report on Form 10-K for the fiscal year ended October 3, 2015.
179
Table of Contents
PENSION BENEFITS
| Name | Plan Name | Number of Years Credited Service (#) |
Present ($)(1)(2) |
Payments ($) |
||||||||||
| Robert M. Ling, Jr. |
Cash balance plan | 18 | 539,030 | — | ||||||||||
| ESPPIII | 16 | 5,700,298 | — | |||||||||||
| Richard J. Martin(3) |
Cash balance plan | 16 | 571,321 | — | ||||||||||
| ESPPIII | 15 | 4,507,563 | — | |||||||||||
| Michael F. Henn(4)(5) |
Cash balance plan | — | — | — | ||||||||||
| Leon G. Bergmann(5) |
Cash balance plan | 2 | 26,847 | — | ||||||||||
| Susan M. Klug(5) |
Cash balance plan | 2 | 29,813 | — | ||||||||||
| Daniel J. Murphy |
Cash balance plan | 14 | 488,600 | — | ||||||||||
| ESPPIII | 14 | 3,001,078 | — | |||||||||||
|
|
||||||||||||||
| (1) | Retirement is assumed to be at the earliest ages at which the benefits are payable unreduced (or a date specified by the officer for the ESPPIII). The Named Executive Officers are assumed to continue with the Company until they reach the age at which they can receive benefits at unreduced amounts based on their age plus number of years of service as an officer of the Company. |
| (2) | No pre-retirement decrements have been assumed in determining the present value of accrued benefits. |
| (3) | Mr. Martin retired from the position of Chief Financial Officer of the Company effective October 27, 2015; he continued as an officer of the Company until May 2, 2016. |
| (4) | Mr. Henn began employment after the end of fiscal 2015 and therefore did not receive any compensation prior to fiscal 2016. |
| (5) | Mr. Henn, Mr. Bergmann and Ms. Klug began employment after September 30, 2012 and are therefore not eligible for the ESPPIII. |
Nonqualified Supplemental Executive Retirement Plan
Following the ESPPIII Freeze described above, the Company adopted a Supplemental Executive Retirement Plan (“SERP”) in fiscal 2013 to provide supplemental post-termination retirement income to officers of the Company based on defined contributions made to the plan during the course of service as an officer of the Company. The SERP is a non-qualified defined contribution type plan under which benefits are derived from an account balance for each participating officer. Each account balance is credited each year with a notional Company contribution based on the officer’s compensation, calculated as base salary plus bonus, earned during a fiscal year and the officer’s executive level at the end of the fiscal year. Plan participants may select from a variety of investment options concerning how the contribution is invested similar to the Company’s non-qualified deferred compensation plan.
Company contributions to the SERP for each participating officer will be based on a percentage of the officer’s compensation for the fiscal year, with the percentage dependent upon the officer’s position within the Company at the end of the fiscal year. The following table sets forth the contribution percentages for fiscal years in which the SERP is in effect for the entire fiscal year.
| Executive Level | Contribution Percentage | |||
| Chief Executive Officer and President |
30 | % | ||
| Executive Vice President |
20 | % | ||
| Senior Vice President |
15 | % | ||
| Vice President |
10 | % | ||
Upon termination of employment or death, the participant’s vested account balance will be payable over a period of from 5 to 15 years, or immediately following a change in control, as elected by the participant upon entry into the plan. Vesting is based on years of service as an officer at the rate of 20% per year. After 5 years of service as an
180
Table of Contents
officer, including service prior to the SERP’s adoption, or following a change in control, the account will be 100% vested. An account may be forfeited in the event a participant is terminated for cause or engages in activity in competition with the Company.
| Name | Registrant Contributions in Last FY ($)(1) |
Aggregate Earnings (Loss) in Last FY ($)(2) |
Aggregate Withdrawals/ Distributions ($)(2) |
Aggregate Balance at Last FYE ($) |
||||||||||||
| Robert M. Ling, Jr. |
465,066 | (6119 | ) | — | 695,180 | |||||||||||
| Richard J. Martin(3) |
127,723 | (5,360 | ) | — | 209,410 | |||||||||||
| Michael F. Henn(4) |
— | — | — | — | ||||||||||||
| Leon G. Bergmann |
116,886 | (3,780 | ) | — | 172,199 | |||||||||||
| Susan M. Klug |
65,025 | (1,502 | ) | — | 115,596 | |||||||||||
| Daniel J. Murphy |
108,603 | (1,308 | ) | — | 159,383 | |||||||||||
|
|
||||||||||||||||
| (1) | For fiscal 2015, The Company made contributions for fiscal 2014 into the participants’ account. The amount included “All Other Compensation” in the Summary Compensation Table above will be allocated to the participants’ account in fiscal 2016. |
| (2) | Amounts in these columns are not included in the Summary Compensation Table above. |
| (3) | Mr. Martin retired from the position of Chief Financial Officer of the Company effective October 27, 2015; he continued as an officer of the Company until May 2, 2016. |
| (4) | Mr. Henn began employment after the end of fiscal 2015 and therefore did not receive any compensation prior to fiscal 2016. |
Qualified and Nonqualified Deferred Compensation Plans
Certain Company employees, including officers, may defer income from their earnings through voluntary contributions to the Company’s Sheltered Savings Plan adopted pursuant to Section 401(k) of the Internal Revenue Code, which is a qualified plan, and the Company’s Amended and Restated Deferred Compensation Plan, which is a nonqualified plan. In the case of those employees who elect to defer income under these plans, the Company makes additional contributions for their benefit, up to established limits. Amounts deferred by an employee are credited with earnings or losses based on the employee’s investment allocation among investment options, which may include stocks, bonds and mutual fund shares. Distributions are paid in accordance with the employee’s elections with regard to the timing and form of distributions. The amount of these additional contributions made during fiscal 2015 for the benefit of the Principal Executive Officer, Principal Financial Officer and other Named Executive Officers is set forth in the footnotes to the Summary Compensation Table.
| Name | Executive Contribution in Last FY ($)(1) |
Registrant Contributions in Last FY ($) (2) |
Aggregate Earnings (Loss) in Last FY($)(3) |
Aggregate Withdrawals/ Distributions ($)(3) |
Aggregate at Last FYE($) |
|||||||||||||||
| Robert M. Ling, Jr. |
126,195 | 47,404 | 1,331 | — | 965,539 | |||||||||||||||
| Richard J. Martin(4) |
92,808 | 14,341 | 4,651 | — | 1,234,022 | |||||||||||||||
| Michael F. Henn(5) |
— | — | — | — | — | |||||||||||||||
| Leon G. Bergmann |
— | 3,219 | (25 | ) | — | 3,971 | ||||||||||||||
| Susan M. Klug |
50,686 | 11,074 | (749 | ) | — | 143,061 | ||||||||||||||
| Daniel J. Murphy |
24,286 | 11,304 | 4,491 | — | 348,535 | |||||||||||||||
|
|
||||||||||||||||||||
| (1) | This column shows amounts that are also reported as salary, bonus or non-equity incentive plan awards in the Summary Compensation Table above. Those amounts, as well as amounts in the “Aggregate Balance” column that represent salary or bonus that were reported in the Summary Compensation Tables in prior years, are quantified in the table below. |
181
Table of Contents
| Name |
Amount included in both Non-Qualified Deferred |
Amount included in both Non-Qualified Deferred |
Total Amounts included in both Non-Qualified Deferred Compensation Table and 2015 or Prior Years’ Summary Compensation Table($) |
|||||||||
| Robert M. Ling, Jr. |
126,195 | 415,303 | 541,498 | |||||||||
| Richard J. Martin(4) |
92,808 | 948,335 | 1,041,143 | |||||||||
| Michael F. Henn(5) |
— | — | — | |||||||||
| Leon G. Bergmann |
— | — | — | |||||||||
| Susan M. Klug |
50,686 | 72,686 | 123,212 | |||||||||
| Daniel J. Murphy |
24,286 | 181,612 | 205,898 | |||||||||
|
|
||||||||||||
| (2) | Amounts in this column are included in “All Other Compensation” in the Summary Compensation Table above. |
| (3) | Amounts in these columns are not included in the Summary Compensation Table above. |
| (4) | Mr. Martin retired from the position of Chief Financial Officer of the Company effective October 27, 2015; he continued as an officer of the Company until May 2, 2016. |
| (5) | Mr. Henn began employment after the end of fiscal 2015 and therefore did not receive any compensation prior to fiscal 2016. |
Officer Health Insurance Plans
The Board approved, effective January 1, 2001, an executive medical reimbursement plan (the “Executive Medical Reimbursement Plan” or “EMRP”) and an officer retiree medical plan (the “Officer Retiree Medical Plan” or “ORMP”) for officers and their eligible dependents. Pursuant to the EMRP, officers will be eligible for payment by the insurance plan of the portion of eligible expenses not covered under the Company’s health insurance plan. Under the ORMP, officers who are at least 55 years of age and have seven years of service with the Company as an officer will be eligible to participate in the ORMP following termination of employment. Benefits under the ORMP are the same as under the base retiree medical plan offered to non-union employees but with no annual premium caps, plus dental and vision benefits, continuation of the EMRP during retirement and extension of benefits for eligible dependents following the officer’s death. Former officers (and surviving spouses) must enroll in Medicare Parts A and B when they reach age 65 at which time the EMRP coverage for medical and prescription benefits ends. Active officers will continue to be obligated to pay the regular premium for the Company health insurance plan they have selected. Effective October 1, 2011, the ORMP was amended to provide that officers, during retirement, are required to pay twenty-five (25%) percent of the ORMP premium to maintain coverage. The eligibility provisions of the ORMP were frozen effective September 30, 2012, and accordingly no employee that is either hired as an officer or becomes an officer on or after such date can become a participant or recommence participation in the ORMP.
Officer Disability Insurance
The Board approved, effective January 1, 2001, a supplemental disability insurance plan for officers that provides 100% of their pre-disability base salary while on a disability leave for up to two years. This disability coverage will be coordinated with existing sick leave, state disability insurance, short-term disability insurance, and long-term disability plans available to all employees so that the officer disability insurance is a supplemental benefit. During the first six months of disability, state disability insurance and short-term disability insurance pay 66 2/3% of the employee’s salary and officer disability insurance pays 33 1/3%. After six months of disability, state disability insurance and long-term disability insurance pays 50% of the employee’s salary and officer disability insurance pays the remaining 50%.
Potential Payments Upon Retirement, Death, Disability, Termination or Change-In-Control
The following sections describe agreements between the Company and the Named Executive Officers if certain events were to occur. At the start of each section a table illustrates the potential payments to the Named Executive Officers if the certain event had occurred on October 3, 2015 which was the last day of fiscal year 2015 (the “Measurement Date”). None of the payments set forth below, except those identified as “Salary” or “Bonus,” are payments that are in addition to payments currently owed the Named Executive Officers under existing benefit
182
Table of Contents
plans. In addition, Named Executive Officers would also be due any accrued vacation amounts. None of the events described have actually occurred as of October 3, 2015, the Company’s most recent fiscal year-end. The disclosed amounts are estimates only and do not necessarily reflect the actual amounts that would be paid to the Named Executive Officers, which would only be known at the time they become eligible for such payments.
Officer Retirement
As discussed in Note 13 “Benefit Plans” of Notes to Consolidated Financial Statements in Part II, Item 8, “Financial Statements and Supplementary Data,” the Company has a defined benefit pension plan (the “Unified Cash Balance Plan”) that covers both non-union and executive employees, which was frozen as of December 31, 2014. Additionally, the Company’s ESPPIII plan, which was frozen as of September 30, 2012, provides supplemental post-termination retirement income based on each participant’s final salary and years of service as an officer of the Company, and the Company adopted a SERP in fiscal 2013 to provide supplemental post-termination retirement income to officers of the Company based on defined contributions made to the plan during the course of service as an officer of the Company.
The following table illustrates the estimated amounts that would be payable to each Named Executive Officer, currently employed with the Company, if they were to have retired, defined as termination of employment upon reaching benefit eligibility and exclusive of termination for cause, disability or death, on October 3, 2015. No such Named Executive Officers retired on that date. Distribution of the amounts due an executive are made pursuant to an individual’s distribution elections, plan terms, and other regulatory constraints.
| Robert Age 59 |
Richard J. Age 70 |
Michael F. Henn Age 67 |
Leon G. Bergmann Age 48 |
Susan M. Klug Age 56 |
Daniel
J. Age 69 |
|||||||||||||||||||
| Cash Balance Plan(1) |
$ | 540,959 | $ | 571,321 | $ | — | $ | — | $ | — | $ | 488,600 | ||||||||||||
| ESPPIII(1) |
5,700,298 | 4,507,563 | — | — | — | 3,001,078 | ||||||||||||||||||
| SERP |
695,180 | 209,410 | — | 68,880 | 46,238 | 159,383 | ||||||||||||||||||
| Deferred Compensation Plan |
965,539 | 1,234,022 | — | 3,971 | 143,061 | 348,535 | ||||||||||||||||||
| ORMP(1) |
170,214 | 75,325 | — | — | — | 75,476 | ||||||||||||||||||
| Life Insurance(2) |
1,000,000 | 500,000 | — | — | — | 400,000 | ||||||||||||||||||
|
|
|
|||||||||||||||||||||||
| Total(4) |
$ | 9,072,190 | $ | 7,097,641 | — | 72,851 | 189,299 | 4,473,072 | ||||||||||||||||
|
|
||||||||||||||||||||||||
| (1) | Amounts represent the net present value of the accumulated benefit at the Measurement Date (October 3, 2015). |
| (2) | Amount of death benefit. |
| (3) | Mr. Henn began employment after the end of fiscal 2015 and therefore did not receive any compensation or benefits prior to fiscal 2016. |
| (4) | LTIP is omitted from the above table as no amounts are due and no amounts have been accrued under the plan. All current Performance Cycles consist of Appreciation Units only and the current share price of $195.34 is less than the Performance Cycle’s issuance price for each respective fiscal year as follows: 2013 Performance Cycle – $316.11; 2014 Performance Cycle – $279.50; and 2015 Performance Cycle – $267.69. |
Officer Death & Disability
As discussed above under “Officer Health Insurance Plans” and “Officer Disability Insurance,” the Company provides certain benefits to the executive officers of the Company. The following table illustrates estimated payments to Named Executive Officers, currently employed with the Company, or their beneficiaries if either death or disability had occurred on October 3, 2015.
| Robert M. Ling, Jr. | Richard J. Martin | Leon G. Bergmann | Susan M. Klug | Daniel J. Murphy | ||||||||||||||||||||||||||||||||||||
| Death ($) | Disability ($)(3) |
Death ($) |
Disability ($)(3) |
Death ($) |
Disability ($)(3) |
Death ($) |
Disability ($)(3) |
Death ($) |
Disability ($)(3) |
|||||||||||||||||||||||||||||||
| Officer Disability Insurance(1)(2) |
— | 779,167 | — | 412,500 | — | 389,583 | — | 343,750 | — | 357,500 | ||||||||||||||||||||||||||||||
| Life Insurance(2) |
1,200,000 | — | 675,000 | — | 637,500 | — | 562,500 | — | 585,000 | — | ||||||||||||||||||||||||||||||
|
|
||||||||||||||||||||||||||||||||||||||||
| (1) | Amounts are payable over two (2) years and reflect only the supplemental officer disability insurance. |
183
Table of Contents
| (2) | Mr. Henn began employment after the end of fiscal 2015 and therefore did not receive any compensation or benefits prior to fiscal 2016. He was omitted from this table due to space limitations. |
| (3) | Disability is defined as “incapacity due to physical or mental illness to perform substantially their duties on a full-time basis for six (6) consecutive months and, within thirty (30) days after a notice of termination is thereafter given by the Company, the Executive shall not have returned to the full-time performance of the Executive’s duties.” |
Executive Termination and Severance Agreements
The Company and Mr. Ling, the Company’s Chief Executive Officer and President, are parties to a severance agreement that provides for severance payments in the event Mr. Ling’s employment is terminated (i) by the Company other than for cause, death or extended disability, (ii) by Mr. Ling for good reason, defined therein as (a) an adverse change in Mr. Ling’s status or position(s) in effect immediately prior to the date of the agreement, (b) a material reduction in Mr. Ling’s base salary, subject to notice to the Company and the Company’s failure to correct, or (iii) by Mr. Ling without cause within 12 months following a change in control. The severance payment is equal to two times the highest annual base salary in the three years prior to termination plus two times the highest annual incentive bonus paid during that three-year period. In the event of the occurrence of a change in control, Mr. Ling, Jr. shall be credited with an additional five (5) years of service for purposes of calculating his benefits under the ESPPIII. In the event of the occurrence of the specified termination events, Mr. Ling is also entitled to Company payment of COBRA health insurance premiums until the earlier of 24 months or the cessation of COBRA eligibility and coverage.
During fiscal 2016, Mr. Richard J. Martin, Chief Financial Officer and Executive Vice President, Finance and Administration, retired from his position effective October 27, 2015; however, he remained as an officer of the Company until May 2, 2016. The Board appointed Mr. Michael F. Henn as Executive Vice President and Chief Financial Officer effective on October 27, 2015. Mr. Henn did not receive any compensation from the Company during fiscal 2015. Previously, the Company and Mr. Martin were parties to a severance agreement that provided for severance payments in the event Mr. Martin’s employment was terminated (i) by the Company other than for cause, death or extended disability, (ii) by Mr. Martin for good reason (as defined), or (iii) by Mr. Martin without cause within 12 months following a change in control. The severance payment was equal to two times the highest annual base salary in the three years prior to termination plus two times the highest annual incentive bonus paid during that three-year period. In the event of the occurrence of a change in control, Mr. Martin would have been credited with an additional five (5) years of service for purposes of calculating his benefits under the ESPPIII. In the event of the occurrence of the specified termination events, Mr. Martin was also entitled to Company payment of COBRA health insurance premiums until the earlier of 24 months or the cessation of COBRA eligibility and coverage. Pursuant to an agreement entered into on April 26, 2016, and retroactive to Mr. Martin’s resignation from the position of Chief Financial Officer and Executive Vice President, Finance and Administration on October 27, 2015, Mr. Martin’s employment terminated at the end of business on May 2, 2016. Mr. Martin’s separation from the Company will be a retirement. The agreement stipulates that Mr. Martin’s resignation from the position of Chief Financial Officer and Executive Vice President, Finance and Administration, does not meet the definition of “good reason” as defined in his previous severance agreement. Termination of Mr. Martin’s employment on or before that date entitles him to (i) the unpaid balance of his paid time off bank, (ii) any amounts, payments or benefits to which he is entitled under the express terms of any applicable Company employee benefit plans, (iii) any unpaid eligible reimbursable expenses and (iv) any outstanding incentive compensation awards (according to their plan terms). Additionally, Mr. Martin will receive medical COBRA and EMRP for himself and his spouse (as eligible) for a period of seven (7) months. Thereafter, Mr. Martin may purchase COBRA medical coverage. Mr. Martin is not eligible for any other post-employment payments and benefits.
Mr. Henn entered into an at-will employment arrangement with the Company effective October 27, 2015. His annual salary is $500,000 plus an annual car allowance of $31,558.80. Mr. Henn has waived participation in the Company’s Deferred Compensation Plan, Supplemental Executive Retirement Plan and Long Term Incentive Plan. He is eligible to participate in the Company’s Officer Annual Incentive Plan, Sheltered Savings Plan and employee health insurance plans.
184
Table of Contents
The Company has approved severance agreements with each of Mr. Bergmann, Executive Vice President, Sales and Procurement, Ms. Klug, Executive Vice President, Chief Marketing Officer, and Mr. Murphy, Executive Vice President, Fresh Programs and Manufacturing with terms that provide a severance benefit equal to one year’s salary and bonus based on the highest annual salary and the highest incentive bonus paid over the prior three years in the event of the occurrence of specified termination events. These include termination (i) by the Company other than for cause, death or extended disability, and (ii) by the executive for good reason (as defined).
The following table illustrates the estimated amounts that would be payable to each Named Executive Officer, currently employed with the Company, if they were to have terminated, voluntarily or involuntarily, at October 3, 2015. None of the payments set forth below, except those identified as “Salary” or “Bonus,” are payments that are in addition to payments currently owed to such Named Executive Officers under existing benefit plans. In addition, such Named Executive Officers would also be due any accrued vacation benefits.
| Payable pursuant to Employment or Severance Agreements | ||||||||||||||||||||||||||||||||||
| Salary (2) ($) |
Bonus (2) ($) |
Cash Balance Plan (3)(4) ($) |
ESPPIII (3)(4) ($) |
SERP (4) ($) |
Deferred Compensation (4) ($) |
ORMP (3)(4) ($) |
Total (5) ($) |
|||||||||||||||||||||||||||
| Robert M. Ling, Jr. |
Voluntary Termination | — | — | 540,959 | 5,700,298 | 695,180 | 965,539 | 170,214 | 8,072,190 | |||||||||||||||||||||||||
| Constructive (1) or Involuntary Termination | 1,700,000 | 1,525,440 | 540,959 | 5,700,298 | 695,180 | 965,539 | 170,214 | 11,297,630 | ||||||||||||||||||||||||||
| Termination for Cause | — | — | 540,959 | 5,700,298 | 695,180 | 965,539 | 170,214 | 8,072,190 | ||||||||||||||||||||||||||
|
|
||||||||||||||||||||||||||||||||||
| Richard J. Martin (6) |
Voluntary Termination | — | — | 571,321 | 4,507,563 | 209,410 | 1,234,022 | 75,325 | 6,597,641 | |||||||||||||||||||||||||
| Constructive (1) or Involuntary Termination | 900,000 | 414,730 | 571,321 | 4,507,563 | 209,410 | 1,234,022 | 75,325 | 7,912,371 | ||||||||||||||||||||||||||
| Termination for Cause | — | — | 571,321 | 4,507,563 | 209,410 | 1,234,022 | 75,325 | 6,597,641 | ||||||||||||||||||||||||||
|
|
||||||||||||||||||||||||||||||||||
| Michael F. Henn (7) |
Voluntary Termination | — | — | — | — | — | — | — | — | |||||||||||||||||||||||||
| Constructive (1) or Involuntary Termination | — | — | — | — | — | — | — | — | ||||||||||||||||||||||||||
| Termination for Cause | — | — | — | — | — | — | — | — | ||||||||||||||||||||||||||
|
|
||||||||||||||||||||||||||||||||||
| Leon G. Bergmann |
Voluntary Termination | — | — | — | — | 68,880 | 3,971 | — | 72,851 | |||||||||||||||||||||||||
| Constructive (1) or Involuntary Termination | 425,000 | 90,680 | — | — | 68,880 | 3,971 | — | 588,531 | ||||||||||||||||||||||||||
| Termination for Cause | — | — | — | — | 68,880 | 3,971 | — | 72,851 | ||||||||||||||||||||||||||
|
|
||||||||||||||||||||||||||||||||||
| Susan M. Klug |
Voluntary Termination | — | — | — | — | 46,238 | 143,061 | — | 189,299 | |||||||||||||||||||||||||
| Constructive (1) or Involuntary Termination | 375,000 | 97,247 | — | — | 46,238 | 143,061 | — | 661,546 | ||||||||||||||||||||||||||
| Termination for Cause | — | — | — | — | 46,238 | 143,061 | — | 189,299 | ||||||||||||||||||||||||||
|
|
||||||||||||||||||||||||||||||||||
185
Table of Contents
| Payable pursuant to Employment or Severance Agreements | ||||||||||||||||||||||||||||||||||
| Salary (2) ($) |
Bonus (2) ($) |
Cash Balance Plan (3)(4) ($) |
ESPPIII (3)(4) ($) |
SERP (4) ($) |
Deferred Compensation (4) ($) |
ORMP (3)(4) ($) |
Total (5) ($) |
|||||||||||||||||||||||||||
| Daniel J. Murphy |
Voluntary Termination | — | — | 488,600 | 3,011,078 | 159,383 | 348,535 | 75,476 | 4,083,072 | |||||||||||||||||||||||||
| Constructive (1) or Involuntary Termination | 390,000 | 178,763 | 488,600 | 3,011,078 | 159,383 | 348,535 | 75,476 | 4,651,835 | ||||||||||||||||||||||||||
| Termination for Cause | — | — | 488,600 | 3,011,078 | 159,383 | 348,535 | 75,476 | 4,083,072 | ||||||||||||||||||||||||||
|
|
||||||||||||||||||||||||||||||||||
(Footnotes continued from previous page)
| (1) | Constructive Termination is termination for “good reason,” which is defined in Mr. Ling’s Employment Agreement and the other officers’ Severance Agreements to mean “an adverse change in the Executive’s status or position in effect immediately prior to the date of this agreement or a reduction in the Executive’s base salary.” |
| (2) | Salary and bonus are paid in a lump sum. |
| (3) | Amounts represent the net present value of the accumulated benefit at September 28, 2013, the last day of fiscal 2013, and commence immediately, or on a date specified by the officer for the ESPPIII or at the earliest date of first eligibility in the case of the Cash Balance Plan. |
| (4) | Payments are made based on Plan documents as described above in “Pension Benefits,” “Nonqualified Supplemental Executive Retirement Plan,” “Nonqualified Deferred Compensation” and “Officer Health Insurance Plans.” Estimated amounts due are not additional amounts, but are the current benefits due to the Named Executive Officers under the previously described plans. |
| (5) | LTIP is omitted from the above table as no amounts are due and no amounts have been accrued under the plan. All current Performance Cycles consist of Appreciation Units only and the current share price of $195.34 is less than the Performance Cycle’s issuance price for each respective fiscal year as follows: 2013 Performance Cycle – $316.11; 2014 Performance Cycle – $279.50; and 2015 Performance Cycle – $267.69. |
| (6) | Mr. Martin retired from the position of Chief Financial Officer of the Company effective October 27, 2015; he continued as an officer of the Company until May 2, 2016. |
| (7) | Mr. Henn began employment after the end of fiscal 2015. |
The following table illustrates the estimated amounts that would be payable to each Named Executive Officer, currently employed with the Company, if there had been a change-in-control event as of October 3, 2015. None of the payments set forth below, except those identified as “Salary” or “Bonus,” are payments that are in addition to payments currently owed to such Named Executive Officers under existing benefit plans. In addition, such Named Executive Officers would also be due any accrued vacation benefits.
| Robert M. Ling, Jr. |
Richard J. Martin |
Michael F. Henn (5) |
Leon G. Bergmann |
Susan M. Klug |
Daniel J. Murphy |
|||||||||||||||||||
| Salary (1) |
$ | 1,700,000 | $ | 900,000 | $ | — | $ | 425,000 | $ | 375,000 | $ | 780,000 | ||||||||||||
| Bonus (1) |
1,525,440 | 414,730 | — | 90,680 | 97,247 | 357,526 | ||||||||||||||||||
| Cash Balance Plan (2)(3) |
540,959 | 571,321 | — | 0 | 488,600 | |||||||||||||||||||
| ESPPIII (2)(3) |
6,175,320 | 4,873,465 | — | 3,336,951 | ||||||||||||||||||||
| SERP(3) |
695,180 | 209,410 | — | 68,880 | 46,238 | 159,383 | ||||||||||||||||||
| Deferred Compensation(3) |
965,539 | 1,234,022 | — | 3,971 | 143,061 | 348,535 | ||||||||||||||||||
| ORMP (2)(3) |
170,214 | 75,325 | — | 75,476 | ||||||||||||||||||||
|
|
||||||||||||||||||||||||
| Total (4) |
$ | 11,772,652 | $ | 8,278,273 | — | $ | 588,531 | $ | 661,546 | $ | 5,546,471 | |||||||||||||
| (1) | Salary and bonus are paid in a lump sum. |
| (2) | Amounts represent the net present value of the accumulated benefit at October 3, 2015, the last day of fiscal 2015 and commence immediately, or on a date specified by the officer for the ESPPIII or at the earliest date of first eligibility in the case of the Cash Balance Plan. |
186
Table of Contents
| (3) | Payments are made based on Plan documents as described above in “Pension Benefits,” “Nonqualified Supplemental Executive Retirement Plan,” “Qualified and Nonqualified Deferred Compensation Plans” and “Officer Health Insurance Plans.” Estimated amounts due are not additional amounts, but are the current benefits due to the Named Executive Officers under the previously described plans. |
| (4) | LTIP is omitted from the above table as no amounts are due and no amounts have been accrued under the plan. All current Performance Cycles consist of Appreciation Units only and the current share price of $195.34 is less than the Performance Cycle’s issuance price for each respective fiscal year as follows: 2013 Performance Cycle – $316.11; 2014 Performance Cycle – $279.50; and 2015 Performance Cycle – $267.69. |
| (5) | Mr. Henn began employment after the end of fiscal 2015. |
Director Compensation
Board Compensation
Overview
The compensation policy for members of the Board for fiscal 2016 remains unchanged from fiscal 2015.
Compensation Committee Analysis
In December 2014, the Compensation Committee retained Pearl Meyer to conduct a review of the compensation of the Board to ensure that it continued to be reasonable, competitive and reflective of the changing environment for director compensation (the “2014 Director Compensation Survey”). Pearl Meyer reviewed director compensation level and structure among a Peer Group of 16 companies. The 2014 Peer Group used for comparisons included 12 companies from the 2011 Compensation Survey and four additional companies, which were subsequently included in the Peer Group for the 2014 Compensation Survey, as follows:
| 2014 Director Compensation Survey—Peer Companies | ||
| The Andersons, Inc. |
Smart & Final Stores, Inc. | |
| Casey’s General Stores, Inc. |
SpartanNash Company | |
| Chiquita Brands International Inc. |
Sprouts Farmers Market, Inc. | |
| Core-Mark Holding Company, Inc. |
Stater Bros. Holdings, Inc. | |
| Flowers Foods, Inc. |
United Natural Foods, Inc. | |
| Ingles Markets, Incorporated |
Weis Markets, Inc. | |
| The Pantry, Inc. |
The WhiteWave Foods Company | |
| Pinnacle Foods Inc. |
Whole Foods Market, Inc. | |
Pearl Meyer compared the compensation levels and programs of such companies to those of the Company for its non-shareholder directors. All aspects of director compensation were reviewed, including the annual retainer, board meeting fees, equity compensation, committee compensation (for both the chairperson and members) and total compensation. Based on the results of the survey, Pearl Meyer determined that (i) total director compensation was well below the 50th percentile of the Peer Group due to the lack of director equity compensation and below-market committee compensation (particularly for chairpersons), (ii) the differential between the non-executive chairman’s compensation and that of other directors was less at the Company than at the Peer Group of companies and (iii) the total board cost was slightly above the Peer Group’s 25th percentile due to the higher number of paid directors at Unified (15 at Unified versus an average of six for the Peer Group). Based on the results of this review, the Board made several changes to director compensation in 2015 as indicated below.
Fiscal 2015 and 2016 Board Compensation Policy
Under the Company’s current director compensation policy, each Shareholder-Related Director receives an annual retainer as compensation for service as a director of the Company and as a member of any committees of the Board of the Company and the board of any subsidiary of the Company, if applicable. The annual retainer is $15,000 for fiscal 2015. Directors who are non-Shareholder-Related Directors receive an annual retainer of $90,000, an increase from $75,000 in previous fiscal years, as compensation for service as a director of the Company and as a member of any committees of the Board of the Company and the board of any subsidiary of the
187
Table of Contents
Company, if applicable. Each director receives additional compensation of $1,500 for each Board meeting attended, and $1,000 for each committee or subsidiary board meeting attended, not to exceed $2,000 if multiple meetings are attended on any given day. In recognition of the additional duties and responsibilities attendant with such positions, the Chairman of the Board receives additional annual compensation of $50,000, an increase from $25,000 in previous fiscal years, the 1st and 2nd Vice-Chairmen receive additional annual compensation of $3,000 each, the chairman of the Audit Committee receives additional annual compensation of $30,000, an increase from $10,000 in previous fiscal years, the chairmen of the Compensation Committee and the Governance Committee receive additional annual compensation of $10,000, an increase from $5,000 in previous fiscal years, each and the chairmen of other committees receive additional annual compensation of $1,000 each. In addition, directors are reimbursed for Company related expenses.
Mr. Laverty has been engaged by the Company as a consultant, outside of his normal Board responsibilities, to assist the Company in support of a strategic planning project under the direction of the Board reporting to Mr. Ling. Mr. Laverty may receive compensation up to $120,000 per year pursuant to the letter agreement dated as of December 7, 2015. The letter agreement stipulates that the consulting engagement may be terminated by either party, without cause, by providing written notice not less than ten (10) days prior or the agreement may be terminated for cause. During fiscal year 2015, Mr. Laverty received payment of $120,000 for such services.
Directors are eligible to participate in the Company’s Amended and Restated Deferred Compensation Plan described above.
Compensation Paid to Directors in Fiscal 2015
The following table sets forth the compensation paid to our non-employee directors in fiscal 2015.
| Name | Fees Earned or paid in Cash ($)(1) |
Stock Awards ($) |
Option Awards ($) |
Non-Equity Incentive Plan Compensation ($) |
Changes in Pension Value and Nonqualified Deferred Compensation Earnings |
All Other Compensation ($) |
Total ($) | |||||||||||||||||||||
| Bradley Alford |
114,500 | — | — | — | — | — | 114,500 | |||||||||||||||||||||
| Louis A. Amen |
31,000 | — | — | — | — | — | 31,000 | |||||||||||||||||||||
| John Berberian |
31,000 | — | — | — | — | — | 31,000 | |||||||||||||||||||||
| Vache Fermanian |
24,500 | — | — | — | — | — | 24,500 | |||||||||||||||||||||
| Oscar Gonzalez |
46,500 | — | — | — | — | — | 46,500 | |||||||||||||||||||||
| Richard E. Goodspeed |
177,500 | — | — | — | — | — | 177,500 | |||||||||||||||||||||
| Paul Kapioski |
37,500 | — | — | — | — | — | 37,500 | |||||||||||||||||||||
| Darioush Khaledi |
34,000 | — | — | — | — | — | 34,000 | |||||||||||||||||||||
| Mark Kidd |
30,000 | — | — | — | — | — | 30,000 | |||||||||||||||||||||
| John D. Lang |
150,000 | — | — | — | — | — | 150,000 | |||||||||||||||||||||
| Roger M. Laverty |
114,500 | — | — | — | — | 120,000 | 234,500 | |||||||||||||||||||||
| Jay T. McCormack |
39,500 | — | — | — | — | — | 39,500 | |||||||||||||||||||||
| G. Robert McDougall |
22,000 | 22,000 | ||||||||||||||||||||||||||
| John Najjar |
31,000 | — | — | — | — | — | 31,000 | |||||||||||||||||||||
| Greg Saar |
23,000 | 23,000 | ||||||||||||||||||||||||||
| Thomas S. Sayles |
121,500 | — | — | — | — | — | 121,500 | |||||||||||||||||||||
| Mimi R. Song |
27,500 | — | — | — | — | — | 27,500 | |||||||||||||||||||||
| Michael S. Trask |
32,500 | — | — | — | — | — | 32,500 | |||||||||||||||||||||
| Kenneth Ray Tucker |
36,500 | — | — | — | — | — | 36,500 | |||||||||||||||||||||
| Richard L. Wright |
45,500 | — | — | — | — | — | 45,500 | |||||||||||||||||||||
| (1) | Amounts include compensation that was deferred by the directors pursuant to the Company’s Amended and Restated Deferred Compensation Plan as discussed above. |
188
Table of Contents
Item 12. SECURITY OWNERSHIP OF CERTAIN BENEFICIAL OWNERS AND MANAGEMENT AND RELATED STOCKHOLDER MATTERS
As of April 2, 2016, no person was known by the Company to own beneficially more than five percent (5%) of the outstanding Class A Shares of the Company, and the only shareholder known by the Company to own beneficially more than 5% of the outstanding Class B Shares of the Company is as set forth in the table below.
| Title of Class | Name and Address of Beneficial Owner | Amount of Ownership |
% of Class |
|||||||
| Class B |
Mimi R. Song Super Center Concepts, Inc. 15510 Carmenita Road Santa Fe Springs, CA 90620 |
25,286 | 6.26% | |||||||
The following table sets forth the beneficial ownership of the Company’s Class A Shares, Class B Shares and Class E Shares, as of April 2, 2016, by each Shareholder-Related Director nominee and his or her affiliated companies, and by all Shareholder-Related Directors and their affiliated companies, as a group. Non-Shareholder-Related Directors and officers of the Company do not own any class of the Company’s stock.
| Shares Owned | ||||||||||||||||||||||||
| Class A Shares | Class B Shares | Class E Shares | ||||||||||||||||||||||
| Name and Affiliated Company * |
No. of Shares |
% of Total Outstanding |
No. of Shares |
% of Total Outstanding |
No. of Shares |
% of Total Outstanding |
||||||||||||||||||
| Bradley Alford (3) |
0 | 0.00 | % | 0 | 0.00 | % | 0 | 0.00 | % | |||||||||||||||
| Louis A. Amen |
350 | 0.29 | % | 12,287 | 3.04 | % | 1,470 | 1.20 | % | |||||||||||||||
| John Berberian |
350 | 0.29 | % | 8,572 | 2.12 | % | 1,934 | 1.58 | % | |||||||||||||||
| Vache Fermanian |
350 | 0.29 | % | 3,057 | 0.76 | % | 254 | 0.21 | % | |||||||||||||||
| Oscar Gonzalez (1) (2) |
350 | 0.29 | % | 12,785 | 3.17 | % | 2,983 | 2.43 | % | |||||||||||||||
| Richard E. Goodspeed (3) |
0 | 0.00 | % | 0 | 0.00 | % | 0 | 0.00 | % | |||||||||||||||
| Paul Kapioski |
350 | 0.29 | % | 25 | 0.01 | % | 38 | 0.03 | % | |||||||||||||||
| Darioush Khaledi (1) |
350 | 0.29 | % | 16,395 | 4.06 | % | 2,491 | 2.03 | % | |||||||||||||||
| Mark Kidd |
350 | 0.29 | % | 2,907 | 0.72 | % | 563 | 0.46 | % | |||||||||||||||
| John D. Lang (3) |
0 | 0.00 | % | 0 | 0.00 | % | 0 | 0.00 | % | |||||||||||||||
| Roger M. Laverty (3) |
0 | 0.00 | % | 0 | 0.00 | % | 0 | 0.00 | % | |||||||||||||||
| Jay T. McCormack (4) |
350 | 0.29 | % | 5,146 | 1.27 | % | 634 | 0.52 | % | |||||||||||||||
| Robert G. McDougall (5) |
350 | 0.29 | % | 9,923 | 2.46 | % | 4,936 | 4.03 | % | |||||||||||||||
| John Najjar |
350 | 0.29 | % | 238 | 0.06 | % | 163 | 0.13 | % | |||||||||||||||
| Greg Saar |
350 | 0.29 | % | 107 | 0.03 | % | 167 | 0.14 | % | |||||||||||||||
| Thomas S. Sayles (3) |
0 | 0.00 | % | 0 | 0.00 | % | 0 | 0.00 | % | |||||||||||||||
| Mimi R. Song (1) Super Center Concepts, Inc. |
350 | 0.29 | % | 25,286 | 6.26 | % | 12,006 | 9.80 | % | |||||||||||||||
189
Table of Contents
| Shares Owned | ||||||||||||||||||||||||
| Class A Shares | Class B Shares | Class E Shares | ||||||||||||||||||||||
| Name and Affiliated Company * |
No. of Shares |
% of Total Outstanding |
No. of Shares |
% of Total Outstanding |
No. of Shares |
% of Total Outstanding |
||||||||||||||||||
| Michael S. Trask Stanlar Foods, Inc. |
350 | 0.29 | % | 17 | 0.00 | % | 26 | 0.02 | % | |||||||||||||||
| Kenneth R. Tucker Evergreen Markets, Inc. |
350 | 0.29 | % | 267 | 0.07 | % | 79 | 0.06 | % | |||||||||||||||
| Richard L. Wright Market of Choice, Inc. |
350 | 0.29 | % | 3,122 | 0.77 | % | 448 | 0.37 | % | |||||||||||||||
|
|
||||||||||||||||||||||||
| All directors and their affiliated companies as a group |
5,250 | 4.30 | % | 100,134 | 24.80 | % | 28,192 | 23.01 | % | |||||||||||||||
|
|
||||||||||||||||||||||||
| (1) | Elected by Class B Shareholders. |
| (2) | Mr. Gonzalez is a shareholder and officer of a family-owned corporation. |
| (3) | Non-Shareholder-Related Director. |
| (4) | Shares owned by RRM LLC, parent corporation of Rio Ranch Markets. Mr. McCormack disclaims beneficial ownership of these shares. |
| (5) | Shares owned by Arden-Mayfair Inc., parent corporation of Gelson’s Markets. Mr.McDougall disclaims beneficial ownership of these shares. |
Item 13. CERTAIN RELATIONSHIPS AND RELATED TRANSACTIONS, AND DIRECTOR INDEPENDENCE
Entities with which our directors are affiliated, as Members of Unified, purchase groceries and related products and services from us in the ordinary course of business pursuant to published terms or according to the provisions of individually negotiated supply agreements. As Members, firms with which directors are affiliated may receive various benefits including patronage dividends, allowances and retail support services. We make a variety of benefits available to Members on a negotiated basis. We have provided to our Members loan financing in the form of direct loans and loan guarantees; provided lease guarantees and subleases; as well as invested directly in Members who are sometimes affiliated with our directors. In addition, we may also enter into other agreements with Members which are affiliated with our directors, as well as agreements with our executive officers. See Note 20 of Notes to Consolidated Financial Statements in Part II, Item 8, “Financial Statements and Supplementary Data,” which is incorporated herein by this reference, for a description of related party transactions.
Item 14. PRINCIPAL ACCOUNTANT FEES AND SERVICES
Pursuant to its charter, the Audit Committee is responsible for appointing the Company’s independent registered public accounting firm. For fiscal 2014, 2015 and 2016, the Audit Committee appointed Moss Adams LLP to serve in this capacity. Prior to fiscal 2014 and during the first half of fiscal 2014, the Audit Committee appointed Deloitte & Touche, LLP to serve in this capacity. There are no unresolved disagreements with Deloitte & Touche, LLP. The Audit Committee has not yet selected the Company’s independent registered public accounting firm for fiscal 2017. A representative of Moss Adams LLP will be present at the Annual Meeting and will have the opportunity to make a statement if such representative desires to do so and will also be available to answer appropriate questions from shareholders.
Moss Adams LLP has provided audit services related to fiscal 2013. Approximately $1.5 million in fees related to those audit services were incurred in fiscal 2016.
190
Table of Contents
The aggregate fees billed to the Company by Moss Adams LLP with respect to services performed for fiscal 2014 and 2015 are as follows:
| 2015 | 2014 | |||||||
| Audit fees (1) |
$ | 1,200,000 | $ | 850,000 | ||||
| Audit-related fees (2) |
— | — | ||||||
| Tax fees (3) |
— | — | ||||||
| All other fees (4) |
— | — | ||||||
|
|
||||||||
| Total |
$ | 1,200,000 | $ | 850,000 | ||||
|
|
||||||||
| (1) | Audit fees consisted of fees billed by Moss Adams LLP for professional services rendered for the audit of the Company’s annual financial statements and for reviews of the financial statements for fiscal 2014 and 2015. |
| (2) | Audit-related fees consisted of fees billed by Moss Adams LLP for services rendered to the Company for SEC registration statement review, services reasonably related to the performance of the audit or review of our financial statements and that are not reported as audit fees, and technical accounting assistance for fiscal 2015 and 2014. No fees were paid to Moss Adams for audit-related items in either fiscal 2015 or 2014. |
| (3) | Tax fees consisted principally of fees billed by Moss Adams LLP for assistance relating to tax compliance and reporting for fiscal 2015 and 2014. No fees were paid to Moss Adams for tax items in either fiscal 2015 or 2014. |
| (4) | All other fees consist of fees not reported as audit fees, audit-related fees, or tax fees. No other fees were paid to Moss Adams in either fiscal 2015 or 2014. |
The aggregate fees billed to the Company by Deloitte & Touch, LLP with respect to services performed for fiscal 2014 and 2015 are as follows:
| 2015 | 2014 | |||||||
| Audit fees (1) |
$ | — | $ | 1,047,950 | ||||
| Audit-related fees (2) |
— | 29,200 | ||||||
| Tax fees (3) |
— | — | ||||||
| All other fees (4) |
240,652 | — | ||||||
|
|
||||||||
| Total |
$ | 240,652 | $ | 1,077,150 | ||||
|
|
||||||||
| (1) | Audit fees consisted of fees billed by Deloitte & Touche LLP for professional services rendered for the audit of the Company’s annual financial statements and for reviews of the financial statements included in the Company’s Quarterly Reports on Form 10-Q for fiscal 2014. No fees were paid to Deloitte & Touche LLP for audit-related items in fiscal 2015. |
| (2) | Audit-related fees consisted of fees billed by Deloitte & Touche LLP for services rendered to the Company for SEC registration statement review, services reasonably related to the performance of the audit or review of our financial statements and that are not reported as audit fees, and technical accounting assistance for fiscal 2015 and 2014. No fees were paid to Deloitte & Touche LLP for audit-related items in fiscal 2015. |
| (3) | Tax fees consisted principally of fees billed by Deloitte & Touche LLP for assistance relating to tax compliance and reporting for fiscal 2015 and 2014. No fees were paid to Deloitte & Touche LLP for audit-related items in either fiscal 2015 or 2014. |
| (4) | All other fees consist of fees not reported as audit fees, audit-related fees, or tax fees. No fees were paid to Deloitte & Touche LLP for audit-related items in fiscal 2014. Fees paid to Deloitte & Touche LLP during fiscal 2015 were related to the Audit Committee Investigation. |
The Audit Committee, pursuant to its policies, administers the Company’s engagement of Moss Adams LLP, previously Deloitte & Touche LLP, and pre-approves all audit and permissible non-audit services on a case-by-case basis. In approving non-audit services, the Audit Committee considers whether the engagement could compromise the independence of Moss Adams LLP, and whether for reasons of efficiency or convenience it is in the best interest of the Company to engage its independent registered public accounting firm to perform the services. The Audit Committee, in reliance on management and the independent registered public accounting firm, has determined that the provision of these services is compatible with maintaining the independence of Moss Adams LLP.
191
Table of Contents
Prior to engagement, the Audit Committee pre-approves all independent registered public accounting firm services. The fees are budgeted and the Audit Committee requires the independent registered public accounting firm and management to report actual fees versus budget periodically throughout the year by category of service. During the year, circumstances may arise when it may become necessary to engage the independent registered public accounting firm for additional services not contemplated in the original pre-approval categories. In those instances, the Audit Committee requires specific pre-approval before engaging the independent registered public accounting firm on any service activity.
The Audit Committee may delegate pre-approval authority to one or more of its members. The member to whom such authority is delegated must report, for informational purposes only, any pre-approval decisions to the Audit Committee at its next scheduled meeting.
Part IV
Item 15. EXHIBITS AND FINANCIAL STATEMENT SCHEDULES
(a) (1) and (2) Financial Statements and Financial Statement Schedule
Our consolidated financial statements, the notes thereto, and the related report thereon of the independent registered public accounting firm are filed under Part II, Item 8 of this report. The financial statement schedule is filed herein and the related report thereon of the independent registered public accounting firm is filed under Part II, Item 8 of this report.
(a) (1) Consolidated Financial Statements:
| · | Report of Independent Registered Public Accounting Firm. |
| · | Consolidated Balance Sheets as of October 3, 2015 and September 27, 2014. |
| · | Consolidated Statements of Earnings (Loss) for the fiscal years ended October 3, 2015, September 27, 2014 and September 28, 2013. |
| · | Consolidated Statements of Comprehensive Earnings (Loss) for the fiscal years ended October 3, 2015, September 27, 2014 and September 28, 2013. |
| · | Consolidated Statements of Shareholders’ Equity for the fiscal years ended October 3, 2015, September 27, 2014 and September 28, 2013. |
| · | Consolidated Statements of Cash Flows for the fiscal years ended October 3, 2015, September 27, 2014 and September 28, 2013. |
| · | Notes to Consolidated Financial Statements. |
(2) Financial Statement Schedule:
| · | Schedule II—Valuation and Qualifying Accounts for the fiscal years ended October 3, 2015, September 27, 2014 and September 28, 2013. |
All other financial statement schedules for which provision is made in the applicable accounting regulations of the SEC are not required under the instructions to Part II, Item 8 or are inapplicable and therefore have been omitted.
(3) Exhibits:
See Item 15 (b) below.
192
Table of Contents
| (b) | Exhibits |
The following documents are filed as part of this Annual Report on Form 10-K:
| Exhibit No. |
Description | |
| 3.1 | Amended and Restated Articles of Incorporation of Unified Grocers, Inc., as amended (incorporated by reference to Exhibit 3.1 to the Company’s Quarterly Report on Form 10-Q for the fiscal quarter ended March 29, 2008, filed on May 13, 2008). | |
| 3.2 | Bylaws of Unified Grocers, Inc., as amended (incorporated by reference to Exhibit 3.2 to the Company’s Annual Report on Form 10-K for the fiscal year ended October 1, 2011, filed on December 9, 2011). | |
| 4.1 | Retail Grocer Application and Agreement for Continuing Service Affiliation with Unified Grocers, Inc. and Pledge Agreement (incorporated by reference to Exhibit 4.7 to Amendment No. 2 to Form S-1 Registration Statement of the Company, filed on December 31, 1981, File No. 2-70069). | |
| 4.2 | Retail Grocer Application and Agreement for Service Affiliation with and the Purchase of Shares of Unified Grocers, Inc. and Pledge Agreement (incorporated by reference to Exhibit 4.2 to Post-Effective Amendment No. 7 to Form S-2 Registration Statement of the Company, filed on December 13, 1989, File No. 33-19284). | |
| 4.3 | Copy of Application and Agreement for Service Affiliation as a Member-Patron/Affiliate with Unified Grocers, Inc. and Pledge and Security Agreement (incorporated by reference to Exhibit 4.1 to the Company’s Quarterly Report on Form 10-Q for the fiscal quarter ended April 1, 2000). | |
| 4.4 | Subordination Agreement (Member-Patron-1988) (incorporated by reference to Exhibit 4.4 to Post-Effective Amendment No. 4 to Form S-2 Registration Statement of the Company, filed on July 15, 1988, File No. 33-19284). | |
| 4.5 | Subordination Agreement (New Member-Patron-1988) (incorporated by reference to Exhibit 4.6 to Post-Effective Amendment No. 4 to Form S-2 Registration Statement of the Company, filed on July 15, 1988, File No. 33-19284). | |
| 4.6 | Copy of Member Patron/Affiliate Subordination Agreement (Subordination of Required Deposit) (incorporated by reference to Exhibit 4.10 to the Company’s Annual Report on Form 10-K for the fiscal year ended September 29, 2001, filed on December 27, 2001). | |
| 4.7 | Form of Pledge and Security Agreement (effective July, 2008) (incorporated by reference to Exhibit 4.41.1 to the Company’s Quarterly Report on Form 10-Q for the fiscal quarter ended on June 28, 2008, filed on August 12, 2008). | |
| 4.8 | Form of Member Subordination (effective July, 2008) (incorporated by reference to Exhibit 4.42.1 to the Company’s Quarterly Report on Form 10-Q for the fiscal quarter ended on June 28, 2008, filed on August 12, 2008). | |
| 4.9 | Form of Continuing Guaranty (effective July, 2008) (incorporated by reference to Exhibit 4.43.1 to the Company’s Quarterly Report on Form 10-Q for the fiscal quarter ended on June 28, 2008, filed on August 12, 2008). | |
| 4.90 | Form of Class A Share Certificate (incorporated by reference to Exhibit 4.12 to the Company’s Annual Report on Form 10-K for the fiscal year ended September 30, 2000, filed on December 26, 2000). | |
| 4.91 | Form of Class B Share Certificate (incorporated by reference to Exhibit 4.13 to the Company’s Annual Report on Form 10-K for the fiscal year ended September 30, 2000, filed on December 26, 2000). | |
| 4.92 | Agreement respecting directors’ shares (incorporated by reference to Exhibit 4.9 to Amendment No. 2 to Form S-1 Registration Statement of the Company, filed on December 31, 1981, File No. 2-70069). | |
| 4.93 | Form of Class E Share Certificate (incorporated by reference to Exhibit 4.37 to the Company’s Registration Statement on Form S-1, filed on January 31, 2006, File No. 333-131414). | |
193
Table of Contents
| Exhibit No. |
Description | |
| 10.1** | Form of Indemnification Agreement between Unified Grocers, Inc. and each Director and Officer (incorporated by reference to Exhibit 10.20.1 to the Company’s Quarterly Report on Form 10-Q for the fiscal quarter ended June 30, 2007, filed on August 14, 2007). | |
| 10.1.1** | Form of Indemnification Agreement between the Company and each Director and Officer, dated as of December 28, 2015 (incorporated by reference to Exhibit 99.5 to the Company’s Current Report on Form 8-K, filed on December 30, 2015). | |
| 10.2** | Amended and Restated Severance Agreement for the Company President and Chief Executive Officer dated as of August 7, 2013, between Unified Grocers, Inc. and Robert M. Ling, Jr. (incorporated by reference to Exhibit 99.1 to the Company’s Quarterly Report on Form 10-Q for the fiscal quarter ended June 29, 2013, filed on August 7, 2013). | |
| 10.3** | Form of Severance Agreement for Vice Presidents, Senior Vice Presidents and Executive Vice Presidents with Less Than Three Years in an Officer Position dated as of December 30, 2010, executed by John C. Bedrosian, Dirk T. Davis, Joseph L. Falvey, Gary C. Hammett, Gary S. Herman, Robert E. Lutz, Daniel J. Murphy, Christine Neal, Joseph A. Ney, Randall G. Scoville and Rodney L. Van Bebber (incorporated by reference to Exhibit 10.73 to Post-Effective Amendment No. 2 to Form S-1 Registration Statement of the Company, filed on January 12, 2011, File No. 333-156519). | |
| 10.4** | Form of Severance Agreement for Executive Vice Presidents with Three Years or More in an Officer Position dated as of August 7, 2013 (incorporated by reference to Exhibit 99.2 to the Company’s Quarterly Report on Form 10-Q for the fiscal quarter ended June 29, 2013, filed on August 7, 2013). | |
| 10.5** | Amended and Restated Unified Grocers, Inc. Deferred Compensation Plan dated as of May 1, 1999 (incorporated by reference to Exhibit 10.2 to the Company’s Annual Report on Form 10-K for the fiscal year ended August 28, 1999, filed on November 14, 1999). | |
| 10.5.1** | Amendment No. 1 to Amended and Restated Unified Grocers, Inc. Deferred Compensation Plan, amended as of October 19, 2007 (incorporated by reference to Exhibit 10.2.1 to the Company’s Annual Report on Form 10-K for the fiscal year ended September 29, 2007, filed on December 13, 2007). | |
| 10.6** | Unified Grocers, Inc. Deferred Compensation Plan II, Master Plan, dated as of September 26, 2008, effective January 1, 2005 (incorporated by reference to Exhibit 10.30 to the Company’s Annual Report on Form 10-K for the fiscal year ended September 27, 2008, filed on December 12, 2008). | |
| 10.6.1** | Amendment No. 1 to Unified Grocers, Inc. Deferred Compensation Plan II, effective as of January 1, 2011, amended as of September 9, 2010 (incorporated by reference to Exhibit 10.30.1 to the Company’s Annual Report on Form 10-K for the fiscal year ended October 2, 2010, filed on December 10, 2010). | |
| 10.7** | Unified Grocers, Inc. Executive Salary Protection Plan III, Master Plan Document, dated as of September 26, 2008, effective January 1, 2005 (incorporated by reference to Exhibit 10.36 to the Company’s Annual Report on Form 10-K for the fiscal year ended September 27, 2008, filed on December 12, 2008). | |
| 10.7.1** | Amendment No. 1 to Unified Grocers, Inc. Executive Salary Protection Plan III, amended as of December 31, 2012 (incorporated by reference to Exhibit 99.1 to the Company’s Current Report on Form 8-K, filed on January 7, 2013). | |
| 10.7.2** | Amendment No. 2 to Unified Grocers, Inc. Executive Salary Protection Plan III, amended as of August 7, 2013 (incorporated by reference to Exhibit 99.3 to the Company’s Quarterly Report on Form 10-Q for the fiscal quarter ended June 29, 2013, filed on August 7, 2013). | |
| 10.8** | Comprehensive Amendment to Unified Grocers, Inc. Employees’ Excess Benefit Plan dated as of December 5, 1995 (incorporated by reference to Exhibit 10.7 to the Company’s Annual Report on Form 10-K for the fiscal year ended August 30, 1997, filed on November 28, 1997). | |
194
Table of Contents
| Exhibit No. |
Description | |
| 10.9** | Unified Grocers, Inc. Executive Insurance Plan Split dollar Agreement and Schedule of Executive Officers party thereto (incorporated by reference to Exhibit 10.6 to the Company’s Annual Report on Form 10-K for the fiscal year ended September 2, 1995, filed on December 1, 1995). | |
| 10.9.1** | Amendment No. 1 to Unified Grocers, Inc. Executive Insurance Plan, amended as of December 31, 2012 (incorporated by reference to Exhibit 99.2 to the Company’s Current Report on Form 8-K, filed on January 7, 2013). | |
| 10.9.2** | Unified Grocers, Inc. Executive Insurance Plan Amended and Restated Split Dollar Agreement, dated as of May 14, 2013, effective June 1, 2013 (incorporated by reference to Exhibit 99.3 to the Company’s Current Report on Form 8-K, filed on May 14, 2013). | |
| 10.10** | Unified Grocers, Inc. Executive Medical Reimbursement Plan, dated as of January 1, 2011 (incorporated by reference to Exhibit 10.78 to the Company’s Annual Report on Form 10-K for the fiscal year ended October 1, 2011, filed on December 9, 2011). | |
| 10.11** | Unified Grocers, Inc. Officer Retiree Medical Plan Document and Summary Plan Description, effective October 1, 2011 (incorporated by reference to Exhibit 10.78 to the Company’s Annual Report on Form 10-K for the fiscal year ended October 1, 2011, filed on December 9, 2011). | |
| 10.11.1** | Amendment No. 1 to Unified Grocers, Inc. Officer Retiree Medical Plan, amended as of December 31, 2012 (incorporated by reference to Exhibit 99.3 to the Company’s Current Report on Form 8-K, filed on January 7, 2013). | |
| 10.11.2** | Addendum to Unified Grocers, Inc. Officer Retiree Medical Plan, amended as of May 31, 2013 (incorporated by reference to Exhibit 99.1 to the Company’s Quarterly Report on Form 10-Q for the fiscal quarter ended December 28, 2013, filed on February 5, 2014). | |
| 10.12** | Unified Grocers, Inc. Officer Retiree Health Reimbursement Arrangement, effective June 1, 2013 (incorporated by reference to Exhibit 99.2 to the Company’s Quarterly Report on Form 10-Q for the fiscal quarter ended December 28, 2013, filed on February 5, 2014). | |
| 10.13** | Unified Grocers, Inc. Long-Term Incentive Plan, dated as of May 14, 2013, effective June 1, 2013 (incorporated by reference to Exhibit 99.1 to the Company’s Current Report on Form 8-K, filed on May 14, 2013). | |
| 10.13.1** | Long-Term Incentive Plan, as amended and restated effective October 4, 2015, dated as of December 28, 2015 (incorporated by reference to Exhibit 99.4 to the Company’s Current Report on Form 8-K, filed on December 30, 2015). | |
| 10.14** | Amended and Restated Unified Grocers, Inc. Cash Balance Plan, generally effective January 1, 2010, as amended (incorporated by reference to Exhibit 10.75 to the Company’s Quarterly Report on Form 10-Q for the fiscal quarter ended April 2, 2011, filed on May 17, 2011). | |
| 10.14.1** | Amendment No. 1 to Unified Grocers, Inc. Cash Balance Plan, amended as of November 29, 2011 (incorporated by reference to Exhibit 10.75.1 to the Company’s Annual Report on Form 10-K for the fiscal year ended October 1, 2011, filed on December 9, 2011). | |
| 10.14.2** | Amendment No. 2 to Unified Grocers, Inc. Cash Balance Plan, amended as of December 31, 2012 (incorporated by reference to Exhibit 99.4 to the Company’s Current Report on Form 8-K, filed on January 7, 2013). | |
| 10.14.3** | Amendment No. 3 to Unified Grocers, Inc. Cash Balance Plan, amended as of December 31, 2012 (incorporated by reference to Exhibit 99.5 to the Company’s Current Report on Form 8-K, filed on January 7, 2013). | |
| 10.14.4** | Amendment No. 4 to Unified Grocers, Inc. Cash Balance Plan, amended as of May 30, 2014 (incorporated by reference to Exhibit 99.1 to the Company’s Current Report on Form 8-K, filed on June 5, 2014). | |
| 10.15** | Amended and Restated Unified Grocers, Inc. Employee Savings Plan, effective January 1, 2010, except as otherwise provided (incorporated by reference to Exhibit 10.76 to the Company’s Quarterly Report on Form 10-Q for the fiscal quarter ended April 2, 2011, filed on May 17, 2011). | |
195
Table of Contents
| Exhibit No. |
Description | |
| 10.15.1** | Amendment No. 1 to Unified Grocers, Inc. Employees Savings Plan, amended as of March 17, 2011 (incorporated by reference to Exhibit 10.76.1 to the Company’s Quarterly Report on Form 10-Q for the fiscal quarter ended April 2, 2011, filed on May 17, 2011). | |
| 10.15.2** | Amendment No. 2 to Unified Grocers, Inc. Employees Savings Plan, amended as of May 7, 2011 (incorporated by reference to Exhibit 10.3 to the Company’s Quarterly Report on Form 10-Q for the fiscal quarter ended June 30, 2012, filed on August 14, 2012). | |
| 10.16** | Amended and Restated Unified Grocers, Inc. Sheltered Savings Plan, effective January 1, 2010, except as otherwise provided (incorporated by reference to Exhibit 10.77 to the Company’s Quarterly Report on Form 10-Q for the fiscal quarter ended April 2, 2011, filed on May 17, 2011). | |
| 10.16.1** | Amendment No. 1 to Unified Grocers, Inc. Sheltered Savings Plan, amended as of March 17, 2011 (incorporated by reference to Exhibit 10.77.1 to the Company’s Quarterly Report on Form 10-Q for the fiscal quarter ended April 2, 2011, filed on May 17, 2011). | |
| 10.17** | Unified Grocers, Inc. Supplemental Executive Retirement Plan, dated as of May 14, 2013, effective June 1, 2013 (incorporated by reference to Exhibit 99.2 to the Company’s Current Report on Form 8-K, filed on May 14, 2013). | |
| 10.18 | Promissory Note dated December 6, 2000, due on demand in favor of Grocers Capital Company by Daniel J. Murphy and Debra A. Murphy (incorporated by reference to Exhibit 10.46 to the Company’s Annual Report on Form 10-K for the fiscal year ended September 27, 2003, filed on December 16, 2003). | |
| 10.19 | Amended and Restated Note Purchase Agreement, effective January 6, 2006, by and among Unified Grocers, Inc. and the Noteholders listed on the signature pages thereto (incorporated by reference to Exhibit 4.1 to the Company’s Current Report on Form 8-K, filed on January 11, 2006). | |
| 10.19.1 | Amendment to Note Purchase Agreement and Consent, dated as of December 19, 2006, by and among Unified Grocers, Inc., John Hancock Life Insurance Company as collateral agent for the Noteholders and the Noteholders under the Amended and Restated Note Purchase Agreement listed on the signature pages thereto (incorporated by reference to Exhibit 4.40 to the Company’s Quarterly Report on Form 10-Q for the fiscal quarter ended December 30, 2006, filed on February 13, 2007). | |
| 10.19.2 | Second Amendment to Note Purchase Agreement, dated as of November 7, 2008, by and among Unified Grocers, Inc. and the Noteholders listed on the signature page thereto (incorporated by reference to Exhibit 10.7.2 to the Company’s Annual Report on Form 10-K for the fiscal year ended September 27, 2008, filed on December 12, 2008). | |
| 10.19.3 | Third Amendment to Note Purchase Agreement, dated as of November 3, 2009, by and among Unified Grocers, Inc. and the Noteholders listed on the signature page thereto (incorporated by reference to Exhibit 10.1 to the Company’s Current Report on Form 8-K, filed on November 9, 2009). | |
| 10.19.4 | Fourth Amendment to Note Purchase Agreement, dated as of June 29, 2012, by and among Unified Grocers, Inc. and the Noteholders listed on the signature page thereto (incorporated by reference to Exhibit 10.2 to the Company’s Quarterly Report on Form 10-Q for the fiscal quarter ended June 30, 2012, filed on August 14, 2012). | |
| 10.19.5 | Fifth Amendment to Note Purchase Agreement, dated as of December 26, 2012, by and among Unified Grocers, Inc. and the Noteholders listed on the signature page thereto (incorporated by reference to Exhibit 99.1 to the Company’s Current Report on Form 8-K, filed on December 31, 2012). | |
| 10.19.6 | Sixth Amendment to Note Purchase Agreement, dated as of March 27, 2013, by and among Unified Grocers, Inc. and the Noteholders listed on the signature page thereto (incorporated by reference to Exhibit 99.1 to the Company’s Current Report on Form 8-K, filed on March 29, 2013). | |
| 10.19.7 | Seventh Amendment to Amended and Restated Note Purchase Agreement, dated as of June 28, 2013, by and among Unified Grocers, Inc., the Noteholders listed on the signature page thereto and John Hancock Life Insurance Company (U.S.A.), as collateral agent (incorporated by reference to Exhibit 99.5 to the Company’s Current Report on Form 8-K, filed on July 3, 2013). | |
196
Table of Contents
| Exhibit No. |
Description | |
| 10.20 | Amended and Restated Credit Agreement, dated as of June 28, 2013, by and among Unified Grocers, Inc., the lenders party thereto, and Wells Fargo Bank, National Association, as Administrative Agent (incorporated by reference to Exhibit 99.1 to the Company’s Current Report on Form 8-K, filed on July 3, 2013). | |
| 10.20.1 | Consent and Agreement, dated as of October 09, 2013, by and among Unified Grocers, Inc., the lenders party thereto, and Wells Fargo Bank, National Association, as administrative agent (incorporated by reference to Exhibit 99.1 to the Company’s Current Report on Form 8-K, filed on October 15, 2013). | |
| 10.20.2 | First Amendment and Consent, dated as of June 27, 2014, by and among Unified Grocers, Inc., the lenders party thereto, and Wells Fargo Bank, National Association, as administrative agent, modifying the Company’s Amended and Restated Credit Agreement dated as of June 28, 2013 (incorporated by reference to Exhibit 99.2 to the Company’s Current Report on Form 8-K, filed on July 2, 2014). | |
| 10.20.3 | Second Amendment, Consent and Lender Joinder, dated as of December 18, 2014, by and among Unified Grocers, Inc., the Lenders party thereto, and Wells Fargo Bank, National Association, as administrative agent (incorporated by reference to Exhibit 99.1 to the Company’s Current Report on Form 8-K, filed on December 19, 2014). | |
| 10.20.4 | Consent, dated as of June 26, 2015, by and among Unified Grocers, Inc., the lenders party thereto, and Wells Fargo Bank, National Association, as administrative agent (incorporated by reference to Exhibit 99.1 to the Company’s Current Report on Form 8-K, filed on July 2, 2015). | |
| 10.20.5 | Consent, dated as of December 28, 2015, by and among Unified Grocers, Inc., the lenders party thereto, and Wells Fargo Bank, National Association, as administrative agent (incorporated by reference to Exhibit 99.1 to the Company’s Current Report on Form 8-K, filed on December 30, 2015). | |
| 10.21 | Amended and Restated Subsidiary Guaranty, dated as of June 28, 2013, by and among Crown Grocers, Inc., Market Centre and Unified International, Inc. in favor of Wells Fargo Bank, National Association, as agent for and representative of the Lenders described therein and other Beneficiaries described therein (incorporated by reference to Exhibit 99.2 to the Company’s Current Report on Form 8-K, filed on July 3, 2013). | |
| 10.21.1 | Amended and Restated Security Agreement, dated as of June 28, 2013, by and among Unified Grocers, Inc., Crown Grocers, Inc., Market Centre, Unified International, Inc. and Wells Fargo Bank, National Association, as Secured Party described therein (incorporated by reference to Exhibit 99.3 to the Company’s Current Report on Form 8-K, filed on July 3, 2013). | |
| 10.22 | Loan and Security Agreement, dated as of September 24, 2010, by and among Grocers Capital Company, the lenders signatory thereto, and California Bank & Trust, as Arranger and Administrative Agent (incorporated by reference to Exhibit 99.4 to the Company’s Current Report on Form 8-K, filed on October 13, 2010). | |
| 10.22.1 | Amendment Number One, dated as of September 19, 2013, to Loan and Security Agreement, dated as of September 24, 2010, by and among Grocers Capital Company, the lenders signatory thereto, and California Bank & Trust, as Arranger and Administrative Agent (incorporated by reference to Exhibit 10.22.1 to the Company’s Annual Report on Form 10-K for the fiscal year ended September 28, 2013, filed on December 13, 2013). | |
| 10.22.2 | Amendment Number Two, dated as of March 12, 2014, to Loan and Security Agreement, dated as of September 24, 2010, by and among Grocers Capital Company, the lenders signatory thereto, and California Bank & Trust, as Arranger and Administrative Agent (incorporated by reference to Exhibit 99.1 to the Company’s Current Report on Form 8-K, filed on March 18, 2014). | |
| 10.22.3 | Amendment Number Three, dated as of June 26, 2014, to Loan and Security Agreement, dated as of September 24, 2010, by and among Grocers Capital Company, the lenders signatory thereto, and California Bank & Trust, as Arranger and Administrative Agent (incorporated by reference to Exhibit 99.1 to the Company’s Current Report on Form 8-K, filed on July 2, 2014). | |
197
Table of Contents
| Exhibit No. |
Description | |
| 10.22.4 | Amended and Restated Loan and Security Agreement, dated as of September 26, 2014, by and among Grocers Capital Company, the lenders signatory thereto, and California Bank & Trust, as Arranger and Administrative Agent (incorporated by reference to Exhibit 99.1 to the Company’s Current Report on Form 8-K, filed on October 2, 2014). | |
| 10.22.5 | Consent dated December 17, 2014 to the Amended and Restated Loan and Security Agreement, dated as of September 26, 2014 (incorporated by reference to Exhibit 99.6 to the Company’s Current Report on Form 8-K, filed on December 19, 2014). | |
| 10.22.6 | Form of Deed of Trust with Assignment of Rents and Fixture Filing dated as of December 18, 2014, by Borrower, as trustor, to Chicago Title Company, as trustee, for the benefit of Administrative Agent, as beneficiary, relating to certain real property located in Santa Fe Springs, Los Angeles County, California (incorporated by reference to Exhibit 99.2 to the Company’s Current Report on Form 8-K, filed on December 19, 2014). | |
| 10.22.7 | Form of Deed of Trust with Assignment of Rents and Fixture Filing dated as of December 18, 2014, by Borrower, as trustor, to Chicago Title Company, as trustee, for the benefit of Administrative Agent, as beneficiary, relating to certain real property located in San Joaquin County, California (incorporated by reference to Exhibit 99.3 to the Company’s Current Report on Form 8-K, filed on December 19, 2014). | |
| 10.22.8 | Form of Deed of Trust with Assignment of Rents and Fixture Filing dated as of December 18, 2014, by Borrower, as trustor, to Chicago Title Company, as trustee, for the benefit of Administrative Agent, as beneficiary, relating to certain real property located in Clackamas County, Oregon (incorporated by reference to Exhibit 99.4 to the Company’s Current Report on Form 8-K, filed on December 19, 2014). | |
| 10.22.9 | First Amendment to Deed of Trust with Assignment of Rents and Fixture Filing dated as of December 18, 2014, by Borrower, as trustor, to Chicago Title Company, as trustee, for the benefit of Administrative Agent, as beneficiary, relating to certain real property located in Commerce and Los Angeles, Los Angeles County, California (incorporated by reference to Exhibit 99.5 to the Company’s Current Report on Form 8-K filed on December 19, 2014). | |
| 10.22.10 | Consent letter dated June 26, 2015, by California Bank & Trust, as arranger and administrative agent, to Grocers Capital Company, relating to the Amended and Restated Loan and Security Agreement, dated as of September 26, 2014, by and among Grocers Capital Company, the lenders that are signatories thereto, and California Bank & Trust, as arranger and administrative agent (incorporated by reference to Exhibit 99.2 to the Company’s Current Report on Form 8-K, filed on July 2, 2015). | |
| 10.22.11 | Amendment Number One to Amended and Restated Loan and Security Agreement, dated as of June 26, 2015, by and among Grocers Capital Company, the lenders that are signatories thereto, and California Bank & Trust, as arranger and administrative agent, which amends the Amended and Restated Loan and Security Agreement, dated as of September 26, 2014, by and among Grocers Capital Company, the lenders that are signatories thereto, and California Bank & Trust, as arranger and administrative agent (incorporated by reference to Exhibit 99.3 to the Company’s Current Report on Form 8-K, filed on July 2, 2015). | |
| 10.22.12 | Consent letter dated December 28, 2015, by and among Grocers Capital Company, the lenders that are signatories thereto, and California Bank & Trust, as arranger and administrative agent (incorporated by reference to Exhibit 99.2 to the Company’s Current Report on Form 8-K, filed on December 30, 2015). | |
| 10.23 | Commercial Lease-Net dated December 6, 1994 between TriNet Essential Facilities XII and Unified Grocers, Inc. (incorporated by reference to Exhibit 10.17 to the Company’s Annual Report on Form 10-K for the fiscal year ended September 2, 1995, filed on December 1, 1995). | |
| 10.23.1 | First Amendment to Lease, dated January 4, 2005, between iStart HQ, L.P. (successor-in-interest landlord) and Unified Grocers, Inc. (incorporated by reference to Exhibit 10.1 to the Company’s Quarterly Report on Form 10-Q for the fiscal quarter ended March 31, 2012, filed on May 15, 2012). | |
198
Table of Contents
| Exhibit No. |
Description | |
| 10.24 | First Amendment to Industrial Real Estate Lease Agreement by and between 3301 South Norfolk, LLC., as Landlord, and Unified Grocers, Inc., as assigned by Associated Grocers, Inc., as Tenant, under Industrial Real Estate Lease Agreement dated April 19, 2007 (incorporated by reference to Exhibit 10.68 to the Company’s Quarterly Report on Form 10-Q for the fiscal quarter ended April 3, 2010, filed on May 14, 2010). | |
| 10.24.1 | Second Amendment to Industrial Real Estate Lease Agreement by and between 3301 South Norfolk, LLC., as Landlord, and Unified Grocers, Inc., formerly Unified Western Grocers, Inc., as assigned by Associated Grocers, Inc., as Tenant, under Industrial Real Estate Lease Agreement dated April 19, 2007 (incorporated by reference to Exhibit 10.68.1 to the Company’s Quarterly Report on Form 10-Q for the fiscal quarter ended January 1, 2011, filed on February 15, 2011). | |
| 10.24.2 | Third Amendment to Industrial Real Estate Lease, dated September 14, 2011, between 3301 South Norfolk, LLC. and Unified Grocers, Inc. (incorporated by reference to Exhibit 10.2 to the Company’s Quarterly Report on Form 10-Q for the fiscal quarter ended March 31, 2012, filed on May 15, 2012). | |
| 10.24.3 | Fourth Amendment to Industrial Real Estate Lease, dated February 8, 2012, between 3301 South Norfolk, LLC. and Unified Grocers, Inc. (incorporated by reference to Exhibit 10.3 to the Company’s Quarterly Report on Form 10-Q for the fiscal quarter ended March 31, 2012, filed on May 15, 2012). | |
| 10.25 | Commercial Lease-Net, dated March 1, 2005, between Atlantic and Sheila, L.P. and Unified Grocers, Inc. (incorporated by reference to Exhibit 10.4 to the Company’s Quarterly Report on Form 10-Q for the fiscal quarter ended March 31, 2012, filed on May 15, 2012). | |
| 10.25.1 | Addendum to Commercial Lease-Net, dated March 1, 2005, between Atlantic and Sheila, L.P. and Unified Grocers, Inc. (incorporated by reference to Exhibit 10.4.1 to the Company’s Quarterly Report on Form 10-Q for the fiscal quarter ended March 31, 2012, filed on May 15, 2012). | |
| 10.26 | Form of Deed of Trust with Assignment of Rents and Fixture Filing, made as of June 28, 2013 by Unified Grocers, Inc., as trustor, in favor of Wells Fargo Bank, National Association, as Administrative Agent for itself and the other Lenders (defined therein), as beneficiary (incorporated by reference to Exhibit 99.4 to the Company’s Current Report on Form 8-K, filed on July 3, 2013). | |
| 10.28** | Unified Grocers, Inc. Officer Annual Incentive Plan (incorporated by reference to Exhibit 99.1 to the Company’s Current Report on Form 8-K filed on December 24, 2014). | |
| 10.28.1** | Unified Grocers, Inc. Officer Annual Incentive Plan, as amended and restated effective October 4, 2015, dated as of December 28, 2015 (incorporated by reference to Exhibit 99.3 to the Company’s Current Report on Form 8-K filed on December 30, 2015). | |
| 10.29 | Stock Purchase Agreement by and between Unified Grocers, Inc. and AmTrust Financial Services, Inc. dated as of April 16, 2015 (incorporated by reference to Exhibit 99.1 to the Company’s Current Report on Form 8-K filed on April 22, 2015). | |
| 10.29.1 | Master Services Agreement by and between Unified Grocers, Inc. and AmTrust Financial Services, Inc. dated as of October 7, 2015 (incorporated by reference to Exhibit 99.2 to the Company’s Current Report on Form 8-K filed on October 14, 2015). | |
| 10.30*,** | Consulting Agreement between Unified Grocers, Inc. and Roger M. Laverty dated as of December 7, 2015. | |
| 10.31* | Transition Agreement between Unified Grocers, Inc. and Richard J. Martin dated as of April 26, 2016. | |
| 14 | Code of Financial Ethics (incorporated by reference to Exhibit 14.1 to the Company’s Annual Report on Form 10-K for the fiscal year ended October 1, 2005, filed on December 21, 2005, File No. 000-10815). | |
| 16.1 | Letter of Deloitte & Touche, LLP to the Securities and Exchange Commission dated May 7, 2014 (incorporated by reference to Exhibit 16.1 to the Company’s Current Report on Form 8-K, filed on May 12, 2014). | |
199
Table of Contents
| Exhibit No. |
Description | |
| 21* | Subsidiaries of the Company. | |
| 31.1* | Certification pursuant to Section 302 of the Sarbanes-Oxley Act of 2002. | |
| 31.2* | Certification pursuant to Section 302 of the Sarbanes-Oxley Act of 2002. | |
| 32.1* | Certification pursuant to Section 906 of the Sarbanes-Oxley Act of 2002. | |
| 32.2* | Certification pursuant to Section 906 of the Sarbanes-Oxley Act of 2002. | |
| 101.INS* | XBRL Instance Document. | |
| 101.SCH* | XBRL Taxonomy Extension Schema Document. | |
| 101.CAL* | XBRL Taxonomy Extension Calculation Linkbase Document. | |
| 101.DEF* | XBRL Taxonomy Extension Definition Linkbase Document. | |
| 101.LAB* | XBRL Taxonomy Extension Label Linkbase Document. | |
| 101.PRE* | XBRL Taxonomy Extension Presentation Linkbase Document. | |
| * | Filed herein. |
| ** | Management contract or compensatory plan or arrangement. |
(c) Financial Statement Schedule:
Schedule II—Valuation and Qualifying Accounts for the fiscal years ended October 3, 2015, September 27, 2014 and September 28, 2013.
200
Table of Contents
Pursuant to the requirements of Section 13 or 15(d) of the Securities Exchange Act of 1934, the registrant has duly caused this report to be signed on its behalf by the undersigned, thereunto duly authorized.
UNIFIED GROCERS, INC.
| By |
/s/ MICHAEL F. HENN | |
| Michael F. Henn | ||
| Executive Vice President and Chief Financial Officer (Duly Authorized Officer and Principal Financial and Accounting Officer) | ||
Dated: June 1, 2016
POWER OF ATTORNEY
KNOW ALL PERSONS BY THESE PRESENTS, that each director whose signature appears below hereby constitutes and appoints each of Robert M. Ling, Jr., President and Chief Executive Officer and Michael F. Henn, Executive Vice President and Chief Financial Officer, his or her true and lawful attorney-in-fact and agent, with full power of substitution, to sign and execute on behalf of the undersigned any and all amendments to this report, and to perform any acts necessary in order to file the same, with all exhibits thereto and other documents in connection therewith with the Securities and Exchange Commission, granting unto said attorney-in-fact and agent full power and authority to do and perform each and every act and thing requested and necessary to be done in connection therewith, as fully to all intents and purposes as he might or could do in person, hereby ratifying and confirming all that said attorney-in-fact and agent, or their or his or her substitutes, shall do or cause to be done by virtue hereof.
Pursuant to the requirements of the Securities Exchange Act of 1934, this report has been signed below by the following persons on behalf of the registrant and in the capacities and on the dates indicated.
| Signature | Title | Date | ||
| /s/ Robert M. Ling, Jr. Robert M. Ling, Jr. |
President and Chief Executive Officer (Principal Executive Officer) | June 1, 2016 | ||
| /s/ Michael F. Henn Michael F. Henn |
Executive Vice President and Chief Financial Officer (Principal Financial and Accounting Officer) |
June 1, 2016 | ||
|
Bradley A. Alford |
Director | |||
| /S/ LOUIS A. AMEN Louis A. Amen |
Director | June 1, 2016 | ||
| /s/ JOHN BERBERIAN John Berberian |
Director | June 1, 2016 | ||
201
Table of Contents
| Signature | Title | Date | ||
| /s/ VACHE FERMANIAN Vache Fermanian |
Director | June 1, 2016 | ||
| /s/ OSCAR GONZALEZ Oscar Gonzalez |
Director | June 1, 2016 | ||
| /s/ RICHARD E. GOODSPEED Richard E. Goodspeed |
Director | June 1, 2016 | ||
| /s/ PAUL KAPIOSKI Paul Kapioski |
Director | June 1, 2016 | ||
| /s/ DARIOUSH KHALEDI Darioush Khaledi |
Director | June 1, 2016 | ||
| /s/ MARK KIDD Mark Kidd |
Director | June 1, 2016 | ||
| /s/ JOHN D. LANG John D. Lang |
Director | June 1, 2016 | ||
| /s/ ROGER M. LAVERTY, III Roger M. Laverty, III |
Director | June 1, 2016 | ||
| /s/ JAY T. MCCORMACK Jay T. McCormack |
Director | June 1, 2016 | ||
| /s/ G. ROBERT MCDOUGALL G. Robert McDougall |
Director | June 1, 2016 | ||
| /s/ JOHN NAJJAR John Najjar |
Director | June 1, 2016 | ||
| /s/ GREGORY A. SAAR Gregory A. Saar |
Director | June 1, 2016 | ||
| /s/ THOMAS S. SAYLES Thomas S. Sayles |
Director | June 1, 2016 | ||
| /s/ MIMI R. SONG Mimi R. Song |
Director | June 1, 2016 | ||
| /s/ MICHAEL S. TRASK Michael S. Trask |
Director | June 1, 2016 | ||
| /s/ KENNETH R. TUCKER Kenneth Ray Tucker |
Director | June 1, 2016 | ||
| /s/ RICHARD L. WRIGHT Richard L. Wright |
Director | June 1, 2016 | ||
202
Table of Contents
Schedule II
Valuation and Qualifying Accounts
For the Fiscal Years Ended October 3, 2015, September 27, 2014 and September 28, 2013
| (dollars in thousands) | ||||||||||||||||
| Balance at Beginning of Period |
Additions (Reductions) |
Write-Offs(a) | Balance at end of Period |
|||||||||||||
| Year ended September 28, 2013: |
||||||||||||||||
| Reserves and allowances deducted from asset accounts: |
||||||||||||||||
| Allowance for uncollectible accounts and notes receivable |
$ | 3,770 | $ | 1,279 | $ | (1,463 | ) | $ | 3,586 | |||||||
| Year ended September 27, 2014: |
||||||||||||||||
| Reserves and allowances deducted from asset accounts: |
||||||||||||||||
| Allowance for uncollectible accounts and notes receivable |
$ | 3,586 | $ | 123 | $ | (364 | ) | $ | 3,345 | |||||||
| Year ended October 3, 2015: |
||||||||||||||||
| Reserves and allowances deducted from asset accounts: |
||||||||||||||||
| Allowance for uncollectible accounts and notes receivable |
$ | 3,345 | $ | 2,029 | $ | (1,149 | ) | $ | 4,225 | |||||||
| (a) | Accounts written off, net of recoveries. |