Attached files
| file | filename |
|---|---|
| EX-23.1 - EX-23.1 - DORIAN LPG LTD. | lpg-20160331ex231d05fec.htm |
| EX-32.2 - EX-32.2 - DORIAN LPG LTD. | lpg-20160331ex322cb831f.htm |
| EX-32.1 - EX-32.1 - DORIAN LPG LTD. | lpg-20160331ex321a2600e.htm |
| EX-31.2 - EX-31.2 - DORIAN LPG LTD. | lpg-20160331ex31297988e.htm |
| EX-31.1 - EX-31.1 - DORIAN LPG LTD. | lpg-20160331ex3114a1070.htm |
| EX-23.2 - EX-23.2 - DORIAN LPG LTD. | lpg-20160331ex232e4ee65.htm |
| EX-21.1 - EX-21.1 - DORIAN LPG LTD. | lpg-20160331ex211dd0e3e.htm |
| EX-10.5 - EX-10.5 - DORIAN LPG LTD. | lpg-20160331ex105d397ca.htm |
| EX-10.11 - EX-10.11 - DORIAN LPG LTD. | lpg-20160331ex10113d4f9.htm |
UNITED STATES
SECURITIES AND EXCHANGE COMMISSION
Washington, D.C. 20549
FORM 10-K
[X] ANNUAL REPORT PURSUANT TO SECTION 13 OR 15(d) OF THE SECURITIES EXCHANGE ACT OF 1934
For the fiscal year ended March 31, 2016
or
[ ] TRANSITION REPORT PURSUANT TO SECTION 13 OR 15(d) OF THE SECURITIES EXCHANGE ACT OF 1934
Commission file number: 001-36437
Dorian LPG Ltd.
(Exact name of registrant as specified in its charter)
|
Marshall Islands |
|
66-0818228 |
|
(State or other jurisdiction of incorporation or organization) |
|
(I.R.S. Employer Identification No.) |
|
27 Signal Road, Stamford, CT |
|
06902 |
|
(Address of principal executive offices) |
|
(Zip Code) |
Registrant’s telephone number, including area code: (203) 674-9900
SECURITIES REGISTERED PURSUANT TO SECTION 12(b) OF THE ACT:
|
Title of Each Class |
|
Name of Each Exchange on Which Registered |
|
Common stock, par value $0.01 per share Preferred stock purchase rights |
|
New York Stock Exchange New York Stock Exchange |
SECURITIES REGISTERED PURSUANT TO SECTION 12(g) OF THE ACT:
None
Indicate by check mark if the registrant is a well-known seasoned issuer, as defined in Rule 405 of the Securities Act. Yes ◻No ☒
Indicate by check mark if the registrant is not required to file reports pursuant to Section 13 or Section 15(d) of the Act. Yes ◻No ☒
Indicate by check mark whether the registrant (1) has filed all reports required to be filed by Section 13 or 15(d) of the Securities Exchange Act of 1934 during the preceding 12 months (or for such shorter period that the registrant was required to file such reports), and (2) has been subject to such filing requirements for the past 90 days. Yes ☒ No ◻
Indicate by check mark whether the registrant has submitted electronically and posted on its corporate Web site, if any, every Interactive Data File required to be submitted and posted pursuant to Rule 405 of Regulation S-T (§ 232.405 of this chapter) during the preceding 12 months (or for such shorter period that the registrant was required to submit and post such files). Yes ☒ No ◻
Indicate by check mark if disclosure of delinquent filers pursuant to Item 405 of Regulation S-K (§ 229.405 of this chapter) is not contained herein, and will not be contained, to the best of registrant’s knowledge, in definitive proxy or information statements incorporated by reference in Part III of this Form 10-K or any amendment to this Form 10-K. ◻
Indicate by check mark whether the registrant is a large accelerated filer, an accelerated filer, a non-accelerated filer, or a smaller reporting company. See the definitions of “large accelerated filer,” “accelerated filer” and “smaller reporting company” in Rule 12b-2 of the Exchange Act.
|
Large accelerated filer ◻ |
Accelerated filer ☒ |
Non-accelerated filer ◻ |
Smaller reporting company ◻ |
Indicate by check mark whether the registrant is a shell company (as defined in Rule 12b-2 of the Act). Yes ◻No ☒
The aggregate market value of the registrant’s common stock held by non-affiliates, based upon the closing price of common stock as reported on the New York Stock Exchange as of September 30, 2015, was approximately $398,012,472. (For this purpose, all outstanding shares of common stock have been considered held by non-affiliates, other than the shares beneficially owned by directors, officers and shareholders of 10% or more of the registrant outstanding common shares, without conceding that any of the excluded parties are "affiliates" of the registrant for purposes of the federal securities laws.) As of May 26, 2016, there were 55,627,128 shares of the registrant’s common stock outstanding.
DOCUMENTS INCORPORATED BY REFERENCE
Portions of the Registrant’s definitive proxy statement for its 2016 Annual Meeting of Stockholders to be filed with the Securities and Exchange Commission, or the Commission, pursuant to Regulation 14A within 120 days after the end of the Registrant’s fiscal year covered by this Form 10-K are incorporated by reference into Part III of this Form 10-K.
FORWARD-LOOKING STATEMENTS
This report contains forward-looking statements within the meaning of the Private Securities Litigation Reform Act of 1995, including analyses and other information based on forecasts of future results and estimates of amounts not yet determinable and statements relating to our future prospects, developments and business strategies. Forward-looking statements are identified by their use of terms and phrases such as “anticipate,” “believe,” “could,” “estimate,” “expect,” “intend,” “may,” “plan,” “predict,” “project,” “will” and similar terms and phrases, including references to assumptions.
The forward-looking statements in this report are based upon various assumptions, many of which are based, in turn, upon further assumptions, including without limitation, management’s examination of historical operating trends, data contained in our records and other data available from third parties. Although we believe that these assumptions were reasonable when made, because these assumptions are inherently subject to significant uncertainties and contingencies which are difficult or impossible to predict and are beyond our control, we cannot assure you that we will achieve or accomplish these expectations, beliefs or projections.
In addition to important factors and matters discussed elsewhere in this report, and in the documents incorporated by reference herein, important factors that, in our view, could cause our actual results to differ materially from those discussed in the forward-looking statements include:
|
· |
our future operating or financial results; |
|
· |
our acquisitions, business strategy and expected capital spending or operating expenses; |
|
· |
shipping trends, including changes in charter rates, scrapping rates and vessel and other asset values; |
|
· |
factors affecting supply of and demand for liquefied petroleum gas, or LPG, shipping; |
|
· |
changes in trading patterns that impact tonnage requirements |
|
· |
general economic conditions and specific economic conditions in the oil and natural gas industry and the countries and regions where LPG is produced and consumed; |
|
· |
the supply of and demand for LPG, which is affected by the production levels and price of oil, refined petroleum products and natural gas, including production from U.S. shale fields; |
|
· |
completion of infrastructure projects to support marine transportation of LPG, including export terminals and pipelines; |
|
· |
oversupply of or limited demand for LPG vessels comparable to ours or higher specification vessels; |
|
· |
competition in the LPG shipping industry; |
|
· |
our ability to profitably employ our vessels, including vessels participating in the Helios Pool (defined below); |
|
· |
the failure of our or the Helios Pool’s significant customers to perform their obligations to us or to the Helios Pool; |
|
· |
performance of the Helios Pool; |
|
· |
the loss or reduction in business from our or the Helios Pool’s significant customers; |
|
· |
our financial condition and liquidity, including our ability to obtain financing in the future to fund capital expenditures, acquisitions and other general corporate activities, the terms of such financing and our ability to comply with covenants set forth in our existing and future financing arrangements; |
|
· |
our costs, including crew wages, insurance, provisions, repairs and maintenance, and general and administrative expenses; |
|
· |
our dependence on key personnel; |
|
· |
availability of skilled workers and the related labor costs; |
|
· |
the effects of new products and new technology in our industry; |
|
· |
operating hazards in the maritime transportation industry, including piracy; |
|
· |
adequacy of insurance coverage in the event of a catastrophic event; |
|
· |
compliance with and changes to governmental, tax, environmental and safety laws and regulations; |
|
· |
compliance with the U.S. Foreign Corrupt Practices Act of 1977, the U.K. Bribery Act 2010, or other applicable regulations relating to bribery; and |
|
· |
the volatility of the price of our common shares. |
Actual results could differ materially from expectations expressed in the forward-looking statements if one or more of the underlying assumptions or expectations proves to be inaccurate or is not realized. You should thoroughly read this report with the understanding that our actual future results may be materially different from and worse than what we expect. Moreover, we operate in an evolving environment. New risk factors and uncertainties emerge from time to time and it is not possible for our management to predict all risk factors and uncertainties, nor can we assess the impact of all factors on our business or the extent to which any factor, or combination of factors, may cause actual results to differ materially from those contained in any forward-looking statements. We qualify all of the forward-looking statements by these cautionary statements.
We caution readers of this report not to place undue reliance on forward-looking statements. Any forward-looking statements contained herein are made only as of the date of this report, and we undertake no obligation to update or revise any forward-looking statements, whether as a result of new information, future events or otherwise, except as required by law.
Unless otherwise indicated, references to "Dorian," the "Company," "we," "our," "us," or similar terms refer to Dorian LPG Ltd. and its subsidiaries and predecessors. The terms "Predecessor" and "Predecessor Business" refer to the owning companies of the four vessels that comprised our initial fleet (hereinafter referred to as our "Initial Fleet"), prior to their acquisition by us. We use the term "VLGC" to refer to very large gas carriers and the term “PGC” to refer to pressurized gas carriers. We use the term "LPG" to refer to liquefied petroleum gas and we use the term "cbm" to refer to cubic meters in describing the carrying capacity of our vessels. Unless otherwise indicated, all references to "U.S. dollars," "USD," "dollars," "U.S.$," and "$" in this report are to the lawful currency of the United States of America and references to "Norwegian Kroner" and "NOK" are to the lawful currency of Norway. Unless stated otherwise, the information below gives effect to a one-for-five reverse stock split of our common shares effected on April 25, 2014.
Overview
We are a Marshall Islands corporation incorporated in the Marshall Islands on July 1, 2013 and headquartered in the United States. We are focused on owning and operating VLGCs in the LPG shipping industry. Our founding executives have managed vessels in the LPG shipping market since 2002. We currently own and operate a fleet of twenty-two VLGCs, including nineteen new fuel-efficient 84,000 cbm ECO-design VLGCs, or our ECO VLGCs, and three 82,000 cbm VLGCs. The twenty-two VLGCs in our fleet have an aggregate carrying capacity of approximately 1.8 million cbm and an average age of 1.9 years as of May 26, 2016. We provide in-house commercial and technical management services for all of our vessels, including our vessels deployed in the Helios Pool, which may receive commercial management services from Phoenix (described below).
Sixteen of our ECO VLGCs were constructed at Hyundai Heavy Industries Co., Ltd., or Hyundai, and three of our ECO VLGCs were constructed at Daewoo Shipping and Marine Engineering Ltd, or Daewoo. Our nineteen ECO VLGCs, which incorporate fuel efficiency and emission-reducing technologies and certain custom features, were acquired by us for an aggregate purchase price of $1.4 billion, which was financed with proceeds from a $758 million debt facility that we entered into in March 2015 with a group of banks and financial institutions, or the 2015 Debt Facility, proceeds from equity offerings, and cash generated from operations. These nineteen ECO VLGCs were delivered to us between July 2014 and February 2016, seventeen of which were delivered during calendar year 2015 or later.
On April 1, 2015, we and Phoenix Tankers Pte. Ltd., or Phoenix, a wholly-owned subsidiary of Mitsui OSK Lines Ltd., a company not related to us, began operation of Helios LPG Pool LLC, or the Helios Pool, a joint venture owned 50% by us and 50% by Phoenix. We believe that the operation of certain of our VLGCs in this pool will allow us to achieve better market coverage and utilization. Vessels entered into the Helios Pool are commercially managed jointly by Dorian LPG (UK) Ltd., our wholly-owned subsidiary, and Phoenix. The members of the Helios Pool share in the net pool revenues generated by the entire group of vessels participating in the pool, weighted according to certain technical vessel characteristics, and net pool revenues are distributed as variable rate time charter hire to each participant. The vessels entered into the Helios Pool may operate either in the spot market, pursuant to contracts of affreightment, or COAs, or on time charters of two years' duration or less. We and Phoenix have agreed that the Helios Pool will have a right of first refusal to operate each VLGC of our respective fleets not employed on a time charter of more than two years' duration. In March 2016, the Helios Pool reached an agreement with Oriental Energy Company Ltd., or Oriental Energy, one of the largest propane dehydrogenation plant operators and LPG importers in China to operate eight VLGCs on its behalf. As of May 26, 2016, the Helios Pool operated twenty-four VLGCs, including eighteen of our vessels, four Phoenix vessels, and two Oriental Energy vessels. When fully delivered, the Helios Pool will operate six additional VLGCs for Oriental Energy, some of which will be time chartered-in at a fixed time charter hire rate. In addition, the Helios Pool has entered into a COA with Oriental Energy covering Oriental Energy’s shipments from the United States Gulf, which gives us exposure to the growing Chinese LPG market.
1
Our Fleet
The following table sets forth certain information regarding our fleet as of May 26, 2016:
|
|
|
|
|
|
|
|
|
|
|
|
|
|
|
|
|
|
|
|
Capacity |
|
|
|
Sister |
|
|
|
ECO |
|
|
|
Charter |
|
|
|
|
(Cbm) |
|
Shipyard |
|
Ships |
|
Year Built |
|
Vessel(1) |
|
Employment(2) |
|
Expiration(3) |
|
|
VLGCs |
|
|
|
|
|
|
|
|
|
|
|
|
|
|
|
|
Captain Nicholas ML |
|
82,000 |
|
Hyundai |
|
A |
|
2008 |
|
— |
|
Pool |
|
— |
|
|
Captain John NP |
|
82,000 |
|
Hyundai |
|
A |
|
2007 |
|
— |
|
Pool |
|
— |
|
|
Captain Markos NL(4) |
|
82,000 |
|
Hyundai |
|
A |
|
2006 |
|
— |
|
Time Charter |
|
Q4 2019 |
|
|
Comet(5) |
|
84,000 |
|
Hyundai |
|
B |
|
2014 |
|
X |
|
Time Charter |
|
Q3 2019 |
|
|
Corsair(6) |
|
84,000 |
|
Hyundai |
|
B |
|
2014 |
|
X |
|
Time Charter |
|
Q3 2018 |
|
|
Corvette |
|
84,000 |
|
Hyundai |
|
B |
|
2015 |
|
X |
|
Pool |
|
— |
|
|
Cougar |
|
84,000 |
|
Hyundai |
|
B |
|
2015 |
|
X |
|
Pool |
|
— |
|
|
Concorde |
|
84,000 |
|
Hyundai |
|
B |
|
2015 |
|
X |
|
Pool |
|
— |
|
|
Cobra(7) |
|
84,000 |
|
Hyundai |
|
B |
|
2015 |
|
X |
|
Pool |
|
Q3 2016 |
|
|
Continental |
|
84,000 |
|
Hyundai |
|
B |
|
2015 |
|
X |
|
Pool |
|
— |
|
|
Constitution |
|
84,000 |
|
Hyundai |
|
B |
|
2015 |
|
X |
|
Pool |
|
— |
|
|
Commodore |
|
84,000 |
|
Hyundai |
|
B |
|
2015 |
|
X |
|
Pool |
|
— |
|
|
Cresques |
|
84,000 |
|
Daewoo |
|
C |
|
2015 |
|
X |
|
Pool |
|
— |
|
|
Constellation |
|
84,000 |
|
Hyundai |
|
B |
|
2015 |
|
X |
|
Pool |
|
— |
|
|
Cheyenne |
|
84,000 |
|
Hyundai |
|
B |
|
2015 |
|
X |
|
Pool |
|
— |
|
|
Clermont |
|
84,000 |
|
Hyundai |
|
B |
|
2015 |
|
X |
|
Pool |
|
— |
|
|
Cratis |
|
84,000 |
|
Daewoo |
|
C |
|
2015 |
|
X |
|
Pool |
|
— |
|
|
Chaparral |
|
84,000 |
|
Hyundai |
|
B |
|
2015 |
|
X |
|
Pool |
|
— |
|
|
Copernicus |
|
84,000 |
|
Daewoo |
|
C |
|
2015 |
|
X |
|
Pool |
|
— |
|
|
Commander(8) |
|
84,000 |
|
Hyundai |
|
B |
|
2015 |
|
X |
|
Time Charter |
|
Q4 2020 |
|
|
Challenger(9) |
|
84,000 |
|
Hyundai |
|
B |
|
2015 |
|
X |
|
Pool |
|
Q2 2017 |
|
|
Caravelle |
|
84,000 |
|
Hyundai |
|
B |
|
2016 |
|
X |
|
Pool |
|
— |
|
|
Total |
|
1,842,000 |
|
|
|
|
|
|
|
|
|
|
|
|
|
|
(1) |
Represents vessels with very low revolutions per minute, long‑stroke, electronically controlled engines, larger propellers, advanced hull design, and low friction paint. |
|
(2) |
“Pool” indicates that the vessel is operated in the Helios Pool and receives as charter hire a portion of the net revenues of the pool calculated according to a formula based on the vessel’s pro rata performance in the pool. |
|
(3) |
Represents calendar year quarters. |
|
(4) |
Currently on time charter with an oil major that began in December 2014. |
|
(5) |
Currently on time charter with an oil major that began in July 2014. |
|
(6) |
Currently on time charter with an oil major that began in July 2015. |
|
(7) |
Currently on time charter with an oil major within the Helios Pool that began in July 2015. |
|
(8) |
Currently on time charter with a major oil company that began in November 2015. |
|
(9) |
Currently on time charter with a trader within the Helios Pool that began in May 2016. |
2
The LPG Shipping Industry
International seaborne LPG transportation services are generally provided by two types of operators: LPG distributors and traders and independent shipowner fleets. Traditionally the main trading route in our industry has been the transport of LPG from the Arabian Gulf to Asia. With the emergence of the United States as a major LPG export hub, the U.S. Gulf to Asia has become an important trade route. Vessels are generally operated under time charters, bareboat charters, spot charters, or contracts of affreightment. LPG distributors and traders use their fleets not only to transport their own LPG, but also to transport LPG for third-party charterers in direct competition with independent owners and operators in the tanker charter market. We operate in markets that are highly competitive and based primarily on supply and demand of available vessels. Generally, we compete for charters based upon charter rate, customer relationships, operating expertise, professional reputation and vessel specifications (size, age and condition). We also believe that our in-house technical and commercial management allows us to provide superior customer service and reliability which enhances our relationships with our charterers. Our industry is subject to strict environmental regulation, including emissions regulations, and we believe our modern, ECO-class fleet and our high level of crew training and vessel maintenance make us a preferred provider of VLGC tonnage.
Our Customers
Our customers, either directly or through the Helios Pool, include or have included global energy companies such as Exxon Mobil Corp., China International United Petroleum & Chemicals Co., Ltd., Royal Dutch Shell plc and Statoil ASA, commodity traders such as Itochu Corporation and the Vitol Group and importers such as E1 Corp., SK Gas Co. Ltd. and Indian Oil Corporation. See “Item 7. Management Discussion and Analysis—Overview” for a discussion of our customers that accounted for more than 10% of our total revenues and “Item 1A. Risk Factors—We expect to be dependent on a limited number of customers for a material part of our revenues, and failure of such customers to meet their obligations could cause us to suffer losses or negatively impact our results of operations and cash flows.” For the year ended March 31, 2016, approximately 70.2% of our revenue was generated through the Helios Pool as net pool revenues—related parties. See “Item 1A. Risk Factors—We and the Helios Pool operate exclusively in the LPG shipping industry. Due to our lack of diversification and the lack of diversification of the Helios Pool, adverse developments in the LPG shipping industry may adversely affect our business, financial condition and operating results.”
We intend to pursue a balanced chartering strategy by employing our vessels on a mix of multi-year time charters, some of which may include a profit-sharing component, shorter-term time charters, spot market voyages and COAs. Six of our vessels are currently on fixed time charters, including two vessels on fixed time charter within the Helios Pool. These fixed time charters have an average remaining term of 2.4 years as of May 26, 2016. See “Our Fleet” above for more information.
Competition
LPG carrier capacity is primarily a function of the size of the existing world fleet, the number of newbuildings being delivered and the scrapping of older vessels. According to industry sources, there were 1,377 LPG carriers with an aggregate capacity of about 27.6 million cbm as of April 1, 2016. As of such date, a further 180 LPG carriers with an aggregate carrying capacity of about 8.28 million cbm were on order for delivery by the end of 2018, equivalent to 30% of the existing fleet in capacity terms. In contrast to oil tankers and drybulk carriers, according to industry sources, the number of shipyards with LPG carrier experience is quite limited, and as such, a sudden influx of supply beyond what is already on order before 2017 is unlikely. In the VLGC sector in which we operate, as of April 1, 2016, there were 215 vessels with an aggregate carrying capacity of 17.5 million cbm in the world fleet with 61 vessels on order for delivery by 2018.
Our largest competitors for VLGC shipping services include BW LPG Limited, or BWLPG, Navigator Holdings Ltd., or NVGS, Avance Gas Holding Ltd., or Avance, Petredec, Astomos Energy Corporation and a number of smaller, closely held vessel owners. According to industry sources, there were approximately 55 owners in the entire worldwide VLGC fleet as of April 1, 2016, with the top ten owners possessing 51% of the total carrying capacity in service. Competition for the transportation of LPG depends on the price, location, size, age, condition and acceptability of the vessel to the charterer. We believe we own and operate the youngest and second largest fleet in the VLGC size segment,
3
which, in our view, enhances our position relative to that of our competitors. But see “Item 1A. Risk Factors—We will face substantial competition in trying to expand relationships with existing customers and obtain new customers.”
Seasonality
Liquefied gases are primarily used for industrial and domestic heating, as a chemical and refinery feedstock, as a transportation fuel and in agriculture. The LPG shipping market is typically stronger in the spring and summer months in anticipation of increased consumption of propane and butane for heating during the winter months. In addition, unpredictable weather patterns in these months tend to disrupt vessel scheduling and the supply of certain commodities. Demand for our vessels therefore may be stronger in our quarters ending June 30 and September 30 and relatively weaker during our quarters ending December 31 and March 31, although 12-month time charter rates tend to smooth these short-term fluctuations. To the extent any of our time charters expire during the relatively weaker fiscal quarters ending December 31 and March 31, it may not be possible to re-charter our vessels at similar rates. As a result, we may have to accept lower rates or experience off-hire time for our vessels, which may adversely impact our business, financial condition and operating results.
Employees
As of March 31, 2016, we employed 67 persons in our offices in the United States, Greece and the United Kingdom. In addition to our shore-based employees, we had approximately 530 seafaring staff serving on our owned vessels. Seafarers are sourced from seafarer recruitment and placement service agencies and are employed with short-term employment contracts.
Classification, Inspection and Maintenance
Every large, commercial seagoing vessel must be "classed" by a classification society. A classification society certifies that a vessel is "in class," signifying that the vessel has been built and maintained in accordance with the rules of the classification society and the vessel's country of registry and the international conventions of which that country is a member. In addition, where surveys are required by international conventions and corresponding laws and ordinances of a flag state, the classification society will undertake them on application or by official order, acting on behalf of the authorities concerned.
For maintenance of the class certificate, regular and special surveys of hull, machinery, including the electrical plant and any special equipment classed, are required to be performed by the classification society, to ensure continuing compliance. Vessels are drydocked at least once during a five‑year class cycle for inspection of the underwater parts and for repairs related to inspections. Vessels under five years of age can waive drydocking provided the vessel is inspected underwater. If any defects are found, the classification surveyor will issue a "recommendation" which must be rectified by the shipowner within prescribed time limits. The classification society also undertakes on request of the flag state other surveys and checks that are required by the regulations and requirements of that flag state. These surveys are subject to agreements made in each individual case and/or to the regulations of the country concerned.
Most insurance underwriters make it a condition for insurance coverage that a vessel be certified as "in class" by a classification society, which is a member of the International Association of Classification Societies, or the IACS. In December 2013, the IACS adopted harmonized Common Structure Rules that align with International Maritime Organization, or the IMO, goal standards. Our VLGCs are currently classed with Lloyd's Register, the American Bureau of Shipping, or ABS, or Det Norske Veritas, all members of the IACS. All of the vessels in our fleet have been awarded International Safety Management, or ISM, certification and are currently "in class."
We also carry out inspections of the ships on a regular basis; both at sea and while the vessels are in port. The results of these inspections are documented in a report containing recommendations for improvements to the overall condition of the vessel, maintenance, safety and crew welfare. Based in part on these evaluations, we create and implement a program of continual maintenance and improvement for our vessels and their systems.
4
Safety, Management of Ship Operations and Administration
Safety is our top operational priority. Our vessels are operated in a manner intended to protect the safety and health of the crew, the general public and the environment. We actively manage the risks inherent in our business and are committed to preventing incidents that threaten safety, such as groundings, fires and collisions. We are also committed to reducing emissions and waste generation. We have established key performance indicators to facilitate regular monitoring of our operational performance. We set targets on an annual basis to drive continuous improvement, and we review performance indicators every three months to determine if remedial action is necessary to reach our targets. Our shore staff performs a full range of technical, commercial and business development services for us. This staff also provides administrative support to our operations in finance, accounting and human resources.
Risk of Loss and Insurance
The operation of any vessel, including LPG carriers, has inherent risks. These risks include mechanical failure, personal injury, collision, property loss, vessel or cargo loss or damage and business interruption due to political circumstances in foreign countries or hostilities. In addition, there is always an inherent possibility of marine disaster, including explosions, spills and other environmental mishaps, and the liabilities arising from owning and operating vessels in international trade. We believe that our present insurance coverage is adequate to protect us against the accident related risks involved in the conduct of our business and that we maintain appropriate levels of environmental damage and pollution insurance coverage consistent with standard industry practice. However, not all risks can be insured, and there can be no guarantee that any specific claim will be paid, or that we will always be able to obtain adequate insurance coverage at reasonable rates.
We have obtained hull and machinery insurance on all our vessels against marine and war risks, which include the risks of damage to our vessels, salvage or towing costs, and actual or constructive total loss. However, our insurance policies contain deductible amounts for which we are responsible. We have also arranged additional total loss coverage for each vessel. This coverage, which is called hull interest and freight interest coverage, provides us additional coverage in the event of the total loss of a vessel.
We have also obtained loss of hire insurance to protect us against loss of income in the event one of our vessels cannot be employed due to damage that is covered under the terms of our hull and machinery insurance (marine and war risks). Under our loss of hire policies, our insurer will pay us an agreed daily rate in respect of each VLGC in excess of 180 deductible days for the time that the vessel is out of service as a result of damage, for a maximum of 180 days.
Protection and indemnity insurance, which covers our third party legal liabilities in connection with our shipping activities, is provided by mutual protection and indemnity associations, or P&I clubs. This insurance includes third party liability and other expenses related to the injury or death of crew members, passengers and other third parties, loss or damage to cargo, claims arising from collisions with other vessels or from contact with jetties or wharves and other damage to other third party property, including pollution arising from oil or other substances, and other related costs, including wreck removal. Subject to the capping discussed below, our coverage, except for pollution, is unlimited.
Our current protection and indemnity insurance coverage for pollution is $1 billion per vessel per incident. The thirteen P&I clubs that comprise the International Group of Protection and Indemnity Clubs, or the International Group, insure approximately 90% of the world's commercial tonnage and have entered into a pooling agreement to reinsure each association's liabilities. Each P&I club has capped its exposure in this pooling agreement so that the maximum claim covered by the pool and its reinsurance would be approximately $5.45 billion per accident or occurrence. We are a member of three P&I Clubs: The Standard Club Ltd., The United Kingdom Mutual Steamship Assurance Association (Bermuda) Limited and The London Steam‑Ship Owners' Mutual Insurance Association Limited. As a member of these P&I clubs, we are subject to a call for additional premiums based on the clubs' claims record, as well as the claims record of all other members of the P&I clubs comprising the International Group. However, our P&I clubs have reinsured the risk of additional premium calls to limit our additional exposure. This reinsurance is subject to a cap, and there is the risk that the full amount of the additional call would not be covered by this reinsurance.
5
Environmental and Other Regulation
General
Governmental and international agencies extensively regulate the carriage, handling, storage and regasification of LPG. These regulations include international conventions and national, state and local laws and regulations in the countries where our vessels now or, in the future, will operate or where our vessels are registered. We cannot predict the ultimate cost of complying with these regulations, or the impact that these regulations will have on the resale value or useful lives of our vessels. Various governmental and quasi-governmental agencies require us to obtain permits, licenses and certificates for the operation of our vessels. For the years ending March 31, 2017 and 2018, we estimate that capital expenditures for reducing our environmental emissions would total approximately $0.6 million on two of our VLGCs relating to performance enhancing devices to achieve power savings resulting in lower fuel consumption.
Although we believe that we are substantially in compliance with applicable environmental laws and regulations and have all permits, licenses and certificates required for our vessels, future non‑compliance or failure to maintain necessary permits or approvals could require us to incur substantial costs or temporarily suspend operation of one or more of our vessels. A variety of governmental and private entities inspect our vessels on both a scheduled and unscheduled basis. These entities, each of which may have unique requirements and each of which conducts frequent inspections, include local port authorities, such as the U.S. Coast Guard, or USCG, harbor master or equivalent, classification societies, flag state, or the administration of the country of registry, charterers, terminal operators and LPG producers.
International Maritime Organization Regulation of LPG Vessels
The IMO is the United Nations' agency that provides international regulations governing shipping and international maritime trade, including the International Convention on Civil Liability for Oil Pollution Damage, the International Convention on Civil Liability for Bunker Oil Pollution Damage, and the International Convention for the Prevention of Pollution from Ships, or the MARPOL. The flag state, as discussed in the United Nations Convention on Law of the Sea, has overall responsibility for the implementation and enforcement of international maritime regulations for all ships granted the right to fly its flag. The "Shipping Industry Guidelines on Flag State Performance" evaluates flag states based on factors such as sufficiency of infrastructure, ratification of international maritime treaties, implementation and enforcement of international maritime regulations, supervision of surveys, casualty investigations, and participation at IMO meetings. Each of our vessels is flagged in the Bahamas. The requirements contained in the International Management Code for the Safe Operation of Ships and Pollution Prevention, or the ISM Code, promulgated by the IMO, govern our operations. Among other requirements, the ISM Code requires shipowners, ship managers and bareboat charterers to develop and maintain an extensive safety management system that includes, among other things, the adoption of policies for safety and environmental protection setting forth instructions and procedures for operating its vessels safely and also describing procedures for responding to emergencies. We are compliant with the requirement to hold a Document of Compliance under the ISM Code for LPG ships (Gas carriers).
Vessels that transport gas, including LPG carriers, are also subject to regulation under the IMO's International Code for the Construction and Equipment of Ships Carrying Liquefied Gases in Bulk Gas Carrier Code, or the IGC Code. The IGC Code and similar regulations in individual member states, address fire and explosion risk posed by the transport of liquefied gases. Collectively these standards and regulations impose detailed requirements relating to the design and arrangement or cargo tanks, vents, and pipes; construction materials and compatibility; cargo pressure; and temperature control. Compliance with the IGC Code must be evidenced by a Certificate of Fitness for the Carriage of Liquefied Gases of Bulk. Each of our vessels is in compliance with the IGC Code. Non‑compliance with the IGC Code or other applicable IMO regulations may subject a shipowner or a bareboat charterer to increased liability, may lead to decreases in available insurance coverage for affected vessels and may result in the denial of access to, or detention in, some ports.
The IMO also periodically amends the International Convention for the Safety of Life at Sea 1974 and its protocol of 1988, otherwise known as SOLAS, and its implementing regulations. SOLAS includes construction, equipment, and procedure requirements to assure the safe operation of commercial vessels. Among other things, SOLAS requires lifeboats and other life‑saving appliances be provided on vessels and mandates the use of the Global Maritime Distress and Safety System, an international radio equipment and watchkeeping standard, afloat and at shore stations. The IMO has also
6
adopted the International Convention on Standards of Training, Certification and Watchkeeping for Seafarers, or STCW. New SOLAS safety requirements relating to lifeboats and safe manning of vessels that were adopted in May 2012 came into effect on January 1, 2014. Flag states that have ratified SOLAS and STCW generally employ the classification societies, which have incorporated SOLAS and STCW requirements into their class rules, to undertake surveys to confirm compliance.
In the wake of increased worldwide security concerns, after the September 11, 2001 attack in the United States, the IMO amended SOLAS and added the International Ship and Port Facilities Security Code, or ISPS, as a new chapter to that convention. The objective of the ISPS, which came into effect on July 1, 2004, is to detect security threats and take preventive measures against security incidents affecting ships or port facilities. Amendments to SOLAS Chapter VII, made mandatory in 2004, apply to vessels transporting dangerous goods and require those vessels to be in compliance with the International Maritime Dangerous Goods Code, or IMDG Code. We have developed Ship Security Plans, appointed and trained Ship and Office Security Officers and all of our vessels have been certified to meet the ISPS Code requirements.
SOLAS and other IMO regulations concerning safety, including those relating to treaties on training of shipboard personnel, lifesaving appliances, radio equipment and the global maritime distress and safety system, are applicable to our operations. Non‑compliance with these IMO regulations may subject us to increased liability or penalties, may lead to decreases in available insurance coverage for affected vessels and may result in the denial of access to or detention in some ports. For example, the USCG and European Union, or EU, authorities have indicated that vessels not in compliance with the ISM Code will be prohibited from trading in U.S. and EU ports.
The MARPOL Convention establishes environmental standards relating to oil leakage or spilling, garbage management, sewage, air emissions, handling and disposal of noxious liquids and the handling of harmful substances carried in bulk, liquid or packaged form.
The IMO amended Annex I to MARPOL by adding a new regulation relating to oil fuel tank protection that applies to various ships delivered on or after August 1, 2010. It includes requirements for the protected location of the fuel tanks, performance standards for accidental oil fuel outflow, a tank capacity limit and certain other maintenance, inspection and engineering standards. IMO regulations also require owners and operators of vessels to adopt Ship Oil Pollution Emergency Plans. Periodic training and drills for response personnel and for vessels and their crews are required.
In 2012, the IMO's Marine Environmental Protection Committee, or MEPC, adopted a resolution amending the International Code for the Construction of Equipment of Ships Carrying Dangerous Chemicals in Bulk, or IBC Code. The provisions of the IBC Code are mandatory under MARPOL and SOLAS. These amendments, which entered into force in June 2014, pertain to revised international certificates of fitness for the carriage of dangerous chemicals in bulk and identifying new products that fall under the IBC Code. In May 2014, additional amendments to the IBC Code were adopted that became effective in January 2016. These amendments pertain to the installation of stability instruments and cargo tank purging. Our ECO VLGCs are equipped with stability instruments and cargo tank purging. We may need to make certain financial expenditures to comply with these amendments for the remaining VLGCs.
The IMO continues to review and introduce new regulations. It is impossible to predict what additional regulations, if any, may be passed by the IMO and what effect, if any, such regulation may have on our operations.
Air Emissions
In September 1997, the IMO adopted MARPOL 73/78 Annex VI "Regulations for the prevention of Air Pollution" to MARPOL, or Annex VI, to address air pollution from ships. Annex VI came into force on May 19, 2005. It applies to all ships, fixed and floating drilling rigs and other floating platforms, sets limits on sulfur oxide and nitrogen oxide emissions from ship exhausts, and prohibits deliberate emissions of ozone depleting substances, such as chlorofluoro carbons. "Deliberate emissions" are not limited to times when the ship is at sea; they can for example include discharges occurring in the course of the ship's repair and maintenance. Shipboard incineration (from incinerators installed after January 1, 2000) of certain substances (such as polychlorinated biphenyls, or PCBs) are also prohibited. Annex VI also includes a global cap on sulfur content of fuel oil and allows for more stringent controls on sulfur emissions in special coastal areas known as Emission Control Areas, or ECAs, designated by the MEPC. Ships weighing more than 400 gross
7
tons and engaged in international voyages involving countries that have ratified the conventions, or ships flying the flag of those countries, are required to have an International Air Pollution Prevention Certificate, or an IAPP Certificate. Annex VI has been ratified by some but not all IMO member states. Annex VI came into force in the United States on January 8, 2009. All the vessels in our operating fleet have been issued IAPP Certificates.
Amended Annex VI also establishes new tiers of stringent nitrogen oxide emissions standards for new marine engines, depending on their date of installation. The U.S. Environmental Protection Agency, or the EPA, promulgated equivalent (and in some senses stricter) emissions standards in late 2009. As a result of these designations or similar future designations, we may be required to incur additional operating or other costs.
On July 1, 2010, amendments to Annex VI that require progressively stricter limitations on sulfur emissions from ships took effect. As of January 1, 2012, fuel used to power ships was not permitted to contain more than 3.5% sulfur. This cap will then decrease progressively until it reaches 0.5% by January 1, 2020, subject to a feasibility review to be completed no later than 2018. However, in ECAs such as the North America ECA fuels cannot contain more than 0.1% sulfur as of January 1, 2015. The Annex VI amendments also establish new tiers of stringent nitrogen oxide emissions standards for new marine engines, depending on their date of installation. Further, the European directive 2005/33/EU, which became effective on January 1, 2010, bans the use of fuel oils containing more than 0.1% sulfur by mass by any merchant vessel while at berth in any EU country. Our vessels have achieved compliance, where necessary, with both the applicable IMO and EU sulfur regulations, by being arranged to burn compliant fuels for the area of their operation.
Additionally, as discussed above, more stringent emission standards could apply in coastal areas designated as ECAs, such as the United States and Canadian coastal areas designated by the MEPC. U.S. air emissions standards are now equivalent to these amended Annex VI requirements, and once these amendments become effective, we may incur costs to comply with these revised standards. Additional or new conventions, laws and regulations may be adopted that could require the installation of expensive emission control systems.
Ballast Water Management Convention
The IMO adopted the International Convention for the Control and Management of Ships' Ballast Water and Sediments, or the BWM Convention, in February 2004. The BWM will not enter into force until 12 months after it has been adopted by 30 states, the combined merchant fleets of which represent not less than 35% of the gross tonnage of the world's merchant shipping tonnage. As of late March 2016, 49 states had adopted the BWM Convention, coming close to the 35% threshold. Notwithstanding the foregoing, the BWM Convention has not been ratified. Proposals regarding implementation have recently been submitted to the IMO, but we cannot predict the ultimate timing for ratification. Many of the implementation dates originally written into the BWM Convention have already passed, so on December 4, 2013, the IMO Assembly has passed a resolution revising the dates of applicability of the requirements of the BWM Convention so that they are triggered by the entry into force dated, and not the dates originally in the BWM Convention. This in effect makes all vessels constructed before the entry into force date “existing vessels,” and delayed the date for installation of ballast water management systems on vessels until the first renewal survey following entry into force of the convention. Furthermore, in October 2014 the MEPC met and adopted additional resolutions concerning the BWM Convention’s implementation. Upon entry into force of the BWM Convention, mid-ocean ballast exchange would become mandatory. When mid-ocean ballast exchange or ballast water treatment requirements become mandatory, the cost of compliance could increase for ocean carriers, and the costs of ballast water treatment, may be material. However, many countries already regulate the discharge of ballast water carried by vessels from country to country to prevent the introduction of invasive and harmful species via such discharges. The United States, for example, requires vessels entering its waters from another country to conduct mid-ocean ballast exchange, or undertake some alternate measure, and to comply with certain reporting requirements. Although we do not believe the costs of compliance with mandatory mid-ocean ballast exchange would be material, it is difficult to predict the overall impact of such a requirement on our operations.
Bunkers Convention / Civil Liability Convention State Certificates
The International Convention on Civil Liability for Bunker Oil Pollution Damaged of 2001, or the Bunker Convention, entered into force on November 21, 2008. The Bunker Convention provides a liability, compensation and compulsory insurance system for the victims of oil pollution damage caused by spills of bunker oil. The Bunker
8
Convention requires the ship owner liable to pay compensation for pollution damage (including the cost of preventive measures) caused in the territory, including the territorial sea of a State Party, as well as its economic zone or equivalent area. Registered owners of any sea going vessel and seaborne craft over 1,000 gross tonnage, of any type whatsoever, and registered in a State Party, or entering or leaving a port in the territory of a State Party, will be required to maintain insurance which meets the requirements of the Bunker Convention, an amount equal to the limits of liability under the applicable national or international limitation regime (but not exceeding the amount calculated in accordance with the Bunker Convention on Limitation of Liability for Maritime Claims of 1976, as amended, or the LLMC) and to obtain a certificate issued by a State Party attesting that such insurance is in force. The State issued certificate must be carried on board at all times. With respect to non-ratifying states, liability for spills or releases of bunker fuel is determined by the national or other domestic laws in the jurisdiction where the events or damage occur.
Many countries have ratified and follow the liability plan adopted by the IMO and set out in the International Convention on Civil Liability for Oil Pollution Damage of 1969, as amended in 2000, or CLC. Under this convention and depending on whether the country in which the damage results is a party to the 1992 Protocol to the CLC, a vessel's registered owner is strictly liable for pollution damage caused in the territorial waters of a contracting state by discharge of persistent oil, subject to certain complete defenses. The limited liability protections are forfeited under the CLC where the spill is caused by the owner's personal fault and under the 1992 Protocol where the spill is caused by the owner's personal act or omission or by intentional or reckless conduct. Vessels trading to states that are parties to these conventions must provide evidence of insurance covering the liability of the owner.
In jurisdictions such as the United States where the CLC or the Bunkers Convention has not been adopted, various legislative schemes or common law govern, and liability is imposed either on the basis of fault or on a strict-liability basis.
P&I Clubs in the International Group issue the required Bunkers Convention "Blue Cards" to enable signatory states to issue certificates. All of our vessels are in possession of a CLC State‑issued certificate attesting that the required insurance coverage is in force.
Anti‑Fouling Requirements
In 2001, the IMO adopted the International Convention on the Control of Harmful Anti‑fouling Systems on Ships, or the Anti‑fouling Convention. The Anti‑fouling Convention, which entered into force on September 17, 2008, prohibits the use of organotin compound coatings to prevent the attachment of mollusks and other sea life to the hulls of vessels. Vessels of over 400 gross tons engaged in international voyages must obtain an International Anti‑fouling System Certificate, or AFS, and undergo a survey before the vessel is put into service or when the antifouling systems are altered or replaced. We have obtained AFSs for all of our vessels, which are subject to the Anti‑fouling Convention, and do not believe that maintaining such certificates will have an adverse financial impact on the operation of our vessels.
United States Environmental Regulation of LPG Vessels
Our vessels operating in U.S. waters now, or in the future, are or will be subject to various federal, state and local laws and regulations relating to protection of the environment. In some cases, these laws and regulations require us to obtain governmental permits and authorizations before we may conduct certain activities. These environmental laws and regulations may impose substantial penalties for noncompliance and substantial liabilities for pollution. Failure to comply with these laws and regulations may result in substantial civil and criminal fines and penalties. As with the industry generally, our operations will entail risks in these areas, and compliance with these laws and regulations, which may be subject to frequent revisions and reinterpretation, increases our overall cost of business.
Oil Pollution Act and Comprehensive Environmental Response, Compensation, and Liability Act
The U.S. Oil Pollution Act of 1990, or OPA90, established an extensive regulatory and liability regime for environmental protection and cleanup of oil spills. OPA90 affects all owners and operators whose vessels trade with the United States or its territories or possessions, or whose vessels operate in the waters of the United States, which include the U.S. territorial waters and the two hundred nautical mile exclusive economic zone of the United States. The Comprehensive Environmental Response, Compensation, and Liability Act, or CERCLA, applies to the discharge of
9
hazardous substances whether on land or at sea. While OPA90 and CERCLA would not apply to the discharge of LPG, they may affect us because we carry oil as fuel and lubricants for our engines, and the discharge of these substances could cause an environmental hazard. Under OPA90, vessel operators, including vessel owners, managers and bareboat or "demise" charterers, are "responsible parties" who are all liable regardless of fault, individually and as a group, for all containment and clean‑up costs and other damages arising from oil spills from their vessels. These "responsible parties" would not be liable if the spill results solely from the act or omission of a third party, an act of God or an act of war. The other damages aside from clean‑up and containment costs are defined broadly to include:
|
· |
natural resource damages and related assessment costs; |
|
· |
real and personal property damages; |
|
· |
net loss of taxes, royalties, rents, profits or earnings capacity; |
|
· |
lost profits or impairment of earning capacity due to injury, destruction or loss of real or personal property or natural resources; |
|
· |
net cost of public services necessitated by a spill response, such as protection from fire, safety or health hazards; and |
|
· |
loss of subsistence use of natural resources. |
Effective December 21, 2015, the USCG adjusted the limits of OPA90 liability to the greater of $2,200 per gross ton or $18,796,800 for any double‑hull tanker that is over 3,000 gross tons (subject to possible adjustment for inflation). These limits of liability do not apply, however, where the incident is caused by violation of applicable U.S. federal safety, construction or operating regulations by a responsible party (or its agent, employee or a person acting pursuant to a contractual relationship), or a responsible party’s gross negligence or willful misconduct. These limits likewise do not apply if the responsible party fails or refuses to report the incident or to cooperate and assist in connection with the substance removal activities. These limits are subject to possible adjustment for inflation. OPA90 specifically permits individual states to impose their own liability regimes with regard to oil pollution incidents occurring within their boundaries, and some states have enacted legislation providing for unlimited liability for discharge of pollutants within their waters. In some cases, states, which have enacted their own legislation, have not yet issued implementing regulations defining shipowners' responsibilities under these laws.
CERCLA, which also applies to owners and operators of vessels, contains a similar liability regime and provides for cleanup, removal and natural resource damages for releases of "hazardous substances." Liability under CERCLA is limited to the greater of $300 per gross ton or $0.5 million for each release from vessels not carrying hazardous substances, cargo or residue, and $300 per gross ton or $5 million for each release from vessels carrying hazardous substances, cargo or residue. As with OPA90, these limits of liability do not apply where the incident is caused by violation of applicable U.S. federal safety, construction or operating regulations, or by the responsible party's gross negligence or willful misconduct or if the responsible party fails or refuses to report the incident or to cooperate and assist in connection with the substance removal activities. OPA90 and CERCLA each preserve the right to recover damages under existing law, including maritime tort law.
OPA90 requires owners and operators of vessels to establish and maintain with the USCG evidence of financial responsibility sufficient to meet the limit of their potential strict liability under OPA90/CERCLA. Under the regulations, evidence of financial responsibility may be demonstrated by insurance, surety bond, self‑insurance or guaranty. Under OPA90 regulations, an owner or operator of more than one vessel is required to demonstrate evidence of financial responsibility for the entire fleet in an amount equal only to the financial responsibility requirement of the vessel having the greatest maximum liability under OPA90/CERCLA. Each of our shipowning subsidiaries that has vessels trading in U.S. waters has applied for, and obtained from the USCG National Pollution Funds Center, three‑year certificates of financial responsibility, supported by guarantees which we purchased from an insurance based provider. We believe that
10
we will be able to continue to obtain the requisite guarantees and that we will continue to be granted certificates of financial responsibility from the USCG for each of our vessels that is required to have one.
In response to the BP Deepwater Horizon oil spill, a number of bills that could potentially increase or even eliminate the limits of liability under OPA90 have been introduced in the U.S. Congress. In April 2015, it was announced that new regulations are expected to be imposed in the United States regarding offshore oil and gas drilling. In December 2015, the Bureau of Safety and Environmental Enforcement announced a new pilot inspection program for offshore facilities. Compliance with any new requirements of OPA90 may substantially impact our cost of operations or require us to incur additional expenses to comply with any new regulatory initiatives or statutes. Compliance with any new requirements of OPA90 may substantially impact our cost of operations or require us to incur additional expenses to comply with any new regulatory initiatives or statutes. Additional legislation, regulation, or other requirements applicable to the operation of our vessels that may be implemented in the future as could adversely affect our business and ability to make distributions to our shareholders.
Clean Water Act
The United States Clean Water Act, or CWA, prohibits the discharge of oil or hazardous substances in United States navigable waters unless authorized by a permit or exemption, and imposes strict liability in the form of penalties for unauthorized discharges. The CWA also imposes substantial liability for the costs of removal, remediation and damages and complements the remedies available under OPA90 and CERCLA. In additional, many U.S. states that border a navigable waterway have enacted environmental pollution laws that impose strict liability on a person for removal costs and damages resulting from a discharge of oil or a release of a hazardous substance. These laws may be more stringent than U.S. federal law. The EPA recently proposed revisions to the CWA.
The EPA and the USCG have enacted rules relating to ballast water discharge, compliance with which requires the installation of equipment on our vessels to treat ballast water before it is discharged in or the implementation of other port facility disposal arrangements or procedures at potentially substantial costs, and/or otherwise restrict our vessels from entering U.S. waters.
The EPA requires a permit regulating ballast water discharges and other discharges incidental to the normal operation of certain vessels within U.S. water under the Vessel General Permit for Discharges Incidental to the Normal Operation of Vessels, or VGP. For a new vessel delivered to an owner or operator after September 19, 2009, to be covered by the VGP, the owner must submit a Notice of Intent, or NOI, at least 30 days before the vessel operates in U.S. waters. On March 28, 2013, the EPA re-issued the VGP for another 5 years. This VGP took effect on December 19, 2013. The VGP focuses on authorizing discharges incidental to operations of commercial vessels and the new VGP contains numeric ballast water discharge limits for most vessels to reduce the risk of invasive species in U.S. waters, more stringent requirements for gas scrubbers and the use of environmentally acceptable lubricants.
The USCG regulations adopted under the U.S. National Invasive Species Act, or NISA, also impose mandatory ballast water management practices for all vessels equipped with ballast water tanks entering or operating in U.S. waters, which require the installation of equipment to treat ballast water before it is discharged in U.S. waters or, in the alternative, the implementation of other port facility disposal arrangements or procedures. Vessels not complying with these regulations are restricted from entering U.S. waters. The USCG must approve any technology before it is placed on a vessel but has not yet approved the technology necessary for vessels to meet the foregoing standards.
Notwithstanding the foregoing, as of January 1, 2014, vessels are technically subject to the phasing-in of these standards. As a result, the USCG has provided waivers to vessels which cannot install the as-yet unapproved technology. The EPA, on the other hand, has taken a different approach to enforcing ballast discharge standards under the VGP. On December 27, 2013, the EPA issued an enforcement response policy in connection with the new VGP in which the EPA indicated that it would take into account the reasons why vessels do not have the requisite technology installed, but will not grant any waivers.
It should also be noted that in October 2015, the Second Circuit Court of Appeals issued a ruling that directed the EPA to redraft the sections of the 2013 VGP that address ballast water. However, the Second Circuit stated that 2013 VGP
11
will remains in effect until the EPA issues a new VGP. It presently remains unclear how the ballast water requirements set forth by the EPA, the USCG, and IMO BWM Convention, some of which are in effect and some which are pending, will co-exist.
Compliance with the VGP could require the installation of equipment on our vessel to treat ballast water before it is discharged or the implementation of other disposal arrangements, and/or otherwise restrict our vessel from entering United States waters. In addition, certain states have enacted more stringent discharge standards as conditions to their required certification of the VGP. We submit NOIs for our vessel where required and do not believe that the costs associated with obtaining and complying with the VGP have a material impact on our operations.
Clean Air Act
The U.S. Clean Air Act of 1970, as amended, or the CAA, requires the EPA to promulgate standards applicable to emissions of volatile organic compounds and other air contaminants. Our vessels are subject to vapor control and recovery requirements for certain cargoes when loading, unloading, ballasting, cleaning and conducting other operations in regulated port areas and emission standards for so‑called "Category 3" marine diesel engines operating in U.S. waters. The marine diesel engine emission standards are currently limited to new engines beginning with the 2004 model year. On April 30, 2010, the EPA promulgated final emission standards for Category 3 marine diesel engines equivalent to those adopted in the amendments to Annex VI. The emission standards apply in two stages: near‑term standards for newly‑built engines went into effect from 2011, and long‑term standards requiring an 80% reduction in nitrogen dioxides, or NOx, that went into effect on January 1, 2016. We have incurred costs to install control equipment on our vessels to comply with these standards.
European Union
The EU has also adopted legislation that would: (1) ban manifestly sub‑standard vessels (defined as those over 15 years old that have been detained by port authorities at least twice in a six month period) from European waters and require port states to inspect vessels posing a high risk to maritime safety or the marine environment; and (2) provide the EU with greater authority and control over classification societies, including the ability to seek to suspend or revoke the authority of negligent societies.
The EU has implemented regulations requiring vessels to use reduced sulfur content fuel for their main and auxiliary engines. The EU Directive 2005/EC/33 (amending Directive 1999/32/EC) introduced requirements parallel to those in Annex VI relating to the sulfur content of marine fuels. In addition, the EU imposed a 0.1% maximum sulfur requirement for fuel used by ships at berth in EU ports, effective January 1, 2010.
In 2009, the EU amended a directive on ship‑source pollution imposing criminal sanctions for intentional, reckless or seriously negligent illicit ship-source discharges of polluting substances by ships including minor discharges and the discharges, individually or in the aggregate, result in deteriorations or the quality of water. Aiding and abetting the discharge of a polluting substance may also lead to criminal penalties. The directive could result in criminal liability for pollution from vessels in waters of European countries that adopt implementing legislation. Criminal liability for pollution may result in substantial penalties or fines and increased civil liability claims. We cannot predict what regulations, if any, may be adopted by the EU or any other country or authority.
Regulation of Greenhouse Gas Emissions
In February 2005, the Kyoto Protocol entered into force. Pursuant to the Kyoto Protocol, adopting countries are required to implement national programs to reduce emissions of certain gases, generally referred to as greenhouse gases, which are suspected of contributing to global warming. The 2015 United Nations Convention on Climate Change Conference in Paris did not result in an agreement that directly limited greenhouse gas emissions from ships.
Currently, the emissions of greenhouse gases from ships involved in international transport are not subject to the Kyoto Protocol. In December 2009, more than 27 nations, including the United States and China, signed the Copenhagen Accord, which includes a non‑binding commitment to reduce greenhouse gas emissions. In addition, in December 2011,
12
the Conference of the Parties to the United Nations Convention on Climate Change adopted the Durban Platform which calls for a process to develop binding emissions limitations on both developed and developing countries under the United Nations Framework Convention on Climate Change applicable to all Parties. In April 2015, the European Parliament approved EU draft rules, which will require annual CO2 emission monitoring and reporting from ship owners who use EU ports. These rules are expected to be effective in 2018 and apply to ships over 5,000gt. For 2020, the EU made a unilateral commitment to reduce overall greenhouse gas emissions from its member states by 20% of 1990 levels. The EU also committed to reduce its emissions by 20% under the Kyoto Protocol's second period, from 2013 to 2020.
As of January 1, 2013, all ships must comply with mandatory requirements adopted by MEPC in July 2011 in part to address greenhouse gas emissions. The amendments to Annex VI Regulations for the prevention of air pollution from ships add a new Chapter 4 to Annex VI on Regulations on energy efficiency requiring new ships to meet the Energy Efficiency Design Index, or EEDI, and all ships to develop and implement a Ship Energy Efficiency Management Plan, or SEEMP. Other amendments to Annex VI add new definitions and requirements for survey and certification, including the format for the International Energy Efficiency Certificate. The regulations apply to all ships of 400 gross tonnage and above. These new rules will likely affect the operations of vessels that are registered in countries that are signatories to Annex VI or vessels that call upon ports located within such countries. The implementation of the EEDI and SEEMP standards could cause us to incur additional compliance costs. MEPC is also considering market‑based mechanisms to reduce greenhouse gas emissions from ships. It is impossible to predict the likelihood that such a standard might be adopted or its potential impact on our operations at this time.
In the United States, the EPA has issued a final finding that greenhouse gases threaten public health and safety, and has promulgated regulations that regulate the emission of greenhouse gases from certain mobile sources and has proposed regulations to limit greenhouse gases from large stationary sources. The EPA enforces both the CAA and the international standards found in Annex VI concerning marine diesel emissions and the sulfur content found in marine fuel. Any climate control legislation or other regulatory initiatives adopted by the IMO, the EU, the U.S., or other countries where we operate, or any treaty adopted at the international level to succeed the Kyoto Protocol, that restrict emissions of greenhouse gases could require us to make significant financial expenditures, including capital expenditures or operational changes to upgrade our vessels, that we cannot predict with certainty at this time. In addition, even without such regulation, our business may be indirectly affected to the extent that climate change results in sea level changes or more intense weather events.
Vessel Security Regulations
Since the terrorist attacks of September 11, 2001, there have been a variety of initiatives intended to enhance vessel security. On November 25, 2002, the Maritime Transportation Act of 2002, or MTSA, came into effect. To implement certain portions of the MTSA, in July 2003, the USCG issued regulations requiring the implementation of certain security requirements aboard vessels operating in waters subject to the jurisdiction of the United States. The regulations also impose requirements on certain ports and facilities, some of which are regulated by the EPA. Similarly, in December 2002, amendments to SOLAS created a new chapter of the convention dealing specifically with maritime security. The new chapter XI-2 became effective in July 2004 and imposes various detailed security obligations on vessels and port authorities, most of which are contained in the ISPS Code. The ISPS Code is designed to protect ports and international shipping against terrorism. After July 1, 2004, to trade internationally, a vessel must attain an International Ship Security Certificate, or ISSC, from a recognized security organization approved by the vessel's flag state. Among the various requirements are:
|
· |
on‑board installation of automatic identification systems to provide a means for the automatic transmission of safety‑related information from among similarly equipped ships and shore stations, including information on a ship's identity, position, course, speed and navigational status; |
|
· |
on‑board installation of ship security alert systems, which do not sound on the vessel but only alert the authorities on shore; |
|
· |
the development of vessel security plans; |
13
|
· |
ship identification number to be permanently marked on a vessel's hull; |
|
· |
a continuous synopsis record kept onboard showing a vessel's history including, the name of the ship and of the state whose flag the ship is entitled to fly, the date on which the ship was registered with that state, the ship's identification number, the port at which the ship is registered and the name of the registered owner(s) and their registered address; and |
|
· |
compliance with flag state security certification requirements. |
The USCG regulations, intended to align with international maritime security standards, exempt non‑U.S. vessels from obtaining USCG‑approved MTSA vessel security plans provided such vessels have on board an ISSC that attests to the vessel's compliance with SOLAS security requirements and the ISPS Code.
We have developed security plans, appointed and trained Ship and Company Security Officers and each of our vessels in our fleet complies with the requirements of the ISPS Code, SOLAS and the MTSA.
Other Regulation
In 1996, the International Convention on Liability and Compensation for Damages in Connection with the Carriage of Hazardous and Noxious Substances by Sea, or HNS, was adopted and subsequently amended by the 2010 Protocol, or the 2010 HNS Convention. Our LPG vessels may also become subject to the HNS Convention, if it is entered into force. The HNS Convention creates a regime of liability and compensation for damage from HNS, including liquefied gases. The HNS Convention introduces strict liability for the shipowner and covers pollution damage as well as the risks of fire and explosion, including loss of life or personal injury and damage to property. The 2010 HNS Convention sets up a two‑tier system of compensation composed of compulsory insurance taken out by shipowners and an HNS Fund which comes into play when the insurance is insufficient to satisfy a claim or does not cover the incident. Under the 2010 HNS Convention, if damage is caused by bulk HNS, claims for compensation will first be sought from the shipowner up to a maximum of 100 million Special Drawing Rights, or SDR. If the damage is caused by packaged HNS or by both bulk and packaged HNS, the maximum liability is 115 million SDR. Once the limit is reached, compensation will be paid from the HNS Fund up to a maximum of 250 million SDR. The 2010 HNS Convention has not come into effect. It will come into force eighteen months after the date on which certain consent and administrative requirements are satisfied. While a majority of the necessary number of states has indicated their consent to be bound by the 2010 HNS Convention, the required minimum has not been met. We cannot estimate the costs that may be needed to comply with any such requirements that may be adopted with any certainty at this time.
Taxation
The following is a discussion of the material Marshall Islands and United States federal income tax considerations relevant to an investment decision by a United States Holder and a Non‑United States Holder, each as defined below, with respect to the common shares. This discussion does not purport to deal with the tax consequences of owning our common shares to all categories of investors, some of which, such as financial institutions, regulated investment companies, real estate investment trusts, tax‑exempt organizations, insurance companies, persons holding our common stock as part of a hedging, integrated, conversion or constructive sale transaction or a straddle, traders in securities that have elected the mark‑to‑market method of accounting for their securities, persons liable for alternative minimum tax, persons who are investors in partnerships or other pass‑through entities for U.S. federal income tax purposes, dealers in securities or currencies, United States Holders whose functional currency is not the United States dollar and investors that own, actually or under applicable constructive ownership rules, 10% or more of our shares of common stock, may be subject to special rules. This discussion deals only with holders who purchase and hold the common shares as a capital asset. You are encouraged to consult your own tax advisors concerning the overall tax consequences arising in your own particular situation under United States federal, state, local or non‑United States law of the ownership of common shares.
14
Marshall Islands Tax Considerations
In the opinion of Seward & Kissel LLP, our United States counsel, the following are the material Marshall Islands tax consequences of our activities to us and of our common shares to our shareholders. We are incorporated in the Marshall Islands. Under current Marshall Islands law, we are not subject to tax on income or capital gains, and no Marshall Islands withholding tax will be imposed upon payments of dividends by us to our shareholders as there is no reciprocal tax treaty between the Marshall Islands and the United States.
United States Federal Income Tax Considerations
In the opinion of Seward & Kissel LLP, the following are the material United States federal income tax consequences to us of our activities and to United States Holders and Non‑United States Holders, each as defined below, of the common shares. The following discussion of United States federal income tax matters is based on the United States Internal Revenue Code of 1986, or the Code, judicial decisions, administrative pronouncements, and existing and proposed regulations issued by the United States Department of the Treasury, or the Treasury Regulations, all of which are subject to change, possibly with retroactive effect. The discussion below is based, in part, on the description of our business as described in this report and assumes that we conduct our business as described herein.
United States Federal Income Taxation of Operating Income: In General
We anticipate that we will earn substantially all our income from the hiring of vessels for use on a time or spot charter basis, including through the Helios Pool, and from the performance of services directly related to those uses, all of which we refer to as "shipping income."
Unless we qualify for an exemption from United States federal income taxation under the rules of Section 883 of the Code, or Section 883, as discussed below, a foreign corporation such as the Company will be subject to United States federal income taxation on its "shipping income" that is treated as derived from sources within the United States, to which we refer as "United States source shipping income." For United States federal income tax purposes, "United States source shipping income" includes 50% of shipping income that is attributable to transportation that begins or ends, but that does not both begin and end, in the United States.
Shipping income attributable to transportation exclusively between non‑United States ports will be considered to be 100% derived from sources entirely outside the United States. Shipping income derived from sources outside the United States will not be subject to any United States federal income tax.
Shipping income attributable to transportation exclusively between United States ports is considered to be 100% derived from United States sources. However, we are not permitted by United States law to engage in the transportation of cargoes that produces 100% United States source shipping income.
Unless we qualify for the exemption from tax under Section 883, our gross United States source shipping income would be subject to a 4% tax imposed without allowance for deductions as described below.
Exemption of Operating Income from United States Federal Income Taxation
Under Section 883 and the Treasury Regulations thereunder, a foreign corporation will be exempt from United States federal income taxation of its United States source shipping income if:
|
1) |
it is organized in a "qualified foreign country" which is one that grants an "equivalent exemption" from tax to corporations organized in the United States in respect of each category of shipping income for which exemption is being claimed under Section 883; and |
15
|
2) |
one of the following tests is met: |
|
A) |
more than 50% of the value of its shares is beneficially owned, directly or indirectly, by "qualified shareholders," which as defined includes individuals who are "residents" of a qualified foreign country, to which we refer as the "50% Ownership Test"; or |
|
B) |
its shares are "primarily and regularly traded on an established securities market" in a qualified foreign country or in the United States, to which we refer as the "Publicly‑Traded Test." |
The Republic of The Marshall Islands, the jurisdiction where we and our ship‑owning subsidiaries are incorporated, has been officially recognized by the United States Internal Revenue Service, or the IRS, as a qualified foreign country that grants the requisite "equivalent exemption" from tax in respect of each category of shipping income we earn and currently expect to earn in the future. Therefore, we will be exempt from United States federal income taxation with respect to our United States source shipping income if we satisfy either the 50% Ownership Test or the Publicly‑Traded Test.
We believe that we satisfy the Publicly‑Traded Test, a factual determination made on an annual basis, with respect to our taxable year ended March 31, 2016, and we expect to continue to do so for our subsequent taxable years, and we intend to take this position for U.S. federal income tax reporting purposes. We do not currently anticipate circumstances under which we would be able to satisfy the 50% Ownership Test.
Publicly‑Traded Test
The Treasury Regulations under Section 883 provide, in pertinent part, that shares of a foreign corporation will be considered to be "primarily traded" on an established securities market in a country if the number of shares of each class of stock that are traded during any taxable year on all established securities markets in that country exceeds the number of shares in each such class that are traded during that year on established securities markets in any other single country. The Company's common shares, which constitute its sole class of issued and outstanding stock is "primarily traded" on the New York Stock Exchange, or the NYSE, an established securities market for these purposes.
Under the Treasury Regulations, our common shares will be considered to be "regularly traded" on an established securities market if one or more classes of our shares representing more than 50% of our outstanding stock, by both total combined voting power of all classes of stock entitled to vote and total value, are listed on such market, to which we refer as the "listing threshold." Since all of our common shares are listed on the NYSE, we expect to satisfy the listing threshold.
The Treasury Regulations also require that with respect to each class of stock relied upon to meet the listing threshold, (i) such class of stock traded on the market, other than in minimal quantities, on at least 60 days during the taxable year or one‑sixth of the days in a short taxable year, which we refer to as the "trading frequency test"; and (ii) the aggregate number of shares of such class of stock traded on such market during the taxable year must be at least 10% of the average number of shares of such class of stock outstanding during such year or as appropriately adjusted in the case of a short taxable year, which we refer to as the "trading volume" test. We anticipate that we will satisfy the trading frequency and trading volume tests. Even if this were not the case, the Treasury Regulations provide that the trading frequency and trading volume tests will be deemed satisfied if, as is expected to be the case with our common shares, such class of stock is traded on an established securities market in the United States and such shares are regularly quoted by dealers making a market in such shares.
Notwithstanding the foregoing, the Treasury Regulations provide, in pertinent part, that a class of shares will not be considered to be "regularly traded" on an established securities market for any taxable year in which 50% or more of the vote and value of the outstanding shares of such class are owned on more than half the days during the taxable year by persons who each own 5% or more of the vote and value of such class of outstanding stock, to which we refer as the "5% Override Rule."
For purposes of being able to determine the persons who actually or constructively own 5% or more of the vote and value of our common shares, or "5% Shareholders," the Treasury Regulations permit us to rely on those persons that
16
are identified on Schedule 13G and Schedule 13D filings with the Commission, as owning 5% or more of our common shares. The Treasury Regulations further provide that an investment company which is registered under the Investment Company Act of 1940, as amended, will not be treated as a 5% Shareholder for such purposes.
In the event the 5% Override Rule is triggered, the Treasury Regulations provide that the 5% Override Rule will nevertheless not apply if we can establish that within the group of 5% Shareholders, qualified shareholders (as defined for purposes of Section 883) own sufficient number of shares to preclude non‑qualified shareholders in such group from owning 50% or more of our common shares for more than half the number of days during the taxable year.
We believe that we satisfy the Publicly‑Traded Test and will not be subject to the 5% Override Rule for taxable year ending March 31, 2016 and we also expect to continue to do so for our subsequent taxable years. However, there are factual circumstances beyond our control that could cause us to lose the benefit of the Section 883 exemption. For example, we may no longer qualify for Section 883 exemption for a particular taxable year if 5% Shareholders were to own, in the aggregate, 50% or more of our outstanding common shares on more than half the days of the taxable year, unless we could establish that within the group of 5% Shareholders, qualified shareholders own sufficient number of our shares to preclude the non-qualified shareholders in such group from owning 50% or more of our common shares for more than half the number of days during the taxable year. Under the Treasury Regulations, we would have to satisfy certain substantiation requirements regarding the identity of our shareholders. These requirements are onerous and there is no assurance that we would be able to satisfy them. Given the factual nature of the issues involved, we can give no assurances in regards of our or our subsidiaries' qualification for the Section 883 exemption.
Taxation in Absence of Section 883 Exemption
If the benefits of Section 883 are unavailable, our United States source shipping income would be subject to a 4% tax imposed by Section 887 of the Code on a gross basis, without the benefit of deductions, or the "4% gross basis tax regime," to the extent that such income is not considered to be "effectively connected" with the conduct of a United States trade or business, as described below. Since under the sourcing rules described above, no more than 50% of our shipping income would be treated as being United States source shipping income, the maximum effective rate of United States federal income tax on our shipping income would never exceed 2% under the 4% gross basis tax regime.
To the extent our United States source shipping income is considered to be "effectively connected" with the conduct of a United States trade or business, as described below, any such "effectively connected" United States source shipping income, net of applicable deductions, would be subject to United States federal income tax, currently imposed at rates of up to 35%. In addition, we would generally be subject to the 30% "branch profits" tax on earnings effectively connected with the conduct of such trade or business, as determined after allowance for certain adjustments, and on certain interest paid or deemed paid attributable to the conduct of our United States trade or business.
Our United States source shipping income would be considered "effectively connected" with the conduct of a United States trade or business only if:
|
· |
we have, or are considered to have, a fixed place of business in the United States involved in the earning of United States source shipping income; and |
|
· |
substantially all of our United States source shipping income is attributable to regularly scheduled transportation, such as the operation of a vessel that follows a published schedule with repeated sailings at regular intervals between the same points for voyages that begin or end in the United States. |
We do not intend to have, or permit circumstances that would result in having, any vessel sailing to or from the United States on a regularly scheduled basis. Based on the foregoing and on the expected mode of our shipping operations and other activities, it is anticipated that none of our United States source shipping income will be "effectively connected" with the conduct of a United States trade or business.
17
United States Taxation of Gain on Sale of Vessels
Regardless of whether we qualify for exemption under Section 883, we will not be subject to U.S. federal income tax with respect to gain realized on a sale of a vessel, provided the sale is considered to occur outside of the United States under U.S. federal income tax principles. In general, a sale of a vessel will be considered to occur outside of the United States for this purpose if title to the vessel, and risk of loss with respect to the vessel, pass to the buyer outside of the United States. It is expected that any sale of a vessel by us will be considered to occur outside of the United States.
United States Federal Income Taxation of United States Holders
As used herein, the term "United States Holder" means a holder that for U.S. federal income tax purposes is a beneficial owner of common shares and is an individual United States citizen or resident, a United States corporation or other United States entity taxable as a corporation, an estate the income of which is subject to United States federal income taxation regardless of its source, or a trust if a court within the United States is able to exercise primary jurisdiction over the administration of the trust and one or more United States persons have the authority to control all substantial decisions of the trust.
If a partnership holds the common shares, the tax treatment of a partner will generally depend upon the status of the partner and upon the activities of the partnership. If you are a partner in a partnership holding the common shares, you are encouraged to consult your tax advisor.
Distributions
Subject to the discussion of passive foreign investment companies below, any distributions made by us with respect to our common shares to a United States Holder will generally constitute dividends to the extent of our current or accumulated earnings and profits, as determined under United States federal income tax principles. Distributions in excess of such earnings and profits will be treated first as a nontaxable return of capital to the extent of the United States Holder's tax basis in its common shares and thereafter as capital gain. Because we are not a United States corporation, United States Holders that are corporations will not be entitled to claim a dividends received deduction with respect to any distributions they receive from us. Dividends paid with respect to our common shares will generally be treated as foreign source dividend income and will generally constitute "passive category income" for purposes of computing allowable foreign tax credits for United States foreign tax credit purposes.
Dividends paid on our common shares to certain non‑corporate United States Holders will generally be treated as "qualified dividend income" that is taxable to such United States Holders at preferential tax rates provided that (1) the common shares are readily tradable on an established securities market in the United States (such as the NYSE, on which our common shares will be traded), (2) the shareholder has owned the common stock for more than 60 days in the 121‑day period beginning 60 days before the date on which the common stock becomes ex‑dividend, and (3) we are not a passive foreign investment company for the taxable year during which the dividend is paid or the immediately preceding taxable year.
There is no assurance that any dividends paid on our common shares will be eligible for these preferential rates in the hands of such non‑corporate United States Holders, although, as described above, we expect such dividends to be so eligible provided an eligible non‑corporate United States Holder meets all applicable requirements and we are not a passive foreign passive investment company in the taxable year during which the dividend is paid or the immediately preceding taxable year. Any dividends paid by us which are not eligible for these preferential rates will be taxed as ordinary income to a non‑corporate United States Holder.
Special rules may apply to any "extraordinary dividend"—generally, a dividend in an amount which is equal to or in excess of 10% of a shareholder's adjusted tax basis in a common share—paid by us. If we pay an "extraordinary dividend" on our common shares that is treated as "qualified dividend income," then any loss derived by certain non‑corporate United States Holders from the sale or exchange of such common shares will be treated as long term capital loss to the extent of such dividend.
18
Sale, Exchange or Other Disposition of Common Shares
Assuming we do not constitute a passive foreign investment company for any taxable year, a United States Holder generally will recognize taxable gain or loss upon a sale, exchange or other disposition of our common shares in an amount equal to the difference between the amount realized by the United States Holder from such sale, exchange or other disposition and the United States Holder's tax basis in such shares. Such gain or loss will be treated as long‑term capital gain or loss if the United States Holder's holding period is greater than one year at the time of the sale, exchange or other disposition. Such capital gain or loss will generally be treated as United States source income or loss, as applicable, for United States foreign tax credit purposes. Long‑term capital gains of certain non‑corporate United States Holders are currently eligible for reduced rates of taxation. A United States Holder's ability to deduct capital losses is subject to certain limitations.
Passive Foreign Investment Company Status and Significant Tax Consequences
Special United States federal income tax rules apply to a United States Holder that holds shares in a foreign corporation classified as a "passive foreign investment company," or a PFIC, for United States federal income tax purposes. In general, we will be treated as a PFIC with respect to a United States Holder if, for any taxable year in which such holder holds our common shares, either
|
· |
at least 75% of our gross income for such taxable year consists of passive income (e.g., dividends, interest, capital gains and rents derived other than in the active conduct of a rental business); or |
|
· |
at least 50% of the average value of our assets during such taxable year produce, or are held for the production of, passive income. |
For purposes of determining whether we are a PFIC, we will be treated as earning and owning our proportionate share of the income and assets, respectively, of any of our ship‑owning subsidiaries in which we own at least 25% of the value of the subsidiary's stock. Income earned, or deemed earned, by us in connection with the performance of services would not constitute passive income. By contrast, rental income would generally constitute "passive income" unless we were treated under specific rules as deriving our rental income in the active conduct of a trade or business.
We believe that income we earn from the voyage charters, and also from time charters, for the reasons discussed below, of our Initial Fleet during our initial taxable year ended March 31, 2014 and our taxable year ended March 31, 2015, will be treated as active income for PFIC purposes and as a result, we intend to take the position that we satisfy the first leg of the PFIC criteria, the 75% income test, for our initial taxable year ended March 31, 2014, and the taxable year ended March 31, 2015.
Whether we were a PFIC for our initial taxable year ended March 31, 2014, and our taxable year ended March 31, 2015, will depend, in part, upon whether our newbuilding contracts and the deposits made thereon are treated as assets held for the production of passive income and the level of cash held on hand during each of these taxable years. In making such determination, we intend to take the position that the newbuilding contracts and the deposits thereon are assets held for the production of active income on the basis that we expect to either time or voyage charter all vessels upon their completion and delivery under the newbuilding contracts. However, there is no direct authority on this point and it is possible that the IRS may disagree with our position.
As of the date of this Annual Report, we have taken delivery of all of the vessels under our newbuilding contracts. Accordingly, based on our current and anticipated operations, we do not believe that we will be a PFIC for our taxable year ended March 31, 2016, or subsequent taxable years, and we intend to take such position for our U.S. federal income tax reporting purposes. Our belief is based principally on the position that the gross income we derive from our voyage or time chartering activities should constitute services income, rather than rental income. Accordingly, such income should not constitute passive income, and the assets that we own and operate in connection with the production of such income, in particular, the vessels, should not constitute passive assets for purposes of determining whether we are a PFIC. There is substantial legal authority supporting this position consisting of case law and IRS pronouncements concerning the
19
characterization of income derived from time charters as services income for other tax purposes. However, there is also authority which characterizes time charter income as rental income rather than services income for other tax purposes. Accordingly, no assurance can be given that the IRS or a court of law will accept this position, and there is a risk that the IRS or a court of law could determine that we are a PFIC. In addition, although we intend to conduct our affairs in a manner to avoid being classified as a PFIC with respect to any taxable year, we cannot assure you that the nature of our operations will not change in the future.
As discussed more fully below, for any taxable year in which we are, or were to be treated as, a PFIC, a United States Holder would be subject to different taxation rules depending on whether the United States Holder makes an election to treat us as a "Qualified Electing Fund," which election we refer to as a "QEF election." As an alternative to making a QEF election, a United States Holder should be able to make a "mark‑to‑market" election with respect to our common shares, as discussed below. A United States holder of shares in a PFIC will be required to file an annual information return containing information regarding the PFIC as required by applicable Treasury Regulations. We intend to promptly notify our shareholders if we determine we are a PFIC for any taxable year.
Taxation of United States Holders Making a Timely QEF Election
If a United States Holder makes a timely QEF election, which United States Holder we refer to as an "Electing Holder," the Electing Holder must report for United States federal income tax purposes its pro rata share of our ordinary earnings and net capital gain, if any, for each of our taxable years during which we are a PFIC that ends with or within the taxable year of the Electing Holder, regardless of whether distributions were received from us by the Electing Holder. No portion of any such inclusions of ordinary earnings will be treated as "qualified dividend income." Net capital gain inclusions of certain non‑corporate United States Holders would be eligible for preferential capital gains tax rates. The Electing Holder's adjusted tax basis in the common shares will be increased to reflect any income included under the QEF election. Distributions of previously taxed income will not be subject to tax upon distribution but will decrease the Electing Holder's tax basis in the common shares. An Electing Holder would not, however, be entitled to a deduction for its pro rata share of any losses that we incur with respect to any taxable year. An Electing Holder would generally recognize capital gain or loss on the sale, exchange or other disposition of our common shares. A United States Holder would make a timely QEF election for our common shares by filing one copy of IRS Form 8621 with his United States federal income tax return for the first year in which he held such shares when we were a PFIC. If we take the position that we are not a PFIC for any taxable year, and it is later determined that we were a PFIC for such taxable year, it may be possible for a United States Holder to make a retroactive QEF election effective for such year. If we were to be treated as a PFIC for our initial taxable year 2014 and our taxable year 2015, we anticipate that, based on our current projections, we would not generate significant amounts of taxable income or gain that would be required to be included in income for each such year by United States Holders who have QEF elections in effect for such year. If we determine that we are a PFIC for any taxable year, we will provide each United States Holder with all necessary information required for the United States Holder to make the QEF election and to report its pro rata share of our ordinary earnings and net capital gain, if any, for each of our taxable years during which we are a PFIC that ends with or within the taxable year of the Electing Holder as described above.
Taxation of United States Holders Making a "Mark‑to‑Market" Election
Alternatively, for any taxable year in which we determine that we are a PFIC, and, assuming as we anticipate will be the case, our shares are treated as "marketable stock," a United States Holder would be allowed to make a "mark‑to‑market" election with respect to our common shares, provided the United States Holder completes and files IRS Form 8621 in accordance with the relevant instructions and related Treasury Regulations. If that election is made, the United States Holder generally would include as ordinary income in each taxable year the excess, if any, of the fair market value of the common shares at the end of the taxable year over such Holder's adjusted tax basis in the common shares. The United States Holder would also be permitted an ordinary loss in respect of the excess, if any, of the United States Holder's adjusted tax basis in the common shares over its fair market value at the end of the taxable year, but only to the extent of the net amount previously included in income as a result of the mark‑to‑market election. A United States Holder's tax basis in his common shares would be adjusted to reflect any such income or loss amount recognized. In a year when we are a PFIC, any gain realized on the sale, exchange or other disposition of our common shares would be treated as ordinary income, and any loss realized on the sale, exchange or other disposition of the common shares would be treated as ordinary
20
loss to the extent that such loss does not exceed the net mark‑to‑market gains previously included by the United States Holder.
Taxation of United States Holders Not Making a Timely QEF or Mark‑ to‑Market Election
For any taxable year in which we determine that we are a PFIC, a United States Holder who does not make either a QEF election or a "mark‑to‑market" election for that year, whom we refer to as a "Non‑Electing Holder," would be subject to special rules with respect to (i) any excess distribution (i.e., the portion of any distributions received by the Non‑Electing Holder on the common shares in a taxable year in excess of 125% of the average annual distributions received by the Non‑Electing Holder in the three preceding taxable years, or, if shorter, the Non‑Electing Holder's holding period for the common shares), and (ii) any gain realized on the sale, exchange or other disposition of our common shares. Under these special rules:
|
· |
the excess distribution or gain would be allocated ratably over the Non‑Electing Holder's aggregate holding period for the common shares; |
|
· |
the amount allocated to the current taxable year, and any taxable year prior to the first taxable year in which we were a PFIC, would be taxed as ordinary income and would not be "qualified dividend income"; and |
|
· |
the amount allocated to each of the other taxable years would be subject to tax at the highest rate of tax in effect for the applicable class of taxpayer for that year, and an interest charge for the deemed tax deferral benefit would be imposed with respect to the resulting tax attributable to each such other taxable year. |
United States Federal Income Taxation of "Non‑United States Holders"
As used herein, the term "Non‑United States Holder" means a holder that, for United States federal income tax purposes, is a beneficial owner of common shares (other than a partnership) that is not a United States Holder.
If a partnership holds our common shares, the tax treatment of a partner will generally depend upon the status of the partner and upon the activities of the partnership. If you are a partner in a partnership holding our common shares, you are encouraged to consult your tax advisor.
Dividends on Common Shares
A Non‑United States Holder generally will not be subject to United States federal income or withholding tax on dividends received from us with respect to our common shares, unless:
|
· |
the dividend income is effectively connected with the Non‑United States Holder's conduct of a trade or business in the United States; or |
|
· |
the Non‑United States Holder is an individual who is present in the United States for 183 days or more during the taxable year of receipt of the dividend income and other conditions are met. |
Sale, Exchange or Other Disposition of Common Shares
A Non‑United States Holder generally will not be subject to United States federal income or withholding tax on any gain realized upon the sale, exchange or other disposition of our common shares, unless:
|
· |
the gain is effectively connected with the Non‑United States Holder's conduct of a trade or business in the United States; or |
21
|
· |
the Non‑United States Holder is an individual who is present in the United States for 183 days or more during the taxable year of disposition and other conditions are met. |
Income or Gains Effectively Connected with a United States Trade or Business
If the Non‑United States Holder is engaged in a United States trade or business for United States federal income tax purposes, dividends on our common shares and gain from the sale, exchange or other disposition of our common shares, that are effectively connected with the conduct of that trade or business (and, if required by an applicable income tax treaty, is attributable to a United States permanent establishment), will generally be subject to regular United States federal income tax in the same manner as discussed in the previous section relating to the taxation of United States Holders. In addition, in the case of a corporate Non‑United States Holder, its earnings and profits that are attributable to the effectively connected income, which are subject to certain adjustments, may be subject to an additional branch profits tax at a rate of 30%, or at a lower rate as may be specified by an applicable United States income tax treaty.
Backup Withholding and Information Reporting
In general, dividend payments, or other taxable distributions, and the payment of the gross proceeds on a sale of our common shares, made within the United States to a non‑corporate United States Holder will be subject to information reporting. Such payments or distributions may also be subject to backup withholding if the non‑corporate United States Holder:
|
· |
fails to provide an accurate taxpayer identification number; |
|
· |
is notified by the IRS that it has have failed to report all interest or dividends required to be shown on its federal income tax returns; or |
|
· |
in certain circumstances, fails to comply with applicable certification requirements. |
Non‑United States Holders may be required to establish their exemption from information reporting and backup withholding with respect to dividends payments or other taxable distribution on our common shares by certifying their status on an appropriate IRS Form W‑8. If a Non‑United States Holder sells our common shares to or through a United States office of a broker, the payment of the proceeds is subject to both United States backup withholding and information reporting unless the Non‑United States Holder certifies that it is a non‑United States person, under penalties of perjury, or it otherwise establish an exemption. If a Non‑ United States Holder sells our common shares through a non‑United States office of a non‑United States broker and the sales proceeds are paid outside the United States, then information reporting and backup withholding generally will not apply to that payment. However, United States information reporting requirements, but not backup withholding, will apply to a payment of sales proceeds, even if that payment is made outside the United States, if a Non‑ United States Holder sells our common shares through a non‑United States office of a broker that is a United States person or has some other contacts with the United States. Such information reporting requirements will not apply, however, if the broker has documentary evidence in its records that the Non‑United States Holder is not a United States person and certain other conditions are met, or the Non‑United States Holder otherwise establishes an exemption.
Backup withholding is not an additional tax. Rather, a refund may generally be obtained of any amounts withheld under backup withholding rules that exceed the taxpayer's United States federal income tax liability by filing a timely refund claim with the IRS.
Individuals who are United States Holders (and to the extent specified in applicable Treasury regulations, Non‑United States Holders and certain United States entities) who hold "specified foreign financial assets" (as defined in Section 6038D of the Code) are required to file IRS Form 8938 with information relating to the asset for each taxable year in which the aggregate value of all such assets exceeds $75,000 at any time during the taxable year or $50,000 on the last day of the taxable year (or such higher dollar amount as prescribed by applicable Treasury Regulations). Specified foreign
22
financial assets would include, among other assets, our common shares, unless the common shares are held in an account maintained with a United States financial institution. Substantial penalties apply to any failure to timely file IRS Form 8938, unless the failure is shown to be due to reasonable cause and not due to willful neglect. Additionally, in the event an individual United States Holder (and to the extent specified in applicable Treasury Regulations, a Non‑United States Holder or a United States entity) that is required to file IRS Form 8938 does not file such form, the statute of limitations on the assessment and collection of United States federal income taxes of such holder for the related tax year may not close until three years after the date that the required information is filed. United States Holders (including United States entities) and Non‑United States Holders are encouraged consult their own tax advisors regarding their reporting obligations in respect of our common shares.
Available Information
Our website is located at www.dorianlpg.com. Information on our website does not constitute a part of this annual report. Our goal is to maintain our website as a portal through which investors can easily find or navigate, free of charge, to pertinent information about us, including our annual reports on Form 10-K, quarterly reports on Form 10-Q, current reports on Form 8-K, and our proxy statements, after we file them with the Commission. Additionally, these materials, including this annual report and the accompanying exhibits, may be inspected and copied at the public reference facilities maintained by the Commission at 100 F Street, N.E. Washington, D.C. 20549, or from the Commission’s website http://www.sec.gov.
Shareholders may also request a copy of our filings at no cost, by writing or telephoning us at the following address: Dorian LPG c/o Dorian LPG (USA) LLC, 27 Signal Road, Stamford, CT 06902, +1 (203) 674-9900.
The following risks relate principally to us and our business and the industry in which we operate. Other risks relate principally to the securities markets and ownership of our common shares. Any of the risk factors described below could significantly and negatively affect our business, financial condition and results of operations and our ability to pay dividends, and lower the trading price of our common shares. You may lose part or all of your investment.
Risks Relating to Our Company
We and the Helios Pool operate exclusively in the LPG shipping industry. Due to our lack of diversification and the lack of diversification of the Helios Pool, adverse developments in the LPG shipping industry may adversely affect our business, financial condition and operating results.
We currently rely exclusively on the cash flow generated from the vessels in our fleet, all of which are VLGCs operating in the LPG shipping industry (including through the Helios Pool). Unlike some other shipping companies, which have vessels of varying sizes that can carry different cargoes, such as containers, dry bulk, crude oil and oil products, we expect to depend exclusively on VLGCs transporting LPG. Similarly, the Helios Pool also depends exclusively on the cash flow generated from VLGCs operating in the LPG shipping industry. Our lack of diversification and the lack of diversification of the Helios Pool make us vulnerable to adverse developments in the LPG shipping industry, which would have a significantly greater impact on our business, financial condition and operating results than it would if we or the Helios Pool owned and operated more diverse assets or engaged in more diverse lines of business.
We and/or our pool managers may not be able to successfully secure employment for our vessels or vessels in the Helios Pool, which could adversely affect our financial condition and results of operations.
As of May 26, 2016, including through the Helios Pool, sixteen of our vessels are operating in the spot market and six of our vessels are on time charters that expire between the third calendar quarter of 2016 and the fourth calendar quarter of 2020. We cannot assure you that we will be successful in finding employment for our vessels in the spot market, on time charters or otherwise, or that any employment will be at profitable rates. Moreover, as vessels entered into the Helios Pool are commercially managed by our wholly-owned subsidiary and Phoenix, we also cannot assure you that we or they will be successful in finding employment for the vessels in the Helios Pool or that any employment will be
23
profitable. An inability to locate suitable employment for our vessels or the vessels in the Helios Pool could affect our general financial condition, results of operation and cash flow as well as the availability of financing.
Furthermore, the Helios Pool will time charter-in certain VLGCs from Oriental Energy at a fixed time charter hire rate, which will be due regardless of whether we and Phoenix are able to locate suitable employment for the vessels in the Helios Pool. As a result of these fixed expenses, there is an increased risk that an inability to locate suitable employment for the vessels in the Helios Pool could affect our general financial condition, results of operation and cash flow.
We will face substantial competition in trying to expand relationships with existing customers and obtain new customers.
The process of obtaining new charter agreements is highly competitive and generally involves an intensive screening process and competitive bidding process, which, in certain cases, extends for several months. Contracts are awarded based upon a variety of factors, including:
|
· |
the location, size, age, and condition of a vessel; |
|
· |
the operator's industry relationships, experience and reputation for customer service, quality operations and safety; |
|
· |
the quality, experience and technical capability of the crew; |
|
· |
the experience of the crew with the operator and type of vessel; |
|
· |
the operator's relationships with shipyards and the ability to get suitable berths; |
|
· |
the operator's construction management experience, including the ability to obtain on‑time delivery of new vessels according to customer specifications; |
|
· |
the operator's willingness to accept operational risks pursuant to the charter, such as allowing termination of the charter for force majeure events; and |
|
· |
the competitiveness of the bid in terms of overall price. |
Our vessels, and the vessels operating in the Helios Pool, operate in a highly competitive market and we expect substantial competition for providing transportation services from a number of companies (both LPG vessel owners and operators). We anticipate that an increasing number of maritime transport companies, including many with strong reputations and extensive resources and experience, will enter the LPG shipping market. Our existing and potential competitors may have significantly greater financial resources than us. In addition, competitors with greater resources may have larger fleets, or could operate larger fleets through consolidations, acquisitions, newbuildings or pooling of their vessels with other companies, and, therefore, may be able to offer a more competitive service than us or the Helios Pool, including better charter rates. We expect competition from a number of experienced companies providing contracts for gas transportation services to potential LPG customers, including state-sponsored entities and major energy companies affiliated with the projects requiring shipping services. As a result, we (including the Helios Pool) may be unable to expand our relationships with existing customers or to obtain new customers on a profitable basis, if at all, which would have a material adverse effect on our business, financial condition and operating results.
We and the Helios Pool are exposed to fluctuations in spot market charter rates, including as a result of seasonal fluctuations, which may adversely affect our earnings.
As of the date of this annual report, sixteen of our twenty-two vessels operate in the spot market through the Helios Pool. This exposes us to fluctuations in spot market charter rates. We also employ six of our VLGCs (including through the Helios Pool) on time charters. As these time charters expire, we may employ these vessels in the spot market. The spot charter market can fluctuate significantly based upon the supply of and demand for LPG carriers. In the recent past, there have been periods when spot charter rates have declined below the operating costs of vessels. If future spot
24
charter rates decline, or remain depressed, then we may not profitably operate our vessels trading in the spot market or those participating in the Helios Pool, meet our obligations, including payments on indebtedness, or pay dividends.
In addition, VLGC spot market rates are highly seasonal, with typical strength in the second and third calendar quarters as suppliers build inventory for high consumption during the northern hemisphere winter. The successful operation of our vessels in the competitive and highly volatile spot charter market depends on, among other things, obtaining profitable spot charters, which depends greatly on vessel supply and demand, and minimizing, to the extent possible, time spent waiting for charters and time spent traveling unladen to pick up cargo.
Although our six time charters generally provide reliable revenues, they also limit the portion of our fleet available for spot market voyages during an upswing in the market when spot market voyages might be more profitable. Conversely, when the current charters for the six vessels in our fleet on time charter expire (or are terminated early), it may not be possible to re-charter these vessels at similar or higher rates, or at all. As a result, we may have to accept lower rates or experience off hire time for our vessels, which would adversely impact our revenues, results of operations and financial condition.
We and the Helios Pool are subject to risks with respect to counterparties, and failure of such counterparties to meet their obligations could cause us to suffer losses or negatively impact our results of operations and cash flows.
We have entered into, and expect to enter into in the future, various contracts, including charter agreements, and contracts of affreightment, shipbuilding contracts and credit facilities that subject us to counterparty risks. Similarly, the Helios Pool has entered into, and expects to enter into in the future, various contracts, including charters and contracts of affreightment, that subject it to counterparty risks. The ability and willingness of our and the Helios Pool’s counterparties to perform their obligations under any contract will depend on a number of factors that are beyond our control and may include, among other things, general economic conditions, the condition of the maritime and LPG industries, the overall financial condition of the counterparty, charter rates for specific types of vessels, and various expenses. For example, a reduction of cash flow resulting from declines in world trade or the lack of availability of debt or equity financing may result in a significant reduction in the ability of our charterers or the Helios Pool’s charterers to make required charter payments. In addition, in depressed market conditions, charterers and customers may no longer need a vessel that is then under charter or contract or may be able to obtain a comparable vessel at lower rates. As a result, charterers and customers may seek to renegotiate the terms of their existing charter agreements or avoid their obligations under those contracts. Should a counterparty fail to honor its obligations under agreements with us or the Helios Pool, we could sustain significant losses and a significant reduction in the charter hire we earn from the Helios Pool, which could have a material adverse effect on our business, financial condition, results of operations and cash flows.
We expect to be dependent on a limited number of customers for a material part of our revenues, and failure of such customers to meet their obligations could cause us to suffer losses or negatively impact our results of operations and cash flows.
For the year ended March 31, 2016, the Helios Pool and one other individual charterer accounted for 70% and 12% of our total revenues, respectively. Within the Helios Pool, two charterers represented 19% and 14% of net pool revenues—related party for the year ended March 31, 2016. We expect that a material portion of our revenues will continue to be derived from these customers. The ability of each of our customers to perform its obligations under a contract with us will depend on a number of factors that are beyond our control. Should the aforementioned customers fail to honor their obligations under agreements with us, we could sustain material losses that could have a material adverse effect on our business, financial condition, results of operations and cash flows.
Our indebtedness may adversely affect our operational flexibility and financial condition.
As of March 31, 2016 we had outstanding indebtedness of $836.4 million. Amounts owed under our current credit facilities and any future credit facilities will require us to dedicate a part of our cash flow from operations to paying interest and principal payments. These payments will limit funds available for working capital, capital expenditures, acquisitions, dividends, and other purposes and may also limit our ability to undertake further equity or debt financing in the future. Our indebtedness also increases our vulnerability to general adverse economic and industry conditions, limits our
25
flexibility in planning for and reacting to changes in the industry, and places us at a disadvantage to other, less leveraged, competitors.
Our credit facilities bear interest at variable rates and we anticipate that any future credit facilities will also bear interest at variable rates. Increases in prevailing rates could increase the amounts that we would have to pay to our lenders or financing counterparties, even though the outstanding principal amount remains the same, and our net income and available cash flows would decrease as a result.
We expect our earnings and cash flow to vary from year to year due to the cyclical nature of the LPG shipping industry. If we do not generate or reserve enough cash flow from operations to satisfy our financing obligations, we may have to undertake alternative financing plans, such as:
seeking to raise additional capital;
refinancing or restructuring our debt or financing obligations;
selling LPG tankers; and/or
reducing or delaying capital investments.
However, these alternative financing plans, if necessary, may not be sufficient to allow us to meet our debt obligations. If we are unable to meet our debt obligations and we default on our obligations under our debt agreements, our lenders could elect to declare our outstanding borrowings and certain other or amounts owed, together with accrued interest and fees, to be immediately due and payable and foreclose on the vessels securing that debt.
Our existing and future debt agreements contain and are expected to contain restrictive covenants that may limit our liquidity and corporate activities, which could have an adverse effect on our financial condition and results of operations.
Our debt agreements contain, and any future financing arrangements are expected to contain, customary covenants and event of default clauses, including cross‑default provisions and restrictive covenants and performance requirements, which may affect operational and financial flexibility. Such restrictions could affect, and in many respects limit or prohibit, among other things, our ability to pay dividends, incur additional indebtedness, create liens, sell assets, or engage in mergers or acquisitions. These restrictions could limit our ability to plan for or react to market conditions or meet extraordinary capital needs or otherwise restrict corporate activities. There can be no assurance that such restrictions will not adversely affect our ability to finance our future operations or capital needs.
Our agreements relating to the 2015 Debt Facility, which is secured by, among other things, eighteen of our VLGCs, and our term loan facility with the Royal Bank of Scotland, or the RBS Loan Facility, which is secured by, among other things, four of our VLGCs, require us to maintain specified financial ratios and satisfy financial covenants.
In addition, under the 2015 Debt Facility, our payment of dividends to shareholders as well as our subsidiary’s payment of dividends to us is subject to no event of default. Similarly, under the RBS Loan Facility, our payment of dividends to our shareholders is subject to no event of default and our subsidiaries which are party to the facility are prohibited from paying dividends to us without the consent of the lender.
As of March 31, 2016, we are in compliance with our loan covenants.
As a result of the restrictions in our debt agreements, or similar restrictions in our future financing arrangements, we may need to seek permission from our lenders in order to engage in some corporate actions. Our lenders' interests may be different from ours and we may not be able to obtain their permission when needed. This may prevent us from taking actions that we believe are in our best interest which may adversely impact our revenues, results of operations and financial condition.
26
A failure by us to meet our payment and other obligations, including our financial and value to loan covenants, could lead to defaults under our secured loan agreements. In addition, a default under one of our credit facilities could result in the cross-acceleration of our other indebtedness. Our lenders could then accelerate our indebtedness and foreclose on our fleet.
The market values of our vessels may decrease, which could cause us to breach covenants in our loan agreements or record an impairment or loss, or negatively impact our ability to enter into future financing arrangements, and as a result could have a material adverse effect on our business, financial condition and results of operations.
Our existing debt agreements, which are secured by, among other things, liens on the vessels in our fleet contain various financial covenants, including requirements that relate to our financial condition, operating performance and liquidity. For example, we are required to maintain a minimum debt to adjusted equity ratio that is based, in part, upon the market value of the vessels securing the applicable loan, as well as a minimum ratio of the market value of the vessels securing a loan to the principal amount outstanding under such loan. The market value of LPG carriers, is sensitive to, among other things, changes in the LPG carrier charter markets, with vessel values deteriorating in times when LPG carrier charter rates are falling and improving when charter rates are anticipated to rise. While the market values of LPG carriers generally have increased since the economic slowdown in 2008-2009, they still remain below the historic high levels from prior to the economic slowdown. LPG vessel values remain subject to significant fluctuation. A decline in the fair market values of our vessels could result in our not being in compliance with these loan covenants. Furthermore, if the value of our vessels deteriorates and our estimated future cash flows decrease, we may have to record an impairment adjustment in our financial statements or we may be unable to enter into future financing arrangements acceptable to us or at all, which would adversely affect our financial results and further hinder our ability to raise capital.
If we are unable to comply with any of the restrictions and covenants in our debt agreements, or in current or future debt financing agreements, and we are unable to obtain a waiver or amendment from our lenders for such noncompliance, a default could occur under the terms of those agreements. Our ability to comply with these restrictions and covenants, including meeting financial ratios and tests, is dependent on our future performance and may be affected by events beyond our control. If a default occurs under these agreements, lenders could terminate their commitments to lend or in some circumstances accelerate the outstanding loans and declare all amounts borrowed due and payable. Our vessels serve as security under our debt agreements. If our lenders were to foreclose their liens on our vessels in the event of a default, this may impair our ability to continue our operations. In addition, our debt agreements contain cross-default provisions, meaning that if we are in default under one of our debt agreements, amounts outstanding under our other debt agreements may also be in default, accelerated and become due and payable. If any of these events occur, we cannot guarantee that our assets will be sufficient to repay in full all of our outstanding indebtedness, and we may be unable to find alternative financing. Even if we could obtain alternative financing, that financing might not be on terms that are favorable or acceptable to us. In addition, if we find it necessary to sell our vessels at a time when vessel prices are low, we will recognize losses and a reduction in our earnings, which could affect our ability to raise additional capital necessary for us to comply with our debt agreements.
We are exposed to volatility in the London Interbank Offered Rate, or LIBOR, and we have and we intend to selectively enter into derivative contracts, which can result in higher than market interest rates and charges against our income.
The amounts outstanding under our existing credit facilities have been advanced at a floating rate based on LIBOR, which has recently been stable, but was volatile in prior years, and changes in LIBOR could affect the amount of interest payable on our debt, and, in turn, could have an adverse effect on our earnings and cash flow. In recent years, LIBOR has been at relatively low levels, but it may rise in the future as the current low interest rate environment comes to an end. Our financial condition could be materially adversely affected if LIBOR rises, as $271.5 million of our floating rate borrowings are unhedged as of March 31, 2016.
We have entered into and may selectively in the future enter into derivative contracts to hedge our overall exposure to interest rate risk exposure related to our credit facilities. Entering into swaps and derivatives transactions is inherently risky and presents various possibilities for incurring significant expenses. The derivatives strategies that we employ currently and in the future may not be successful or effective, and we could, as a result, incur substantial additional interest costs or losses.
27
Investments in derivative instruments, such as forward freight agreements, could result in losses.
From time to time, we may take hedging or speculative positions in derivative instruments, including freight forward agreements, or FFAs. Upon settlement, if an FFA contracted charter rate is less than the average of the rates, as reported by an identified index, for the specified route and period, the seller of the FFA is required to pay the buyer an amount equal to the difference between the contracted rate and the settlement rate, multiplied by the number of days in the specified period. Conversely, if the contracted rate is greater than the settlement rate, the buyer is required to pay the seller the settlement sum. If we take positions in FFAs or other derivative instruments and do not correctly anticipate charter rate movements over the specified route and time period, we could suffer losses in the settling or termination of the FFA. This could adversely affect our results of operations and cash flows.
Because we generate all of our revenues in U.S. dollars but incur a portion of our expenses in other currencies, exchange rate fluctuations could adversely affect our results of operations.
We generate all of our revenues in U.S. dollars and the majority of our expenses are also in U.S. dollars. However, a portion of our overall expenses is incurred in other currencies, particularly the Euro, British Pound Sterling, the Japanese Yen, Norwegian Krone and the Singapore Dollar. Changes in the value of the U.S. dollar relative to the other currencies, in particular the Euro, or the amount of expenses we incur in other currencies could cause fluctuations in our net income.
Our ECO VLGCs have a limited operational history and inconsistencies in their performance, the failure of such vessels to achieve the level of fuel savings or other cost savings we anticipate could, or any initial operational difficulties with such vessels could have a material adverse effect on our results of operations, financial condition and cash flows.
We cannot assure you that our ECO VLGCs will perform in accordance with our expectations. Our ECO VLGCs are based on innovative new ECO designs, which have only limited operational history, thus exposing us to potential uncertainties. Our ECO VLGCs incorporate many technological improvements related to their Eco-design, such as more efficient hull forms matched with more efficient propellers and decreased water resistance, which optimize speed and fuel consumption and reduce emissions. While we expect these Eco-design vessels to achieve fuel savings and other cost savings over non-Eco-design vessels, increasing demand for these vessels, there is no assurance they will actually achieve the level of savings over non Eco-design vessels that we anticipate. If they do not achieve the benefits we anticipate or have other operational difficulties, competition from other vessels without these technological improvements, which generally have lower charter rates, could adversely affect the rates at which we can charter our ECO VLGCs, which may result in a material adverse effect on our results of operations.
If we fail to manage our growth properly, we may not be able to successfully expand our fleet and may incur significant expenses and losses.
As and when market conditions permit, we intend to continue to prudently grow our fleet over the long term, in addition to the nineteen ECO VLGCs that were delivered between July 2014 and February 2016. Acquisition opportunities may arise from time to time, and any such acquisition could be significant. Successfully consummating and integrating acquisitions will depend on:
|
· |
locating and acquiring suitable vessels at a suitable price; |
|
· |
identifying and completing acquisitions or joint ventures; |
|
· |
integrating any acquired LPG carriers or businesses successfully with our existing operations; |
|
· |
hiring, training and retaining qualified personnel and crew to manage and operate our growing business and fleet; |
|
· |
expanding our customer base; and |
|
· |
obtaining required financing. |
28
Certain acquisition and investment opportunities may not result in the consummation of a transaction. Any acquisition could involve the payment by us of a substantial amount of cash, the incurrence of a substantial amount of debt or the issuance of a substantial amount of equity. In addition, we may not be able to obtain acceptable terms for the required financing for any such acquisition or investment that arises.
Growing a business by acquisition presents numerous risks such as undisclosed liabilities and obligations, difficulty in obtaining additional qualified personnel, managing relationships with customers and suppliers and integrating newly acquired vessels into existing infrastructures. Moreover, acquiring any business is subject to risks related to incorrect assumptions regarding the future results of acquired operations or assets or expected cost reductions or other synergies expected to be realized as a result of acquiring operations or assets.
Additionally, the expansion of our fleet may impose significant additional responsibilities on our management and staff, including the management and staff of our in-house commercial and technical managers, and may necessitate that we increase the number of personnel. Further, there is the risk that we may fail to successfully and timely integrate the operations or management of any acquired businesses or assets and the risk of diverting management's attention from existing operations or other priorities. If we fail to consummate and integrate our acquisitions in a timely and cost‑effective manner, our financial condition, results of operations and ability to pay dividends, if any, to our shareholders could be adversely affected. Moreover, we cannot predict the effect, if any, that any announcement or consummation of an acquisition would have on the trading price of our common shares.
An inability to effectively time investments in and divestments of vessels could prevent the implementation of our business strategy and negatively impact our results of operations and financial condition.
Our strategy is to own and operate a fleet large enough to provide global coverage, but no larger than what the demand for our services can support over a longer period by both contracting newbuildings and through acquisitions and divestitures in the second-hand market. Our business is greatly influenced by the timing of investments and/or divestments and contracting of newbuildings. If we are unable able to identify the optimal timing of such investments, divestments or contracting of newbuildings in relation to the shipping value cycle due to capital restraints, this could have a material adverse effect on our competitive position, future performance, results of operations, cash flows and financial position.
As our fleet grows in size, we may need to improve our operations and financial systems and recruit additional staff and crew; if we cannot improve these systems or recruit suitable employees, our business and results of operations may be adversely affected.
As and when market conditions permit, we intend to continue to prudently grow our fleet over the long term, and as a consequence of this, we may have to invest in upgrading our operating and financial systems. In addition, we may have to recruit well‑qualified seafarers and shoreside administrative and management personnel. We may not be able to hire suitable employees to the extent we continue to expand our fleet. Our vessels require technically skilled staff with specialized training. If our crewing agents are unable to employ such technically skilled staff, they may not be able to adequately staff our vessels. If we are unable to operate our financial and operations systems effectively or we are unable to recruit suitable employees as we expand our fleet, our results of operation and our ability to expand our fleet may be adversely affected.
We may be unable to attract and retain key management personnel and other employees in the shipping industry without incurring substantial expense as a result of rising crew costs, which may negatively affect the effectiveness of our management and our results of operations.
The successful development and performance of our business depends on our ability to attract and retain skilled professionals with appropriate experience and expertise. Any loss of the services of any of the senior management or key personnel could have a material adverse effect on our business and operations.
29
Additionally, obtaining voyage and time charters with leading industry participants depends on a number of factors, including the ability to man vessels with suitably experienced, high-quality masters, officers and crew. In recent years, the limited supply of and increased demand for well-qualified crew has created upward pressure on crewing costs, which we generally bear under our time and spot charters. Increases in crew costs may adversely affect our profitability. In addition, if we cannot retain sufficient numbers of quality on-board seafaring personnel, our fleet utilization will decrease, which could have a material adverse effect on our business, results of operations, cash flows and financial condition.
Our directors and officers may in the future hold direct or indirect interests in companies that compete with us.
Our directors and officers each have a history of involvement in the shipping industry and may, in the future, directly or indirectly, hold investments in companies that compete with us. In that case, they may face conflicts between their own interests and their obligations to us.
We cannot provide assurance that our directors and officers will not be influenced by their interests in or affiliation with other shipping companies, or our competitors, and seek to cause us to take courses of action that might involve risks to our other shareholders or adversely affect us or our shareholders.
Our business and operations involve inherent operating risks, and our insurance and indemnities from our customers may not be adequate to cover potential losses from our operations.
Our vessels are subject to a variety of operational risks caused by adverse weather conditions, mechanical failures, human error, war, terrorism, piracy, or other circumstances or events. We procure hull and machinery insurance, protection and indemnity insurance, which includes environmental damage and pollution insurance coverage, and war risk insurance for our fleet. While we endeavor to be adequately insured against all known risks related to the operation of our ships, there remains the possibility that a liability may not be adequately covered and we may not be able to obtain adequate insurance coverage for our fleet in the future. The insurers may also not pay particular claims. Even if our insurance coverage is adequate, we may not be able to timely obtain a replacement vessel in the event of a loss. There can be no assurance that such insurance coverage will remain available at economic rates. Furthermore, such insurance coverage will contain deductibles, limitations and exclusions, which are standard in the shipping industry and may increase our costs or lower our revenue if applied in respect of any claim.
We may be unable to procure adequate insurance coverage at commercially reasonable rates in the future.
We may not be able to obtain adequate insurance coverage at reasonable rates in the future during adverse insurance market conditions. For example, more stringent environmental regulations have led in the past to increased costs for, and in the future may result in the lack of availability of, insurance against risks of environmental damage or pollution. A marine disaster could exceed our insurance coverage, which could harm our business, financial condition and operating results. Any uninsured or underinsured loss could harm our business and financial condition. In addition, our insurance may be voidable by the insurers as a result of certain of our actions, such as our vessels failing to maintain certification with applicable maritime self-regulatory organizations.
Changes in the insurance markets attributable to terrorist attacks may also make certain types of insurance more difficult for us to obtain. In addition, upon renewal or expiration of our current policies, the insurance that may be available to us may be significantly more expensive than our existing coverage.
Because we will obtain some of our insurance through protection and indemnity associations, we may be required to make additional premium payments.
Although we believe we carry protection and indemnity insurance consistent with industry standards, all risks may not be adequately insured against, and any particular claim may not be paid. Any claims covered by insurance would be subject to deductibles, and since it is possible that a large number of claims may be brought, the aggregate amount of these deductibles could be material. Certain of our insurance coverage is maintained through mutual protection and indemnity associations, and as a member of such associations we may be required to make additional payments, or calls,
30
over and above budgeted premiums if member claims exceed association reserves. These calls will be in amounts based on our claim records, as well as the claim records of other members of the protection and indemnity associations through which we receive insurance coverage for tort liability, including pollution-related liability. In addition, our protection and indemnity associations may not have enough resources to cover claims made against them. Our payment of these calls could result in significant expense to us, which could have a material adverse effect on our business, results of operations, cash flows, financial condition, and ability to pay dividends.
We may incur substantial costs for the drydocking, maintenance or replacement of our vessels as they age, and, as our vessels age, the risks associated with older vessels could adversely affect our ability to obtain profitable charters.
The drydocking of our vessels requires significant capital expenditures and loss of revenue while our vessels are off‑hire. Any significant increase in the number of days of off‑hire due to such drydocking or in the costs of any repairs could have a material adverse effect on our business, results of operations, cash flows and financial condition. Although we do not anticipate that more than one vessel will be out of service at any given time, we may underestimate the time required to drydock our vessels, or unanticipated problems may arise.
In addition, although all of our vessels were built within the past ten years, we estimate that our vessels have a useful life of 25 years. In general, the costs to maintain a vessel in good operating condition increases with the age of the vessel. Older vessels are typically less fuel-efficient than more recently constructed vessels due to improvements in engine technology. Cargo insurance rates increase with the age of a vessel, making older vessels less desirable to charterers.
As our vessels become older, we may have to replace such vessels upon the expiration of their useful lives. Unless we maintain reserves or are able to borrow or raise funds for vessel replacement, we will be unable to replace such older vessels. The inability to replace the vessels in our fleet upon the expiration of their useful lives could have a material adverse effect on our business, results of operations, cash flows and financial condition. Any reserves set aside for vessel replacement will not be available for the payment of dividends to shareholders.
If we purchase secondhand vessels, we will be exposed to increased costs which could adversely affect our earnings.
We may acquire secondhand vessels in the future, and while we typically inspect secondhand vessels prior to purchase, this does not provide us with the same knowledge about their condition that we would have had if these vessels had been built for and operated exclusively by us. A secondhand vessel may have conditions or defects that we were not aware of when we bought the vessel and which may require us to incur costly repairs to the vessel. These repairs may require us to put a vessel into drydock which would reduce our fleet utilization and increase our operating costs.
SeaDor Holdings, Kensico Capital Management, HNA Group Co. Ltd., John C. Hadjipateras, BW Group, Ltd. and Wellington Management Group LLP each have a substantial ownership stake in us, and their interests could conflict with the interests of our other shareholders.
According to information contained in public filings, our principal shareholders include SeaDor Holdings, an affiliate of SEACOR Holdings, Inc. (NYSE:CKH), Kensico Capital Management; Sino Energy Holdings LLC and HNA Logistics LP, affiliates of HNA Group Co., Ltd.; John C. Hadjipateras, our Chief Executive Officer, President and Chairman of the Board of Directors; BW Euroholdings Ltd., an affiliate of BW Group Ltd.; and Wellington Management Group LLP, or our Principal Shareholders, and as of May 26, 2016, they own, or may be deemed to beneficially own, 16.5%, 14.4%, 11.6%, 11.1%, 10.8% and 9.6%, respectively, of our total shares outstanding. SeaDor Holdings, Kensico Capital Management, and John C. Hadjipateras are represented on our Board of Directors. As a result of this substantial ownership interest and, as applicable, their participation on the Board of Directors, our Principal Shareholders currently have the ability to influence certain actions requiring shareholders' approval, including increasing or decreasing the authorized share capital, the election of directors, declaration of dividends, the appointment of management, and other policy decisions. While any future transaction with our Principal Shareholders could benefit us, their interests could at times conflict with the interests of our other shareholders. Conflicts of interest may arise between us and our Principal Shareholders or their affiliates, which may result in the conclusion of transactions on terms not determined by market forces. Any such conflicts of interest could adversely affect our business, financial condition and results of operations, and the trading price of our common shares. Moreover, the concentration of ownership may delay, deter or prevent acts that
31
would be favored by our other shareholders or deprive shareholders of an opportunity to receive a premium for their shares as part of a sale of our business. Similarly, this concentration of share ownership may adversely affect the trading price of our shares because investors may perceive disadvantages in owning shares in a company with concentrated ownership.
United States tax authorities could treat us as a "passive foreign investment company," which could have adverse United States federal income tax consequences to United States holders.
A foreign corporation will be treated as a PFIC for United States federal income tax purposes if either (1) at least 75% of its gross income for any taxable year consists of "passive income" or (2) at least 50% of the average value of the corporation's assets produce or are held for the production of "passive income." For purposes of these tests, "passive income" generally includes dividends, interest, and gains from the sale or exchange of investment property and rents and royalties other than rents and royalties which are received from unrelated parties in connection with the active conduct of a trade or business. For purposes of these tests, income derived from the performance of services generally does not constitute "passive income." United States shareholders of a PFIC are subject to an adverse United States federal income tax regime with respect to the income derived by the PFIC, the distributions they receive from the PFIC and the gain, if any, they derive from the sale or other disposition of their shares in the PFIC.
Whether we were a PFIC for our initial taxable year 2014 and our taxable year 2015 will depend, in part, upon whether our newbuilding contracts and the deposits made thereon are treated as assets held for the production of passive income and the level of cash held on hand during each of these taxable years. In making such determination, we intend to take the position that the newbuilding contracts and the deposits thereon are assets held for the production of active income on the basis that we expect to either time or voyage charter all vessels upon their completion and delivery under the newbuilding contracts. However, there is no direct authority on this point and it is possible that the IRS may disagree with our position.
Whether we will be treated as a PFIC for our taxable year 2016 and subsequent taxable years will depend upon the nature and extent of our operations. In this regard, we intend to treat the gross income we derive from our voyage and time chartering activities as services income, rather than rental income. Accordingly, such income should not constitute passive income, and the assets that we own and operate in connection with the production of such income, in particular, our vessels, should not constitute passive assets for purposes of determining whether we are a PFIC. There is substantial legal authority supporting this position consisting of case law and the United States Internal Revenue Service, or the IRS, pronouncements concerning the characterization of income derived from time charters as services income for other tax purposes. However, there is also authority which characterizes time charter income as rental income rather than services income for other tax purposes. Accordingly, no assurance can be given that the IRS or a court of law will accept this position, and there is a risk that the IRS or a court of law could determine that we are a PFIC. In addition, although we intend to conduct our affairs in a manner to avoid being classified as a PFIC with respect to any taxable year, we cannot assure you that the nature of our operations will not change in the future.
For any taxable year in which we are, or were to be treated as, a PFIC, United States shareholders would face adverse United States federal income tax consequences. Under the PFIC rules, unless a shareholder makes an election available under the U.S. Internal Revenue Code of 1986, as amended, or the Code, (which election could itself have adverse consequences for such shareholders, as discussed below under "Item 1. Taxation—United States Federal Income Tax Considerations—United States Federal Income Taxation of United States Holders"), excess distributions and any gain from the disposition of such shareholder's common shares would be allocated ratably over the shareholder's holding period of the common shares and the amounts allocated to the taxable year of the excess distribution or sale or other disposition and to any year before we became a PFIC would be taxed as ordinary income. The amount allocated to each other taxable year would be subject to tax at the highest rate in effect for individuals or corporations, as appropriate, for that taxable year, and an interest charge would be imposed with respect to such tax. See "Item 1. Taxation—United States Federal Income Tax Considerations—United States Federal Income Taxation of United States Holders" for a more comprehensive discussion of the United States federal income tax consequences to United States shareholders if we are treated as a PFIC.
32
We may have to pay tax on United States source shipping income, which would reduce our earnings.
Under the Code, 50% of the gross shipping income of a corporation that owns or charters vessels, as we and our subsidiaries do, that is attributable to transportation that begins or ends, but that does not both begin and end, in the United States may be subject to a 4%, or an effective 2%, United States federal income tax without allowance for deduction, unless that corporation qualifies for exemption from tax under Section 883 of the Code and the applicable Treasury Regulations promulgated thereunder.
We believe that we qualify, and we expect to qualify, for exemption under Section 883 for our taxable years ended March 31, 2016 and our subsequent taxable years and we intend to take this position for United States federal income tax return reporting purposes. However, there are factual circumstances beyond our control that could cause us to lose the benefit of this tax exemption and thereby become subject to United States federal income tax on our United States source shipping income. For example, we would no longer qualify for exemption under Section 883 of the Code for a particular taxable year if certain "non‑qualified" shareholders with a 5% or greater interest in our common shares owned, in the aggregate, 50% or more of our outstanding common shares for more than half the days during the taxable year. Due to the factual nature of the issues involved, there can be no assurances on that we or any of our subsidiaries will qualify for exemption under Section 883 of the Code.
If we or our subsidiaries were not entitled to exemption under Section 883 of the Code for any taxable year based on our failure to satisfy the publicly‑traded test, we or our subsidiaries would be subject for such year to an effective 2% United States federal income tax on the gross shipping income we or our subsidiaries derive during the year that is attributable to the transport of cargoes to or from the United States. The imposition of this taxation would have a negative effect on our business and would decrease our earnings available for distribution to our shareholders.
Risks Relating to our Industry
The cyclical nature of the demand for LPG transportation may lead to significant changes in charter rates, vessel utilization and vessel values, which may adversely affect our revenues, profitability and financial condition.
Historically, the LPG shipping market has been cyclical with attendant volatility in profitability, charter rates and vessel values. The degree of charter rate volatility among different types of gas carriers has varied widely. Because many factors influencing the supply of, and demand for, vessel capacity are unpredictable, the timing, direction and degree of changes in the LPG shipping market are also not predictable. If charter rates decline, our earnings may decrease, particularly with respect to our vessels deployed in the spot market, including through the Helios Pool, but also with respect to our other vessels when their charters expire, as they may not be rechartered on favorable terms when compared to the terms of the expiring charters. Accordingly, a decline in charter rates would have an adverse effect on our revenues, profitability, liquidity, cash flow and financial position.
Future growth in the demand for LPG carriers and charter rates will depend on economic growth in the world economy and demand for LPG product transportation that exceeds the capacity of the growing worldwide LPG carrier fleet. We believe that the future growth in demand for LPG carriers and the charter rate levels for LPG carriers will depend primarily upon the supply and demand for LPG, particularly in the economies of China, India, Japan, Southeast Asia, the Middle East and the U.S. and upon seasonal and regional changes in demand and changes to the capacity of the world fleet. The capacity of the world LPG shipping fleet appears likely to increase in the near term. Economic growth may be limited in the near term, and possibly for an extended period, as a result of the current global economic conditions, which could have an adverse effect on our business and results of operations.
The factors affecting the supply of and demand for LPG carriers are outside of our control, and the nature, timing and degree of changes in industry conditions are unpredictable.
The factors that influence demand for our vessels include:
|
· |
global or regional economic or political conditions, particularly in LPG consuming regions; |
33
|
· |
changes in global or general industrial activity specifically in the plastics and chemical industries; |
|
· |
changes in the cost of petroleum and natural gas from which LPG is derived; |
|
· |
changes in the consumption of LPG or natural gas due to availability of new, alternative energy sources or changes in the price of LPG or natural gas relative to other energy sources or other factors making consumption of LPG or natural gas less attractive; |
|
· |
supply of and demand for LPG products; |
|
· |
the development and location of production facilities for LPG products; |
|
· |
regional imbalances in production and demand of LPG products; |
|
· |
the distance LPG and LPG products are to be moved by sea; |
|
· |
worldwide production of natural gas; |
|
· |
availability of competing LPG vessels; |
|
· |
availability of alternative transportation means, including pipelines for LPG, which are currently few in number, linking production areas and industrial and residential areas consuming LPG, or the conversion of existing non‑petroleum gas pipelines to petroleum gas pipelines in those markets; |
|
· |
changes in seaborne and other transportation patterns; |
|
· |
development and exploitation of alternative fuels and non-conventional hydrocarbon production; |
|
· |
governmental regulations, including environmental or restrictions on offshore transportation of natural gas; |
|
· |
local and international political, economic and weather conditions; |
|
· |
domestic and foreign tax policies; and |
|
· |
accidents, severe weather, natural disasters and other similar incidents relating to the natural gas industry. |
The factors that influence the supply of vessel capacity include:
|
· |
the number of newbuilding deliveries (including the equivalent of 30% of the capacity of the existing fleet expected to be delivered by the end of 2018); |
|
· |
the scrapping rate of older vessels; |
|
· |
LPG vessel prices, including financing costs and the price of steel, other raw materials and vessel equipment; |
|
· |
the availability of shipyards to build LPG vessels when demand is high; |
|
· |
changes in environmental and other regulations that may limit the useful lives of vessels; |
|
· |
technological advances in LPG vessel design and capacity; and |
|
· |
the number of vessels that are out of service. |
34
A significant decline in demand for the seaborne transport of LPG or a significant increase in the supply of LPG vessel capacity without a corresponding growth in LPG vessel demand could cause a significant decline in prevailing charter rates, which could materially adversely affect our financial condition and operating results and cash flow.
A shift in consumer demand from LPG towards other energy sources or changes to trade patterns may have a material adverse effect on our business.
Substantially all of our earnings are related to the LPG industry. A shift in the consumer demand from LPG towards other energy resources such as oil, wind energy, solar energy, or water energy will potentially affect the demand for our LPG carriers. This could have a material adverse effect on our future performance, results of operations, cash flows and financial position.
Seaborne trading and distribution patterns are primarily influenced by the relative advantage of the various sources of production, locations of consumption, pricing differentials and seasonality. Changes to the trade patterns of LPG may have a significant negative or positive impact on the demand for our vessels. This could have a material adverse effect on our future performance, results of operations, cash flows and financial position.
The market values of our vessels may fluctuate significantly. When the market values of our vessels are low, we may incur a loss on sale of a vessel or record an impairment charge, which may adversely affect our earnings and possibly lead to defaults under our loan agreement or under future loan agreements we may enter into.
Vessel values are both cyclical and volatile, and may fluctuate due to a number of different factors, including general economic and market conditions affecting the shipping industry; sophistication and condition of the vessels; types and sizes of vessels; competition from other shipping companies; the availability of other modes of transportation; increases in the supply of vessel capacity; charter rates; the cost and delivery of newbuildings; governmental or other regulations; supply of and demand for LPG products; prevailing freight rates; and the need to upgrade secondhand and previously owned vessels as a result of charterer requirements, technological advances in vessel design or equipment or otherwise. In addition, as vessels grow older, they generally decline in value.
Due to the cyclical nature of the market, if for any reason we sell any of our owned vessels at a time when prices are depressed and before we have recorded an impairment adjustment to our financial statements, the sale may be for less than the vessel's carrying value in our financial statements, resulting in a loss and reduction in earnings. Furthermore, if vessel values experience significant declines and our estimated future cash flows decrease, we may have to record an impairment adjustment in our financial statements, which could adversely affect our financial results. If the market value of our fleet declines, we may not be in compliance with certain provisions of our loan agreements and we may not be able to refinance our debt or obtain additional financing or pay dividends, if any. If we are unable to pledge additional collateral, our lenders could accelerate our debt and foreclose on our vessels.
Our revenues, operations and future growth could be adversely affected by a decrease in the supply of or demand for LPG or natural gas.
In recent years, there has been a strong supply of natural gas and an increase in the construction of plants and projects involving natural gas, of which LPG is a byproduct. Several of these projects, however, have experienced delays in their completion for various reasons and thus the expected increase in the supply of LPG from these projects may be delayed significantly. If the supply of natural gas decreases, we may see a concurrent reduction in the production of LPG and resulting lesser demand and lower charter rates for our vessels and the vessels in the Helios Pool, which could ultimately have a material adverse impact on our revenues, operations and future growth. Additionally, changes in environmental or other legislation establishing additional regulation or restrictions on LPG production and transportation, including the adoption of climate change legislation or regulations, or legislation in the United States placing additional regulation or restrictions on LPG production from shale gas could result in reduced demand for LPG shipping.
35
General economic conditions could materially adversely affect our business, financial position and results of operations, as well as our future prospects.
The global economy and the volume of world trade have remained relatively weak since the severe decline in the latter part of 2008 and in 2009. Recovery of the global economy is proceeding at varying speeds across regions but remains subject to downside risks, including substantial sovereign debt burdens in countries throughout the world, the United Kingdom’s potential exit from the EU, continuing turmoil and hostilities in the Middle East, North Africa and other geographic areas and the refugee crisis in Europe and the Middle East. There has historically been a strong link between the development of the world economy and demand for LPG shipping. Accordingly, an extended negative outlook for the world economy could reduce the overall demand for our services. More specifically, some LPG products we carry are used in cyclical businesses, such as the manufacturing of plastics and in the chemical industry, that were adversely affected by the economic downturn and, accordingly, continued weakness and any further reduction in demand in those industries could adversely affect the LPG shipping industry. In particular, an adverse change in economic conditions affecting China, India, Japan or Southeast Asia generally could have a negative effect on the demand for LPG products, thereby adversely affecting our business, financial position and results of operations, as well as our future prospects.
In addition, as a result of the ongoing economic turmoil in Greece resulting from the sovereign debt crisis and the related austerity measures implemented by the Greek government, our operations in Greece may be subjected to new regulations that may require us to incur new or additional compliance or other administrative costs and may require that we pay to the Greek government new taxes or other fees. We also face the risk that strikes, work stoppages, civil unrest and violence within Greece may disrupt our shoreside operations located in Greece.
The state of global financial markets and current economic conditions may adversely impact our ability to obtain financing or refinance our credit facilities on acceptable terms, which may hinder or prevent us from operating or expanding our business.
Global financial markets, including credit markets and debt and equity capital markets, remain relatively weak since the severe decline in the latter part of 2008 and 2009. These issues, along with the re-pricing of credit risk and the difficulties experienced by financial institutions, have made, and will likely continue to make, it difficult to obtain financing. As a result of the disruptions in the credit markets and higher capital requirements, many lenders have increased margins on lending rates, enacted tighter lending standards, required more restrictive terms (including higher collateral ratios for advances, shorter maturities and smaller loan amounts), or refused to refinance existing debt on terms similar to current debt or at all. Furthermore, certain banks that have historically been significant lenders to the shipping industry reduced or ceased lending activities in the shipping industry. New banking regulations, including tightening of capital requirements and the resulting policies adopted by lenders, could further reduce lending activities. We may experience difficulties obtaining financing commitments or be unable to fully draw on the capacity under our credit facilities committed in the future or refinance our credit facilities when our facilities mature if our lenders are unwilling to extend financing to us or unable to meet their funding obligations due to their own liquidity, capital or solvency issues. We cannot be certain that financing will be available when needed on acceptable terms or at all. In the absence of available financing, we may be unable to satisfy our obligations, take advantage of business opportunities or respond to competitive pressures.
Our operating results are subject to seasonal fluctuations, which could affect our operating results and the amount of available cash with which we can pay dividends.
We operate our LPG carriers in markets that have historically exhibited seasonal variations in demand and, as a result, in charter hire rates. This seasonality may result in quarter‑to‑quarter volatility in our operating results, which could affect the amount of dividends that we may pay to our shareholders from quarter‑to‑quarter. The LPG shipping market is typically stronger in the spring and summer months in anticipation of increased consumption of propane and butane for heating during the winter months. In addition, unpredictable weather patterns in these months tend to disrupt vessel scheduling and supplies of certain commodities. As a result, our revenues may be stronger in fiscal quarters ended June 30 and September 30, and conversely, our revenues may be weaker during the fiscal quarters ended December 31 and March 31. This seasonality could materially affect our quarterly operating results.
36
Future technological innovation could reduce our charter hire income and the value of our vessels.
The charter hire rates and the value and operational life of a vessel are determined by a number of factors including the vessel's efficiency, operational flexibility and physical life. Efficiency includes speed, fuel economy and the ability to load and discharge cargo quickly. Flexibility includes the ability to enter harbors, utilize related docking facilities and pass through canals and straits. The length of a vessel's physical life is related to its original design and construction, its maintenance and the impact of the stress of operations. We believe that our fleet is among the youngest and most eco‑friendly fleet of all our competitors. However, if new LPG carriers are built that are more efficient or more flexible or have longer physical lives than our vessels, competition from these more technologically advanced vessels could adversely affect the amount of charter hire payments we receive for our vessels and the resale value of our vessels could significantly decrease. Similarly, if the vessels of the other participants in the Helios Pool fleet become outdated, the amount of charter hire payments to the Helios Pool may be adversely effected. As a result of the foregoing, our results of operations and financial condition could be adversely affected.
Changes in fuel, or bunker, prices may adversely affect profits.
While we do not bear the cost of fuel, or bunkers, under time and bareboat charters, including for our vessels employed on time charters through the Helios Pool, fuel is a significant expense in our shipping operations when vessels are off-hire or deployed under spot charters. Changes in the price of fuel may adversely affect our profitability. The price and supply of fuel is unpredictable and fluctuates based on events outside our control, including geopolitical developments, supply and demand for oil and gas, actions by the Organization of Petroleum Exporting Countries, or OPEC, and other oil and gas producers, war and unrest in oil producing countries and regions, regional production patterns and environmental concerns. Further, fuel may become much more expensive in the future, which may reduce profitability.
We are subject to regulation and liability, including environmental laws, which could require significant expenditures and adversely affect our financial conditions and results of operations.
Our business and the operation of our vessels are subject to complex laws and regulations and materially affected by government regulation, including environmental regulations in the form of international conventions and national, state and local laws and regulations in force in the jurisdictions in which the vessels operate, as well as in the country or countries in which the vessels operate, as well as in the country or countries of their registration.
These regulations include, but are not limited to OPA90 that establishes an extensive regulatory and liability regime for the protection and cleanup of the environment from oil spills and applies to any discharges of oil from a vessel, including discharges of fuel oil and lubricants, the U.S. Clean Air Act, U.S. Clean Water Act and requirements of the USCG and the EPA, and the U.S. Marine Transportation Security Act of 2002, and regulations of the IMO, including the IMO International Convention for the Prevention of Pollution from Ships of 1973, as from time to time amended and generally referred to as MARPOL, including the designation of ECAs thereunder, the IMO International Convention on Civil Liability for Oil Pollution Damage of 1969, as from time to time amended and generally referred to as CLC, the International Convention of Civil Liability for Bunker Oil Pollution Damage, the IMO International Convention of Load Lines of 1966, as from time to time amended, and the IMO International Convention for the Safety of Life at Sea of 1974, as from time to time amended and generally referred to as SOLAS. To comply with these and other regulations we may be required to incur additional costs to modify our vessels, meet new operating maintenance and inspection requirements, develop contingency plans for potential spills, and obtain insurance coverage. We are also required by various governmental and quasi-governmental agencies to obtain permits, licenses, certificates and financial assurances with respect to our operations. These permits, licenses, certificates and financial assurances may be issued or renewed with terms that could materially and adversely affect our operations. Because these laws and regulations are often revised, we cannot predict the ultimate cost of complying with them or the impact they may have on the resale prices or useful lives of our vessels. However, a failure to comply with applicable laws and regulations may result in administrative and civil penalties, criminal sanctions or the suspension or termination of our operations. Additional laws and regulations may be adopted which could limit our ability to do business or increase the cost of our doing business and which could materially adversely affect our operations. For example, a future serious incident, such as the April 2010 Deepwater Horizon oil spill in the Gulf of Mexico may result in new regulatory initiatives.
37
The operation of our vessels is affected by the requirements set forth in the ISM Code. The ISM Code requires ship owners and bareboat charterers to develop and maintain an extensive "Safety Management System" that includes, among other things, the adoption of a safety and environmental protection policy setting forth instructions and procedures for safe operation and describing procedures for dealing with emergencies. The failure of a ship owner or bareboat charterer to comply with the ISM Code may subject the owner or charterer to increased liability, may decrease available insurance coverage for the affected vessels, or may result in a denial of access to, or detention in, certain ports. In our case, noncompliance with the ISM Code may result in breach of our loan covenants. Currently, each of the vessels in our fleet is ISM Code certified. Because these certifications are critical to our business, we place a high priority on maintaining them. Nonetheless, there is the possibility that such certifications may not be renewed.
We currently maintain, for each of our vessels, pollution liability insurance coverage in the amount of $1.0 billion per incident. In addition, we carry hull and machinery and protection and indemnity insurance to cover the risks of fire and explosion. Under certain circumstances, fire and explosion could result in a catastrophic loss. We believe that our present insurance coverage is adequate, but not all risks can be insured, and there is the possibility that any specific claim may not be paid, or that we will not always be able to obtain adequate insurance coverage at reasonable rates. If the damages from a catastrophic spill exceeded our insurance coverage, the effect on our business would be severe and could possibly result in our insolvency.
We believe that regulation of the shipping industry will continue to become more stringent and compliance with such new regulations will be more expensive for us and our competitors. Substantial violations of applicable requirements or a catastrophic release from one of our vessels could have a material adverse impact on our financial condition and results of operations.
Climate change and greenhouse gas restrictions may adversely impact our operations and markets.
Due to concern over the risk of climate change, a number of countries and the IMO have adopted, or are considering the adoption of, regulatory frameworks to reduce greenhouse gas emissions. These regulatory measures may include, among others, adoption of cap and trade regimes, carbon taxes, increased efficiency standards, and incentives or mandates for renewable energy. In addition, although the emissions of greenhouse gases from international shipping currently are not subject to the Kyoto Protocol to the United Nations Framework Convention on Climate Change, which required adopting countries to implement national programs to reduce emissions of certain gases, a new treaty may be adopted in the future that includes restrictions on shipping emissions. Compliance with changes in laws, regulations and obligations relating to climate change could increase our costs related to operating and maintaining our vessels and require us to install new emission controls, acquire allowances or pay taxes related to our greenhouse gas emissions, or administer and manage a greenhouse gas emissions program. Revenue generation and strategic growth opportunities could also be adversely affected by compliance with such changes.
We may be required to make significant investments in ballast water management which may have a material adverse effect on our future performance, results of operations, and financial position.
The International Convention for the Control and Management of Vessels' Ballast Water and Sediments, or the BWM Convention, aims to prevent the spread of harmful aquatic organisms from one region to another, by establishing standards and procedures for the management and control of ships' ballast water and sediments. The BWM Convention calls for a phased introduction of mandatory ballast water exchange requirements to be replaced in time with mandatory concentration limits. Investments in ballast water treatment may have a material adverse effect on our future performance, results of operations, cash flows and financial position.
Our vessels may call on ports located in countries that are subject to sanctions and embargoes imposed by the U.S. or other governments, which could adversely affect our reputation and the market for our common shares.
Since January 1, 2010, none of our vessels has called on ports located in countries subject to sanctions and embargoes imposed by the United States government and countries identified by the United States government as state sponsors of terrorism, such as Iran, Sudan and Syria. The U.S. sanctions and embargo laws and regulations vary in their application, as they do not all apply to the same covered persons or proscribe the same activities, and such sanctions and
38
embargo laws and regulations may be amended or strengthened over time. In 2010, the U.S. enacted the Comprehensive Iran Sanctions Accountability and Divestment Act, or CISADA, which expanded the scope of the Iran Sanctions Act of 1996. Among other things, CISADA expands the application of the prohibitions involving Iran to include ships or shipping services by non U.S. companies, such as our company, and introduces limits on the ability of companies and persons to do business or trade with Iran when such activities relate to the investment, supply or export of refined petroleum or petroleum products. In addition, in October 2012, President Obama issued an executive order implementing the Iran Threat Reduction and Syria Human Rights Act of 2012, or the ITRA, which extends the application of all U.S. laws and regulations relating to Iran to non U.S. companies controlled by U.S. companies or persons as if they were themselves U.S. companies or persons, expands categories of sanctionable activities, adds additional forms of potential sanctions and imposes certain related reporting obligations with respect to activities of the Commission registrants and their affiliates. The ITRA also includes a provision requiring the President of the United States to impose five or more sanctions from Section 6(a) of the Iran Sanctions Act, as amended, on a person the President determines is controlling beneficial owner of, or otherwise owns, operates or controls or insures a vessel that was used to transport crude oil from Iran to another country and (1) if the person is a controlling beneficial owner of the vessel, the person had actual knowledge the vessel was so used or (2) if the person otherwise owns, operates, controls, or insures the vessel, the person knew or should have known the vessel was so used. Such a person could be subject to a variety of sanctions, including exclusion from U.S. capital markets, exclusion from financial transactions subject to U.S. jurisdiction, and exclusion of that person's vessels from U.S. ports for up to two years. Finally, in January 2013, the U.S. enacted the Iran Freedom and Counter Proliferation Act of 2012 (the "IFCPA") which expanded the scope of U.S. sanctions on any person that is part of Iran's energy, shipping or shipbuilding sector and operators of ports in Iran, and imposes penalties on any person who facilitates or otherwise knowingly provides significant financial, material or other support to these entities.
On November 24, 2013, the P5+1 (the United States, United Kingdom, Germany, France, Russia and China) entered into an interim agreement with Iran entitled the “Joint Plan of Action,” or JPOA. Under the JPOA it was agreed that, in exchange for Iran taking certain voluntary measures to ensure that its nuclear program is used only for peaceful purposes, the U.S. and EU would voluntarily suspend certain sanctions for a period of six months.
On January 20, 2014, the U.S. and E.U. indicated that they would begin implementing the temporary relief measures provided for under the JPOA. These measures include, among other things, the suspension of certain sanctions on the Iranian petrochemicals, precious metals, and automotive industries from January 20, 2014 until July 20, 2014. The U.S. subsequently extended the JPOA twice.
On July 14, 2015, the P5+1 and the EU announced that they reached a landmark agreement with Iran titled the Joint Comprehensive Plan of Action Regarding the Islamic Republic of Iran’s Nuclear Program, or the JCPOA, which is intended to significantly restrict Iran’s ability to develop and produce nuclear weapons for 10 years while simultaneously easing sanctions directed toward non-U.S. persons for conduct involving Iran, but taking place outside of U.S. jurisdiction and does not involve U.S. persons. On January 16, 2016, the United States joined the EU and the UN in lifting a significant number of their nuclear-related sanctions on Iran following an announcement by the International Atomic Energy Agency, or the IAEA, that Iran had satisfied its respective obligations under the JCPOA.
U.S. sanctions prohibiting certain conduct that is now permitted under the JCPOA have not actually been repealed or permanently terminated at this time. Rather, the U.S. government has implemented changes to the sanctions regime by: (1) issuing waivers of certain statutory sanctions provisions; (2) committing to refrain from exercising certain discretionary sanctions authorities; (3) removing certain individuals and entities from the Office of Foreign Assets Control’s sanctions lists; and (4) revoking certain Executive Orders and specified sections of Executive Orders. These sanctions will not be permanently "lifted" until the earlier of “Transition Day,” set to occur on October 20, 2023, or upon a report from the IAEA stating that all nuclear material in Iran is being used for peaceful activities.
Although we believe that we are in compliance with all applicable sanctions and embargo laws and regulations and intend to maintain such compliance, there can be no assurance that we will be in compliance in the future, particularly as the scope of certain laws may vary or may be subject to changing interpretations and we may be unable to prevent our charterers from violating contractual and legal restrictions on their operations of the vessels. Any such violation could result in fines or other penalties for us and could result in some investors deciding, or being required, to divest their interest, or not to invest, in the Company. Additionally, some investors may decide to divest their interest, or not to invest, in the
39
Company simply because we do business with companies that do business in sanctioned countries. Moreover, our charterers may violate applicable sanctions and embargo laws and regulations as a result of actions that do not involve us or our vessels, and those violations could in turn negatively affect our reputation. Investor perception of the value of our common shares may also be adversely affected by the consequences of war, the effects of terrorism, civil unrest and governmental actions in these and surrounding countries.
Our vessels are subject to periodic inspections by a classification society.
The hull and machinery of every commercial vessel must be classed by a classification society authorized by its country of registry. The classification society certifies that a vessel is safe and seaworthy in accordance with the applicable rules and regulations of the country of registry of the vessel and the Safety of Life at Sea Convention. Our VLGCs are currently classed with Lloyd's Register, ABS or Det Norske Veritas.
A vessel must undergo annual surveys, intermediate surveys and special surveys. In lieu of a special survey, a vessel's machinery may be on a continuous survey cycle, under which the machinery would be surveyed periodically over a five‑year period. Our vessels are on special survey cycles for hull inspection and continuous survey cycles for machinery inspection. Every vessel is also required to be drydocked every two to three years for inspection of the underwater parts of such vessel. However, for vessels not exceeding 15 years that have means to facilitate underwater inspection in lieu of drydocking, the drydocking can be skipped and be conducted concurrently with the special survey.
If a vessel does not maintain its class and/or fails any annual survey, intermediate survey or special survey, the vessel will be unable to trade between ports and will be unemployable, and we could be in violation of covenants in our loan agreements and insurance contracts or other financing arrangements. This would adversely impact our operations and revenues.
Maritime claimants could arrest our vessels, which could interrupt our cash flow.
Crew members, suppliers of goods and services to a vessel, shippers of cargo and others may be entitled to a maritime lien against that vessel for unsatisfied debts, claims or damages. In many jurisdictions, a maritime lien holder may enforce its lien by arresting or attaching a vessel through foreclosure proceedings. The arrest or attachment of one or more of our vessels could interrupt our cash flow and require us to pay large sums of funds to have the arrest lifted.
In addition, in some jurisdictions, such as South Africa, under the "sister ship" theory of liability, a claimant may arrest both the vessel which is subject to the claimant's maritime lien and any "associated" vessel, which is any vessel owned or controlled by the same owner. Claimants could try to assert "sister ship" liability against one vessel in our fleet for claims relating to another of our ships or, possibly, another vessel managed by one of our shareholders holding more than 5% of our common stock or entities affiliated with them.
Governments could requisition our vessels during a period of war or emergency, resulting in loss of revenues.
The government of a vessel's registry could requisition for title or seize our vessels. Requisition for title occurs when a government takes control of a vessel and becomes the owner. A government could also requisition our vessels for hire. Requisition for hire occurs when a government takes control of a vessel and effectively becomes the charterer at dictated charter rates. Generally, requisitions occur during a period of war or emergency. Government requisition of one or more of our vessels could have a material adverse effect on our business, results of operations, cash flows and financial condition.
Risks involved with operating ocean-going vessels could adversely affect our business or reputation, and could cause us to experience unexpected drydocking costs, any of which could result in a material adverse effect on our financial condition, results of operations, cash flows, and ability to pay dividends.
The operation of an ocean-going vessel carries inherent risks. Our vessels and their cargoes are at risk of being damaged or lost because of events such as marine disasters, bad weather, mechanical failures, grounding, fire, explosions, collisions, human error, war, terrorism, piracy, cargo loss, latent defects, acts of God and other circumstances or events.
40
Changing economic, regulatory and political conditions in some countries, including political and military conflicts, have from time to time resulted in attacks on vessels, mining of waterways, piracy, terrorism, labor strikes and boycotts. Damage to the environment could also result from our operations, particularly through spillage of fuel, lubricants or other chemicals and substances used in operations, or extensive uncontrolled fires. These hazards may result in death or injury to persons, loss of revenues or property, environmental damage, higher insurance rates, damage to our customer relationships, market disruptions, delay or rerouting, any of which may also subject us to litigation. As a result, we could be exposed to substantial liabilities not recoverable under our insurances. Further, the involvement of our vessels in a serious accident could harm our reputation as a safe and reliable vessel operator and lead to a loss of business.
If our vessels suffer damage, they may need to be repaired at a drydocking facility. The costs of drydock repairs are unpredictable and may be substantial. We may have to pay drydocking costs that our insurance does not cover at all or in full. The loss of earnings while these vessels are being repaired and repositioned, as well as the actual cost of these repairs, may adversely affect our business and financial condition. In addition, space at drydocking facilities is sometimes limited and not all drydocking facilities are conveniently located. We may be unable to find space at a suitable drydocking facility or our vessels may be forced to travel to a drydocking facility that is not conveniently located to our vessels' positions. The loss of earnings while these vessels are forced to wait for space or to travel or be towed to more distant drydocking facilities may adversely affect our business, financial condition, results of operations and cash flows.
We may be subject to litigation that could have an adverse effect on our business and financial condition.
We are currently not involved in any litigation matters that are expected to have a material adverse effect on our business or financial condition. Nevertheless, we anticipate that we could be involved in litigation matters from time to time in the future. The operating hazards inherent in our business expose us to litigation, including personal injury litigation, environmental litigation, contractual litigation with clients, intellectual property litigation, tax or securities litigation, and maritime lawsuits including the possible arrest of our vessels. We cannot predict with certainty the outcome or effect of any claim or other litigation matter. Any future litigation may have an adverse effect on our business, financial position, results of operations and our ability to pay dividends, because of potential negative outcomes, the costs associated with prosecuting or defending such lawsuits, and the diversion of management's attention to these matters. Additionally, our insurance may not be applicable or sufficient to cover the related costs in all cases or our insurers may not remain solvent.
Acts of piracy on ocean-going vessels could adversely affect our business.
Acts of piracy have historically affected ocean-going vessels trading in regions of the world such as the South China Sea, the Strait of Malacca, the Indian Ocean, the Arabian Sea, the Red Sea, off the coast of West Africa and in the Gulf of Aden off the coast of Somalia. Sea piracy incidents continue to occur, particularly in the South China Sea, the Strait of Malacca, off the coast of West Africa and off the coast of Somalia. If these piracy attacks occur in regions in which our vessels are deployed and are characterized by insurers as "war risk" zones, as the Gulf of Aden continues to be, or Joint War Committee (JWC) "war and strikes" listed areas, premiums payable for such coverage, for which we are responsible with respect to vessels employed on spot charters, but not vessels employed on bareboat or time charters, could increase significantly and such insurance coverage may be more difficult to obtain. In addition, costs to employ onboard security guards could increase in such circumstances. We may not be adequately insured to cover losses from these incidents, which could have a material adverse effect on us. In addition, detention hijacking as a result of an act of piracy against our vessels, or an increase in cost, or unavailability of insurance for our vessels, could have a material adverse impact on our business, financial condition and results of operations.
Our operations outside the United States expose us to global risks, such as political conflict and terrorism, which may interfere with the operation of our vessels and could have a material adverse impact on our operating results, revenues and costs.
We are an international company and primarily conduct our operations outside the United States. Changing economic, political and governmental conditions in the countries where we are engaged in business or where our vessels are registered affect us. In the past, political conflicts, particularly in the Arabian Gulf, resulted in attacks on vessels, mining of waterways and other efforts to disrupt shipping in the area. For example, in October 2002, the vessel Limburg
41
(which is not affiliated with our Company) was attacked by terrorists in Yemen. Acts of terrorism and piracy have also affected vessels trading in regions such as the South China Sea. As a result of the military response of the United States and other nations to threats of terrorism as well as the ongoing conflicts in Iraq, Syria, Afghanistan, Pakistan and Yemen, the likelihood of future acts of terrorism may increase, and our vessels may face higher risks of being attacked. In addition, future hostilities or other political instability in regions where our vessels trade could affect our trade patterns and adversely affect our operations and performance. Hostilities in or closure of major waterways in the Middle East, Ukraine or Black Sea region could adversely affect the availability of and demand for crude oil and petroleum products, as well as LPG, and negatively affect our investment and our customers' investment decisions over an extended period of time. In addition, sanctions against oil exporting countries such as Iran, Russia, Sudan and Syria may also impact the availability of crude oil, petroleum products and LPG and which would increase the availability of applicable vessels thereby impacting negatively charter rates.
Terrorist attacks, or the perception that LPG or natural gas facilities or oil refineries and LPG carriers are potential terrorist targets, could materially and adversely affect the continued supply of LPG. Concern that LPG and natural gas facilities may be targeted for attack by terrorists has contributed to a significant community and environmental resistance to the construction of a number of natural gas facilities, primarily in North America. If a terrorist incident involving a gas facility or gas carrier did occur, the incident may adversely affect necessary LPG facilities or natural gas facilities currently in operation. Furthermore, future terrorist attacks could result in increased volatility of the financial markets in the United States and globally and could result in an economic recession in the United States or the world. Any of these occurrences could have a material adverse impact on our operating results, revenues and costs.
If labor or other interruptions are not resolved in a timely manner, they could have a material adverse effect on our financial condition.
We employ masters, officers and crews to man our vessels. If not resolved in a timely and cost-effective manner, industrial action or other labor unrest or any other interruption arising from incidents of whistleblowing whether proven or not, could prevent or hinder our operations from being carried out as we expect and could have a material adverse effect on our business, financial condition, results of operations, cash flows, and ability to pay dividends.
Risks Relating To Our Common Shares
The price of our common shares may be highly volatile.
The market price of our common shares may fluctuate significantly in response to many factors, such as actual or anticipated fluctuations in our operating results and those of other public companies in the LPG shipping or related industries, market conditions in the LPG shipping industry, changes in financial estimates by securities analysts, significant sales of our shares by us or our shareholders, economic and regulatory trends, general market conditions, rumors and other factors, many of which are beyond our control. In addition, since approximately 74% of our outstanding shares are held by our Principal Shareholders, any movement in our stock price may be exaggerated due to less liquidity. An adverse development in the market price for our common shares could also negatively affect our ability to issue new equity to fund our activities.
Our board of directors may not declare dividends.
We have not paid any dividends since our inception in July 2013. We will evaluate the potential level and timing of dividends as soon as profits and cash flows allow. However, the timing and amount of any dividend payments will always be subject to the discretion of our board of directors and will depend on, among other things, earnings, capital expenditure commitments, market prospects, current capital expenditure programs, investment opportunities, the provisions of Marshall Islands law affecting the payment of distributions to shareholders, and the terms and restrictions of our credit facilities. The LPG shipping industry is highly volatile, and we cannot predict with certainty the amount of cash, if any, that will be available for distribution as dividends in any period. Also, there may be a high degree of variability from period to period in the amount of cash that is available for the payment of dividends.
42
We may incur expenses or liabilities or be subject to other circumstances in the future that reduce or eliminate the amount of cash that we have available for distribution as dividends, including as a result of the risks described herein. Our growth strategy contemplates that we will primarily finance our acquisitions of additional vessels through debt financings or the net proceeds of future equity issuances on terms acceptable to us. If financing is not available to us on acceptable terms, our board of directors may determine to finance or refinance acquisitions with cash from operations, which would reduce the amount of any cash available for the payment of dividends.
In general, under the terms of our credit facilities, we are not permitted to pay dividends if there is a default or a breach of a loan covenant.
The Republic of Marshall Islands laws generally prohibit the payment of dividends other than from surplus (retained earnings and the excess of consideration received for the sale of shares above the par value of the shares) or while a company is insolvent or would be rendered insolvent by the payment of such a dividend. We may not have sufficient surplus in the future to pay dividends and our subsidiaries may not have sufficient funds or surplus to make distributions to us. We can give no assurance that dividends will be paid at all.
We are a holding company, and depend on the ability of our subsidiaries to distribute funds to us in order to satisfy our financial obligations and to make dividend payments.
We are a holding company, and our subsidiaries conduct all of our operations and own all of our operating assets. As a result, our ability to satisfy our financial obligations and to pay dividends, if any, to our shareholders depends on the ability of our subsidiaries to generate profits available for distribution to us. The ability of a subsidiary to make these distributions could be affected by a claim or other action by a third party, including a creditor, the terms of our financing arrangements or by the law of its jurisdiction of incorporation which regulates the payment of dividends. Our subsidiaries who are party to the RBS Loan Facility are prohibited from paying dividends to us without the consent of the lender. However, the loan facility permits the borrowers to make expenditures to fund our administration and operations.
We may issue additional shares in the future, which could cause the market price of our common shares to decline.
We may issue additional shares in the future in connection with, among other things, future vessel acquisitions or repayment of outstanding indebtedness, without shareholder approval, in a number of circumstances. Our issuance of additional shares would have the following effects: our existing shareholders' proportionate ownership interest in us will decrease; the amount of cash available for dividends payable per share may decrease; the relative voting strength of each previously outstanding share may be diminished; and the market price of our shares may decline.
A future sale of shares by major shareholders may reduce the share price.
As of the date of this report and based on information contained in documents publicly filed by our Principal Shareholders, our Principal Shareholders own an aggregate of 41.2 million common shares, or approximately 74% of our outstanding common shares. Sales or the possibility of sales of substantial amounts of our common shares by any of our Principal Shareholders could adversely affect the market price of our common shares.
We are incorporated in the Republic of the Marshall Islands, which does not have a well-developed body of corporate law.
We are incorporated in the Republic of the Marshall Islands, which does not have a well-developed body of corporate or case law. As a result, shareholders may have fewer rights and protections under Marshall Islands law than under a typical jurisdiction in the United States. Our corporate affairs are governed by our articles of incorporation and bylaws and by the Marshall Islands Business Corporations Act, or BCA. The provisions of the BCA resemble provisions of the corporation laws of a number of states in the United States. However, there have been few judicial cases in the Republic of the Marshall Islands interpreting the BCA. The rights and fiduciary responsibilities of directors under the law of the Republic of the Marshall Islands are not as clearly established as the rights and fiduciary responsibilities of directors under statutes or judicial precedent in existence in certain U.S. jurisdictions. Shareholder rights may differ as well. While the BCA does specifically incorporate the non-statutory law, or judicial case law, of the State of Delaware and other states
43
with substantially similar legislative provisions, we cannot predict whether Marshall Islands courts would reach the same conclusions as U.S. courts. Therefore, our public shareholders may have more difficulty in protecting their interests in the face of actions by the management, directors or controlling shareholders than would shareholders of a corporation incorporated in a U.S. jurisdiction.
It may be difficult to enforce a U.S. judgment against us, our officers and our directors because we are a foreign corporation.
We are incorporated in the Republic of the Marshall Islands and most of our subsidiaries are organized in the Republic of the Marshall Islands. Substantially all of our assets and those of our subsidiaries are located outside the United States. As a result, our shareholders should not assume that courts in the countries in which we or our subsidiaries are incorporated or where our assets or the assets of our subsidiaries are located (1) would enforce judgments of U.S. courts obtained in actions against us or our subsidiaries based upon the civil liability provisions of applicable U.S. federal and state securities laws or (2) would enforce, in original actions, liabilities against us or our subsidiaries based upon these laws.
We are an "emerging growth company,” as defined in the JOBS Act, and we cannot be certain if the reduced disclosure requirements applicable to emerging growth companies make our common shares less attractive to investors.
We are an "emerging growth company," as defined in the JOBS Act, and we may take advantage of certain exemptions from various reporting requirements that are applicable to other public companies that are not "emerging growth companies." We cannot determine if investors will find our common shares less attractive because we rely on these exemptions. If some investors find our common shares less attractive as a result, there may be a less active trading market for our common shares and our share price may be more volatile.
In addition, under the JOBS Act, our independent registered public accounting firm is not required to attest to the effectiveness of our internal control over financial reporting pursuant to Section 404 of the Sarbanes‑Oxley Act of 2002 for so long as we are an emerging growth company. For as long as we take advantage of the reduced reporting obligations, the information that we provide shareholders may be different from information provided by other public companies, which could impact the trading price of our shares.
Our organizational documents contain anti‑takeover provisions.
Several provisions of our articles of incorporation and our bylaws could make it difficult for our shareholders to change the composition of our board of directors in any one year, preventing them from changing the composition of management. In addition, the same provisions may discourage, delay or prevent a merger or acquisition that shareholders may consider favorable. These provisions include:
|
· |
authorizing our board of directors to issue "blank check" preferred shares without shareholder approval; |
|
· |
providing for a classified board of directors with staggered, three‑year terms; |
|
· |
authorizing the removal of directors only for cause; |
|
· |
limiting the persons who may call special meetings of shareholders; |
|
· |
establishing advance notice requirements for nominations for election to our board of directors or for proposing matters that can be acted on by shareholders at shareholder meetings; and |
|
· |
restricting business combinations with interested stockholders. |
These anti‑takeover provisions could substantially impede the ability of our shareholders to benefit from a change in control and, as a result, may reduce the market price of our common shares and shareholders' ability to realize any potential change of control premium.
44
We have a shareholders rights agreement that could delay or prevent a change in control.
On December 21, 2015, our Board of Directors adopted a shareholder rights agreement, or the Rights Agreement. The Rights Agreement may cause substantial dilution to a person or group that attempts to acquire control of our Company on terms that our Board of Directors does not believe are in our shareholders’ best interest. The Rights Agreement is intended to protect our shareholders in the event of an unfair or coercive offer to acquire control of the Company and to provide our Board of Directors with adequate time to evaluate unsolicited offers. The Rights Agreement may prevent or make takeovers or unsolicited corporate transactions with respect to our Company more difficult, even if shareholders consider such transactions favorable, possibly including transactions in which shareholders might otherwise receive a premium for their shares. For more information, please see the Rights Agreement dated December 21, 2015 filed as an exhibit to our current report on Form 8-K filed with the Commission on December 21, 2015.
We may have fluctuations in the amount and frequency of our stock repurchases that could affect our liquidity position.
On August 5, 2015, we publicly announced that our Board of Directors had authorized the repurchase of up to $100 million of our common stock on or before December 31, 2016. The amount, timing, and execution of our stock repurchase program may fluctuate based on our priorities for the use of cash for other purposes—such as investing in our business, including operational spending, capital spending, and acquisitions, and returning cash to our stockholders as dividend payments—and because of changes in cash flows and changes in tax laws.
ITEM 1B. UNRESOLVED STAFF COMMENTS.
None.
LPG carriers are the principal physical properties owned by us and are more fully described in "Our Fleet" in "Item 1. Business." We do not own any real property. We lease office space at 27 Signal Road, Stamford, Connecticut, 06902, USA; River House, 143-145 Farringdon Road, London, EC1R 3AB, UK; and 24 Poseidonos Avenue, 17674, Kallithea, Greece.
We have not been involved in any legal proceedings that we believe may have a significant effect on our business, financial position, results of operations or liquidity, and we are not aware of any proceedings that are pending or threatened that may have a material effect on our business, financial position, results of operations or liquidity. From time to time we are and expect to be subject to legal proceedings and claims in the ordinary course of our business, principally personal injury and property casualty claims. These claims, even if lacking merit, could result in the expenditure of significant financial and managerial resources.
ITEM 4. MINE SAFETY DISCLOSURES.
Not applicable.
45
ITEM 5. MARKET FOR REGISTRANT’S COMMON EQUITY, RELATED STOCKHOLDER MATTERS AND ISSUER PURCHASES OF EQUITY SECURITIES.
Our common shares have traded on the New York Stock Exchange, or NYSE, since May 9, 2014, under the symbol "LPG" and traded on the Norwegian OTC List from July 30, 2013 through November 5, 2014 under the symbol "DORIAN." As of May 26, 2016, we had 57 registered holders of our common shares, including Cede & Co., the nominee for the Depository Trust Company.
The following tables set forth the high and low prices for our common shares as reported on the NYSE and the Norwegian OTC List for the calendar periods listed below. On May 26, 2016, the exchange rate between the Norwegian Krone and the U.S. dollar was NOK8.2799 to one U.S. dollar based on the Bloomberg Composite Rate in effect on that date.
The following information gives effect to a one-for-five reverse stock split of our common shares effected on April 25, 2014.
|
|
|
NYSE |
|
Norwegian OTC List |
|
||||
|
|
|
High |
|
Low |
|
High |
|
Low |
|
|
For the Quarter Ended |
|
(US$) |
|
(US$) |
|
(NOK) |
|
(NOK) |
|
|
June 30, 2014* |
|
24.93 |
|
17.95 |
|
132.00 |
|
105.00 |
|
|
September 30, 2014 |
|
24.20 |
|
17.73 |
|
132.00 |
|
114.50 |
|
|
December 31, 2014** |
|
18.15 |
|
9.94 |
|
114.50 |
|
75.00 |
|
|
March 31, 2015 |
|
14.26 |
|
10.10 |
|
— |
|
— |
|
|
June 30, 2015 |
|
16.80 |
|
12.85 |
|
— |
|
— |
|
|
September 30, 2015 |
|
17.59 |
|
9.95 |
|
— |
|
— |
|
|
December 31, 2015 |
|
13.80 |
|
10.43 |
|
— |
|
— |
|
|
March 31, 2016 |
|
12.35 |
|
8.67 |
|
— |
|
— |
|
* Period for the NYSE begins on May 9, 2014
**Deactivated on the Norwegian OTC List on November 5, 2014
Stock Repurchase Program
See Note 12 to our consolidated financial statements for a discussion of our stock repurchase program.
Equity Compensation Plans
Information about the securities authorized for issuance under our compensation plan is incorporated by reference from our Proxy Statement for the 2016 Annual Meeting of Stockholders, which will be filed with the Commission within 120 days of March 31, 2016.
Dividends
We have not paid any dividends since our inception in July 2013. We will evaluate the potential level and timing of dividends as soon as profits and capital expenditure requirements allow. However, the timing and amount of any dividend payments will always be subject to the discretion of our board of directors and will depend on, among other things, earnings, potential future capital expenditure commitments, market prospects, current capital expenditure programs, investment opportunities, the provisions of Marshall Islands law affecting the payment of distributions to shareholders, and the terms and restrictions of our existing and future credit facilities. Marshall Islands law generally prohibits the payment of dividends other than from operating surplus or while a company is insolvent or would be rendered insolvent upon the payment of such dividend.
46
In addition, since we are a holding company with no material assets other than the shares of our subsidiaries through which we conduct our operations, our ability to pay dividends will depend on our subsidiaries' distributing to us their earnings and cash flows. Our subsidiaries that own the four vessels in our Initial Fleet and who are party to the RBS Loan Facility are prohibited from paying dividends to us without the consent of the lender. However, the loan facility permits the borrowers to make expenditures to fund the administration and operation of Dorian LPG Ltd.
Taxation
Please see “Item 1. Business—Taxation” for a discussion of certain tax considerations related to holders of our common shares.
Purchases of Equity Securities
On August 5, 2015, we publicly announced that our Board of Directors had authorized the repurchase of up to $100 million of our common stock on or before December 31, 2016. The table below sets forth information regarding our purchases of our common stock during the quarterly period ended March 31, 2016:
|
|
|
|
|
|
|
Total |
|
|
||
|
|
|
|
|
|
|
Number of |
|
|
||
|
|
|
|
|
|
|
Shares |
|
|
||
|
|
|
|
|
|
|
Purchased as |
|
|
||
|
|
|
|
|
|
|
Part of |
|
Maximum Dollar |
||
|
|
|
Total |
|
|
|
Publicly |
|
Value of Shares |
||
|
|
|
Number |
|
Average |
|
Announced |
|
that May Yet Be |
||
|
|
|
of Shares |
|
Price Paid |
|
Plans or |
|
Purchased Under the |
||
|
Period |
|
Purchased |
|
Per Share |
|
Programs |
|
Plan or Programs |
||
|
January 1 to 31, 2016 |
|
— |
|
$ |
— |
|
— |
|
$ |
89,929,430 |
|
February 1 to 29, 2016 |
|
694,933 |
|
|
9.91 |
|
694,933 |
|
|
83,045,814 |
|
March 1 to 31, 2016 |
|
405,201 |
|
|
9.85 |
|
405,201 |
|
|
79,056,259 |
|
Total |
|
1,100,134 |
|
$ |
9.88 |
|
1,100,134 |
|
$ |
79,056,259 |
Stock Performance Graph
The performance graph below shows the cumulative total return to stockholders of our common stock relative to the cumulative total returns of the Russell 2000 Index and the Dorian Peer Group Index (defined below). The graph tracks the performance of a $100 investment in our common stock and in each of the indices (with the reinvestment of dividends) from May 7, 2014 (the date our common stock was listed on the New York Stock Exchange) to March 31, 2016. The stock price performance included in this graph is not necessarily indicative of future stock price performance.
The Dorian Peer Group Index is a self-constructed peer group that consists of the following direct competitors on a line-of-business basis: BWLPG, NVGS and Avance. NVGS’s common stock trades on the New York Stock Exchange, while the common stock of Avance and BWLPG trade on the Oslo Stock Exchange. For the purposes of the below comparison, the cumulative total returns for Avance and BWLPG were converted into U.S. dollars based on the relevant NOK to one USD exchange rate prevailing on the dates listed below.
47
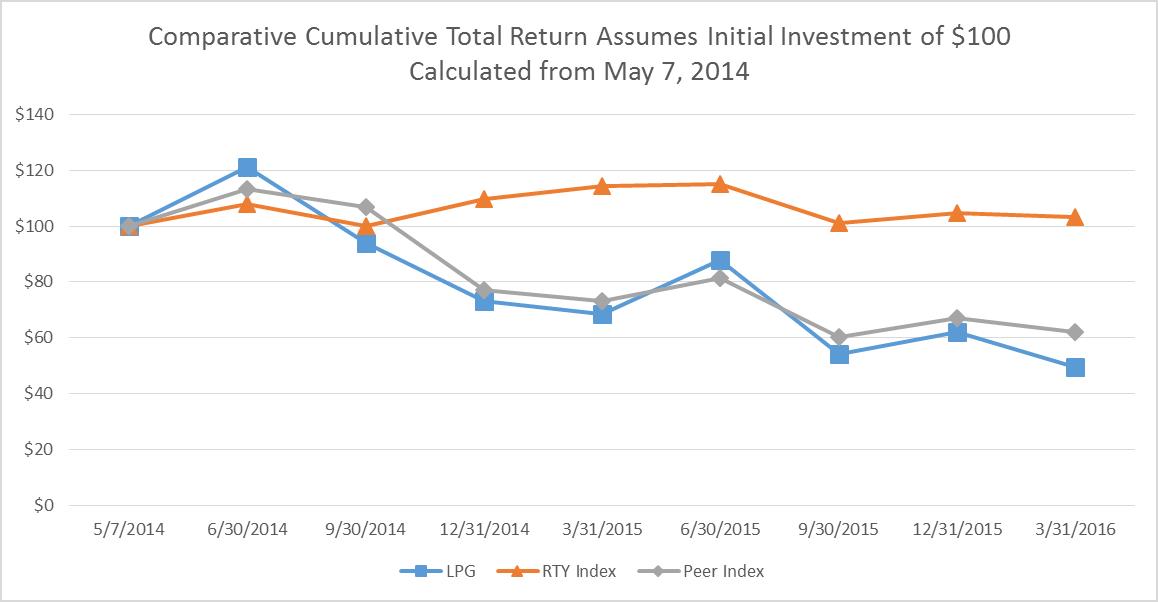
|
|
|
5/7/14 |
|
6/30/14 |
|
9/30/14 |
|
12/31/14 |
|
3/31/15 |
|
6/30/15 |
|
9/30/15 |
|
12/31/15 |
|
3/31/16 |
|
Dorian LPG Ltd. ("LPG") |
|
100.00 |
|
121.00 |
|
93.79 |
|
73.11 |
|
68.58 |
|
87.79 |
|
54.26 |
|
61.95 |
|
49.47 |
|
Russell 2000 Index ("RTY Index") |
|
100.00 |
|
107.89 |
|
99.95 |
|
109.68 |
|
114.41 |
|
114.89 |
|
101.20 |
|
104.84 |
|
103.24 |
|
Peer Index |
|
100.00 |
|
113.09 |
|
106.70 |
|
77.15 |
|
73.32 |
|
81.56 |
|
60.31 |
|
66.99 |
|
62.07 |
|
NOK to USD exchange conversion rate |
|
5.9098 |
|
6.1331 |
|
6.4261 |
|
7.4520 |
|
8.0608 |
|
7.8532 |
|
8.5155 |
|
8.8431 |
|
8.2685 |
This performance graph shall not be deemed “soliciting material” or to be “filed” with the Commission for purposes of Section 18 of the Securities Exchange Act of 1934, as amended, or the Exchange Act, or otherwise subject to the liabilities under that Section, and shall not be deemed to be incorporated by reference into any filing of the Company under the Securities Act of 1933, as amended, or the Securities Act.
ITEM 6. SELECTED FINANCIAL DATA.
The following table presents selected historical financial and other data of Dorian LPG Ltd. and its subsidiaries and the Predecessor Businesses' of Dorian LPG Ltd. for the periods indicated. The selected historical financial data of Dorian LPG Ltd. as of March 31, 2016 and 2015, for the years ended March 31, 2016 and 2015 and for the period July 1, 2013 (inception) to March 31, 2014 has been derived from our audited consolidated financial statements and notes thereto and the selected historical financial data of the Predecessor for the period April 1, 2013 to July 28, 2013 has been derived from the Predecessor Businesses' audited combined financial statements, all included in “Item 8. Financial Statements and Supplementary Data”. The selected historical financial data of Dorian LPG Ltd. and its subsidiaries as of March 31, 2014 and the selected historical financial data of the Predecessor for the fiscal years ended March 31, 2013 and 2012, have been derived from our audited consolidated financial statements and notes thereto and the Predecessor Businesses' audited combined financial statements not appearing in this Form 10-K. The following table should be read together with and are qualified in its entirety by reference to such financial statements, which have been prepared in accordance with U.S.
48
generally accepted accounting principles, or U.S. GAAP and with “Item 7. Management’s Discussion and Analysis of Financial Condition and Results of Operations.”
|
|
|
Dorian LPG Ltd. |
|
|
Predecessor Businesses of |
|
||||||||||||||
|
|
|
|
|
|
|
|
Period July 1, 2013 |
|
|
Period April 1, |
|
|
|
|
|
|
|
|||
|
|
|
Year ended |
|
Year ended |
|
(inception) to |
|
|
2013 to |
|
Year ended |
|
Year ended |
|
||||||
|
(in U.S. dollars, except fleet data) |
|
March 31, 2016 |
|
March 31, 2015 |
|
March 31, 2014 |
|
|
July 28, 2013 |
|
March 31, 2013 |
|
March 31, 2012 |
|
||||||
|
Statement of Operations Data |
|
|
|
|
|
|
|
|
|
|
|
|
|
|
|
|
|
|
|
|
|
Revenues |
|
$ |
289,207,829 |
|
$ |
104,129,149 |
|
$ |
29,633,700 |
|
|
$ |
15,383,116 |
|
$ |
38,661,846 |
|
$ |
34,571,042 |
|
|
Expenses |
|
|
|
|
|
|
|
|
|
|
|
|
|
|
|
|
|
|
|
|
|
Voyage expenses |
|
|
12,064,682 |
|
|
22,081,856 |
|
|
6,670,971 |
|
|
|
3,623,872 |
|
|
8,751,257 |
|
|
2,075,698 |
|
|
Voyage expenses—related party |
|
|
— |
|
|
— |
|
|
— |
|
|
|
198,360 |
|
|
505,926 |
|
|
448,683 |
|
|
Vessel operating expenses |
|
|
47,119,990 |
|
|
21,256,165 |
|
|
8,394,959 |
|
|
|
4,638,725 |
|
|
12,038,926 |
|
|
14,410,349 |
|
|
Management fees—related party |
|
|
— |
|
|
1,125,000 |
|
|
3,122,356 |
|
|
|
601,202 |
|
|
1,824,000 |
|
|
1,824,000 |
|
|
Impairment |
|
|
— |
|
|
1,431,818 |
|
|
— |
|
|
|
— |
|
|
— |
|
|
— |
|
|
Depreciation and amortization |
|
|
42,591,942 |
|
|
14,093,744 |
|
|
6,620,372 |
|
|
|
3,955,309 |
|
|
12,024,829 |
|
|
11,847,628 |
|
|
General and administrative expenses |
|
|
29,836,029 |
|
|
14,145,086 |
|
|
433,674 |
|
|
|
28,204 |
|
|
157,039 |
|
|
80,552 |
|
|
Loss on disposal of assets |
|
|
1,125,395 |
|
|
— |
|
|
— |
|
|
|
— |
|
|
— |
|
|
— |
|
|
Total expenses |
|
|
132,738,038 |
|
|
74,133,669 |
|
|
25,242,332 |
|
|
|
13,045,672 |
|
|
35,301,977 |
|
|
30,686,910 |
|
|
Other income—related parties |
|
|
1,945,396 |
|
|
93,929 |
|
|
— |
|
|
|
— |
|
|
— |
|
|
— |
|
|
Operating income |
|
|
158,415,187 |
|
|
30,089,409 |
|
|
4,391,368 |
|
|
|
2,337,444 |
|
|
3,359,869 |
|
|
3,884,132 |
|
|
Other income/(expenses) |
|
|
|
|
|
|
|
|
|
|
|
|
|
|
|
|
|
|
|
|
|
Interest and finance costs |
|
|
(12,757,013) |
|
|
(289,090) |
|
|
(1,579,206) |
|
|
|
(762,815) |
|
|
(2,568,985) |
|
|
(2,415,855) |
|
|
Interest income |
|
|
148,360 |
|
|
418,597 |
|
|
428,201 |
|
|
|
98 |
|
|
598 |
|
|
504 |
|
|
Gain/(loss) on derivatives, net |
|
|
(15,775,629) |
|
|
(3,959,203) |
|
|
(1,104,001) |
|
|
|
2,830,205 |
|
|
(5,588,479) |
|
|
(10,943,316) |
|
|
Foreign currency gain/(loss), net |
|
|
(342,523) |
|
|
(998,931) |
|
|
697,481 |
|
|
|
(5) |
|
|
(53,700) |
|
|
2,215 |
|
|
Total other income/(expenses), net |
|
|
(28,726,805) |
|
|
(4,828,627) |
|
|
(1,557,525) |
|
|
|
2,067,483 |
|
|
(8,210,566) |
|
|
(13,356,452) |
|
|
Net income/(loss) |
|
$ |
129,688,382 |
|
$ |
25,260,782 |
|
$ |
2,833,843 |
|
|
$ |
4,404,927 |
|
$ |
(4,850,697) |
|
$ |
(9,472,320) |
|
|
Earnings per common share—basic |
|
$ |
2.29 |
|
$ |
0.45 |
|
$ |
0.09 |
|
|
$ |
— |
|
$ |
— |
|
$ |
— |
|
|
Earnings per common share—diluted |
|
$ |
2.29 |
|
$ |
0.45 |
|
$ |
0.09 |
|
|
$ |
— |
|
$ |
— |
|
$ |
— |
|
|
Other Financial Data |
|
|
|
|
|
|
|
|
|
|
|
|
|
|
|
|
|
|
|
|
|
Adjusted EBITDA(1) |
|
$ |
204,865,215 |
|
$ |
47,346,202 |
|
$ |
12,137,422 |
|
|
$ |
6,292,846 |
|
$ |
15,331,596 |
|
$ |
15,734,479 |
|
|
Fleet Data |
|
|
|
|
|
|
|
|
|
|
|
|
|
|
|
|
|
|
|
|
|
Calendar days(2) |
|
|
5,491 |
|
|
1,986 |
|
|
984 |
|
|
|
476 |
|
|
1,460 |
|
|
1,464 |
|
|
Available days(3) |
|
|
5,406 |
|
|
1,925 |
|
|
964 |
|
|
|
476 |
|
|
1,447 |
|
|
1,421 |
|
|
Operating days(4)(7) |
|
|
5,031 |
|
|
1,652 |
|
|
941 |
|
|
|
449 |
|
|
1,359 |
|
|
1,405 |
|
|
Fleet utilization(5)(7) |
|
|
93.1 |
% |
|
85.8 |
% |
|
97.7 |
% |
|
|
94.3 |
% |
|
93.9 |
% |
|
98.9 |
% |
|
Average Daily Results |
|
|
|
|
|
|
|
|
|
|
|
|
|
|
|
|
|
|
|
|
|
Time charter equivalent rate(6)(7) |
|
$ |
55,087 |
|
$ |
49,665 |
|
$ |
24,402 |
|
|
$ |
25,748 |
|
$ |
21,637 |
|
$ |
22,809 |
|
|
Daily vessel operating expenses(8) |
|
$ |
8,581 |
|
$ |
10,703 |
|
$ |
8,531 |
|
|
$ |
9,745 |
|
$ |
8,246 |
|
$ |
9,843 |
|
|
|
|
Dorian LPG Ltd. |
|
|
|
Predecessor Businesses of |
|
|||||||||||
|
|
|
As of |
|
As of |
|
As of |
|
|
|
As of |
|
As of |
|
|||||
|
(in U.S. dollars) |
|
March 31, 2016 |
|
March 31, 2015 |
|
March 31, 2014 |
|
|
|
March 31, 2013 |
|
March 31, 2012 |
|
|||||
|
Balance Sheet Data |
|
|
|
|
|
|
|
|
|
|
|
|
|
|
|
|
|
|
|
Cash and cash equivalents |
|
$ |
46,411,962 |
|
$ |
204,821,183 |
|
$ |
279,131,795 |
|
|
|
$ |
1,041,644 |
|
$ |
2,040,290 |
|
|
Restricted cash, non – current |
|
|
50,812,789 |
|
|
33,210,000 |
|
|
4,500,000 |
|
|
|
|
— |
|
|
— |
|
|
Total assets |
|
|
1,865,926,292 |
|
|
1,099,101,270 |
|
|
840,245,766 |
|
|
|
|
194,447,604 |
|
|
203,943,273 |
|
|
Current portion of long-term debt |
|
|
66,265,643 |
|
|
15,677,553 |
|
|
9,612,000 |
|
|
|
|
12,112,000 |
|
|
10,612,000 |
|
|
Long-term debt – net of current portion |
|
|
770,102,729 |
|
|
184,665,874 |
|
|
119,106,500 |
|
|
|
|
128,718,500 |
|
|
139,003,000 |
|
|
Total liabilities |
|
|
880,327,055 |
|
|
225,887,011 |
|
|
148,046,334 |
|
|
|
|
181,689,814 |
|
|
186,334,786 |
|
|
Total shareholders’ equity(9) |
|
$ |
985,599,237 |
|
$ |
873,214,259 |
|
$ |
692,199,432 |
|
|
|
$ |
12,757,790 |
|
$ |
17,608,487 |
|
|
(1) |
Adjusted EBITDA is non-U.S. GAAP financial measure and represents net income before interest and finance costs, loss/(gain) on derivatives, net, stock compensation expense, impairment, and depreciation and amortization and is used as a supplemental financial measure by management to assess our financial and operating performance. We believe that adjusted EBITDA assists our management and investors by increasing the |
49
comparability of our performance from period to period. This increased comparability is achieved by excluding the potentially disparate effects between periods of derivatives, interest and finance costs, stock-based compensation expense, impairment, depreciation and amortization and loss on disposal of assets expense, which items are affected by various and possibly changing financing methods, capital structure and historical cost basis and which items may significantly affect net income between periods. We believe that including adjusted EBITDA as a financial and operating measure benefits investors in selecting between investing in us and other investment alternatives. |
Adjusted EBITDA has certain limitations in use and should not be considered an alternative to net income, operating income, cash flow from operating activities or any other measure of financial performance presented in accordance with U.S. GAAP. Adjusted EBITDA excludes some, but not all, items that affect net income. Adjusted EBITDA as presented below may not be computed consistently with similarly titled measures of other companies and, therefore might not be comparable with other companies.
The following table sets forth a reconciliation of net income/(loss) to Adjusted EBITDA (unaudited) for the periods presented:
|
|
|
|
Dorian LPG Ltd. |
|
|
Predecessor Businesses of Dorian LPG Ltd. |
|
||||||||||||||
|
|
|
|
|
|
|
|
|
Period July 1, 2013 |
|
|
Period April 1, |
|
|
|
|
|
|
|
|||
|
|
|
|
Year ended |
|
Year ended |
|
(inception) to |
|
|
2013 to |
|
Year ended |
|
Year ended |
|
||||||
|
|
|
|
March 31, 2016 |
|
March 31, 2015 |
|
March 31, 2014 |
|
|
July 28, 2013 |
|
March 31, 2013 |
|
March 31, 2012 |
|
||||||
|
(in U.S. dollars) |
|
|
|
|
|
|
|
|
|
|
|
|
|
|
|
|
|
|
|
|
|
|
Net income/(loss) |
|
|
$ |
129,688,382 |
|
$ |
25,260,782 |
|
$ |
2,833,843 |
|
|
$ |
4,404,927 |
|
$ |
(4,850,697) |
|
$ |
(9,472,320) |
|
|
Interest and finance costs |
|
|
|
12,757,013 |
|
|
289,090 |
|
|
1,579,206 |
|
|
|
762,815 |
|
|
2,568,985 |
|
|
2,415,855 |
|
|
(Gain)/loss on derivatives, net |
|
|
|
15,775,629 |
|
|
3,959,203 |
|
|
1,104,001 |
|
|
|
(2,830,205) |
|
|
5,588,479 |
|
|
10,943,316 |
|
|
Stock-based compensation expense |
|
|
|
4,052,249 |
|
|
2,311,565 |
|
|
— |
|
|
|
— |
|
|
— |
|
|
— |
|
|
Impairment |
|
|
|
— |
|
|
1,431,818 |
|
|
— |
|
|
|
— |
|
|
— |
|
|
— |
|
|
Depreciation and amortization |
|
|
|
42,591,942 |
|
|
14,093,744 |
|
|
6,620,372 |
|
|
|
3,955,309 |
|
|
12,024,829 |
|
|
11,847,628 |
|
|
Adjusted EBITDA |
|
|
$ |
204,865,215 |
|
$ |
47,346,202 |
|
$ |
12,137,422 |
|
|
$ |
6,292,846 |
|
$ |
15,331,596 |
|
$ |
15,734,479 |
|
|
(2) |
We define calendar days as the total number of days in a period during which each vessel in our fleet was owned. Calendar days are an indicator of the size of the fleet over a period and affect both the amount of revenues and the amount of expenses that are recorded during that period. |
|
(3) |
We define available days as calendar days less aggregate off‑hire days associated with scheduled maintenance, which include major repairs, drydockings, vessel upgrades or special or intermediate surveys. We use available days to measure the aggregate number of days in a period that our vessels should be capable of generating revenues. |
|
(4) |
We define operating days as available days less the aggregate number of days that our vessels are off‑hire for any reason other than scheduled maintenance. We use operating days to measure the number of days in a period that our operating vessels are on hire (refer to 7 below). |
|
(5) |
We calculate fleet utilization by dividing the number of operating days during a period by the number of available days during that period. An increase in non‑scheduled off‑hire days would reduce our operating days, and therefore, our fleet utilization. We use fleet utilization to measure our ability to efficiently find suitable employment for our vessels. |
|
(6) |
Time charter equivalent rate, or TCE rate, is a non-GAAP measure of the average daily revenue performance of a vessel. TCE rate is a shipping industry performance measure used primarily to compare period‑to‑period changes in a shipping company’s performance despite changes in the mix of charter types (such as time charters, voyage charters) under which the vessels may be employed between the periods. Our method of calculating TCE rate is to divide revenue net of voyage expenses by operating days for the relevant time period, which may not be calculated the same by other companies. |
50
The following table sets forth a reconciliation of revenues to TCE rate (unaudited) for the periods presented:
|
|
|
Dorian LPG Ltd. |
|
|
Predecessor Businesses of |
|
||||||||||||||
|
Period July 1, 2013 |
Period April 1, |
|||||||||||||||||||
|
Year ended |
Year ended |
(inception) to |
2013 to |
Year ended |
Year ended |
|||||||||||||||
|
(in U.S. dollars, except operating days) |
March 31, 2016 |
March 31, 2015 |
March 31, 2014 |
July 28, 2013 |
March 31, 2013 |
March 31, 2012 |
||||||||||||||
|
Numerator: |
||||||||||||||||||||
|
Revenues |
$ |
289,207,829 |
$ |
104,129,149 |
$ |
29,633,700 |
$ |
15,383,116 |
$ |
38,661,846 |
$ |
34,571,042 | ||||||||
|
Voyage expenses |
(12,064,682) | (22,081,856) | (6,670,971) | (3,623,872) | (8,751,257) | (2,075,698) | ||||||||||||||
|
Voyage expenses—related party |
— |
— |
— |
(198,360) | (505,926) | (448,683) | ||||||||||||||
|
Time charter equivalent |
$ |
277,143,147 |
$ |
82,047,293 |
$ |
22,962,729 |
$ |
11,560,884 |
$ |
29,404,663 |
$ |
32,046,661 | ||||||||
|
Denominator: |
||||||||||||||||||||
|
Operating days |
5,031 | 1,652 | 941 | 449 | 1,359 | 1,405 | ||||||||||||||
|
TCE rate: |
||||||||||||||||||||
|
Time charter equivalent rate |
$ |
55,087 |
$ |
49,665 |
$ |
24,402 |
$ |
25,748 |
$ |
21,637 |
$ |
22,809 | ||||||||
|
(7) |
We determine operating days for each vessel based on the underlying vessel employment, including our vessels in the Helios Pool, which resulted in 5,031 operating days, fleet utilization of 93.1% and a TCE rate of $55,087 for the year ended March 31, 2016. If we were to calculate operating days for each vessel within the Helios Pool as a variable rate time charter for the year ended March 31, 2016, our operating days and fleet utilization would be increased to 5,291 and 97.9%, respectively and our TCE rate would be reduced to $52,380. We believe that our methodology using the underlying vessel employment provides more meaningful insight into market conditions and the performance of our vessels. |
|
(8) |
Daily vessel operating expenses are calculated by dividing vessel operating expenses by calendar days for the relevant time period. |
|
(9) |
Total owners’ equity for the Predecessor Businesses of Dorian LPG Ltd. |
ITEM 7. MANAGEMENT’S DISCUSSION AND ANALYSIS OF FINANCIAL CONDITION AND RESULTS OF OPERATIONS.
You should read the following discussion of our financial condition and results of operations in conjunction with our consolidated and our Predecessor Businesses’ combined financial statements and related notes included elsewhere in this report. Among other things, those financial statements include more detailed information regarding the basis of presentation for the following information. The financial statements have been prepared in accordance with U.S. GAAP and are presented in U.S. Dollars unless otherwise indicated. The following discussion contains forward‑looking statements that involve risks and uncertainties. As a result of many factors, such as those set forth under "Item 1A—Risk Factors" and elsewhere in this report, our actual results may differ materially from those anticipated in these forward‑looking statements. Please see the section "Forward‑Looking Statements" elsewhere in this report.
For the period April 1, 2013 to July 28, 2013, the combined financial statements include the accounts of the vessel owning companies of our Initial Fleet, which we refer to collectively as our Predecessor or the Predecessor Businesses. Our financial position, results of operations and cash flows reflected in our Predecessor combined financial statements are not indicative of those that would have been achieved had we operated as an independent stand‑alone entity for all periods presented or of future results. As such, the results of operations for Predecessor Businesses for the period April 1, 2013 to July 28, 2013 are not comparable and have been presented separately.
Overview
We are a Marshall Islands corporation, headquartered in the United States, focused on owning and operating very large gas carriers, or VLGCs, each with a cargo-carrying capacity of greater than 80,000 cbm. We currently own and
51
operate twenty-two VLGC carriers, including nineteen new fuel-efficient 84,000 cbm ECO VLGCs and three 82,000 cbm VLGCs.
Sixteen of our ECO VLGCs were constructed by Hyundai and three of our ECO VLGCs were constructed at Daewoo. Our nineteen ECO VLGCs, which incorporate fuel efficiency and emission-reducing technologies and certain custom features, were acquired by us for an aggregate purchase price of $1.4 billion, which was financed with proceeds from the 2015 Debt Facility, proceeds from equity offerings, and cash generated from operations. These nineteen ECO VLGCs were delivered to us between July 2014 and February 2016, seventeen of which were delivered during calendar year 2015 or later.
Sixteen of the nineteen ECO VLGCs were delivered during the year ended March 31, 2016, and we borrowed $676.8 million in floating rate debt under the 2015 Debt Facility in connection with those deliveries. During the year we entered into four interest rate swap contracts which hedged $250 million of non-amortizing principal and $214.3 million of amortizing principal of the 2015 Debt Facility to fixed interest rates. In February 2016, we sold the Grendon, a 5,000 cbm PGC.
On April 1, 2015, Dorian and Phoenix began operations of the Helios Pool and entered into pool participation agreements for the purpose of establishing and operating, as charterer, under a variable rate time charter to be entered into with owners or disponent owners of VLGCs, a commercial pool of VLGCs whereby revenues and expenses are shared. The vessels entered into the Helios Pool may operate either in the spot market, pursuant to COAs or on time charters of two years' duration or less. As of March 31, 2016, eighteen of our twenty-two VLGCs were deployed in the Helios Pool.
Our customers, either directly or through the Helios Pool, include or have included global energy companies such as Exxon, Unipec, Statoil and Shell, commodity traders such as Itochu Corporation and the Vitol Group and importers such as E1 Corp., SK Gas Co. Ltd. and Indian Oil Corporation. For the year ended March 31, 2016, the Helios Pool and one other individual charterer accounted for 70% and 12% of our total revenues, respectively. Within the Helios Pool, two charterers represented 19% and 14% of net pool revenues—related party for the year ended March 31, 2016. For the year ended March 31, 2015, five charterers represented 27%, 19%, 14%, 12% and 11% of total revenues, respectively. For the period ended March 31, 2014, three charterers represented 51%, 13% and 10% of total revenues, respectively. See “Item 1A. Risk Factors—We operate exclusively in the LPG shipping industry. Due to our lack of diversification and the lack of diversification of the Helios Pool, adverse developments in the LPG shipping industry may adversely affect our business, financial condition and operating results” and “Item 1A. Risk Factors—We expect to be dependent on a limited number of customers for a material part of our revenues, and failure of such customers to meet their obligations could cause us to suffer losses or negatively impact our results of operations and cash flows.”
We intend to pursue a balanced chartering strategy by employing our vessels on a mix of multi-year time charters, some of which may include a profit-sharing component, shorter-term time charters, spot market voyages and COAs. Six of our vessels are currently on fixed time charters, including two vessels on fixed time charter within the Helios Pool. See “Item 1. Business—Our Fleet” above for more information.
On August 5, 2015, we publicly announced that our Board of Directors had authorized the repurchase of up to $100.0 million of our common stock on or before December 31, 2016. As of March 31, 2016, we repurchased a total of 1,932,465 shares of our common stock for approximately $20.9 million under this program, resulting in $79.1 million of available authorization remaining.
Vessel Deployment—Spot Voyages, Time Charters, COAs, and Pooling Arrangements
We seek to employ our vessels in a manner that maximizes fleet utilization and earnings upside through our chartering strategy in line with our goal of maximizing shareholder value and returning capital to shareholders when appropriate, taking into account fluctuations in freight rates in the market and our own views on the direction of those rates in the future. As of March 31, 2016, eighteen of our twenty-two VLGCs were employed in the Helios Pool, which includes time charters with a term of less than two years.
52
A spot market voyage charter is generally a contract to carry a specific cargo from a load port to a discharge port for an agreed upon freight per ton of cargo or a specified total amount. Under spot market voyage charters, we pay voyage expenses such as port and fuel costs. A time charter is generally a contract to charter a vessel for a fixed period of time at a set daily or monthly rate. Under time charters, the charterer pays voyage expenses such as port and fuel costs. Vessels operating on time charters provide more predictable cash flows, but can yield lower profit margins than vessels operating in the spot market during periods characterized by favorable market conditions. Vessels operating in the spot market generate revenues that are less predictable but may enable us to capture increased profit margins during periods of improvements in tanker rates although we are exposed to the risk of declining tanker rates and lower utilization. Pools generally consist of a number of vessels which may be owned by a number of different ship owners which operate as a single marketing entity in an effort to produce freight efficiencies. Pools typically employ experienced commercial charterers and operators who have close working relationships with customers and brokers while technical management is typically the responsibility of each ship owner. Under pool arrangements, vessels typically enter the pool under a time charter agreement whereby the cost of bunkers and port expenses are borne by the charterer (i.e., the pool) and operating costs, including crews, maintenance and insurance are typically paid by the owner of the vessel. Pools, in return, typically negotiate charters with customers primarily in the spot market. Since the members of a pool typically share in the revenue generated by the entire group of vessels in the pool, and since pools operate primarily in the spot market, including the pools in which we participate, the revenue earned by vessels placed in spot market related pools is subject to the fluctuations of the spot market and the ability of the pool manager to effectively charter its fleet. We believe that vessel pools can provide cost-effective commercial management activities for a group of similar class vessels and potentially result in lower waiting times.
COAs relate to the carriage of multiple cargoes over the same route and enables the COA holder to nominate different ships to perform individual voyages. It constitutes a number of voyage charters to carry a specified amount of cargo during the term of the COA, which usually spans a number of years. All of the vessel's operating, voyage and capital costs are borne by the ship owner.
On April 1, 2015, Dorian and Phoenix began operation of the Helios Pool, a 50% joint venture, which is a pool of VLGC vessels. We believe that the operation of certain of our VLGCs in this pool will allow us to achieve better market coverage and utilization. Vessels entered into the Helios Pool are commercially managed jointly by Dorian LPG (UK) Ltd., our wholly-owned subsidiary, and Phoenix. The members of the Helios Pool share in the net pool revenues generated by the entire group of vessels in the pool, weighted according to certain technical vessel characteristics, and net pool revenues (see Note 2 to our consolidated financial statements) are distributed as variable rate time charter hire to each participant. The vessels entered into the Helios Pool may operate either in the spot market, COAs, or on time charters of two years' duration or less. In March 2016, the Helios Pool reached an agreement with Oriental Energy, one of the largest propane dehydrogenation plant operators and importers in China to operate eight VLGCs on its behalf. As of May 26, 2016, the Helios Pool operated twenty-four VLGCs, including eighteen of our vessels, four Phoenix vessels, and two Oriental Energy vessels. When fully delivered, the Helios Pool will operate six additional VLGCs for Oriental Energy, some of which will be time chartered-in at a fixed time charter hire rate. In addition, the Helios Pool has entered into a COA with Oriental Energy covering its shipments from the United States Gulf, which gives us exposure to the growing Chinese LPG market.
Important Financial and Operational Terms and Concepts
We use a variety of financial and operational terms and concepts in the evaluation of our business and operations including the following:
Vessel Revenue. Our revenues are driven primarily by the number of vessels in our fleet, the number of days during which our vessels operate and the amount of daily rates that our vessels earn under our charters, which, in turn, are affected by a number of factors, including levels of demand and supply in the LPG shipping industry; the age, condition and specifications of our vessels; the duration of our charters; the timing of when the profit sharing arrangements are earned; the amount of time that we spend positioning our vessels; the availability of our vessels, which is related to the amount of time that our vessels spend in drydock undergoing repairs and the amount of time required to perform necessary maintenance or upgrade work; and other factors affecting rates for LPG vessels.
53
We generate revenue by providing seaborne transportation services to customers pursuant to three types of contractual relationships:
Pooling Arrangements. As from April 1, 2015, we began operation of the Helios Pool. Net pool revenues—related party for each vessel is determined in accordance with the profit sharing terms specified within the pool agreement for the Helios Pool. In particular, the pool manager aggregates the revenues and voyage expenses of all of the pool participants and Helios Pool general and administrative expenses and distributes the net earnings to participants based on:
|
· |
pool points (vessel attributes such as cargo carrying capacity, fuel consumption, and speed are taken into consideration); and |
|
· |
number of days the vessel participated in the Helios Pool in the period. We recognize pool revenue on a monthly basis, when the vessel has participated in the Helios Pool during the period and the amount of pool revenue for the month can be estimated reliably. We receive estimated vessel earnings based on the known number of days the vessel has participated in the Helios Pool, the contract terms, and the estimated monthly pool revenue. We receive a report from the Helios Pool which identifies the number of days the vessel participated in the Helios Pool, the total pool points for the period, the total net pool revenues—related party for the period, and the calculated share of pool revenue for the vessel. We review the report for consistency with each vessel’s pool agreement and vessel management records. |
For the year ended March 31, 2016, approximately 70.2% of our revenue was generated through the Helios Pool as net pool revenues—related party. There were no revenues generated through pooling arrangements for the year ended March 31, 2015 and for the period July 1, 2013 (inception) to March 31, 2014.
Voyage Charters. A voyage charter, or spot charter, is a contract for transportation of a specified cargo between two or more designated ports. This type of charter is priced on a current or "spot" market rate, typically on a price per ton of product carried. Under voyage charters, we are responsible for all of the voyage expenses in addition to providing the crewing and other vessel operating services. Revenues for voyage charters are more volatile as they are typically tied to prevailing market rates at the time of the voyage. Our gross revenue under voyage charters are generally higher than under comparable time charters so as to compensate us for bearing all voyage expenses. As a result, our revenue and voyage expenses may vary significantly depending on our mix of time charters and voyage charters. For the years ended March 31, 2016 and 2015 and for the period July 1, 2013 (inception) to March 31, 2014, approximately 16.0%, 74.3% and 37.8%, respectively, of our revenue was generated pursuant to voyage charters.
Time Charters. A time charter is a contract under which a vessel is chartered for a defined period of time at a fixed daily or monthly rate. Under time charters, we are responsible for providing crewing and other vessel operating services, the cost of which is intended to be covered by the fixed rate, while the customer is responsible for substantially all of the voyage expenses, including bunker fuel consumption, port expenses and canal tolls. LPG is typically transported under a time charter arrangement, with terms ranging up to seven years. In addition, we may also have profit sharing arrangements with some of our customers that provide for additional payments above a floor monthly rate (usually up to an agreed ceiling) based on the actual, average daily rate quoted by the Baltic Exchange for Very Large Gas Carriers on the benchmark Ras Tanura‑Chiba route over an agreed time period converted to a Time Charter Equivalent monthly rate. For the years ended March 31, 2016 and 2015 and for the period July 1, 2013 (inception) to March 31, 2014, approximately 13.4%, 25.1% and 59.4%, respectively, of our revenue was generated pursuant to time charters from our VLGCs not in the Helios Pool.
Other Revenues. Other revenues represents income from charterers, including the Helios Pool, relating to reimbursement of expenses such as costs for security guards and war risk insurance for voyages operating high risk areas. For the years ended March 31, 2016 and 2015 and for the period July 1, 2013 (inception) to March 31, 2014, approximately 0.4%, 0.6% and 2.8%, respectively, of our revenue was generated pursuant to other revenues.
54
Calendar Days. We define calendar days as the total number of days in a period during which each vessel in our fleet was owned. Calendar days are an indicator of the size of the fleet over a period and affect both the amount of revenues and the amount of expenses that are recorded during that period.
Available Days. We define available days as calendar days less aggregate off‑hire days associated with scheduled maintenance, which include major repairs, drydockings, vessel upgrades or special or intermediate surveys. We use available days to measure the aggregate number of days in a period that our vessels should be capable of generating revenues.
Operating Days. We define operating days as available days less the aggregate number of days that our vessels are off‑hire for any reason other than scheduled maintenance. We use operating days to measure the number of days in a period that our operating vessels are on hire.
Drydocking. We must periodically drydock each of our vessels for any major repairs and maintenance and for inspection of the underwater parts of the vessel that cannot be performed while the vessels are operating and for any modifications to comply with industry certification or governmental requirements. We are required to drydock a vessel once every five years until it reaches fifteen years of age and thereafter every 2.5 years. We capitalize costs associated with the drydockings and amortize these costs on a straight‑line basis over the period through the date the next survey is scheduled to become due under the "Deferral" method permitted under U.S. GAAP. Costs incurred during the drydocking period which relate to routine repairs and maintenance are expensed as incurred. The number of drydockings undertaken in a given period and the nature of the work performed determine the level of drydocking expenditures.
Fleet Utilization. We calculate fleet utilization by dividing the number of operating days during a period by the number of available days during that period. An increase in non‑scheduled off‑hire days would reduce our operating days, and therefore, our fleet utilization. We use fleet utilization to measure our ability to efficiently find suitable employment for our vessels.
Time Charter Equivalent Rate. Time charter equivalent rate, or TCE rate, is a measure of the average daily revenue performance of a vessel. TCE rate is a shipping industry performance measure used primarily to compare period‑to‑period changes in a shipping company’s performance despite changes in the mix of charter types (such as time charters, voyage charters) under which the vessels may be employed between the periods. Our method of calculating TCE rate is to divide revenue net of voyage expenses by operating days for the relevant time period.
Voyage Expenses. Voyage expenses are all expenses unique to a particular voyage, including bunker fuel consumption, port expenses, canal fees, charter hire commissions, war risk insurance and security costs. Voyage expenses are typically paid by us under voyage charters and by the charterer under time charters. Accordingly, we generally only incur voyage expenses for our own account when performing voyage charters or during repositioning voyages between time charters for which no cargo is available or travelling to or from drydocking. We generally bear all voyage expenses under voyage charters and, as such, voyage expenses are generally greater under voyage charters than time charters. As a result, our voyage expenses may vary significantly depending on our mix of time charters and voyage charters.
Vessel Operating Expenses. Vessel operating expenses are expenses that are not unique to a specific voyage. Vessel operating expenses are paid by us under each of our charter types (as we do not employ our vessels on bare boat charters). Vessel operating expenses include crew wages and related costs, the costs for lubricants, insurance, expenses relating to repairs and maintenance, the cost of spares and consumable stores, tonnage taxes and other miscellaneous expenses. Our vessel operating expenses will increase with the expansion of our fleet and are subject to change because of higher crew costs, higher insurance premiums, unexpected repair expenses and general inflation. Furthermore, we expect maintenance costs will increase as our vessels age.
Daily Vessel Operating Expenses. Daily vessel operating expenses are calculated by dividing vessel operating expenses by calendar days for the relevant time period.
Management Fees—Related Party. Management fees to related parties ceased on June 30, 2014. They were paid pursuant to management agreements entered into by each vessel owning subsidiary with Dorian (Hellas) S.A., or
55
DHSA. DHSA provided the financial, strategic, technical, crew and commercial management as well as insurance and accounting services to the vessel owning subsidiaries for a fee of $93,750 per vessel per month payable one month in advance effective from July 29, 2013 through June 30, 2014. Prior to July 29, 2013, our Predecessor paid a fixed monthly management fee of $40,000 per VLGC and $32,000 for our 5,000 cbm PGC. Eagle Ocean Transport Inc., or Eagle Ocean, and Highbury Shipping Services Limited, or Highbury also provided commercial and strategic services to the Predecessor. Mr. John Hadjipateras, our Chairman, President and Chief Executive Officer, owns 100% of Eagle Ocean, and our Vice President of Chartering, Insurance and Legal, Nigel Grey‑Turner, owns 100% of Highbury.
In addition, DHSA provided us with pre‑delivery services for each newbuilding, which included engineering and technical support, liaising with the shipyard, and ensuring key suppliers are integrated into the production planning process for a fee of $15,000 per month for each newbuilding contract. The fees for pre‑delivery services were capitalized to the cost of the vessels under construction. The management fees were charged on a monthly basis per vessel and newbuilding contract and the total fees were affected by the number of vessels in our fleet and the number of newbuilding contracts managed.
Pursuant to transition agreements that became effective on July 1, 2014, or the Transition Agreements, we pay no further management or pre-delivery services fees to DHSA and we have transitioned all management functions to our wholly‑owned subsidiaries Dorian LPG Management Corp., Dorian LPG (USA) LLC, and Dorian LPG (UK) Ltd. as of July 1, 2014. Subsequent to the completion of this transition, no fees for such services are paid to any related parties and no consideration is payable by us to DHSA.
In addition, pursuant to the Transition Agreements, each of DHSA, Eagle Ocean, and Highbury transferred a certain number of employees and selected assets to our wholly‑owned subsidiaries. Subsequent to the Transition Agreements, Eagle Ocean continues to incur travel-related costs for certain transitioned employees as well as office-related costs. We reimbursed Eagle Ocean $0.8 million and $0.7 million at cost for the years ended March 31, 2016 and 2015, respectively.
Depreciation and Amortization. We depreciate our vessels on a straight‑line basis using an estimated useful life of 25 years and after considering estimated salvage values. Our Predecessor used an estimated useful life of 20 years to 25 years depending on the type of vessel.
We amortize the cost of capitalized drydocking expenditures on a straight‑line basis over the period through the date the next drydocking/special survey is scheduled to become due.
General and Administrative Expenses. General and administrative expenses principally consist of the costs incurred in the corporate administration of the vessel and non‑vessel owning subsidiaries. Beginning July 1, 2014, we ceased to incur related-party management fees as a result of the completion of the Transaction Agreements described above under "Management Fees—Related Party." In June 2014, we granted 655,000 restricted stock awards to certain of our officers and in March 2015, we granted 274,000 restricted stock awards to certain of our directors, employees and non-employee consultants (see “Item 12. Security Ownership of Certain Beneficial Owners and Management and Related Stockholder Matters”) that vest over five years. Granting of restricted stock results in an increase in expenses. Compensation expense for employees is measured at the grant date based on the estimated fair value of the awards and is recognized over the vesting period and for nonemployees is re-measured at the end of each reporting period based on the estimated fair value of the awards on that date and is recognized over the vesting period.
Critical Accounting Estimates
We prepare our consolidated financial statements in accordance with U.S. GAAP, which requires us to make estimates in the application of our accounting policies based on our best assumptions, judgments and opinions. On a regular basis, management reviews the accounting policies, assumptions, estimates and judgments to ensure that our consolidated financial statements are presented fairly and in accordance with U.S. GAAP. However, because future events and their effects cannot be determined with certainty, actual results could differ from our assumptions and estimates, and such differences could be material. Accounting estimates and assumptions discussed in this section are those that we consider
56
to be the most critical to an understanding of our financial statements because they inherently involve significant judgments and uncertainties. For a description of our material accounting policies, please read Note 2 of our consolidated financial statements included elsewhere in this report.
Net pool revenues—related party. Net pool revenues—related party for each vessel in the pool is determined in accordance with the profit sharing terms specified within the pool agreement. In particular, the pool manager calculates the net pool revenues using gross revenues less voyage expenses of all the pool vessels and less the general and administrative expenses of the pool and distributes the net pool revenues as time charter hire to participants based on:
|
· |
pool points (vessel attributes such as cargo carrying capacity, fuel consumption, and construction characteristics are taken into consideration); and |
|
· |
number of days the vessel participated in the pool in the period. |
We recognize net pool revenues—related party on a monthly basis, when the vessel has participated in the pool during the period and the amount of net pool revenues for the month can be estimated reliably.
Vessel Depreciation. The cost of our vessels less their estimated residual value is depreciated on a straight‑line basis over the vessels' estimated useful lives. We estimate the useful life of each of our vessels to be 25 years from the date the vessel was originally delivered from the shipyard. Based on the current market and the types of vessels we plan to purchase, we expect the residual values of our vessels will be based upon a value of approximately $400 per lightweight ton. An increase in the useful life of our vessels or in their residual value would have the effect of decreasing the annual depreciation charge and extending it into later periods. An increase in the useful life of a vessel may occur as a result of superior vessel maintenance performed, favorable ocean going and weather conditions the vessel is subjected to, superior quality of the shipbuilding or yard, or high freight market rates, which result in owners scrapping the vessels later due to the attractive cash flows. A decrease in the useful life of our vessels or in their residual value would have the effect of increasing the annual depreciation charge and possibly result in an impairment charge. A decrease in the useful life of a vessel may occur as a result of poor vessel maintenance performed, harsh ocean going and weather conditions the vessel is subjected to, or poor quality of the shipbuilding or yard. However, when regulations place limitations over the ability of a vessel to trade on a worldwide basis, we will adjust the vessel's useful life to end at the date such regulations preclude such vessel's further commercial use.
Impairment of long‑lived assets. We review our vessels and other fixed assets for impairment when events or circumstances indicate the carrying amount of the asset may not be recoverable. In addition, we compare independent appraisals to our carrying value for indicators of impairment to our vessels. When such indicators are present, an asset is tested for recoverability by comparing the estimate of future undiscounted net operating cash flows expected to be generated by the use of the asset over its remaining useful life and its eventual disposition to its carrying amount. An impairment charge is recognized if the carrying value is in excess of the estimated future undiscounted net operating cash flows. The impairment loss is measured based on the excess of the carrying amount over the fair market value of the asset. The new lower cost basis would result in a lower annual depreciation than before the impairment.
Our estimates of fair market value assume that our vessels are all in good and seaworthy condition without need for repair and if inspected would be certified in class without notations of any kind. Our estimates are based on information available from various industry sources, including:
|
· |
reports by industry analysts and data providers that focus on our industry and related dynamics affecting vessel values; |
|
· |
news and industry reports of similar vessel sales; |
|
· |
approximate market values for our vessels or similar vessels that we have received from shipbrokers, whether solicited or unsolicited, or that shipbrokers have generally disseminated; |
|
· |
offers that we may have received from potential purchasers of our vessels; and |
57
|
· |
vessel sale prices and values of which we are aware through both formal and informal communications with shipowners, shipbrokers, industry analysts and various other shipping industry participants and observers. |
As we obtain information from various industry and other sources, our estimates of fair market value are inherently uncertain. In addition, vessel values are highly volatile; as such, our estimates may not be indicative of the current or future fair market value of our vessels or prices that we could achieve if we were to sell them.
For the year ended March 31, 2016, independent appraisals of four of our VLGCs had indicators of impairment in accordance with ASC 360 Property, Plant, and Equipment. We determined estimated net operating cash flows for these VLGCs by applying various assumptions regarding future time charter equivalent revenues net of commissions, operating expenses, scheduled drydockings, expected offhire and scrap values. These assumptions were based on historical data as well as future expectations. We estimated spot market rates used are based on the trailing 10-year historical average spot market rates based on average rates published by maritime industry researchers. Estimated outflows for operating expenses and drydocking expenses were based on historical and budgeted costs and were adjusted for assumed inflation. Utilization was based on our historical levels achieved in the spot market and estimates of a residual value consistent with scrap rates used in management's evaluation of scrap value. Such estimates and assumptions regarding expected net operating cash flows require considerable judgment and were based upon historical experience, financial forecasts and industry trends and conditions. Therefore, based on this analysis, we concluded that no impairment charge was necessary because we believe the vessel carrying values are recoverable. No impairment charges were recognized for the year ended March 31, 2016.
In addition, we performed a sensitivity analysis as of March 31, 2016, to determine the effect on recoverability of changes in daily TCE rates. The sensitivity analysis suggests that we would not incur an impairment charge on any of those four VLGCs if daily TCE rates fell by 30% compared to the 10-year historical average spot market rates. An impairment charge of approximately $4.9 million on those four VLGCs would be triggered by a reduction of 40% in the 10-year historical average spot market rates. The amount, if any, and timing of any impairment charges we may recognize in the future will depend upon then current and expected future charter rates and vessel values, which may differ materially from those used in our estimates as of March 31, 2016.
For the year ended March 31, 2015, an independent appraisal of our PGC vessel indicated impairment and, therefore, we determined estimated net operating cash flows for our PGC vessel by applying the above methodology with the exception of utilizing 6-year historical average spot market rates. Management believes the use of estimates based on the 6-year historical average rates calculated as of the reporting date was reasonable for our PGC vessel as the vessel had a remaining useful life of six years. We recognized an impairment loss of $1.4 million for our PGC vessel to its fair value of $4.0 million, which resulted from the prolonged market weaknesses continuing into the fourth fiscal quarter in the year ended March 31, 2015, in the market for shipping petro-chemical gases, an important trade for PGC vessels. Sales of similarly aged PGC vessels reflected the market weaknesses and the impending newbuilding PGC vessels entering the global fleet.
58
The table set forth below indicates the carrying value of each owned vessel in our fleet as of March 31, 2016 and 2015 at which times none of the vessels listed in the table below were being held for sale:
|
|
|
|
|
|
|
Date of |
|
|
|
|
|
|
|
|
|
|
|
|
|
Capacity |
|
Year |
|
Acquisition/ |
|
Purchase Price/ |
|
Carrying value at |
|
Carrying value at |
|
|||
|
Vessels |
|
(Cbm) |
|
Built |
|
Delivery |
|
Original Cost |
|
March 31, 2016(1) |
|
March 31, 2015(2) |
|
|||
|
Captain Nicholas ML |
|
82,000 |
|
2008 |
|
7/29/2013 |
|
$ |
68,156,079 |
|
$ |
60,052,136 |
|
$ |
63,092,093 |
|
|
Captain John NP |
|
82,000 |
|
2007 |
|
7/29/2013 |
|
|
64,955,636 |
|
|
56,741,656 |
|
|
60,030,417 |
|
|
Captain Markos NL |
|
82,000 |
|
2006 |
|
7/29/2013 |
|
|
61,421,882 |
|
|
53,560,395 |
|
|
56,508,422 |
|
|
Comet |
|
84,000 |
|
2014 |
|
7/25/2014 |
|
|
75,276,432 |
|
|
70,728,846 |
|
|
73,433,095 |
|
|
Corsair |
|
84,000 |
|
2014 |
|
9/26/2014 |
|
|
80,906,292 |
|
|
76,484,212 |
|
|
79,416,243 |
|
|
Corvette(3) |
|
84,000 |
|
2015 |
|
1/2/2015 |
|
|
84,262,500 |
|
|
80,458,627 |
|
|
83,495,783 |
|
|
Cougar |
|
84,000 |
|
2015 |
|
6/15/2015 |
|
|
80,427,640 |
|
|
78,116,797 |
|
|
— |
|
|
Concorde |
|
84,000 |
|
2015 |
|
6/24/2015 |
|
|
81,168,031 |
|
|
78,905,515 |
|
|
— |
|
|
Cobra |
|
84,000 |
|
2015 |
|
6/26/2015 |
|
|
80,467,667 |
|
|
78,242,067 |
|
|
— |
|
|
Continental |
|
84,000 |
|
2015 |
|
7/23/2015 |
|
|
80,487,197 |
|
|
78,476,407 |
|
|
— |
|
|
Constitution |
|
84,000 |
|
2015 |
|
8/20/2015 |
|
|
80,517,226 |
|
|
78,729,121 |
|
|
— |
|
|
Commodore |
|
84,000 |
|
2015 |
|
8/28/2015 |
|
|
80,468,889 |
|
|
78,745,787 |
|
|
— |
|
|
Cresques(3) |
|
84,000 |
|
2015 |
|
9/1/2015 |
|
|
82,960,176 |
|
|
81,210,645 |
|
|
— |
|
|
Constellation |
|
84,000 |
|
2015 |
|
9/30/2015 |
|
|
78,649,026 |
|
|
77,228,406 |
|
|
— |
|
|
Clermont |
|
84,000 |
|
2015 |
|
10/13/2015 |
|
|
80,530,199 |
|
|
79,172,913 |
|
|
— |
|
|
Cheyenne |
|
84,000 |
|
2015 |
|
10/22/2015 |
|
|
80,503,271 |
|
|
79,218,316 |
|
|
— |
|
|
Cratis(3) |
|
84,000 |
|
2015 |
|
10/30/2015 |
|
|
83,186,333 |
|
|
81,919,911 |
|
|
— |
|
|
Commander |
|
84,000 |
|
2015 |
|
11/5/2015 |
|
|
78,056,729 |
|
|
76,925,109 |
|
|
— |
|
|
Chaparral |
|
84,000 |
|
2015 |
|
11/20/2015 |
|
|
80,516,187 |
|
|
79,462,497 |
|
|
— |
|
|
Copernicus(3) |
|
84,000 |
|
2015 |
|
11/25/2015 |
|
|
83,333,085 |
|
|
82,279,285 |
|
|
— |
|
|
Challenger |
|
84,000 |
|
2015 |
|
12/11/2015 |
|
|
80,576,863 |
|
|
79,690,068 |
|
|
— |
|
|
Caravelle |
|
84,000 |
|
2016 |
|
2/25/2016 |
|
|
81,119,450 |
|
|
80,875,760 |
|
|
— |
|
|
Grendon(4) |
|
5,000 |
|
1996 |
|
7/29/2013 |
|
|
6,625,000 |
|
|
— |
|
|
4,000,000 |
|
|
|
|
1,847,000 |
|
|
|
|
|
$ |
1,734,571,790 |
|
$ |
1,667,224,476 |
|
$ |
419,976,053 |
|
|
(1) |
Our vessels are stated at carrying values (refer to our accounting policy in Note 2 to our consolidated financial statements) and with the exception of four VLGCs as of March 31, 2016, the carrying value of each of our vessels was lower than its estimated market value as of March 31, 2016. On an aggregate fleet basis, the estimated market value of our vessels exceeded their carrying value as of March 31, 2016 by $31.3 million. No impairment was recorded during the year ended March 31, 2016 as we believe that the carrying value of our vessels is fully recoverable. |
|
(2) |
With the exception of the Grendon as of March 31, 2015 (refer to 4 below), the carrying value of each of our vessels was lower than its estimated market value as of March 31, 2015. On an aggregate fleet basis, the estimated market value of our vessels exceeded their carrying value as of March 31, 2015 by $85.3 million. |
|
(3) |
VLGCs for which we believe, as of March 31, 2016, that the estimated fair value is lower than the VLGC’s carrying value. We believe that the aggregate carrying value of these vessels exceeds their aggregate estimated fair value by $4.9 million as of March 31, 2016. However, as described above, the estimated net operating cash flows for each of the four VLGCs was higher than the carrying amount and consequently, no impairment loss was recognized. |
|
(4) |
During the year ended March 31, 2015, an impairment loss was taken on the Grendon of $1.4 million and the carrying value was written down to $4.0 million. The Grendon was sold in February 2016 and had no carrying value as of March 31, 2016. |
59
Drydocking and special survey costs. We must periodically drydock each of our vessels to comply with industry standards, regulatory requirements and certifications. We are required to drydock a vessel once every five years until it reaches 15 years of age, after which we are required to drydock the applicable vessel every 2.5 years.
Drydocking costs are accounted under the deferral method whereby the actual costs incurred are deferred and are amortized on a straight‑line basis over the period through the date the next drydocking is scheduled to become due. Costs deferred include expenditures incurred relating to shipyard costs, hull preparation and painting, inspection of hull structure and mechanical components, steelworks, machinery works, and electrical works. Drydocking costs do not include vessel operating expenses such as replacement parts, crew expenses, provisions, luboil consumption, insurance, management fees or management costs during the drydock period. Expenses related to regular maintenance and repairs of our vessels are expensed as incurred, even if such maintenance and repair occurs during the same time period as our drydocking.
If a drydocking is performed prior to the scheduled date, the remaining unamortized balances are immediately written off. Unamortized balances of vessels that are sold are written‑off and included in the calculation of the resulting gain or loss in the period of the vessel's sale. The nature of the work performed and the number of drydockings undertaken in a given period determine the level of drydocking expenditures.
Fair Value of Derivative Instruments. We use derivative financial instruments to manage interest rate risks. The fair value of our interest rate swap agreements is the estimated amount that we would receive or pay to terminate the agreements at the reporting date, taking into account current interest rates and the current credit worthiness of both us and the swap counterparties. The estimated amount is the present value of estimated future cash flows, being equal to the difference between the benchmark interest rate and the fixed rate in the interest rate swap agreement, multiplied by the notional principal amount of the interest rate swap agreement at each interest reset date
The fair value of our interest swap agreements at the end of each period are most significantly affected by the interest rate implied by the LIBOR interest yield curve, including its relative steepness. Interest rates have experienced significant volatility in recent years in both the short and long term. While the fair value of our interest rate swap agreements are typically more sensitive to changes in short‑term rates, significant changes in the long‑term benchmark interest rates also materially impact our interest.
The fair value of our interest swap agreements is also affected by changes in our own and our counterparty specific credit risk included in the discount factor. Our estimate of our counterparty's credit risk is based on the credit default swap spread of the relevant counterparty which is publicly available. The process of determining our own credit worthiness requires significant judgment in determining which source of credit risk information most closely matches our risk profile, which includes consideration of the margin we would be able to secure for future financing. A 10% increase / decrease in our own or our counterparty credit risk would not have had a significant impact on the fair value of our interest rate swaps.
The LIBOR interest rate yield curve and our specific credit risk are expected to vary over the life of the interest rate swap agreements. The larger the notional amount of the interest rate swap agreements outstanding and the longer the remaining duration of the interest rate swap agreements, the larger the impact of any variability in these factors will be on the fair value of our interest rate swaps. We economically hedge the interest rate exposure on a significant amount of our long‑term debt and for long durations. As such, we have experienced, and we expect to continue to experience, material variations in the period‑to‑period fair value of our derivative instruments.
Although we measure the fair value of our derivative instruments utilizing the inputs and assumptions described above, if we were to terminate the interest rate swap agreements at the reporting date, the amount we would pay or receive to terminate the derivative instruments may differ from our estimate of fair value. If the estimated fair value differs from the actual termination amount, an adjustment to the carrying amount of the applicable derivative asset or liability would be recognized in earnings for the current period. Such adjustments could be material.
60
Results of Operations —Dorian LPG Ltd.
For the year ended March 31, 2016 as compared to the year ended March 31, 2015
Revenues
The following table compares revenues for the years ended March 31:
|
|
|
|
|
|
|
|
|
Increase / |
|
Percent |
|
|
|
|
|
2016 |
|
2015 |
|
(Decrease) |
|
Change |
|
|||
|
Net pool revenues—related party |
|
$ |
202,918,232 |
|
$ |
— |
|
$ |
202,918,232 |
|
NM |
|
|
Voyage charter revenues |
|
|
46,194,134 |
|
|
77,331,934 |
|
|
(31,137,800) |
|
(40.3) |
% |
|
Time charter revenues |
|
|
38,737,172 |
|
|
26,098,290 |
|
|
12,638,882 |
|
48.4 |
% |
|
Other revenues |
|
|
1,358,291 |
|
|
698,925 |
|
|
659,366 |
|
94.3 |
% |
|
Total |
|
$ |
289,207,829 |
|
$ |
104,129,149 |
|
$ |
185,078,680 |
|
177.7 |
% |
Revenues of $289.2 million for the year ended March 31, 2016, including net pool revenues—related party, voyage charters, time charters and other revenues earned by our VLGCs and our PGC, increased $185.1 million, or 177.7%, from $104.1 million for the year ended March 31, 2015. The increase is primarily attributable to $162.2 million of revenues contributed by sixteen of our newbuilding VLGCs that were delivered subsequent to March 31, 2015. Additionally, revenues contributed by VLGCs in our operating fleet during both periods increased $21.8 million resulting from employment of 2,101 operating days during the year ended March 31, 2016 compared to 1,512 operating days during the year ended March 31, 2015. The Grendon’s revenues increased $1.1 million to $2.9 million on 224 operating days for the year ended March 31, 2016 from $1.8 million on 140 operating days for the year ended March 31, 2015.
For the year ended March 31, 2016, nineteen of our VLGCs operated within the Helios Pool, including one VLGC that left the Helios Pool to begin a long-term time charter in July 2015, and our VLGCs with the Helios Pool earned net pool revenues—related party of $202.9 million. Four of our VLGCs operated in the spot market outside of the Helios Pool and earned $43.3 million in voyage charter revenues and four of our VLGCs earned time charter revenues amounting to $38.7 million during the year ended March 31, 2016. For the year ended March 31, 2015, four of our VLGCs operated in the spot market and earned $76.1 million in voyage charter revenues, and three of our VLGCs earned time charter revenues during the period amounting to $25.5 million, including a VLGC that ended its time charter on July 27, 2014. Time charter revenues included $7.8 million of profit sharing for the year ended March 31, 2015.
Voyage Expenses
Voyage expenses were $12.1 million during the year ended March 31, 2016 a decrease of $10.0 million, or 45.4%, from $22.1 million for the year ended March 31, 2015. The decrease was mainly attributable to a decrease in the number of vessels operating on voyage charters as a result of vessels operating in the Helios Pool as well as decreases in fuel prices. These decreases resulted in decreases in bunker costs of $8.4 million, port expenses of $1.0 million and other voyage expenses of $0.6 million. Voyage expenses during the year ended March 31, 2016 mainly related to bunkers of $7.2 million, port charges and other related expenses of $2.6 million, brokers’ commissions of $1.3 million, security costs of $0.4 million and other voyage expenses of $0.6 million. Voyage expenses during the year ended March 31, 2015 mainly related to bunkers of $15.7 million, port charges and other related expenses of $3.6 million, brokers’ commissions of $1.7 million, security costs of $0.7 million and other voyage expenses of $0.4 million.
Vessel Operating Expenses
Vessel operating expenses were $47.1 million during the year ended March 31, 2016, or $8,581 per vessel per calendar day, which is calculated by dividing vessel operating expenses by calendar days for the relevant time period for the vessels that were in our fleet. This was an increase of $25.8 million, or 121.7%, from $21.3 million or $10,703 per vessel per calendar day, for the year ended March 31, 2015. This increase is primarily the result of an increase of $24.0 million of vessel operating expenses attributable to sixteen of our ECO VLGCs that were delivered subsequent to March 31, 2015. Additionally, vessel operating expenses increased $1.8 million for the seven vessels that were in our fleet during both periods resulting from 2,518 calendar days during the year ended March 31, 2016 compared to 1,986 calendar days
61
during the year ended March 31, 2015. The decline in vessel operating expenses per vessel per calendar day during the year ended March 31, 2016 was largely due to the addition of newer vessels, which incur lower operating costs, along with a $0.5 million reduction in costs relating to the training of additional crew when compared to the year ended March 31, 2015.
Management Fees—Related Party
Beginning July 1, 2014, we ceased to incur these related-party management fees as a result of the completion of the Transition Agreements described above in “Important Financial and Operational Terms and Concepts—Management Fees—Related Party.” Management fees expensed for the year ended March 31, 2015 represent fees charged by DHSA amounting to approximately $1.1 million in accordance with our management agreements entered into with DHSA. The management fees were charged on a monthly basis per vessel and the total fees were affected by the number of vessels in our fleet. No management fees—related party were incurred during the year ended March 31, 2016.
Impairment
We did not incur any impairment charges during the year ended March 31, 2016. In the year ended March 31, 2015, we recognized an impairment loss of $1.4 million for our owned PGC vessel. This impairment loss was triggered by reductions in vessel values reflecting challenging conditions in the PGC market, and represented the difference between the carrying value and recoverable amount, being fair value.
Depreciation and Amortization
Depreciation and amortization was approximately $42.6 million for the year ended March 31, 2016, an increase of $28.5 million, or 202.2%, from $14.1 million for the year ended March 31, 2015. The increase is primarily attributable to $23.8 million of depreciation and amortization related to sixteen of our ECO VLGCs that were delivered subsequent to March 31, 2015. Additionally, there was an increase of $4.7 million for the six VLGCs that were in our fleet during both years resulting from an increase in VLGC calendar days from 1,621 during the year ended March 31, 2015 to 2,196 during the year ended March 31, 2016.
General and Administrative Expenses
General and administrative expenses were $29.8 million for the year ended March 31, 2016, an increase of $15.7 million, or 110.9%, from $14.1 million for the year ended March 31, 2015 mainly due to compensation-related increases of $8.9 million for salaries, wages and benefits (primarily due to an increase of $5.1 million relating to cash bonuses to various employees relating to the year ended March 31, 2016, as well as prior periods, were granted and expensed in the year ended March 31, 2016), $1.7 million for stock-based compensation, and $0.5 million in directors fees. Additionally, increases in conjunction with the build out of our operations amounted to $3.0 million for certain non-capitalizable costs incurred prior to vessel delivery including crew costs prior to initial voyage, $0.3 million in information technology and $1.3 million for other general and administrative expenses. During the year ended March 31, 2016, general and administrative expenses were comprised of $15.3 million of salaries and benefits (inclusive of the $3.0 million expense, approved by the board of directors in March 2016, for cash bonuses relating to the year ended March 31, 2016, and $2.1 million in cash bonuses, approved by the board of directors in May 2015, to various employees for services related to prior periods), $4.1 million of stock-based compensation, $3.4 million for certain non-capitalizable costs incurred prior to vessel delivery, $2.5 million for professional, legal, audit and accounting fees and $4.5 million of other general and administrative expenses. During the year ended March 31, 2015, general and administrative expenses were comprised of $6.4 million of salaries and benefits (inclusive of a $0.4 million accrual for statutory retirement benefits for our Greece-based employees), $2.4 million for professional, legal, audit and accounting fees, $2.3 million of stock-based compensation and $3.0 million of other general and administrative expenses.
62
Loss on disposal of assets
Loss on disposal of assets amounted to $1.1 million for the year ended March 31, 2016 and was primarily attributable to the sale of the Grendon. There was no loss on disposal of assets for the year ended March 31, 2015.
Other income —related parties
Other income —related parties amounted to $1.9 million for the year ended March 31, 2016, an increase of $1.8 million from $0.1 million for the year ended March 31, 2015. The increase was primarily attributable to $1.4 million of fees for commercial management services provided by Dorian LPG (UK) Ltd. to the Helios Pool as well an increase of $0.5 million for certain chartering and marine operation services provided by Dorian LPG (USA) LLC and its subsidiaries to DHSA.
Interest and Finance Costs
Interest and finance costs amounted to $12.8 million for the year ended March 31, 2016, an increase of $12.5 million from $0.3 million for the year ended March 31, 2015. The increase of $12.5 million during this period was mainly due to a $13.8 million increase in interest incurred on our long-term debt, amortization and other financing expenses from $3.8 million in the year ended March 31, 2015 to $17.6 million in the year ended March 31, 2016. These increases were partially offset by a $1.3 million increase in capitalized interest from $3.5 million in the year ended March 31, 2015 to $4.8 million in the year ended March 31, 2016. The average indebtedness during the year ended March 31, 2016 was $543.1 million compared to $125.9 million during the year ended March 31, 2015, reflecting debt drawdowns of $676.8 million made under our 2015 Debt Facility. The outstanding balance of our long term debt as of March 31, 2016 was $836.4 million.
Loss on Derivatives, net
Loss on derivatives, net was $15.8 million for the year ended March 31, 2016, an increase of $11.8 million, or 298.5%, compared to $4.0 million for the year ended March 31, 2015. The increase is primarily attributable to an increase in unrealized losses from the changes in the fair value of our interest rate swaps of $10.2 million during the year ended March 31, 2016 compared to the year ended March 31, 2015. Additionally, the increase is attributable to an increase of $1.6 million of realized loss due to an increase in the notional debt amounts during the year ended March 31, 2016 compared the year ended March 31, 2015. The net loss on derivatives for the year ended March 31, 2016 was comprised of an unrealized loss of $8.9 million from the changes in the fair value of the interest rate swaps due mainly to changes in yield curves along with a realized loss of $6.9 million due mainly to an increase in notional debt amounts due to four new interest rate swaps we entered into during the period. For the year ended March 31, 2015, the net loss on derivatives was primarily comprised of a realized loss of $5.3 million, partially offset by an unrealized gain of $1.3 million from the changes in the fair value of the interest rate swaps.
Foreign Currency Gain/(Loss), net
Foreign currency gain/(loss), net amounted to a net loss of approximately $0.3 million for the year ended March 31, 2016. This was a decrease in the loss of $0.7 million, or 65.7%, compared to a loss of $1.0 million for the year ended March 31, 2015. The decrease is primarily attributable to unrealized losses from cash held in Norwegian Krone during the year ended March 31, 2015 that did not recur during the year ended March 31, 2016.
For the year ended March 31, 2015 as compared to the period from July 1, 2013 (inception) to March 31, 2014
The Company remained substantially inactive for the period from July 1, 2013 until July 29, 2013, the date of our business combination with the Predecessor Businesses of Dorian LPG Ltd. Because we acquired three VLGC vessels during the year ended March 31, 2015 and the period from July 1, 2013 through March 31, 2014 included only eight months of active operations, we do not believe that the results of operations of the Company for the year ended March 31, 2015 and for the period July 1, 2013 through March 31, 2014 are directly comparable.
63
Revenues
The following table compares revenues for the year ended March 31, 2015 as compared to the period from July 1, 2013 (inception) to March 31, 2014:
|
|
|
|
|
|
Period July 1, 2013 |
|
|
|
|
|
||
|
|
|
|
|
|
(inception) to |
|
Increase / |
|
Percent |
|
||
|
|
|
2015 |
|
March 31, 2014 |
|
(Decrease) |
|
Change |
|
|||
|
Voyage charter revenues |
|
$ |
77,331,934 |
|
$ |
11,210,785 |
|
$ |
66,121,149 |
|
589.8 |
% |
|
Time charter revenues |
|
|
26,098,290 |
|
|
17,602,137 |
|
|
8,496,153 |
|
48.3 |
% |
|
Other revenues |
|
|
698,925 |
|
|
820,778 |
|
|
(121,853) |
|
(14.8) |
% |
|
Total |
|
$ |
104,129,149 |
|
$ |
29,633,700 |
|
$ |
74,495,449 |
|
251.4 |
% |
Revenues of $104.1 million for the year ended March 31, 2015 represent time charter and voyage charters earned for our six VLGC vessels and our PGC, an increase of $74.5 million, or 251.4%, from $29.6 million for the period from July 1, 2013 (inception) to March 31, 2014. The increase is primarily attributable to an increase of $42.6 million contributed by the four vessels that were in our fleet during both periods resulting from increases in charter rates and the number of these vessels operating in the spot market, as well as employment of 1,173 operating days during the year ended March 31, 2015 compared to 941 operating days during the period from July 1, 2013 (inception) to March 31, 2014. Additionally, $31.9 million of revenues were contributed by three of our ECO VLGCs that were delivered subsequent to March 31, 2014. For the year ended March 31, 2015, four of our VLGCs operated in the spot market and earned $76.1 million in voyage charter revenues. Three of our VLGCs earned time charter revenues during the period amounting to $25.5 million, including a VLGC that ended its time charter on July 27, 2014. Time charter revenues included $7.8 million of profit sharing. For the year ended March 31, 2015, the Grendon, whose time charter expired at the end of May 2014, earned $1.8 million of revenues, had 140 operating days and was in drydock for 10 days. Revenues of $29.6 million for the period July 1, 2013 to March 31, 2014 represent charter hire and voyage charters earned for our three VLGC vessels and our PGC. Revenues from time charter hire earned for our two VLGC vessels and the Grendon amounted to $17.8 million, of which $6.1 million represented profit sharing, and revenues from voyage charter for one VLGC vessel amounted to $11.8 million. The Captain Nicholas ML was in drydock for the period from August 28, 2013 to September 14, 2013 and did not earn revenue during this time.
Voyage Expenses
Voyage expenses were approximately $22.1 million during the year ended March 31, 2015, an increase of $15.4 million, or 231.0%, from $6.7 million for the period from July 1, 2013 (inception) to March 31, 2014. The increase is primarily attributable to an increase of $9.6 million for the four vessels that were in our fleet during both periods resulting from an increase in the number of these vessels operating in the spot market as well as employment of 1,173 operating days during the year ended March 31, 2015 compared to 941 operating days during the period from July 1, 2013 (inception) to March 31, 2014. Additionally, $5.7 million of voyage expenses were attributable to three of our ECO VLGCs that were delivered subsequent to March 31, 2014. Voyage expenses during the year ended March 31, 2015 mainly related to bunkers of $15.7 million, port charges and other related expenses of $3.6 million, brokers’ commissions of $1.7 million, security costs of $0.7 million and other voyage expenses of $0.4 million. Voyage expenses were approximately $6.7 million during the period July 1, 2013 to March 31, 2014 and mainly related to bunkers of $5.3 million, port charges of $0.6 million, brokers' commissions of $0.4 million, security costs of $0.3 million, and other voyage expenses of $0.1 million.
Vessel Operating Expenses
Vessel operating expenses were approximately $21.3 million during the year ended March 31, 2015, or $10,703 per vessel per calendar day, which is calculated by dividing vessel operating expenses by calendar days for the relevant time period. This was an increase of $12.9 million, or 153.2%, from $8.4 million, or $8,531 per vessel per calendar day, for the period from July 1, 2013 (inception) to March 31, 2014. The increase is primarily attributable to an increase of $6.7 million for the four vessels that were in our fleet during both periods resulting from 1,460 calendar days during the year ended March 31, 2015 compared to 984 calendar days during the period from July 1, 2013 (inception) to March 31, 2014. Additionally, $6.2 million of vessel operating expenses attributable to three of our ECO VLGCs that were delivered
64
subsequent to March 31, 2014. Vessel operating expenses for the year ended March 31, 2015 included approximately $2.9 million relating to training of additional crew on our operating VLGC fleet in anticipation of newbuilding deliveries. The Grendon, which ended its time charter at the end of May 2014, had 140 operating days and was in drydock for 10 days for the year ended March 31, 2015. The Grendon had $2.8 million of vessel operating expenses, inclusive of $0.5 million of expenses related to repairs and maintenance, for the year ended March 31, 2015.
Management Fees—Related Party
For the year ended March 31, 2015, management fees—related party decreased $2.0 million, or 64.0%, from the period from July 1, 2013 (inception) to March 31, 2014. Beginning July 1, 2014, we ceased to incur these related-party management fees as a result of the completion of the Transition Agreements described above in “Important Financial and Operational Terms and Concepts—Management Fees—Related Party.” Management fees expensed for the year ended March 31, 2015 represent fees charged by DHSA amounting to approximately $1.1 million in accordance with our management agreements entered into with DHSA. The management fees were charged on a monthly basis per vessel and the total fees were affected by the number of vessels in our fleet. Management fees expensed for the period July 1, 2013 to March 31, 2014 represent fees charged by DHSA amounting to approximately $3.0 million representing $93,750 per vessel per month and $0.1 million for Management fees relating to pre-delivery services, both in accordance with our management agreements entered into with DHSA. The management fees were charged on a monthly basis per vessel and the total fees were affected by the number of vessels in our fleet.
Impairment
In the year ended March 31, 2015, we recognized an impairment loss of $1.4 million for our owned PGC vessel. This impairment loss was triggered by reductions in vessel values reflecting challenging conditions in the PGC market, and represented the difference between the carrying value and recoverable amount, being fair value. We did not incur any impairment charges during the period from July 1, 2013 (inception) to March 31, 2014.
Depreciation and Amortization
Depreciation and amortization was approximately $14.1 million for the year ended March 31, 2015 and mainly relates to depreciation expense for our operating vessels, which represented an increase of $7.5 million, or 112.9%, from $6.6 million for the period from July 1, 2013 (inception) to March 31, 2014. The increase is primarily attributable to $4.1 million of depreciation and amortization related to three of our ECO VLGCs that were delivered subsequent to March 31, 2014. Additionally, there was an increase of $3.4 million for the four vessels that were in our fleet during both periods resulting from an increase in calendar days from 984 during the period from July 1, 2013 (inception) to March 31, 2014 to 1,460 during the year ended March 31, 2015. Depreciation and amortization was approximately $6.6 million for the period July 1, 2013 to March 31, 2014 and mainly relates to depreciation expense for our Initial Fleet from the date of acquisition, July 29, 2013.
General and Administrative Expenses
General and administrative expenses were approximately $14.1 million for the year ended March 31, 2015, an increase of $13.7 million, or 3,161.7%, from $0.4 million for the period from July 1, 2013 (inception) to March 31, 2014. This increase was primarily a result of a majority of general and administrative expenses being covered under our management agreement with DHSA during the period from July 1, 2013 (inception) to March 31, 2014. During the year ended March 31, 2015, general and administrative expenses were comprised of $6.4 million of salaries and benefits (inclusive of a $0.4 million accrual for statutory retirement benefits for our Greece-based employees), $2.4 million for professional, legal, audit and accounting fees, $2.3 million of stock-based compensation and $3.0 million of other general and administrative expenses. Prior to July 1, 2014, general and administrative expenses were primarily covered under our management agreement with DHSA, which terminated on June 30, 2014. Expenses not covered under the management agreement included, among others, stock-based compensation, audit and accounting fees, professional and legal fees and investor relations. As of July 1, 2014, vessel management services for our fleet was transferred from DHSA and are now provided through our wholly owned subsidiaries.
65
Interest and Finance Costs
Interest and finance costs amounted to approximately $0.3 million for the year ended March 31, 2015, a decrease of $1.3 million, or 81.7%, from $1.6 million for the period from July 1, 2013 (inception) to March 31, 2014. This decrease was primarily a result of a larger percentage of our interest costs being capitalized to our newbuilding vessels during the year ended March 31, 2015 compared to the period from July 1, 2013 (inception) to March 31, 2014. The interest and finance costs for the year ended March 31, 2015 consisted of interest incurred on our long-term debt of $2.7 million, amortization of financing costs of $0.8 million, and $0.3 million of other financing expenses, less capitalized interest of $3.5 million. The average indebtedness during the year ended March 31, 2015 was $125.9 million and the outstanding balance of our long‑term debt as of March 31, 2015 was $200.3 million, which included $81.2 million under the 2015 Debt Facility. Interest and finance costs amounted to approximately $1.6 million for the period July 1, 2013 to March 31, 2014. The interest and finance costs consisted of interest incurred on our long-term debt of $1.7 million, amortization of financing costs of $0.8 million and $0.1 million of other financing costs less capitalized interest of $1.0 million. The average indebtedness during the period from July 1, 2013 (inception) to March 31, 2014 was $132.6 million and the outstanding balance of our long‑term debt as of March 31, 2014, was $128.7 million.
Interest Income
Interest income amounted to approximately $0.4 million for the year ended March 31, 2015 derived from short term bank deposits. This amount was relatively unchanged from the period from July 1, 2013 (inception) to March 31, 2014.
Loss on Derivatives, net
Loss on derivatives, net, was $4.0 million for year ended March 31, 2015, an increase of $2.9 million, or 258.6%, from a net loss of approximately $1.1 million for the period from July 1, 2013 (inception) to March 31, 2014. The increase is primarily attributable to an increase of $1.6 million of realized loss due to a higher number of days in the year ended March 31, 2015 compared to the period from July 1, 2013 (inception) to March 31, 2014. Additionally, the unrealized gain from the changes in the fair value of our interest rate swaps decreased $1.3 million during the year ended March 31, 2015 compared to the period from July 1, 2013 (inception) to March 31, 2014. For the year ended March 31, 2015, the net loss on derivatives of approximately $4.0 million was primarily comprised of a realized loss of $5.3 million, partially offset by an unrealized gain of $1.3 million from the changes in the fair value of our interest rate swaps. For the period from July 1, 2013 (inception) to March 31, 2014, net loss on derivatives of approximately $1.1 million comprised of a realized loss of $3.7 million, partially offset by an unrealized gain of $2.6 million from the changes in the fair value of the interest rate swaps.
Foreign Currency Gain/(Loss), net
Foreign currency gain/(loss), net amounted to a net loss of approximately $1.0 million for the year ended March 31, 2015, and comprised mainly of unrealized losses from cash held in Norwegian Krone. This was a decrease of $1.7 million compared to the period from July 1, 2013 (inception) to March 31, 2014. Foreign currency gain/(loss), net amounted to a net gain approximately $0.7 million for the period July 1, 2013 to March 31, 2014, and were comprised mainly of realized gains of $1.9 million from payments in U.S. dollars received in advance of the closing of the November 26, 2013 equity private placement transactions priced in Norwegian Krone and converted to U.S. dollars, partially offset by realized losses of $1.2 million from payments in U.S. dollars received in advance of the closing of the February 12, 2014 equity private placement transactions priced in Norwegian Krone and converted to U.S. dollars.
Results of Operations—Predecessor Businesses of Dorian LPG Ltd.
Also included in this report are the combined results of operations of the Predecessor Businesses of Dorian LPG Ltd. that owned and operated three VLGCs and one PGC (Captain Nicholas ML, Captain John NP, Captain Markos NL and Grendon, respectively) prior to the sale of the vessels to us, for the periods from April 1, 2013 to July 28, 2013.
66
For the period from April 1, 2013 to July 28, 2013
Revenues
Revenues of $15.4 million for the period April 1, 2013 to July 28, 2013 represent charter hire and voyage charters earned for three VLGC vessels and one PGC vessel. Revenues from time charter hire earned for two VLGC vessels and one PGC vessel amounted to $9.2 million, of which $2.7 million represented profit sharing. Revenues from voyage charter for one VLGC vessel amounted to $6.2 million for the period April 1, 2013 to July 28, 2013.
Voyage Expenses
Voyage expenses were approximately $3.8 million for the period April 1, 2013 to July 28, 2013. Voyage expenses were comprised mainly of bunkers of $2.8 million, charter hire commissions of $0.4 million, port charges and other related expenses of $0.4 million and security costs of $0.2 million.
Vessel Operating Expenses
Vessel operating expenses were approximately $4.6 million for the period April 1, 2013 to July 28, 2013, or $9,745 per calendar day.
Management Fees—related party
Management fees charged by DHSA for the period April 1, 2013 to July 28, 2013 were approximately $0.6 million relating to fees of $40,000 per VLGC vessel per month and $32,000 for the PGC vessel per month.
Depreciation and Amortization
Depreciation and amortization for our fleet for the period April 1, 2013 to July 28, 2013 was $4.0 million, which were comprised of depreciation of $3.9 million and amortization of deferred charges from drydock and special survey costs of approximately $0.1 million.
Interest and Finance Costs
Interest and finance costs amounted to approximately $0.8 million for the period April 1, 2013 to July 28, 2013 primarily relating to the interest incurred on long-term debt.
Gain/(Loss) on Derivatives, net
Gain/(loss) on derivatives, net, amounted to a net gain of approximately $2.8 million for the period April 1, 2013 to July 28, 2013. The gain on derivatives comprised a gain from the changes in the fair value of the interest rate swaps of $4.7 million due to an increase in forward Libor curve rates, partially offset by a realized loss of $1.9 million for the period April 1, 2013 to July 28, 2013.
Liquidity and Capital Resources
Our business is capital intensive, and our future success depends on our ability to maintain a high‑quality fleet. As of March 31, 2016, we had cash and cash equivalents of $46.4 million and restricted cash of $50.8 million.
Our primary sources of capital during the year ended March 31, 2016 was $676.8 million of proceeds from the 2015 Debt Facility that we used to make the final payments for our sixteen ECO VLGCs delivered during the year ended March 31, 2016 and $151.0 million in cash generated from operations during the year ended March 31, 2016. As of March 31, 2016, we had total outstanding indebtedness of $836.4 million and within the next twelve months, $66.3 million of principal on our long-term debt is scheduled to be repaid.
67
Operating expenses, including to maintain the quality of our vessels, comply with international shipping standards and environmental laws and regulations and fund working capital requirements, long-term debt repayments, financing costs, including the repayment of principal and interest under our debt facilities, and repurchases of our own securities represent our short‑term, medium‑term and long‑term liquidity needs as of March 31, 2016. We anticipate satisfying these needs with cash on hand, cash from operations and/or debt financings.
Our dividend policy will also impact our future liquidity position. Marshall Islands law generally prohibits the payment of dividends other than from surplus or while a company is insolvent or would be rendered insolvent by the payment of such a dividend. In addition, under the terms of our credit facilities, we may only declare or pay any dividends from our free cash flow and may not do so if i) an event of default is occurring or ii) the payment of such dividend would result in an event of default. Our vessel owning subsidiaries who are party to the RBS Loan Facility, as described in Note 11 to our consolidated financial statements, are prohibited from paying dividends without the consent of the lender.
As part of our growth strategy, we will continue to consider strategic opportunities, including the acquisition of additional vessels and repurchases of our own securities. We may choose to pursue such opportunities through internal growth or joint ventures or business acquisitions. We expect to finance the purchase price of any additional future acquisitions and our operations either through internally generated funds, debt financings (public or private), the issuance of additional equity securities (public or private) or a combination of these forms of financing.
Cash Flows
The following table summarizes our cash and cash equivalents provided by (used in) operating, financing and investing activities for the periods presented:
|
|
|
|
|
|
|
Period July 1, 2013 |
|||
|
|
|
Year ended |
|
Year ended |
|
(inception) to |
|||
|
|
|
March 31, 2016 |
|
March 31, 2015 |
|
March 31, 2014 |
|||
|
Net cash provided by operating activities |
|
$ |
151,027,500 |
|
$ |
25,623,220 |
|
$ |
7,236,422 |
|
Net cash used in investing activities |
|
|
(910,414,841) |
|
|
(312,326,844) |
|
|
(221,434,724) |
|
Net cash provided by financing activities |
|
|
601,090,409 |
|
|
213,694,591 |
|
|
493,322,093 |
|
Net increase/(decrease) in cash and cash equivalents |
|
$ |
(158,409,221) |
|
$ |
(74,310,612) |
|
$ |
279,131,795 |
The following table summarizes our cash and cash equivalents provided by (used in) operating, financing and investing activities of our predecessor for the period presented:
|
|
|
Predecessor |
|
|
|
|
April 1, 2013 |
|
|
|
|
to July 28, |
|
|
|
|
2013 |
|
|
Net cash provided by operating activities |
|
$ |
4,670,470 |
|
Net cash used in investing activities |
|
|
(90,492) |
|
Net cash used in financing activities |
|
|
(5,606,000) |
|
Net decrease in cash and cash equivalents |
|
$ |
(1,026,022) |
Operating Cash Flows. Net cash provided by operating activities for the year ended March 31, 2016 amounted to $151.0 million compared with $25.6 million for the year ended March 31, 2015. The increase primarily reflects higher earnings and was driven by an increase in our number of vessels from seven as of March 31, 2015, to twenty-two as of March 31, 2016, as well as an increase in our time charter equivalent rate from $49,665 during the year ended March 31, 2015, to $55,087 during the year ended March 31, 2016.
Net cash provided by operating activities for the period July 1, 2013 to March 31, 2014 amounted to $7.2 million, primarily as a result of our operating profits, net of non-cash adjustments to net income, which were offset partially by payments for drydocking costs of $0.4 million.
68
Predecessor: Net cash provided by operating activities amounted to $4.7 million for the period April 1, 2013 to July 28, 2013 as a result of favorable movements in working capital.
Net cash flow from operating activities depends upon our overall profitability, market rates for vessels employed on voyage charters, charter rates agreed to for time charters, the timing and amount of payments for drydocking expenditures and unscheduled repairs and maintenance, fluctuations in working capital balances and bunker costs.
Investing Cash Flows. Net cash used in investing activities was $910.4 million for the year ended March 31, 2016, an increase of $598.1 million compared to the year ended March 31, 2015. For the year ended March 31, 2016, net cash used in investing activities comprised mainly of $895.1 million of scheduled payments to the shipyards, supervision costs, management fees, and other capitalized costs related to newbuildings, and $17.6 million of restricted cash deposits, partially offset by $2.7 million of proceeds from asset disposals. Net cash used in investing activities of $312.3 million for the year ended March 31, 2015, comprised mainly of $314.2 million of scheduled payments to the shipyards, supervision costs, management fees, and other capitalized costs related to newbuildings, partially offset by a $2.2 million decrease in restricted cash.
Net cash used in investing activities of $221.4 million for the period July 1, 2013 to March 31, 2014 comprised mainly of payments for vessels and vessels under construction of $172.2 million, a net increase in restricted cash of $35.4 million, which was comprised of an increase of $71.0 million from the original funding of the account from the a private placement in July 2013 offset by a decrease of $35.6 million due to an accelerated payment of $28.4 million to the shipyard in return for a reduction in the contract price of the vessel and the scheduled payment of $7.2 million, and net payments to acquire the Predecessor Businesses of $13.7 million.
Predecessor: Net cash used in investing activities was $0.1 million for the period from April 1, 2013 to July 28, 2013 as a result of payments for vessel improvements.
Financing Cash Flows. Net cash provided by financing activities was $601.1 million for the year ended March 31, 2016 an increase of $387.4 million compared to the year ended March 31, 2015. For the year ended March 31, 2016, net cash provided by financing activities consisted of $676.8 million of borrowings related to our 2015 Debt Facility partially offset by repayments of long term debt of $40.8 million, treasury stock repurchases of $20.9 million and debt financing costs of $14.0 million. Net cash provided by financing activities was $213.7 million for the year ended March 31, 2015 and consisted of cash proceeds from our initial public offering, the overallotment exercise by the underwriters of our initial public offering, and a private placement of our common stock, together totaling $155.8 million, and $80.1 million in cash proceeds from borrowings related to our 2015 Debt Facility offset partially by debt financing costs of $11.2 million, repayments of long term debt of $9.6 million and payment of equity issuance costs of $1.4 million.
Net cash provided by financing activities was $493.3 million for the period July 1, 2013 to March 31, 2014 and consisted of cash proceeds from three private placements of common shares totaling $510.5 million, offset partially by repayments of long term debt of $6.5 million, payment of financing costs of $1.5 million and payments relating to equity issuance costs of $9.2 million.
Predecessor: Net cash used in financing activities amounted to $5.6 million for the period April 1, 2013 to July 28, 2013 and reflects the scheduled repayments due under our long‑term debt.
Capital Expenditures. LPG transportation is a capital‑intensive business, requiring significant investment to maintain an efficient fleet and to stay in regulatory compliance.
We are required to complete a special survey for a vessel once every five years until 15 years of age and thereafter every 2.5 years and an intermediate survey every 2.5 years after the first special survey. Drydocking each vessel takes approximately 10‑20 days. We spend significant amounts for scheduled drydocking (including the cost of classification society surveys) for each of our vessels.
As our vessels age and our fleet expands, our drydocking expenses will increase. We estimate the current cost of a VLGC special survey to be approximately $1,000,000 and the cost of an intermediate survey to be approximately
69
$100,000. Ongoing costs for compliance with environmental regulations are primarily included as part of our drydocking and classification society survey costs. We are not aware of any future regulatory changes or environmental laws that we expect to have a material impact on our current or future results of operations that we have not already considered. Please see "Item 1A. Risk Factors—Risks Relating to Our Company—We may incur substantial costs for the drydocking, maintenance or replacement of our vessels as they age, and, as our vessels age, the risks associated with older vessels could adversely affect our ability to obtain profitable charters.”
Contractual Obligations
The following table summarizes our contractual obligations as of March 31, 2016:
|
|
|
|
|
|
Payments due by period |
|
||||||||||
|
|
|
|
|
|
Less than |
|
|
|
|
|
|
|
More than |
|
||
|
|
|
Total |
|
1 Year |
|
1 to 3 Years |
|
3 to 5 Years |
|
5 Years |
|
|||||
|
Long‑term debt obligations |
|
$ |
836,368,372 |
|
$ |
66,265,643 |
|
$ |
179,613,571 |
|
$ |
145,736,071 |
|
$ |
444,753,087 |
|
|
Interest payments(1) |
|
|
109,847,782 |
|
|
22,277,248 |
|
|
37,836,256 |
|
|
24,360,959 |
|
|
25,373,319 |
|
|
Remaining payments on office leases(2) |
|
|
876,200 |
|
|
382,194 |
|
|
462,543 |
|
|
31,463 |
|
|
— |
|
|
Total |
|
$ |
947,092,354 |
|
$ |
88,925,085 |
|
$ |
217,912,370 |
|
$ |
170,128,493 |
|
$ |
470,126,406 |
|
|
(1) |
Our interest commitment on our RBS Loan Facility is calculated based on an as assumed LIBOR rate of 0.90% (the six‑month LIBOR rate as of March 31, 2016), plus the applicable margin for the respective period as per the loan agreement and the estimated net settlement of the related interest rate swaps. Our interest commitment on our 2015 Debt Facility is calculated based on an assumed LIBOR rate of 0.63% (the three‑month LIBOR rate as of March 31, 2016), plus the applicable margin for the respective period as per the loan agreement and the estimated net settlement of the related interest rate swaps. |
|
(2) |
Our United Kingdom and Greece office lease payments were translated into U.S. Dollars using foreign currency equivalent rates of British Pound Sterling 1.44 and Euro 1.14, respectively, as of March 31, 2016. |
Off-Balance Sheet Arrangements
We currently do not have any off‑balance sheet arrangements.
Description of Our Debt Obligations
See Note 11 to our consolidated financial statements for a description of our debt obligations.
Compliance with New Accounting Standards
We have elected to “opt out” of the extended transition period relating to the exemption from new or revised financial accounting standards under the JOBS Act and, as a result, we will comply with new or revised financial accounting standards on the relevant dates on which adoption of such standards is required for non‑emerging growth companies. Section 107 of the JOBS Act provides that our decision to opt out of the extended transition period for complying with new or revised financial accounting standards is irrevocable.
Recent Accounting Pronouncements
Refer to Note 2 of our consolidated financial statements included elsewhere in this report.
ITEM 7A. QUANTITATIVE AND QUALITATIVE DISCLOSURES ABOUT MARKET RISK.
We are exposed to market risk from changes in interest rates and foreign currency fluctuations, as well as inflation. We use interest rate swaps to manage interest rate risks, but will not use these financial instruments for trading or speculative purposes.
70
Interest Rate Risk
The LPG shipping industry is capital intensive, requiring significant amounts of investment. Much of this investment is provided in the form of long term debt. Our debt agreements contain interest rates that fluctuate with LIBOR. We have entered into interest rate swap agreements to hedge a majority of our exposure to fluctuations of interest rate risk associated with our RBS Debt Facility. As of March 31, 2016 we hedged approximately 99% of our RBS Loan Facility to changes in interest rates and as a result we were not materially exposed to interest rate risk on the RBS Loan Facility. We have hedged $250 million of non-amortizing principal and $206.4 million of amortizing principal of the 2015 Debt Facility as of March 31, 2016 and thus increasing interest rates could adversely impact our future earnings. For the 12 months following March 31, 2016, a hypothetical increase or decrease of 20 basis points in the underlying LIBOR rates would result in an increase or decrease of our interest expense on our non-hedged interest bearing debt by approximately $0.5 million assuming all other variables are held constant. See Notes 11 and 20 to our audited consolidated financial statements included elsewhere in this report for a description of our debt obligations and interest rate swaps, respectively.
Foreign Currency Exchange Rate Risk
Our primary economic environment is the international LPG shipping market. This market utilizes the U.S. dollar as its functional currency. Consequently, our revenues are in U.S. dollars and the majority of our operating expenses are in U.S. dollars. However, we incur some of our expenses in other currencies, particularly the Euro, Norwegian Krone, British Pound Sterling, the Japanese Yen and the Singapore Dollar. The amount and frequency of some of these expenses, such as vessel repairs, supplies and stores, may fluctuate from period to period. Depreciation in the value of the U.S. dollar relative to other currencies will increase the cost of us paying such expenses. For the year ended March 31, 2016, 16% of our expenses, (excluding depreciation and amortization, interest and finance costs and gain/loss on derivatives), were in currencies other than the U.S. dollar, and as a result we expect the foreign exchange risk associated with these operating expenses to be immaterial. We do not have foreign exchange exposure in respect of our credit facility and interest rate swap agreements, as these are denominated in U.S. dollars.
The portion of our business conducted in other currencies could increase in the future, which could expand our exposure to losses arising from currency fluctuations.
Inflation
Certain of our operating expenses, including crewing, insurance and drydocking costs, are subject to fluctuations as a result of market forces. Crewing costs in particular have risen over the past number of years as a result of a shortage of trained crews. Please read "Item 1A. Risk Factors—We may be unable to attract and retain key management personnel and other employees in the shipping industry without incurring substantial expense as a result of rising crew costs, which may negatively affect the effectiveness of our management and our results of operations." A shortage of qualified officers makes it more difficult to crew our vessels and may increase our operating costs. If this shortage were to continue or worsen, it may impair our ability to operate and could have an adverse effect on our business, financial condition and operating results. Inflationary pressures on bunker (fuel and oil) costs could have a material effect on our future operations if the number of vessels employed on voyage charters increases. In the case of any vessels that are time‑chartered to third parties, it is the charterers who pay for the fuel. If our vessels are employed under voyage charters, freight rates are generally sensitive to the price of fuel. However, a sharp rise in bunker prices may have a temporary negative effect on our results since freight rates generally adjust only after prices settle at a higher level. Please read "Item 1A. Risk Factors—Changes in fuel, or bunker, prices may adversely affect profits.”
Forward Freight Agreements
From time to time, we may take hedging or speculative positions in derivative instruments, including FFAs. The usage of such derivatives can lead to fluctuations in the Company’s reported results from operations on a period-to-period basis. During the year ended March 31, 2016, we had no open FFA positions.
71
ITEM 8. FINANCIAL STATEMENTS AND SUPPLEMENTARY DATA.
The financial information required by this Item is set forth on pages F-1 to F-43 and is filed as part of this annual report.
ITEM 9. CHANGES IN AND DISAGREEMENTS WITH ACCOUNTANTS ON ACCOUNTING AND FINANCIAL DISCLOSURE.
None.
ITEM 9A. CONTROLS AND PROCEDURES.
Our management, with the participation of our Chief Executive Officer and our Chief Financial Officer, has evaluated the effectiveness of the design and operation of our disclosure controls and procedures pursuant to Rule 13a-15(e) and 15d-15(e) under the Exchange Act, as of the end of the period covered by this Annual Report on Form 10-K. Based on this evaluation, our management concluded that our disclosure controls and procedures were effective as of March 31, 2016. Our disclosure controls and procedures are designed to provide reasonable assurance that information required to be disclosed by the Company in the reports that it files or submits to the Commission under the Exchange Act is recorded, processed, summarized and reported within the time periods specified in Commission rules and forms and that such information is accumulated and communicated to our management, including our Chief Executive Officer and Chief Financial Officer, as appropriate, to allow timely decisions regarding required disclosure.
Management’s Report on Internal Control over Financial Reporting
Our management is responsible for establishing and maintaining an adequate system of internal control over financial reporting, as defined in the Rule 13a-15(f) of the Exchange Act. Our management conducted an evaluation of our the effectiveness of our internal control over financial reporting based on the framework in Internal Control—Integrated Framework (2013) issued by the Committee of Sponsoring Organizations of the Treadway Commission (“COSO”). Our internal control over financial reporting includes those policies and procedures that: (i) pertain to the maintenance of records that, in reasonable detail, accurately and fairly reflect the transactions and dispositions of our assets; (ii) provide reasonable assurance that transactions are recorded as necessary to permit preparation of our financial statements in accordance with US GAAP, and that our receipts and expenditures are being made in accordance with authorizations of our management and directors; and (iii) provide reasonable assurance regarding prevention or timely detection of unauthorized acquisition, use or disposition of our assets that could have a material effect on the financial statements. Because of the inherent limitations of internal controls over financial reporting, misstatements may not be prevented or detected on a timely basis. Also, projections of any evaluation of the effectiveness of the internal control over financial reporting to future periods are subject to the risk that the controls may become inadequate because of changes in conditions, or that the degree of compliance with the policies or procedures may deteriorate. Based on the evaluation, management concluded that our internal control over financial reporting is effective as of March 31, 2016.
In accordance with the Jumpstart Our Businesses Startups Act of 2012 as an emerging growth company, we are exempt from the requirement to obtain an attestation report from our independent registered public accounting firm on the assessment of our internal controls pursuant to the Sarbanes-Oxley Act of 2002.
Changes in Internal Control over Financial Reporting
Our management with the participation of our principal executive officer and principal financial officer or persons performing similar functions has determined that no change in our internal control over financial reporting (as that term is defined in Rules 13(a)-15(f) and 15(d)-15(f) of the Exchange Act) occurred during the fourth fiscal quarter of our fiscal year ended March 31, 2016 that has materially affected, or is reasonably likely to materially affect, our internal control over financial reporting.
72
Limitation on Effectiveness of Controls and Procedures
In designing and evaluating the disclosure controls and our internal control over financial reporting, management recognizes that any controls and procedures, no matter how well designed and operated, can provide only reasonable assurance of achieving the desired control objectives. In addition, the design of disclosure controls and our internal control over financial reporting must reflect the fact that there are resource constraints and that management is required to apply its judgment in evaluating the benefits of possible controls and procedures relative to their costs.
None
73
ITEM 10. DIRECTORS, EXECUTIVE OFFICERS AND CORPORATE GOVERNANCE.
The required information is incorporated by reference from our Proxy Statement to be filed with respect to our 2016 Annual Meeting of Stockholders within 120 days of March 31, 2016.
We intend to satisfy the disclosure requirements under Item 5.05 of Form 8-K regarding amendment to, or waiver from, a provision of the Code of Ethics for our principal executive officer, principal financial officer, principal accounting officer or controller or persons performing similar functions by posting such information on our website, http://dorianlpg.com/. Information on our website is not included in, and should not be deemed incorporated by reference into, this Annual Report.
ITEM 11. EXECUTIVE COMPENSATION.
The required information is incorporated by reference from our Proxy Statement to be filed with respect to our 2016 Annual Meeting of Stockholders within 120 days of March 31, 2016.
ITEM 12. SECURITY OWNERSHIP OF CERTAIN BENEFICIAL OWNERS AND MANAGEMENT AND RELATED STOCKHOLDER MATTERS.
The required information is incorporated by reference from our Proxy Statement to be filed with respect to our 2016 Annual Meeting of Stockholders within 120 days of March 31, 2016.
ITEM 13. CERTAIN RELATIONSHIPS AND RELATED TRANSACTIONS, AND DIRECTOR INDEPENDENCE.
The required information is incorporated by reference from our Proxy Statement to be filed with respect to our 2016 Annual Meeting of Stockholders within 120 days of March 31, 2016.
ITEM 14. PRINCIPAL ACCOUNTANT FEES AND SERVICES.
The required information is incorporated by reference from our Proxy Statement to be filed with respect to our 2016 Annual Meeting of Stockholders within 120 days of March 31, 2016.
74
ITEM 15. EXHIBITS, FINANCIAL STATEMENT SCHEDULES.
|
1. |
Financial Statements |
|
2. |
Financial Statement Schedules |
All schedules have been omitted because they are not applicable, not required or the information is included elsewhere in the Financial Statements or Notes thereto.
|
3. |
Exhibits |
See accompanying Exhibit Index included after the signature page of this Report for a list of exhibits filed or furnished with or incorporated by reference in this annual report.
75
SIGNATURES
Pursuant to the requirements of Section 13 or 15(d) of the Securities Exchange Act of 1934, the registrant has duly caused this report to be signed on its behalf by the undersigned, thereunto duly authorized.
Date: May 27, 2016
|
|
|
Dorian LPG Ltd. |
|
|
|
(Registrant) |
|
|
|
|
|
|
|
/s/ John Hadjipateras |
|
|
|
John Hadjipateras |
|
|
|
President and Chief Executive Officer |
Pursuant to the requirements of the Securities Exchange Act of 1934, this report has been signed below by the following persons on behalf of the registrant and in the capacities and on the dates indicated.
|
Signature |
|
Capacity |
|
|
|
|
|
/s/ John Hadjipateras |
|
President, Chief Executive Officer and Chairman of the Board |
|
John Hadjipateras |
|
(Principal Executive Officer) |
|
/s/ Theodore B. Young |
|
Chief Financial Officer |
|
Theodore B. Young |
|
(Principal Financial Officer and Principal Accounting Officer) |
|
/s/ John C. Lycouris |
|
Director |
|
John C. Lycouris |
|
|
|
/s/ Thomas J. Coleman |
|
Director |
|
Thomas J. Coleman |
|
|
|
/s/ Ted Kalborg |
|
Director |
|
Ted Kalborg |
|
|
|
/s/ Øivind Lorentzen |
|
Director |
|
Øivind Lorentzen |
|
|
|
|
|
|
|
/s/ Malcolm McAvity |
|
Director |
|
Malcolm McAvity |
|
|
|
|
|
|
|
/s/ Christina Tan |
|
Director |
|
Christina Tan |
|
|
76
EXHIBIT INDEX
|
Exhibit Number |
|
Description |
|
3.1 |
|
Articles of Incorporation, incorporated by reference to Exhibit 3.1 to the Company’s Registration Statement on Form F-1 (Registration Number 333-194434), filed with the Commission on March 7, 2014. |
|
3.2 |
|
Bylaws, incorporated by reference to Exhibit 3.2 to the Company's Registration Statement on Form F-1 (Registration Number 333- 194434), filed with the Commission on March 7, 2014. |
|
3.3 |
|
Amendment to Articles of Incorporation, incorporated by reference to Exhibit 3.3 to the Company's Registration Statement on Form F-1/A (Registration Number 333-194434), filed with the Commission on March 28, 2014. |
|
3.4 |
Certificate of Designations for Dorian LPG Ltd. Series A Junior Participating Preferred Stock, incorporated by reference to Exhibit 3.1 of the Company’s Form 8-K filed with the Commission on December 21, 2015. |
|
|
4.1 |
|
Form of Common Share Certificate, incorporated by reference to Exhibit 4.1 to the Company's Registration Statement on Form F-1 (Registration Number 333-194434), filed with the Commission on March 7, 2014. |
|
4.2 |
|
Rights Agreement, dated December 21, 2015, between Dorian LPG Ltd. and Computershare Inc., incorporated by reference to Exhibit 4.1 of the Company’s Form 8-K filed with the Commission on December 21, 2015. |
|
10.1 |
|
Equity Incentive Plan, incorporated by reference to Exhibit 10.1 to the Company's Registration Statement on Form F-1/A (Registration Number 333-194434), filed with the Commission on April 28, 2014. |
|
10.2 |
|
Shareholders Agreement between Dorian LPG Ltd., Scorpio Tankers Inc., SeaDor Holdings LLC and Dorian Holdings LLC, incorporated by reference to Exhibit 10.2 to the Company's Registration Statement on Form F-1/A (Registration Number 333-194434), filed with the Commission on March 31, 2014. |
|
10.3 |
|
$135.2 million Term Loan Facility, dated July 29, 2013, between CJNP LPG Transport LLC, CMNL LPG Transport LLC, CNML LPG Transport LLC, Corsair LPG Transport LLC, Dorian LPG Ltd. and The Royal Bank of Scotland plc, incorporated by reference to Exhibit 10.10 to the Company's Registration Statement on Form F-1/A (Registration Number 333-194434), filed with the Commission on March 31, 2014. |
|
10.4 |
|
Supplemental Letter to $135.2 million Term Loan Facility, dated October 18, 2013, incorporated by reference to Exhibit 10.19 to the Company's Registration Statement on Form F-1/A (Registration Number 333-194434), filed with the Commission on March 31, 2014. |
|
10.5 |
Registration Rights Agreement by and between Dorian LPG Ltd. and Kensico Capital Management Corporation. |
|
|
10.6 |
|
Form of Vessel Management Agreement with Dorian LPG Management Corp., incorporated by reference to Exhibit 4.21 to the Company’s Annual Report on Form 20-F filed with the Commission on July 30, 2014. |
|
10.7 |
|
Form of General Agency Agreement with Dorian LPG Management Corp., incorporated by reference to Exhibit 4.22 to the Company’s Annual Report on Form 20-F filed with the Commission on July 30, 2014. |
77
|
10.8 |
|
Newbuilding Service Agreement between Dorian LPG Ltd. and Dorian LPG (USA) LLC, incorporated by reference to Exhibit 4.23 to the Company’s Annual Report on Form 20-F filed with the Commission on July 30, 2014. |
|
10.9 |
|
Administrative, Advisory and Support Services Agreement between Dorian LPG Ltd. and Dorian LPG (USA) LLC, incorporated by reference to Exhibit 4.24 to the Company’s Annual Report on Form 20-F filed with the Commission on July 30, 2014. |
|
10.10 |
|
$758 million Facility Agreement, dated March 23, 2015, between Dorian LPG Finance LLC as Borrower and ABN Amro Capital USA LLC, Citibank N.A., London Branch, ING Bank N.V., London Branch, DBN Bank SE, as Bookrunners, incorporated by reference to Exhibit 10.25 to the Company’s Annual Report on Form 10-K filed with the Commission on June 3, 2015. |
|
10.11 |
|
2014 Executive Severance and Change in Control Severance Plan. |
|
21.1 |
|
List of Subsidiaries. |
|
23.1 |
|
Consent of Independent Registered Public Accounting Firm. |
|
23.2 |
|
Consent of Seward & Kissel LLP. |
|
31.1 |
|
Certification of Chief Executive Officer pursuant to Exchange Act Rules 13a-14(a) and 15d-14(a), as adopted pursuant to Section 302 of the Sarbanes-Oxley Act of 2002. |
|
31.2 |
|
Certification of Chief Financial Officer pursuant to Exchange Act Rules 13a-14(a) and 15d-14(a), as adopted pursuant to Section 302 of the Sarbanes-Oxley Act of 2002. |
|
32.1† |
|
Certifications of Chief Executive Officer pursuant to 18 U.S.C. Section 1350, as adopted pursuant to Section 906 of the Sarbanes-Oxley Act of 2002. |
|
32.2† |
|
Certifications of Chief Financial Officer pursuant to 18 U.S.C. Section 1350, as adopted pursuant to Section 906 of the Sarbanes-Oxley Act of 2002. |
|
101.INS |
|
XBRL Document. |
|
101.SCH |
|
XBRL Taxonomy Extension Schema. |
|
101.CAL |
|
XBRL Taxonomy Extension Schema Calculation Linkbase. |
|
101.DEF |
|
XBRL Taxonomy Extension Schema Definition Linkbase. |
|
101.LAB |
|
XBRL Taxonomy Extension Schema Label Linkbase. |
|
101.PRE |
|
XBRL Taxonomy Extension Schema Presentation Linkbase. |
†This certification is deemed not filed for purposes of Section 18 of the Exchange Act or otherwise subject to the liability of that section, nor shall it be deemed incorporated by reference into any filing under the Securities Act of 1933 or the Exchange Act.
78
INDEX TO THE FINANCIAL STATEMENTS
|
DORIAN LPG LTD. |
|
|
|
|
|
F-1 |
|
|
F-2 |
|
|
F-3 |
|
|
F-4 |
|
|
F-5 |
|
|
F-6 |
|
|
|
|
|
PREDECESSOR BUSINESSES OF DORIAN LPG LTD. |
|
|
|
|
|
F-32 |
|
|
Predecessor Combined Statements of Operations for the period April 1, 2013 to July 28, 2013 |
F-33 |
|
Predecessor Combined Statements of Owners' Equity for the period April 1, 2013 to July 28, 2013 |
F-34 |
|
Predecessor Combined Statements of Cash Flows for the period April 1, 2013 to July 28, 2013 |
F-35 |
|
F-36 |
|
REPORT OF INDEPENDENT REGISTERED PUBLIC ACCOUNTING FIRM
To the Board of Directors and Shareholders
of Dorian LPG Ltd.
Majuro, Republic of the Marshall Islands
We have audited the accompanying consolidated balance sheets of Dorian LPG Ltd. and subsidiaries (the "Company") as of March 31, 2016 and 2015, and the related consolidated statements of operations, shareholders' equity, and cash flows for each of the two years in the period ended March 31, 2016 and for the period July 1, 2013 (inception) to March 31, 2014. These financial statements are the responsibility of the Company's management. Our responsibility is to express an opinion on these financial statements based on our audits.
We conducted our audits in accordance with the standards of the Public Company Accounting Oversight Board (United States). Those standards require that we plan and perform the audit to obtain reasonable assurance about whether the financial statements are free of material misstatement. The Company is not required to have, nor were we engaged to perform, an audit of its internal control over financial reporting. Our audits included consideration of internal control over financial reporting as a basis for designing audit procedures that are appropriate in the circumstances, but not for the purpose of expressing an opinion on the effectiveness of the Company's internal control over financial reporting. Accordingly, we express no such opinion. An audit also includes examining, on a test basis, evidence supporting the amounts and disclosures in the financial statements, assessing the accounting principles used and significant estimates made by management, as well as evaluating the overall financial statement presentation. We believe that our audits provide a reasonable basis for our opinion.
In our opinion, such consolidated financial statements present fairly, in all material respects, the financial position of Dorian LPG Ltd. and subsidiaries as of March 31, 2016 and 2015, and the results of their operations and their cash flows for each of the two years in the period ended March 31, 2016 and for the period July 1, 2013 (inception) to March 31, 2014, in conformity with accounting principles generally accepted in the United States of America.
/s/ Deloitte Hadjipavlou, Sofianos & Cambanis S.A.
Athens, Greece
May 27, 2016
F-1
Dorian LPG Ltd.
(Expressed in United States Dollars)
|
|
|
As of |
|
As of |
|
||
|
|
|
March 31, 2016 |
|
March 31, 2015 |
|
||
|
Assets |
|
|
|
|
|
|
|
|
Current assets |
|
|
|
|
|
|
|
|
Cash and cash equivalents |
|
$ |
46,411,962 |
|
$ |
204,821,183 |
|
|
Trade receivables, net and accrued revenues |
|
|
107,317 |
|
|
22,847,224 |
|
|
Prepaid expenses and other receivables |
|
|
2,247,706 |
|
|
1,780,548 |
|
|
Due from related parties |
|
|
54,504,359 |
|
|
386,743 |
|
|
Inventories |
|
|
2,288,073 |
|
|
3,375,759 |
|
|
Total current assets |
|
|
105,559,417 |
|
|
233,211,457 |
|
|
Fixed assets |
|
|
|
|
|
|
|
|
Vessels, net |
|
|
1,667,224,476 |
|
|
419,976,053 |
|
|
Vessels under construction |
|
|
— |
|
|
398,175,504 |
|
|
Other fixed assets, net |
|
|
591,288 |
|
|
464,889 |
|
|
Total fixed assets |
|
|
1,667,815,764 |
|
|
818,616,446 |
|
|
Other non-current assets |
|
|
|
|
|
|
|
|
Deferred charges, net |
|
|
24,043,051 |
|
|
13,965,921 |
|
|
Due from related parties—non-current |
|
|
17,600,000 |
|
|
— |
|
|
Restricted cash |
|
|
50,812,789 |
|
|
33,210,000 |
|
|
Other non-current assets |
|
|
95,271 |
|
|
97,446 |
|
|
Total assets |
|
$ |
1,865,926,292 |
|
$ |
1,099,101,270 |
|
|
Liabilities and shareholders’ equity |
|
|
|
|
|
|
|
|
Current liabilities |
|
|
|
|
|
|
|
|
Trade accounts payable |
|
$ |
6,826,503 |
|
$ |
5,224,349 |
|
|
Accrued expenses |
|
|
9,721,477 |
|
|
5,647,702 |
|
|
Due to related parties |
|
|
708,210 |
|
|
525,170 |
|
|
Deferred income |
|
|
4,606,540 |
|
|
1,122,239 |
|
|
Current portion of long-term debt |
|
|
66,265,643 |
|
|
15,677,553 |
|
|
Total current liabilities |
|
|
88,128,373 |
|
|
28,197,013 |
|
|
Long-term liabilities |
|
|
|
|
|
|
|
|
Long-term debt—net of current portion |
|
|
770,102,729 |
|
|
184,665,874 |
|
|
Derivative instruments |
|
|
21,647,965 |
|
|
12,730,462 |
|
|
Other long-term liabilities |
|
|
447,988 |
|
|
293,662 |
|
|
Total long-term liabilities |
|
|
792,198,682 |
|
|
197,689,998 |
|
|
Total liabilities |
|
|
880,327,055 |
|
|
225,887,011 |
|
|
Commitments and contingencies |
|
|
|
|
|
|
|
|
Shareholders’ equity |
|
|
|
|
|
|
|
|
Preferred stock, $0.01 par value, 50,000,000 shares authorized, none issued nor outstanding |
|
|
— |
|
|
— |
|
|
Common stock, $0.01 par value, 450,000,000 shares authorized, 58,057,493 and 58,057,493 shares issued, 56,125,028 and 58,057,493 shares outstanding (net of treasury stock), as of March 31, 2016 and March 31, 2015, respectively |
|
|
580,575 |
|
|
580,575 |
|
|
Additional paid-in-capital |
|
|
848,179,471 |
|
|
844,539,059 |
|
|
Treasury stock, at cost; 1,932,465 and zero shares as of March 31, 2016 and March 31, 2015, respectively |
|
|
(20,943,816) |
|
|
— |
|
|
Retained earnings |
|
|
157,783,007 |
|
|
28,094,625 |
|
|
Total shareholders’ equity |
|
|
985,599,237 |
|
|
873,214,259 |
|
|
Total liabilities and shareholders’ equity |
|
$ |
1,865,926,292 |
|
$ |
1,099,101,270 |
|
The accompanying notes are an integral part of these consolidated financial statements.
F-2
Dorian LPG Ltd.
Consolidated Statements of Operations
(Expressed in United States Dollars, except for share data)
|
|
|
|
|
|
|
|
|
|
July 1, 2013 |
|
|
|
|
|
|
Year ended |
|
Year ended |
|
(inception) to |
|
|||
|
|
|
|
March 31, 2016 |
|
March 31, 2015 |
|
March 31, 2014 |
|
|||
|
Revenues |
|
|
|
|
|
|
|
|
|
|
|
|
Net pool revenues—related party |
|
|
$ |
202,918,232 |
|
$ |
— |
|
$ |
— |
|
|
Voyage charter revenues |
|
|
|
46,194,134 |
|
|
77,331,934 |
|
|
11,210,785 |
|
|
Time charter revenues |
|
|
|
38,737,172 |
|
|
26,098,290 |
|
|
17,602,137 |
|
|
Other revenues |
|
|
|
1,358,291 |
|
|
698,925 |
|
|
820,778 |
|
|
Total revenues |
|
|
|
289,207,829 |
|
|
104,129,149 |
|
|
29,633,700 |
|
|
Expenses |
|
|
|
|
|
|
|
|
|
|
|
|
Voyage expenses |
|
|
|
12,064,682 |
|
|
22,081,856 |
|
|
6,670,971 |
|
|
Vessel operating expenses |
|
|
|
47,119,990 |
|
|
21,256,165 |
|
|
8,394,959 |
|
|
Management fees—related party |
|
|
|
— |
|
|
1,125,000 |
|
|
3,122,356 |
|
|
Impairment |
|
|
|
— |
|
|
1,431,818 |
|
|
— |
|
|
Depreciation and amortization |
|
|
|
42,591,942 |
|
|
14,093,744 |
|
|
6,620,372 |
|
|
General and administrative expenses |
|
|
|
29,836,029 |
|
|
14,145,086 |
|
|
433,674 |
|
|
Loss on disposal of assets |
|
|
|
1,125,395 |
|
|
— |
|
|
— |
|
|
Total expenses |
|
|
|
132,738,038 |
|
|
74,133,669 |
|
|
25,242,332 |
|
|
Other income—related parties |
|
|
|
1,945,396 |
|
|
93,929 |
|
|
— |
|
|
Operating income |
|
|
|
158,415,187 |
|
|
30,089,409 |
|
|
4,391,368 |
|
|
Other income/(expenses) |
|
|
|
|
|
|
|
|
|
|
|
|
Interest and finance costs |
|
|
|
(12,757,013) |
|
|
(289,090) |
|
|
(1,579,206) |
|
|
Interest income |
|
|
|
148,360 |
|
|
418,597 |
|
|
428,201 |
|
|
Loss on derivatives, net |
|
|
|
(15,775,629) |
|
|
(3,959,203) |
|
|
(1,104,001) |
|
|
Foreign currency gain/(loss), net |
|
|
|
(342,523) |
|
|
(998,931) |
|
|
697,481 |
|
|
Total other income/(expenses), net |
|
|
|
(28,726,805) |
|
|
(4,828,627) |
|
|
(1,557,525) |
|
|
Net income |
|
|
$ |
129,688,382 |
|
$ |
25,260,782 |
|
$ |
2,833,843 |
|
|
Earnings per common share—basic |
|
|
$ |
2.29 |
|
$ |
0.45 |
|
$ |
0.09 |
|
|
Earnings per common share—diluted |
|
|
$ |
2.29 |
|
$ |
0.45 |
|
$ |
0.09 |
|
The accompanying notes are an integral part of these consolidated financial statements.
F-3
Dorian LPG Ltd.
Consolidated Statements of Shareholders’ Equity
(Expressed in United States Dollars, except for number of shares)
|
|
|
Number of |
|
|
|
|
|
|
Additional |
|
|
|
|
|
|
|
|
|
|||
|
|
|
common |
|
Common |
|
Treasury |
|
paid-in |
|
Retained |
|
Due from |
|
|
|
|
|||||
|
|
|
shares |
|
stock |
|
stock |
|
capital |
|
Earnings |
|
shareholder |
|
Total |
|
||||||
|
Issuance on inception—July 1, 2013 |
|
100 |
|
$ |
1 |
|
$ |
— |
|
$ |
99 |
|
$ |
— |
|
$ |
(100) |
|
$ |
— |
|
|
Cancellation—July 29, 2013 |
|
(100) |
|
|
(1) |
|
|
— |
|
|
(99) |
|
|
— |
|
|
100 |
|
|
— |
|
|
Issuance—July 29, 2013 |
|
18,644,324 |
|
|
186,443 |
|
|
— |
|
|
229,804,569 |
|
|
— |
|
|
— |
|
|
229,991,012 |
|
|
Issuance—November 26, 2013 |
|
24,071,506 |
|
|
240,715 |
|
|
— |
|
|
361,957,921 |
|
|
— |
|
|
— |
|
|
362,198,636 |
|
|
Issuance—February 12, 2014 |
|
5,649,200 |
|
|
56,492 |
|
|
— |
|
|
97,119,449 |
|
|
— |
|
|
— |
|
|
97,175,941 |
|
|
Fractional shares cancelled |
|
(19) |
|
|
— |
|
|
— |
|
|
— |
|
|
— |
|
|
— |
|
|
— |
|
|
Net income for the period |
|
— |
|
|
— |
|
|
— |
|
|
— |
|
|
2,833,843 |
|
|
— |
|
|
2,833,843 |
|
|
Balance, March 31, 2014 |
|
48,365,011 |
|
|
483,650 |
|
|
— |
|
|
688,881,939 |
|
|
2,833,843 |
|
|
|
|
|
692,199,432 |
|
|
Issuance—April 24, 2014 |
|
1,412,698 |
|
|
14,127 |
|
|
— |
|
|
25,849,437 |
|
|
— |
|
|
— |
|
|
25,863,564 |
|
|
Issuance—May 13, 2014 |
|
7,105,263 |
|
|
71,053 |
|
|
— |
|
|
123,169,507 |
|
|
— |
|
|
— |
|
|
123,240,560 |
|
|
Issuance—May 22, 2014 |
|
245,521 |
|
|
2,455 |
|
|
— |
|
|
4,335,901 |
|
|
— |
|
|
— |
|
|
4,338,356 |
|
|
Restricted share award issuances |
|
929,000 |
|
|
9,290 |
|
|
— |
|
|
(9,290) |
|
|
— |
|
|
— |
|
|
— |
|
|
Net income for the period |
|
— |
|
|
— |
|
|
— |
|
|
— |
|
|
25,260,782 |
|
|
— |
|
|
25,260,782 |
|
|
Stock-based compensation |
|
— |
|
|
— |
|
|
— |
|
|
2,311,565 |
|
|
— |
|
|
— |
|
|
2,311,565 |
|
|
Balance, March 31, 2015 |
|
58,057,493 |
|
|
580,575 |
|
|
— |
|
|
844,539,059 |
|
|
28,094,625 |
|
|
— |
|
|
873,214,259 |
|
|
Net income for the period |
|
— |
|
|
— |
|
|
— |
|
|
— |
|
|
129,688,382 |
|
|
— |
|
|
129,688,382 |
|
|
Stock-based compensation |
|
— |
|
|
— |
|
|
— |
|
|
3,640,412 |
|
|
— |
|
|
— |
|
|
3,640,412 |
|
|
Purchase of treasury stock |
|
— |
|
|
— |
|
|
(20,943,816) |
|
|
— |
|
|
— |
|
|
— |
|
|
(20,943,816) |
|
|
Balance, March 31, 2016 |
|
58,057,493 |
|
$ |
580,575 |
|
$ |
(20,943,816) |
|
$ |
848,179,471 |
|
$ |
157,783,007 |
|
$ |
— |
|
$ |
985,599,237 |
|
The accompanying notes are an integral part of these consolidated financial statements.
F-4
Dorian LPG Ltd.
Consolidated Statements of Cash Flows
(Expressed in United States Dollars)
|
|
|
|
|
|
|
|
|
July 1, 2013 |
|
||
|
|
|
|
Year ended |
|
Year ended |
|
(inception) to |
|
|||
|
|
|
|
March 31, 2016 |
|
March 31, 2015 |
|
March 31, 2014 |
|
|||
|
Cash flows from operating activities: |
|
|
|
|
|
|
|
|
|
|
|
|
Net income |
|
|
$ |
129,688,382 |
|
$ |
25,260,782 |
|
$ |
2,833,843 |
|
|
Adjustments to reconcile net income to net cash provided by operating activities: |
|
|
|
|
|
|
|
|
|
|
|
|
Impairment |
|
|
|
— |
|
|
1,431,818 |
|
|
— |
|
|
Depreciation and amortization |
|
|
|
42,591,942 |
|
|
14,093,744 |
|
|
6,620,372 |
|
|
Amortization of financing costs |
|
|
|
2,499,185 |
|
|
830,899 |
|
|
800,806 |
|
|
Unrealized loss/(gain) on derivatives |
|
|
|
8,917,503 |
|
|
(1,331,954) |
|
|
(2,623,456) |
|
|
Stock-based compensation expense |
|
|
|
4,052,249 |
|
|
2,311,565 |
|
|
— |
|
|
Loss on disposal of assets |
|
|
|
1,125,395 |
|
|
— |
|
|
— |
|
|
Unrealized exchange differences |
|
|
|
96,550 |
|
|
1,244,394 |
|
|
(8,004) |
|
|
Other non-cash items |
|
|
|
138,588 |
|
|
489,039 |
|
|
— |
|
|
Changes in operating assets and liabilities |
|
|
|
|
|
|
|
|
|
|
|
|
Trade receivables, net and accrued revenue |
|
|
|
22,739,907 |
|
|
(21,018,670) |
|
|
(1,966,746) |
|
|
Prepaid expenses and other receivables |
|
|
|
(467,158) |
|
|
(1,437,501) |
|
|
(343,047) |
|
|
Due from related parties |
|
|
|
(71,717,616) |
|
|
1,252,754 |
|
|
(1,639,497) |
|
|
Inventories |
|
|
|
1,087,686 |
|
|
(2,317,430) |
|
|
396,776 |
|
|
Other non-current assets |
|
|
|
2,175 |
|
|
(97,446) |
|
|
— |
|
|
Trade accounts payable |
|
|
|
1,044,595 |
|
|
2,731,828 |
|
|
1,799,616 |
|
|
Accrued expenses and other liabilities |
|
|
|
9,045,077 |
|
|
2,306,631 |
|
|
2,043,523 |
|
|
Due to related parties |
|
|
|
183,040 |
|
|
411,705 |
|
|
(292,687) |
|
|
Payments for drydocking costs |
|
|
|
— |
|
|
(538,938) |
|
|
(385,077) |
|
|
Net cash provided by operating activities |
|
|
|
151,027,500 |
|
|
25,623,220 |
|
|
7,236,422 |
|
|
Cash flows from investing activities: |
|
|
|
|
|
|
|
|
|
|
|
|
Payments for vessels and vessels under construction |
|
|
|
(895,063,383) |
|
|
(314,173,298) |
|
|
(172,237,529) |
|
|
Net payments to acquire predecessor businesses |
|
|
|
— |
|
|
— |
|
|
(13,732,896) |
|
|
Restricted cash deposits |
|
|
|
(17,602,789) |
|
|
(28,700,000) |
|
|
(35,448,702) |
|
|
Restricted cash released |
|
|
|
— |
|
|
30,938,702 |
|
|
— |
|
|
Proceeds from disposal of assets |
|
|
|
2,713,660 |
|
|
— |
|
|
— |
|
|
Payments to acquire other fixed assets |
|
|
|
(462,329) |
|
|
(392,248) |
|
|
(15,597) |
|
|
Net cash used in investing activities |
|
|
|
(910,414,841) |
|
|
(312,326,844) |
|
|
(221,434,724) |
|
|
Cash flows from financing activities: |
|
|
|
|
|
|
|
|
|
|
|
|
Proceeds from long-term debt borrowings |
|
|
|
676,819,873 |
|
|
80,086,143 |
|
|
— |
|
|
Repayment of long-term debt borrowings |
|
|
|
(40,794,928) |
|
|
(9,612,000) |
|
|
(6,506,000) |
|
|
Purchase of treasury stock |
|
|
|
(20,943,816) |
|
|
— |
|
|
— |
|
|
Financing costs paid |
|
|
|
(13,990,720) |
|
|
(11,220,812) |
|
|
(1,516,847) |
|
|
Cash proceeds from common share issuances |
|
|
|
— |
|
|
155,830,178 |
|
|
510,496,990 |
|
|
Payments relating to issuance costs |
|
|
|
— |
|
|
(1,388,918) |
|
|
(9,152,050) |
|
|
Net cash provided by financing activities |
|
|
|
601,090,409 |
|
|
213,694,591 |
|
|
493,322,093 |
|
|
Effects of exchange rates on cash and cash equivalents |
|
|
|
(112,289) |
|
|
(1,301,579) |
|
|
8,004 |
|
|
Net increase/(decrease) in cash and cash equivalents |
|
|
|
(158,409,221) |
|
|
(74,310,612) |
|
|
279,131,795 |
|
|
Cash and cash equivalents at the beginning of the period |
|
|
|
204,821,183 |
|
|
279,131,795 |
|
|
— |
|
|
Cash and cash equivalents at the end of the period |
|
|
$ |
46,411,962 |
|
$ |
204,821,183 |
|
$ |
279,131,795 |
|
|
Supplemental disclosure of cash flow information |
|
|
|
|
|
|
|
|
|
|
|
|
Cash paid during the period for interest excluding interest capitalized to vessels |
|
|
$ |
8,354,474 |
|
$ |
69,323 |
|
$ |
517,646 |
|
|
Predelivery costs for vessels and vessels under construction included in liabilities |
|
|
|
1,040,189 |
|
|
1,211,534 |
|
|
653,159 |
|
|
Non cash consideration of shares issued to acquire Predecessor businesses and acquisitions of assets |
|
|
|
— |
|
|
— |
|
|
187,495,680 |
|
|
Financing costs included in liabilities |
|
|
|
— |
|
|
1,039,479 |
|
|
— |
|
|
Issuance costs included in liabilities |
|
|
$ |
— |
|
$ |
244,414 |
|
$ |
549,966 |
|
The accompanying notes are an integral part of these consolidated financial statements.
F-5
Dorian LPG Ltd.
Notes to Consolidated Financial Statements
(Expressed in United States Dollars)
|
1. |
Basis of Presentation and General Information |
Dorian LPG Ltd. (“Dorian”) was incorporated on July 1, 2013, under the laws of the Republic of the Marshall Islands and is headquartered in the United States and is engaged in the transportation of liquefied petroleum gas (“LPG”) worldwide through the ownership and operation of LPG tankers. Dorian LPG Ltd. and its subsidiaries (together “we,” “us,” “our,” or the “Company”) is focused on owning and operating very large gas carriers (“VLGCs”), each with a cargo carrying capacity of greater than 80,000 cbm. Our fleet currently consists of twenty-two VLGCs, including nineteen fuel-efficient 84,000 cbm ECO-design VLGCs (“ECO VLGCs”) and three 82,000 cbm VLGCs.
The Company remained dormant until July 29, 2013 when the following transactions were completed concurrently:
|
· |
The Company completed a private placement of 9,310,054 shares of its common stock with institutional investors and other investors in Norway (“NPP”). The shares were issued at NOK 75.00 per share, equivalent to USD 12.66 per share and realized gross proceeds of $117.9 million based on the exchange rate on July 29, 2013. |
|
· |
The Company acquired from Dorian Holdings LLC (“Dorian Holdings”) the following in exchange for 4,667,135 shares of its common stock and $9.7 million in cash: |
|
(a) |
100% interest in three ship owning entities, CNML LPG Transport LLC (“CNML”), CJNP LPG Transport LLC (“CJNP”) and CMNL LPG Transport LLC (“CMNL”), which each owned a VLGC (the Captain Nicholas ML, the Captain John NP and the Captain Markos NL respectively), the related bank debt, interest rate swaps, and the inventory on board each vessel. The Captain Nicholas ML, Captain John NP and Captain Markos NL were previously owned by Cepheus Transport Ltd, Lyra Gas Transport Ltd and Cetus Transport Ltd., all owned by principals of Dorian Holdings until July 29, 2013 on which date they were sold to CNML, CJNP and CMNL, respectively. The sale of the vessels required approval from the bank that had provided the related financing that was assumed by the Company in connection with the transaction and resulted in a modification of the financing terms in connection with the acquisition. A further description of the loan arrangements is provided in Note 11. |
|
(b) |
100% interest in two entities, each a party to a contract for the construction of one VLGC, option rights to construct an additional 1.5 VLGCs and $2.67 million in cash. |
The Company acquired from an affiliate of Dorian Holdings a 100% interest in an LPG pressurized gas carrier (“PGC”), the LPG Grendon, and the inventory onboard the vessel for $6.672 million in cash.
The abovementioned acquisitions from Dorian Holdings and its affiliate were accounted as a business combination (refer to Note 4) and the operations of LPG Grendon along with that of the three VLGCs referred to above are herein referred to as the Predecessor.
|
· |
The Company issued 4,667,135 shares of its common stock to SEACOR Holdings Inc., through its subsidiary, SeaDor Holdings LLC (“SeaDor”) as consideration for the following: |
|
(a) |
100% interest in a subsidiary company, SEACOR LPGI LLC, a party to a contract for the construction of one VLGC; |
|
(b) |
$49.9 million in cash; and |
F-6
|
(c) |
the assignment to the Company of option rights to purchase 1.5 VLGC vessels. |
The above mentioned acquisitions from SeaDor were accounted for as an asset acquisition. The allocation of the purchase price between the assets acquired is described in Note 3(b).
At the closing of the NPP, Dorian Holdings (the “Original Shareholders”) surrendered the 100 shares of capital stock of the Company, which were then cancelled. Following the completion of the above transactions on July 29, 2013, Dorian Holdings, whose chairman is Mr. John Hadjipateras, our Chairman, President and Chief Executive Officer, and SeaDor, each owned approximately 25.0% of the Company’s outstanding common stock with the remaining 50% held by institutional investors and high net worth investors.
We successfully closed our initial public offering ("IPO") on May 13, 2014 and our shares are listed on the NYSE and trade under the symbol “LPG”.
The accompanying financial statements have been prepared in accordance with accounting principles generally accepted in the United States of America (“U.S. GAAP”) and include the accounts of Dorian LPG Ltd. and its subsidiaries.
On April 1, 2015, Dorian and Phoenix Tankers Pte. Ltd. (“Phoenix”) began operations of Helios LPG Pool LLC (the “Helios Pool”) and entered into pool participation agreements for the purpose of establishing and operating, as charterer, under a variable rate time charter to be entered into with owners or disponent owners of VLGCs, a commercial pool of VLGCs whereby revenues and expenses are shared. See Note 3 below for further description of the Helios Pool relationship.
Our subsidiaries, which are all wholly-owned and all are incorporated in Republic of the Marshall Islands (unless otherwise indicated below), as of March 31, 2016 are listed below.
Vessel Owning Subsidiaries
|
|
|
Type of |
|
|
|
|
|
|
|
|
Subsidiary |
|
vessel |
|
Vessel’s name |
|
Built |
|
CBM(1) |
|
|
CNML LPG Transport LLC |
|
VLGC |
|
Captain Nicholas ML |
|
2008 |
|
82,000 |
|
|
CJNP LPG Transport LLC |
|
VLGC |
|
Captain John NP |
|
2007 |
|
82,000 |
|
|
CMNL LPG Transport LLC |
|
VLGC |
|
Captain Markos NL |
|
2006 |
|
82,000 |
|
|
Comet LPG Transport LLC |
|
VLGC |
|
Comet |
|
2014 |
|
84,000 |
|
|
Corsair LPG Transport LLC |
|
VLGC |
|
Corsair |
|
2014 |
|
84,000 |
|
|
Corvette LPG Transport LLC |
|
VLGC |
|
Corvette |
|
2015 |
|
84,000 |
|
|
Dorian Shanghai LPG Transport LLC |
|
VLGC |
|
Cougar |
|
2015 |
|
84,000 |
|
|
Concorde LPG Transport LLC |
|
VLGC |
|
Concorde |
|
2015 |
|
84,000 |
|
|
Dorian Houston LPG Transport LLC |
|
VLGC |
|
Cobra |
|
2015 |
|
84,000 |
|
|
Dorian Sao Paulo LPG Transport LLC |
|
VLGC |
|
Continental |
|
2015 |
|
84,000 |
|
|
Dorian Ulsan LPG Transport LLC |
|
VLGC |
|
Constitution |
|
2015 |
|
84,000 |
|
|
Dorian Amsterdam LPG Transport LLC |
|
VLGC |
|
Commodore |
|
2015 |
|
84,000 |
|
|
Dorian Dubai LPG Transport LLC |
|
VLGC |
|
Cresques |
|
2015 |
|
84,000 |
|
|
Constellation LPG Transport LLC |
|
VLGC |
|
Constellation |
|
2015 |
|
84,000 |
|
|
Dorian Monaco LPG Transport LLC |
|
VLGC |
|
Cheyenne |
|
2015 |
|
84,000 |
|
|
Dorian Barcelona LPG Transport LLC |
|
VLGC |
|
Clermont |
|
2015 |
|
84,000 |
|
|
Dorian Geneva LPG Transport LLC |
|
VLGC |
|
Cratis |
|
2015 |
|
84,000 |
|
|
Dorian Cape Town LPG Transport LLC |
|
VLGC |
|
Chaparral |
|
2015 |
|
84,000 |
|
|
Dorian Tokyo LPG Transport LLC |
|
VLGC |
|
Copernicus |
|
2015 |
|
84,000 |
|
|
Commander LPG Transport LLC |
|
VLGC |
|
Commander |
|
2015 |
|
84,000 |
|
|
Dorian Explorer LPG Transport LLC |
|
VLGC |
|
Challenger |
|
2015 |
|
84,000 |
|
|
Dorian Exporter LPG Transport LLC |
|
VLGC |
|
Caravelle |
|
2016 |
|
84,000 |
|
F-7
Management Subsidiaries
|
|
|
|
Subsidiary |
|
|
Dorian LPG Management Corp |
|
|
Dorian LPG (USA) LLC (incorporated in USA) |
|
|
Dorian LPG (UK) Ltd. (incorporated in UK) |
|
|
Dorian LPG Finance LLC |
|
|
Occident River Trading Limited (incorporated in UK) |
|
Dormant Subsidiaries
|
|
|
|
Subsidiary |
|
|
SeaCor LPG I LLC |
|
|
SeaCor LPG II LLC |
|
|
Capricorn LPG Transport LLC |
|
|
Constitution LPG Transport LLC |
|
|
Grendon Tanker LLC(2) |
|
|
(1) |
CBM: Cubic meters, a standard measure for LPG tanker capacity |
|
(2) |
Owner of the Pressurized Gas Carrier (“PGC”) Grendon until it was sold in February 2016 |
Customers
For the year ended March 31, 2016, the Helios Pool and one other individual charterer accounted for 70% and 12% of our total revenues, respectively. For the year ended March 31, 2015, five charterers represented 27%, 19%, 14%, 12% and 11% of total revenues, respectively. For the period ended March 31, 2014, three charterers represented 51%, 13% and 10% of total revenues, respectively.
2. Significant Accounting Policies
(a)Principles of consolidation: The consolidated financial statements incorporate the financial statements of the Company and its wholly‑owned subsidiaries. Income and expenses of subsidiaries acquired or disposed of during the period are included in the consolidated statements of operations from the effective date of acquisition and up to the effective date of disposal, as appropriate. All intercompany balances and transactions have been eliminated.
(b)Use of estimates: The preparation of the financial statements in conformity with U.S. GAAP requires management to make estimates and assumptions that affect the reported amounts of assets and liabilities and disclosure of contingent assets and liabilities at the date of the financial statements and the reported amounts of revenues and expenses during the reporting period. Actual results could differ from those estimates.
(c)Other comprehensive income/(loss): The Company follows the accounting guidance relating to Comprehensive Income, which requires separate presentation of certain transactions that are recorded directly as components of stockholders’ equity. The Company has no other comprehensive income/(loss) and accordingly, comprehensive income/(loss) equals net income/(loss) for the periods presented and thus has not presented this in the statement of operations or in a separate statement.
(d)Foreign currency translation: The functional currency of the Company is the U.S. Dollar. Foreign currency transactions are measured and recorded in the functional currency using the exchange rate in effect at the date of the transaction. As of balance sheet date, monetary assets and liabilities that are denominated in a currency other than the functional currency are adjusted to reflect the exchange rate at the balance sheet date and any gains or losses are included in the statement of operations. For the periods presented, the Company had no foreign currency derivative instruments.
(e)Cash and cash equivalents: The Company considers highly liquid investments such as time deposits and certificates of deposit with an original maturity of three months or less to be cash equivalents.
F-8
(f)Trade receivables, net and accrued revenues: Trade receivables, net and accrued revenues, reflect receivables from vessel charters, net of an allowance for doubtful accounts. At each balance sheet date, all potentially uncollectible accounts are assessed individually for purposes of determining the appropriate provision for doubtful accounts. Provision for doubtful accounts for the periods presented was zero.
(g)Due from related parties: Due from related parties reflect receivables from Helios Pool, and other related parties. Distributions of earnings due from the Helios Pool are classified as current and working capital contributed to the Helios Pool is classified as non-current.
(h)Inventories: Inventories consist of bunkers on board the vessels when vessels are unemployed or are operating under voyage charters and lubricants and stores on board the vessels. Inventories are stated at the lower of cost or market. Cost is determined by the first in, first out method.
(i)Vessels, net: Vessels, net are stated at cost net of accumulated depreciation and impairment charges. The costs of the vessels acquired as part of a business acquisition are recorded at their fair value on the date of acquisition. The cost of vessels purchased consists of the contract price, less discounts, plus any direct expenses incurred upon acquisition, including improvements, commission paid, delivery expenses and other expenditures to prepare the vessel for her initial voyage. The initial purchase of LPG coolant for the refrigeration of cargo is also capitalized. Allocated interest costs incurred during construction are capitalized. Subsequent expenditures for conversions and major improvements are also capitalized when they appreciably extend the life, increase the earning capacity or improve the efficiency or safety of the vessels. Repairs and maintenance are expensed as incurred.
(j)Impairment of long‑lived assets: The Company reviews their vessels “held and used” for impairment whenever events or changes in circumstances indicate that the carrying amount of the assets may not be recoverable. When the estimate of future undiscounted cash flows, excluding interest charges, expected to be generated by the use of the asset is less than its carrying amount, the asset is evaluated for an impairment loss. Measurement of the impairment loss is based on the fair value of the asset.
(k)Vessel depreciation: Depreciation is computed using the straight‑line method over the estimated useful life of the vessels, after considering the estimated salvage value. Each vessel’s salvage value is equal to the product of its lightweight tonnage and estimated scrap rate. Management estimates the useful life of its vessels to be 25 years from the date of initial delivery from the shipyard. Second hand vessels are depreciated from the date of their acquisition through their remaining estimated useful life.
(l)Drydocking and special survey costs: Drydocking and special survey costs are accounted under the deferral method whereby the actual costs incurred are deferred and are amortized on a straight‑line basis over the period through the date the next survey is scheduled to become due. We are required to drydock each of our vessels every five years until it reaches 15 years of age, after which we are required to drydock the applicable vessel every 2.5 years. Costs deferred are limited to actual costs incurred at the yard and parts used in the drydocking or special survey. Costs deferred include expenditures incurred relating to shipyard costs, hull preparation and painting, inspection of hull structure and mechanical components, steelworks, machinery works, and electrical works. If a survey is performed prior to the scheduled date, the remaining unamortized balances are immediately written off. Unamortized balances of vessels that are sold are written‑off and included in the calculation of the resulting gain or loss in the period of the vessel’s sale. The amortization charge is presented within Depreciation and amortization in the consolidated statement of operations.
(m)Financing costs: Financing costs incurred for obtaining new loans and credit facilities are deferred and amortized to interest expense over the respective term of the loan or credit facility using the effective interest rate method. Any unamortized balance of costs relating to loans repaid or refinanced is expensed in the period the repayment or refinancing is made, subject to the accounting guidance regarding Debt—Modifications and Extinguishments. Any unamortized balance of costs related to credit facilities repaid is expensed in the period. Any unamortized balance of costs relating to credit facilities refinanced are deferred and amortized over the term of the respective credit facility in the period the refinancing occurs, subject to the provisions of the accounting
F-9
guidance relating to Debt—Modifications and Extinguishments. The unamortized financing costs are reflected in Deferred charges in the accompanying consolidated balance sheet.
(n)Restricted cash: Restricted cash represents minimum liquidity to be maintained with certain banks under our borrowing arrangements and a pledged cash deposit. The restricted cash is classified as non-current in the event that its obligation is not expected to be terminated within the next twelve months as they are long-term in nature.
(o)Revenues and expenses: Revenue is recognized when an agreement exists, the vessel is made available to the charterer or services are provided, the charter hire is determinable and collection of the related revenue is reasonably assured.
Net pool revenue: As from April 1, 2015, we began operation of a pool. Net pool revenues—related party for each vessel in the pool is determined in accordance with the profit sharing terms specified within the pool agreement. In particular, the pool manager calculates the net pool revenues using gross revenues less voyage expenses of all the pool vessels and less the general and administrative expenses of the pool and distributes the net pool revenues as time charter hire to participants based on:
|
· |
pool points (vessel attributes such as cargo carrying capacity, fuel consumption, and speed are taken into consideration); and |
|
· |
number of days the vessel participated in the pool in the period. |
We recognize net pool revenues—related party on a monthly basis, when the vessel has participated in the pool during the period and the amount of net pool revenues for the month can be estimated reliably.
Voyage charter revenue: Under a voyage charter, the revenues are recognized on a pro‑rata basis over the duration of the voyage determined on a discharge—to discharge port basis but the Company does not begin recognizing revenue until a charter has been agreed to by the customer and the Company, even if the vessel has discharged its cargo and is sailing to the anticipated load port for its next voyage. In the event a vessel is acquired or sold while a voyage is in progress, the revenue recognized is based on an allocation formula agreed between the buyer and the seller. Demurrage income represents payments by the charterer to the vessel owner when loading or discharging time exceeds the stipulated time in the voyage charter and is recognized when earned and collection is reasonably assured. Despatch expense represents payments by the Company to the charterer when loading or discharging time is less than the stipulated time in the voyage charter and is recognized as incurred. Voyage charter revenue relating to voyages in progress as of the balance sheet date are accrued and presented in Trade receivables and accrued revenue in the accompanying consolidated balance sheet.
Time charter revenue: Time charter revenues are recorded ratably over the term of the charter as service is provided. Time charter revenues received in advance of the provision of charter service are recorded as deferred income and recognized when the charter service is rendered. Deferred income or accrued revenue also may result from straight‑line revenue recognition in respect of charter agreements that provide for varying charter rates. Deferred income and accrued revenue amounts that will be recognized within the next twelve months are presented as current, with amounts to be recognized thereafter presented as non‑current. Revenues earned through the profit sharing arrangements in the time charters represent contingent rental revenues that are recognized when earned and amounts are reasonably assured based on estimates provided by the charterer.
Commissions: Charter hire commissions to brokers or managers, if any, are deferred and amortized over the related charter period and are included in Voyage expenses.
Vessel operating expenses: Vessel operating expenses are accounted for as incurred on the accrual basis. Vessel operating expenses include crew wages and related costs, the cost of insurance, expenses relating to repairs and maintenance, the cost of spares and consumable stores and other miscellaneous expenses.
F-10
(p)Repairs and maintenance: All repair and maintenance expenses, including underwater inspection costs are expensed in the period incurred. Such costs are included in Vessel operating expenses.
(q)Stock-based compensation: Stock-based payments to employees and directors are determined based on their grant date fair values and are amortized against income over the vesting period. The fair value is considered to be the closing price recorded on the grant date. We account for restricted stock award forfeitures upon occurrence.
(r)Stock repurchases: We record the repurchase of our shares of common stock at cost based on the settlement date of the transaction. These shares are classified as treasury stock, which is a reduction to stockholders’ equity. Treasury shares are included in authorized and issued shares but excluded from outstanding shares.
(s)Segment reporting: Each of the Company’s vessels serve the same type of customer, have similar operations and maintenance requirements, operate in the same regulatory environment, and are subject to similar economic characteristics. Based on this, the Company has determined that it operates in one reportable segment, the international transportation of liquid petroleum gas with its fleet of vessels. Furthermore, when the Company charters a vessel to a charterer, the charterer is free to trade the vessel worldwide and, as a result, the disclosure of geographic information is impracticable.
(t)Derivative instruments: All derivatives are stated at their fair value, as either a derivative asset or a liability. The fair value of the interest rate derivatives is based on a discounted cash flow analysis and their fair value changes are recognized in current period earnings. When the derivatives do qualify for hedge accounting, depending upon the nature of the hedge, changes in fair value of the derivatives are either recognized in current period earnings or in other comprehensive income/(loss) (effective portion) until the hedged item is recognized in the consolidated statements of operations. For the periods presented, no derivatives were accounted for as accounting hedges.
(u)Fair value of financial instruments: In accordance with the requirements of accounting guidance relating to Fair Value Measurements, the Company classifies and discloses its assets and liabilities carried at fair value in one of the following three categories:
|
Level 1: |
Quoted market prices in active markets for identical assets or liabilities. |
|
Level 2: |
Observable market based inputs or unobservable inputs that are corroborated by market data. |
|
Level 3: |
Unobservable inputs that are not corroborated by market data. |
(v)Recent accounting pronouncements: In May 2014, the Financial Accounting Standards Board (“FASB”) amended its accounting guidance for revenue recognition. The fundamental principles of the new guidance are that companies should recognize revenue in a manner that reflects the timing of the transfer of services to customers and consideration that a company expects to receive for the services provided. It also requires additional disclosures necessary for the financial statement users to understand the nature, amount, timing and uncertainty of revenue and cash flows arising from contracts with customers. The standard is effective for annual periods beginning after December 15, 2017, and interim periods therein, and shall be applied either retrospectively to each period presented or as a cumulative effect adjustment as of the date of adoption, early adoption is permitted, but not before the beginning of 2017. We are currently assessing the impact the amended guidance will have on our financial statements.
In February 2015, the FASB issued accounting guidance amending consolidation analysis which focuses on the consolidation evaluation for reporting organizations that are required to evaluate whether they should consolidate certain legal entities. This new standard simplifies consolidation accounting by reducing the number of consolidation models and providing incremental benefits to stakeholders. In addition, the new standard places more emphasis on risk of loss when determining a controlling financial interest, reduces the frequency of the application of related-party guidance when determining a controlling financial interest in a variable interest entity (a “VIE”), and changes consolidation conclusion for public and private companies in several industries that typically make use of limited partnerships or VIEs. The pronouncement is effective prospectively for annual
F-11
periods beginning after December 15, 2015, and interim periods within that reporting period. The amended guidance will have no impact on our financial statements.
In April 2015, an accounting pronouncement was issued by the FASB to update the guidance related to the presentation of debt issuance costs. This guidance requires debt issuance costs, related to a recognized debt liability, be presented in the balance sheet as a direct deduction from the carrying amount of the related debt liability rather than being presented as an asset. This pronouncement is effective retrospectively for fiscal years beginning after December 15, 2015 and interim periods within that reporting period, with early adoption permitted. We will adopt this pronouncement on April 1, 2016 and the amount of debt issuance costs that would be classified on our balance sheet as a reduction of debt was $23.7 million as of March 31, 2016 and $13.3 million as of March 31, 2015.
In July 2015, the FASB issued accounting guidance requiring entities to measure most inventory at the lower of cost and net realizable value. The pronouncement is effective prospectively for annual periods beginning after December 15, 2016, and interim periods within that reporting period. We are currently assessing the impact the amended guidance will have on our financial statements.
In February 2016, the FASB issued accounting guidance to update the requirements of financial accounting and reporting for lessees and lessors. The updated guidance, for lease terms of more than 12 months, will require a dual approach for lessee accounting under which a lessee would account for leases as finance leases or operating leases. Both finance leases and operating leases will result in the lessee recognizing a right-of-use asset and a corresponding lease liability. For finance leases, the lessee would recognize interest expense and amortization of the right-of-use asset, and for operating leases, the lessee would recognize a straight-line total lease expense. Lessor accounting remains largely unchanged. The new standard requires a modified retrospective transition approach for all leases existing at, or entered into after, the date of initial application, with an option to use certain transition relief. The pronouncement is effective prospectively for public business entities for annual periods beginning after December 15, 2018, and interim periods within that reporting period. Early adoption is permitted for all entities. We are currently assessing the impact the amended guidance will have on our financial statements.
In March 2016, the FASB issued accounting guidance to simplify the requirements of accounting for share-based payment transactions. The guidance simplifies the accounting for taxes related to stock-based compensation, including adjustments to how excess tax benefits and an entity’s payments for tax withholdings should be classified. Additionally, an entity may make an entity-wide policy election to either estimate the number of awards that are expected to vest or account for forfeitures when they occur. The pronouncement is effective for annual periods beginning after December 15, 2016, and interim periods within that reporting period with early adoption permitted in any interim or annual period. We have early adopted this pronouncement for the year ended March 31, 2016 and have made the entity-wide policy election to account for forfeitures when they occur, which resulted in us recognizing an additional $0.1 million of stock-based compensation for the year ended March 31, 2016.
3. Transactions with Related Parties
|
(a) |
Dorian Holdings: Dorian was formed by Dorian Holdings on July 1, 2013, to acquire and operate LPG tankers and initially to acquire the LPG tankers held by affiliates of Dorian Holdings. These acquisitions were accounted for as the acquisition of a business, refer Notes to 1 and 4. In addition on July 29, 2013, we entered into a license agreement with Dorian Holdings pursuant to which Dorian Holdings has granted us a non‑transferable, non‑exclusive, perpetual (subject to termination for material breach or a change of control event), world‑wide, royalty‑free right and license to use the Dorian logo and “Dorian LPG” in connection with our LPG business. |
|
(b) |
SEACOR Holdings Inc. (“SEACOR”): On April 29, 2013, affiliates of the Company entered into a series of agreements with subsidiaries of SEACOR under which the affiliates of the Company granted certain rights to SEACOR to purchase newbuilding contracts for VLGCs and associated options. The affiliates of the Company had the right to repurchase a portion of those contracts and the associated options. As part of these agreements, subsidiaries of SEACOR paid the first installment under the newbuilding contracts to the shipyard, which, under |
F-12
the terms of the agreements, could be partially acquired by Dorian affiliates for the amount of the installments paid, certain agreed third party expenses, and a capital charge of 6% per annum. |
As described in Note 1, the Company acquired a 100% interest in SEACOR LPG I LLC, a party to a contract for the construction of one VLGC, $49.9 million in cash and the assignment to the Company of option rights to purchase 1.5 VLGC vessels, from SEACOR in exchange for 4,667,135 shares of its common stock. This transaction was accounted for as an asset acquisition.
The fair value of the transaction was determined based on the number of shares issued by the Company. The fair value of the common stock was determined to be NOK75.00 per share (or $12.66 per share at the exchange rate on July 29, 2013) which was the price per share for the Company’s common shares issued to private investors on the same date.
The total transaction value of $59.4 million (including transaction costs) was allocated to the assets purchased as follows:
|
Cash |
$ |
49,854,870 |
|
|
Purchase contract for one VLGC newbuilding contract (includes advance payment) |
|
7,009,675 |
|
|
Purchase option contracts |
|
2,529,126 |
|
|
|
$ |
59,393,671 |
|
The allocation between the newbuilding contract and the purchase options was based on their relative fair value. The fair value of the newbuilding contract and purchase options was computed as the excess of the purchase consideration for similar vessels with similar delivery dates based on valuation from an independent broker over the purchase consideration of the contracts acquired plus for newbuilding contracts any advance to the shipyard as of the acquisition date. The appraised value was determined using recent transactions involving comparable vessels as adjusted for age and features. The appraisal was performed on “willing Seller and willing Buyer” basis and based on the sale and purchase market condition prevailing at the acquisition date subject to the vessel being in sound condition and made available for delivery charter free.
|
(c) |
Scorpio Tankers Inc. (“Scorpio”): On November 26, 2013, the Company issued 7,990,425 shares of its common stock to Scorpio as consideration for 100% interest in thirteen subsidiary companies, (each a party to a contract for the construction of one VLGC) and $1.9 million in cash. This transaction was accounted for as an asset acquisition. |
The fair value of the transaction was determined based on the number of shares issued by the Company. The fair value of the common stock was determined to be NOK92.50 per share (or $15.16 per share at the exchange rate on November 26, 2013), which was the price per share for the Company’s common shares issued to private investors on the same date.
The total transaction value of $121.3 million (including transaction costs) was allocated to the assets purchased as follows:
|
Cash |
$ |
1,930,000 |
|
|
Purchase contract for thirteen VLGC newbuilding contracts (includes advance payments) |
|
119,386,040 |
|
|
|
$ |
121,316,040 |
|
The cost of the group of non‑cash assets was allocated to each of the new building contracts based on their relative fair value. The fair value of each newbuilding contract was determined as the excess of the purchase consideration as of the acquisition date for similar vessels with similar delivery dates based on valuation from an independent broker over the purchase consideration of the contracts acquired plus any advance paid to the shipyard. The appraised value was determined using recent transactions involving comparable vessels as adjusted for age and features. The appraisal was performed on “willing Seller and willing Buyer” basis and based on the sale and
F-13
purchase market condition prevailing at the acquisition date subject to the vessel being in sound condition and made available for delivery charter free.
|
(d) |
Dorian (Hellas) S.A.: |
|
A. Ship‑Owning Companies Management Agreements: Pursuant to management agreements entered into by each vessel owning subsidiary on July 26, 2013, as amended, with Dorian (Hellas) S.A. (“DHSA” or the “Manager”), the technical, crew and commercial management as well as insurance and accounting services of its vessels was outsourced to DHSA. In addition, under these management agreements, strategic and financial services had also been outsourced to DHSA. DHSA had entered into agreements with each of Eagle Ocean Transport Inc. (“Eagle Ocean Transport”) and Highbury Shipping Services Limited (“HSSL”), to provide certain of these services on behalf of the vessel owning companies. Mr. John Hadjipateras, our Chairman, President and CEO, owns 100% of Eagle Ocean Transport, and our Vice President of Chartering, Insurance and Legal, Nigel Grey‑Turner, owns 100% of HSSL. The fees payable for the above services to DHSA amounted to $93,750 per month per vessel, payable one month in advance. These management agreements terminated on June 30, 2014. As of July 1, 2014, vessel management services and the associated agreements for our fleet were transferred from DHSA and are now provided through our wholly owned subsidiaries Dorian LPG (USA) LLC, Dorian LPG (UK) Ltd. and Dorian LPG Management Corp. Subsequent to the transition agreements, Eagle Ocean Transport continues to incur related travel costs for certain transitioned employees as well as office-related costs, for which we reimbursed Eagle Ocean Transport $0.8 million and $0.7 million for the years ended March 31, 2016 and 2015, respectively. Such expenses are reimbursed based on their actual cost. |
Management fees related to these agreements for the year ended March 31, 2015 and for the period July 1, 2013 to March 31, 2014 amounted to $1.1 million and $3.1 million, respectively, and are presented in Management fees‑ related party in the consolidated statements of operations. There were no management fees incurred for the year ended March 31, 2016.
Dorian LPG (USA) LLC and its subsidiaries entered into an agreement with DHSA, retroactive to July 2014 and superseding an agreement between Dorian LPG (UK) Ltd. and DHSA, for the provision by Dorian LPG (USA) LLC and its subsidiaries of certain chartering and marine operation services to DHSA, for which income totaling $0.5 million and $0.1 million was earned and included in other income for the years ended March 31, 2016 and 2015, respectively.
As of March 31, 2016, $0.9 million was due from DHSA and included in due from related parties and $0.5 million was due to DHSA and included in due to related parties.
|
B. Pre‑Delivery Services: A fixed monthly fee of $15,000 per hull was payable to the Manager for pre‑delivery services provided during the period from July 29, 2013 until the date of delivery of each newbuilding. These management agreements terminated on June 30, 2014. As of July 1, 2014, vessel management services and the associated agreements for our fleet were transferred from the Manager and are now provided through our wholly owned subsidiaries. Management fees related to the pre‑delivery services provided by DHSA for the year ended March 31, 2015 and for the period July 1, 2013 to March 31, 2014 amounted to $0.9 million and $1.2 million, respectively. For the period July 1, 2013 to March 31, 2014, $0.1 million is presented in Management fees‑related party in the consolidated statement of operations. |
|
(e) |
Eagle Ocean Transport Inc.: As part of the series of agreements with SEACOR, Eagle Ocean Transport, a company 100% owned by Mr. John Hadjipateras, our Chairman, President and Chief Executive Officer, is entitled to retain 100% of any portion of the shipbroker fee rebated to it as compensation for its services in securing the newbuilding contracts for three VLGCs and three associated option agreements. To the extent that any fees are received in respect of option vessels under such agreements, the fees shall be shared evenly between SEACOR and Eagle Ocean Transport. Collectively, Eagle Ocean Transport and SEACOR received a total of $0.8 million and $0.5 million of shipbroker rebates for their services in securing the newbuilding contracts for the year ended March 31, 2015 and period ended March 31, 2014, respectively. In addition, Eagle Ocean Transport was |
F-14
reimbursed for an amount of $0.3 million, representing costs incurred on behalf of the Company relating to equity issuances and debt restructuring for the period July 1, 2013 to March 31, 2014. |
|
(f) |
Helios LPG Pool LLC (“Helios Pool”): On April 1, 2015, Dorian and Phoenix began operations of the Helios Pool and entered into pool participation agreements for the purpose of establishing and operating, as charterer, under a variable rate time charter to be entered into with owners or disponent owners of VLGCs, a commercial pool of VLGCs whereby revenues and expenses are shared as described in Note 2 above. We hold a 50% interest in the Helios Pool as a joint venture with Phoenix and all significant rights and obligations are equally shared by both parties. All profits of the Helios Pool are distributed to the pool participants based on pool points assigned to each vessel as variable charter hire (refer to Note 2 above) and, as a result, there are no profits available to the equity investors as a share of equity. We have determined that the Helios Pool is a VIE as it does not have sufficient equity at risk. We do not consolidate the Helios Pool because we are not the primary beneficiary and do not have a controlling financial interest. In consideration of ASC 810-10-50-4e, the significant factors considered and judgments made in determining that the power to direct the activities of the Helios Pool that most significantly impact the entity’s economic performance are shared, in that all significant performance activities which relate to approval of pool policies and strategies related to pool customers and the marketing of the pool for the procurement of customers for the pool vessels, addition of new pool vessels and the pool cost management, require unanimous board consent from a board consisting of two members from each joint venture investor. Further, in accordance with the guidance in ASC 810-10-25-38D, the Company and Phoenix are not related parties as defined in ASC 850 nor are they de facto agents pursuant to ASC 810-10, the power over the significant activities of the Helios Pool is shared, and no party is the primary beneficiary in the Helios Pool, or has a controlling financial interest. In March 2016, the Helios Pool reached an agreement with Oriental Energy Company Ltd. ("Oriental Energy"). When fully delivered, the Helios Pool will operate eight VLGCs for Oriental Energy, some of which will be time chartered-in at a fixed time charter hire rate. The agreement with Oriental Energy had no impact on the ownership structure or the power to direct significant activities of the Helios Pool. |
As of March 31, 2016, we had receivables from the Helios Pool of $71.0 million, including $17.6 million of working capital contributed for the operation of our vessels in the pool. Our maximum exposure to losses from the pool as of March 31, 2016 is limited to the receivables from the pool. The Helios Pool does not have any third-party debt obligations. The Helios Pool has entered into commercial management agreements with each of Dorian LPG (UK) Ltd. and Phoenix as commercial managers and has appointed both commercial managers as the exclusive commercial managers of pool vessels. Fees for commercial management services provided by Dorian LPG (UK) Ltd. are included in “Other income-related parties” in the consolidated statement of operations and were $1.4 million for the year ended March 31, 2016. Additionally, we received a fixed reimbursement of expenses such as costs for security guards and war risk insurance for voyages operating high risk areas from the Helios Pool, for which we earned $1.2 million for the year ended March 31, 2016 and are included in “Other revenues” in the consolidated statement of operations.
Through our vessel owning subsidiaries, we have chartered vessels to the Helios Pool during the year ended March 31, 2016. The time charter revenue from the Helios Pool is variable depending upon the net results of the pool, operating days and pool points for each vessel. The Helios Pool enters into voyage and time charters with external parties and receives freight and related revenue and incurs voyage costs such as bunkers, port costs and commissions. At the end of each month, the pool aggregates the revenue and expenses for all the vessels in the pool and distributes net pool revenues to the participants based on the results of the pool, operating days and pool points, as variable rate time charter hire for the relevant vessel. We recognize net pool revenues on a monthly basis, when the vessel has participated in the pool during the period and the amount of pool revenues for the month can be estimated reliably. Revenue earned is presented in Note 14.
|
(g) |
Consulting: Since the formation of the Predecessor Companies, a member of our board of directors, who resigned effective May 1, 2015, provided certain chartering and commercial services to the Company, its subsidiaries, and the Predecessor Companies. This individual entered into a consulting agreement on May 1, 2015 that provides for, among other things, an annual fee of $250,000, payable for services rendered commencing on May 8, 2014. Related to this consulting agreement we expensed $0.2 million and $0.2 million, for the years ended March 31, 2016 and 2015, respectively. |
F-15
|
(h) |
Artwork: During the year ended March 31, 2016, we purchased $0.1 million of artwork for newbuilding vessels, which have been capitalized and presented in “Vessels, net” for vessels that have been delivered during the period, for our Athens, Greece office and for a shipyard, which are included in “General and administrative expenses” in the consolidated statement of operations. The artist is a relative of one of our executive officers. |
|
(i) |
Commissions: Orient River Trading Ltd., a company 100% owned by a senior officer of our 100% owned subsidiary Dorian Management Corp., provided disponent owner services for certain charterers that do not recognize Marshall Islands vessel-owning subsidary companies. Commission expenses on voyages utilizing these services, included in “Voyage expenses” in the consolidated statement of operations, amounted to $0.1 million and $0.1 million for the years ended March 31, 2016 and 2015, respectively. There were no commissions for these services for the period ended March 31, 2014. |
4. Acquisition of Business
On July 29, 2013, Dorian Holdings sold to Dorian in exchange for equity and $9.7 million in cash its 100% interest in CMNL, CJNP, CNML owners of the Captain Markos NL, Captain John NP and Captain Nicholas ML, respectively and acquired the related inventory on board, and assumed the associated bank debt, and interest rate swap and 100% interest in two entities, each a party to a contract for the construction of one VLGC, and option rights to construct an additional 1.5 VLGCs and $2.67 million in cash. The $9.7 million cash related to the payment for inventories and LPG coolant on board of $2.3 million and to reimburse for an advance for vessels under construction of $7.4 million
In addition on July 29, 2013 Dorian acquired 100% interest of Grendon Tanker LLC, the owner of the Grendon (until its sale to a third party in February 2016), from an affiliate of Dorian Holdings for a cash consideration of $6,625,000 plus the value of inventory on board the vessel.
These acquisitions have been treated as business acquisitions and were initially recorded at fair value.
The following table summarizes the fair value of the consideration paid and assets/liabilities acquired.
Fair value of total consideration
|
|
Acquisition |
|
|
|
|
|
|
|
|
|
|
from Dorian |
|
Grendon |
|
|
|
|
||
|
|
Holdings |
|
acquisition |
|
Total |
|
|||
|
Cash |
$ |
9,732,911 |
|
$ |
6,672,485 |
|
$ |
16,405,396 |
|
|
Equity instruments (4,667,135 common shares of the Company at NOK 75.00 per share) |
|
59,092,499 |
|
|
— |
|
|
59,092,499 |
|
|
Total consideration |
|
68,825,410 |
|
|
6,672,485 |
|
|
75,497,895 |
|
|
Fair value of identifiable assets and liabilities acquired: |
|
|
|
|
|
|
|
|
|
|
Cash |
|
2,672,500 |
|
|
— |
|
|
2,672,500 |
|
|
Vessels |
|
194,457,529 |
|
|
6,625,000 |
|
|
201,082,529 |
|
|
Inventories on board the vessels |
|
1,407,622 |
|
|
47,485 |
|
|
1,455,107 |
|
|
Newbuilding vessels contracted for construction |
|
17,593,130 |
|
|
— |
|
|
17,593,130 |
|
|
Other assets—Vessel purchase options |
|
4,605,000 |
|
|
— |
|
|
4,605,000 |
|
|
Long term bank debt |
|
(135,224,500) |
|
|
— |
|
|
(135,224,500) |
|
|
Interest rate swaps |
|
(16,685,871) |
|
|
— |
|
|
(16,685,871) |
|
|
Net assets acquired—fair value |
$ |
68,825,410 |
|
$ |
6,672,485 |
|
$ |
75,497,895 |
|
The fair value of the common stock was determined to be NOK75.00 per share (or $12.66 per share at the exchange rate on July 29, 2013) being the price the Company issued its common shares to private investors under its private placement which closed on the same date.
F-16
The vessels were acquired with attached charters. The attached charters for each vessel were evaluated by the Company based on market charter rates on the acquisition date and were found to be at market values, and thus none of the purchase consideration was allocated to the attached time charters or voyage charter.
The fair values of the vessels, excluding LPG coolant, on the date of acquisition were determined by the Company based on valuations from an independent broker. The appraised value was determined using recent transactions involving comparable vessels as adjusted for age and features. The appraisal was performed on “willing Seller and willing Buyer” basis and based on the sale and purchase market condition prevailing at the acquisition date subject to the vessel being in sound condition and made available for delivery charter free. The fair value of the LPG coolant at the date of acquisition was determined by the quantity purchased valued at the then current LPG rate. The fair value of the newbuilding contracts and vessel purchase options was computed as the excess of the purchase consideration for similar vessels with similar delivery dates based on valuation from an independent broker over the purchase consideration of the contracts acquired plus in respect of the newbuilding contracts any advance paid to the shipyard as of the acquisition date. The fair value of the interest rate swaps was determined using a discounted cash flow approach based on market‑based LIBOR swap yield rates. The fair value of the bank debt and cash was determined to be its face value.
In addition, on July 29, 2013 Dorian Holdings granted the Company a royalty‑free, non‑exclusive right and license to use the then newly created Dorian logo and “Dorian LPG”. The Company evaluated the license agreement and did not assign any value to the use of this logo and name based on the fact that it was a brand new logo, created shortly prior to the NPP and never used in the market place, and for which the Company does not have exclusive use.
The revenue and net income relating to the Predecessor operations acquired since their acquisition date to March 31, 2014 included in the consolidated statement of operations for the period ended March 31, 2014 amount to $29,633,700 and $3,152,335, respectively.
Pro forma Information (unaudited)
The following table summarizes total net revenues and net income of the Company, had the acquisition of the Predecessor operations occurred on April 1, 2013:
|
|
|
For the year ended |
|
|
|
$ in 000’s |
|
March 31, 2014 |
|
|
|
Net revenues |
|
$ |
45,017 |
|
|
Net income |
|
$ |
6,613 |
|
The combined results in the table above have been prepared for comparative purposes only and include acquisition related adjustments for depreciation, interest charges and management fees. The combined results do not purport to be indicative of the results of operations which would have resulted had the acquisition been effected at the beginning of the applicable period noted above, or the future results of operations of the combined entity.
5. Inventories
Our inventories by type were as follows:
|
|
March 31, 2016 |
|
March 31, 2015 |
|
||
|
Lubricants |
$ |
1,612,354 |
|
$ |
737,502 |
|
|
Victualing |
|
494,098 |
|
|
132,017 |
|
|
Bonded stores |
|
103,446 |
|
|
35,399 |
|
|
Communication cards |
|
78,175 |
|
|
24,417 |
|
|
Bunkers |
|
— |
|
|
2,446,424 |
|
|
Total |
$ |
2,288,073 |
|
$ |
3,375,759 |
|
F-17
6. Vessels, Net
|
|
|
|
|
|
Accumulated |
|
|
|
|
|
|
|
|
Cost |
|
depreciation |
|
Net book Value |
|
|||
|
Balance, April 1, 2015 |
|
$ |
201,390,135 |
|
$ |
(6,555,269) |
|
$ |
194,834,866 |
|
|
Vessels delivered |
|
|
240,415,534 |
|
|
— |
|
|
240,415,534 |
|
|
Impairment(1) |
|
|
(2,625,000) |
|
|
1,193,182 |
|
|
(1,431,818) |
|
|
Depreciation |
|
|
— |
|
|
(13,842,529) |
|
|
(13,842,529) |
|
|
Balance, March 31, 2015 |
|
|
439,180,669 |
|
|
(19,204,616) |
|
|
419,976,053 |
|
|
Vessels delivered |
|
|
1,292,872,267 |
|
|
— |
|
|
1,292,872,267 |
|
|
Other additions |
|
|
195,272 |
|
|
— |
|
|
195,272 |
|
|
Disposals |
|
|
(4,268,279) |
|
|
429,214 |
|
|
(3,839,065) |
|
|
Depreciation |
|
|
— |
|
|
(41,980,051) |
|
|
(41,980,051) |
|
|
Balance, March 31, 2016 |
|
$ |
1,727,979,929 |
|
$ |
(60,755,453) |
|
$ |
1,667,224,476 |
|
|
(1) |
We recognized no impairment losses for the year ended March 31, 2016, and a non-cash impairment loss of $1.4 million for the year ended March 31, 2015. We prepared future undiscounted cash flows for the PGC vessel as there were indicators of impairment for this size vessel, which provided evidence that the book value was not recoverable. |
Vessels delivered represent amounts transferred from Vessels under Construction relating to the cost of our ECO VLGCs delivered to us between July 2014 and February 2016.
Vessels with a total carrying value of $1,667.2 million as of March 31, 2016 are first‑priority mortgaged as collateral for our loan facilities (refer to Note 11 below). As of March 31, 2015, vessels with a total carrying value of $416.0 million were first priority mortgaged as collateral for our loan facilities.
7. Vessels Under Construction
|
Balance, April 1, 2015 |
|
$ |
323,206,206 |
|
|
Installment payments to shipyards |
|
|
300,866,261 |
|
|
Other capitalized expenditures |
|
|
11,016,951 |
|
|
Capitalized interest |
|
|
3,501,620 |
|
|
Vessels delivered (transferred to Vessels) |
|
|
(240,415,534) |
|
|
Balance, March 31, 2015 |
|
|
398,175,504 |
|
|
Installment payments to shipyards |
|
|
867,187,966 |
|
|
Other capitalized expenditures |
|
|
22,699,783 |
|
|
Capitalized interest |
|
|
4,809,014 |
|
|
Vessels delivered (transferred to Vessels) |
|
|
(1,292,872,267) |
|
|
Balance, March 31, 2016 |
|
$ |
— |
|
Other capitalized expenditures for the year ended March 31, 2016 represent LPG coolant of $5.0 million, fees paid to third party vendors of $17.3 million and $0.4 million of employee-related costs for supervision fees and other newbuilding pre-delivery costs including engineering and technical support, liaising with the shipyard, and ensuring key suppliers are integrated into the production planning process. Other capitalized expenditures for the year ended March 31, 2015 represent LPG coolant of $1.4 million, fees paid to our Manager of $0.9 million and to third party vendors of $8.6 million and $0.1 million of employee-related costs for supervision fees and other newbuilding pre‑delivery costs including engineering and technical support, liaising with the shipyard, and ensuring key suppliers are integrated into the production planning process.
F-18
8. Other Fixed Assets, Net
Other fixed assets of $591,288 and $464,889 as of March 31, 2016 and March 31, 2015, respectively, represent leasehold improvements, software and furniture and fixtures at cost. Accumulated depreciation on other fixed assets net was $279,651 as of March 31, 2016 and $46,402 as of March 31, 2015.
9. Deferred Charges, Net
The analysis and movement of deferred charges is presented in the table below:
|
|
|
Financing |
|
Drydocking |
|
Equity |
|
Total deferred |
|
||||
|
|
|
costs |
|
costs |
|
offering costs |
|
charges, net |
|
||||
|
Balance, April 1, 2014 |
|
$ |
716,040 |
|
$ |
535,291 |
|
$ |
1,304,343 |
|
$ |
2,555,674 |
|
|
Additions |
|
|
13,411,075 |
|
|
323,623 |
|
|
760,680 |
|
|
14,495,378 |
|
|
Amortization |
|
|
(830,899) |
|
|
(189,209) |
|
|
— |
|
|
(1,020,108) |
|
|
Transferred to APIC |
|
|
— |
|
|
— |
|
|
(2,065,023) |
|
|
(2,065,023) |
|
|
Balance, March 31, 2015 |
|
|
13,296,216 |
|
|
669,705 |
|
|
— |
|
|
13,965,921 |
|
|
Additions |
|
|
12,951,085 |
|
|
— |
|
|
— |
|
|
12,951,085 |
|
|
Amortization |
|
|
(2,499,185) |
|
|
(374,770) |
|
|
— |
|
|
(2,873,955) |
|
|
Balance, March 31, 2016 |
|
$ |
23,748,116 |
|
$ |
294,935 |
|
$ |
— |
|
$ |
24,043,051 |
|
The drydocking costs incurred during the year ended March 31, 2015 relate to the drydocking for Grendon.
Financing costs incurred during the year ended March 31, 2016 and 2015 relate to the 2015 Debt Facility as further described in Note 11.
Offering costs related to our IPO were transferred to additional paid in capital (“APIC”) on completion of our IPO on May 13, 2014.
10. Accrued Expenses
Accrued expenses comprised of the following:
|
|
March 31, 2016 |
|
March 31, 2015 |
|
||
|
Accrued employee-related costs |
$ |
4,231,542 |
|
$ |
546,095 |
|
|
Accrued professional services |
|
1,676,880 |
|
|
1,282,639 |
|
|
Accrued loan and swap interest |
|
1,664,002 |
|
|
1,619,897 |
|
|
Accrued voyage and vessel operating expenses |
|
1,644,557 |
|
|
1,406,023 |
|
|
Accrued board of directors' stock-based compensation and fees |
|
492,652 |
|
|
— |
|
|
Other |
|
11,844 |
|
|
88,048 |
|
|
Accrued financing costs |
|
— |
|
|
705,000 |
|
|
Total |
$ |
9,721,477 |
|
$ |
5,647,702 |
|
11. Long‑Term Debt
Description of our Debt Obligations
2015 Debt Facility
In March 2015, we entered into a $758 million debt financing facility (the “2015 Debt Facility”) with four separate tranches. Commercial debt financing (“Commercial Financing”) of $249 million is being provided by ABN AMRO Capital USA LLC (“ABN”); ING Bank N.V., London Branch, ("ING"); DVB Bank S.E. ("DVB"); Citibank (“Citi”); and Commonwealth Bank of Australia, New York Branch, ("CBA"), (collectively the "Commercial Lenders"), while the Export Import Bank of Korea ("KEXIM") is directly providing $204 million of financing (“KEXIM Direct Financing”). The remaining $305 million of financing is being provided under tranches guaranteed by KEXIM of $202 million
F-19
(“KEXIM Guaranteed”) and insured by the Korea Trade Insurance Corporation ("K-sure") of $103 million (“K-sure Insured”). Financing under the KEXIM guaranteed and K-sure insured tranches are provided by certain Commercial Lenders; Deutsche Bank AG; and Santander Bank, N.A. The debt financing is secured by, among other things, eighteen of the Company's ECO VLGCs, and represents a loan-to-contract cost ratio before fees of approximately 55%.
The 2015 Debt Facility contains various covenants providing for, among other things, maintenance of certain financial ratios and certain limitations on payment of dividends, investments, acquisitions and indebtedness. A commitment fee was payable on the average daily unused amount under the 2015 Debt Facility of 40% of the margin on each tranche. Additionally, we incurred approximately $13.0 million and $13.4 million of debt issuance costs associated with the 2015 Debt Facility for the years ended March 31, 2016 and 2015, respectively, which have been deferred and are amortized over the life of the agreement and are included as part of interest expense. Certain terms of the borrowings under each tranche of the 2015 Debt Facility are as follows:
|
|
|
|
|
|
|
|
|
|
|
|
Interest Rate at |
|
|
|
|
|
|
Term |
|
Interest Rate Description(1) |
|
March 31, 2016(2) |
|
|||
|
Tranche 1 |
|
Commercial Financing |
|
7 |
years |
|
London InterBank Offered Rate (“LIBOR”) plus a margin(4) |
|
3.38 |
% |
||
|
Tranche 2 |
|
KEXIM Direct Financing |
|
12 |
years(3) |
|
LIBOR |
plus a margin of |
2.45 |
% |
3.08 |
% |
|
Tranche 3 |
|
KEXIM Guaranteed |
|
12 |
years(3) |
|
LIBOR |
plus a margin of |
1.40 |
% |
2.03 |
% |
|
Tranche 4 |
|
K-sure Insured |
|
12 |
years(3) |
|
LIBOR |
plus a margin of |
1.50 |
% |
2.13 |
% |
|
(1) |
The interest rate of the 2015 Debt Facility on Tranche 1 is determined in accordance with the agreement as three or six month LIBOR plus the applicable margin and the interest rate on Tranches 2, 3 and 4 is determined in accordance with the agreement as three month LIBOR plus the applicable margin for the respective tranches. |
|
(2) |
The set LIBOR rate in effect as of March 31, 2016 was 0.63%. |
|
(3) |
The KEXIM Direct Financing, KEXIM Guaranteed, and K-Sure tranches have put options to call for the prepayment on the final payment date of the Commercial Financing tranche subject to specific notifications and commitments for refinancing/renewal of the Commercial Financing tranche. |
|
(4) |
The Commercial Financing tranche margin over LIBOR is 2.75% and is reduced to 2.50% if 50% or more but less than 75% of the vessels financed in the 2015 Debt Facility are employed under time charters as defined in the agreement and to 2.25% if 75% or more of the vessels financed in the 2015 Debt Facility are employed under time charters as defined in the agreement. As of March 31, 2016, the set margin was 2.75%. |
The 2015 Debt Facility is secured by, among other things, (i) first priority Bahamian mortgages on the vessels financed; (ii) first priority assignments of all of the financed vessels’ insurances, earnings, requisition compensation, and management agreements; (iii) first priority security interests in respect of all issued shares or limited liability company interests of the borrowers and vessel-owning guarantors; (iv) first priority charter assignments of all of the financed vessels’ long term charters; (v) assignments of the interests of any ship manager in the insurances of the financed vessels; (vi) an assignment by the borrower of any bank, deposit or certificate of deposit opened in accordance with the facility; and (vii) a guaranty by the Company guaranteeing the obligations of the borrower and other guarantors under the facility agreement. The 2015 Debt Facility further provides that the facility is to be secured by assignments of the borrower’s rights under any hedging contracts in connection with the facility but such assignments have not been entered into at this time.
During the year ended March 31, 2016, we made drawdowns of $676.8 million, including $9.6 million to pay guarantee and insurance fees, under the 2015 Debt Facility, which was secured by eighteen ECO VLGCs delivered during that period and was comprised of four separate tranches. As of March 31, 2016, the 2015 Debt Facility was fully drawn.
Royal Bank of Scotland plc. (“RBS”) secured bank debt
As discussed in Note 1 to the consolidated financial statements, the Company assumed the debt obligations associated with the financing of the vessels that were acquired through the acquisition of CMNL, CJNP and CNML. The prior loan arrangements associated with those vessels required approval from the lenders to sell the vessels and agreement from the lenders to transfer the borrowings to another party. As a consequence, the Company and the lender negotiated new borrowing terms in connection with this transaction. The new terms are described below. The total borrowings outstanding immediately prior to the debt modification and immediately after remained the same.
F-20
CMNL, CJNP, CNML and Corsair as joint and several borrowers (Borrowers), and Dorian LPG Ltd. as parent guarantor entered into a loan facility of $135,224,500 (the “RBS Loan Facility”), which replaced the prior borrowing arrangements of the Predecessor. The RBS Loan Facility is divided into three tranches. Tranche A of $47.6 million, Tranche B of $34.5 million and Tranche C of up to $53.1 million and is associated with each of the Captain John NP, Captain Markos NL and the Captain Nicholas ML, respectively.
Tranche A is payable in twelve equal semi‑annual installments each in the amount of $1,700,000 that commenced on September 24, 2013 plus a balloon of $27,200,000 payable concurrently with the last installment on March 24, 2019.
Tranche B is payable in eleven equal semi‑annual installments each in the amount of $1,278,500 that commenced on November 17, 2013 plus a balloon of $20,456,000 payable concurrently with the last installment on November 17, 2018.
Tranche C is payable in fourteen equal semi‑annual installments each in the amount of $1,827,500 that commenced on January 21, 2014 plus a balloon of $27,520,000 payable concurrently with the last installment July 21, 2020.
The interest rate on the RBS Loan Facility increased in accordance with the loan agreement from LIBOR plus a margin of 1.5% per annum to LIBOR plus a margin of 2.0% per annum on September 26, 2014, concurrent with the delivery of the Corsair and to 2.5% on September 26, 2015 until maturity. In the event of non‑compliance the Borrowers will be required within one month of being notified in writing by the lender to make such prepayment. In the event the lender agrees to release Corsair or another borrower approved by the lender from joint and several liabilities under the agreement, the minimum market adjusted security cover is adjusted to 175% and the margin will be increased to 2.75%.
The RBS Loan Facility provides that it be secured by, among other things, (i) first priority mortgages on the vessels financed; (ii) first assignments of all freights, earnings and insurances; (iii) first assignment of any borrowers’ rights and interests in any hedging agreement in connection with the facility; and (iv) assignment of any approved charter in respect of any financed vessel.
The 2015 Debt Facility and RBS Loan Facility also contain customary covenants that require us to maintain adequate insurance coverage, properly maintain the vessels and to obtain the lender’s prior consent before changes are made to the flag, class or management of the vessels, or enter into a new line of business. The loan facilities include customary events of default, including those relating to a failure to pay principal or interest, a breach of covenant, representation and warranty, a cross-default to other indebtedness and non-compliance with security documents, and customary restrictions from paying dividends if an event of default has occurred and is continuing, or if an event of default would result therefrom.
Debt Covenants: The following financial covenants are the most restrictive from the 2015 Debt Facility and the RBS Loan Facility with which the Company is required to comply, calculated on a consolidated basis, determined and defined according to the provisions of the loan agreement:
2015 Debt Facility Covenants
|
· |
The ratio of current assets divided by current liabilities shall always be greater than 1.00; |
|
· |
Maintain minimum stockholder’s equity at all times equal to the aggregate of (i) $400,000,000, (ii) 50% of any new equity raised after loan agreement date and (iii) 25% of the positive net income for the immediately preceding financial year; |
|
· |
Minimum interest coverage ratio of consolidated EBITDA to consolidated net interest expense must be maintained (i) greater than or equal to: 1.00 for the 12-month period starting in the calendar quarter following the one in which delivery of the first ship occurs, (ii) 1.50 in the subsequent year, (iii) 2.00 in the third year following the initial period, and (iv) 2.50 thereafter; |
F-21
|
· |
The ratio of consolidated net debt to consolidated total capitalization shall not exceed 0.60 to 1.00; |
|
· |
Liquidity reserve minimum must be the higher of (a) the aggregate of (i) $25 million and (ii) $1,100,000 for every vessel delivered and financed by the 2015 Debt Facility and (b) 5% of the consolidated interest bearing debt outstanding of the Company; |
|
· |
Fair market value of the mortgaged ships plus any additional security shall be at least 135% of the outstanding loan balance; |
RBS Loan Facility Covenants
|
· |
The ratio of cash flow from operations before interest and finance costs to cash debt service costs shall not be less than 1:1; |
|
· |
Minimum shareholders' equity, as adjusted for any reduction in vessel fair market value, shall not be less than $85 million; |
|
· |
Minimum cash balance of $10 million at the end of each quarter and minimum cash balances of $1.5 million per mortgaged vessel in a pledged account with the lender at all times; |
|
· |
The ratio of Total Debt to Shareholders Funds shall not exceed 150% at all times; |
|
· |
The ratio of the aggregate market value of the vessels securing the loan to the principal amount outstanding under such loan, plus 100% of the related swap exposure, at all times shall be in excess of 125%; and |
|
· |
No dividends shall be paid in excess of free cash flow if an event of default is occurring. |
The RBS Loan Facility further (i) requires that the existing shareholders at the date of the agreement maintain their ownership of our common shares at a minimum level of 15% of our issued share capital, subject to downward adjustment for any future equity issuances by us, (ii) provides that the ownership of more than one‑third of our common shares by any shareholder other than the existing shareholders at the date of the agreement is an event of default and/or permits the lender to accelerate the indebtedness, (iii) permits the lender to accelerate the indebtedness if at any time the existing shareholders at the date of the agreement do not maintain a representative on our board of directors or any other of our management committees; (iv) requires the lender's approval prior to chartering for a period of greater than one year any of the vessels securing the loan, subject to certain conditions; and (v) restricts our subsidiaries, which own the vessels securing the loan, from paying any dividends, however, the loan facility permits the borrowers to make expenditures to fund our administration and operations.
Similarly, the 2015 Debt Facility permits the lenders to accelerate the indebtedness if, without the prior written consent of the lenders, (i) one-third of our common shares are owned by any shareholder other than certain entities, directors or officers listed in the agreement; (ii) there are certain changes to our board of directors; or (iii) Mr. John Hadjipateras ceases to serve on our board of directors.
We were in compliance with the financial covenants as of March 31, 2016.
F-22
Debt Obligations
The table below presents our debt obligations:
|
RBS secured bank debt |
|
March 31, 2016 |
|
March 31, 2015 |
|
||
|
Tranche A |
|
$ |
37,400,000 |
|
$ |
40,800,000 |
|
|
Tranche B |
|
|
28,127,000 |
|
|
30,684,000 |
|
|
Tranche C |
|
|
43,967,500 |
|
|
47,622,500 |
|
|
Total |
|
$ |
109,494,500 |
|
$ |
119,106,500 |
|
|
|
|
|
|
|
|
|
|
|
2015 Debt Facility |
|
|
|
|
|
|
|
|
Commercial Financing |
|
$ |
241,442,384 |
|
$ |
26,695,381 |
|
|
KEXIM Direct Financing |
|
|
194,827,596 |
|
|
21,890,212 |
|
|
KEXIM Guaranteed |
|
|
192,736,763 |
|
|
21,655,293 |
|
|
K-sure Insured |
|
|
97,867,129 |
|
|
10,996,041 |
|
|
Total |
|
|
726,873,872 |
|
|
81,236,927 |
|
|
Total debt obligations |
|
$ |
836,368,372 |
|
$ |
200,343,427 |
|
|
|
|
|
|
|
|
|
|
|
Presented as follows: |
|
|
|
|
|
|
|
|
Current portion of long-term debt |
|
$ |
66,265,643 |
|
$ |
15,677,553 |
|
|
Long-term debt—net of current portion |
|
|
770,102,729 |
|
|
184,665,874 |
|
|
Total |
|
$ |
836,368,372 |
|
$ |
200,343,427 |
|
Future Cash Payments for Debt
The minimum annual principal payments, in accordance with the loan agreements, required to be made after March 31, 2016 are as follows:
|
Year ending March 31: |
|
|
|
|
2017 |
$ |
66,265,643 |
|
|
2018 |
|
65,978,785 |
|
|
2019 |
|
113,634,786 |
|
|
2020 |
|
60,021,785 |
|
|
2021 |
|
85,714,286 |
|
|
Thereafter |
|
444,753,087 |
|
|
Total |
$ |
836,368,372 |
|
12. Common Stock
Under the articles of incorporation effective July 1, 2013, the Company’s authorized capital stock consists of 500,000,000 registered shares, par value $.01 per share, of which 450,000,000 are designated as common share and 50,000,000 shares are designated as preferred shares.
On July 29, 2013, the Company issued the following shares:
|
· |
9,310,054 common shares on completion of its NPP, at NOK75.00 per share, equivalent to USD12.66 per share based on the exchange rate on July 29, 2013 |
|
· |
4,667,135 common shares to Dorian Holdings (refer to Note 4) |
|
· |
4,667,135 common shares to SeaDor Holdings LLC (refer to Note 3) |
F-23
The fair value of the shares issued to Dorian and SeaDor was determined by the Company to be NOK75 (or USD12.66) per share based on the issue price of the NPP.
On November 26, 2013, the Company issued the following shares:
|
· |
16,081,081 common shares on completion of a second Private Placement in Norway (“NPP2”), at NOK92.50 per share, equivalent to USD15.16 per share based on the exchange rate on November 26, 2013 |
|
· |
7,990,425 common shares to Scorpio Tankers Inc. (refer to Note 3) |
On February 12, 2014, the Company issued the following shares:
|
· |
5,649,200 common shares on completion of a third Private Placement in Norway (“NPP3”), at NOK110.00 per share, equivalent to USD17.92 per share based on the exchange rate on February 12, 2014 |
Each holder of common shares is entitled to one vote on all matters submitted to a vote of shareholders. Subject to preferences that may be applicable to any outstanding shares of preferred stock, holders of common shares are entitled to share equally in any dividends, which the Company’s board of directors may declare from time to time, out of funds legally available for dividends. Upon dissolution, liquidation or winding‑up, the holders of common shares will be entitled to share equally in all assets remaining after the payment of any liabilities and the liquidation preferences on any outstanding preferred stock. Holders of common shares do not have conversion, redemption or pre‑emptive rights.
On April 25, 2014 the Company completed a one-for-five reverse stock split and reduced the number of the Company’s issued and outstanding common shares and affected all issued and outstanding common shares, outstanding immediately prior to the effectiveness of the reverse stock split. The number of the Company’s authorized common shares was not affected by the reverse split and the par value of our common shares remained unchanged at $0.01 per share. The reverse stock split reduced the number of the Company’s common shares outstanding at March 31, 2014 from 241,825,149 to 48,365,011 after the cancellation of 19 fractional shares. No fractional shares were issued in connection with the reverse stock split. Shareholders who otherwise held a fractional share of the Company’s common stock as a result of the reverse stock split received a cash payment in lieu of such fractional share. All amounts related to number of shares and per share amounts have been retroactively restated.
On April 25, 2014, we completed a private placement of 1,412,698 common shares with a strategic investor at a price of NOK 110.00 or USD 18.40 based upon the exchange rate on April 24, 2014, which represents approximately $26.0 million in gross proceeds not including closing fees.
On May 13, 2014, we completed an initial public offering of 7,105,263 common shares on the New York Stock Exchange at a price of $19.00 per share, or $135.0 million in gross proceeds not including underwriting fees or closing costs. The shares began trading on the New York Stock Exchange on May 8, 2014 under the ticker symbol “LPG”.
On May 22, 2014, we completed the issuance of 245,521 common shares related to the overallotment exercise by the underwriters of our initial public offering at a price of $19.00 per share, or $4.7 million in gross proceeds not including underwriting fees or closing costs.
On June 25, 2014, we completed the exchange offer of unregistered common shares that we previously issued in our prior equity private placements, other than the common shares owned by our affiliates, for 15,528,507 common shares that have been registered under the Securities Act of 1933, as amended, the complete terms and conditions of which were set forth in a prospectus dated May 8, 2014 and the related letter of transmittal.
In June 2014, we granted 655,000 shares of restricted stock to certain of our officers and, in March 2015, we granted 274,000 shares of restricted stock to certain of our employees and non-employee consultants (see Note 13 for further discussion regarding stock-based compensation).
F-24
In August 2015, we established a stock repurchase program authorizing the repurchase of up to $100.0 million of our common stock. As of March 31, 2016, we repurchased a total of 1,932,465 shares of our common stock for approximately $20.9 million under this program, resulting in $79.1 million of available authorization remaining. Purchases may be made at our discretion in the form of open market repurchase programs, privately negotiated transactions, accelerated share repurchase programs or a combination of these methods. The actual timing and amount of our repurchases will depend on Company and market conditions.
13. Stock-Based Compensation Plans
In April 2014, we adopted an equity incentive plan, which we refer to as the Equity Incentive Plan, under which we expect that directors, officers, and employees (including any prospective officer or employee) of the Company and its subsidiaries and affiliates, and consultants and service providers to (including persons who are employed by or provide services to any entity that is itself a consultant or service provider to) the Company and its subsidiaries and affiliates, as well as entities wholly‑owned or generally exclusively controlled by such persons, may be eligible to receive non‑qualified stock options, stock appreciation rights, stock awards, restricted stock units and performance compensation awards that the plan administrator determines are consistent with the purposes of the plan and the interests of the Company. We have reserved 2,850,000 of our common shares for issuance under the Equity Incentive Plan, subject to adjustment for changes in capitalization as provided in the Equity Incentive Plan in April 2014. The plan is administered by our compensation committee.
In June 2014, we granted 655,000 shares of restricted stock to certain of our officers and, in March 2015, we granted 274,000 shares of restricted stock to certain of our employees and non-employee consultants. One-third of these restricted shares vest three years after grant date, one-third vest four years after grant date, and one-third vest five years after grant date. The restricted shares were valued at their fair market value on their grant date and are expensed on a straight-line basis over five years. Our stock-based compensation expense was $4.1 million (including accrued stock-based compensation of $0.5 million for our board of directors) and $2.3 million for the years ended March 31, 2016 and 2015, respectively, and is included within general and administrative expenses in our accompanying consolidated statements of operations. There was no stock-based compensation expense for the period of July 1, 2013 through March 31, 2014. Unrecognized compensation cost as of March 31, 2016 was $12.2 million and will be recognized over the remaining weighted average life of 3.45 years.
A summary of the activity of our restricted shares as of March 31, 2016 and 2015 changes during the year ended March 31, 2016 and 2015, are as follows:
|
|
|
|
|
Weighted-Average |
|
|
|
|
|
|
|
Grant-Date |
|
|
|
Restricted Share Awards |
|
Numbers of Shares |
|
Fair Value |
|
|
|
Unvested as of April 1, 2014 |
|
— |
|
$ |
— |
|
|
Granted |
|
929,000 |
|
|
19.70 |
|
|
Unvested as of March 31, 2015 |
|
929,000 |
|
|
19.70 |
|
|
Granted |
|
— |
|
|
— |
|
|
Unvested as of March 31, 2016 |
|
929,000 |
|
$ |
19.70 |
|
F-25
14. Revenues
Revenues comprise the following:
|
|
|
|
Year ended |
|
Year ended |
|
July 1, 2013 (inception) |
|||
|
|
|
|
March 31, 2016 |
|
March 31, 2015 |
|
to March 31, 2014 |
|||
|
Net pool revenues—related party |
|
|
$ |
202,918,232 |
|
$ |
— |
|
$ |
— |
|
Voyage charter revenues |
|
|
|
46,194,134 |
|
|
77,331,934 |
|
|
11,210,785 |
|
Time charter revenues |
|
|
|
38,737,172 |
|
|
26,098,290 |
|
|
17,602,137 |
|
Other revenues |
|
|
|
1,358,291 |
|
|
698,925 |
|
|
820,778 |
|
Total |
|
|
$ |
289,207,829 |
|
$ |
104,129,149 |
|
$ |
29,633,700 |
Time charter revenue included a profit-sharing element of the time charter agreements of $7.8 million and $6.1 million for the year ended March 31, 2015 and the period ended March 31, 2014, respectively. There was no profit-sharing element of the time charter agreements for the year ended March 31, 2016. Other revenue represents income from charterers relating to reimbursement of expenses such as costs for security guards and war risk insurance.
15. Voyage Expenses
Voyage expenses comprise the following:
|
|
|
Year ended |
|
Year ended |
|
July 1, 2013 (inception) |
|
|||
|
|
|
March 31, 2016 |
|
March 31, 2015 |
|
to March 31, 2014 |
|
|||
|
Bunkers |
|
$ |
7,240,544 |
|
$ |
15,678,905 |
|
$ |
5,271,126 |
|
|
Port charges and other related expenses |
|
|
2,558,697 |
|
|
3,603,707 |
|
|
552,634 |
|
|
Brokers’ commissions |
|
|
1,335,584 |
|
|
1,703,589 |
|
|
386,244 |
|
|
Security cost |
|
|
370,762 |
|
|
709,035 |
|
|
298,820 |
|
|
War risk insurances |
|
|
219,261 |
|
|
146,320 |
|
|
37,001 |
|
|
Other voyage expenses |
|
|
339,834 |
|
|
240,300 |
|
|
125,146 |
|
|
Total |
|
$ |
12,064,682 |
|
$ |
22,081,856 |
|
$ |
6,670,971 |
|
16. Vessel Operating Expenses
Vessel operating expenses comprise the following:
|
|
|
Year ended |
|
Year ended |
|
July 1, 2013 (inception) |
|
|||
|
|
|
March 31, 2016 |
|
March 31, 2015 |
|
March 31, 2014 |
|
|||
|
Crew wages and related costs |
|
$ |
31,449,090 |
|
$ |
14,529,018 |
|
$ |
5,306,441 |
|
|
Spares and stores |
|
|
6,403,785 |
|
|
2,666,100 |
|
|
1,395,287 |
|
|
Insurance |
|
|
3,527,386 |
|
|
1,343,071 |
|
|
566,021 |
|
|
Lubricants |
|
|
2,489,494 |
|
|
964,951 |
|
|
480,279 |
|
|
Repairs and maintenance costs |
|
|
2,076,576 |
|
|
1,315,028 |
|
|
502,424 |
|
|
Miscellaneous expenses |
|
|
1,173,659 |
|
|
437,997 |
|
|
144,507 |
|
|
Total |
|
$ |
47,119,990 |
|
$ |
21,256,165 |
|
$ |
8,394,959 |
|
F-26
17. Interest and Finance Costs
Interest and finance costs is comprised of the following:
|
|
|
Year ended |
|
Year ended |
|
July 1, 2013 (inception) |
|
|||
|
|
|
March 31, 2016 |
|
March 31, 2015 |
|
to March 31, 2014 |
|
|||
|
Interest incurred |
|
$ |
14,350,900 |
|
$ |
2,657,943 |
|
$ |
1,666,159 |
|
|
Amortization of financing costs |
|
|
2,499,185 |
|
|
830,899 |
|
|
800,806 |
|
|
Other financing costs |
|
|
715,942 |
|
|
301,868 |
|
|
84,251 |
|
|
Capitalized interest |
|
|
(4,809,014) |
|
|
(3,501,620) |
|
|
(972,010) |
|
|
Total |
|
$ |
12,757,013 |
|
$ |
289,090 |
|
$ |
1,579,206 |
|
18. Income Taxes
The Company and its vessel-owning subsidiaries are incorporated in the Marshall Islands and under the laws of the Marshall Islands, are not subject to tax on income or capital gains and no Marshall Islands withholding tax will be imposed on dividends paid by the Company to its shareholders. The Company is also subject to United States federal income taxation in respect of income that is derived from the international operation of ships and the performance of services directly related thereto attributable to the transport of cargo to or from the United States (“Shipping Income”), unless exempt from United States federal income taxation.
If the Company does not qualify for the exemption from tax under Section 883, of the Internal Revenue Code of 1986, as amended, the Company and its subsidiaries will be subject to a 4% tax on its “U.S. source shipping income,” imposed without the allowance for any deductions. For these purposes, “U.S. source shipping income” means 50% of the Shipping Income derived by the Company and its subsidiaries that is attributable to transportation that begins or ends, but that does not both begin and end, in the United States.
For our first fiscal year ended March 31, 2014, we do not believe that we were able to qualify for exemption under Section 883 and as a consequence, our gross U.S. source shipping income is subject to a 4% gross basis tax (without allowance for deductions) equal to $39,266 and is included in Voyage expenses in the consolidated statement of operations.
For our fiscal years ended March 31, 2016 and 2015, we believe that we will qualify for exemption under Section 883 and as a consequence, our gross U.S. source shipping income will not be subject to a 4% gross basis tax.
19. Commitments and Contingencies
Commitments under Operating Leases
We had the following commitments as a lessee under operating leases relating to our United States, Greece and United Kingdom offices:
|
|
|
March 31, 2016 |
|
|
|
Less than one year |
|
$ |
382,194 |
|
|
One to three years |
|
|
462,543 |
|
|
Three to five years |
|
|
31,463 |
|
|
Total |
|
$ |
876,200 |
|
F-27
Fixed Time Charter Commitments
We had the following future minimum fixed time charter hire receipts based on non-cancelable long-term fixed time charter contracts:
|
|
|
March 31, 2016 |
|
|
Less than one year |
|
$ |
53,053,113 |
|
One to three years |
|
|
85,001,227 |
|
Three to five years |
|
|
27,531,365 |
|
Total |
|
$ |
165,585,705 |
Other
From time to time we expect to be subject to legal proceedings and claims in the ordinary course of business, principally personal injury and property casualty claims. Such claims, even if lacking in merit, could result in the expenditure of significant financial and managerial resources. We are not aware of any claim, which is reasonably possible and should be disclosed or probable and for which a provision should be established in the accompanying consolidated financial statements.
20. Financial Instruments and Fair Value Disclosures
Our principal financial assets consist of cash and cash equivalents, amounts due from related parties and trade accounts receivable. Our principal financial liabilities consist of long-term bank loan, interest rate swaps, accounts payable, amounts due to related parties and accrued liabilities.
|
(a) |
Concentration of credit risk: Financial instruments, which may subject us to significant concentrations of credit risk, consist principally of amounts due from our charterers, including the receivable from Helios Pool, and cash and cash equivalents. We limit our credit risk with amounts due from our charterers, including those through the Helios Pool, by performing ongoing credit evaluations of our charterers’ financial condition and generally do not require collateral from our charterers. We limit our credit risk with our cash and cash equivalents by placing it with highly-rated financial institutions. |
|
(b) |
Interest rate risk: Our long‑term bank loans are based on LIBOR and hence we are exposed to movements thereto. We entered into interest rate swap agreements in order to hedge a majority of our variable interest rate exposure related to the RBS Loan Facility and our 2015 Debt Facility. |
The principal terms of the interest rate swaps are as follows:
|
|
|
|
|
|
|
|
|
|
|
|
|
|
|
|
|
Transaction |
|
Termination |
|
Fixed |
|
|
Nominal value |
|
Nominal value |
|
|
Interest rate swap |
|
Date |
|
Date |
|
interest rate |
|
|
March 31, 2016 |
|
March 31, 2015 |
|
|
RBS - CMNL(1) |
|
July 2013(8) |
|
Nov 2018 |
|
5.395 |
% |
|
20,456,000 |
|
20,456,000 |
|
|
RBS - CMNL(1) |
|
July 2013(8) |
|
Nov 2018 |
|
4.936 |
% |
|
7,671,000 |
|
10,228,000 |
|
|
RBS - CJNP(2) |
|
July 2013(8) |
|
March 2019 |
|
4.772 |
% |
|
27,979,875 |
|
30,523,500 |
|
|
RBS - CJNP(2) |
|
July 2013(8) |
|
March 2019 |
|
2.960 |
% |
|
9,420,125 |
|
10,276,500 |
|
|
RBS - CNML(3) |
|
July 2013(8) |
|
July 2020 |
|
4.350 |
% |
|
43,000,000 |
|
46,440,000 |
|
|
2015 Debt Facility - Citibank(4) |
|
September 2015 |
|
March 2022 |
|
1.933 |
% |
|
200,000,000 |
|
— |
|
|
2015 Debt Facility - ING(5) |
|
September 2015 |
|
March 2022 |
|
2.000 |
% |
|
50,000,000 |
|
— |
|
|
2015 Debt Facility - CBA(6) |
|
October 2015 |
|
March 2022 |
|
1.430 |
% |
|
82,550,000 |
|
— |
|
|
2015 Debt Facility - Citibank(7) |
|
October 2015 |
|
March 2022 |
|
1.380 |
% |
|
123,825,000 |
|
— |
|
|
|
|
|
|
|
|
|
|
|
564,902,000 |
|
117,924,000 |
|
|
(1) |
Reduces semi-annually by $1.3 million with a final settlement of $21.7 million due in November 2018. |
|
(2) |
Reduces semi-annually by $1.7 million with final settlement of $28.9 million due in March 2019. |
|
(3) |
Reduces semi-annually by $1.7 million with a final settlement of $27.5 million due in July 2020. |
|
(4) |
Non-amortizing with a final settlement of $200 million in March 2022. |
F-28
|
(5) |
Non-amortizing with a final settlement of $50 million in March 2022. |
|
(6) |
Reduces quarterly by $2.8 million with a final settlement of $17.9 million due in March 2022. |
|
(7) |
Reduces quarterly by $4.2 million with a final settlement of $26.9 million due in March 2022. |
|
(8) |
RBS swaps assumed from Predecessor Businesses in July 2013 |
|
(c) Fair Value Measurements: |
Fair Value on a Recurring Basis: Interest rate swaps are stated at fair value, which is determined using a discounted cash flow approach based on market‑based LIBOR swap yield rates. LIBOR swap rates are observable at commonly quoted intervals for the full terms of the swaps and therefore are considered Level 2 items in accordance with the fair value hierarchy. The fair value of the interest rate swap agreements approximates the amount that we would have to pay for the early termination of the agreements.
The following table summarizes the location on the balance sheet of the financial assets and liabilities that are carried at fair value on a recurring basis, which comprise our financial derivatives all of which are considered Level 2 items in accordance with the fair value hierarchy:
|
|
|
|
March 31, 2016 |
|
|
March 31, 2015 |
|
||||||
|
|
|
Other non-current assets |
|
Long-term liabilities |
|
Other non-current assets |
|
Long-term liabilities |
|
||||
|
Derivatives not designated as hedging instruments |
|
Derivative instruments |
|
Derivative instruments |
|
Derivative instruments |
|
Derivative instruments |
|
||||
|
Interest rate swap agreements |
|
$ |
— |
|
$ |
21,647,965 |
|
$ |
— |
|
$ |
12,730,462 |
|
The effect of derivative instruments within the consolidated statement of operations for the periods presented is as follows:
|
|
|
|
|
|
|
|
|
|
|
|
July 1, 2013 |
|
|
|
|
|
|
|
|
Year ended |
|
Year ended |
|
(inception) |
|
|||
|
Derivatives not designated as hedging instruments |
|
Location of gain/(loss) recognized |
|
|
March 31, 2016 |
|
March 31, 2015 |
|
to March 31, 2014 |
|
|||
|
Interest Rate Swap—Change in fair value |
|
Gain/(loss) on derivatives, net |
|
|
$ |
(8,917,503) |
|
$ |
1,331,954 |
|
$ |
2,623,456 |
|
|
Interest Rate Swap—Realized loss |
|
Gain/(loss) on derivatives, net |
|
|
|
(6,858,126) |
|
|
(5,291,157) |
|
|
(3,727,457) |
|
|
Gain/(loss) on derivatives, net |
|
|
|
|
$ |
(15,775,629) |
|
$ |
(3,959,203) |
|
$ |
(1,104,001) |
|
As of March 31, 2016 and March 31, 2015, no fair value measurements for assets or liabilities under Level 1 or Level 3 were recognized in the accompanying consolidated balance sheets. We did not have any other assets or liabilities measured at fair value on a non-recurring basis during the year ended March 31, 2016 or during the year ended March 31, 2015.
Fair value on a non-recurring basis: As of March 31, 2016 and March 31, 2015, we reviewed the carrying amount and the estimated recoverable amount for each of our vessels. The review for the year ended March 31, 2015 indicated that the carrying amount was not recoverable for our PGC vessel. The fair value is considered a Level 2 item in the fair value hierarchy and is based on our best estimate of the value of the vessel, which is supported by independent vessel appraisals. We recognized an impairment loss of $1.4 million during the year ended March 31, 2015 as further described in Note 6 to the consolidated financial statements. No impairment loss was incurred for the year ended March 31, 2016.
We did not have any other assets or liabilities measured at fair value on a non-recurring basis during the year ended March 31, 2016 or during the year ended March 31, 2015.
|
(d) |
Book values and fair values of financial instruments. In addition to the derivatives that we are required to record at fair value on our balance sheet (see (c) above), we have other financial instruments that are carried at historical cost. These financial instruments include trade accounts receivable, amounts due from related parties, cash and cash equivalents, accounts payable, amounts due to related parties and accrued liabilities for which the historical carrying value approximates the fair value due to the short‑term nature of these financial instruments. We also have long term bank debt for which we believe the historical carrying value approximates their fair value as the loans bear interest at variable interest rates, being LIBOR, which is observable at commonly quoted |
F-29
intervals for the full terms of the loans, and hence are considered as Level 2 items in accordance with the fair value hierarchy. Cash and cash equivalents and restricted cash are considered Level 1 items. |
21. Retirement Plans
Defined Contribution Plan
United States-based employees participate in our 401(k) retirement plan and may contribute a portion of their annual compensation to a 401(k) plan on a pre-tax basis, in accordance with Internal Revenue Service guidelines. On behalf of all participants in the plan, we provide a safe harbor contribution subject to certain limitations. Employee contributions and our safe harbor contributions are vested at all times. We recognized and paid compensation expense associated with the safe harbor contributions totaling $0.1 million and $0.1 million for the years ended March 31, 2016 and 2015, respectively. There was no compensation expense associated with the safe harbor contributions for the period ended March 31, 2014 as the plan was initiated during the year ended March 31, 2015 coinciding with the transfer of management services from the Manager to our wholly owned subsidiaries, as described in Note 3.
Defined Benefit Plan
Our Greece-based employees have a statutory required defined benefit pension plan according to provisions of Greek law 2112/20 covering all eligible employees (the “Greece Plan”). We recognized compensation expense and recorded a corresponding liability associated with our projected benefit obligation to the Greece Plan totaling $0.2 million and $0.3 million for the years ended March 31, 2016 and 2015, respectively, and no compensation expense for the period ended March 31, 2014.
Other
We contribute to retirement accounts for certain United Kingdom-based employees based on a percentage of their annual salaries. For the years ended March 31, 2016 and 2015, we recognized compensation expense of $0.1 million and $0.1 million, respectively, related to these contributions. There was no compensation expense associated with these contributions for the period ended March 31, 2014.
22. Shareholder Rights Plan
On December 21, 2015, our Board of Directors declared a dividend of one preferred share purchase right (a "Right") for each share of our common stock outstanding on December 31, 2015. Each Right is attached to and trades with the associated share of common stock. The Rights will become exercisable only if a person or group has acquired 15% or more of our outstanding common stock or announces a tender offer or exchange offer which, if consummated, would result in ownership by a person or group of 15% or more of our outstanding common stock (an "Acquiring Person"). If a person becomes an Acquiring Person, each Right will entitle its holder (other than an Acquiring Person and certain related parties) to purchase for $60 a number of shares of our common stock having a market value of twice such price. In addition, at any time after a person or group acquires 15% or more of our outstanding common stock (unless such person or group acquires 50% or more), our Board of Directors may exchange one share of our common stock for each outstanding Right (other than Rights owned by the Acquiring Person and certain related parties, which would have become void). Any person who, prior to the time of public announcement of the existence of the Rights, beneficially owned 15% or more of our outstanding common stock is not considered to be an Acquiring Person so long as such person does not acquire additional shares in excess of certain limitations.
The Rights will expire on December 20, 2018; provided that if our shareholders have not ratified the shareholder rights plan by December 20, 2016, the shareholder rights plan will expire on December 20, 2016.
23. Earnings Per Share (“EPS”)
Basic EPS represents net income attributable to common shareholders divided by the weighted average number of common shares outstanding during the measurement period. Our restricted stock shares include rights to receive
F-30
dividends that are subject to the risk of forfeiture if service requirements are not satisfied, thus these shares are not considered participating securities and are excluded from the basic weighted-average shares outstanding calculation. Diluted EPS represent net income attributable to common shareholders divided by the weighted average number of common shares outstanding during the measurement period while also giving effect to all potentially dilutive common shares that were outstanding during the period.
The calculations of basic and diluted EPS for the periods presented were as follows:
|
|
|
|
Year ended |
|
Year ended |
|
|
July 1, 2013 (inception) |
|
||
|
(In U.S. dollars except share data) |
|
|
March 31, 2016 |
|
March 31, 2015 |
|
March 31, 2014 |
|
|||
|
Numerator: |
|
|
|
|
|
|
|
|
|
|
|
|
Net income |
|
|
$ |
129,688,382 |
|
$ |
25,260,782 |
|
$ |
2,833,843 |
|
|
Denominator: |
|
|
|
|
|
|
|
|
|
|
|
|
Basic weighted average number of common shares outstanding |
|
|
|
56,657,570 |
|
|
56,183,707 |
|
|
32,075,897 |
|
|
Effect of dilutive restricted stock |
|
|
|
49,524 |
|
|
— |
|
|
— |
|
|
Diluted weighted average number of common shares outstanding |
|
|
|
56,707,094 |
|
|
56,183,707 |
|
|
32,075,897 |
|
|
EPS: |
|
|
|
|
|
|
|
|
|
|
|
|
Basic |
|
|
$ |
2.29 |
|
$ |
0.45 |
|
$ |
0.09 |
|
|
Diluted |
|
|
$ |
2.29 |
|
$ |
0.45 |
|
$ |
0.09 |
|
For the year ended March 31, 2016, there were 655,000 shares of unvested restricted stock excluded from the calculation of diluted EPS because the effect of their inclusion would be anti-dilutive. There were no shares of unvested restricted stock excluded from the calculation of diluted EPS for the year ended March 31, 2015 or for the period ended March 31, 2014.
24. Selected Quarterly Financial Information (unaudited)
The following tables summarize the 2016 and 2015 quarterly results:
|
|
|
Three months ended |
|
Three months ended |
|
Three months ended |
|
Three months ended |
|
||||
|
|
|
June 30, 2015 |
|
September 30, 2015 |
|
December 31, 2015 |
|
March 31, 2016 |
|
||||
|
|
|
|
|
|
|
|
|
|
|
|
|
|
|
|
Revenues |
|
$ |
35,642,460 |
|
$ |
74,946,432 |
|
$ |
93,283,708 |
|
$ |
85,335,229 |
|
|
Operating income |
|
|
13,571,687 |
|
|
48,743,550 |
|
|
54,011,305 |
|
|
42,088,645 |
|
|
Net income |
|
$ |
13,652,883 |
|
$ |
41,213,264 |
|
$ |
54,661,323 |
|
$ |
20,160,912 |
|
|
Earnings per common share, basic and diluted |
|
$ |
0.24 |
|
$ |
0.72 |
|
$ |
0.97 |
|
$ |
0.36 |
|
|
|
|
Three months ended |
|
Three months ended |
|
Three months ended |
|
|
Three months ended |
||||
|
|
|
June 30, 2014 |
|
September 30, 2014 |
|
December 31, 2014 |
|
|
March 31, 2015 |
||||
|
|
|
|
|
|
|
|
|
|
|
|
|
|
|
|
Revenues |
|
$ |
15,853,840 |
|
$ |
20,358,211 |
|
$ |
32,583,990 |
|
$ |
35,333,108 |
|
|
Operating income |
|
|
5,200,271 |
|
|
3,476,450 |
|
|
10,825,590 |
|
|
10,587,098 |
|
|
Net income |
|
$ |
3,667,249 |
|
$ |
3,768,677 |
|
$ |
8,996,605 |
|
$ |
8,828,251 |
|
|
Earnings per common share, basic and diluted |
|
$ |
0.07 |
|
$ |
0.07 |
|
$ |
0.16 |
|
$ |
0.15 |
|
25. Subsequent Events
During April and May 2016, we repurchased and held 497,900 common shares as treasury shares for $5.0 million.
F-31
REPORT OF INDEPENDENT REGISTERED PUBLIC ACCOUNTING FIRM
To the Board of Directors and Shareholders
of the Predecessor Businesses of Dorian LPG Ltd:
We have audited the accompanying combined statements of operations, owners' equity, and cash flows for the period April 1, 2013 to July 28, 2013. The combined financial statements include the accounts of the companies as defined in Note 1 to the Company's accompanying financial statements (hereinafter collectively referred to as the "Company"). These companies are under common management. These combined financial statements are the responsibility of the companies' management. Our responsibility is to express an opinion on these combined financial statements based on our audit.
We conducted our audit in accordance with the standards of the Public Company Accounting Oversight Board (United States). Those standards require that we plan and perform the audit to obtain reasonable assurance about whether the financial statements are free of material misstatement. The companies are not required to have, nor were we engaged to perform, an audit of its internal control over financial reporting. Our audit included consideration of internal control over financial reporting as a basis for designing audit procedures that are appropriate in the circumstances, but not for the purpose of expressing an opinion on the effectiveness of the companies' internal control over financial reporting. Accordingly, we express no such opinion. An audit also includes examining, on a test basis, evidence supporting the amounts and disclosures in the financial statements, assessing the accounting principles used and significant estimates made by management, as well as evaluating the overall financial statement presentation. We believe that our audit provides a reasonable basis for our opinion.
In our opinion, such combined financial statements present fairly, in all material respects, the combined results of operations of the Predecessor Businesses of Dorian LPG Ltd. and their combined cash flows for the period April 1, 2013 to July 28, 2013, in conformity with accounting principles generally accepted in the United States of America.
/s/ Deloitte Hadjipavlou Sofianos & Cambanis S.A.
Athens, Greece
July 29, 2014
F-32
Predecessor Businesses of Dorian LPG Ltd.
Combined statements of operations
For the period April 1, 2013 to July 28, 2013
(Expressed in United States Dollars)
|
|
|
April 1, 2013 to |
|
|
|
|
|
July 28, 2013 |
|
|
|
Revenues |
|
$ |
15,383,116 |
|
|
Expenses |
|
|
|
|
|
Voyage expenses |
|
|
3,623,872 |
|
|
Voyage expenses—related party |
|
|
198,360 |
|
|
Vessel operating expenses |
|
|
4,638,725 |
|
|
Management fees—related party |
|
|
601,202 |
|
|
Depreciation and amortization |
|
|
3,955,309 |
|
|
General and administrative expenses |
|
|
28,204 |
|
|
Total expenses |
|
|
13,045,672 |
|
|
Operating income |
|
|
2,337,444 |
|
|
Other income/(expenses) |
|
|
|
|
|
Interest and finance costs |
|
|
(762,815) |
|
|
Interest income |
|
|
98 |
|
|
Gain on derivatives, net |
|
|
2,830,205 |
|
|
Foreign currency loss, net |
|
|
(5) |
|
|
Total other income/(expenses), net |
|
|
2,067,483 |
|
|
Net income |
|
$ |
4,404,927 |
|
The accompanying notes are an integral part of these combined financial statements.
F-33
Predecessor Businesses of Dorian LPG Ltd.
Combined statements of owners’ equity
For the period April 1, 2013 to July 28, 2013
(Expressed in United States Dollars)
|
|
|
Owners' |
|
Accumulated |
|
|
|
|||
|
|
|
capital |
|
deficit |
|
Total |
|
|||
|
Balance, April 1, 2013 |
|
$ |
73,880,910 |
|
|
(61,123,120) |
|
$ |
12,757,790 |
|
|
Net income for the period |
|
|
— |
|
|
4,404,927 |
|
|
4,404,927 |
|
|
Balance, July 28, 2013 |
|
$ |
73,880,910 |
|
$ |
(56,718,193) |
|
$ |
17,162,717 |
|
The accompanying notes are an integral part of these combined financial statements.
F-34
Predecessor Businesses of Dorian LPG Ltd.
Combined statements of cash flows
For the period April 1, 2013 to July 28, 2013
(Expressed in United States Dollars)
|
|
|
April 1, 2013 to |
|
|
|
|
|
July 28, 2013 |
|
|
|
Cash flows from operating activities: |
|
|
|
|
|
Net income |
|
$ |
4,404,927 |
|
|
Adjustments to reconcile net income |
|
|
|
|
|
to net cash provided by operating activities: |
|
|
|
|
|
Depreciation and amortization |
|
|
3,955,309 |
|
|
Amortization of financing costs |
|
|
15,437 |
|
|
Unrealized (loss) on derivatives |
|
|
(4,684,006) |
|
|
Changes in assets and liabilities: |
|
|
|
|
|
Trade receivables |
|
|
(3,431,789) |
|
|
Prepaid expenses and other receivables |
|
|
8,646 |
|
|
Due from related parties |
|
|
853,214 |
|
|
Inventories |
|
|
415,631 |
|
|
Trade accounts payable |
|
|
759,262 |
|
|
Accrued expenses and other liabilities |
|
|
(336,312) |
|
|
Due to related parties |
|
|
2,710,151 |
|
|
Payment for drydocking costs |
|
|
— |
|
|
Net cash from operating activities |
|
|
4,670,470 |
|
|
Cash flows from investing activities: |
|
|
|
|
|
Payments for vessel improvements |
|
|
(90,492) |
|
|
Net cash used in investing activities |
|
|
(90,492) |
|
|
Cash flows from financing activities: |
|
|
|
|
|
Repayment of long‑term debt |
|
|
(5,606,000) |
|
|
Net cash used in financing activities |
|
|
(5,606,000) |
|
|
Net (decrease) in cash and cash equivalents |
|
|
(1,026,022) |
|
|
Cash and cash equivalents at the beginning of the period |
|
|
1,041,644 |
|
|
Cash and cash equivalents at the end of the period |
|
$ |
15,622 |
|
|
Supplemental disclosure of cash flow information |
|
|
|
|
|
Cash paid during the period for interest |
|
$ |
1,002,958 |
|
The accompanying notes are an integral part of the combined financial statements.
F-35
Predecessor Businesses of Dorian LPG Ltd.
Notes to combined financial statements
(Expressed in United States Dollars)
1. Basis of Presentation and General Information
The accompanying combined financial statements include the accounts of entities listed below (collectively, the “Owning Companies” or “Company” or “Predecessor”). The Owning Companies have been presented on a combined basis, as they had common board of directors who functioned as the executive management and made all significant management decisions throughout the periods presented. In order to present the track record of this management team the entities are presented in a single combined set of financial statements.
|
|
|
Date of |
|
Type of |
|
|
|
|
|
|
|
|
Vessel owning Company |
|
incorporation |
|
vessel(3) |
|
Vessel's name |
|
Built |
|
CBM(2) |
|
|
Cepheus Transport Ltd. (Cepheus) (1) |
|
March 17, 2004 |
|
VLGC |
|
Captain Nicholas ML |
|
2008 |
|
82,000 |
|
|
Lyra Gas Transport Ltd (Lyra) (1) |
|
January 30, 2005 |
|
VLGC |
|
Captain John NP |
|
2007 |
|
82,000 |
|
|
Cetus Transport Ltd. (Cetus) (1) |
|
January 27, 2004 |
|
VLGC |
|
Captain Markos NL |
|
2006 |
|
82,000 |
|
|
Orion Tankers Limited (Orion) (1) |
|
October 26, 2005 |
|
PGC |
|
Grendon |
|
1996 |
|
5,000 |
|
|
(1) |
Incorporated in Republic of Liberia. |
|
(2) |
CBM: Cubic meters, a standard measure for LPG tanker capacity. |
|
(3) |
Very Large Gas Carrier (“VLGC”), Pressurized Gas Carrier (“PGC”) |
The Owning Companies are engaged in providing international seaborne transportation services of liquefied petroleum gas (LPG) worldwide through the ownership of LPG tankers to LPG producers and users. The Owning Companies’ vessels are managed by Dorian (Hellas) S.A.‑Panama (the “Manager”), a related party. The Manager is a company incorporated in Panama and has a registered branch in Greece, established in 1974 under the provisions of Law 89/1967, 378/1968 and article 25 of law 27/75, as amended by article 4 of law 2234/94.
The following charterers individually accounted for more than 10% of the Company’s revenues as follows:
|
|
% of revenue |
|
|
|
|
Charterer |
April 1, 2013 |
|
|
|
|
|
to July 28, 2013 |
|
|
|
|
Statoil Hydro ASA |
|
49 |
% |
|
|
Petredec Ltd. |
|
18 |
% |
|
|
E1Corp. |
|
19 |
% |
|
|
Astomos Energy Corporation |
|
12 |
% |
|
2. Significant Accounting Policies
(a)Principles of combination: The accompanying combined financial statements have been prepared in accordance with accounting principles generally accepted in the United States of America (“U.S. GAAP”) and include the accounts and operating results of the legal entities comprising the Owning Companies as discussed in Note 1, which were all under common management. The combined statements represent an aggregation of the U.S. GAAP financial information of the entities comprising the Owning Companies. All intercompany balances and transactions have been eliminated upon combination.
(b)Use of estimates: The preparation of the Predecessor combined financial statements in conformity with U.S. GAAP requires management to make estimates and assumptions that affect the reported amounts of assets and liabilities and disclosure of contingent assets and liabilities at the date of the financial statements and the reported amounts of revenues and expenses during the reporting period. Actual results could differ from those estimates.
(c)Other comprehensive income/(loss): The Company follows the accounting guidance relating to Comprehensive Income, which requires separate presentation of certain transactions that are recorded directly as components of
F-36
stockholders’ equity. The Company has no other comprehensive income/(loss) and accordingly, comprehensive income/(loss) equals net income/(loss) for the periods presented.
(d)Foreign currency translation: The functional currency of the Company is the U.S. Dollar. Each foreign currency transaction is measured and recorded in the functional currency using the exchange rate in effect at the date of the transaction. As of the balance sheet date, monetary assets and liabilities that are denominated in a currency other than the functional currency are adjusted to reflect the exchange rate at the balance sheet date and any gains or losses are included in the combined statement of operations.
(e)Cash and cash equivalents: The Company considers highly liquid investments such as time deposits and certificates of deposit with an original maturity of three months or less to be cash equivalents.
(f)Trade receivables (net): Trade receivables (net), reflect receivables from vessel charters, net of an allowance for doubtful accounts. At each balance sheet date, all potentially uncollectible accounts are assessed individually for purposes of determining the appropriate provision for doubtful accounts. No allowance for doubtful accounts was recorded for the periods presented.
(g)Inventories: Inventories consist of bunkers on board the vessels when vessels are unemployed or are operating under voyage charters and lubricants and stores on board the vessels. Inventories are stated at the lower of cost or market. Cost is determined by the first in, first out method.
(h)Vessels: Vessels are stated at cost, less accumulated depreciation. The cost of the vessels consists of the contract price, less discounts, plus any direct expenses incurred upon acquisition, including improvements, commission paid, delivery expenses and other expenditures to prepare the vessel for her initial voyage. The cost of vessels constructed includes financing costs incurred during the construction period. Subsequent expenditures for conversions and major improvements are also capitalized when they appreciably extend the life, increase the earning capacity or improve the efficiency or safety of the vessels. Repairs and maintenance are expensed as incurred.
(i)Impairment of long‑lived assets: The Company reviews their vessels “held and used” for impairment whenever events or changes in circumstances indicate that the carrying amount of the assets may not be recoverable. When the estimate of future undiscounted cash flows, excluding interest charges, expected to be generated by the use of the asset is less than its carrying amount, the asset is evaluated for an impairment loss. Measurement of the impairment loss is based on the fair value of the asset. In this respect, management regularly reviews the carrying amount of the vessels in connection with the estimated recoverable amount for each of the Company’s vessels.
(j)Vessel depreciation: Depreciation is computed using the straight‑line method over the estimated useful life of the vessels, after considering the estimated salvage value. Each vessel’s salvage value is equal to the product of its lightweight tonnage and estimated scrap rate, which is estimated to be $400 per lightweight ton. Management of the Owning Companies estimates the useful life of its vessels to be 20 years from the date of initial delivery from the shipyard for VLGC’s and 25 years for PGC vessels. Secondhand vessels are depreciated from the date of their acquisition through their remaining estimated useful life.
(k)Drydocking and special survey costs: Drydocking and special survey costs are accounted under deferral method whereby actual costs incurred are deferred and are amortized on a straight‑line basis over the period through the date the next survey is scheduled to become due. We are required to drydock a vessel once every five years until it reaches 15 years of age, after which we are required to drydock the applicable vessel every two and one‑half years. Costs deferred are limited to actual costs incurred at the yard and parts used in the drydocking or special survey. Costs deferred include expenditures incurred relating to shipyard costs, hull preparation and painting, inspection of hull structure and mechanical components, steelworks, machinery works, and electrical works. If a survey is performed prior to the scheduled date, the remaining unamortized balances are immediately written off. Unamortized balances of vessels that are sold are written‑off and included in the calculation of the resulting gain or loss in the period of the vessel’s sale. The amortization charge is presented within “Depreciation and amortization” in the combined statements of operations.
F-37
(l)Financing costs: Financing fees incurred for obtaining new loans and credit facilities are deferred and amortized to interest expense over the respective loan or credit facility using the effective interest rate method. Any unamortized balance of costs relating to loans repaid or refinanced is expensed in the period the repayment or refinancing is made, subject to the accounting guidance regarding debt extinguishment. Any unamortized balance of costs related to credit facilities repaid is expensed in the period. Any unamortized balance of costs relating to credit facilities refinanced are deferred and amortized over the term of the respective credit facility in the period the refinancing occurs, subject to the provisions of the accounting guidance relating to debt extinguishment. The unamortized financing costs are reflected in Deferred Charges in the accompanying combined balance sheets.
(m)Revenue and expenses: Revenue is recognized when an agreement exists, the vessel is made available to the charterer or services are provided, the charter hire is determinable and collection of the related revenue is reasonably assured.
Time charter revenue: Time charter revenues are recorded ratably over the term of the charter as service is provided. Time charter revenues received in advance of the provision of charter service are recorded as deferred income and recognized when the charter service is rendered. Accrued revenue results from straight‑line revenue recognition in respect of charter agreements that provide for varying charter rates. Deferred income and accrued revenue amounts that will be recognized within the next twelve months are presented as current, with amounts to be recognized thereafter presented as non‑current. Revenues earned through the profit sharing arrangements in the time charters represent contingent rental revenues that are recognized when earned and amounts are reasonably assured based on estimates provided by the charterer.
Voyage charter revenue: Under a voyage charter, the revenues are recognized on a pro‑rata basis over the duration of the voyage determined on a discharge-to-discharge port basis but the Company does not begin recognizing revenue until a charter has been agreed to by the customer and the Company, even if the vessel has discharged its cargo and is sailing to the anticipated load port for its next voyage. In the event a vessel is sold while a voyage is in progress, the revenue recognized is based on an allocation formula agreed between the buyer and the seller. Demurrage income represents payments by the charterer to the vessel owner when loading or discharging time exceeds the stipulated time in the voyage charter and is recognized when earned and collection is reasonably assured. Despatch expense represents payments by the Company to the charterer when loading or discharging time is less than the stipulated time in the voyage charter and is recognized as incurred.
Commissions: Charter hire commissions to brokers or the Manager are deferred and amortized over the related charter period and are included in Voyage expenses.
Vessel operating expenses: Vessel operating expenses are accounted for as incurred on the accrual basis. Vessel operating expenses include crew wages and related costs, the cost of insurance, expenses relating to repairs and maintenance, the cost of spares and consumable stores, and other miscellaneous expenses.
(n)Repairs and maintenance: All repair and maintenance expenses, including underwater inspection costs are expensed in the period incurred. Such costs are included in Vessel operating expenses.
(o)Segment reporting: Each of the Owning Company’s vessels serve the same type of customer, have similar operations and maintenance requirements, operate in the same regulatory environment, and are subject to similar economic characteristics. Based on this, the Company has determined that it operates in one reportable segment, the international transportation of liquid petroleum gas with its fleet of vessels. Furthermore, when the Company charters a vessel to a charterer, the charterer is free to trade the vessel worldwide and, as a result, the disclosure of geographic information is impracticable.
F-38
(p)Derivative Instruments: The Company enters into interest rate swap agreements to manage its exposure to fluctuations of interest rate risk associated with its borrowings. All derivatives are recognized in the combined financial statements at their fair value, as either a derivative asset or a liability. The fair value of the interest rate derivatives is based on a discounted cash flow analysis. When such derivatives do not qualify for hedge accounting, the Company recognizes their fair value changes in current period earnings.
(q)Fair value of financial instruments: In accordance with the requirements of accounting guidance relating to Fair Value Measurements, the Company classifies and discloses its assets and liabilities carried at fair value in one of the following three categories:
|
Level 1: |
|
Quoted market prices in active markets for identical assets or liabilities |
|
||
|
Level 2: |
|
Observable market based inputs or unobservable inputs that are corroborated by market data |
|
||
|
Level 3: |
|
Unobservable inputs that are not corroborated by market data. |
|
||
(r)Recent accounting pronouncements: There are no recent accounting pronouncements the adoption of which would have a material effect on the Company’s combined financial statements in the current period or expected to have an impact on future periods.
3. Transactions with Related Parties
Dorian (Hellas) S.A:
Ship‑Owning Companies Management Agreements: The Owning Companies historically outsourced the technical, crew and commercial management as well as insurance and accounting services of the vessels to Dorian (Hellas) S.A., pursuant to management agreements (“Management Agreements”) with each vessel owning subsidiary. These agreements had an initial term of 12 months and thereafter could be terminated by either party giving two months written notice. For each of the periods presented, under the Management Agreements the Manager received for each VLGC and PGC vessel a commission of 1.25% or 2%, respectively, of the gross freight, demurrage, dead freights and charter hire which are due and payable (“charter hire commission”) and a fixed monthly management fee of $40,000 or $32,000 per vessel respectively. In addition, under the Management Agreements, the Manager is entitled to a commission of 1% on the contract price, for any vessel bought or sold.
The following amounts charged by the Manager are included in the combined statement of operations:
|
|
|
April 1, 2013 |
|
|
|
|
|
to July 28, 2013 |
|
|
|
(i) Charter hire commissions , included in Voyage expenses—related party |
|
$ |
198,360 |
|
|
(ii) Management fees |
|
$ |
601,202 |
|
The amounts due to/from related parties represent amounts due to/from the Manager relating to payments made by the Manager on behalf of each of the Owning Companies net of amounts transferred to the Manager.
4. Vessels, Net
|
|
|
|
|
|
Accumulated |
|
Net book |
|
||
|
|
|
Vessel cost |
|
depreciation |
|
value |
|
|||
|
Balance, April 1, 2013 |
|
$ |
252,493,282 |
|
$ |
(65,415,560) |
|
$ |
187,077,722 |
|
|
Vessel improvements |
|
|
90,492 |
|
|
— |
|
|
90,492 |
|
|
Depreciation |
|
|
— |
|
|
(3,839,271) |
|
|
(3,839,271) |
|
|
Balance, July 28, 2013 |
|
$ |
252,583,774 |
|
$ |
(69,254,831) |
|
$ |
183,328,943 |
|
All the Company’s vessels were first‑priority mortgaged as collateral to secure the bank loans.
F-39
The vessel improvements relate to improvements to the vessels and include systems to improve the consumption of the main engines lubricating oil, fuel system modification (double fuel system), and modifications to increase the vessel cargo operation flexibility.
5. Deferred Charges, Net
The deferred charges comprised of the following:
|
|
|
Financing |
|
Drydocking |
|
|
|
|||
|
|
|
costs |
|
costs |
|
Total |
|
|||
|
April 1, 2013 |
|
$ |
262,355 |
|
$ |
949,508 |
|
$ |
1,211,863 |
|
|
Amortization |
|
|
(15,437) |
|
|
(116,038) |
|
|
(131,475) |
|
|
July 28, 2013 |
|
$ |
246,918 |
|
$ |
833,470 |
|
$ |
1,080,388 |
|
6. Owners’ Capital
Each ship owning entity is a body corporate duly organized under the laws of the Republic of Liberia and has an authorized share capital divided into 500 registered and/or bearer shares of no par value, all of which have been issued in the bearer form. The holders of the shares are entitled to one vote on all matters submitted to a vote of owners and to receive all dividends, if any.
|
Ship-owning entity |
|
Date of incorporation |
|
|
Cetus Transport Ltd. |
|
March 17, 2004 |
|
|
Lyra Gas Transport Ltd. |
|
January 30, 2005 |
|
|
Cepheus Transport Ltd. |
|
January 27, 2004 |
|
|
Orion Tankers Limited |
|
October 26,2005 |
|
As discussed in Note 1, the financial statements are comprised of the combined financial information of the entities that comprise the Owning Companies. As a result, the financial statements reflect owners’ capital and not share capital and additional paid in capital of a parent company. Owners’ capital represents contributions from owners. The owners’ capital was used to partly finance the acquisition of the vessels.
7. Revenues
Revenues comprise the following:
|
|
|
April 1, 2013 |
|
|
|
|
|
to July 28, 2013 |
|
|
|
Time charter revenue |
|
$ |
8,850,543 |
|
|
Voyage charter revenue |
|
|
6,236,525 |
|
|
Other income |
|
|
296,048 |
|
|
Total |
|
$ |
15,383,116 |
|
Included in time charter revenue is the profit‑sharing element of the time charter agreements of $2,702,635 for the period April 1, 2013 to July 28, 2013. Other income represents demurrage income and income from charterers relating to expenses such as security guards and additional war risk insurance recovered from the charterers.
F-40
8. Voyage Expenses
Voyage expenses, including voyage expenses—related party, are comprised as follows:
|
|
|
April 1, 2013 |
|
|
|
|
|
to July 28, 2013 |
|
|
|
Brokers commission |
|
$ |
396,720 |
|
|
Bunkers |
|
|
2,755,445 |
|
|
Port charges and other related expenses |
|
|
391,091 |
|
|
Security cost |
|
|
206,940 |
|
|
War risk insurances |
|
|
26,673 |
|
|
Other voyage expenses |
|
|
45,363 |
|
|
Total voyage expenses |
|
$ |
3,822,232 |
|
9. Vessel Operating Expenses
Vessel operating expenses are comprised of the following:
|
|
|
April 1, 2013 |
|
|
|
|
|
to July 28, 2013 |
|
|
|
Crew wages and related costs |
|
$ |
2,519,315 |
|
|
Spares and stores |
|
|
1,284,161 |
|
|
Lubricants |
|
|
176,502 |
|
|
Insurance |
|
|
298,249 |
|
|
Repairs and maintenance costs |
|
|
279,921 |
|
|
Miscellaneous expenses |
|
|
80,577 |
|
|
Total |
|
$ |
4,638,725 |
|
10. Interest and Finance Cost
Interest and finance cost is comprised of $659,832 of interest on long-term debt and $102,983 of other finance costs for the period ended July 28, 2013.
11. Income Taxes
The Owning Companies are incorporated in the Republic of Liberia and under the laws of the Liberia, are not subject to income taxes, however, they are subject to registration and tonnage taxes, which are not income taxes and are included in vessel operating expenses in the accompanying combined statements of operations. Furthermore, the Owning Companies are subject to a 4% United States federal tax in respect of its U.S. source shipping income (imposed on gross income without the allowance for any deductions), which is not an income tax. Such taxes have been recorded within Voyage Expenses in the accompanying combined statements of operations. In many cases, these taxes are recovered from the charterers; such amounts recovered are recorded within Revenues in the accompanying combined statements of operations.
12. Commitments and Contingencies
From time to time the Owning Companies expect to be subject to legal proceedings and claims in the ordinary course of business, principally personal injury and property casualty claims. Such claims, even if lacking in merit, could result in the expenditure of significant financial and managerial resources. The Owning Companies are not aware of any claim, which is reasonably possible and should be disclosed or probable and for which a provision should be established in the accompanying financial statements.
F-41
13. Derivative Instruments
The Owning Companies use interest rate swaps for the management of interest rate risk exposure. The interest rate swaps effectively convert a portion of the Company’s debt from a floating to a fixed rate. To hedge its exposure to changes in interest rates the Company is a party to five floating‑to‑fixed interest rate swaps with RBS covering notional amounts aggregating approximately $136,718,000 as of March 31, 2013.
On March 31, 2005 and April 3, 2007 Cetus Transport Ltd entered into interest rate swap agreements with RBS with effective dates November 21, 2006 and November 17, 2006, respectively, and termination dated November 21, 2018 and November 17, 2018. Under the terms of this arrangement the Company swaps the notional amount outstanding under the agreement from a floating rate of interest to a fixed rate of 5.395% and 4.936% respectively. The original notional amount of $51,140,000 is reduced semi‑annually by $1,278,500 with a final settlement of $20,456,000 due in November, 2018.
On March 9, 2007 and February 7, 2012, Lyra Gas Transport Ltd entered into interest rate swap agreements with RBS with effective dates March 22, 2007 and September 24, 2011, respectively, and termination dated March 22, 2019. Under the terms of this arrangement the Company swaps the notional amount outstanding under the agreement from a floating rate of interest to a fixed rate of 4.772% and 2.960% respectively. The original notional amount of $64,146,313 is reduced semi‑annually by $1,700,000 with a final settlement of $28,900,000 due in March 22, 2019.
On January 8, 2009, Cepheus Transport Ltd entered into an extendable interest rate swap agreement with the RBS with effective date July 21, 2008 and termination dated July 21, 2014. RBS holds the right to extend the interest rate swap until the July 21 2020. Under the terms of this arrangement the Company swaps the notional amount outstanding under the agreement from a floating rate of interest to a fixed rate of 4.35%. The original notional amount of $68,800,000 is reduced semi‑annually by $1,720,000 with a final settlement of $29,240,000 due in July 21, 2020.
The effect of derivative instruments on the combined statements of operations is as follows:
|
|
|
|
|
April 1, 2013 |
|
|
|
Derivatives not designated as hedging instruments |
|
Location of gain/(loss) recognized |
|
to July 28, 2013 |
|
|
|
Interest Rate Swap—Change in fair value |
|
Gain/(loss) on derivatives, net |
|
$ |
4,684,007 |
|
|
Interest Rate Swap—Realized loss |
|
Gain/(loss) on derivatives, net |
|
|
(1,853,802) |
|
|
Loss on derivatives—net |
|
|
|
$ |
2,830,205 |
|
14. Financial Instruments
The principal financial assets of the Company consist of cash and cash equivalents, amounts due from related parties and trade accounts receivable. The principal financial liabilities of the Company consist of long‑term bank loans, interest rate swaps, accounts payable, amounts due to related parties and accrued liabilities.
|
(a) |
Interest rate risk: The Company’s long‑term bank loans are based on LIBOR and hence the Company is exposed to movements in LIBOR. The Company entered into interest rate swap agreements, discussed in Note 13, in order to hedge its variable interest rate exposure. |
|
(b) |
Concentration of credit risk: Financial instruments, which potentially subject the Company to significant concentrations of credit risk, consist principally of trade accounts receivable, amounts due from related parties, cash and cash equivalents. The Company limits its credit risk with accounts receivable by performing ongoing credit evaluations of its customers’ financial condition and generally does not require collateral for its trade accounts receivable. The Company places its cash and cash equivalents, with high credit quality financial institutions. |
|
(c) |
Fair value: The carrying values of trade accounts receivable, amounts due from related parties, cash and cash equivalents, accounts payable, amounts due to related parties and accrued liabilities are reasonable estimates of their fair value due to the short‑term nature of these financial instruments. The fair value of long‑term bank loans approximate the recorded value, due to their variable interest rate, being the LIBOR. LIBOR rates are observable at |
F-42
commonly quoted intervals for the full terms of the loans and hence long‑term bank loans are considered Level 2 items in accordance with the fair value hierarchy. |
The interest rate swaps, discussed in Note 13, are stated at fair value. The fair value of the interest rate swaps is determined using a discounted cash flow approach based on market‑based LIBOR swap yield rates. LIBOR swap rates are observable at commonly quoted intervals for the full terms of the swaps and therefore are considered Level 2 items in accordance with the fair value hierarchy. The fair value of the interest rate swap agreements approximates the amount that the Company would have to pay for the early termination of the agreements.
15. Subsequent Events
On July 29, 2013, the following transactions took place:
|
· |
Cepheus, Lyra and Cetus sold the Captain Nicholas ML, the Captain John NP and the Captain Markos NL to CMNL LPG Transport LLC, CJNP LPG Transport LLC and CNML LPG Transport LLC (being newly created entities of the same shareholders), respectively, which also assumed the related outstanding bank debt and interest rate swaps related to each vessel. |
|
· |
100% interest in CMNL LPG Transport LLC, CJNP LPG Transport LLC and CNML LPG Transport LLC was contributed to Dorian LPG Ltd. in exchange for equity in Dorian LPG Ltd. |
|
· |
The Grendon was sold to Grendon Tanker LLC, a wholly-owned subsidiary of Dorian LPG Ltd. |
F-43