Attached files
| file | filename |
|---|---|
| 8-K - FORM 8-K - TOYOTA MOTOR CREDIT CORP | dp65965_8k.htm |
Exhibit 99.1
Presentation Materials for Investors May 2016
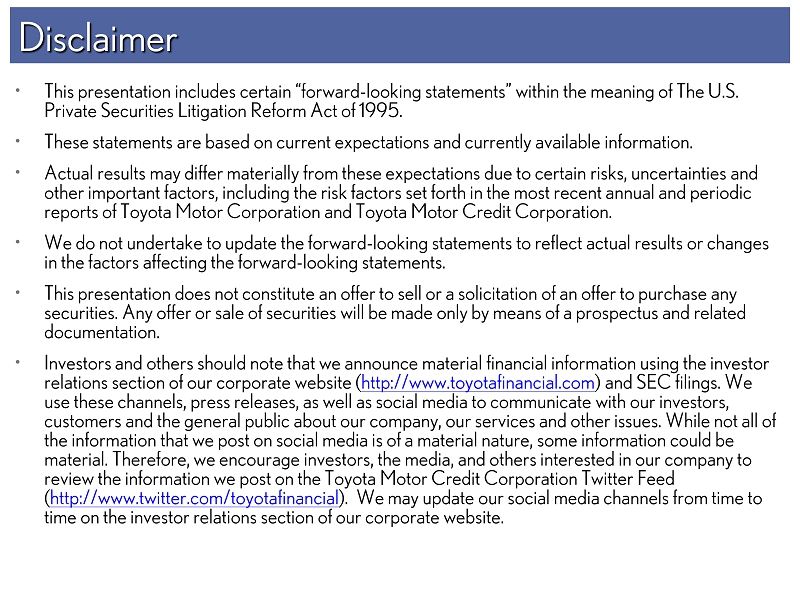
2 Disclaimer • This presentation includes certain “forward - looking statements” within the meaning of The U.S. Private Securities Litigation Reform Act of 1995. • These statements are based on current expectations and currently available information. • Actual results may differ materially from these expectations due to certain risks, uncertainties and other important factors, including the risk factors set forth in the most recent annual and periodic reports of Toyota Motor Corporation and Toyota Motor Credit Corporation. • We do not undertake to update the forward - looking statements to reflect actual results or changes in the factors affecting the forward - looking statements. • This presentation does not constitute an offer to sell or a solicitation of an offer to purchase any securities. Any offer or sale of securities will be made only by means of a prospectus and related documentation. • Investors and others should note that we announce material financial information using the investor relations section of our corporate website ( http://www.toyotafinancial.com ) and SEC filings. We use these channels, press releases, as well as social media to communicate with our investors, customers and the general public about our company, our services and other issues. While not all of the information that we post on social media is of a material nature, some information could be material. Therefore, we encourage investors, the media, and others interested in our company to review the information we post on the Toyota Motor Credit Corporation Twitter Feed ( http://www.twitter.com/toyotafinancial ). We may update our social media channels from time to time on the investor relations section of our corporate website.
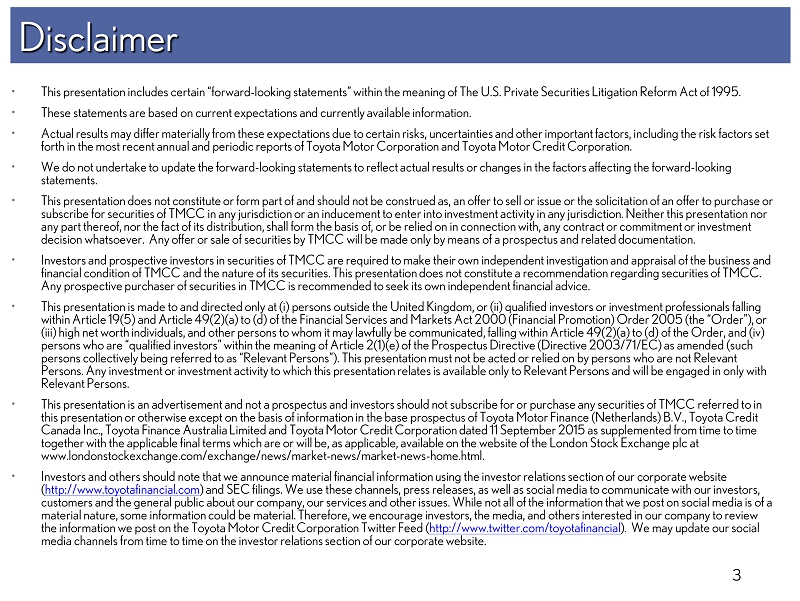
3 Disclaimer • This presentation includes certain “forward - looking statements” within the meaning of The U.S. Private Securities Litigation Ref orm Act of 1995. • These statements are based on current expectations and currently available information. • Actual results may differ materially from these expectations due to certain risks, uncertainties and other important factors, in cluding the risk factors set forth in the most recent annual and periodic reports of Toyota Motor Corporation and Toyota Motor Credit Corporation. • We do not undertake to update the forward - looking statements to reflect actual results or changes in the factors affecting the f orward - looking statements. • This presentation does not constitute or form part of and should not be construed as, an offer to sell or issue or the solici tat ion of an offer to purchase or subscribe for securities of TMCC in any jurisdiction or an inducement to enter into investment activity in any jurisdiction. Nei ther this presentation nor any part thereof, nor the fact of its distribution, shall form the basis of, or be relied on in connection with, any contract or commitment or investment decision whatsoever. Any offer or sale of securities by TMCC will be made only by means of a prospectus and related document ati on. • Investors and prospective investors in securities of TMCC are required to make their own independent investigation and apprai sal of the business and financial condition of TMCC and the nature of its securities. This presentation does not constitute a recommendation regardin g s ecurities of TMCC. Any prospective purchaser of securities in TMCC is recommended to seek its own independent financial advice. • This presentation is made to and directed only at (i) persons outside the United Kingdom, or (ii) qualified investors or investm ent professionals falling within Article 19(5) and Article 49(2)(a) to (d) of the Financial Services and Markets Act 2000 (Financial Promotion) Order 2 005 (the “Order”), or (iii) high net worth individuals, and other persons to whom it may lawfully be communicated, falling within Article 49(2)(a) to (d) of the Order, and (iv) persons who are “qualified investors” within the meaning of Article 2(1)(e) of the Prospectus Directive (Directive 2003/71/EC ) a s amended (such persons collectively being referred to as “Relevant Persons”). This presentation must not be acted or relied on by persons wh o a re not Relevant Persons. Any investment or investment activity to which this presentation relates is available only to Relevant Persons and w ill be engaged in only with Relevant Persons. • This presentation is an advertisement and not a prospectus and investors should not subscribe for or purchase any securities of TMCC referred to in this presentation or otherwise except on the basis of information in the base prospectus of Toyota Motor Finance (Netherlands ) B .V., Toyota Credit Canada Inc., Toyota Finance Australia Limited and Toyota Motor Credit Corporation dated 11 September 2015 as supplemented fro m t ime to time together with the applicable final terms which are or will be, as applicable, available on the website of the London Stock Ex cha nge plc at www.londonstockexchange.com/exchange/news/market - news/market - news - home.html. • Investors and others should note that we announce material financial information using the investor relations section of our cor porate website ( http://www.toyotafinancial.com ) and SEC filings. We use these channels, press releases, as well as social media to communicate with our investors, customers and the general public about our company, our services and other issues. While not all of the information that we p ost on social media is of a material nature, some information could be material. Therefore, we encourage investors, the media, and others interested in o ur company to review the information we post on the Toyota Motor Credit Corporation Twitter Feed ( http://www.twitter.com/toyotafinancial ). We may update our social media channels from time to time on the investor relations section of our corporate website.
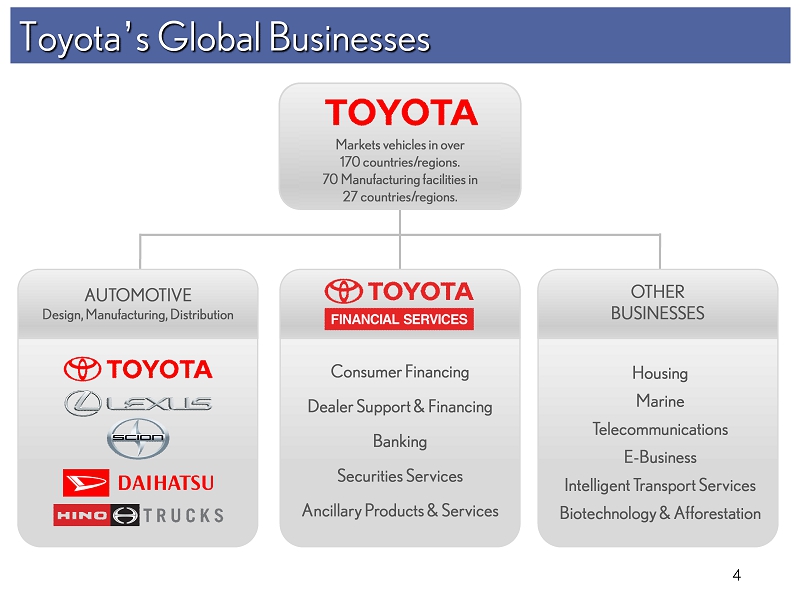
4 Toyota ’ s Global Businesses Markets vehicles in over 170 countries/regions. 70 Manufacturing facilities in 27 countries/regions. OTHER BUSINESSES AUTOMOTIVE Design, Manufacturing, Distribution Consumer Financing Dealer Support & Financing Banking Securities Services Ancillary Products & Services Housing Marine Telecommunications E - Business Intelligent Transport Services Biotechnology & Afforestation
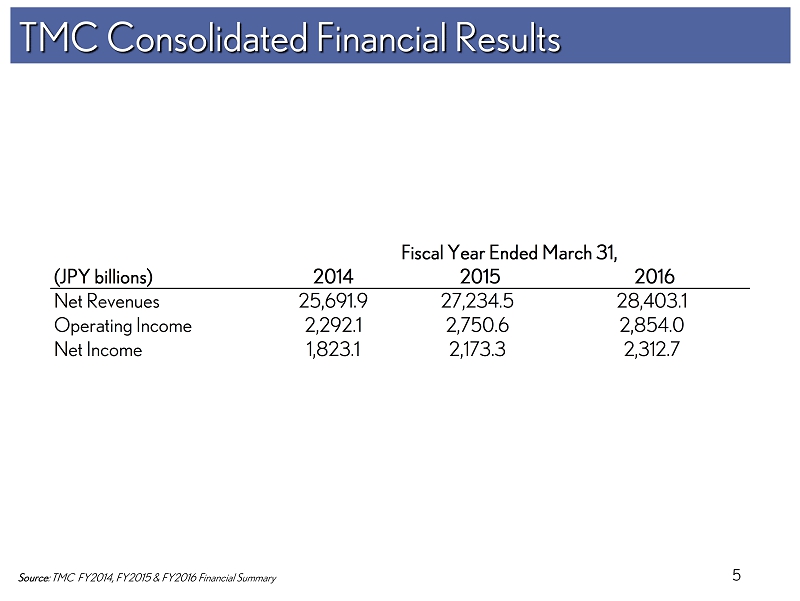
5 TMC Consolidated Financial Results Source : TMC FY2014, FY2015 & FY2016 Financial Summary (JPY billions) 2014 2015 2016 Net Revenues 25,691.9 27,234.5 28,403.1 Operating Income 2,292.1 2,750.6 2,854.0 Net Income 1,823.1 2,173.3 2,312.7 Fiscal Year Ended March 31,
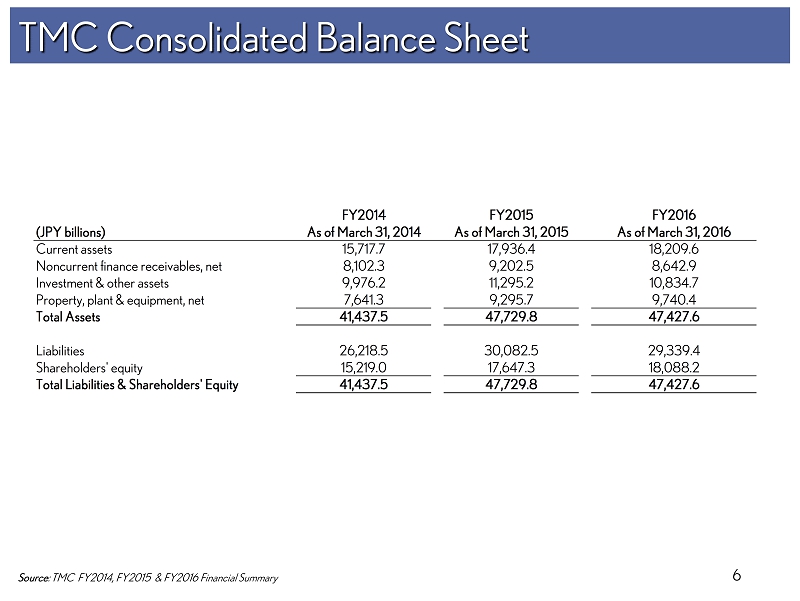
6 TMC Consolidated Balance Sheet Source : TMC FY2014, FY2015 & FY2016 Financial Summary FY2014 FY2015 FY2016 (JPY billions) As of March 31, 2014 As of March 31, 2015 As of March 31, 2016 Current assets 15,717.7 17,936.4 18,209.6 Noncurrent finance receivables, net 8,102.3 9,202.5 8,642.9 Investment & other assets 9,976.2 11,295.2 10,834.7 Property, plant & equipment, net 7,641.3 9,295.7 9,740.4 Total Assets 41,437.5 47,729.8 47,427.6 Liabilities 26,218.5 30,082.5 29,339.4 Shareholders' equity 15,219.0 17,647.3 18,088.2 Total Liabilities & Shareholders' Equity 41,437.5 47,729.8 47,427.6
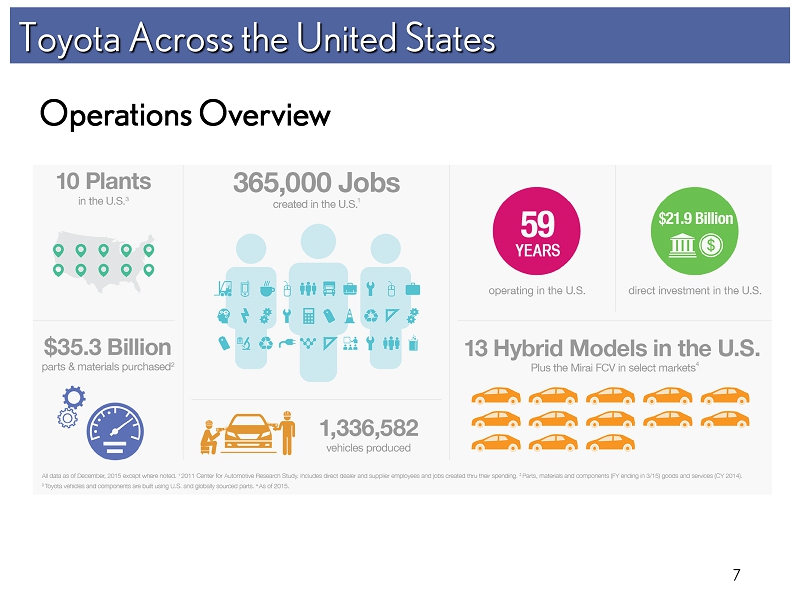
Toyota Across the United States 7 Operations Overview
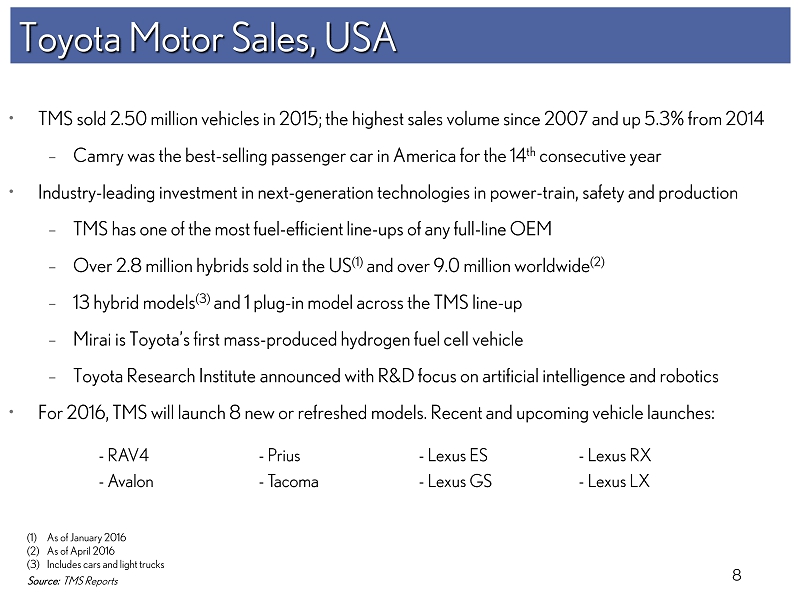
8 • TMS sold 2.50 million vehicles in 2015; the highest sales volume since 2007 and up 5.3% from 2014 – Camry was the best - selling passenger car in America for the 14 th consecutive year • Industry - leading investment in next - generation technologies in power - train, safety and production – TMS has one of the most fuel - efficient line - ups of any full - line OEM – Over 2.8 million hybrids sold in the US (1) and over 9.0 million worldwide (2) – 13 hybrid models (3) and 1 plug - in model across the TMS line - up – Mirai is Toyota’s first mass - produced hydrogen fuel cell vehicle – Toyota Research Institute announced with R&D focus on artificial intelligence and robotics • For 2016, TMS will launch 8 new or refreshed models. Recent and upcoming vehicle launches: Toyota Motor Sales, USA Source: TMS Reports - RAV4 - Prius - Lexus ES - Lexus RX - Avalon - Tacoma - Lexus GS - Lexus LX (1) As of January 2016 (2) As of April 2016 (3) Includes cars and light trucks
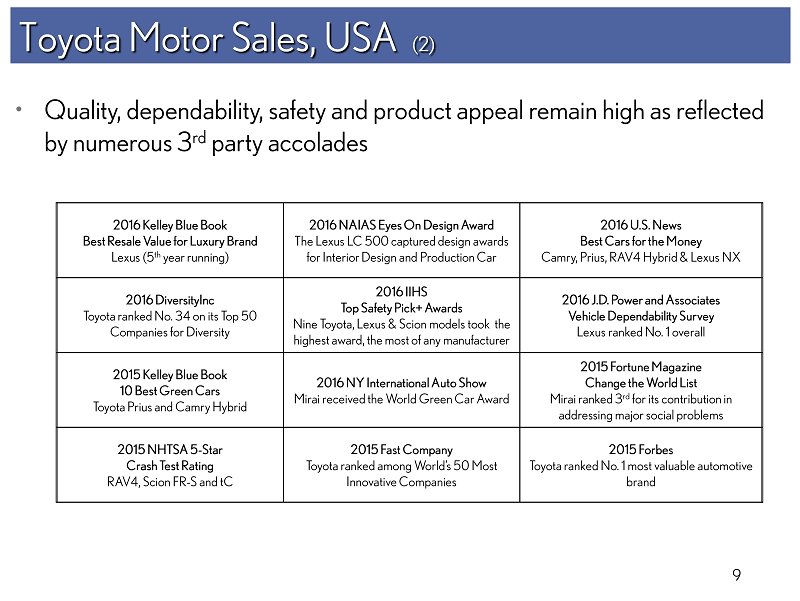
9 Toyota Motor Sales, USA (2) • Qu ality, dependability, safety and product appeal remain high as reflected by numerous 3 rd party accolades 2016 Kelley Blue Book Best Resale Value for Luxury Brand Lexus (5 th year running) 2016 NAIAS Eyes On Design Award The Lexus LC 500 captured design awards for Interior Design and Production Car 2016 U.S. News Best Cars for the Money Camry, Prius, RAV4 Hybrid & Lexus NX 2016 DiversityInc Toyota ranked No. 34 on its Top 50 Companies for Diversity 2016 IIHS Top Safety Pick+ Awards Nine Toyota, Lexus & Scion models took the highest award, the most of any manufacturer 2016 J.D. Power and Associates Vehicle Dependability Survey Lexus ranked No. 1 overall 2015 Kelley Blue Book 10 Best Green Cars Toyota Prius and Camry Hybrid 2016 NY International Auto Show Mirai received the World Green Car Award 2015 Fortune Magazine Change the World List Mirai ranked 3 rd for its contribution in addressing major social problems 2015 NHTSA 5 - Star Crash Test Rating RAV4, Scion FR - S and tC 2015 Fast Company Toyota ranked among World’s 50 Most Innovative Companies 2015 Forbes Toyota ranked No. 1 most valuable automotive brand
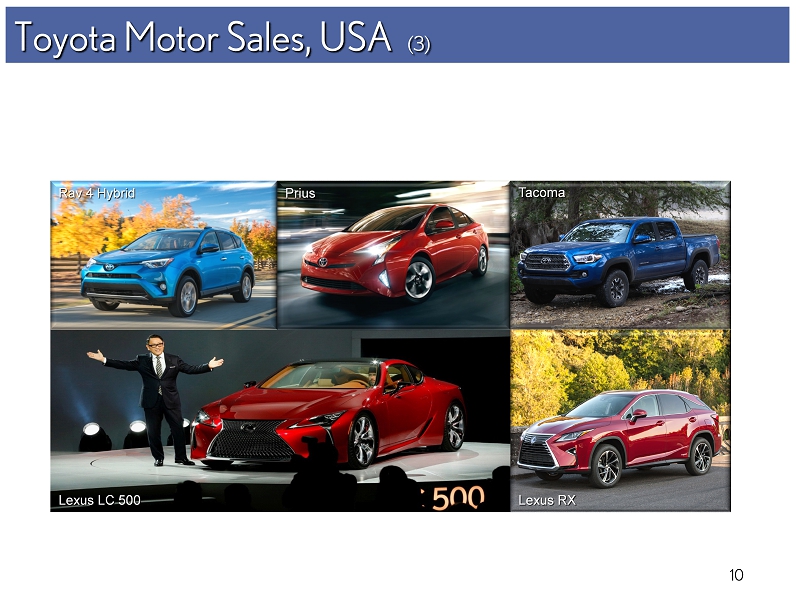
10 Toyota Motor Sales, USA (3) Lexus LC 500 Rav 4 Hybrid Prius Tacoma Lexus RX
11 Toyota Financial Services
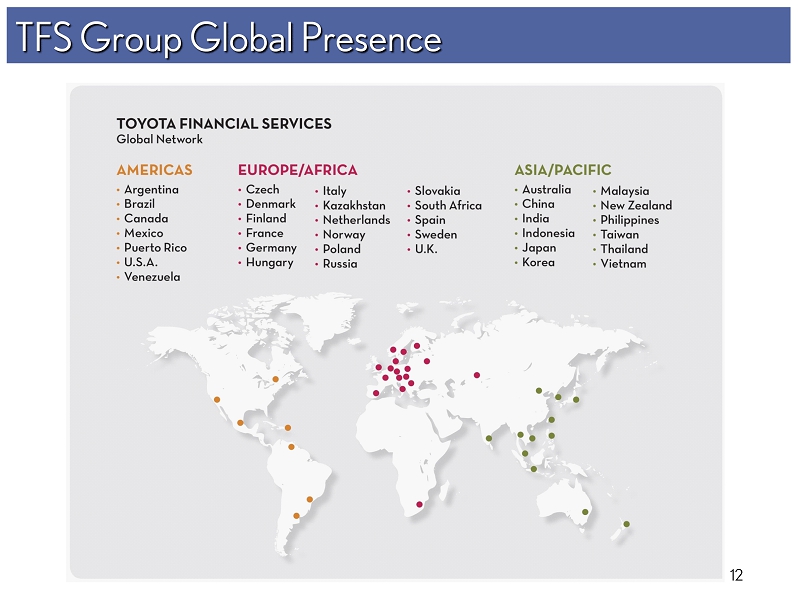
12 TFS Group Global Presence

13 • Over 4.4 million active finance contracts (1) • AA - (2) /Aa3 (2) rated captive finance company by S&P/Moody’s • Credit support agreement structure with TFSC/TMC (3) Toyota Financial Services Corporation (TFSC) Toyota Motor Credit Corporation (TMCC) Toyota Motor Credit Corporation (TMCC) Toyota Motor Corporation (TMC) (1) As of March 2016 (2) Outlook stable (3) The Credit Support Agreements do not apply to securitization transactions
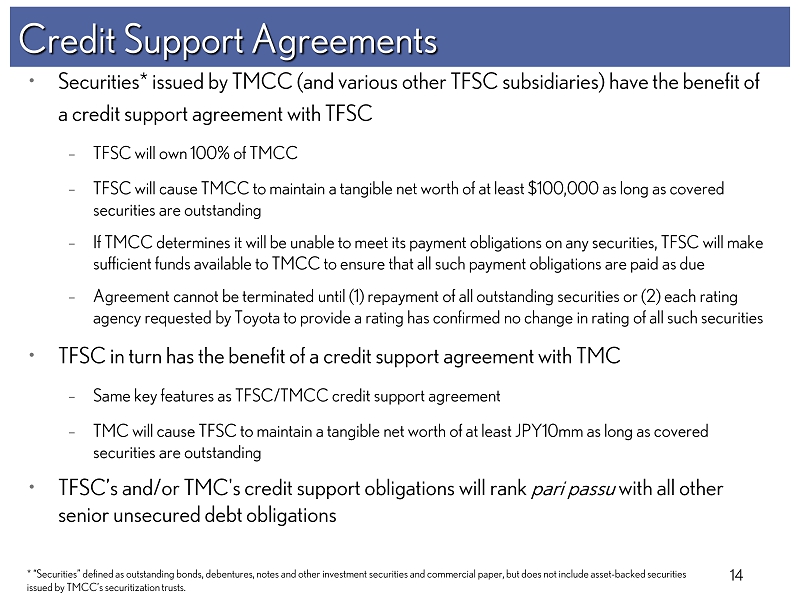
14 Credit Support Agreements • Securities* issued by TMCC (and various other TFSC subsidiaries) have the benefit of a credit support agreement with TFSC – TFSC will own 100% of TMCC – TFSC will cause TMCC to maintain a tangible net worth of at least $100,000 as long as covered securities are outstanding – If TMCC determines it will be unable to meet its payment obligations on any securities, TFSC will make sufficient funds available to TMCC to ensure that all such payment obligations are paid as due – Agreement cannot be terminated until (1) repayment of all outstanding securities or (2) each rating agency requested by Toyota to provide a rating has confirmed no change in rating of all such securities • TFSC in turn has the benefit of a credit support agreement with TMC – Same key features as TFSC/TMCC credit support agreement – TMC will cause TFSC to maintain a tangible net worth of at least JPY10mm as long as covered securities are outstanding • TFSC’s and/or TMC's credit support obligations will rank pari passu with all other senior unsecured debt obligations * “Securities” defined as outstanding bonds, debentures, notes and other investment securities and commercial paper, but does no t include asset - backed securities issued by TMCC’s securitization trusts.
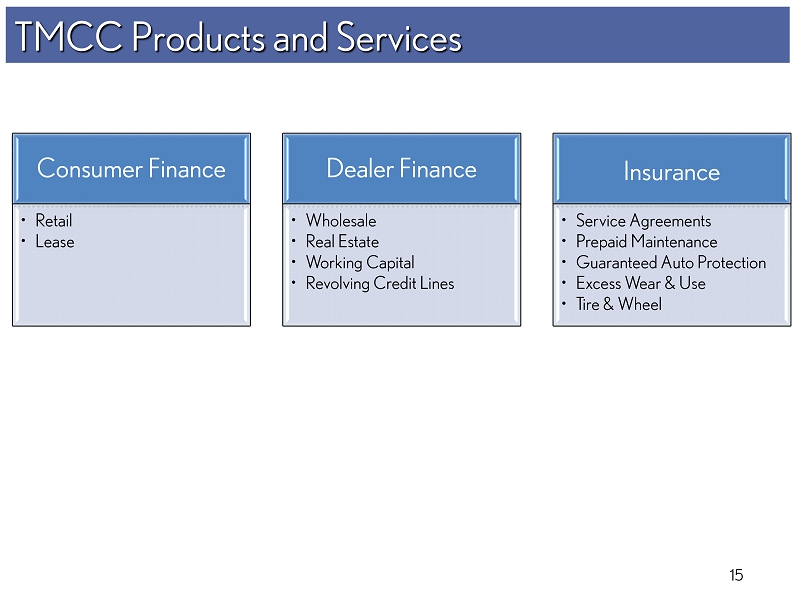
15 TMCC Products and Services Consumer Finance • Retail • Lease Dealer Finance • Wholesale • Real Estate • Working Capital • Revolving Credit Lines Insurance • Service Agreements • Prepaid Maintenance • Guaranteed Auto Protection • Excess Wear & Use • Tire & Wheel
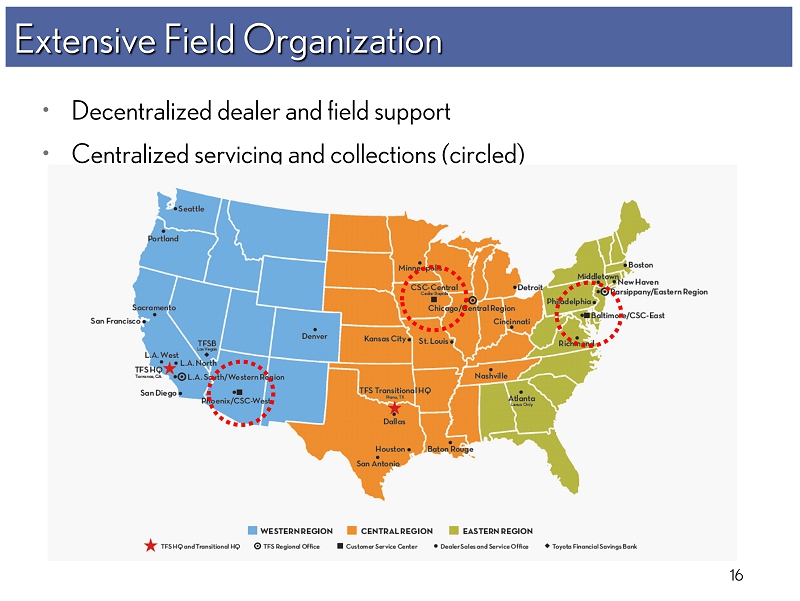
16 Extensive Field Organization • Decentralized dealer and field support • Centralized servicing and collections (circled)
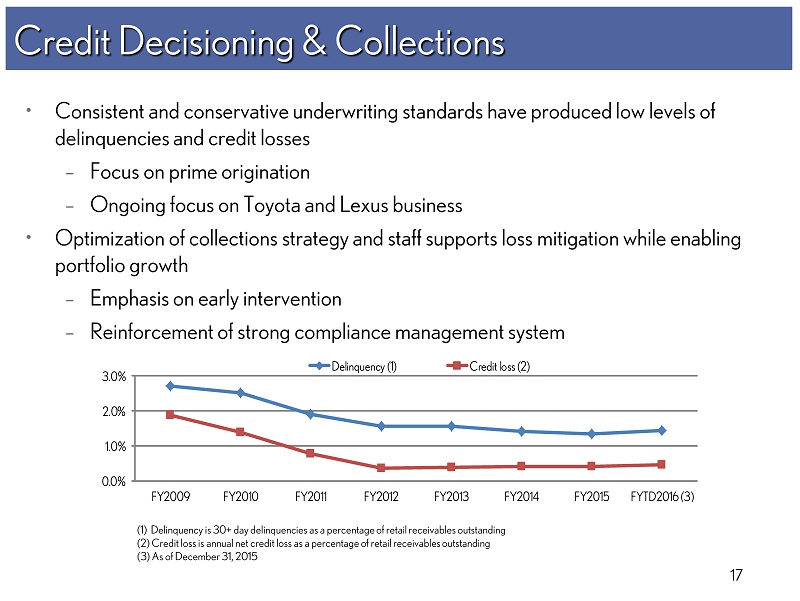
17 • Consistent and conservative underwriting standards have produced low levels of delinquencies and credit losses – Focus on prime origination – Ongoing focus on Toyota and Lexus business • Optimization of collections strategy and staff supports loss mitigation while enabling portfolio growth – Emphasis on early intervention – Reinforcement of strong compliance management system Credit Decisioning & Collections 17 0.0% 1.0% 2.0% 3.0% FY2009 FY2010 FY2011 FY2012 FY2013 FY2014 FY2015 FYTD2016 (3) Delinquency (1) Credit loss (2) (1) Delinquency is 30+ day delinquencies as a percentage of retail receivables outstanding (2) Credit loss is annual net credit loss as a percentage of retail receivables outstanding (3) As of December 31, 2015
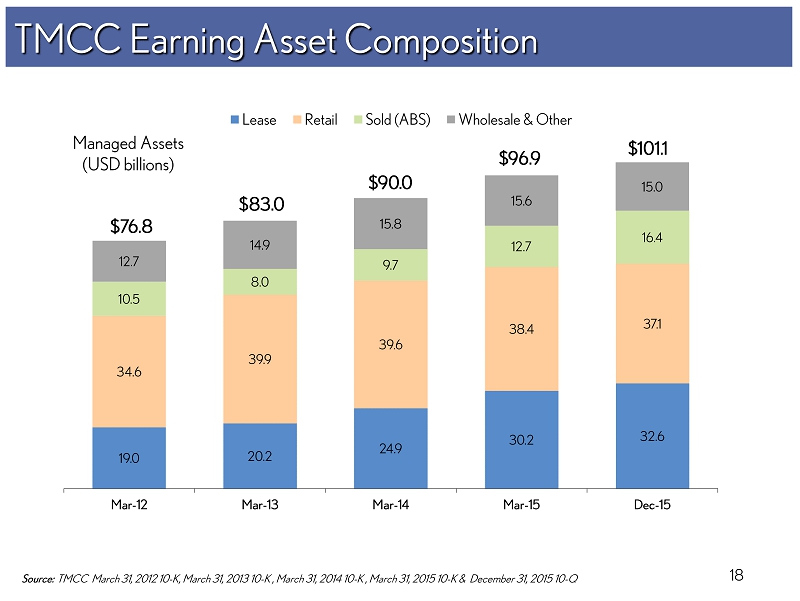
18 TMCC Earning Asset Composition Managed Assets (USD billions) Source: TMCC March 31, 2012 10 - K, March 31, 2013 10 - K , March 31, 2014 10 - K , March 31, 2015 10 - K & December 31, 2015 10 - Q 19.0 20.2 24.9 30.2 32.6 34.6 39.9 39.6 38.4 37.1 10.5 8.0 9.7 12.7 16.4 12.7 14.9 15.8 15.6 15.0 $76.8 $83.0 $90.0 $96.9 $101.1 Mar-12 Mar-13 Mar-14 Mar-15 Dec-15 Lease Retail Sold (ABS) Wholesale & Other
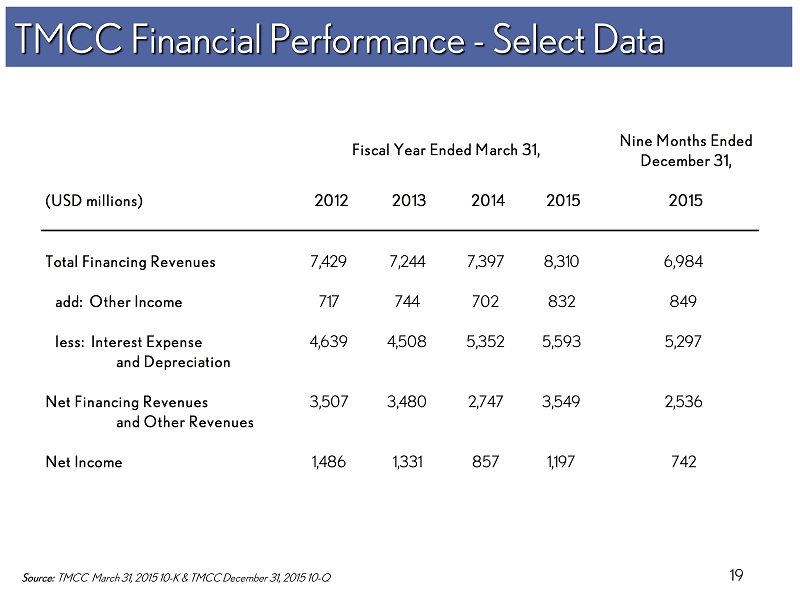
19 TMCC Financial Performance - Select Data Source: TMCC March 31, 2015 10 - K & TMCC December 31, 2015 10 - Q Nine Months Ended December 31, (USD millions) 2012 2013 2014 2015 2015 Total Financing Revenues 7,429 7,244 7,397 8,310 6,984 add: Other Income 717 744 702 832 849 less: Interest Expense 4,639 4,508 5,352 5,593 5,297 and Depreciation Net Financing Revenues 3,507 3,480 2,747 3,549 2,536 and Other Revenues Net Income 1,486 1,331 857 1,197 742 Fiscal Year Ended March 31,
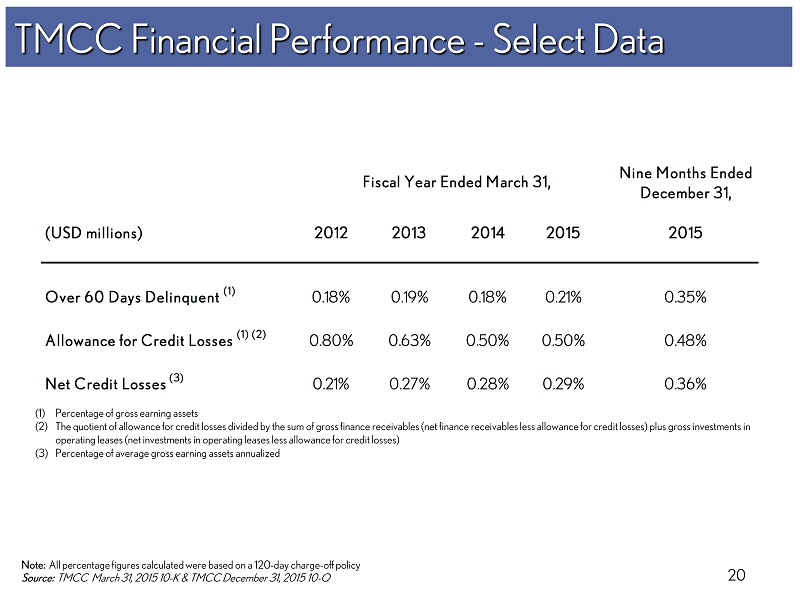
20 TMCC Financial Performance - Select Data (1) Percentage of gross earning assets (2) The quotient of allowance for credit losses divided by the sum of gross finance receivables (net finance receivables less all owa nce for credit losses) plus gross investments in operating leases (net investments in operating leases less allowance for credit losses) (3) Percentage of average gross earning assets annualized Note: All percentage figures calculated were based on a 120 - day charge - off policy Source: TMCC March 31, 2015 10 - K & TMCC December 31, 2015 10 - Q Nine Months Ended December 31, (USD millions) 2012 2013 2014 2015 2015 Over 60 Days Delinquent (1) 0.18% 0.19% 0.18% 0.21% 0.35% Allowance for Credit Losses (1) (2) 0.80% 0.63% 0.50% 0.50% 0.48% Net Credit Losses (3) 0.21% 0.27% 0.28% 0.29% 0.36% Fiscal Year Ended March 31,
21 TMCC Funding Programs
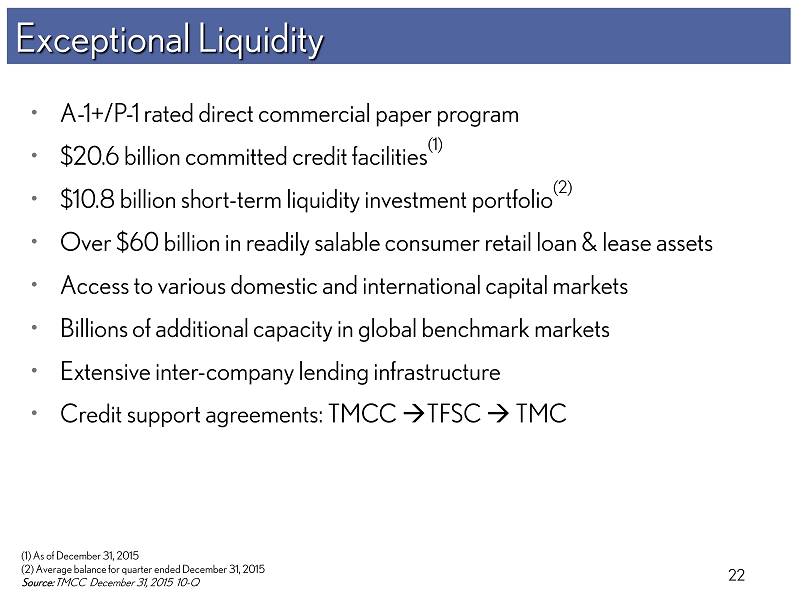
22 • A - 1+/P - 1 rated direct commercial paper program • $20.6 billion committed credit facilities (1) • $10.8 billion short - term liquidity investment portfolio (2) • Over $60 billion in readily salable consumer retail loan & lease assets • Access to various domestic and international capital markets • Billions of additional capacity in global benchmark markets • Extensive inter - company lending infrastructure • Credit support agreements: TMCC TFSC TMC Exceptional Liquidity (1) As of December 31, 2015 (2) Average balance for quarter ended December 31, 2015 Source: TMCC December 31, 2015 10 - Q
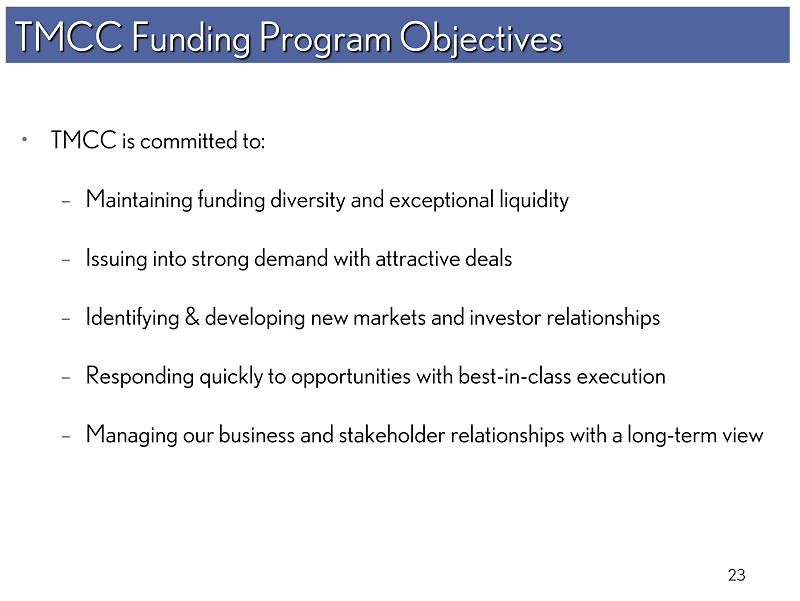
23 • TMCC is committed to: – Maintaining funding diversity and exceptional liquidity – Issuing into strong demand with attractive deals – Identifying & developing new markets and investor relationships – Responding quickly to opportunities with best - in - class execution – Managing our business and stakeholder relationships with a long - term view TMCC Funding Program Objectives
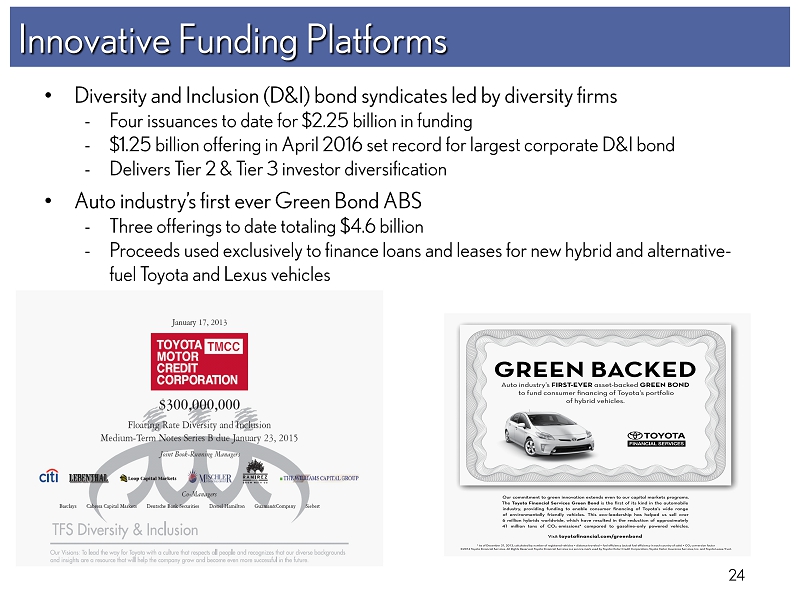
Innovative Funding Platforms 24 • Diversity and Inclusion (D&I) bond syndicates led by diversity firms - Four issuances to date for $2.25 billion in funding - $1.25 billion offering in April 2016 set record for largest corporate D&I bond - Delivers Tier 2 & Tier 3 investor diversification • Auto industry’s first ever Green Bond ABS - Three offerings to date totaling $4.6 billion - Proceeds used exclusively to finance loans and leases for new hybrid and alternative - fuel Toyota and Lexus vehicles
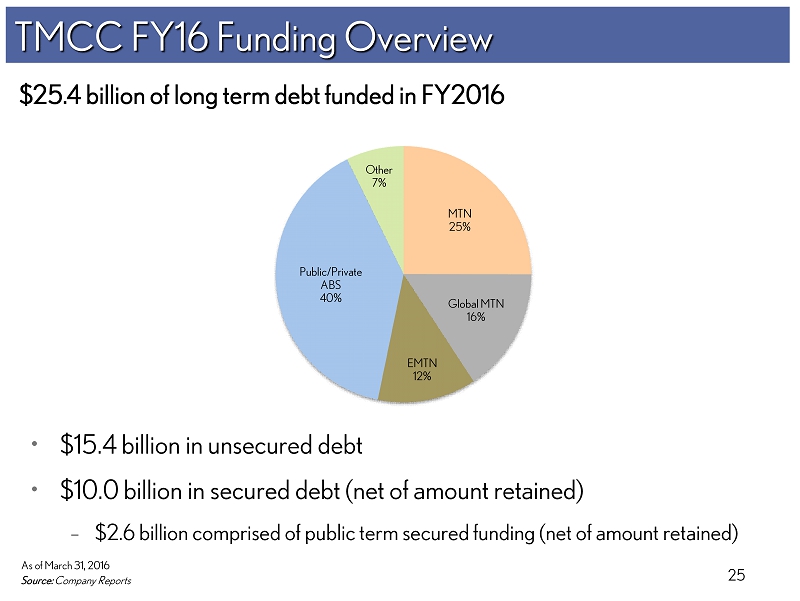
25 • $15.4 billion in unsecured debt • $10.0 billion in secured debt (net of amount retained) – $2.6 billion comprised of public term secured funding (net of amount retained) TMCC FY16 Funding Overview Source: Company Reports $25.4 billion of long term debt funded in FY2016 As of March 31, 2016 MTN 25% Global MTN 16% EMTN 12% Public/Private ABS 40% Other 7%
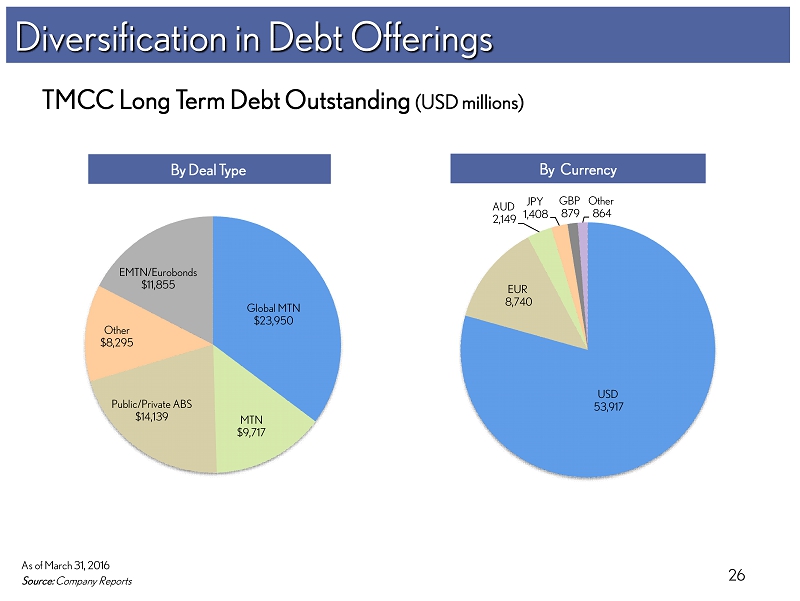
26 TMCC Long Term Debt Outstanding (USD millions) Diversification in Debt Offerings As of March 31, 2016 Source: Company Reports By Deal Type By Currency Global MTN $23,950 MTN $9,717 Public/Private ABS $14,139 Other $8,295 EMTN/Eurobonds $11,855 USD 53,917 EUR 8,740 AUD 2,149 JPY 1,408 GBP 879 Other 864
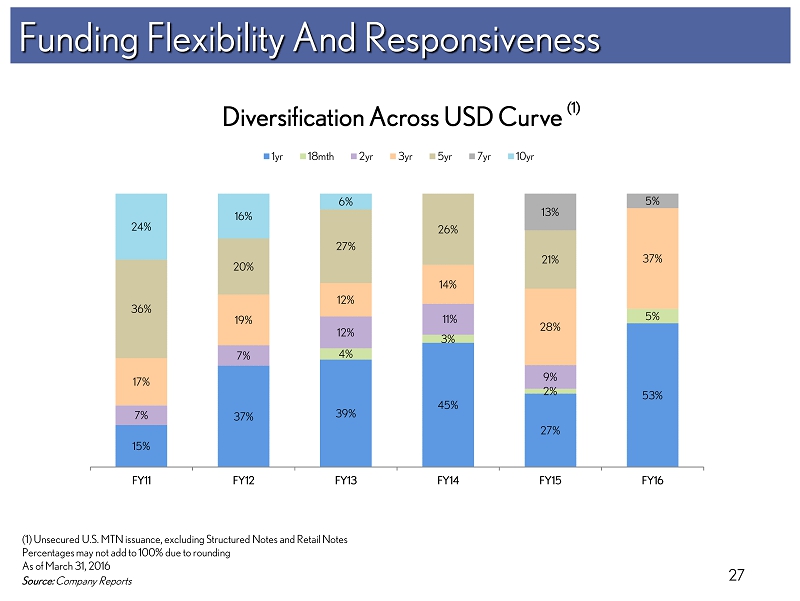
27 Funding Flexibility And Responsiveness Source: Company Reports Diversification Across USD Curve (1) (1) Unsecured U.S. MTN issuance, excluding Structured Notes and Retail Notes Percentages may not add to 100% due to rounding As of March 31, 2016 15% 37% 39% 45% 27% 53% 4% 3% 2% 5% 7% 7% 12% 11% 9% 17% 19% 12% 14% 28% 37% 36% 20% 27% 26% 21% 13% 5% 24% 16% 6% FY11 FY12 FY13 FY14 FY15 FY16 1yr 18mth 2yr 3yr 5yr 7yr 10yr
28 Key Investment Highlights • Financial strength supported by strong credit ratings • Transparent business model with exceptional liquidity • Rational funding programs with long - term perspective – Diversification in bond offerings – Focus on proactively meeting needs of market – Strong emphasis placed on flexibility and responsiveness • Industry - leading in: – Liquidity management framework – Balance sheet strength – Business model resiliency