Attached files
| file | filename |
|---|---|
| EX-10.31 - EXHIBIT 10.31 - XURA, INC. | mesg-1312016xexhibit1031.htm |
| XML - IDEA: XBRL DOCUMENT - XURA, INC. | R9999.htm |
| EX-32.2 - EXHIBIT 32.2 - XURA, INC. | mesg-1312016xexhibit322.htm |
| EX-32.1 - EXHIBIT 32.1 - XURA, INC. | mesg-1312016xexhibit321.htm |
| EX-31.2 - EXHIBIT 31.2 - XURA, INC. | mesg-1312016xexhibit312.htm |
| EX-31.1 - EXHIBIT 31.1 - XURA, INC. | mesg-1312016xexhibit311.htm |
| EX-23.2 - EXHIBIT 23.2 - XURA, INC. | mesg-1312016xexhibit232.htm |
| EX-23.1 - EXHIBIT 23.1 - XURA, INC. | mesg-1312016xexhibit231.htm |
| EX-21.1 - EXHIBIT 21.1 - XURA, INC. | mesg-1312016xexhibit211.htm |
UNITED STATES
SECURITIES AND EXCHANGE COMMISSION
Washington, D.C. 20549
_______________________________________________
FORM 10-K
_______________________________________________
(Mark One)
x | ANNUAL REPORT PURSUANT TO SECTION 13 OR 15(d) OF THE SECURITIES EXCHANGE ACT OF 1934 |
For the fiscal year ended January 31, 2016
OR
¨ | TRANSITION REPORT PURSUANT TO SECTION 13 OR 15(d) OF THE SECURITIES EXCHANGE ACT OF 1934 |
For the transition period from to
Commission File Number 001-35572
_______________________________________________
XURA, INC.
(Exact name of registrant as specified in its charter)
_______________________________________________
Delaware | 04-3398741 |
(State or other jurisdiction of incorporation or organization) | (I.R.S. Employer Identification No.) |
200 Quannapowitt Parkway Wakefield, MA | 01880 |
(Address of principal executive offices) | (Zip Code) |
Registrant’s telephone number, including area code: (781) 246-9000
______________________________________________
Securities registered pursuant to Section 12(b) of the Act:
Title of each class | Name of each exchange on which registered |
Common Stock, $0.01 par value per share | The NASDAQ Stock Market, LLC (NASDAQ Global Market) |
Securities registered pursuant to Section 12(g) of the Act:
None
(Title of Class)
_______________________________________________
Indicate by check mark if the registrant is a well-known seasoned issuer, as defined in Rule 405 of the Securities Act. ¨ Yes x No
Indicate by check mark if the registrant is not required to file reports pursuant to Section 13 or Section 15(d) of the Act. ¨ Yes x No
Indicate by check mark whether the registrant (1) has filed all reports required to be filed by Section 13 or 15(d) of the Securities Exchange Act of 1934 during the preceding 12 months (or for such shorter period that the registrant was required to file such reports), and (2) has been subject to such filing requirements for the past 90 days. x Yes ¨ No
Indicate by check mark whether the registrant has submitted electronically and posted on its corporate Web site, if any, every Interactive Data File required to be submitted and posted pursuant to Rule 405 of Regulation S-T during the preceding 12 months (or for such shorter period that the registrant was required to submit and post such files). x Yes ¨ No
Indicate by check mark if disclosure of delinquent filers pursuant to Item 405 of Regulation S-K is not contained herein, and will not be contained, to the best of registrant’s knowledge, in definitive proxy or information statements incorporated by reference in Part III of this Form 10-K or any amendment to this Form 10-K. ¨
Indicate by check mark whether the registrant is a large accelerated filer, an accelerated filer, a non-accelerated filer or a smaller reporting company. See definitions of “large accelerated filer,” “accelerated filer” and “smaller reporting company” in Rule 12b-2 of the Exchange Act.
Large accelerated filer | ¨ | Accelerated filer | x | |
Non-accelerated filer | ¨ | (Do not check if a smaller reporting company) | Smaller reporting company | ¨ |
Indicate by check mark whether the registrant is a shell company (as defined in Rule 12b-2 of the Exchange Act). ¨ Yes x No
As of July 31, 2015 (the last business day of the registrant’s second fiscal quarter), the aggregate market value of common stock held by non-affiliates of the registrant was $350,556,312 based on the last reported sale price of the registrant's common stock on such date. For purposes of this calculation, executive officers, directors and greater than 10% beneficial owners of the registrant were assumed to be affiliates. However, such assumption should not be deemed to be a determination that such executive officers, directors or 10% beneficial owners are, in fact, affiliates of the registrant.
There were 25,018,539 shares of the registrant’s common stock outstanding on May 17, 2016.
_______________________________________________
DOCUMENTS INCORPORATED BY REFERENCE
Portions of the information called for by Part III will be included in an amendment to this Annual Report on Form 10-K or incorporated by reference from the registrant’s proxy statement to be filed pursuant to Regulation 14A.
_______________________________________________
XURA, INC. AND SUBSIDIARIES
2015 ANNUAL REPORT ON FORM 10-K
TABLE OF CONTENTS
Page | ||
ITEM 1. | ||
ITEM 1A. | ||
ITEM 1B. | ||
ITEM 2. | ||
ITEM 3. | ||
ITEM 4. | ||
ITEM 5. | ||
ITEM 6. | ||
ITEM 7. | ||
ITEM 7A. | ||
ITEM 8. | ||
ITEM 9. | ||
ITEM 9A. | ||
ITEM 9B. | ||
ITEM 10. | ||
ITEM 11. | ||
ITEM 12. | ||
ITEM 13. | ||
ITEM 14. | ||
ITEM 15. | ||
FORWARD-LOOKING STATEMENTS
Certain statements contained in this Annual Report on Form 10-K are “forward-looking statements” within the meaning of Section 27A of the Securities Act of 1933, as amended, and Section 21E of the Securities Exchange Act of 1934, as amended. We intend such forward-looking statements to be covered by the safe harbor provisions for forward-looking statements. Forward-looking statements include financial projections, statements of plans and objectives for future operations, statements of future economic performance, and statements of assumptions relating thereto. In some cases, forward-looking statements can be identified by the use of terminology such as “may,” “expects,” “plans,” “anticipates,” “estimates,” “believes,” “potential,” “projects,” “forecasts,” “intends,” or the negative thereof or other comparable terminology. By their very nature, forward-looking statements involve known and unknown risks, uncertainties and other important factors that could cause actual results, performance and the timing of events to differ materially from those anticipated, expressed or implied by the forward-looking statements in this Annual Report. Such risks or uncertainties may give rise to future claims and increase exposure to contingent liabilities. These risks and uncertainties arise from (among other factors) the following, categorized by recently completed material transactions, and other operational and legal risks:
Recently Completed Material Transactions
We recently completed three material transactions: the sale of our BSS business (as defined below) to Amdocs Limited; the execution of a master services agreement with Tech Mahindra pursuant to which Tech Mahindra performs certain services for us on a global basis; and the acquisition of Acision Global Limited (or Acision), which closed on August 6, 2015. See Item 1, “Business - Material Transactions Completed During the Fiscal Year.” These transactions are subject to numerous risks and uncertainties, which include:
• | general disruption of the business and allocation of resources to integration and restructuring following these transactions rather than sales and fulfillment efforts; |
• | loss of customers or delays in orders until operations fully normalize following completion of the transaction; and |
• | loss of key employees, employee unrest or distraction. |
The BSS Business sale transaction poses additional risks such as:
• | delays in anticipated benefits of the transaction; |
• | post-closing reductions in the purchase price as a result of breaches of representation, warranties or covenants, including those relating to certain third-party consents to be achieved after closing; |
• | difficulties in implementing restructuring initiatives necessary to reduce costs and expenses following the completion of the BSS Business sale transaction; and |
• | inability to re-invest the proceeds of the sale in businesses that are profitable or otherwise successful. |
The Tech Mahindra transaction poses additional risks such as:
• | failure to achieve the cost savings and other benefits anticipated from the transaction; and |
• | material dependence on Tech Mahindra for critical functions and operations (including research and development, project deployment, delivery, maintenance, and support services). |
The Acision acquisition poses additional risks such as:
• | problems that may continue, and additional problems that may arise, in integrating the Acision business into our current business, which may result in our not operating as effectively and efficiently as expected; |
• | inability to achieve expected revenues or synergies or unexpected delays in achieving such revenues or synergies; |
• | unexpected costs or unexpected liabilities involving the transaction or the post-transaction integration; |
• | operating and financial requirements and restrictions imposed on us by Acision’s senior credit facility, including requirements and restrictions that may limit our ability to engage in acts that we believe may be in our long-term best interests; and |
• | the need to implement and enhance required controls, procedures and policies at Acision which prior to the acquisition operated as a private company. |
Operating and Legal Risks
In addition to the risks and uncertainties identified above, we generally face operating and legal risks, including:
i
• | risks associated with our company being merged with and into affiliates of Siris Capital Group, LLC as contemplated by a definitive merger agreement between the two companies; |
• | inability to stem declines in customer sales and related cash flows, and ultimately to achieve growth in sales and cash flows; |
• | inability to develop, produce and sell products and services that satisfy customer demands, operate in their particular technology environments, and comply with constantly changing standards, laws and regulations; |
• | the reliance on a major customer for a significant portion of our revenue, which could materially adversely affect our overall revenue, profitability and cash flows if we are unable to maintain or develop relationships with this customer, or if this customer reduces demand for our products; |
• | pricing pressure on products and services arising out of customer demand for lower capital and operating costs; |
• | competition from larger and more well capitalized businesses that have greater ability to lower their pricing to secure business; |
• | the difficulty in reducing costs to match revenues (and in forecasting quarterly and annual product bookings), because a high percentage of orders are typically placed late in fiscal quarters or fiscal years, sales cycles are lengthy and unpredictable, and we are dependent on large projects that require material upfront investment for a large portion of our revenues; |
• | any failure to timely implement restructuring alternatives designed to reduce costs when and as required to align with revenues; |
• | costs associated with product or service implementation delays, performance issues, warranty claims and other liabilities (which may result in material quarter to quarter fluctuations especially in projects accounted for using the percentage-of-completion method); |
• | decline or weakness in the global economy; |
• | adverse conditions in the telecommunications industry that result in reduced spending or demand for our products and services; |
• | our reliance on third-party subcontractors for important company functions; |
• | supply shortage and/or interruptions in product supply due to our dependence on a limited number of suppliers and manufacturers for certain components and third-party software; |
• | the risk that natural disasters, environmental issues or other force majeure events may harm our business; |
• | the risk that material weaknesses in our internal control over financial reporting that we identified relative to our Acision subsidiary and tax accounting process could, if not remediated, have a material adverse impact on our ability to produce timely and accurate financial statements; |
• | the cost to comply with, and the consequences if we fail to comply with, the Sarbanes-Oxley Act of 2002, Dodd-Frank Wall Street Reform and Consumer Protection Act, environmental laws, and other laws or regulations that govern our business; |
• | the loss of revenues and any costs to assert any infringement of our proprietary technology by a third-party; |
• | costs associated with (including potential loss of sales revenue) any infringement by us of the intellectual property of third parties, including through the use of free or open source software; |
• | contractual obligations, including indemnity provisions, that in some cases expose us to significant or uncapped liabilities; |
• | our dependence upon hiring and retaining highly qualified employees; |
• | labor disruptions, union or work council actions, or similar events; |
• | security breaches and other disruptions that could compromise our confidential information (whether at our facilities or those of third-party providers or other business partners), or customer or supplier information; |
• | risks associated with significant foreign operations and international sales, including the impact of geopolitical, economic and military conditions in foreign countries, operations in countries with a history of corruption or which are on various restricted lists, entering into transactions with foreign governments, compliance with laws that prohibit improper payments, and adverse fluctuations of currency exchange rates; |
• | in particular, risks relating to our significant operations in Israel, including economic, political and/or military conditions in Israel and the Middle East, and uncertainties and restrictions or obligations relating to research and development grants and tax benefits; |
• | risks related to the Share Distribution (defined below) including our obligation to indemnify Verint Systems Inc. in connection with the distribution; taxes of the prior CTI consolidated group for periods ended on or before the Share Distribution date; and any legal infirmities related to the Share Distribution; and |
• | limitations on our ability to use our net operating loss carryforwards, which would reduce our future cash flows, that could arise out of changes in ownership we cannot prevent. |
These risks and uncertainties discussed above, as well as others, are discussed in greater detail in Part I, Item 1A, “Risk Factors” of this Annual Report. The documents and reports we file with the SEC are available through Xura, or our website, www.xura.com, or through the SEC's Electronic Data Gathering, Analysis, and Retrieval system (EDGAR)
ii
at www.sec.gov. We undertake no commitment to update or revise any forward-looking statements except as required by law.
iii
PART I
ITEM 1. | BUSINESS |
Potential Sale of Our Company
On May 23, 2016, we entered into an Agreement and Plan of Merger (or the Merger Agreement) with Sierra Private Holdings II Ltd., a private limited company incorporated under the laws of England and Wales (or Sierra), and Sierra Private Merger Sub Inc., a Delaware corporation and wholly-owned subsidiary of Sierra (or Merger Sub), under which Merger Sub will be merged with and into our company (or the Merger), with us continuing after the Merger as the surviving corporation and wholly-owned subsidiary of Sierra, subject to the terms and conditions set forth in the Merger Agreement. Parent and Merger Sub are affiliates of Siris Capital Group, LLC (or Siris). The Merger Agreement has been unanimously approved by our Board of Directors.
Under the terms of the Merger Agreement, Sierra will acquire all of our outstanding common stock for $25.00 per share in cash. The Merger is currently expected to close in the third fiscal quarter of 2016 and is subject to approval by our stockholders, certain regulatory approvals and other closing conditions.
Additional information about the Merger and the terms of the Merger Agreement can be found in the Current Report on Form 8-K filed by us under Item 1.01 of that Form 8-K on May 23, 2016, including the full text of the Merger Agreement filed as Exhibit 2.1 to that Form 8-K. Our stockholders are urged to read all relevant documents filed with the SEC because they contain important information about the proposed transaction. Investors and security holders are able to obtain the documents free of charge at the SEC’s web site, www.sec.gov, or for free from us by contacting our Investor Relations Department or through the investor relations section of our website (www.xura.com).
Overview
We are a global provider of digital communications solutions for communication service providers (or CSPs), enterprises and application providers. Our digital communications solutions are designed to enhance CSPs’ ability to address evolving market trends with the simplification and modernization of networks, as well as to create monetizable services with both existing and emerging technologies, such as voice over long-term evolution (or VoLTE), rich communication services (or RCS) credit orchestration and internet protocol (or IP) messaging and web real-time communications (or WebRTC). We also provide solutions for messaging security, network signaling security, data analytics, and machine-to-machine messaging. We continue to offer traditional value-added services (or VAS) solutions, including voicemail, visual voicemail, call completion, short messaging service (or SMS), multimedia picture and video messaging (or MMS) and IP-messaging designed to provide CSPs the ability to augment their networks with emerging products and solutions to address opportunities provided by new types of devices, technologies, and multi-device user experiences. In addition, we offer CSPs innovative monetization solutions using messaging as transport to exchange billing credits between subscribers, primarily in prepaid markets. Our enterprise solutions are designed to accelerate our enterprise customers’ shift towards mobile-enablement and to improve their customer engagement. These solutions include secure enterprise application-to-person messaging (or A2P), two-factor authentication (or 2FA) and developer tools for customized service creation.
Most of our solutions can be delivered via the cloud, in a “software-as-a-service” (or SaaS) model, allowing us to speed up deployment and permit rapid introduction of additional services. With our acquisition of Acision Global Limited (or Acision), several of our monetization solutions are offered in a revenue-share model, which reduces our customers' up-front investments and ties payments to actual service usage, provides us with continual revenue streams and allows us to actively participate in service value creation.
Products
Our software solution suite and related solutions enhance wireless, wireline and cable networks and services both for CSPs and enterprises, helping them to effectively monetize their businesses.
For CSPs, our products are designed to help advance the migration to richer communications, secure revenue and create new revenue opportunities.
For enterprises, we provide a comprehensive carrier-grade cloud-based platform for delivering A2P messaging and communication enabling mobile application engagement with consumers across a number of industries.
1
Consistent with our efforts in recent years, we continued to transition our business to a software-only solution offering. Our solutions are delivered through a variety of models and channels, including on-premises, customer hosted, public cloud, SaaS and managed services. Our portfolio includes the following product categories:
Digital Communications
Our Digital Communications portfolio centers around solutions designed to assist CSPs to evolve their communications infrastructure to meet the demands of a rapidly changing marketplace. Our software solutions are designed to enable CSPs to address changes in their communications networks, including adopting IP communications, upgrading their network to VoLTE, incorporating RCS, and implementing WebRTC.
We also offer a range of security solutions for spam and fraud control at both the messaging and network signaling levels to enable CSPs’ to address a range of security challenges. These solutions enhance the CSPs level associated content and the network signaling layer itself, which in turn facilitates revenue loss prevention, improves the overall subscriber user experience and mitigates churn. Our security solutions provide CSPs with comprehensive analytics information related to the various facets of the spam or fraud activity helping CSPs to address unacceptable behaviors and protect the network and subscribers and enhance regulatory compliance.
Our Digital Communications portfolio includes:
• | VAS Solutions consisting primarily of: |
◦ | Xura Voicemail which provides call completion functionality to telecom users, designed to ensure a higher level of billable calls and improved returned call activity for wireless and wireline network CSPs. Voicemail is offered by most of the world’s wireless network operators as part of a bundled package of communication services and is offered by wireline network operators on a more limited basis. |
◦ | Xura Visual Voicemail, which provides users with a visual inbox user interface for convenient message management, including address book integration for “record-and-send” one-to-one and one-to-many voice messaging. Visual Voicemail continues to be launched in a number of networks and its deployment corresponds to the continued proliferation of “smartphones.” Supported by nearly all smartphones, Visual Voicemail has been launched by many CSPs worldwide. |
◦ | Xura Short Message Service (or SMS) Center and Message Controller, which enable texting that is used for an expanding range of purposes, including person-to-person messaging, televoting, application-to-person messaging such as information and entertainment alerts, social network-based messaging, such as Twitter updates, as well as thousands of other mobile app communications. Texting has achieved mass market mobile end user adoption levels, and continues to be one of the world’s most popular wireless enhanced services. |
◦ | Multimedia Messaging Service (or MMS) Center, which enables the sharing and messaging of pictures and video over wireless networks, including person-to-person and application-to-person multimedia messaging. |
◦ | MultiVAS, which is a virtualized and modular solution that enables the convergence of SMS, MMS and next-generation voice messaging over IP-based fourth generation (or 4G) networks. This solution is designed to offer savings to CSPs, simplify operations and provide the required path to IP-based messaging and rich communication services (or RCS). |
◦ | Application Gateways, which provide the interconnectivity between legacy systems and the recent innovations in CSP technology. We provide a large array of gateway solutions to interconnect market standards such as RCS, WebRTC, IP messaging and communications protocols, such as SIP and Diameter, that are used in CSP networks. |
• | Xura Communication Suite (or XCS), which is an IP-based digital voicemail and messaging service with multi-device support, delivered on wireless and fixed networks. The multi-device support enables a subscriber with multi device user experience, such as smartphone and tablet, across a range of our digital services. XCS offers an RCS service that includes IP-based messaging, IP-based chat, IP-based voice and video, and file transfer capabilities over a 4G wireless network. The infrastructure for RCS services is designed to work with any available RCS client application. XCS also includes: |
◦ | an RCS Gateway Solution that connects RCS services to other IP and internet based services. This capability enables a wide range of IP services to be offered through 4G wireless networks; |
◦ | WebRTC, that enables real time voice, video and messaging communications through the use of an internet web browser without the need to download applications. Our WebRTC solution is offered to both enterprise businesses and CSPs; and |
2
◦ | IP Short Message Gateway for 4G Long Term Evolution (LTE) network that supports messaging on 4G LTE networks as well as provides messaging between 4G and 3G wireless networks. |
• | Enterprise IP Communication Solution, which is an IP-based enterprise communications solution that provides CSP-hosted, IP-based enterprise services that enable CSPs to deliver Voice over IP (or VoIP) telephony, fixed-mobile converged voice, video and messaging services, and IP Centrex enterprise communications services. These products allow CSPs and enterprises to benefit from IP-based services, and provide a path for enterprises to migrate from their traditional office telephony systems to new IP-based digital communication systems. |
• | Security solutions, designed to enhance the level of security of message transport (and its associated content) to prevent revenue loss and protect the network signaling layer itself. Our anti-spam and anti-fraud solutions provide CSPs with direct measurement and reporting of spam and fraud levels in their networks, analytics relating to quantity, origin, and nature of spam or fraud traffic, and various levels of control, including anti-fake, anti-spoof, anti-flood, anti-abuse, keyword filtering, black and white lists, duplicate message detection, malicious content detection, phishing and scam protection, spam protection and grey route management. Our signaling fraud management and enforcement solutions are designed to enable CSP’s to address network security risks primarily related to unauthorized signaling exploitation, including the tracking of subscriber location, faking of subscriber profiles and spoofing of network elements. These risks could lead to loss of revenue by CSPs, violations of subscribers’ privacy, unauthorized interception and fake initiation of voice calls and messaging, attacks on other CSP’s networks, and exposure of a CSP’s network to attacks by another CSP’s network. |
Monetization
We provide innovative monetization solutions for using messages as the transport medium for exchanging billing credits between subscribers, primarily in prepaid markets. These solutions are designed to allow CSPs to create new revenue streams by leveraging their current networks to monetize otherwise lost person to person (or P2P) messaging and also provide CSPs with a monitoring tool to measure message completion success rates. These solutions are made available to subscribers on demand and do not require subscriber activation.
Our Monetization portfolio includes:
• | Low Credit Services, such as Collect SMS, Loan SMS, Gift SMS, Data Package transfers and other related message-based credit transfer services. These services are designed to allow CSPs to create new revenue streams from prepaid subscribers with insufficient credit to pay for usage of messaging services. These services enable: |
◦ | the sending party to obtain credit temporarily in various forms, including a loan or a premium charge on the next top-up; |
◦ | the receiving party to extend credit to the person attempting to communicate with them. For example, CollectSMS allows a subscriber to send an SMS message and have the receiving party pay for the message; |
◦ | the receiving party to provide an “allocation” of billable events from either the person they are trying to communicate with or the CSP itself ; and |
◦ | orchestration where neither party extends or receives credit but rather the system intervenes to provide payment through other monetizable services. For example, we can orchestrate a communication between users when both parties are out of credit by allowing one user to see an “Ad” or view a video and thereby pay for the communication via the CSP’s ad inventory. |
• | Advanced Value added services focused on lifestyle mobile solutions. These solutions include: |
◦ | distracted driving solutions which prevent drivers from using text messaging (IP-based or traditional) while operating their vehicles. |
◦ | parental control solutions to prevent bullying and inappropriate content from reaching their children; and |
◦ | standard solutions for block-listing subscribers, creating white lists of users and other solutions to enhance the mobile user experience. |
Enterprise
Our Enterprise portfolio includes:
3
• | Secure Enterprise Services designed to provide direct encrypted communications between enterprise businesses and their mobile users, including A2P and 2FA. These solutions include access to the Xura Cockpit service that allows enterprise businesses to manage their communications needs, monitor the service and optimize their business communications. |
• | Our Forge software development kit (or SDK) and other developer focused tools for enterprise businesses to enable their mobile applications, and allow developers to integrate and develop rich communication functionalities, such as voice, video, chat and presentence, into mobile and web-based applications and services to reduce operating costs and increase customer loyalty by moving operations to a mobile environment. |
Markets
We market our product and service portfolio primarily to CSPs, such as wireless and wireline network CSPs, cable CSPs, content providers and a growing number of enterprises seeking to transition to mobile communications. Our product and service portfolio generates fees for CSPs on a subscription, pay-per-usage or advertising-supported basis. For addition information relating to our markets, see “Management Discussion and Analysis of Financial Conditions and Results of Operations-Overview-Business Trends and Uncertainties.”
Sales and Marketing
We market our products throughout the world, primarily through our own direct sales force, and also in cooperation with a number of third parties in specified markets.
Our sales force is deployed globally. Account management teams are supported by solution experts who collaborate to design solutions to fit the needs of our current and prospective customers.
We also provide customers with marketing consultations, seminars and materials designed to assist them in marketing enhanced communication services, and further undertake an ongoing role supporting their business and market planning processes. These services are designed to promote the successful launch, execution, and end user adoption of Xura-enabled applications to increase usage of our services and encourage customers to place additional orders with for capacity expansions.
Customers
We market our products primarily to CSPs, such as wireless and wireline, cable and content CSPs, as well as growing digital enterprises. Our customer base includes more than 350 CSPs and more than 200 digital enterprises in more than 150 countries, including a significant number of large wireless network CSPs.
For the fiscal years ended January 31, 2016, 2015 and 2014, Cellco Partnership (d/b/a as Verizon Wireless) accounted for approximately 16%, 17% and 30%, respectively, of our consolidated revenue. No other customer, individually accounted for 10% or more of our consolidated revenue for any of the fiscal years ended January 31, 2016, 2015 or 2014.
Competition
The markets for our Digital Communications, Monetization and Enterprise solutions are highly competitive, and include numerous products offering a broad range of features and capacities. Our Digital Communications competitors include network providers, suppliers of turnkey systems and software, indirect competitors that supply certain components to systems integrators and solution-specific niche competitors, such as security providers. Traditional competitors in Digital Communications include Alcatel-Lucent, Ericsson, HP, Huawei, Jinny Software, Jibe Mobile, Mitel (including through its acquisition of Mavenir), Movius, NEC, Nokia Siemens Networks, Openwave (recently acquired by Syncronoss Technologies), Oracle, Tecnotree, Unisys and ZTE. Solution specific primary competitors include security vendors such as Cloudmark, Adaptive Mobile, Hewlett-Packard, Fortinet, F5, Juniper Networks, Hewlett-Packard, Openwave (now Syncronoss) and Oracle. Competitors of our Monetization solutions include Tiaxa, Tango, Huawei and Take.Net. Competitors of our Enterprise solutions include Syniverse, SAP mobile services, Twilio, Genband, and KandyX. Some of our competitors are significantly larger and at times may be able to exert pressure. Certain Asian competitors have cost structures and financing alternatives that allow them in certain locations to also put pressure on prices. In addition, our competitors that manufacture other network telecommunications equipment may derive a competitive advantage in selling systems to customers that are purchasing, or have previously purchased, other compatible network equipment from such manufacturers. Many of our competitors specialize in a subset of our portfolio of products. We also encounter competition from internal solutions developed by in-house IT departments of our customers.
4
In the Digital Communications market, wireless subscriber preferences have changed in recent years as consumers have transitioned from traditional VAS services to alternative IP-based applications with the deployment of smartphones and other devices, such as tablets. This transition has resulted in intensified competition due to the change in our business mix from circuit-switched to IP-based product lines that may provide alternatives to our products and services. We believe our new security and cloud-based products, leading market position in VAS (including voice and messaging), substantial install base, strong expertise in IP communications, and our evolution strategy for CSPs that aims to reduce the total cost of ownership of the currently deployed networks and increase revenues through new IP-based services, give us a competitive advantage in providing solutions for the evolution of our customer base to 4G IP networks. We are currently focused on our IP-based digital services offering, primarily RCS, which is designed to deliver digital voice, video and messaging services on different types of devices, both SIM and non-SIM based, and allow CSPs to address the needs of its subscribers’ digital lifestyle.
In the monetization and enterprise markets, we compete with both software and cloud-based software solution providers, some of which are more established in those markets than we are. We believe that competition in the sale of our products is based on a number of factors, the most important of which are: the ability to effectively address changing market needs, product features and functionality, system capacity and reliability, marketing and distribution capability and price. Other important competitive factors include service and support and the capability to integrate systems with a variety of telecom networks, IP networks and operation and support systems. We believe that the range of capabilities provided by, and the ease of use of, our systems compare favorably with other products currently marketed. We anticipate that competition will increase, and that a number of our direct and indirect competitors will continue to introduce new or improved systems during the next several years.
Manufacturing and Sources of Supplies
Our manufacturing operations consist primarily of installing software on externally purchased hardware components and testing. We apply extensive quality assessment procedures through software testing of the solution and overall systems. We use in house or open source-based software testing procedures for our engineered software solutions. Furthermore, we test on standard virtualization platforms (such as KVM and VMware) and off the shelf hardware platforms.
While we continue our transition to a software-only solution offering, in customer engagements requiring hardware, we source the hardware from third-party distributors and testing, is often performed on customer premises as a software quality assurance process.
We maintain global management systems assuring compliance with the ISO 9001:2008, 14001:2004, 27001:2013 and OHSAS 18001:2007 standards for our research and development, and service domains, as well as for our worldwide main offices as applicable.
Material Transactions Completed During the Fiscal Year
Amdocs Asset Purchase Agreement
On April 29, 2015, we entered into an Asset Purchase Agreement (including the ancillary agreements and documents thereto, the Amdocs Purchase Agreement) with Amdocs Limited, a Guernsey company (or Purchaser). Pursuant to the Amdocs Purchase Agreement, we agreed to sell substantially all of our assets required for operating our converged, prepaid and postpaid billing and active customer management systems for wireless, wireline, cable and multi-play communication service providers (or the BSS Business) to the Purchaser, and the Purchaser agreed to assume certain post-closing liabilities of ours. For more information, see “Management Discussion and Analysis of Financial Conditions and Results of Operations-Overview-Amdocs Asset purchase Agreement.”
Acquisition of Acision
On August 6, 2015, we completed the acquisition (or the Acquisition) of Acision Global Limited, a private company formed under the laws of England and Wales (or Acision) and a holding company for Acision B.V. (its sole asset), pursuant to the terms of the share sale and purchase agreement, dated June 15, 2015 (or the Purchase Agreement), between us and Bergkamp Coöperatief U.A., a cooperative with excluded liability formed under the laws of the Netherlands (or the Seller). For more information, see “Management Discussion and Analysis of Financial Conditions and Results of Operations-Overview-Acquisition of Acision.”
Master Services Agreement with Tech Mahindra
On April 14, 2015, we entered into a Master Service Agreement (or the MSA) with Tech Mahindra Limited (or Tech Mahindra) pursuant to which Tech Mahindra will perform certain services for our business on a global basis. For
5
more information, see “Management Discussion and Analysis of Financial Conditions and Results of Operations-Overview-Master Services Agreement with Tech Mahindra.”
Backlog
As of January 31, 2016 and 2015, we had a backlog of approximately $233 million and $228 million, respectively. Approximately 44% of our backlog as of January 31, 2016 is not expected to be filled in the fiscal year ending January 31, 2017. We define “backlog” as projected revenue from signed orders not yet recognized, excluding revenue from maintenance agreements. Orders constituting backlog may be reduced, cancelled or deferred by customers.
Research and Development
We continue to enhance the features and performance of existing solutions and introduce new solutions through extensive research and development activities. We believe that our future success depends on a number of factors, which include the ability to:
• | identify and respond to emerging technological trends in our target markets; |
• | develop and maintain competitive solutions that meet or exceed customers' changing needs; and |
• | enhance existing products by adding features and functionality that differentiate our products from those of our competitors. |
As a result, we have made and intend to continue to make investments in research and development. Research and development resources are allocated in response to market research and customer demands for additional features and products. The development strategy involves rolling out initial releases of products and adding features over time. We continuously incorporate customer feedback into the product development process. While we expect that new products will continue to be developed internally, we may, based on timing and cost considerations, acquire or license technologies, products or applications from third parties.
Significant research and development activity occurs in the United States, the United Kingdom, the Czech Republic and Israel with additional research and development offices in India. Research and development leverages broad industry expertise, which includes computer architecture, telephony, IP, data networking, multi-processing, databases, real time software design and application software design.
Patents and Intellectual Property Rights
Our success depends to a significant degree on the legal protection of our software and other proprietary technology rights. We rely on a combination of patent, trade secret, copyright, and trademark laws and confidentiality and non-disclosure agreements with employees and third parties to establish and protect our proprietary rights.
We currently hold several patents, none of which are material to our operations on an individual basis.
Substantial litigation regarding intellectual property rights exists in technology-related industries, and our products are increasingly at risk of third-party infringement claims as the number of competitors in our industry segments grows and the functionality of software products in different industry segments overlaps. In the event of an infringement claim, we may be forced to seek expensive licenses, reengineer our products, engage in expensive and time-consuming litigation or stop marketing those products. In the fiscal years ended January 31, 2016, 2015 and 2014, we entered into several settlements in connection with patent litigation claims asserted against us.
Licenses and Royalties
Licenses to third parties by us are designed to prohibit unauthorized use, copying, and disclosure of our software and other proprietary technology rights. We also license from third parties certain software, technology, and related rights for use in manufacture and marketing of our products, and in certain cases, pay royalties under such licenses and other agreements. We believe that the rights under such licenses and other agreements are sufficient for the manufacture and marketing of our products and, in the case of licenses, extend for periods at least equal to the estimated useful lives of the related technology and know-how.
6
Discontinued Operations
As of April 30, 2015, the BSS Business met the criteria to be classified as held for sale as well as discontinued operations. As such, the BSS Business have been re-classified and reflected as discontinued operations on the consolidated statements of operations for all periods presented. The assets and liabilities of the BSS business are included in discontinued operations as separate components to our consolidated balance sheet as of January 31, 2015. For additional information, see note 17 to our consolidated financial statements included in Item 15 of this Annual Report.
Segment Information
Prior to entering into the Amdocs Purchase Agreement, our reportable segments consisted of BSS and Digital Services. As a result of entering into the Amdocs Purchase Agreement, the results of operations of the former BSS Business segment are classified as discontinued operations. Therefore, with the reported divestiture we now operate as a single business segment the results of which are included in our income statement from continuing operations. We acquired Acision to complement our solution portfolio, enhance our market leadership, penetrate growth markets and improve our operational efficiency. Acision was integrated into Digital Services and we continue to operate a single segment as a global provider of digital communications solutions for CSPs and enterprises.
Domestic and International Sales and Long-Lived Assets
For a presentation of domestic and international sales for the fiscal years ended January 31, 2016, 2015 and 2014 and long-lived assets as of January 31, 2016 and 2015, see note 20 to the consolidated financial statements included in Item 15 of this Annual Report. Our international operations are subject to certain risks. For a description of risks attendant to our foreign operations, see Item 1A, “Risk Factors-Risks Related to International Operations.”
Export Regulations
We are subject to export control regulations in countries from which we export goods and services. These controls may apply by virtue of the country in which the products are located or by virtue of the origin of the content contained in the products. If the controls of a particular country apply, the level of control generally depends on the nature of the goods and services in question. Where controls apply, the export of our products generally requires an export license or authorization (either on a per-product or per-transaction basis) or that the transaction qualifies for a license exception or the equivalent, and may also be subject to corresponding reporting requirements.
Environmental Regulations
Our operations are subject to certain foreign, federal, state and local regulatory requirements relating to environmental, waste management, labor and health and safety matters. Management believes that our business is operated in material compliance with all such regulations. To date, the cost of such compliance has not had a material impact on our capital expenditures, earnings or competitive position or that of our subsidiaries. However, violations may occur in the future as a result of human error, equipment failure or other causes. Further, we cannot predict the nature, scope or effect of environmental legislation or regulatory requirements that could be imposed or how existing or future laws or regulations will be administered or interpreted. Compliance with more stringent laws or regulations, as well as more vigorous enforcement policies of regulatory agencies, could require substantial expenditures by us and could have a material impact on our business, financial condition and results of operations.
Employees
As of January 31, 2016, we employed approximately 1,100 individuals. Approximately 27%, 11% and 62% of our employees are located in Israel, the United States and other regions, including Europe and Asia Pacific (or APAC), respectively.
Our U.S. employees are not covered by collective bargaining agreements. Employees based in certain countries in Europe, including France, Italy and Spain, and in the Americas (other than the U.S.), including Brazil, are covered by collective bargaining agreements. These collective agreements typically cover work hour, working conditions, disability, vacation, severance and other employment terms.
The Histadrut (General Federation of Labor in Israel) (or the Histadrut) is the representative organization of our employees in Israel. In June 2015, we entered into a collective bargaining agreement with the Histadrut in connection with the transfer of certain of our employees in Israel to Tech Mahindra. In November 2015, we entered into a collective bargaining agreement with the Histadrut that governs the terms of termination of certain employees in Israel as part of
7
our restructuring activities. We expect to negotiate a separate collective bargaining agreement with the Histadrut in respect of the employment terms of our remaining employees in Israel.
In addition to our special collective bargaining agreements with the Histadrut, certain provisions of the general collective bargaining agreements between the Histadrut and the Coordinating Bureau of Economic Organizations (including the Manufacturers' Association of Israel) are applicable to our Israeli employees by virtue of an expansion order of the Israeli Ministry of Industry, Trade and Labor. Under Israeli law, we are required to maintain employee benefit plans for the benefit of our employees (referred to as the employee benefit plans). Each month, both we and our employees contribute sums to the employee benefit plans. The employee benefit plans provide a combination of savings plan, insurance and severance pay benefits to participating employees. We contribute monthly to the employee benefit plan in order satisfy the severance pay to which the employees are entitled under Israeli law. Under Israeli law, we are obligated to make severance payments to employees of our Israeli subsidiaries on the basis of each individual's current salary and length of employment. Under Israel's Severance Pay Law, employees are entitled to one month's salary for each year of employment or a portion thereof. Israeli employees are required to make, and employers are required to pay and withhold, certain payments to the National Insurance Institute (similar, to some extent, to the United States Social Security Administration), on account of social security and health tax payments, for national health insurance and social security benefits.
We consider our relationship with our employees to be good.
Other Information
Our common stock is traded on the NASDAQ stock exchange (NASDAQ Global Market) under the symbol “MESG.” We were incorporated in the State of Delaware in November 1997. Our principal executive offices are located at 200 Quannapowitt Parkway Wakefield, MA 01880 and our telephone number at that location is (781) 246-9000.
On October 31, 2012, Comverse Technology, Inc. (or CTI) completed the spin-off of our company as an independent, publicly traded company, accomplished by means of a pro rata distribution of 100% of our outstanding common shares to CTI's shareholders (such transaction referred to as the Share Distribution). Following the Share Distribution, CTI no longer held any of our outstanding capital stock, and we became an independent publicly-traded company.
Our Internet address is www.xura.com. The information contained on our website is not included as a part of, or incorporated by reference into, this Annual Report. We make available, free of charge, on our website, our Annual Reports on Form 10-K, Quarterly Reports on Form 10-Q, Current Reports on Form 8-K, proxy statements and amendments to such reports filed or furnished pursuant to Section 13(a), 14 or 15(d) of the Exchange Act, as soon as reasonably practicable after we have electronically filed such material with, or furnished such material to, the SEC. The SEC's website at www.sec.gov has all of the reports that we file or furnish with the SEC. You may read and copy any materials we file with the SEC at the SEC's Public Reference Room at 100 F Street, NE, Washington, D.C. 20549. You can get information on the operation of the Public Reference Room by calling the SEC at 1-800-SEC-0330.
ITEM 1A. | RISK FACTORS |
You should carefully consider the risks described below, in addition to other information contained in this Annual Report, including our consolidated financial statements and related notes. If any of the risks described below actually occurs, our business, financial results, financial condition and stock price could be materially adversely affected. The risks below are categorized by “Risks Relating to Our Business,” “Risks Relating to International Operations,” “Risks Relating to our Recent Material Transactions,” “Risks Relating to Our Operation as an Independent, Publicly Traded Company,” and “Risks Related to Our Common Stock.” Additional risk and uncertainties not presently known to us or that we currently deem immaterial also may affect our business.
Risks Related to Our Proposed Acquisition by Sierra
The announcement and pendency of our proposed Merger with Sierra could adversely affect our business, financial results and operations.
The announcement and pendency of the proposed acquisition of our company by Sierra could cause disruptions in and create uncertainty surrounding our business, including affecting our relationships with our existing and future customers, suppliers and employees, which could have an adverse effect on our business, financial results and operations, regardless of whether the proposed Merger is completed. In particular, we could potentially lose important personnel as a result of the departure of employees who decide to pursue other opportunities in light of the proposed acquisition. We could also potentially lose customers or suppliers, and new customer or supplier contracts could be delayed or decreased. In addition, we have
8
diverted, and will continue to divert, significant management resources towards the completion of the transaction, which could adversely affect our business and results of operations.
We are also subject to restrictions on the conduct of our business prior to the consummation of the Merger as provided in the Merger Agreement, including, among other things, certain restrictions on our ability to acquire other businesses, sell, transfer or license our assets, amend our organizational documents, and incur indebtedness. These restrictions could result in our inability to respond effectively to competitive pressures, industry developments and future opportunities and may otherwise harm our business, financial results and operations.
Failure to complete the proposed Merger could adversely affect our business and the market price of our common stock.
There is no assurance that the closing of the Merger will occur. Consummation of the Merger is subject to various conditions, including, among other things, the absence of certain legal impediments; the expiration or termination of the required waiting periods under the Hart-Scott-Rodino Antitrust Improvements Act of 1976, as amended; antitrust regulatory approval in certain other jurisdictions; certain other filings and approvals by governmental authorities in France; and approval by our stockholders. We cannot predict with certainty whether and when any of these conditions will be satisfied. Although there is not a financing contingency in the Merger Agreement, the Merger could fail if Sierra is unable to obtain the financing for the transaction, in which event we would likely be entitled to the reverse break-up fee. In addition, the Merger Agreement may be terminated under certain specified circumstances, including, but not limited to, a change in the recommendation of our Board of Directors or a termination of the Merger Agreement by us to enter into an agreement for a “superior proposal.” If the Merger is not consummated, our stock price will likely decline as our stock has recently traded based on the proposed per share price for the Merger. We will have incurred significant costs, including, among other things, the diversion of management resources, for which we will have received little or no benefit if the closing of the Merger does not occur. A failed transaction may result in negative publicity and a negative impression of us in the investment community. The occurrence of any of these events individually or in combination could have a material adverse effect on our results of operations and our stock price.
Risk Relating to Our Business
Although we experienced an increase in product bookings during the fiscal year ended January 31, 2016 compared to the prior fiscal year, product bookings in the preceding years have decreased significantly. If product bookings do not continue to increase, our revenue, profitability and cash flows will likely be materially adversely affected and we may be required to implement certain measures to preserve or enhance our operating results and cash position.
We experienced an increase in product bookings in the fiscal year ended January 31, 2016. However, in the preceding years, product bookings decreased significantly, continuing an adverse business trend that began in 2008. Although product bookings are expected to increase in the fiscal year ending January 31, 2017 (or fiscal 2016), we cannot assure you that we will achieve our targets and product bookings may decrease in fiscal 2016 and in future periods. If product bookings do not continue to increase, our revenue, profitability and cash flows will likely be materially adversely affected and we may be required to implement further cost reduction measures and other initiatives to preserve and enhance our operating results and cash position. Any such measures may limit or hinder our ability to execute our strategy and achieve our objectives, thereby adversely affecting our business. In addition, declines in customer order activity may result in reduced revenue in future periods and may require us to record non-cash expenses relating to the impairment of goodwill and intangible assets, which may materially adversely affect our results of operations.
Our success depends on our ability to anticipate customer demand for new products and solutions and to generate revenue from new products and technologies that exceed any declines in revenue we may experience from the sale of traditional products and solutions. Our advanced offerings may not be widely adopted by our existing and potential customers and increases in sales of our advanced offerings, if any, may not exceed or fully offset potential declines in sales of our traditional products and solutions.
In response to a rapidly evolving Digital Services market, we are engaged in the promotion of Digital Services advanced offerings, such as IP messaging, WebRTC, IP-SMS-Gateway, security solutions, mobile monetization, enterprise solutions, Rich Communication Solutions (or RCS), and Software as a Service (or SaaS) cloud-based solutions, in addition to our traditional VAS solutions, such as voicemail, SMS and MMS. While we believe demand for advanced offerings may grow due to the increasing deployment of smartphones and rollout of 4G/LTE networks by wireless CSPs, the implementation of a new services model poses challenges with respect to pricing and customer demand for and acceptance of new offerings.
It is unclear whether our advanced offerings will be widely adopted by existing and potential customers. Currently, we are unable to predict whether sales of advanced offerings will exceed or fully offset declines that we may experience in the sale of traditional VAS solutions in subsequent fiscal periods. If sales of advanced offerings do not increase or if increases in sales of advanced offerings do not exceed or fully offset any declines in sales of traditional VAS solutions, due to adverse market trends,
9
changes in consumer preferences or otherwise, our revenue, profitability and cash flows would likely be materially adversely affected.
Historically, we have derived a significant portion of our revenue from certain major customers, and our revenue, profitability and cash flows could be materially adversely affected if we are unable to maintain or develop relationships with these customers, or if these customers reduce demand for our products.
Historically, we have derived a significant portion of our revenue from a limited number of customers.
For the fiscal years ended January 31, 2016, 2015 and 2014, one customer accounted for approximately 16%, 17%, and 30% of our revenue, respectively. We intend to establish long-term relationships with existing customers and continue to expand our customer base. While we diligently seek to become less dependent on any single customer, it is likely that one or more customers will continue to contribute a significant portion of our revenue in any given year for the foreseeable future. The loss of one or more of our significant customers, or reduced demand from one or more of our significant customers, would result in an adverse effect on our revenue and profitability.
Product bookings are difficult to predict as a result of a high percentage of product bookings typically generated late in the fiscal quarter and in the fiscal year, lengthy and variable sales cycles, and a focus on large customers and projects.
A high percentage of our product bookings has typically been generated late in fiscal quarters. This trend makes it difficult for us to forecast our annual product bookings and to implement effective measures to cover any shortfalls of prior fiscal quarters if product bookings for the fourth fiscal quarter fail to meet our expectations.
Furthermore, we continue to emphasize large capacity systems in our product development and marketing strategies. Contracts for Digital Services installations typically involve a lengthy, complex and highly competitive bidding and selection process, and our ability to obtain particular contracts is inherently difficult to predict. A delay, cancellation or postponement of significant orders may cause us to miss our projections, which may not be discernible until the end of a financial reporting period.
It is difficult for us to forecast the timing of orders because our customers often need a significant amount of time to evaluate products before purchasing them. The period between initial customer contact and a purchase by a customer may vary from a few weeks to more than a year. During the evaluation period, customers may defer or scale down proposed orders of products for various reasons, including:
• | changes in budgets and purchasing priorities; |
• | reduced need to upgrade existing systems; |
• | deferrals in anticipation of enhancements or new products; |
• | introduction of products by competitors; and |
• | lower prices offered by competitors. |
We have many significant customers and frequently receive multi-million dollar orders. The deferral or loss of one or more significant orders or customers, could materially and adversely affect our results of operations in future fiscal periods.
We base our current and future expense levels on internal operating plans and sales forecasts, and operating costs are, to a large extent, fixed. As a result, we may not be able to sufficiently reduce our operating costs in any period to compensate for an unexpected near-term shortfall in revenue.
Decline or weakness in the global economy may result in reduced information technology spending and reduced demand for our products and services.
We derive a substantial portion of our revenue from CSPs. Historically, during times of weakness in the global economy, many of our customers experienced significant declines in revenue and profitability and some customers were required to reduce excessive debt levels. In response to these challenges, many of our customers implemented cost-cutting measures, and more closely managed their operating expenses and capital investment budgets. These responses resulted in reduced demand for our products, services and solutions, longer customer purchasing decisions and pricing pressures that adversely affected our revenue, profitability and cash flow. More specifically, adverse market conditions have had a negative impact on our business by reducing the number of contracts we were able to sign with new customers and the size of initial spending commitments, as well as decreasing the level of discretionary spending under contracts with existing customers. In addition, a slowdown in buying decisions of CSPs has in the past affected, and may affect our business by increasing the risks of credit or business failures of suppliers, customers or distributors, by customer requirements for extended payment terms, by delays and defaults in customer or distributor payments, and by price reductions instituted by competitors to retain or acquire market share. In response to these events we, similar to other companies, engaged in significant cost savings measures.
10
During the fiscal year ended January 31, 2016, the global economy continued to experience a modest recovery but was still subject to significant volatility and uncertainty. If the global economy continues to experience volatility and uncertainty or market conditions worsen, our existing and potential customers will likely reduce their spending, which, in turn, would reduce the demand for our products and services, and materially affect our business, including our revenue, profitability and cash flows. In addition, we would likely be required to again undertake significant cost-saving measures, which measures may negatively impact our ability to implement our strategies and obtain our objectives, particularly if we are not able to invest in our businesses as a result of a protracted economic downturn.
Conditions in the telecommunications industry have harmed and may continue to harm our business, including our revenue, profitability and cash flows.
We have experienced certain adverse conditions in the telecommunications industry, including the emergence of new, lower-cost competitors from emerging markets, continued pressure on both capital expenditure and operating budgets at CSPs due to reduced ARPU, the proliferation of alternative messaging applications and new over-the-top competitors to CSPs, the maturation of wireless services, the commoditization of some voice and SMS text message services, the increased dependence for growth on emerging markets with a lower average revenue per user, customer consolidation and changes in the regulatory environment at times. These conditions have had, and could continue to have, a material adverse effect on our business, including our revenue, profitability and cash flows.
Restructuring initiatives to align operating costs and expenses with anticipated revenue could have an adverse impact on our product development, project deployment and the timely execution of our business strategy.
In recent years we have implemented certain initiatives to improve operating performance and cash flow from operations. We intend to continue to implement these initiatives, which we believe will enhance efficiency and result in significant reductions in costs and operating expenses, including realigning our cost structure to our current size and business environment by primarily reducing our selling, general and administrative expenses. We intend to continue to implement restructuring initiatives during the fiscal year ending January 31, 2017 in connection with the sale of the BSS business to Amdocs, the acquisition of Acision and as part of our ongoing review of our operations. While restructuring our operations is designed to improve operational efficiency and business performance, there is a risk that such restructuring could have an adverse impact on our product development, project deployment and the timely execution of our business strategy. In addition, there is no assurance that these initiatives will reduce costs and the costs to implement them may offset any savings for a period of time.
We have engaged third parties to perform portions of our business operations, including research and development, project deployment, delivery, maintenance and support functions, and expect to use third parties for additional business operations which may limit our control over these business operations and exposes us to additional risk as a result of our reliance on third-party providers.
We use third-party subcontractors, also referred to as third-party providers, primarily for certain research and development, project deployment, delivery, maintenance and support, and general and administrative functions, primarily in India, Israel, China and the United States. As of January 31, 2016, we used approximately 850 independent subcontractors for such functions, including under our master services agreement with Tech Mahindra Limited (or Tech Mahindra). For more information about the agreement with Tech Mahindra, see “−Risks Related to Our Recent Material Transactions.”
We use third-party providers to help provide flexibility to our cost structure as well as provide expertise in certain areas where the hiring of some skills in certain geographies may be difficult to obtain. While we utilize several companies to supply subcontractors and other services, we rely on a few for a large portion of these functions. For example, we expect to be dependent on Tech Mahindra for the provision of services related to our Digital Services business. To the extent we do not properly manage or supervise our third-party providers, or where we cannot find an adequate number of qualified third-party providers, we may experience delays and quality issues and ultimately cost overruns and losses on projects. In addition, any disputes or other interruptions in our relationships with such third-party providers may have a material adverse effect on our business.
Furthermore, as we rely on third-party providers for more of our business operations, we are not able to directly control these activities. Our third-party providers may not prioritize our business over that of their other customers and they may not meet our desired level of quality, performance, service, cost reductions or other metrics. Failure to meet key performance indicators may result in our being in default with our customers. In addition, we may rely on our third-party providers to secure materials from our suppliers with whom our third-party providers may not have existing relationships and we may be required to continue to manage these relationships even after we engage third-party providers to perform certain business operations.
11
As we engage third-party providers for business operations we become dependent on the IT systems of our third-party providers, including to transmit demand and purchase orders to suppliers, which can result in a delay in order placement. In addition, in an effort to reduce costs and limit their liabilities, our third-party providers may not have robust systems or make commitments in as timely a manner as we require.
In some cases the actions of our third-party providers may result in our being found to be in violation of laws or regulations like import or export regulations. As many of our third-party providers operate outside of the U.S., our activity through third-party providers exposes us to information security vulnerabilities and increases our global risks. In addition, we are exposed to the financial viability of our third-party providers. Once a business activity is transitioned to a third-party provider we may be contractually prohibited from or may not practically be able to bring such activity back within our company or move it to another third-party provider. The actions of our third-party providers could result in reputational damage to us and could negatively impact our financial results.
Our success depends on our ability to implement strategies for achieving growth by enhancing our existing products and developing and marketing new products in response to rapidly changing technology in our industries.
The software and high technology industry is subject to rapid change. The introduction of new technologies and new alternatives for the delivery of services are having, and can be expected to continue to have, a profound effect on competitive conditions in the market and our success. We have executed strategies to capitalize on growth opportunities in new and emerging products and technologies to offset such pressures. While certain of these new products and technologies have proven to initially be successful, it is unclear whether they will be widely adopted by our customers and potential customers. Any increases in revenue from these new products and technologies may not, however, exceed any declines in revenue we may experience from the sale of traditional products and technologies and our revenue and profitability may be adversely affected.
Our success depends on our ability to correctly anticipate technological trends, to react quickly and effectively to such trends and to enhance our existing products accordingly. Our success also depends, in part, on the development and introduction of new products on a timely and cost-effective basis, the acceptance of these new products by customers and consumers, and the corresponding risks associated with the development, marketing and adoption of these new products. As a result, the life cycle of our products is difficult to estimate. New product offerings may not enter the market in a timely manner for their acceptance or may not properly integrate into existing platforms. The failure of new product offerings to be accepted by the market could have a material adverse effect on our business. Our revenue and profitability may be adversely affected in the event that our customers reduce our actual and planned expenditures to expand or replace equipment or if we delay and reduce the deployment of new products.
Changing industry and market conditions may dictate strategic decisions to restructure some business units and discontinue others. Discontinuing a business unit or a product line may require us to record accrued liabilities for restructuring expenses. These strategic decisions could result in changes to determinations regarding a product's useful life and the recoverability of the carrying basis of certain assets.
We must often establish and demonstrate the benefits of new and innovative products to customers.
Many of our new and innovative products are complex. In many cases, it is necessary for us to educate existing and potential customers about the benefits and value of such new and innovative products, with no assurance that the customer will ultimately purchase them. The need to educate our customers increases the difficulty and time necessary to complete transactions, makes it more difficult to efficiently deploy limited resources, and creates risk that we will have invested in an opportunity that ultimately does not come to fruition. If we are unable to establish and demonstrate to customers the benefits and value of our new and innovative products and convert these efforts into sales, our business, including our revenue, profitability and cash flows, will be adversely affected.
We are exposed to risks associated with the sale of large systems and large system installations.
We have historically derived a significant portion of our sales and operating profit from contracts for large system installations with major customers. We continue to emphasize large capacity systems in our product development and marketing strategies. Contracts for large capacity system installations typically involve a lengthy, complex and highly competitive bidding and selection process, and our ability to obtain particular contracts is inherently difficult to predict. The timing and scope of these opportunities and the pricing and margins associated with any eventual contract award are difficult to forecast, and may vary substantially from transaction to transaction. As a result, our future operating results may exhibit a high degree of volatility and may vary significantly from period to period. The degree of our dependence on large system orders, and the investment required to enable us to perform such orders, without assurance of continuing order flow from the same customers, increases the risk associated with our business. Furthermore, if our professional services employees do not provide installation services
12
effectively and efficiently, our customers may not use our installation services or may stop using our software. This could adversely impact our revenue and harm our reputation.
We may incur significant fees, penalties and costs in respect of undetected defects, errors or operational problems in our complex products.
Our products are complex and involve sophisticated technology that performs critical functions to highly demanding standards. Our existing and future products may develop operational problems and we may incur fees and penalties in connection with such problems. In addition, when we introduce products to the market or as we release new versions of existing products, the products may contain undetected defects or errors. We may not discover such defects, errors or other operational problems until after products have been released and used by the customer. We may incur significant costs to correct undetected defects, errors or operational problems in our products, including product liability claims. In addition, defects or errors in products also may result in questions regarding the integrity of the products, which could cause adverse publicity and impair their market acceptance, resulting in lost future sales.
If our products fail to function as promised, we may be subject to claims for substantial damages. Courts may not enforce provisions in contracts that would limit our liabilities or otherwise protect us from liability for damages. Although we maintain general liability insurance coverage, including coverage for errors or omissions, this coverage may not continue to be available on reasonable terms or in sufficient amounts to cover claims against us. In addition, our insurers may disclaim coverage as to any future claim. If claims exceeding the available insurance coverage are successfully asserted against us, or our insurers impose premium increases, large deductibles or co-insurance requirements, our business, including our cash position and profitability, could be adversely affected.
We depend on a limited number of suppliers and manufacturers for certain components and are exposed to the risk that these suppliers and manufacturers will not be able to fill our orders on a timely basis and at the specifications we require.
We rely on a limited number of suppliers and manufacturers for specific components and third-party software and may not be able to find alternate manufacturers or third-party software providers that meet our requirements. Existing or alternative sources may not be available on favorable terms and conditions, or at all. Thus, if there is a shortage of supply for these components or third-party software, we may experience an interruption in our product supply.
Increased competition could force us to lower our prices or take other actions to differentiate our products and changes in the competitive environment in the telecommunications industry worldwide could seriously affect our business.
Our competitors may be able to develop more quickly or adapt faster to new or emerging technologies and changes in customer requirements, or devote greater resources to the development, promotion and sale of their products. Some of our competitors have, relative to us, greater name recognition and significantly greater financial, technical, marketing, customer service, public relations, distribution and other resources. We also experience competition from significantly larger network providers who, as a result of their size, may be able to put pressure on prices. Certain Asian competitors have cost structures and financing alternatives that allow them in certain locations to also put pressure on prices. In addition, our competitors that manufacture other network telecommunications equipment may derive a competitive advantage in selling systems to customers that are purchasing, or have previously purchased, other compatible network equipment from such manufacturers. Furthermore, due to competition and market trends we expect to provide an increased portion of our solutions as SaaS, which is expected to create further pricing pressures. In addition, some of our customers may in the future decide to develop their own solutions internally instead of purchasing them from us. Increased competition could force us to lower our prices or take other actions to differentiate our products.
In addition, the telecommunications industry in which we operate continues to undergo significant changes as a result of deregulation and privatization worldwide, reduced restrictions on competition in the industry and rapid and evolving technologies. The worldwide enhanced services industry is already highly competitive and we expect competition to intensify. In addition, as we enter new markets as a result of our own research and development efforts, acquisitions or changes in subscriber preferences, we are likely to encounter new competitors. Moreover, we face indirect competition from changing and evolving technology, which provides alternatives to our products and services. For example, the introduction of open access to web-based applications from wireless devices allows end users to utilize web-based services, such as Facebook, FaceTime, Google, WhatsApp, Line or Skype, to access, among other things, IP communications free of charge rather than use similar services provided by CSPs. This may reduce demand and the price of our products and services.
Our compliance with telecommunications regulations and standards may be time-consuming, difficult and costly.
In order to maintain market acceptance, our products must continue to meet a significant number of regulations and standards. In the United States, our products must comply with various regulations defined by the Federal Communications
13
Commission (or the FCC), as well as national and international standards. Internationally, our products must comply with standards established by telecommunications authorities in various countries as well as with recommendations of the International Telecommunications Union. As these standards evolve and if new standards are implemented, we will be required to modify our products or develop and support new versions of our products, and this may negatively affect the sales of our products and increase our costs. The failure of our products to comply, or delays in compliance, with the various existing and evolving industry standards could prevent or delay introduction of our products, which could harm our business.
Government regulatory policies are likely to continue to have an impact on product development costs and project spending costs and accordingly, on the pricing of existing as well as new public network services and, therefore, are expected to affect demand for such services and the communications products, including our products, which support these services. Tariff rates, the rates charged by service providers to their customers, whether determined by service providers or in response to regulatory directives, may affect the cost effectiveness of deploying and promoting certain public network services. Tariff policies are under continuous review and are subject to change. Future changes in tariffs by regulatory agencies or the application of tariff requirements to additional services could adversely affect the sales of our products to certain customers.
There may be future changes in U.S. and international telecommunications regulations that could slow the expansion of the service providers' network infrastructure and materially adversely affect our business. User uncertainty regarding future policies may also affect demand for communications products, including our products. In addition, the convergence of circuit and packet networks could be subject to governmental regulation. Currently, few laws or regulations apply to the Internet and to matters such as voice over the Internet. Regulatory initiatives in this area could decrease demand for our products and increase the cost of our products, thereby adversely affecting our business.
Environmental and other related laws and regulations subject us to a number of risks and could result in significant liabilities and costs.
Our operations are subject to certain foreign, federal, state and local regulatory requirements relating to environmental, waste management, labor and health and safety matters, including disclosure of the use of certain “conflict minerals.” Management believes that our business is operated in material compliance with all such regulations. However, violations may occur in the future as a result of human error, equipment failure or other causes, and any violation of these laws can subject us to significant liability, including fines, penalties and possible prohibition of sales of our products into one or more states or countries and result in a material adverse effect on our financial condition or results of operations.
As a reporting company, we are required to comply with rules adopted by the SEC pursuant to Section 1502 of the Dodd-Frank Wall Street Reform and Consumer Protection Act that require disclosure of the use of conflict minerals that are mined from the Democratic Republic of Congo and adjoining countries. We have incurred and expect to continue to incur costs associated with complying with these disclosure requirements, including for conducting diligence procedures to determine the sources of conflict minerals that may be used or necessary to the production of our products and, if applicable, potential changes to products, processes or sources of supply as a consequence of such verification activities. In addition, these rules could adversely affect the sourcing, supply and pricing of materials used in our products, particularly if the number of suppliers offering the minerals identified as conflict minerals sourced from locations other than the Democratic Republic of Congo and adjoining countries is limited.
To date, the cost of compliance with such laws and regulations has not had a material impact on our expenditures, earnings or competitive position or that of our subsidiaries. We cannot, however, predict the nature, scope or effect of environmental legislation or regulatory requirements that could be imposed or how existing or future laws or regulations will be administered or interpreted. Compliance with more stringent laws or regulations, as well as more vigorous enforcement policies of regulatory agencies, could require substantial expenditures by us and could have a material impact on our business, financial condition and results of operations.
Security breaches and other disruptions could compromise our information or those of our third-party providers, expose us to liability and harm our reputation and business.
In the ordinary course of our business, we collect and store sensitive data in our data centers and on our networks, including intellectual property, personal information, our proprietary business information and that of our customers, suppliers and business providers, and personally identifiable information of our customers and employees. Further, we are dependent, in certain instances, upon our third-party providers and other third parties to adequately protect our sensitive data. The secure maintenance and transmission of this information is critical to our operations and business strategy. We rely on commercially available systems, software, tools and monitoring to provide security for processing, transmission and storage of confidential information. Computer hackers may attempt to penetrate our computer systems or those of our third-party providers or other third parties and, if successful, misappropriate personal or confidential business information. In addition, an associate, contractor, or other third-party with whom we do business may attempt to circumvent our security measures in order to obtain such information, and may purposefully or inadvertently cause a breach involving such information. Any such compromise of
14
our data security and access or those of our third-party providers or other third parties with whom we may do business, public disclosure, or loss of personal or confidential business information could result in legal claims or proceedings, liability under laws that protect the privacy of personal information, and regulatory penalties, disrupt our operations, damage our reputation and customers’ willingness to transact business with us, and subject us to additional costs and liabilities any of which could adversely affect our business.
In addition, because we engage third-party providers for certain business operations, we are dependent on our third-party providers to protect certain of our sensitive data. Due to these relationships, the “attack surface” for us to protect against unauthorized access to such data is often extended to our third-party business providers and other third parties, and we may be dependent upon their cyber security capabilities as well as their willingness to exchange threat and response information with us.
Although we have historically experienced actual or attempted breaches of our computer systems and none of these breaches has had a material effect on our business, operations or reputation, there can be no assurance such will be the case in the future.
Failure or delay by us to achieve interoperability of our products with the systems of our customers could impair our ability to sell our products.
In order to penetrate new target markets, it is important that we ensure the interoperability of our products with the operations, administration, maintenance and provisioning systems used by our customers. Failure or delay in achieving such interoperability could impair our ability to sell products to some segments of the communications market and would adversely affect our business, including our revenue, profitability and cash flows.
Many of our sales are made by competitive bid or other competitive process which often require us to expend significant resources with no guaranty of recoupment.
Many of our sales, particularly in larger installations, are made by competitive bid or other competitive process. Successfully competing in competitive bidding situations subjects us to risks associated with:
• | the frequent need to bid on programs in advance of the completion of our design, which may result in unforeseen technological difficulties and cost overruns; |
• | incurring research and development expenses to improve or refine products in advance of winning the bid; and |
• | the substantial time, money, and effort, including design, development, and marketing activities, required to prepare bids and proposals for contracts that may not be awarded to us. |
If we do not ultimately win a bid, we may obtain little or no benefit from these expenditures and may not be able to recoup them on future projects.
Even where we are not involved in a competitive bidding process, due to the intense competition in our markets and increasing customer demand for shorter delivery periods, we must, in some cases, begin implementation of a project before the corresponding order has been finalized, increasing the risk that we will have to write off expenses associated with pursuing opportunities that ultimately do not come to fruition.
In addition, we sell certain products as components in large bids submitted by third parties, including systems integrators. These third parties may not be able to win these bids for reasons unrelated to our products. Accordingly, we may lose potential business, which may be significant, for reasons beyond our control.
Third parties may infringe upon our proprietary technology and we may infringe on the intellectual property rights of others.
We rely on a combination of patent, copyright, trade secret and trademark law and contractual non-disclosure and other provisions to protect our technology. These measures may not be sufficient to protect proprietary rights, and third parties may misappropriate our technologies and use for their own benefit. Also, most of these protections do not preclude competitors from independently developing products with functionality or features substantially equivalent or superior to our software. Any failure to protect our intellectual property could have a material adverse effect on our business.
While we regularly file patent applications, patents may not be issued on the basis of such applications and, if such patents are issued, they may not be sufficient to protect our technologies. In addition, any patents issued to us may be challenged, invalidated or circumvented. Despite our efforts to protect our intellectual property and proprietary rights, unauthorized parties may attempt to copy or otherwise obtain and use our products or technologies. Effectively policing the unauthorized use of our products is time-consuming and costly, and the steps taken by us may not prevent misappropriation of our technologies, particularly in foreign countries where in many instances the local laws or legal systems do not offer the same level of protection as in the United States.
15
If others claim that certain of our products infringe their intellectual property rights, we may be forced to seek expensive licenses, reengineer our products, engage in expensive and time-consuming litigation or stop marketing those products. We have been party to patent litigations. We attempt to avoid infringing known proprietary rights of third parties in our product development efforts. There are many issued patents as well as patent applications in the fields in which we are engaged. Because patent applications in the United States are not publicly disclosed until published or issued, applications may have been filed which relate to our software and products. If we were to discover that our products violated or potentially violated third-party proprietary rights, we might not be able to continue offering these products without obtaining licenses for those products or without substantial reengineering of the products. Any reengineering effort may not be successful and such licenses may not be available. Even if such licenses were available, they may not be offered to us on commercially reasonable terms.
Substantial litigation regarding intellectual property rights exists in technology related industries, and our products may be increasingly subject to third-party infringement claims as the number of competitors in our industry segments grows and the functionality of software products in different industry segments overlaps. In addition, we agreed to indemnify certain customers in certain situations should it be determined that our products infringe on the proprietary rights of third parties and have received certain requests for indemnification from customers. Any third-party infringement claims could be time consuming to defend, result in costly litigation, divert management's attention and resources, cause product and service delays or may require us to enter into royalty or licensing agreements. Any royalty or licensing arrangements, if required, may not be available on terms acceptable to us, if at all. A successful claim of infringement against us and our failure or inability to license the infringed or similar technology could have a material adverse effect on our business, including profitability and cash flows.
Use of free or open source software could expose our products to unintended consequences, including causing code that we develop to become publicly available, which could materially adversely affect our business.
Some of our products contain free or open source software, referred to collectively as “open source software,” and we anticipate we will make additional use of open source software in the future. Open source software is generally covered by license agreements that permit the user to use, copy, modify and distribute the software without cost, provided that the licensee abides by certain licensing requirements. For example, some open source software license agreements permit the licensee to distribute a derivative work (e.g., a combination of the open source software with other software), but only if the user makes the source code for the entire derivative works available to recipients of the derivative work. If we were required to make any of its proprietary source code available under an open source license, our customers, system integrators and others could have the right to maintain, modify and/or use such code without payment of any license, maintenance or other fees. In recent periods, we have taken steps to mitigate this risk; however, products delivered in the past are subject to greater exposure to open source licensing issues. Furthermore, the developers of open source software generally provide no warranties on such software, which exposes us to greater risk than if we had incorporated third-party commercial software into our products instead of open source software.
Certain contractual obligations could expose us to uncapped or other significant liabilities.
Certain contract provisions, principally confidentiality and indemnification obligations in certain of our license agreements, could expose us to risks of significant loss that, in some cases, are not limited by contract to a specified maximum amount. Even where we are able to negotiate limitation of liability provisions, these provisions may not always be enforced depending on the facts and circumstances of the case at hand. If we or our products fail to perform to the standards required by our contracts, we could be subject to uncapped or other significant liability for which we may or may not have adequate insurance and our business, financial condition and results of operations, including cash position and profitability, could be materially adversely affected.
We recently completed the acquisition of Acision and may continue to pursue mergers and acquisitions and strategic investments that present risks and may not be successful.
We have made acquisitions in the past and continue to examine opportunities for growth through mergers and acquisitions. Mergers and acquisitions entail a number of risks including:
• | the impact of the assumption of known potential liabilities or unknown liabilities associated with the merged or acquired companies; |
• | financing the acquisition through the use of cash reserves, the incurrence of debt or the issuance of equity securities, which may be dilutive to our existing stockholders; |
• | the difficulty of assimilating the operations, personnel and customers of the acquired companies into our operations and business; |
• | the potential disruption of our ongoing business and distraction of management; |
16
• | the difficulty of integrating acquired technology and rights into our services and unanticipated expenses related to such integration; |
• | the difficulty of achieving the anticipated synergies from the combined businesses, including marketing, product integration, sales and distribution, product development and other synergies; |
• | the failure to successfully develop acquired technology, resulting in the impairment of amounts capitalized as intangible assets at the date of the acquisition; |
• | the potential for patent, trademark and other intellectual property infringement claims against the acquired company; |
• | the impairment of relationships with customers and partners of the acquired companies or our customers and partners as a result of the integration of acquired operations; |
• | the impairment of relationships with employees of the acquired companies or our employees as a result of integration of new management personnel; |
• | the difficulty of integrating the acquired company's accounting, management information, human resources and other administrative systems into existing administrative, financial and managerial controls, reporting systems and procedures, particularly in the case of large acquisitions; |
• | the need to implement required controls, procedures and policies at private companies which, prior to acquisition, lacked such controls, procedures and policies; |
• | in the case of foreign acquisitions, uncertainty regarding the impact of foreign laws and regulations, currency risks and the particular economic, political and regulatory risks associated with specific countries and the difficulty integrating operations and systems as a result of language, cultural, systems, accounting principles and operational differences; |
• | the potential inheritance of the acquired companies' past financial statements with their associated risks; and |
• | the potential need to write-down impaired goodwill associated with any such transaction in subsequent periods, resulting in expenses to operations. |
We continue to make significant investments in our business and to examine opportunities for growth. These activities may involve significant expenditures and obligations that cannot readily be curtailed or reduced if anticipated demand for the associated products does not materialize or is delayed. The impact of these decisions on future financial results cannot be predicted with assurance, and our commitment to growth may increase our vulnerability to downturns in our markets, technology changes and shifts in competitive conditions.
We are dependent upon hiring and retaining highly qualified employees.
We believe that our future success depends in large part on our continued ability to hire, train, develop, motivate and retain highly qualified employees, including sales, technical and managerial personnel. Competition for highly qualified employees in our industry is significant. We believe that there are only a limited number of individuals with the requisite skills to serve in many of our key positions and it is difficult to hire and retain those individuals. Failure to attract and retain highly qualified employees may have an adverse effect on our ability to develop new products and enhancements for existing products and to successfully market and sell those products.
We face certain risks associated with potential labor disruptions.
Our employees based in certain countries, including Israel, France, Germany, Italy and Brazil, are represented by a representative organization and works councils, as applicable (referred to collectively as unions).
We conduct discussions with the unions on various matters. In August 2015, The Histadrut (General Federation of Labor in Israel), the representative organization of our employees in Israel, following certain discussions with us, declared a labor dispute which was ultimately resolved and did not lead to a strike. However, if future negotiations of collective bargaining agreements or other discussions with the unions are not successful or become unproductive, the affected unions could take actions such as strikes, work slowdowns or work stoppages. Strikes, work slowdowns or work stoppages or the possibility of such actions could delay or affect the transition process or otherwise have an adverse effect on our business. We could also incur higher costs from such actions, new collective bargaining agreements or the renewal of collective bargaining agreements on less favorable terms.
Environmental and other disasters may adversely impact our business.
Environmental and other disasters, such as flooding, earthquakes, volcanic eruptions or nuclear or other disasters, or a combination thereof, may negatively impact our business. Environmental and other disasters may cause disruption to our
17
operations in the regions impacted by such disasters and impede our ability to sell our solutions and services. In addition, customers located in countries or regions impacted by environmental and other disasters, may decide to suspend or discontinue projects. The occurrence of any environmental and/or other material disasters may have an adverse impact on our business in the future.
Risks Relating to International Operations
Geopolitical, economic, security and military conditions in countries in which we and our third-party providers operate may adversely affect us.
We have significant operations outside the United States, including research and development, manufacturing, sales, and support. Geopolitical, economic, security and military conditions could directly affect our operations or those of our third-party providers. Recent turmoil in the geopolitical environment in many parts of the world, including terrorist activities, military actions or political unrest, instability marked by civil war, military actions and conflicts in or adjacent to countries in which we or our third-party providers operate and the nationalization of privately-owned telecommunications companies, may cause disruptions to our business. Adverse Geopolitical, economic, security and military conditions may result in delays in or disruption to our research and developments activities, project deployment, manufacture and shipments of products, service and support services and delays or cancellations of customer orders. If these risks were to materialize, our business, including revenue, profitability and cash flows, would likely be materially adversely affected. In addition, if these events result in restrictions on travel or unsafe travel conditions, our ability to service our existing clients on-site and secure new business from potential new clients would likely be adversely affected. In addition, employees of ours and our third-party providers in certain countries are required to perform annual mandatory military service and are subject to being called to active duty at any time under emergency circumstances. The absence of these employees may have an adverse effect on our operations.
We derive a significant portion of our total revenue from customers outside the United States and have significant international operations, which subject us to risks inherent with foreign operations.
For the fiscal years ended January 31, 2016, 2015 and 2014, we derived approximately 70%, 69%, and 60% respectively, of our total revenue from customers outside of the United States. We maintain significant international operations in the Czech Republic, India, Israel and the United Kingdom and elsewhere throughout the world, including with respect to business functions that we may engage third parties to operate. Approximately 89% of our employees and approximately 79% of our facilities were located outside the United States as of January 31, 2016. Conducting business internationally exposes us to particular risks inherent in doing business in international markets, including, but not limited to:
• | lack of acceptance of non-localized products; |
• | legal and cultural differences in the conduct of business; |
• | difficulties in hiring qualified foreign employees and staffing and managing foreign operations; |
• | longer payment cycles; |
• | difficulties in collecting accounts receivable and withholding taxes that limit the repatriation of cash; |
• | tariffs and trade conditions; |
• | currency exchange rate fluctuations; |
• | rapid and unforeseen changes in economic conditions in individual countries; |
• | increased costs resulting from lack of proximity to customers; |
• | difficulties in complying with varied legal and regulatory requirements across jurisdictions, including tax laws, labor laws, employee benefits, customs requirements and currency restrictions; |
• | different tax regimes and potentially adverse tax consequences of operating in foreign countries; |
• | immigration regulations that limit our ability to deploy our employees; |
• | difficulties in complying with applicable export laws and regulations requiring licensure or authorization to sell products; |
• | difficulties in repatriating cash held by our foreign subsidiaries on a tax efficient basis; and |
• | turbulence in foreign currency and credit markets. |
One or more of these factors could have a material adverse effect on our international operations.
18
Our business in countries with a history of corruption and transactions with foreign governments, including with government owned or controlled CSPs, increase the risks associated with our international activities.
We are subject to the U.S. Foreign Corrupt Practices Act (or the FCPA) and other laws of the United States and other countries, including the UK Bribery Act 2010 (or the UK Bribery Act), that prohibit improper payments or offers of payments for the purpose of obtaining or retaining business. We have operations, deal with customers and make sales in countries known to experience corruption. Our activities in these countries create the risk of unauthorized payments or offers of payments by one of our employees, consultants, sales agents or distributors that could be in violation of various U.S. and local laws, including the FCPA and the UK Bribery Act, even though these parties are not always subject to our control.
We have implemented safeguards designed to eliminate improper practices by our employees, consultants, external sales agents and resellers. However, these safeguards and any future improvements may prove to be less than effective, and our employees, consultants, external sales agents or distributors may engage in the future in conduct for which we might be held responsible. Violations of the FCPA and other laws of the United States and other countries may result in significant civil and/or criminal penalties and other sanctions, which could have a material adverse effect on our business, financial condition and results of operations. In addition, violations of these laws, including the FCPA and the U.K. Bribery Act, may harm our reputation and deter governmental agencies and other existing or potential customers from buying our products and engaging our services.
Rules of the Authority for Technological Innovation (formerly known as the Office of the Chief Scientist) may limit our ability to transfer technology outside of Israel or engage in strategic transactions or require us to pay redemption fees in the event we engage in such transactions.
Historically, a portion of the research and development operations of our Israeli subsidiary benefited from financial incentives provided by government agencies to promote research and development activities performed in Israel. Our research and development activities included projects submitted for partial funding under a program administered by the Authority for Technological Innovation of the Israeli Ministry of the Economy, formerly known as the Office of the Chief Scientist (or the ATI), under which reimbursement of a portion of our research and development expenditures was made subject to final approval of project budgets. Although the Government of Israel does not own proprietary rights in the ATI-funded Products and there is no specific restriction by the ATI with regard to the export of the ATI-funded Products, under certain circumstances, there may be limitations on our ability to transfer technology, know-how and manufacturing of ATI-funded Products outside of Israel. Such limitations could result in the requirement to pay increased royalties or a redemption fee calculated according to the applicable regulations. During the fiscal year ended January 31, 2013, we discontinued the practice of seeking funding from the ATI and accordingly, there were no new programs initiated with the ATI during the fiscal years ended January 31, 2016, 2015 or 2014. In addition, we do not plan to submit any new applications for funding. However, the limitations on the transfer of technology, know-how and manufacturing of ATI-funded Products outside of Israel continue to apply. The difficulties in obtaining the approval of the ATI for the transfer of technology, know-how, manufacturing activities and/or manufacturing rights out of Israel could impair the ability of some of our subsidiaries to outsource manufacturing, enter into strategic alliances or engage in similar arrangements for those technologies, know-how or products or, if approved may require us to pay significant redemption fees. If we are restricted from engaging in such transactions or may be required to pay redemption fees, our business, results of operations and cash flows could be materially adversely affected.
Currency exchange rates, fluctuations of currency exchange rates and limitations imposed by certain countries on the outflow of their currencies could have a material adverse effect on our results of operations.
Although partially mitigated by our hedging activities, we are impacted by currency exchange rates and fluctuations thereof in a number of ways, including the fact that:
• | A significant portion of our expenses, principally salaries and related personnel expenses, are incurred in new Israeli shekels (or NIS), whereas the currency we use to report our financial results is the U.S. dollar and most of our revenue is generated in U.S. dollars. A significant strengthening of the NIS against the U.S. dollar can considerably increase the U.S. dollar value of our expenses in Israel. Should the NIS strengthen in comparison to the U.S. dollar our results of operations will be adversely affected; |
• | A portion of our international sales is denominated in currencies other than U.S. dollars, such as the euro, thereby exposing us to gains and losses on non-U.S. currency transactions; |
• | A substantial portion of our international sales is denominated in U.S. dollars. Accordingly, devaluation in the local currencies of our customers relative to the U.S. dollar may impair the purchasing power of our customers and could cause customers to decrease or cancel orders or default on payment, which could harm our results of operations; and |
19
• | We translate sales and other results denominated in foreign currency into U.S. dollars for our financial statements. During periods of a strengthening dollar, our reported international sales and earnings could be reduced because foreign currencies may translate into fewer U.S. dollars. |
As noted above, from time to time, we enter into hedging transactions to attempt to limit the impact of foreign currency fluctuations. However, such hedging transactions may not prevent all exchange rate-related losses and risks. Therefore, our business and profitability may be harmed by such exchange rate fluctuations.
In addition, certain countries in which we operate, or in which we may operate, limit the outflow of their currencies to purchase products from foreign companies thus limiting the ability of existing or potential customers to purchase our products. As a result, these practices may have a material adverse effect on our business, financial condition and results of operations, including revenue, profitability and cash flows.
Risks Relating to Our Recent Material Transactions
We are subject to various risks and uncertainties arising out of the MSA pursuant to which a substantial portion of the employee base was transferred to a third-party, Tech Mahindra, any of which could materially and adversely affect our business and operations, and our stock price.
On June 1, 2015, Tech Mahindra began performing certain services for our business on a global basis. In connection with the master services agreement with Tech Mahindra, approximately 500 of our employees have been rehired by Tech Mahindra or its affiliates. Further, we are materially dependent on Tech Mahindra for certain critical functions and operations, including research and development, project deployment, delivery, maintenance, and support services. A significant portion of Tech Mahindra’s employees that provide us services under the master services are located in Israel and are represented by a representative organization. As a result, Tech Mahindra may face labor disputes or experience strikes or work stoppages. Any failure on Tech Mahindra’s part could materially affect our business and financial results and we may fail to achieve the cost savings and other benefits anticipated from the master services agreement.
We are subject to various risks and uncertainties arising out of the completed divestiture of our BSS Business, any of which could materially and adversely affect our business and operations, and our stock price.
We completed the sale of our BSS Business on July 2, 2015. There may be delays in the realization of anticipated benefits of the sale. Following the closing of the sale of the BSS Business, the purchase price is subject to various post-closing adjustment provisions relating to compliance with our representations, warranties and covenants, including post-closing covenants relating to the procurement of various third-party consents, over which we will have no meaningful control.
In connection with the Asset Sale, we agreed to indemnify Amdocs for certain pre-closing liabilities and breaches of certain representations and warranties. Upon the closing, $26 million of the purchase price was deposited into escrow to fund potential indemnification claims and certain adjustments for a period of 12 months following the closing. In August 2015 and May 2016, we received various claims for indemnification against the escrow from Amdocs. We could receive additional claims in the future. While we continue to evaluate certain claims made, we believe several pending claims are without merit and intend to vigorously defend against them. Nonetheless, amounts held in escrow necessary to satisfy pending claims will remain unavailable to us until these claims are resolved. In addition, we are not able to predict the ultimate outcome of these or future claims that Amdocs may assert against us in connection with the asset sale, any of which could have a material adverse effect on our results of operation and financial condition.
In connection with the divestiture of the BSS Business, certain previously allocated corporate overhead costs (indirect BSS costs) charged to the former BSS segment were excluded from discontinued operations and included in continuing operations. Following the closing of the sale of the BSS business, our efforts to reduce such costs and expenses, including through restructuring initiatives, may not be as successful as anticipated, or at all. We may encounter difficulties in implementing restructuring initiatives in certain countries in a timely manner, or at all, and restructuring costs may ultimately exceed our initial estimates. There is no assurance that these initiatives will reduce costs and the costs to implement them may not offset any savings for a period of time.
The failure to successfully integrate the Acision business and/or fully realize expected synergies from the acquisition in the expected timeframe or at all may adversely affect our business and operations.
The success of the Acision acquisition will depend, in part, on our ability to realize the anticipated benefits and cost savings from combining our business prior to the acquisition with the acquired business of Acision. Prior to the completion of the transaction, our business and the acquired Acision business operated independently. The integration process is ongoing and may result in the loss of key employees, the disruption of each company’s ongoing businesses or inconsistencies in standards, controls, procedures and policies that could adversely affect the combined company’s ability to achieve the anticipated benefits of the transaction. We have experienced and may experience difficulties with the integration process, the anticipated synergies and other benefits of the transaction may not be realized fully or at all, or may take longer to realize than expected. Integration efforts between the two companies have and may continue to divert management attention and resources. These integration
20
matters could have an adverse effect on us for an undetermined period. In addition, even if we successfully integrate business operations, we may not realize the full expected benefits of the transaction, including the synergies, cost savings, sales and growth opportunities that we expect. These benefits may not be achieved within the anticipated time frame, or at all.
Also, we have incurred acquisition-related and integration costs, including legal and accounting fees and expenses, and other related charges. We expect to incur additional integration costs, such as IT and financial reporting and controls integration expenses, retention costs and severance costs, which may be higher than expected. We also may incur unanticipated integration-related costs. As a result, we cannot assure you that the combination of our business and the acquired business of Acision will result in the realization of the full synergies and other benefits, or any of them, anticipated from the transaction.
Acision’s indebtedness could adversely affect us, including by decreasing our business flexibility and increasing our costs.
Upon the signing of the definitive documentation relating to the Acision acquisition, Acision, in consultation with us, entered into a consent, waiver and first amendment (referred to as the Amendment) to the Acision senior credit facility, which became effective concurrent with the completion of the Acision acquisition and pursuant to which Acision’s debt under its senior credit facility remains in place. In connection with the Amendment, we have paid certain fees and costs imposed on Acision by its senior lenders as a condition to the effectiveness of the Amendment. The Acision senior credit facility contains customary representations and warranties and affirmative, restrictive and financial covenants, each of which may impose operating and financial restrictions on us and Acision, including restrictions that may limit our ability to engage in acts that we believe may be in our long-term best interests. These provisions, with certain exceptions, restrict Acision’s ability and the ability of its subsidiaries to (i) incur additional indebtedness, (ii) create, incur, assume or permit to exist any liens, (iii) enter into mergers, consolidations or similar transactions, (iv) make investments and acquisitions, (v) make certain dispositions of assets, (vi) make dividends, distributions and prepayments of certain indebtedness, and (vii) enter into certain transactions with affiliates. The Acision senior credit facility also contains customary events of default, including, among other things, non-payment defaults, covenant defaults, material adverse effect defaults, bankruptcy and insolvency defaults and material judgment default.
The operating restrictions and covenants in the Acision senior credit facility and any future financing agreements may limit our ability to finance future operations or capital needs, to engage in other business activities or to respond to changes in market conditions. Acision’s ability to comply with any such covenants could be affected materially by events beyond our and/or Acision’s control, and Acision may be unable to satisfy any such requirements. If Acision fails to comply with any such covenants or any event of default occurs, Acision may need to seek waivers or amendments of such covenants or events of default from the lenders under its senior credit facility or we and/or Acision may seek alternative or additional sources of financing or reduce its expenditures. Acision may be unable to obtain such waivers or amendments or we and/or Acision may not be able to obtain such alternative or additional financing on a timely basis or at all, or on favorable terms.
Acision is required to make periodic principal and interest payments and, in certain circumstances, mandatory prepayments pursuant to the terms of the Acision senior credit facility. If an event of default occurs, the interest rate on any amounts due will increase and the lenders under the Acision senior credit facility may declare all outstanding borrowings, together with accrued interest and other fees and costs, to be immediately due and payable and may exercise remedies in respect of the collateral provided by Acision and its subsidiaries as security. Acision may not be able to repay all amounts due under the Acision senior credit facility in the event these amounts are accelerated and declared due upon an event of default.
We may have difficulty attracting, motivating and retaining executives and other key employees in light of the Acision acquisition.
Uncertainty about the effect of the acquisition on our employees may have an adverse effect on the combined business. This uncertainty may impair our ability to attract, retain and motivate key personnel. If our key employees depart, we may incur costs in identifying, hiring, training and retaining replacements for departing employees, which could reduce our ability to realize the anticipated benefits of the acquisition.
Risks Relating to our Operation as an Independent, Publicly-Traded Company
We have determined that material weaknesses exist in our internal control over financial reporting relative to our Acision subsidiary and tax accounting process that could, if not remediated, have a material adverse impact on our ability to produce timely and accurate financial statements.
We are responsible for establishing and maintaining adequate internal control over financial reporting, as defined in Rule 13a-15(f) under the Exchange Act. We have identified material weaknesses in our internal control over financial reporting as of January 31, 2016 relative to our Acision subsidiary and tax accounting process, as described in Part II, Item 9A of this Annual Report. As a result of these material weaknesses, we concluded that our disclosure controls and procedures were not effective as of January 31, 2016. We originally identified the material weakness in our internal control over financial reporting
21
as of October 31, 2015 relative to our Acision subsidiary, as described in our Quarterly Report on Form 10-Q for the quarterly period then ended. As a result of such material weakness we were unable to timely file our Quarterly Report for the period ended October 31, 2015. The material weakness in our tax accounting process was identified during the three months ended January 31, 2016 and is being reported for the first time in this Annual Report.
A material weakness is defined as a deficiency, or combination of deficiencies, such that there is a reasonable possibility that a material misstatement of our annual or interim financial statements will not be prevented or detected on a timely basis. We are actively engaged in the planning for and implementation of remediation efforts to address the material weaknesses that we identified. Our remediation initiatives include (i) the strengthening of Acision’s internal processes and our tax department, including training for personnel, ensuring account reconciliations are completed and reviewed properly on a timely basis; and (ii) accelerating movement of certain accounting transactions to Ra’anana as appropriate while assessing and upgrading accounting resources as needed throughout our company to ensure reliable accounting processes and effectiveness of managerial reviews. While we have deployed additional resources and work processes at our recently-acquired Acision subsidiary to ensure the reliability of our financial reporting, and undertaken a significant redesign of our financial reporting work processes to ensure that our disclosure controls and procedures, including at our Acision subsidiary, will be effective for subsequent fiscal periods, we are still in the process of implementing and testing these processes and procedures. Implementing any appropriate changes to our internal controls has, and may continue to distract our officers and employees and entail material costs to implement new processes or modify our existing processes. Moreover, investors’ perceptions that our internal controls are inadequate or that we are unable to produce accurate financial statements on a timely basis may harm our stock price. We may conclude that additional measures are required to remediate the material weaknesses in our disclosure controls and procedures that may necessitate additional implementation and evaluation time. If we do not complete our remediation in a timely manner or if our remediation plan is inadequate, there will continue to be a risk of future material misstatements in our annual or interim financial statements and a potential material adverse effect on our ability to file our periodic reports timely.
For as long as we are an emerging growth company, we will be exempt from certain reporting requirements, including those relating to accounting standards and disclosure about our executive compensation, that apply to other public companies.
In April 2012, President Obama signed into law the Jumpstart Our Business Startups Act, or the JOBS Act. The JOBS Act contains provisions that, among other things, relax certain reporting requirements for emerging growth companies, including certain requirements relating to accounting standards and executive compensation disclosure. We are classified as an emerging growth company, which is defined as a company with annual gross revenues of less than $1 billion, that has been a public reporting company for a period of less than five years, and that does not have a public float of $700 million or more in securities held by non-affiliated holders. For as long as we are an emerging growth company, which may be up to five full fiscal years, unlike other public companies, unless we elect not to take advantage of applicable JOBS Act provisions, we will not be required to (1) provide an auditor's attestation report on management's assessment of the effectiveness of our system of internal control over financial reporting pursuant to Section 404 of the Sarbanes-Oxley Act, (2) comply with any new or revised financial accounting standards applicable to public companies until such standards are also applicable to private companies under Section 102(b)(1) of the JOBS Act, (3) comply with any new requirements adopted by the Public Company Accounting Oversight Board, or the PCAOB, requiring mandatory audit firm rotation or a supplement to the auditor's report in which the auditor would be required to provide additional information about the audit and the financial statements of the issuer, (4) comply with any new audit rules adopted by the PCAOB after April 5, 2012 unless the SEC determines otherwise, (5) provide certain disclosure regarding executive compensation required of larger public companies or (6) hold stockholder advisory votes on executive compensation. We cannot predict if investors will find our common stock less attractive if we choose to rely on these exemptions. If some investors find our common stock less attractive as a result of any choices to reduce future disclosure, there may be a less active trading market for our common stock and our stock price may be more volatile.
As noted above, under the JOBS Act, emerging growth companies can delay adopting new or revised accounting standards that have different effective dates for public and private companies until such time as those standards apply to private companies. We intend to take advantage of such extended transition period. Since we would then not be required to comply with new or revised accounting standards on the relevant dates on which adoption of such standards is required for other public companies, our financial statements may not be comparable to the financial statements of companies that comply with public company effective dates. If we were to elect to comply with these public company effective dates, such election would be irrevocable pursuant to Section 107 of the JOBS Act.
The cost of compliance or failure to comply with the Sarbanes-Oxley Act of 2002 may adversely affect our business.
As a new reporting company under the Securities and Exchange Act of 1934 (or the Exchange Act), we are subject to certain provisions of the Sarbanes-Oxley Act of 2002, which may result in higher compliance costs and may adversely affect our financial results. The Sarbanes-Oxley Act affects corporate governance, securities disclosure, compliance practices, internal audits, disclosure controls and procedures, financial reporting and accounting systems. Section 404 of the Sarbanes-Oxley Act,
22
for example, requires companies subject to the reporting requirements of the U.S. securities laws to conduct a comprehensive evaluation of their internal control over financial reporting. We are required to provide our Section 404 evaluation with this annual report on Form 10-K for the fiscal year ended January 31, 2016. The failure to comply with Section 404 may result in investors losing confidence in the reliability of our financial statements (which may result in a decrease in the trading price of our common stock), prevent us from providing the required financial information in a timely manner (which could materially and adversely impact our business, our financial condition, the trading price of our common stock and our ability to access capital markets, if necessary), prevent us from otherwise complying with the standards applicable to us as an independent, publicly traded company and subject us to adverse regulatory consequences.
We may continue to incur significant expenses for professional fees in connection with the preparation of our periodic reports.
We have periodically engaged outside accounting consulting firms and other external consultants to assist our finance and accounting personnel in the preparation of financial statements and periodic reports and incurred significant expenses for their services. Although we expect these expenses to decline and be eliminated over time as we enhance our internal finance and accounting personnel to replace such external consultants and build these functions as an independent, publicly traded company, we may in the near term incur significant expenses relating to professional fees in connection with the preparation of periodic reports, which may materially adversely affect our financial position and cash flows.
We agreed to indemnify a subsidiary of Verint Systems Inc. (or Verint) as successor to CTI and its affiliates following the merger of CTI with and into a subsidiary of Verint (referred to as the Verint Merger) after the Verint Merger against certain claims or losses that may arise in connection with the Verint Merger and the Share Distribution.
Under the Distribution Agreement we and CTI entered into in connection with the Share Distribution, we have agreed to indemnify CTI and its affiliates (including Verint after the Verint Merger) against certain losses that may arise as a result of the Verint Merger and the Share Distribution. Certain of our indemnification obligations are capped at $25.0 million and certain are uncapped. Specifically, the capped indemnification obligations include indemnifying CTI and its affiliates (including Verint after the Verint Merger) against losses stemming from breaches by CTI of representations, warranties and covenants in the Verint Merger Agreement and for any liabilities of CTI that were known by CTI but not included on the net worth statement delivered by CTI at the closing of the Verint Merger. Our uncapped indemnification obligations include indemnifying CTI and its affiliates (including Verint after the Verint Merger) against liabilities relating to our business; claims by any shareholder or creditor of CTI related to the Share Distribution, the Verint Merger or related transactions or disclosure documents; certain claims made by employees or former employees of CTI and any claims made by employees and former employees of ours (including but not limited to the Israeli optionholder suits discussed in note 24 to the consolidated financial statements included in Item 15 of this Annual Report; any failure by us to perform under any of the agreements entered into in connection with the Share Distribution; claims related to CTI's ownership or operation of our company; claims related to the Starhome Disposition (as defined in note 24 to the consolidated financial statements included in Item 15 of this Annual Report); certain retained liabilities of CTI that are not reflected on or reserved against on the net worth statement delivered by CTI at the closing of the Verint Merger; and claims arising out of the exercise of appraisal rights by a CTI shareholder in connection with the Share Distribution.
Future changes in stock ownership could limit our use of net operating loss carryforwards.
As of January 31, 2016, we had net operating loss carryforwards of approximately $369.0 million available to offset future federal taxable income. Similarly, we had net operating loss carryforwards to offset state taxable income in varying amounts. As a result of changes in stock ownership that may take place in the future, there may be limitations on our ability to use net operating loss carryforwards. Limitations on our ability to use net operating loss carryforwards to offset future taxable income could reduce the benefit of our net operating loss carryforwards by requiring us, as applicable, to pay federal and state income taxes earlier than otherwise would be required, and causing part of our net operating loss carryforwards to expire without having been fully utilized. These various limitations resulting from an ownership change could have a material adverse effect on our cash flow and results of operations. We cannot predict the extent to which our net operating loss carryforwards will be limited or the ultimate impact of other limitations that may be caused by future changes in stock ownership, which will depend on various factors.
We may have significant liabilities for taxes of the CTI consolidated group for periods ended on or before the Share Distribution date, and may have an indemnity obligation to CTI for any tax on the Share Distribution.
We and our controlled domestic subsidiaries were members of CTI's consolidated group for U.S. federal income tax purposes. The Share Distribution was a taxable transaction and resulted in our deconsolidation from the CTI consolidated group. U.S. federal income tax law provides that each member of a consolidated group is jointly and severally liable for the consolidated group's entire federal income tax liability for periods when they are members of the same group. Similar principles
23
may apply for foreign, state or local tax purposes where CTI had previously filed or may be determined to have been required to file combined, consolidated or unitary returns with us or our subsidiaries for foreign, state or local tax purposes. In addition, as part of the Share Distribution, we have entered into a Tax Disaffiliation Agreement with CTI, which sets out each party's rights and obligations with respect to deficiencies and refunds, if any, of federal, state, local or foreign taxes for periods before and after the Distribution and related matters such as the filing of tax returns and the conduct of IRS and other audits. Pursuant to the Tax Disaffiliation Agreement, we are required to indemnify CTI for losses and tax liabilities of the CTI consolidated group for periods (or portions thereof) ending at or before the end of the day on the Share Distribution date. Also, since the Share Distribution was a taxable transaction, CTI will be treated as if it had sold the stock of our Company in a taxable sale for its fair market value, and pursuant to the Tax Disaffiliation Agreement we are required to indemnify CTI for any tax on the Share Distribution. Since we are required to indemnify CTI under any circumstance set forth in the Tax Disaffiliation Agreement, we may be subject to substantial liabilities, which could have a material negative effect on our business, results of operations and cash flows.
Risks Relating to Our Common Stock
Our stock price may fluctuate significantly in the future, which may make it difficult for stockholders to resell shares of common stock at times or prices that they find attractive.
The price of our common stock on NASDAQ constantly changes. We expect that the market price of our common stock will continue to fluctuate, depending upon many factors, some of which may be beyond our control, including:
• | changes in expectations concerning our future financial performance and the future performance of the communication industry in general, including financial estimates and recommendations by securities analysts; |
• | differences between our actual financial and operating results and those expected by investors and analysts; |
• | strategic moves by us or our competitors, such as acquisitions or restructurings; |
• | changes in the regulatory framework affecting our international operations; and |
• | changes in general economic or market conditions. |
Stock markets in general have experienced volatility unrelated to the operating performance of a particular company. These broad market fluctuations may adversely affect the trading price of our common stock.
Substantial sales of shares of our common stock could cause our stock price to decline.
All of our outstanding shares may be sold immediately in the public market. The sales of significant amounts of our common stock or the perception in the market that this will occur may result in the lowering of the market price of our common stock.
Holders of our common stock may be adversely affected through dilution.
We may need to issue equity in order to fund working capital, capital expenditures and product development requirements or to make acquisitions and other investments. If we choose to raise funds or make acquisitions and other investments through the issuance of common equity, the issuance will dilute our stockholders’ ownership interests.
We cannot provide assurance that we will pay any dividends.
We do not currently plan to pay any dividends. We cannot provide assurance that we will pay any dividends in the future, continue to pay any dividends if we do commence the payment of dividends, or that if we do decide to pay dividends, what the amount of dividends will be or that we will have sufficient surplus under Delaware law to be able to pay any dividends. This may result from extraordinary cash expenses, actual expenses exceeding contemplated costs, funding of capital expenditures, or increases in reserves. If we do not pay dividends, the price of our common stock must appreciate for you to receive a gain on your investment in us. This appreciation may not occur.
Anti-takeover provisions in our organizational documents, our stockholder rights plan, and Delaware law could delay or prevent a change in control.
Anti-takeover provisions of our charter, bylaws, and the Delaware General Corporation Law, or DGCL, may discourage, delay or prevent a merger or acquisition that a stockholder may consider favorable and diminish the opportunity for stockholders to participate in acquisition proposals at a price above the then-current market price of our common stock. For example, our charter and bylaws authorize our Board, without further stockholder approval, to issue one or more classes or series of preferred stock and fix the powers, preferences, rights, and limitations of such class or series, which could adversely
24
affect the voting power of your shares. In addition, our bylaws provide for an advance notice procedure for nomination of candidates to our Board that could have the effect of delaying, deterring, or preventing a change in control.
We also have adopted a stockholder rights plan as a deterrent against an “ownership change” under federal tax law that would diminish our ability to utilize our significant net operating losses and other tax attributes. Although the rights plan is intended to reduce the likelihood of an ownership change that could adversely affect us, we cannot assure that it would prevent all transfers that could result in such an ownership change. Further, because the rights plan may restrict a stockholder’s ability to acquire our stock, the liquidity and market value of our stock might be adversely affected. The rights plan also may cause substantial dilution to a person or group that becomes an "acquiring person" under the plan and may discourage or delay a merger or acquisition that individual stockholders consider favorable or in which stockholders might otherwise receive a premium for their shares.
Further, as a Delaware corporation, we are subject to provisions of the DGCL regarding “business combinations,” which can deter attempted takeovers in certain situations. We may, in the future, consider adopting additional anti-takeover measures. The authority of our Board to issue undesignated preferred or other capital stock and the anti-takeover provisions of the DGCL, as well as other current and any future anti-takeover measures adopted by us, may, in certain circumstances, delay, deter, or prevent takeover attempts and other changes in control of us not approved by our Board.
ITEM 1B. | UNRESOLVED STAFF COMMENTS |
None.
ITEM 2. | PROPERTIES |
We lease office space and manufacturing and storage facilities for our operations worldwide. We also have leases for our various sales offices worldwide. The following table presents, as of January 31, 2016, the country location and size (expressed in square feet) of the facilities leased by us:
Total | ||
Israel | 208,122 | |
United States | 105,534 | |
India | 46,601 | |
Czech Republic | 35,811 | |
France | 27,071 | |
United Kingdom | 14,029 | |
Other | 67,460 | |
Total | 504,628 | |
For the fiscal year ended January 31, 2016, the aggregate base annual rent for the facilities under lease, net of sub-lease income, was approximately $3.1 million, and such leases may be subject to various pass-throughs and escalation adjustments. For more detailed information about our leases, see note 23 to the consolidated financial statements included in Item 15 of this Annual Report.
In connection with the 2012 restructuring initiative, certain office space, including offices in New York, New York, have been vacated or consolidated upon expiration of leases.
In May 2012, we entered into an agreement for the lease of a facility in Ra'anana, Israel to replace our then-existing office space in Tel Aviv, Israel. The lease includes an option to exit up to 30% of our leased space in the building subject to a penalty. During the fiscal year ended January 31, 2014, we exercised this option and returned 27% of the building and recognized a termination penalty of $1.7 million during such fiscal year. The term of the lease is for ten years, which commenced in December 2014. In addition, we have the right to extend the term of the lease by up to five years. The annual base rent under the agreement, after partial return of office space, for approximately 218,912 square feet is $4.5 million.
In connection with our 2014 restructuring plan, we have ceased use of an additional 21% of the remaining leased space in Ra'anana, Israel. We recorded restructuring expense for facilities-related costs of $2.0 million and a write-off of $1.5 million in property and equipment during the fiscal year ended January 31, 2015.
In connection with our 2015 restructuring plan, we have ceased use of an additional 7% and have subleased 11% of the leased space in Ra'anana, Israel. We recorded restructuring expense net of change in assumptions for facilities-related costs of $0.8 million during the fiscal year ended January 31, 2016.
We will continue to evaluate our existing lease commitments and reduce or expand space as warranted.
25
ITEM 3. LEGAL PROCEEDINGS
Israeli Optionholder Class Action
CTI and certain of its former subsidiaries, including Xura Ltd. (formerly Comverse Ltd., a subsidiary of ours), were named as defendants in four potential class action litigations in the State of Israel involving claims to recover damages incurred as a result of purported negligence or breach of contract due to previously-settled allegations regarding illegal backdating of CTI options that allegedly prevented certain current or former employees from exercising certain stock options. We intend to vigorously defend these actions.
Two cases were filed in the Tel Aviv District Court against CTI on March 26, 2009, by plaintiffs Katriel (a former Comverse Ltd. employee) and Deutsch (a former Verint Systems Ltd. employee). The Katriel case (Case Number 1334/09) and the Deutsch case (Case Number 1335/09) both seek to approve class actions to recover damages that are claimed to have been incurred as a result of CTI's negligence in reporting and filing its financial statements, which allegedly prevented the exercise of certain stock options by certain employees and former employees. By stipulation of the parties, on September 30, 2009, the court ordered that these cases, including all claims against CTI in Israel and the motion to approve the class action, be stayed until resolution of the actions pending in the United States regarding stock option accounting, without prejudice to the parties' ability to investigate and assert the unique facts, claims and defenses in these cases. On May 7, 2012, the court lifted the stay, and the plaintiffs have filed an amended complaint and motion to certify a class of plaintiffs in a single consolidated class action. The defendants responded to this amended complaint on November 11, 2012, and the plaintiffs filed a further reply on December 20, 2012. A pre-trial hearing for the case was held on December 25, 2012, during which all parties agreed to attempt to settle the dispute through mediation.
The mediation process ended without success. According to the parties’ consent to submit summations in the motion to certify the claims as a class action (or Motion to Certify), including the certification of the class of plaintiffs, the court held the following dates for submission of summations: Summations on behalf of the plaintiffs were submitted on August 31, 2014; Summations on behalf of the defendants were submitted on November 20, 2014; and summations of response by the plaintiffs were submitted on December 30, 2014. On February 9, 2015, the Judge presiding over the case recused herself due to a conflict of interests. On March 30, 2015, the plaintiffs filed a motion to the Court seeking to have the case assigned to a new presiding Judge and as a result on April 4, 2015 a new presiding judge was assigned to the case. The parties are now waiting for the Court’s decision on the Motion to Certify.
Two cases were also filed in the Tel Aviv Labor Court by plaintiffs Katriel and Deutsch, and both sought to approve class actions to recover damages that are claimed to have been incurred as a result of breached employment contracts, which allegedly prevented the exercise by certain employees and former employees of certain CTI and Verint stock options, respectively. The Katriel litigation (Case Number 3444/09) was filed on March 16, 2009, against Xura Ltd., and the Deutsch litigation (Case Number 4186/09) was filed on March 26, 2009, against Verint Systems Ltd. The Tel Aviv Labor Court has ruled that it lacks jurisdiction, and both cases have been transferred to the Tel Aviv District Court. These cases have been consolidated with the Tel Aviv District Court cases discussed above.
We have not accrued for these matters as the potential loss is currently not probable or estimable.
An additional case has been filed by an individual plaintiff in the Tel Aviv District Court similarly seeking to recover damages up to an aggregate of $3.3 million allegedly incurred as a result of the inability to exercise certain stock options. The case generally alleged the same causes of actions alleged in the potential class action discussed above. In December 2014, the District Court assigned the case to the Labor Court. In December 2015, the case was settled without admission of liability by the defendants for an immaterial amount.
On February 4, 2013, Verint and CTI completed the Verint Merger. As a result of the Verint Merger, Verint assumed certain rights and liabilities of CTI, including any liability of CTI arising out of the actions discussed above. However, under the terms of the Distribution Agreement between CTI and us relating to the Share Distribution, Verint, as successor to CTI, is entitled to indemnification from us for any losses it suffers in its capacity as successor-in-interest to CTI in connection with these actions.
Other Legal Proceedings
We completed the sale of our BSS Business on July 2, 2015. In connection with the Asset Sale, we agreed to indemnify Amdocs for certain pre-closing liabilities and breaches of certain representations and warranties. Upon the closing, $26 million of the purchase price was deposited into escrow to fund potential indemnification claims and certain adjustments for a period of 12 months following the closing. In August 2015 and May 2016, we received various claims for indemnification against the escrow from Amdocs. We could receive additional claims in the future. While we continue to evaluate certain claims made, we believe several pending claims are without merit and intend to vigorously defend against them. Nonetheless, amounts held in escrow necessary to satisfy pending claims will remain unavailable to
26
us until these claims are resolved. In addition, we are not able to predict the ultimate outcome of these or future claims that Amdocs may assert against us in connection with the asset sale, any of which could have a material adverse effect on our results of operation and financial condition.
From time to time, we and our subsidiaries are subject to claims in legal proceedings that arise, or may arise in the normal course of business. We do not believe that we or our subsidiaries are currently party to any pending legal action not described herein or disclosed in our consolidated financial statements that could reasonably be expected to have a material adverse effect on our business, financial condition or results of operations.
ITEM 4. | MINE SAFETY DISCLOSURES |
Not applicable.
27
PART II
ITEM 5. | MARKET FOR REGISTRANT'S COMMON EQUITY, RELATED STOCKHOLDER MATTERS AND ISSUER PURCHASES OF EQUITY SECURITIES |
Listing on the NASDAQ Global Market
Our common stock is traded on Nasdaq’s Global Market stock exchange. Until September 9, 2015, our common stock traded under the ticker symbol “CNSI”. Since September 9, 2015, our common stock has traded under the ticker symbol “MESG”. The following table sets forth the high and low intra-day sales prices of our common stock, as reported by NASDAQ for the period of February 1, 2014 through January 31, 2016:
Fiscal Year | Fiscal Quarter | Low | High | |||||||
2015 | 11/1/2015 –1/31/2016 | $ | 20.53 | $ | 26.45 | |||||
8/1/2015 –10/31/2015 | $ | 17.79 | $ | 26.63 | ||||||
5/1/2015 –7/31/2015 | $ | 18.42 | $ | 25.18 | ||||||
2/1/2015 –4/30/2015 | $ | 16.95 | $ | 25.99 | ||||||
2014 | 11/1/2014 –1/31/2015 | $ | 16.99 | $ | 22.19 | |||||
8/1/2014 –10/31/2014 | $ | 19.95 | $ | 26.47 | ||||||
5/1/2014 –7/31/2014 | $ | 22.00 | $ | 27.16 | ||||||
2/1/2014 –4/30/2014 | $ | 24.34 | $ | 36.12 | ||||||
As of May 17, 2016, the last practicable date, the last reported sale price of our common stock was $21.11 per share and there were approximately 2,940 holders of record of our common stock. Such record holders include a number of holders who are nominees for an undetermined number of beneficial owners.
Dividend Policy
We have not declared or paid any cash dividends on our equity securities and currently do not expect to pay any cash dividends in the near future. Any future determination as to the declaration and payment of dividends will be made by our Board of Directors, in its discretion, and will depend upon our earnings, financial condition, capital requirements and other relevant factors.
Securities Authorized for Issuance under Equity Compensation Plans
For a discussion related to securities authorized for issuance under equity compensation plans, see Item 12, “Security Ownership of Certain Beneficial Owners and Management and Related Stockholder Matters—Equity Compensation Plan Information.”
Recent Sales of Unregistered Securities
None.
Issuer Purchases of Equity Securities
In the fourth quarter of the fiscal year ended January 31, 2016, we purchased an aggregate of 1,130 shares of our common stock from certain of our directors, executive officers and employees to cover tax liabilities in connection with the delivery of shares in settlement of stock awards. The shares purchased by us are deposited in our treasury. These purchases were not made pursuant to a specific repurchase plan or program.
As disclosed in our prior SEC filings, our Board of Directors adopted a program to repurchase from time to time at management’s discretion up to $30.0 million in shares of our common stock on the open market during the 18-month period ending October 9, 2015 at prevailing market prices. In early September 2014, as part of this program, our Board approved a $5.0 million committed repurchase plan to be implemented in accordance with Rule 10b5-1 of the Exchange Act. Repurchases were made under the program using our own cash resources. During the fiscal year ended January 31, 2015, we repurchased in the open market under this program 688,642 shares of common stock for an aggregate purchase price of approximately $15.1 million and a weighted average purchase price of $21.98 per share. In mid-July 2015, as part of this program, our Board approved a $5.0 million committed repurchase plan to be implemented in accordance with Rule 10b5-1 of the Exchange Act. During the fiscal year ended January 31, 2016, we repurchased in the open market under this program 319,985 shares of common stock for an aggregate purchase price of approximately $6.3 million with a weighted average purchase price of $19.69 per share.
28
The following table provides information regarding our purchases of our common stock in respect of each month during the fourth quarter of the fiscal year ended January 31, 2016 during which purchases occurred:
ISSUER PURCHASES OF EQUITY SECURITIES
Period | Total Number of Shares (or Units) Purchased | Average Price Paid Per Share (or Unit) | Total Number of Shares (or Units) Purchased as Part of Publicly Announced Plans or Programs | Maximum Number (or Approximate Dollar Value) of Shares (or Units) That May Yet Be Purchased Under the Plans or Programs | ||||||||||
November 1, 2015 – November 30, 2015 | — | $ | — | — | $ | 8,563,754 | ||||||||
December 1, 2015 – December 31, 2015 | 46 | 24.60 | — | 8,563,754 | ||||||||||
January 1, 2016 – January 31, 2016 | 1,084 | 24.58 | — | 8,563,754 | ||||||||||
Total | 1,130 | $ | 24.58 | — | $ | 8,563,754 | ||||||||
Stock Performance Graph
The graph depicted below shows a comparison from February 1, 2013 through January 31, 2016 of the cumulative total return for our common stock, the Russell 3000 Index and the S&P Communications Equipment Index, assuming a hypothetical investment of $100 in our common stock and in each index on February 1, 2013 and the reinvestment of any dividends. The performance shown is not necessarily indicative of future performance.
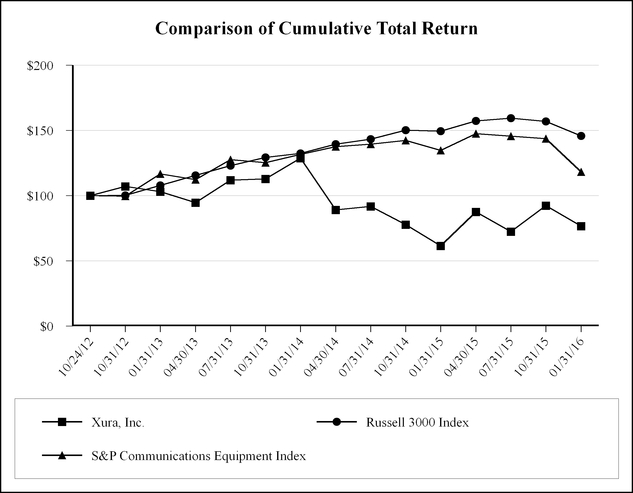
29
ITEM 6. | SELECTED FINANCIAL DATA |
The following table presents selected consolidated and combined financial data as of and for the fiscal years ended January 31, 2016, 2015, 2014, 2013 and 2012. The selected consolidated financial data as of January 31, 2016 and 2015 and for the fiscal years ended January 31, 2016, 2015 and 2014 were derived from the consolidated financial statements included in Item 15 of this Annual Report. The selected consolidated and combined financial data as of January 31, 2014, 2013 and 2012 and for the fiscal years ended January 31, 2013 and 2012 were derived from financial statements that were audited, prior to any adjustments for discontinued operations, updated to reflect the BSS Business as discontinued operations, that are not included in this Annual Report.
Our historical financial statements combine, on the basis of common control, the results of operations and financial position of Xura, Inc. and its subsidiaries with Starhome and Exalink Ltd. CTI's interest in Starhome (66.5% of the outstanding share capital) and a former CTI wholly-owned subsidiary, Exalink Ltd. were contributed to us on September 19, 2012 and October 31, 2012, respectively. As a result of the Starhome Disposition on October 19, 2012, the results of operations of Starhome, including the gain on sale of Starhome, are included in discontinued operations, less applicable income taxes, as a separate component of net (loss) income in our consolidated and combined statements of operations for fiscal years ended January 31, 2013 and 2012 and the assets and liabilities of Starhome are included as separate components in our combined balance sheets as of January 31, 2012. See note 1 to the consolidated and combined financial statements included in Item 15 of this Annual Report. Our financial information reflects historical results and may not be indicative of our future performance.
The comparability of the selected consolidated and combined financial data as of and for the fiscal years ended January 31, 2016, 2015, 2014, 2013 and 2012 has been materially affected primarily by significant compliance-related professional fees and compliance-related compensation and other expenses recorded for the fiscal year ended January 2012 in connection with remediation of material weaknesses, evaluations of our revenue recognition practices and the preparation of our financial information as part of CTI's efforts to become current in periodic reporting obligations under the federal securities laws, the impairment of goodwill in the fiscal year ended January 31, 2013 and Asset Sale of the BSS business to Amdocs and the acquisition of Acision completed in the fiscal year ended January 31, 2016. The selected consolidated and combined financial data presented should be read together with Item 7 “Management's Discussion and Analysis of Financial Condition and Results of Operations” and the consolidated financial statements and the related notes included in Items 8 and 15 of this Annual Report.
30
Fiscal Years Ended January 31, | ||||||||||||||||||||
2016 | 2015 | 2014 | 2013 | 2012 | ||||||||||||||||
(In thousands, except per share data) | ||||||||||||||||||||
Consolidated Statement of Operations Data: | ||||||||||||||||||||
Total revenue (1) | $ | 270,914 | $ | 268,974 | $ | 415,970 | $ | 445,590 | $ | 403,567 | ||||||||||
(Loss) income from operations(2)(3)(4) | (68,369 | ) | (64,448 | ) | 11,976 | (25,793 | ) | (32,839 | ) | |||||||||||
Net (loss) income from continuing operations(5)(6) | (51,350 | ) | (57,238 | ) | (4,427 | ) | (46,660 | ) | (46,704 | ) | ||||||||||
Income from discontinued operations, net of tax | 184,123 | 35,099 | 23,113 | 52,908 | 33,817 | |||||||||||||||
Net (loss) income | 132,773 | (22,139 | ) | 18,686 | 6,248 | (12,887 | ) | |||||||||||||
Less: Net income attributable to noncontrolling interest | — | — | — | (1,167 | ) | (2,574 | ) | |||||||||||||
Net (loss) income attributable to Xura, Inc. | 132,773 | (22,139 | ) | 18,686 | 5,081 | (15,461 | ) | |||||||||||||
(Loss) earnings per share attributable to Xura, Inc.’s stockholders:(7) | ||||||||||||||||||||
Basic (loss) earnings per share | ||||||||||||||||||||
Continuing operations | $ | (2.19 | ) | $ | (2.58 | ) | $ | (0.20 | ) | $ | (2.18 | ) | $ | (2.25 | ) | |||||
Discontinued operations | 7.85 | 1.58 | 1.04 | 2.41 | 1.54 | |||||||||||||||
Basic (loss) earnings per share | $ | 5.66 | $ | (1.00 | ) | $ | 0.84 | $ | 0.23 | $ | (0.71 | ) | ||||||||
Diluted (loss) earnings per share | ||||||||||||||||||||
Continuing operations | $ | (2.19 | ) | $ | (2.58 | ) | $ | (0.20 | ) | $ | (2.18 | ) | $ | (2.25 | ) | |||||
Discontinued operations | 7.85 | 1.58 | 1.03 | 2.41 | 1.54 | |||||||||||||||
Diluted (loss) earnings per share | $ | 5.66 | $ | (1.00 | ) | $ | 0.83 | $ | 0.23 | $ | (0.71 | ) | ||||||||
As of January 31, | ||||||||||||||||||||
2016 | 2015 | 2014 | 2013 | 2012 | ||||||||||||||||
(In thousands) | ||||||||||||||||||||
Consolidated Balance Sheet Data: | ||||||||||||||||||||
Total assets(7)(8) | $ | 820,622 | $ | 606,352 | $ | 748,837 | $ | 857,790 | $ | 902,947 | ||||||||||
Indebtedness including current maturities(9) | 152,958 | 1,130 | — | — | 8,536 | |||||||||||||||
(1) | Total revenue for the fiscal year ended January 31, 2016 includes $63.0 million in revenue from Acision subsequent to the completion of the acquisition on August 6, 2015. |
(2) | For the fiscal years ended January 31, 2015, 2014, 2013 and 2012, we recorded compliance-related professional fees of $1.0 million, $2.1 million, $0.2 million and $10.9 million, respectively. |
(3) | For the fiscal years ended January 31, 2013 and 2012, we recorded compliance-related compensation and other expenses of $2.1 million and $6.7 million, respectively. |
(4) | Includes a $10.9 million VAT refund received in the fiscal year ended January 31, 2014. |
(5) | Includes $16.7 million in acquisition and transition service cost relating to the acquisition of Acision in the fiscal year ended January 31, 2016. |
(6) Includes uncertain tax position net reversals of $2.9 million, $85.1 million and $16.5 million in the fiscal years ended January 31, 2016, 2015 and 2014, respectively.
(7) | The computation of basic and diluted (loss) earnings per share for fiscal years ended January 31, 2012 calculated using the number of shares of our common stock outstanding on October 31, 2012, the completion date of the Share Distribution. |
(8) | Includes the balance sheet of Starhome as of January 31, 2012 which was subsequently sold on October 19, 2012. Excludes the balance sheet of the BSS business as of January 31, 2016, which was sold on July 2, 2015. Includes the balance sheet of Acision as of January 31, 2016. |
(9) | We have not declared any dividends during the fiscal years presented. |
31
(10) Includes borrowings outstanding under (i) notes payable to CTI of $8.5 million as of January 31, 2012, (ii) government sponsored loans for research and development projects in connection with the acquisition of Solaiemes of $1.0 million and $1.1 million as of January 31, 2016 and 2015, respectively and a (iii) $152.0 million of indebtedness as of January 31, 2016 assumed in connection with the acquisition of Acision.
ITEM 7. | MANAGEMENT’S DISCUSSION AND ANALYSIS OF FINANCIAL CONDITION AND RESULTS OF OPERATIONS |
The following discussion and analysis of our financial condition and results of operations should be read together with Item 1, “Business,” Item 6, “Selected Financial Data,” and the consolidated financial statements and related notes included in Item 15 of this Annual Report. This discussion and analysis contains forward-looking statements based on current expectations relating to future events and our future financial performance that involve risks and uncertainties. See “Forward-Looking Statements” on page i of this Annual Report. Our actual results may differ materially from those anticipated in these forward-looking statements as a result of many factors, including those set forth under Item 1A, “Risk Factors,” and elsewhere in this Annual Report. Percentages and amounts within this section may not calculate due to rounding differences.
EXECUTIVE SUMMARY
Potential Sale of Our Company
On May 23, 2016, we entered into an Agreement and Plan of Merger (or the Merger Agreement) with Sierra Private Holdings II Ltd., a private limited company incorporated under the laws of England and Wales (or Sierra), and Sierra Private Merger Sub Inc., a Delaware corporation and wholly-owned subsidiary of Sierra (or Merger Sub), under which Merger Sub will be merged with and into our company (or the Merger), with us continuing after the Merger as the surviving corporation and wholly-owned subsidiary of Sierra , subject to the terms and conditions set forth in the Merger Agreement. Parent and Merger Sub are affiliates of Siris Capital Group, LLC (or Siris). The Merger Agreement has been unanimously approved by our Board of Directors.
Under the terms of the Merger Agreement, Sierra will acquire all of our outstanding common stock for $25.00 per share in cash. The Merger is currently expected to close in the third fiscal quarter of 2016 and is subject to approval by our stockholders, certain regulatory approvals and other closing conditions.
Additional information about the Merger and the terms of the Merger Agreement can be found in the Current Report on Form 8-K filed by us under Item 1.01 of that Form 8-K on May 23, 2016, including the full text of the Merger Agreement filed as Exhibit 2.1 to that Form 8-K. Our stockholders are urged to read all relevant documents filed with the SEC because they contain important information about the proposed transaction. Investors and security holders are able to obtain the documents free of charge at the SEC’s web site, www.sec.gov, or for free from us by contacting our Investor Relations Department or through the investor relations section of our website (www.xura.com).
Overview
We are a global provider of digital communications solutions for communication service providers (or CSPs), enterprises and application providers. Our digital communications solutions are designed to enhance CSPs’ ability to address evolving market trends with the simplification and modernization of networks, as well as to create monetizable services with both existing and emerging technologies, such as voice over long-term evolution (or VoLTE), rich communication services (or RCS) credit orchestration and internet protocol (or IP) messaging and web real-time communications (or WebRTC). We also provide solutions for messaging security, network signaling security, data analytics, and machine-to-machine messaging. We continue to offer traditional value-added services (or VAS) solutions, including voicemail, visual voicemail, call completion, short messaging service (or SMS), multimedia picture and video messaging (or MMS) and IP-messaging designed to provide CSPs the ability to augment their networks with emerging products and solutions to address opportunities provided by new types of devices, technologies, and multi-device user experiences. In addition, we offer CSPs innovative monetization solutions using messaging as transport to exchange billing credits between subscribers, primarily in prepaid markets. Our enterprise solutions are designed to accelerate our enterprise customers’ shift towards mobile-enablement and to improve their customer engagement. These solutions include secure enterprise application-to-person messaging (or A2P), two-factor authentication (or 2FA) and developer tools for customized service creation.
Most of our solutions can be delivered via the cloud, in a “software-as-a-service” model, allowing us to speed up deployment and permit rapid introduction of additional services. With our acquisition of Acision Global Limited (or Acision), several of our monetization solutions are offered in a revenue-share model, which reduces our customers’ up-front investments and ties payments to actual service usage, provides us with continual revenue streams and allows us to actively participate in service value creation.
32
Significant Events
During the fiscal year ended January 31, 2016 and subsequent thereto, the following significant events occurred:
Amdocs Asset Purchase Agreement.
On April 29, 2015, we entered into an Asset Purchase Agreement (including the ancillary agreements and documents thereto, the Amdocs Purchase Agreement) with Amdocs Limited, a Guernsey company (or Purchaser). Pursuant to the Amdocs Purchase Agreement, we agreed to sell substantially all of our assets required for operating our converged, prepaid and postpaid billing and active customer management systems for wireless, wireline, cable and multi-play communication service providers (or the BSS Business) to the Purchaser, and the Purchaser agreed to assume certain post-closing liabilities of ours. We refer to this transaction as the Asset Sale. The initial closing of the Asset Sale occurred on July 2, 2015. The total cash purchase price payable by the Purchaser to us in connection with the Asset Sale was approximately $271.7 million, including currently estimated purchase price adjustment of approximately $0.7 million, of which an aggregate of $5.5 million was paid upon certain deferred closings.
In connection with the Asset Sale, we agreed to indemnify Amdocs for certain pre-closing liabilities and breaches of certain representations and warranties. Upon the closing, $26.0 million of the purchase price was deposited into escrow to fund potential indemnification claims and certain adjustments for a period of 12 months following the closing. In August 2015 and May 2016, we received various claims for indemnification against the escrow from Amdocs. We could receive additional claims in the future. While we continue to evaluate certain claims made, we believe several pending claims are without merit and intend to vigorously defend against them.
In connection with the Amdocs Purchase Agreement, we and the Purchaser have also entered into a Transition Services Agreement (or the TSA), which provides for support services between us and the Purchaser in connection with the transition of the BSS Business to the Purchaser, for various periods up to 12 months following the closing of the Asset Sale. For additional information, see note 17 to our consolidated financial statements included in Item 15 of this Annual Report.
Acquisition of Acision
On August 6, 2015 (or the Closing Date), we completed the previously announced acquisition (or the Acquisition) of Acision Global Limited, a private company formed under the laws of England and Wales (or Acision) and a holding company for Acision B.V. (its sole asset), pursuant to the terms of the share sale and purchase agreement, dated June 15, 2015 (or the Purchase Agreement), between us and Bergkamp Coöperatief U.A., a cooperative with excluded liability formed under the laws of the Netherlands (or the Seller).
Pursuant to the terms of the Purchase Agreement, on the Closing Date we acquired 100% of the equity interests of Acision in exchange for $171.3 million in cash (excluding cash acquired and closing costs), earnout payments (as discussed below), and 3.14 million shares of our common stock, par value $0.01 per share (or the Consideration Shares), which were issued in a private placement transaction conducted pursuant to Section 4(a)(2) under the Securities Act of 1933, as amended (or the Securities Act). As previously disclosed, pursuant to the terms of the Purchase Agreement, an amount up to $35.0 million of cash consideration is subject to an earnout, contingent on the achievement of revenue targets by certain of Acision’s business activities through the first quarter of 2016. Earnout revenue targets through December 31, 2015 were not achieved and accordingly, no earnout was paid in respect thereof. To secure claims we may have under the Purchase Agreement, $10.0 million of the initial cash consideration was retained in escrow, which amount will be increased in the event that further consideration is triggered under the earnout, up to a maximum aggregate escrow retention of $25.0 million. Such monies will be released to the Seller two years after completion of the Acquisition, subject to any claims. In addition, Acision, in consultation with us, entered into a consent, waiver and amendment (or the Amendment) with the requisite lenders under Acision’s credit agreement (or the Acision Credit Agreement) governing Acision’s existing approximately $156.0 million senior credit facility (or the Acision Senior Debt), pursuant to which the Acision Senior Debt remains in place following completion of the Acquisition. The Acision Senior Debt matures, subject to the terms and conditions of the Acision Credit Agreement, on December 15, 2018. In connection with the Amendment, we agreed to pay certain costs imposed on Acision by its lenders under the Acision Senior Debt. Each party agreed to indemnify the other for certain potential liabilities and claims, subject to certain exceptions and limitations. For additional information, see note 16 to our consolidated financial statements included in Item 15 of this Annual Report.
Master Services Agreement with Tech Mahindra
On April 14, 2015, we entered into a Master Services Agreement (or the MSA) with Tech Mahindra Limited (or Tech Mahindra) pursuant to which Tech Mahindra performs certain services for our business on a global basis. The
33
services include research and development, project deployment and delivery, and maintenance and support for certain customers. In connection with the transaction, approximately 500 of our employees have been rehired by Tech Mahindra or its affiliates.
Under the MSA, we are required to pay to Tech Mahindra in the aggregate approximately $212.0 million in base fees for services to be provided pursuant to the MSA for a term of six years, renewable at our option. The services under the MSA started on June 1, 2015. We expect to realize gross savings in excess of $70.0 million over the term of the MSA.
Net Operating Loss Rights Agreement
Effective April 29, 2015, our Board of Directors adopted a rights plan (or the Rights Plan) and declared a dividend of one preferred share purchase right for each outstanding share of common stock. The dividend was paid to our stockholders of record as of May 11, 2015.
Our Board of Directors adopted the Rights Plan in an effort to protect stockholder value by attempting to diminish the risk of our ability to use its net operating losses and unrealized losses (or collectively, the NOLs) to reduce potential future federal income tax obligations may become substantially limited. We have experienced and may continue to experience substantial operating losses, including realized losses for tax purposes from sales inventory previously written down for financial statement purposes, which would produce NOLs. Under the Internal Revenue Code and regulations promulgated by the U.S. Treasury Department, we may “carry forward” these NOLs in certain circumstances to offset any current and future taxable income and thus reduce our federal income tax liability, subject to certain requirements and restrictions. To the extent that the NOLs do not otherwise become limited, we project to be able to carry forward a significant amount of NOLs, and therefore these NOLs could be a substantial asset to us. However, if we experience an “Ownership Change,” as defined in Section 382 of the Internal Revenue Code, the ability to use the NOLs, including NOLs later arising from sales inventory previously written down, will be substantially limited, and the timing of the usage of the NOLs could be substantially delayed, which could therefore significantly impair the value of that asset.
The Rights Plan is intended to act as a deterrent to any person or group acquiring 4.9% or more of our outstanding common stock (or an Acquiring Person) without the approval of our Board of Directors. Stockholders who own 4.9% or more of our outstanding common stock as of the close of business on May 11, 2015 will not trigger the Rights Plan so long as they do not (i) acquire any additional shares of common stock or (ii) fall under 4.9% ownership of common stock and then re-acquire 4.9% or more of our common stock. The Rights Plan does not exempt any future acquisitions of common stock by such persons. Any rights held by an Acquiring Person are void and may not be exercised. The Board of Directors may, in its sole discretion, exempt any person or group from being deemed an Acquiring Person for purposes of the Rights Plan.
Our Board of Directors authorized the issuance of one right per each outstanding share of our common stock payable to our stockholders of record as of May 11, 2015. Subject to the terms, provisions and conditions of the Rights Plan, if the rights become exercisable, each right would initially represent the right to purchase from us one one-thousandth of a share of our Series A Junior Participating Preferred Stock (or the Series A Preferred Stock) for a purchase price of $100.00 (or the Purchase Price). If issued, each fractional share of preferred stock would give the stockholder approximately the same dividend, voting and liquidation rights as one share of our common stock. However, prior to exercise, a right does not give its holder any rights as a stockholder of ours, including without limitation any dividend, voting or liquidation rights.
The rights and the Rights Plan will expire on the earliest of (i) April 29, 2018, (ii) the time at which the rights are redeemed pursuant to the Rights Agreement, (iii) the time at which the rights are exchanged pursuant to the Rights Agreement, (iv) the repeal of Section 382 of the Code or any successor statute if the Board of Directors determines that the Rights Agreement is no longer necessary for the preservation of Tax Benefits, (v) the beginning of our taxable year to which the Board of Directors determines that no Tax Benefits may be carried forward and (vi) April 29, 2016 if Stockholder Approval has not been obtained.
The Rights Plan was approved by our stockholders at the 2015 Annual Meeting of Stockholders held on June 24, 2015.
Replacement of Chief Financial Officer
Effective April 30, 2015, we appointed Jacky Wu as our Chief Financial Officer and entered into a separation agreement with Thomas Sabol, our former Senior Vice President, Chief Financial Officer, pursuant to which Mr. Sabol
34
ceased to serve as Senior Vice President and Chief Financial Officer on April 30, 2015 and his employment with us terminated on July 1, 2015.
Resignation of Board Member
On May 9, 2015, Neil Montefiore did not stand for re-election at the 2015 annual meeting of stockholders (or Annual Meeting) and resigned from our Board of Directors effective the date of the 2015 Annual Meeting of Stockholders. Mr. Montefiore, whose primary expertise lies with the BSS Business, advised us that his resignation was prompted by the sale of the BSS business to Amdocs Limited.
Extension of Employment Terms of Named Executive Officers
On May 14, 2015, we entered into amendments to our employment agreements with each of Philippe Tartavull, our President, Chief Executive Officer and Director, and Nassrin Tavakoli, our Executive Vice President and Chief Technology Officer pursuant to which the term of employment of Mr. Tartavull and Ms. Tavakoli was extended for a year through May 21, 2016 and October 1, 2016, respectively. The term of each executive’s employment will automatically renew for one year increments, unless either the executive or we provide the other party with a prior written notice of non-renewal at least 60 days prior to the renewal date.
Separation agreement with Former Chief Accounting Officer
On September 18, 2015, we entered into a separation agreement with Shawn Rathje, our former Vice President, Chief Accounting Officer, pursuant to which Mr. Rathje's employment with us terminated effective January 1, 2016.
Election of Board Member
On November 18, 2015, the Board of Directors increased the size of the Board to eight directors and approved the recommendation of the Corporate Governance and Nominating Committee to appoint Niccolo M. de Masi to fill the resulting vacancy, to serve until the 2016 annual meeting of stockholders or until his successor is duly elected and qualified.
Temporary Expatriate Assignments of Executive Officers
On December 4, 2015, we entered into amendments to our employment agreements with each of Philippe Tartavull, our President, Chief Executive Officer and Director, and Jacky Wu, our Executive Vice President and Chief Financial Officer, in connection with temporary expatriate assignments to England. The expatriate assignments allow Messrs. Tartavull and Wu to be in frequent, close proximity to the former headquarters of the Acision business to facilitate its effective integration. The expatriate assignments are for up to a year beginning on January 1, 2016. At any time during the expatriate assignments, we have the right to require the officers to relocate back to Boston, Massachusetts by providing them with a 60 day prior written notice. Messrs. Tartavull and Wu will continue to fulfill their regular responsibilities with us during the term of the assignments.
Discontinued Operations
As of April 30, 2015, the BSS Business met the criteria to be classified as held for sale as well as discontinued operations. As such, the BSS Business have been re-classified and reflected as discontinued operations on the consolidated statements of earnings for all periods presented. The assets and liabilities of the BSS business are included in discontinued operations as separate components to our consolidated balance sheet as of January 31, 2015. For additional information, see note 17 to our consolidated financial statements included in Item 15 of this Annual Report.
Segment Information
Prior to entering into the Amdocs Purchase Agreement, our reportable segments consisted of BSS and Digital Services. As a result of entering into the Amdocs Purchase Agreement, the results of operations of the former BSS Business segment are classified as discontinued operations. Therefore, with the reported divestiture we now operate as a single business segment, the results of which are included in our income statement from continuing operations. We acquired Acision to complement our solution portfolio, enhance our market leadership, penetrate growth markets and improve our operational efficiency. Acision was integrated into Digital Services and we continue to operate a single segment as a global provider of digital communications solutions for communication service providers.
35
Consolidated Financial Highlights
The following table presents certain financial highlights for the fiscal years ended January 31, 2016, 2015 and 2014, for us on a consolidated basis:
Fiscal Years Ended January 31, | |||||||||||
2016 | 2015 | 2014 | |||||||||
(Dollars in thousands) | |||||||||||
Total revenue | $ | 270,914 | $ | 268,974 | $ | 415,970 | |||||
Gross margin | 28.4 | % | 25.0 | % | 36.5 | % | |||||
(Loss) income from operations | (68,369 | ) | (64,448 | ) | 11,976 | ||||||
Operating margin | (25.2 | )% | (24.0 | )% | 2.9 | % | |||||
Net loss from continuing operations | (51,350 | ) | (57,238 | ) | (4,427 | ) | |||||
Income from discontinued operations, net of tax | 184,123 | 35,099 | 23,113 | ||||||||
Net income (loss) | 132,773 | (22,139 | ) | 18,686 | |||||||
Net cash used in operating activities - continuing operations | (85,582 | ) | (47,675 | ) | (643 | ) | |||||
Business Trends
For the fiscal year ended January 31, 2016, we had an increase in loss from operations compared to the fiscal year ended January 31, 2015. The change was primarily a result of an increase in costs and operating expenses which were partially offset by an increase in revenue. For more information, see “-Results of Operations-Fiscal year Ended January 31, 2016 Compared to Fiscal Year Ended January 31, 2015- Consolidated Results.”
Product bookings and total customer orders (consisting of product bookings and maintenance revenue) increased in the fiscal year ended January 31, 2016 compared to the fiscal year ended January 31, 2015. The increase was primarily attributable to the inclusion of Acision's post-acquisition and higher product bookings from a large customer during the fiscal year ended January 31, 2016 partially offset by a reduction in product bookings attributable to the BSS business not included in the Asset Sale, a reduction in maintenance fees charged to certain customers, timing of entering into renewals of maintenance contracts, the termination of certain maintenance contracts and the impact of adverse foreign currency exchange rate fluctuations.
During the fiscal year ended January 31, 2016, our cash and cash equivalents and restricted cash decreased primarily due to the payment of cash consideration for the acquisition of Acision, negative operating cash flow, payments made in connection with restructuring activities and repurchase of shares of common stock in the open market under a Board approved stock repurchase program partially offset by the receipt of proceeds from the Asset Sale. For more information, see “Liquidity and Capital Resources-Financial Condition”
Our costs, operating expenses and disbursements increased during the fiscal year ended January 31, 2016 compared to the fiscal year ended January 31, 2015, primarily due to our acquisition of Acision partially offset by a decrease operating expenses due to our continued focus on closely monitoring costs and operating expenses as part of our efforts to improve our cash position and achieve long-term improved operating performance and positive operating cash flows.
As part of these efforts, we continued to implement initiatives to reduce costs and expenses during the fiscal year ended January 31, 2016, including the entry into the MSA with Tech Mahindra and the relocation of certain delivery and research and development activities to low cost centers of excellence in Eastern Europe and Asia.
In connection with the MSA, the BSS Business sale and the acquisition of Acision, we commenced a restructuring plan during the fiscal year ended January 31, 2016, which primarily includes a reduction of workforce included in cost of revenue, research and development and selling, general and administrative expenses. The aggregate cost of the plan is currently estimated to be approximately $27.2 million and $0.9 million in severance and facilities-related costs, respectively, which is expected to be paid by July, 2016 and December, 2024, respectively.
We continue to maintain our market leadership in the traditional value added services (or VAS) market by providing solutions to CSPs based on voice and messaging services, such as voicemail, call completion, SMS and MMS. However, CSPs face increasing competition from both Internet players and mobile device manufacturers, using new technologies that may provide alternatives to CSP products and services. For example, the introduction of IP-based over-the-top (or OTT) applications on wireless devices, allows end users to utilize IP-based person-to-person (or P2P) services, such as Facebook, FaceTime, Google, WhatsApp, Line or Skype, to access, among other things, IP
36
communications free of charge rather than use similar services provided by CSPs. Furthermore, these CSP services continue to face competition from low-cost service providers from emerging markets. We believe these changes have reduced demand for traditional P2P communication products and services and increased pricing pressures, which have in turn adversely impacted our revenue and margins and we expect this trend to continue.
At the same time, in emerging markets where mobile users are predominantly prepaid subscribers and mobile Internet is less accessible, CSP’s are looking for services that leverage existing messaging infrastructure and allow users to stay connected from feature phones via SMS. These include mobile credit (or monetization) services, which enable users to continue to communicate when out of credit, by texting another subscriber who has the option to pay the cost. These services provide new incremental revenue streams to CSPs. As a leading provider of these credit services, we are witnessing increased uptake from users which, in turn, is driving SMS traffic and revenue growth.
Additionally, the growth in global wireless subscriptions, and high growth wireless segments, such as data services and Internet browsing are pushing CSPs to evolve to 4G/LTE IP-based network technologies, supporting the demand for several of our products. Also, increased use by subscribers of data services means CSPs are focused on increasing their relevance in the digital lifestyle of their subscribers. We believe that by leveraging our IP-based solutions, CSPs will be able to launch and offer applications and services that underpin subscribers’ digital lifestyles and that will create new revenue streams to CSPs. This also means CSPs are moving to network function virtualization as part of their core infrastructure. Therefore, we are now virtualizing our products to meet demand by CSPs for this requirement as they advance their own networks and services from legacy systems.
Furthermore, in conjunction with the previously mentioned increased presence of IP traffic on the carrier network, we see several opportunities to establish ourselves as a leading provider of security technology for CSPs. Unlike the enterprise market, where businesses are focused on access, spam content or intellectual property leakage, CSPs face a number of singular concerns around revenue leakage, inappropriate access to services and, even more recently, core signaling access itself. Most recently, we have entered the core signaling network security market by creating a solution specifically designed around the emergent SS7 signaling fraud problem. We believe we can leverage our experience and the portfolio of security solutions to grow our revenue.
To address these market trends and the needs of our customers, we are implementing our strategy in respect of traditional VAS, IP-based solutions and unified communications. The key elements to our Digital Communications Services strategy include:
• | Continuing to leverage our leading market position in traditional VAS. As a market leader in the traditional VAS market we plan to focus on the following initiatives: |
• | Leveraging existing customer base. We continue to maintain our existing VAS customer base by enhancing our existing products and services and offering new products and services that facilitate system consolidation and total cost reduction of CSPs system operations and allow CSPs to launch new services; |
• | Gain market share through virtualization and cloud-based offering. We are currently aggressively pursuing new opportunities with new and existing customers by offering virtualized and cloud-based solutions which are designed to simplify CSPs’ current systems, improve efficiencies and reduce total cost of ownership; and |
• | Centralize the systems of multi-country large CSPs. We are currently pursuing and intend to continue to pursue opportunities to consolidate the systems of large, multi-country CSPs by moving their traditional VAS deployments from a per-country operation to a centralized cloud infrastructure that either they can operate or we could operate for them. This proposition is designed to create a significant reduction in the total cost of ownership for CSPs and also provides them with a platform for launching new digital services for their markets. |
• | Focusing on IP-Based Evolved Communication Services (or XCS). Our XCS solution is designed to modernize the Traditional VAS deployments by extending current services to IP endpoints, as well as upgrade the CSP’s voice and messaging offer to a comprehensive communication package that is based on Rich Communication Standards (or RCS), including voice, multi-device visual voicemail, messaging to IP-based devices, video, presence and chat. Our connectivity layer uses multiple access technologies to bridge traditional endpoints, web endpoints, and IP Multimedia System Session Initiation Protocol (SIP) endpoints. In order to enhance our solution, we acquired Solaiemes, whose WebRTC, RCS Monetization API Gateway and Presence solutions complement our XCS offering, with the combined portfolio creating a platform for service monetization of IP-based digital services. We plan to continue to enhance our XCS solution internally and through acquisitions or third-party engagements; |
37
• | Increase market share in emerging markets with monetization services. Having had success deploying monetization and message-based mobile credit services at CSPs within emerging markets, we will continue to aggressively pursue opportunities with existing customers to expand their services with more advanced systems and additional low credit services that go beyond their own networks and internationally, while also adding new customers to our portfolio who do not currently offer these services; |
• | Pursuing Enterprise Unified Communications Opportunities. We offer a portfolio of IP Trunking and Unified Communications services that CSPs can extend to their enterprise customers. Our objective is to sell these solutions through the CSP, and become the CSP’s Unified Communication solution of choice. The strength of our portfolio lies in its ability to provide convergence between the “at-work” Unified Communication experience and the “outside-work” XCS experience for CSPs’ end customers. This capability leverages our existing broad customer base which we believe provides us with a competitive advantage; |
• | Growth in enterprise customer portfolio. By expanding our secure application-to-person (or A2P) messaging services into new industry verticals beyond our current financial, logistics and travel customer base, while directly offering and enabling new IP-based communication through Rich Communication (RCS) and WebRTC technology, which provide more interactive IP-based messaging, voice and video chat services; and |
• | Focus on and expand our security solutions. We believe that our security solutions are well positioned to address the CSP security opportunity. Accordingly, we intend to leverage our customer base and aggressively pursue new customer engagements. We also plan to expand and augment our Spam and Fraud technology, SpamShield managed threat offering and SS7 signaling management solution with complementary technologies. |
Uncertainties Impacting Future Performance
Mix of Revenue
It is unclear whether our advanced offerings will be widely adopted by existing and potential customers. Currently, we are unable to predict whether sales of advanced offerings will fully offset declines in the sale of traditional VAS solutions in subsequent fiscal periods. If sales of advanced offerings do not increase or if increases in sales of advanced offerings do not exceed or fully offset any declines in sales of traditional solutions, due to adverse market trends, changes in consumer preferences or otherwise, our revenue, profitability and cash flows would likely be materially adversely affected.
Difficulty in Forecasting Product Bookings
Our product bookings are difficult to predict. A high percentage of our product bookings have typically been generated late in fiscal quarters. This trend makes it difficult for us to forecast our annual product bookings and to implement effective measures to cover any shortfalls of prior fiscal quarters if product bookings for the fourth fiscal quarter fail to meet our expectations. Furthermore, we continue to emphasize large capacity systems in our product development and marketing strategies. Contracts for installations typically involve a lengthy, complex and highly competitive bidding and selection process, and our ability to obtain particular contracts is inherently difficult to predict. A delay, cancellation or other factor resulting in the postponement or cancellation of significant orders may cause us to miss our projections.
Indemnification Obligations
We are subject to significant indemnification obligations, including to customers in the ordinary course and counterparties in connection with corporate transactions. In the normal course of business we provide indemnifications of varying scopes to customers against claims of intellectual property infringement made by third parties arising from the use of our products. In addition, we are subject to significant indemnification obligations to counterparties under certain agreements with third parties in connection with corporate transactions. These indemnification obligations include obligations to (i) Verint (as successor to CTI) under the Share Distribution Agreements we entered into in connection with the Share Distribution, (ii) Amdocs for certain pre-closing liabilities and breaches of certain representations and warranties in connection with the Asset Sale of the BSS business to Amdocs, (iii) Tech Mahindra, under the MSA therewith; and (iv) Acision, for certain potential liabilities and claims, subject to certain exceptions and limitations in connection with the acquisition of Acision. For more information, see Note 24 to the consolidated financial statements included in Item 15 of this Annual Report. These indemnification obligations could subject us to significant liabilities.
38
RESULTS OF OPERATIONS
Prior to entering into the Amdocs Purchase Agreement, our reportable segments consisted of BSS and Digital Services. As a result of entering into the Amdocs Purchase Agreement, the results of operations of the former BSS Business segment are classified as discontinued operations. Therefore, with the reported divestiture we now operate as a single business segment the results of which are included in our income statement from continuing operations. We acquired Acision to complement our solution portfolio, enhance our market leadership, penetrate growth markets and improve our operational efficiency. Acision was integrated into Digital Services and we continue to operate a single segment as a global provider of digital communications solutions for communication service providers.
The expenses that qualify for inclusion in discontinued operations are only the direct operating expenses incurred by the disposed component. As a result of the reported divestiture, certain previously allocated corporate overhead costs charged to the BSS Segment are excluded from discontinued operations and included in continuing operations.
Under the prior segment structure, our global corporate functions, that provided common support to its segments, were included in a column captioned “All Other” as part of our business segment presentation. All Other included sales, marketing, finance, legal, and management as they provided services to both the BSS and Digital Services segments. In addition, there were certain delivery, support, and research and development groups that provided common support to the BSS and Digital Services segments, and therefore the costs of these common groups were included in All Other. The majority of the costs included in All Other are indirect costs that did not qualify for the inclusion in discontinued operations. As a result of the reported divestiture, included in continuing operations are all unallocated indirect shared costs of ours, which were previously included in All Other.
On August 6, 2015, we completed the acquisition of Acision. The results of operations of the acquired businesses have been included since the date of acquisition.
The following discussion provides an analysis of our consolidated results and the results of operations for the fiscal periods presented.
Fiscal Year Ended January 31, 2016 Compared to Fiscal Year Ended January 31, 2015
Consolidated Results
Fiscal Years Ended January 31, | Change | |||||||||||||
2016 | 2015 | Amount | Percent | |||||||||||
(Dollars in thousands, except per share data) | ||||||||||||||
Total revenue | $ | 270,914 | $ | 268,974 | $ | 1,940 | 0.7 | % | ||||||
Costs and expenses | ||||||||||||||
Cost of revenue | 193,909 | 201,732 | (7,823 | ) | (3.9 | )% | ||||||||
Research and development, net | 37,270 | 36,857 | 413 | 1.1 | % | |||||||||
Selling, general and administrative | 95,349 | 82,722 | 12,627 | 15.3 | % | |||||||||
Other operating expenses | 12,755 | 12,111 | 644 | 5.3 | % | |||||||||
Total costs and expenses | 339,283 | 333,422 | 5,861 | 1.8 | % | |||||||||
Loss from operations | (68,369 | ) | (64,448 | ) | (3,921 | ) | 6.1 | % | ||||||
Interest income | 327 | 480 | (153 | ) | (31.9 | )% | ||||||||
Interest expense | (8,654 | ) | (641 | ) | (8,013 | ) | N/M | |||||||
Foreign currency transaction (loss) gain, net | (249 | ) | 4,659 | (4,908 | ) | (105.3 | )% | |||||||
Other income (expense), net | 361 | (517 | ) | 878 | (169.8 | )% | ||||||||
Income tax benefit | 25,234 | 3,229 | 22,005 | 681.5 | % | |||||||||
Loss from continuing operations | (51,350 | ) | (57,238 | ) | 5,888 | (10.3 | )% | |||||||
Income from discontinued operations, net of tax | 184,123 | 35,099 | 149,024 | N/M | ||||||||||
Net income (loss) | $ | 132,773 | $ | (22,139 | ) | $ | 154,912 | N/M | ||||||
Basic and diluted earnings (loss) per share | ||||||||||||||
Continuing operations | $ | (2.19 | ) | $ | (2.58 | ) | $ | 0.39 | ||||||
Discontinued operations | $ | 7.85 | $ | 1.58 | $ | 6.27 | ||||||||
39
Total Revenue
Revenue generated from customer solutions consists primarily of the licensing of our customer solutions, revenue generate from usage of our monetization solutions based on revenue sharing arrangements, hardware and related professional services and training. Professional services primarily include installation, customization and consulting services. Certain revenue arrangements that require significant customization of a product to meet the particular requirements of a customer are recognized under the percentage-of-completion method. The vast majority of the percentage-of-completion method arrangements are fixed-fee contracts. Maintenance revenue consists of post-contract customer support (or PCS), including technical software support services, unspecified software updates or upgrades to customers on a when-and-if-available basis.
Revenue from customer solutions was $144.6 million for the fiscal year ended January 31, 2016, an increase of $6.0 million, or 4.4%, compared to the fiscal year ended January 31, 2015. The increase was attributable to the inclusion of Acision's post-acquisition revenue partially offset by a reduction in revenue attributable to the BSS business not included in the Asset Sale and due to a lower volume of projects in the current period resulting from lower bookings. Revenue recognized using the percentage-of-completion method was $66.8 million and $76.9 million for the fiscal years ended January 31, 2016 and 2015, respectively.
Maintenance revenue was $126.3 million for the fiscal year ended January 31, 2016, a decrease of $4.1 million, or 3.2%, compared to the fiscal year ended January 31, 2015. This decrease was primarily attributable to a reduction in maintenance fees charged to certain customers, timing of entering into renewals of maintenance contracts, the termination of certain maintenance contracts and due to a reduction in revenue attributable to the BSS business not included in the Asset Sale partially offset by the inclusion of Acision's post-acquisition maintenance revenue.
Revenue by Geographic Region
Revenue in the Americas, APAC and Europe, Middle East and Africa (or EMEA) represented approximately 48%, 20% and 32% of our revenue, respectively, for the fiscal year ended January 31, 2016 compared to approximately 44%, 27% and 29% of our revenue, respectively, for the fiscal year ended January 31, 2015.
Foreign Currency Impact on Revenue
Our currency for financial reporting purposes is the U.S. dollar. The majority of our revenue for the fiscal year ended January 31, 2016 was derived from transactions denominated in U.S. dollars. All other revenue was derived from transactions denominated in various foreign currencies, primarily the euro, Japanese yen, Brazilian real and British pound. For the fiscal year ended January 31, 2016, fluctuations in the U.S. dollar relative to foreign currencies in which we conducted business unfavorably impacted revenue by $7.0 million compared to the fiscal year ended January 31, 2015, primarily due to a $3.4 million and $2.8 million unfavorable impact of the euro and Japanese yen, respectively.
Foreign Currency Impact on Costs
A significant portion of our expenses, principally personnel-related costs, is incurred in new Israeli shekel (or NIS), whereas our currency for financial reporting purposes is the U.S. dollar. A strengthening of the NIS against the U.S. dollar would increase the U.S. dollar value of our expenses in Israel. In order to mitigate this risk we enter into foreign currency forward contracts to hedge foreign currency exchange rate fluctuations.
For the fiscal year ended January 31, 2016, fluctuations in the U.S. dollar relative to all foreign currencies in which we conducted business favorably impacted costs by $8.1 million compared to the fiscal year ended January 31, 2015, primarily due to a favorable impact of the NIS and Euro.
Cost of Revenue
Cost of revenue primarily consists of (i) contractor costs, (ii) compensation and related overhead expenses for personnel involved in the customization of our products, customer delivery and maintenance and professional services, (iii) material costs, (iv) amortization of capitalized software costs and certain purchased intangible assets (v) depreciation of equipment used in operations royalties and license fees and (vi) royalties and license fees.
Cost of revenue was $193.9 million for the fiscal year ended January 31, 2016, a decrease of $7.8 million, or 3.9%, compared to the fiscal year ended January 31, 2015. The decrease was primarily attributable to a decrease of $58.9 million in personnel-related and overhead allocation costs due to the transfer of employees to Tech Mahindra and restructuring initiatives, a decrease of $17.7 million in material costs primarily due to a reduction in cost attributable to the BSS business not included in the Asset Sale and more profitable projects in the current period, partially offset by an increase of $18.5 million in subcontractor costs attributable to the transfer of employees to Tech Mahindra, the inclusion
40
of Acision's post-acquisition cost of revenue including an increase of $21.9 million in amortization of acquired intangible assets.
Research and Development, Net
Research and development expenses, net, primarily consist of personnel-related costs involved in product development and third-party development and programming costs and contractor costs.
Research and development expenses, net, were $37.3 million for the fiscal year ended January 31, 2016, an increase of $0.4 million, or 1.1%, compared to the fiscal year ended January 31, 2015. The increase was attributable to the inclusion of Acision's post-acquisition research and development costs partially offset by a decrease in personnel-related and overhead allocation costs of $11.0 million due to restructuring initiatives and the transfer of employees to Tech Mahindra.
Selling, General and Administrative
Selling, general and administrative expenses consist primarily of compensation and related expenses of personnel involved in sales, marketing, finance, legal and management and professional fees related to such functions.
Selling, general and administrative expenses were $95.3 million for the fiscal year ended January 31, 2016, an increase of $12.6 million, or 15.3%, compared to the fiscal year ended January 31, 2015.
Sales and marketing costs were $30.3 million for the fiscal year ended January 31, 2016, a decrease of $1.5 million or 4.6%, compared to the fiscal year ended January 31, 2015. The decrease was primarily attributable to a $12.0 million decrease in personnel-related and overhead allocation costs due to restructuring initiatives and to a $1.0 million decrease in subcontractor costs to align expenses with anticipated levels of business partially offset by the inclusion of Acision's post-acquisition sales and marketing costs.
General and administrative expenses were $65.0 million for the fiscal year ended January 31, 2016, an increase of $14.1 million or 27.6%, compared to the fiscal year ended January 31, 2015. The increase was primarily attributable to a $16.7 million increase in Acision acquisition and transition costs and the inclusion of Acision's post-acquisition general and administrative expenses partially offset by a decrease in personnel-related and overhead allocation costs due to restructuring initiatives.
Other Operating Expenses
Other operating expenses consist of operating expenses not included in research and development, net and selling, general and administrative expenses and for the fiscal periods presented consist of restructuring expenses.
Other operating expenses were $12.8 million for the fiscal year ended January 31, 2016, an increase of $0.6 million or 5.3%, compared to the fiscal year ended January 31, 2015. The increase was attributable to an increase in restructuring expense. See note 10 of the consolidated financial statements included in Item 15 of this Annual Report.
Loss from Operations
Loss from operations was $68.4 million for the fiscal year ended January 31, 2016, an increase in loss of $3.9 million, or 6.1%, compared to the fiscal year ended January 31, 2015. The increase in loss was primarily attributable to the reasons discussed above.
Interest Income
Interest income was $0.3 million for the fiscal year ended January 31, 2016, a decrease of $0.2 million, or 31.9%, compared to the fiscal year ended January 31, 2015. The decrease was primarily attributable to a decrease in cash.
Interest Expense
Interest expense was $8.7 million for the fiscal year ended January 31, 2016, an increase of $8.0 million, compared to the fiscal year ended January 31, 2015. The increase was primarily attributable to interest expense on the senior credit facility since the Acision Acquisition on August 6, 2015.
Foreign Currency Transaction (Loss) Gain, Net
Foreign currency transaction loss, net, was $0.2 million for the fiscal year ended January 31, 2016, a change of $4.9 million, compared to a foreign currency transaction gain, net of $4.7 million for the fiscal year ended January 31, 2015. The change was attributable to exchange rate volatility primarily related to the Brazilian real, euro, British pound and new Israeli shekels.
41
Other Income (Expense), Net
Other income, net, was $0.4 million for the fiscal year ended January 31, 2016, a change of $0.9 million, compared to other expense, net of $0.5 million for the fiscal year ended January 31, 2015.
Income Tax Benefit
Income tax benefit from continuing operations was $25.2 million for the fiscal year ended January 31, 2016, representing an effective tax rate of 32.9%, compared to income tax benefit from continuing operations of $3.2 million, representing an effective tax rate of 5.3% for the fiscal year ended January 31, 2015. The effective tax rate was lower than the U.S federal statutory rate of 35% primarily due to the mix of income and losses by jurisdiction, changes in statutory tax rates in a foreign jurisdiction, the release of tax contingency reserves as a result of the expiration of certain statutes of limitation and because we did not record an income tax benefit on losses in certain jurisdictions in which we maintain valuation allowances against certain of our U.S. and foreign net deferred tax assets. The income tax benefit from continuing operations for the period is comprised primarily of income tax benefit recorded in non-loss jurisdictions, the release of certain tax contingencies, offset by withholding taxes. For additional information, see note 19 of the consolidated financial statements included in Item 15 of this Annual Report.
Income from Discontinued Operations, Net of Tax
Income from discontinued operations represents the results of operations of BSS, our former BSS segment that was sold to Amdocs effective July 2, 2015.
Income from discontinued operations, net of tax, was $184.1 million for the fiscal year ended January 31, 2016, an increase of $149.0 million, compared to the fiscal year ended January 31, 2015. The increase was primarily attributable to the gain on sale of discontinued operations. See note 17 of the consolidated financial statements included in Item 15 of this Annual Report.
Net Income (Loss)
Net income was $132.8 million for the fiscal year ended January 31, 2016, a change of $154.9 million compared to a net loss of $22.1 million for the fiscal year ended January 31, 2015 due primarily to the reasons discussed above.
42
Fiscal Year Ended January 31, 2015 Compared to Fiscal Year Ended January 31, 2014
Consolidated Results
Fiscal Years Ended January 31, | Change | |||||||||||||
2015 | 2014 | Amount | Percent | |||||||||||
(Dollars in thousands, except per share data) | ||||||||||||||
Total revenue | $ | 268,974 | $ | 415,970 | $ | (146,996 | ) | (35.3 | )% | |||||
Costs and expenses | ||||||||||||||
Cost of revenue | 201,732 | 264,141 | (62,409 | ) | (23.6 | )% | ||||||||
Research and development, net | 36,857 | 39,401 | (2,544 | ) | (6.5 | )% | ||||||||
Selling, general and administrative | 82,722 | 90,607 | (7,885 | ) | (8.7 | )% | ||||||||
Other operating expenses | 12,111 | 9,845 | 2,266 | 23.0 | % | |||||||||
Total costs and expenses | 333,422 | 403,994 | (70,572 | ) | (17.5 | )% | ||||||||
(Loss) income from operations | (64,448 | ) | 11,976 | (76,424 | ) | N/M | ||||||||
Interest income | 480 | 614 | (134 | ) | (21.8 | )% | ||||||||
Interest expense | (641 | ) | (847 | ) | 206 | (24.3 | )% | |||||||
Foreign currency transaction gain (loss) | 4,659 | (10,290 | ) | 14,949 | (145.3 | )% | ||||||||
Other (expense) income, net | (517 | ) | 699 | (1,216 | ) | (174.0 | )% | |||||||
Income tax benefit (expense) | 3,229 | (6,579 | ) | 9,808 | (149.1 | )% | ||||||||
Loss from continuing operations | (57,238 | ) | (4,427 | ) | (52,811 | ) | N/M | |||||||
Income from discontinued operations, net of tax | 35,099 | 23,113 | 11,986 | 51.9 | % | |||||||||
Net (loss) income | $ | (22,139 | ) | $ | 18,686 | $ | (40,825 | ) | N/M | |||||
Basic and diluted (loss) earnings per share | ||||||||||||||
Continuing operations | $ | (2.58 | ) | $ | (0.20 | ) | $ | (2.38 | ) | |||||
Discontinued operations | $ | 1.58 | $ | 1.04 | $ | 0.54 | ||||||||
Total Revenue
Revenue from customer solutions was $143.7 million for the fiscal year ended January 31, 2015, a decrease of $126.3 million, or 46.8%, compared to the fiscal year ended January 31, 2014. The decrease was primarily attributable to a lower volume of projects in the current period resulting from lower bookings and a reduction in revenue primarily attributable to a $15.5 million reduction in revenue attributable to the BSS business not included in the Asset Sale. Revenue recognized using the percentage-of-completion method was $76.9 million and $86.4 million for the fiscal years ended January 31, 2015 and 2014, respectively.
Maintenance revenue was $125.3 million for the fiscal year ended January 31, 2015, a decrease of $20.7 million, or 14.2%, compared to the fiscal year ended January 31, 2014. This decrease was primarily attributable the reduction in maintenance fees charged to certain customers, the timing of entering into renewals of maintenance contracts, the termination of certain maintenance contracts.
Revenue by Geographic Region
Revenue in the Americas, APAC and EMEA represented approximately 44%, 27% and 29% of our revenue, respectively, for the fiscal year ended January 31, 2015 compared to approximately 49%, 26% and 25% of our revenue, respectively, for the fiscal year ended January 31, 2014.
Foreign Currency Impact on Revenue
Our currency for financial reporting purposes is the U.S. dollar. The majority of our revenue for the fiscal year ended January 31, 2015 was derived from transactions denominated in U.S. dollars. All other revenue was derived from transactions denominated in various foreign currencies, primarily the British pound, euro and Japanese yen. For the fiscal year ended January 31, 2015, fluctuations in the U.S. dollar relative to foreign currencies in which we conducted business unfavorably impacted revenue by $3.9 million compared to the fiscal year ended January 31, 2014, primarily due to a $2.5 million and $1.0 million unfavorable impact of the Japanese yen and the euro, respectively.
43
Foreign Currency Impact on Costs
A significant portion of our expenses, principally personnel-related costs, is incurred in new Israeli shekel (or NIS), whereas our currency for financial reporting purposes is the U.S. dollar. A strengthening of the NIS against the U.S. dollar would increase the U.S. dollar value of our expenses in Israel. In order to mitigate this risk we enter into foreign currency forward contracts to hedge foreign currency exchange rate fluctuations.
For the fiscal year ended January 31, 2015, fluctuations in the U.S. dollar relative to all foreign currencies in which we conducted business favorably impacted costs by $1.4 million compared to the fiscal year ended January 31, 2014, primarily due to a favorable impact of the Japanese yen.
Cost of Revenue
Cost of revenue was $201.7 million for the fiscal year ended January 31, 2015, a decrease of $62.4 million, or 23.6%, compared to the fiscal year ended January 31, 2014. The decrease was primarily attributable to a $40.7 million reduction in material costs primarily due to decrease in revenue and a change in mix of revenue with higher margins and a reduction in revenue attributable to the BSS business not included in the Asset Sale, a decrease of $21.4 million in personnel-related and overhead allocation costs due to the transfer of employees to Tech Mahindra and restructuring initiatives and a decrease of $6.9 million in subcontractor costs. The decrease was partially offset by an increase due to a $10.9 million VAT refund received in the fiscal year ended January 31, 2014.
The product cost component of cost of revenue was $55.1 million for the fiscal year ended January 31, 2015, a decrease of $41.8 million compared to the fiscal year ended January 31, 2014. The decrease was primarily attributable to a $40.7 million reduction in material costs primarily due to decrease in revenue and a change in mix of revenue with higher margins and a reduction in business attributable to the BSS business not included in the Asset Sale.
Research and Development, Net
Research and development expenses, net were $36.9 million for the fiscal year ended January 31, 2015, a decrease of $2.5 million, or 6.5%, compared to the fiscal year ended January 31, 2014. The decrease was primarily attributable to a decrease in personnel-related and overhead allocation costs due to restructuring initiatives.
Selling, General and Administrative
Selling, general and administrative expenses were $82.7 million for the fiscal year ended January 31, 2015, a decrease of $7.9 million, or 8.7%, compared to the fiscal year ended January 31, 2014. The decrease was primarily attributable to a $6.8 million decrease in finance department costs and a $5.2 million decrease in commissions due to a reduction in bookings partially offset by an increase legal and professional fees.
Other Operating Expenses
Other operating expenses were $12.1 million for the fiscal year ended January 31, 2015, an increase of $2.2 million, or 23.0%, compared to the fiscal year ended January 31, 2014. The increase was attributable to an increase in restructuring expenses during the fiscal year ended January 31, 2015 compared to the fiscal year ended January 31, 2014. See note 10 of the consolidated and combined financial statements included in Item 15 of this Annual Report.
(Loss) Income from Operations
Loss from operations was $64.4 million for the fiscal year ended January 31, 2015, a change of $76.4 million compared to income from operations of $12.0 million for the fiscal year ended January 31, 2014. The decrease was primarily due to the reasons discussed above.
Interest Income
Interest income was $0.5 million for the fiscal year ended January 31, 2015, a decrease of $0.1 million, or 21.8%, compared to the fiscal year ended January 31, 2014. The decrease was primarily attributable to a decrease in cash.
Interest Expense
Interest expense was $0.6 million for the fiscal year ended January 31, 2015, a decrease of $0.2 million, or 24.3%, compared to the fiscal year ended January 31, 2014.
44
Foreign Currency Transaction Gain (Loss), Net
Foreign currency transaction gain, net, was $4.7 million for the fiscal year ended January 31, 2015, a change of $14.9 million compared to foreign currency transaction loss, net, of $10.3 million for the fiscal year ended January 31, 2014. The change was attributable to exchange rate volatility primarily related to the British pound, euro and new Israeli shekel.
Other (Expense) Income, Net
Other expense, net, was $0.5 million for the fiscal year ended January 31, 2015, a change of $1.2 million compared to Other income, net of $0.7 million for the fiscal year ended January 31, 2014. The change is primarily due to the sale of a patent during the fiscal year ended January 31, 2014.
Income Tax Benefit (Expense)
Income tax benefit from continuing operations was $3.2 million for the fiscal year ended January 31, 2015, representing an effective tax rate of 5.3%, compared to income tax expense from continuing operations of $6.6 million, representing an effective tax rate of 305.7% for the fiscal year ended January 31, 2014. The effective tax rate was lower than the U.S federal statutory rate of 35% primarily due to the mix of income and losses by jurisdiction and because we did not record an income tax benefit on losses in certain jurisdictions in which we maintain valuation allowances against certain of our U.S. and foreign net deferred tax assets. The income tax benefit from continuing operations for the period is comprised primarily of income tax benefit recorded in non-loss jurisdictions, withholding taxes, and certain tax contingencies recorded in the fiscal years ended January 31, 2015 and 2014. We recorded a reduction of income tax benefit of $2.0 million during the fiscal year ended January 31, 2015, primarily due to the expiration of statutes of limitations in various jurisdictions and an audit settlement in Israel. We recorded a reduction in our uncertain tax provision liability and a net reduction of income tax benefit of $16.5 million during the fiscal year ended January 31, 2014, primarily due to the expiration of statutes of limitations in various jurisdictions. Of the $16.5 million net reduction of income tax, approximately $3.6 million was a correction of an error recorded in the 2005 to 2012 fiscal years. For additional information, see note 19 of the consolidated and combined financial statements included in Item 15 of this Annual Report.
Income from Discontinued Operations, Net of Tax
Income from discontinued operations represents the results of operations of our former BSS segment that was sold to Amdocs effective July 2, 2015.
Income from discontinued operations, net of tax, was $35.1 million for the fiscal year ended January 31, 2015, an increase of $12.0 million, or 51.9%, compared to the fiscal year ended January 31, 2014. See note 17 of the consolidated financial statements included in Item 15 of this Annual Report.
Net (Loss) Income
Net loss was $22.1 million for the fiscal year ended January 31, 2015, a change of $40.8 million compared to net income of $18.7 million for the fiscal year ended January 31, 2014 due primarily to the reasons discussed above.
45
LIQUIDITY AND CAPITAL RESOURCES
Overview
We have experienced operating losses in the past two years. In addition, we utilized cash to fund operations, resulting in negative operating cash flows and a decrease in cash balances. As of January 31, 2016, we had approximately $115.4 million of unrestricted cash on-hand. During the most recent fiscal year, we utilized approximately $85.6 million of cash to fund continuing operations. In connection with the acquisition of Acision, we assumed a senior credit facility which requires us to comply with certain operating financial covenants. This debt matures on December 15, 2018.
Our liquidity is dependent on our ability to profitably grow revenues while further reducing costs under our restructuring initiatives announced as well as cost reduction efforts in the future, in connection with plans to consolidate further our operations and integrate the Acision business, realizing favorable cost synergies as a result. Our liquidity is also dependent on our ability to satisfy the operating financial covenants required by the terms of the senior credit facility agreement. We believe that our future sources of liquidity will include cash and cash equivalents, cash flows from operations, refinancing of the senior credit facility or proceeds from the issuance of equity or debt securities.
During the fiscal year ended January 31, 2016, our principal uses of liquidity were to pay the cash consideration for the acquisition of Acision, repayment of Acision shareholder loans, strategic transaction and integration costs, payment of interest on and principal of the Acision Credit Facility, repurchase shares of common stock, fund operating expenses, implement restructuring initiatives and make capital expenditures.
Financial Condition
Cash and Cash Equivalents and Restricted Cash
As of January 31, 2016, we had cash, cash equivalents, bank deposits and restricted cash of approximately $170.0 million, compared to approximately $201.9 million as of January 31, 2015. During the fiscal year ended January 31, 2016, we made the following significant disbursements:
• | Approximately $171.3 million in cash consideration for the acquisition of Acision; |
• | approximately $28.9 million in restructuring payments; |
• | approximately $16.7 million in acquisition and transition service cost relating to a the acquisition of Acision in the fiscal year ended January 31, 2016; |
• | approximately $6.3 million for repurchased shares of common stock in the open market under a Board approved stock repurchase program; and |
• | negative cash flows from operations. |
These declines in cash and cash equivalents were partially offset by proceeds of $271.7 million in connection with the Asset Sale of the BSS business.
Restricted Cash
Restricted cash short-term and long-term aggregated $54.5 million and $43.7 million as of January 31, 2016 and January 31, 2015, respectively. Restricted cash includes compensating cash balances related to existing lines of credit and deposits that are pledged as collateral or restricted for use specified performance guarantees to customers and vendors, letters of credit, indemnification claims, foreign currency transactions in the ordinary course of business and pending tax judgments. Upon closing of the Asset Sale during the fiscal years ended January 31, 2016, $26.0 million of the purchase price was deposited into escrow to fund potential indemnification claims and certain adjustments for a period of 12 months following the closing.
Common Stock Repurchase
As disclosed in our prior SEC filings, our Board of Directors adopted a program to repurchase from time to time at management’s discretion up to $30.0 million in shares of our common stock on the open market during the 18-month period ending October 9, 2015 at prevailing market prices. In early September 2014, as part of this program, our Board approved a $5.0 million committed repurchase plan to be implemented in accordance with Rule 10b5-1 of the Exchange Act. Repurchases were made under the program using our own cash resources. During the fiscal year ended January 31, 2015, we repurchased in the open market under this program 688,642 shares of common stock for an aggregate purchase price of approximately $15.1 million and a weighted average purchase price of $21.98 per share. In mid-July 2015, as part of this program, our Board approved a $5.0 million committed repurchase plan to be implemented in accordance with Rule 10b5-1 of the Exchange Act. During the fiscal year ended January 31, 2016, we repurchased in the open
46
market under this program 319,985 shares of common stock for an aggregate purchase price of approximately $6.3 million with a weighted average purchase price of $19.69 per share.
Liquidity Forecast
We currently forecast that available cash and cash equivalents will be sufficient to meet our liquidity needs, including capital expenditures, for at least the next 12 months.
Management's current forecast is based upon a number of assumptions including, among others: assumed levels of customer order activity, revenue and collections; continued implementation of initiatives to reduce operating costs; no significant degradation in operating margins; increased spending on certain investments in the business; slight reductions in the unrestricted cash levels required to support the working capital needs of the business and other professional fees; successful integration of the Acision business; intra-period working capital fluctuations consistent with historical trends. Management believes that the above-noted assumptions are reasonable. However, should one or more of the assumptions prove incorrect, or should one or more of the risks or uncertainties described in Item 1A, “Risk Factors” materialize, we may experience a shortfall in the cash required to support working capital needs.
Capital Expenditures
We currently expect that the aggregate amount of cash used for capital expenditures for leasehold improvements and upgrades of systems and tools to be between $5.0 million to $7.0 million during the fiscal year ending January 31, 2017.
Sources of Liquidity
The following is a discussion that highlights our primary sources of liquidity, cash and cash equivalents, and changes in those amounts due to operations, financing, and investing activities and the liquidity of our investments.
Cash Flows
Fiscal Year Ended January 31, 2016 Compared to Fiscal Year Ended January 31, 2015
Fiscal Year Ended January 31, | |||||||
2016 | 2015 | ||||||
(In thousands) | |||||||
Net cash used in operating activities | $ | (85,582 | ) | $ | (47,675 | ) | |
Net cash (used in) provided by investing activities | (164,460 | ) | 2,182 | ||||
Net cash used in financing activities | (10,140 | ) | (16,160 | ) | |||
Net cash provided by (used in) discontinued operations | 220,080 | (26,255 | ) | ||||
Effects of exchange rates on cash and cash equivalents | (2,574 | ) | (8,551 | ) | |||
Net decrease in cash and cash equivalents | (42,676 | ) | (96,459 | ) | |||
Cash and cash equivalents, beginning of year | 158,121 | 254,580 | |||||
Cash and cash equivalents, end of year | $ | 115,445 | $ | 158,121 | |||
Operating Cash Flows
Net cash used in operations activities from continuing operations was $85.6 million during the fiscal year ended January 31, 2016, an increase in cash used of $37.9 million compared to the fiscal year ended January 31, 2015. The increase in cash used was primarily attributable to the use of cash associated with the purchase of the Acision, Inc as well as supporting the cost of the stranded overhead in relation to the sale of BSS, partially offset by a decrease in net loss due to the acquisition of Acision and savings from ongoing restructuring and headcount reduction initiatives.
Investing Cash Flows
Net cash used in investing activities from continuing operations was $164.5 million during the fiscal year ended January 31, 2016, a change of $166.6 million compared to cash provided of $2.2 million for the fiscal year ended January 31, 2015. The increase in cash used was primarily attributable $140.0 million in cash as part of the consideration for the acquisition of Acision net of cash acquired. The increase in cash used was also attributable to restricted cash provided of $23.8 million during the fiscal year ended January 31, 2015 primarily due to $25.0 million in escrow
47
released 18 months after the closing of the Verint Merger, compared to restricted cash used of $13.0 million during the fiscal year ended January 31, 2016 primarily due to $26.0 million placed in escrow in connection with the BSS Business sale net of a decrease in cash balance supporting one of our lines of credit. This increase in cash used was partially offset by a decrease in cash used of $7.8 million for purchases of property and equipment.
Financing Cash Flows
Net cash used in financing activities was $10.1 million during the fiscal year ended January 31, 2016, a decrease of $6.0 million, compared to the fiscal year ended January 31, 2015. The decrease was primarily attributable to an $8.8 million decrease in cash used for the repurchase common stock under the repurchase program during the fiscal year ended January 31, 2016 compared to the fiscal year ended January 31, 2015 and a $1.3 million in cash provided for proceeds from the exercise of stock options during the fiscal year ended January 31, 2016 partially offset by an increase of $4.0 million in cash used for the repayment of Acision debt.
Effects of Exchange Rates on Cash and Cash Equivalents
The majority of our cash and cash equivalents are denominated in U.S. dollars. However, due to the nature of our global business, we also hold cash denominated in other currencies, primarily the euro, the NIS and the British pound. For the fiscal year ended January 31, 2016, the fluctuation in foreign currency exchange rates had an unfavorable impact of $2.6 million on cash and cash equivalents.
Fiscal Year Ended January 31, 2015 Compared to Fiscal Year Ended January 31, 2014
Fiscal Years Ended January 31, | |||||||
2015 | 2014 | ||||||
(In thousands) | |||||||
Net cash (used in) provided by operating activities | $ | (69,595 | ) | $ | 6,621 | ||
Net cash used in investing activities | (2,153 | ) | (38,297 | ) | |||
Net cash (used in) provided by financing activities | (16,160 | ) | 25,118 | ||||
Effects of exchange rates on cash and cash equivalents | (8,551 | ) | (1,783 | ) | |||
Net decrease in cash and cash equivalents | (96,459 | ) | (8,341 | ) | |||
Cash and cash equivalents, beginning of year | 254,580 | 262,921 | |||||
Cash and cash equivalents, end of year | $ | 158,121 | 254,580 | ||||
Operating Cash Flows
The net change in cash used in operating activities of $76.2 million during the fiscal year ended January 31, 2015 is primarily due to a loss from operations compared to income from operations in the fiscal year ended January 31, 2014. The change was primarily attributable to the decreases in revenue, which was partially offset by a decrease in costs and operating expenses. The decrease in cash from operations was also negatively impacted by the reduction in deferred revenue during the fiscal year ended January 31, 2015 due to a decline in product bookings and total customer orders (consisting of product bookings and maintenance revenue) compared to the fiscal year ended January 31, 2014. The decrease is primarily attributable to strong activity by certain large Digital Services customers in North America and by a large BSS customer in EMEA during the fiscal year ended January 31, 2014 and the cancellation or delays of orders by BSS customers experiencing financial difficulties. Overall total customer order activity continues to be affected by the decline in product bookings in Digital Services’ traditional solutions, such as voicemail, SMS and MMS and the deferral of significant capital investments involved in deploying our BSS solutions by customers who prioritize their capital expenditures to the deployment of next generation networks, including LTE.
Cash used in operating activities was primarily attributed to a $38.0 million decrease in accounts payable and accrued expenses and a $69.3 million decrease in deferred revenue. These decreases were partially offset by a $22.7 million decrease in deferred cost of sales and a $12.4 million decrease in accounts receivable.
48
Investing Cash Flows
Net cash used in investing activities was $2.2 million during the fiscal year ended January 31, 2015, a decrease of $36.1 million compared to the fiscal year ended January 31, 2014. The decrease was primarily attributable to restricted cash used of $26.9 million during the fiscal year ended January 31, 2014, compared to restricted cash provided of $23.8 million during the fiscal year ended January 31, 2015. This change in restricted cash was mainly due to $25.0 million in bank time deposits placed in escrow by CTI in connection with the closing of the Verint Merger during the fiscal year ended January 31, 2014, which was released from escrow during the fiscal year ended January 31, 2015. Additionally, the cash provided by restricted cash during the fiscal year ended January 31, 2015 includes $4.7 million in return of escrow funds relating to the sale of Starhome partially offset by cash used in the ordinary course of business for use to settle specified performance guarantees to customers and vendors.
This decrease was partially offset by an increase in cash used of $11.0 million for purchases of property and equipment and $2.7 million for the acquisition of Solaiemes during the fiscal year ended January 31, 2015 compared to the fiscal year ended January 31, 2014.
Financing Cash Flows
Net cash used in financing activities was $16.2 million during the fiscal year ended January 31, 2015, a change of $41.3 million, compared to cash provided from financing activities of $25.1 million for the fiscal year ended January 31, 2014. The decrease was primarily attributable to a $25.0 million cash capital contribution from CTI in the fiscal year ended January 31, 2014 and $15.1 million in cash used to repurchase common stock under the repurchase program initiated during the fiscal year ended January 31, 2015.
Effects of Exchange Rates on Cash and Cash Equivalents
The majority of our cash and cash equivalents are denominated in U.S. dollars. However, due to the nature of our global business, we also hold cash denominated in other currencies, primarily the euro, the NIS and the British pound. For the fiscal year ended January 31, 2015, the fluctuation in foreign currency exchange rates had an unfavorable impact of $8.6 million on cash and cash equivalents.
Amdocs Asset Purchase Agreement
On April 29, 2015, we entered into an Asset Purchase Agreement (including the ancillary agreements and documents thereto, the Amdocs Purchase Agreement) with Amdocs Limited, a Guernsey company (or Purchaser). Pursuant to the Amdocs Purchase Agreement, we agreed to sell substantially all of our assets required for operating our converged, prepaid and postpaid billing and active customer management systems for wireless, wireline, cable and multi-play communication service providers (or the BSS Business) to the Purchaser, and the Purchaser agreed to assume certain post-closing liabilities of ours (or the Asset Sale). The initial closing of the Asset Sale occurred on July 2, 2015. The total cash purchase price payable by the Purchaser to us in connection with the Asset Sale was approximately $271.7 million, including currently estimated purchase price adjustment of approximately $0.7 million, of which an aggregate of $5.5 million was paid upon certain deferred closings.
In connection with the Asset Sale, we agreed to indemnify Amdocs for certain pre-closing liabilities and breaches of certain representations and warranties. Upon the closing, $26.0 million of the purchase price was deposited into escrow to fund potential indemnification claims and certain adjustments for a period of 12 months following the closing. In August 2015 and May 2016, we received various claims for indemnification against the escrow from Amdocs. We could receive additional claims in the future. While we continue to evaluate certain claims made, we believe several pending claims are without merit and intend to vigorously defend against them. Nonetheless, amounts held in escrow necessary to satisfy pending claims will remain unavailable to us until these claims are resolved.
In connection with the Amdocs Purchase Agreement, we and the Purchaser have also entered into a Transition Services Agreement (or the TSA), which provides for support services between us and the Purchaser in connection with the transition of the BSS Business to the Purchaser, for various periods up to 12 months following the closing of the Asset Sale. As of March 31, 2016, we have completed substantially all of our commitments to Amdocs under the TSA. For additional information, see Note 17 to our consolidated financial statements included in Item 15 of this Annual Report.
Acquisition of Acision
On August 6, 2015 (or the Closing Date), we completed the previously announced acquisition (or the Acquisition) of Acision Global Limited, a private company formed under the laws of England and Wales (or Acision), a holding
49
company for Acision B.V. (its sole asset), pursuant to the terms of the share sale and purchase agreement, dated June 15, 2015 (or the Purchase Agreement), between us and Bergkamp Coöperatief U.A., a cooperative with excluded liability formed under the laws of the Netherlands (or the Seller).
Pursuant to the terms of the Purchase Agreement, on the Closing Date we acquired 100% of the equity interests of Acision in exchange for $171.3 million in cash (excluding cash acquired and closing costs), certain earnout payments (as discussed below), and 3.14 million shares of our common stock, par value $0.01 per share (or the Consideration Shares), which were issued in a private placement transaction conducted pursuant to Section 4(a)(2) under the Securities Act of 1933, as amended (or the Securities Act). As previously disclosed, pursuant to the terms of the Purchase Agreement, an amount up to $35.0 million of cash consideration is subject to an earnout, contingent on the achievement of revenue targets by certain of Acision’s business activities through the first quarter of 2016. Earnout revenue targets through December 31, 2015 were not achieved and accordingly, no earnout was paid in respect thereof. To secure claims we may have under the Purchase Agreement, $10.0 million of the initial cash consideration was retained in escrow, which amount will be increased in the event that further consideration is triggered under the earnout, up to a maximum aggregate escrow retention of $25.0 million. Such monies will be released to the Seller two years after completion of the Acquisition, subject to any claims. In addition, Acision, in consultation with us, entered into a consent, waiver and amendment (or the Amendment) with the requisite lenders under Acision’s credit agreement (or the Acision Credit Agreement) governing Acision’s existing approximately $156.0 million senior credit facility (or the Acision Senior Debt), pursuant to which the Acision Senior Debt remains in place following completion of the Acquisition. Pursuant to the terms of the Acision Credit Agreement the Acision Senior Debt bears interest at a rate per annum, at the option of Acision, of either (i) a customary adjusted Eurocurrency interest rate plus 9.75% or (ii) a customary base rate plus 8.75%, which currently accrues interest at 10.75%, and matures, subject to the terms and conditions of the Acision Credit Agreement, on December 15, 2018. In connection with the Amendment, we agreed to pay certain costs imposed on Acision by its lenders under the Acision Senior Debt.
The Acision Credit Agreement contains customary representations and warranties and affirmative, restrictive and financial covenants. These provisions, with certain exceptions, restrict Acision’s ability and the ability of its subsidiaries to (i) incur additional indebtedness, (ii) create, incur, assume or permit to exist any liens, (iii) enter into mergers, consolidations or similar transactions, (iv) make investments and acquisitions, (v) make certain dispositions of assets, (vi) make dividends, distributions and prepayments of certain indebtedness, and (vii) enter into certain transactions with affiliates. The Acision Credit Agreement also contains customary events of default, including, among other things, non-payment defaults, covenant defaults, material adverse effect defaults, bankruptcy and insolvency defaults and material judgment default.
The Acision Credit Agreement provides for customary events of default with corresponding grace periods, including failure to pay principal or interest under the new credit agreement when due, failure to comply with covenants, any representation or warranty made by Acision proving to be inaccurate in any material respect, a change of control (which was triggered by our acquisition of Acision and waived by the requisite lenders in the aforementioned amendment). Upon an event of default, all of Acision's indebtedness under the Acision Credit Agreement may be declared immediately due and payable, and the lenders' commitments to provide loans under the Acision Credit Agreement may be terminated.
The Acision Credit Agreement contains a number of affirmative reporting and operational covenants, including a requirement to submit consolidated financial statements to the lenders within certain periods after the end of each fiscal year and quarter. In May 2016 we received the consent of the lenders to extend the deadline to filing Acision’s consolidated financial statement for the fiscal year ended December 31, 2015 and for the three months ended March 31, 2016 to July 5, 2016.
The Acision Credit Agreement also contains a financial covenant that requires Acision to maintain under IFRS a Consolidated Debt to Consolidated Earnings before Interest, Taxes, Depreciation and Amortization (or Consolidated EBITDA) (all of the foregoing as defined in the Acision Credit Agreement) leverage ratio measured quarterly of no greater than 3.75 to 1. At the last covenant reporting date, December 31, 2015, Acision was in compliance with the financial covenant under IFRS and its consolidated leverage ratio was approximately 3.25 to 1.
For additional information, see Note 11 and Note 16 to our consolidated financial statements included in Item 15 of this Annual Report.
50
Agreement with Tech Mahindra
On April 14, 2015, we entered into a MSA with Tech Mahindra pursuant to which Tech Mahindra performs certain services for our business on a global basis. Under the MSA, we are obligated to pay to Tech Mahindra in the aggregate approximately $212.0 million in base fees for services to be provided pursuant to the MSA for a term of six years, renewable at our option. As a result of the MSA, we expect approximately $12.0 million in annual cost savings. For additional information relating to our contractual obligations see "Contractual Obligations" included in this Annual Report.
Sale of Starhome
On August 1, 2012, CTI, certain other Starhome shareholders and Starhome entered into the Starhome Share Purchase Agreement with Fortissimo pursuant to which Fortissimo agreed to purchase all of the outstanding share capital of Starhome as part of the Starhome Disposition. On September 19, 2012, CTI, in order to ensure it could meet the conditions of the Verint Merger, contributed to us its interest in Starhome, including its rights and obligations under the Starhome Share Purchase Agreement. The Starhome Disposition was completed on October 19, 2012.
Under the terms of the Starhome Share Purchase Agreement, Starhome's shareholders received aggregate cash proceeds of approximately $81.3 million, subject to adjustment for fees, transaction expenses and certain taxes. Of this amount, $10.5 million was held in escrow to cover potential post-closing indemnification claims, with $5.5 million being released after 18 months and the remainder released after 24 months, in each case, less any claims made on or prior to such dates. We received aggregate net cash consideration (including $4.9 million deposited in escrow at closing) of approximately $37.2 million, after payments that CTI agreed to make to certain other Starhome shareholders of approximately $4.5 million. The escrow funds were available to satisfy certain indemnification claims under the Starhome Share Purchase Agreement to the extent that such claims exceed $1.0 million. During the fiscal year ended January 31, 2015, we received approximately $4.7 million upon release of the escrow.
Merger of CTI and Verint
On October 31, 2012, CTI completed the spin-off of us as an independent, publicly-traded company, accomplished by means of a pro rata distribution of 100% of our outstanding common shares to CTI's shareholders (or Share Distribution). Following the Share Distribution, CTI no longer holds any of our outstanding capital stock, and we are an independent publicly-traded company.
On August 12, 2012, CTI entered into an agreement and plan of merger with Verint, its then majority-owned publicly-traded subsidiary, providing for the merger of CTI with and into a subsidiary of Verint to become a wholly-owned subsidiary of Verint (or Verint Merger). The Verint Merger was completed on February 4, 2013.
Under the Share Distribution Agreements we and CTI entered into in connection with the Share Distribution, we have agreed to indemnify CTI and its affiliates (including Verint after the Verint Merger) against certain losses that may arise as a result of the Verint Merger and the Share Distribution. Certain of our indemnification obligations are capped at $25.0 million and certain are uncapped. CTI placed $25.0 million in escrow to support indemnification claims to the extent made against us by Verint and any cash balance remaining in such escrow fund 18 months after the closing of the Verint Merger, less any claims made on or prior to such date, to be released to us. The escrow funds could not be used for claims related to the Israeli Optionholder suit. On August 6, 2014, the escrow was released in accordance with its terms and we received the escrow amount of approximately $25.0 million. We also assumed all pre-Share Distribution tax obligations of each of us and CTI. For more information, see Note 3 to our consolidated financial statements included in Item 15 of this Annual Report.
Indebtedness
Spanish Government Sponsored Loans
On August 1, 2014,we assumed in connection with the acquisition of Solaiemes approximately $0.1 million and $1.3 million of short-term and long-term debt, respectively. The debt consists of Spain government sponsored loans extended for research and development projects. The loans are subject to certain acceleration clauses which are not considered probable.
Acision Indebtedness
In connection with the completion of the Acquisition of Acision, on August 6, 2015, Acision, in consultation with us, entered into the previously disclosed consent, waiver and amendment with the requisite lenders under Acision’s credit agreement governing Acision’s existing approximately $156.0 million senior credit facility with $10.0 million and
51
$146.0 million classified as short-term and long-term debt, respectively. For more information, see “−Acquisition of Acision.”
Xura Ltd. Lines of Credit
As of January 31, 2016 and 2015, Xura Ltd., our wholly-owned Israeli subsidiary, had a $17.0 million and $25.0 million, respectively, line of credit with a bank to be used for various performance guarantees to customers and vendors, letters of credit and foreign currency transactions in the ordinary course of business. During the fiscal year ended January 31, 2016, Xura Ltd. decreased the line of credit from $25.0 million to $17.0 million with a corresponding decrease in the cash balances Xura Ltd. is required to maintain with the bank to $17.0 million. This line of credit is not available for borrowings. The line of credit bears no interest and is subject to renewal on an annual basis. Xura Ltd. is required to maintain cash balances with the bank of no less than the capacity under the line of credit at all times regardless of amounts utilized under the line of credit. As of January 31, 2016 and 2015, Xura Ltd. had utilized $10.3 million and $19.5 million, respectively, of capacity under the line of credit for guarantees and foreign currency transactions.
As of January 31, 2016 and 2015, Xura Ltd. had an additional line of credit with a bank for $5.0 million and $10.0 million, respectively, to be used for borrowings, various performance guarantees to customers and vendors, letters of credit and foreign currency transactions in the ordinary course of business. During the fiscal year ended January 31, 2016, Xura Ltd. decreased the line of credit from $10.0 million to $5.0 million with a corresponding decrease in the cash balances Xura Ltd. is required to maintain with the bank to $5.0 million. Borrowings under the line of credit bear interest at an annual rate of London Interbank Offered Rate (or LIBOR) plus a variable margin determined based on the bank’s underlying cost of capital. Xura Ltd. is required to maintain cash balances with the bank of no less than the capacity under the line of credit at all times regardless of amounts borrowed or utilized under the line of credit. As of January 31, 2016 and 2015, Xura Ltd. had no outstanding borrowings under the line of credit. As of January 31, 2016 and 2015, Xura Ltd. had utilized $3.7 million and $6.8 million, respectively, of capacity under the line of credit for guarantees and foreign currency transactions.
Other than Xura Ltd.’s requirement to maintain cash balances with the banks as discussed above, the lines of credit have no financial covenants. These cash balances required to be maintained with the banks were classified as “Restricted cash and bank deposits” and “Long-term restricted cash” included within the consolidated balance sheets as of January 31, 2016 and 2015.
Restructuring Initiatives
We review our business, manage costs and align resources with market demand. As a result, we have taken several actions to improve our cash position, reduce fixed costs, eliminate redundancies, strengthen operational focus and better position us to respond to market pressures or unfavorable economic conditions. While such restructuring initiatives are expected to have positive impact on our operating cash flows in the long term, they also have led, and will lead, to additional expenses. During the fiscal years ended January 31, 2016 and 2015, we recorded severance and facility-related costs attributable to existing restructuring initiatives of $27.4 million and $14.9 million, respectively, and paid $28.9 million and $14.3 million, respectively. The remaining severance and facility-related costs relating to existing restructuring initiatives of $3.2 million and $3.0 million are expected to be substantially paid by July, 2016 and December, 2024, respectively. For more information relating to our restructuring initiatives, including our financial obligations in respect thereof, see Note 10 to the consolidated financial statements included in Item 15 of this Annual Report.
52
Guarantees and Restrictions on Access to Subsidiary Cash
Guarantees
We provide certain customers in the ordinary course of business with financial performance guarantees, which in certain cases are backed by standby letters of credit or surety bonds, the majority of which are cash collateralized and accounted for as restricted cash and bank deposits. We are only liable for the amounts of those guarantees in the event of our nonperformance, which would permit the customer to exercise the guarantee. As of January 31, 2016 and 2015, we believe that we were in compliance with our performance obligations under all contracts for which there is a financial performance guarantee, and that any liabilities arising in connection with these guarantees will not have a material adverse effect on our consolidated results of operations, financial position or cash flows. We also obtained bank guarantees primarily to provide customer assurance relating to the performance of certain obligations required by customer agreements for the guarantee of certain payment obligations. These guarantees, which aggregated $19.1 million and $29.0 million as of January 31, 2016 and 2015, respectively, are generally scheduled to be released upon our performance of specified contract milestones, a majority of which are scheduled to be completed at various dates through July 31, 2016.
Dividends from Subsidiaries
The ability of our Israeli subsidiaries to pay dividends is governed by Israeli law, which provides that dividends may be paid by an Israeli corporation only out of earnings as defined in accordance with the Israeli Companies Law of 1999, provided that there is no reasonable concern that such payment will cause such subsidiary to fail to meet its current and expected liabilities as they come due.
In addition, Acision is party to the Acision Credit Agreement that contains certain restrictive covenants which, among other things, preclude Acision from paying cash dividends and limit its ability to make asset distributions to us.
Cash and cash equivalents held by foreign subsidiaries
We operate our business globally. A significant portion of our cash and cash equivalents is held by various foreign subsidiaries. As of January 31, 2016 and 2015, we had $89.0 million and $88.0 million or 77% and 56% respectively, of our cash and cash equivalents held by our foreign subsidiaries. If cash and cash equivalents held outside the United States are distributed to the United States resident corporate parent in the form of dividends or otherwise, we may be subject to additional U.S. income taxes (subject to an adjustment for foreign tax credits) and foreign withholding taxes. We may incur substantial withholding taxes if we repatriate our cash from certain foreign subsidiaries. We expect a portion of our foreign subsidiaries cash to be repatriated to the U.S. and to other jurisdictions including the Netherlands and Singapore). The tax consequences of any such repatriations would be inconsequential as a result of participation exemptions and the eligibility of foreign tax credits. With respect to certain previously taxed income, the non-U.S. withholding taxes that would be imposed on an actual triggering of a dividend of $148.5 million has been accrued in the amount of $20.3 million. At January 31, 2016, we have approximately $104.6 million of undistributed earnings in its foreign subsidiaries which are considered to be indefinitely reinvested, and the determination of the amount of unrecognized deferred tax liability on unremitted foreign earnings is not practicable because of the complexities of the hypothetical calculation.
OFF-BALANCE SHEET ARRANGEMENTS
As of January 31, 2016, we had no material off-balance sheet arrangements, other than performance guarantees disclosed in “—Liquidity and Capital Resources—Guarantees and Restrictions on Access to Subsidiary Cash—Guarantees” and except as disclosed in Note 24 to the consolidated financial statements included in Item 15 of this Annual Report. There were no material changes in our off-balance sheet arrangements since January 31, 2015.
53
CONTRACTUAL OBLIGATIONS
The following table presents our contractual obligations as of January 31, 2016:
Payments due by period | |||||||||||||||||||
Total | < 1 year | 1-3 years | 3-5 years | > 5 years | |||||||||||||||
(In thousands) | |||||||||||||||||||
Long-term debt obligations (1) | $ | 152,958 | $ | 12,248 | $ | 140,557 | $ | 153 | $ | — | |||||||||
Operating lease obligations - real estate | 46,837 | 8,244 | 12,689 | 8,728 | 17,176 | ||||||||||||||
Operating lease obligations - other (equipment, etc.) | 166 | 105 | 61 | — | — | ||||||||||||||
Purchase obligations (2)(3) | 195,894 | 50,321 | 75,240 | 61,000 | 9,333 | ||||||||||||||
Total (4) | $ | 395,855 | $ | 70,918 | $ | 228,547 | $ | 69,881 | $ | 26,509 | |||||||||
(1) | In connection with the completion of the Acquisition of Acision, on August 6, 2015, Acision, in consultation with us, entered into the previously disclosed consent, waiver and amendment with the requisite lenders under Acision’s credit agreement governing Acision’s existing senior credit facility. For additional information, see Note11 to our consolidated financial statements included in Item 15 of this Annual Report. |
(2) | Purchase obligations include agreements to purchase goods or services that are enforceable, legally binding and specify all significant terms, including fixed or minimum quantities to be purchased; fixed, minimum or variable price provisions, and the approximate timing of the transaction. Purchase obligations exclude agreements that are cancelable without penalty. |
(3) | The table above includes the Master Service Agreement with Tech Mahindra entered into on April 14, 2015 and started on June 1, 2015, to perform certain services for our business on a global basis. Our obligation is to pay Tech Mahindra in the aggregate was approximately $212 million in base fees for services to be provided pursuant to the MSA for a term of six years, renewable at our option. The remaining obligation as of January 31,2016 is $189.7 million. We have the right to terminate the agreement subject to certain early termination fees. |
(4) | Our consolidated balance sheet as of January 31, 2016 includes $77.5 million in non-current tax liabilities for uncertain tax positions. The specific timing of any cash payments, if any, relating to this obligation cannot be projected with reasonable certainty and, therefore, no amounts for this obligation are included in the table set forth above. |
CRITICAL ACCOUNTING POLICIES AND ESTIMATES
The accounting estimates and judgments discussed in this section are those that we consider to be most critical to understand our consolidated financial statements (or the financial statements), because they involve significant judgments and uncertainties. More specifically, the accounting estimates and judgments outlined below are critical because they can materially affect our operating results and financial condition, inasmuch as they require management to make difficult and subjective judgments regarding uncertainties. Many of these estimates include determinations of fair value. All of these estimates reflect our best judgment about current and, for some estimates, future, economic and market conditions and effects based on information available to us as of the date of the accompanying financial statements. As a result, the accuracy of these estimates and the likelihood of future changes depend on a range of possible outcomes and a number of underlying variables, some of which are beyond our control. See also Note 1 to the consolidated financial statements included in Item 15 of this Annual Report for additional information on the significant accounting estimates and judgments underlying the financial results disclosed in our consolidated financial statements.
Revenue Recognition
We report our revenue in two categories: (i) product revenue, including hardware and software products; and (ii) service revenue, including revenue from professional services, training services and post-contract customer support (or PCS). Professional services primarily include installation, customization and consulting services. Revenue arrangements may include one of these single elements, or may incorporate one or more elements in a single transaction or combination of related transactions.
In September 2009, the FASB issued revenue recognition guidance applicable to multiple element arrangements, which:
• | applies to multiple element revenue arrangements that contain both software and hardware elements, focusing on determining which revenue arrangements are within the scope of the software revenue guidance; and |
• | addresses how to separate consideration related to each element in a multiple element arrangement, excluding software arrangements, and establishes a hierarchy for determining the selling price of an element. It also eliminates the residual method of allocation by requiring that arrangement consideration be allocated at the inception of the arrangement to all elements using the relative selling price method. |
We adopted this guidance on a prospective basis for revenue arrangements entered into, or materially modified, on or after February 1, 2011.
54
Multiple element arrangements entered into or materially modified on or after February 1, 2011 that include hardware which functions together with software to provide the essential functionality of the product are accounted under the FASB's guidance applicable to multiple element arrangements. Multiple element arrangements entered into prior to February 1, 2011 and not materially modified on or after February 1, 2011 are accounted for in accordance with the FASB's guidance relating to revenue recognition for software arrangements as the software component of most of our multiple element arrangements is more than incidental to the products being sold.
For arrangements that do not require significant customization of the underlying software, we recognize revenue when we have persuasive evidence of an arrangement, the product has been shipped and the services have been provided to the customer, the sales price is fixed or determinable, collectability is probable, and all pertinent criteria are met as required by the FASB's guidance.
For multiple element arrangements entered into prior to February 1, 2011 and not materially modified on or after February 1, 2011, we allocate revenue to the delivered elements of the arrangement using the residual method, whereby revenue is allocated to the undelivered elements based on vendor specific objective evidence (or VSOE) of fair value of the undelivered elements with the remaining arrangement fee allocated to the delivered elements and recognized as revenue assuming all other revenue recognition criteria are met. If we are unable to establish VSOE of fair value for the undelivered elements of the arrangement, revenue recognition is deferred for the entire arrangement until all elements of the arrangement are delivered. However, if the only undelivered element is PCS, we recognize the arrangement fee ratably over the PCS period.
For multiple element arrangements entered into or materially modified after February 1, 2011 that include hardware which functions together with software to provide the essential functionality of the product, we allocate revenue to each element based on its selling price. The selling price used for each element is based on VSOE of fair value, if available, third-party evidence (or TPE) of fair value if VSOE is not available, or our best estimate of selling price (or BESP) if neither VSOE nor TPE is available. In determining the units of accounting for these arrangements, we evaluate whether each element has stand-alone value as defined in the FASB's guidance. Given that the hardware and software function together to provide the essential functionality of the product and each element is critical to the overall tangible product sold, neither the software nor the hardware has stand-alone value. Professional services performed prior to the product's acceptance do not have stand-alone value and are therefore combined with the related hardware and software as one non-software deliverable. After determining the fair value for each deliverable, the arrangement consideration is allocated using the relative selling price method. Revenue is recognized accordingly for each deliverable once the respective revenue recognition criteria are met for that deliverable.
The majority of multiple element arrangements contain at least two of the following elements: (1) tangible product (hardware, software, and professional services performed prior to the product's acceptance), (2) post-contract support (PCS), (3) training, and (4) post acceptance services. Our tangible products are rarely sold separately. In addition, our tangible products are complex, and contain a high degree of customizations such that we are unable to demonstrate pricing within a pricing range to establish BESP as very few contracts are comparable. Therefore, we have concluded that cost plus a target gross profit margin provides the best estimate of the selling price.
PCS, training, and post acceptance services have various pricing practices based on several factors, including the geographical region of the customer, the size of the customer's installed base, the volume of services being sold and the type or class of service being performed. As noted above, we have VSOE of PCS for a portion of our arrangements. For PCS, we use our minimum substantive VSOE thresholds by region plus a reasonable margin as the basis to estimate BESP of PCS for transactions that do not meet the VSOE criteria. For training and post-acceptance services, we perform an annual study of stand-alone training and post-acceptance sales to arrive at BESP. While the study does not result in VSOE, it is useful in determining our BESP.
The timing of recognition for our revenue transactions involves numerous judgments, estimates and policy determinations. The most significant are summarized as follows:
PCS revenue is derived primarily from providing technical software support services, unspecified software updates and upgrades to customers on a when and if available basis. PCS revenue is recognized ratably over the term of the PCS period.
When PCS is included within a multiple element arrangement and the arrangement is within the scope of the software revenue guidance, we utilize the substantive renewal rate or the bell-shaped curve approach (depending on the maintenance pricing mechanism for each customer) to establish VSOE of fair value for the PCS.
When using the substantive renewal rate method, we may be unable to establish VSOE of fair value for PCS because the renewal rate is deemed to be non-substantive or there are no contractually-stated renewal rates. If the stated renewal rate is non-substantive, the entire arrangement fee is recognized ratably over the estimated economic life of the product (five to eight years) beginning upon delivery of all elements other than PCS. We believe that the estimated
55
economic life of the product is the best estimate of how long the customer will renew PCS. If there is no contractually stated renewal rate, the entire arrangement fee is recognized ratably over the relevant contractual PCS term beginning upon delivery of all elements other than PCS.
For arrangements that include a stated renewal rate, determining whether the actual renewal rate is substantive is a matter of judgment. For each group of our products, we stratify our customers based on the geographic location of the customer. Based on our historical negotiations and contract experience we believe that our customers behave differently and perceive different values for PCS based on this factor.
We evaluate many factors in determining the estimated economic life of our products, including the support period of the product, technological obsolescence, average time between new product releases and upgrade activity by customers. We have concluded that the estimated economic lives of our key software products range from five to eight years.
When using the bell-shaped curve approach, the timing of revenue recognition on software licenses and other revenue could be significantly impacted if we are unable to maintain VSOE on one or more undelivered elements during any quarterly period. Loss of VSOE could result in (i) the complete deferral of all revenue or (ii) ratable recognition of all revenue under a customer arrangement until such time as VSOE is re-established.
Our policy for establishing VSOE of fair value for professional services and training is based upon an analysis of separate sales of services, which are then compared with the fees charged when the same elements are included in a multiple element arrangement. Xura has not yet established VSOE of fair value for any element other than PCS.
In certain multiple element arrangements, we are obligated to provide training services to customers related to the operation of our software products. These training services are either provided to the customer on a “defined” basis (limited to a specified number of days or training classes) or on an “as-requested” basis (unlimited training over a contractual period).
For multiple element arrangements containing as-requested training obligations that are within the scope of the software revenue guidance, we recognize the total arrangement consideration ratably over the contractual period during which we are required to “stand ready” to perform such training, provided that all other criteria for revenue recognition have been met.
For multiple element arrangements containing defined training obligations, the training services are typically provided to the customer prior to the completion of the installation services. For arrangements that are within the scope of the software revenue guidance, because revenue recognition does not commence until the completion of installation, the defined training obligations do not impact the timing of recognition of revenue. In certain circumstances in which training is provided after the end of the installation period, we commence revenue recognition upon the completion of training, provided that all other criteria for revenue recognition have been met.
Some of our arrangements require significant customization of the product to meet the particular requirements of the customer. For these arrangements, revenue is recognized, in accordance with the FASB's guidance for long-term construction type contracts using the percentage-of-completion (or POC) method.
The determination of whether services entail significant customization requires judgment and is primarily based on alterations to the features and functionality to the standard release, complex or unusual interfaces as well as the amount of hours necessary to complete the customization solution relative to the size of the contract. Revenue from these arrangements is recognized on the POC method based on the ratio of total hours incurred to date compared to estimated total hours to complete the contract. We are required to make judgments to estimate the total estimated costs and progress to completion. Changes to such estimates can impact the timing of the revenue recognition period to period. We use historical experience, project plans, and an assessment of the risks and uncertainties inherent in the arrangement to establish these estimates. Uncertainties in these arrangements include implementation delays or performance issues that may or may not be within our control. If some level of profitability is assured, but the related revenue and costs cannot be reasonably estimated, then revenue is recognized to the extent of costs incurred until such time that the project's profitability can be estimated or the services have been completed.
If VSOE of fair value of PCS does not exist, all revenue will be deferred until completion of the professional services and recognized ratably over the respective PCS period. If we determine that based on our estimates our costs exceed the sales price, the entire amount of the estimated loss is accrued in the period that such losses become known.
When revenue is recognized over multiple periods in accordance with our revenue recognition policies, the material cost, including hardware and third-party software license fees are deferred and amortized over the same period that product revenue is recognized. These costs are recognized as “Deferred cost of revenue” on the consolidated balance sheets. However, we have made an accounting policy election whereby the cost for installation and other service costs
56
are expensed as incurred, except for arrangements recognized in accordance with the FASB's guidance for long-term construction type contracts.
In the consolidated statements of operations, we classify revenue as product revenue or service revenue as prescribed by SEC Rules and Regulations. For multiple element arrangements that include both product and service elements, management evaluates various available indicators of fair value and applies its judgment to reasonably classify the arrangement fee between product revenue and service revenue. The amount of multiple element arrangement fees classified as product and service revenue based on management estimates of fair value when VSOE of fair value for all elements of an arrangement does not exist could differ from amounts classified as product and service revenue if VSOE of fair value of all elements existed. The allocation of multiple element arrangement fees between product revenue and service revenue, when VSOE of fair value of all elements does not exist, is for combined financial statement presentation purposes only and does not affect the timing or amount of revenue recognized.
In determining the amount of a multiple element arrangement fee that should be classified between product revenue and service revenue, we first allocate the arrangement fee to product revenue and PCS (PCS is classified as service revenue) based on management's estimate of fair value for those elements. The remainder of the arrangement fee, which is comprised of all other service elements, is allocated to service revenue. The estimate of fair value of the product element is based primarily on management's evaluation of direct costs and reasonable profit margins on those products. This was determined to be the most appropriate methodology as we have historically been product oriented with respect to pricing policies which facilitates the evaluation of product costs and related margins in arriving at a reasonable estimate of the product element fair value. Management's estimate of reasonable profit margins requires significant judgment and consideration of various factors, such as the impact of the economic environment on margins, the complexity of projects, the stability of product profit margins and the nature of products. The estimate of fair value for PCS is based on management's evaluation of weighted average PCS rates for arrangements for which VSOE of fair value of PCS exists.
Extended Payment Terms
One of the critical judgments that we make, related to revenue recognition, is the assessment that collectability is probable. Our recognition of revenue is based on our assessment of the probability of collecting the related accounts receivable balance at the onset of a sales arrangement. Certain of our arrangements include payment terms that depart from our customary practice. In these situations, if a customer does not have an adequate history of abiding by its contractual payment terms without concessions, the sales price is not considered fixed or determinable and revenue is recognized upon collection provided all other revenue recognition criteria have been met. We consider payment terms where more than 5% of the arrangement fees are due 120 days from customer acceptance to be extended. If the arrangement is with a new customer and the payment terms are extended, there is no evidence of collecting under the original payment terms without making concessions and therefore the presumption that the fee is not fixed and determinable cannot be overcome. If this arrangement is with an existing customer, an evaluation of the customer's payment history will take place to determine if the fee is fixed.
Percentage-of-Completion Accounting
We have a standard quarterly process in which management reviews the progress and performance of our significant contracts. As part of this process, management reviews include, but are not limited to, any outstanding key contract matters, progress towards completion and the related program schedule, identified risks and opportunities, and the related changes in estimates of revenues and costs. These risks and opportunities include management's judgment about the ability and costs to achieve the schedule requirements, technical requirements (for example, a newly-developed product versus a mature product) and other specific contract requirements. Management must make assumptions regarding labor productivity and availability, the complexity of the work to be performed, the availability of materials, the length of time to complete the contract (to estimate increases in wages and prices for materials and related support cost allocations), performance by our subcontractors, and the availability and timing of funding from our customer, among other variables. Based on this analysis, any adjustments to net sales, costs of sales and the related impact to operating income are recorded as necessary in the period they become known. These adjustments may result in an increase in operating profit during the performance of a contract to the extent we determine we will be successful in mitigating risks for schedule and technical requirements in addition to other specific contract risks or we will realize related opportunities. Likewise, these adjustments may decrease operating profit if we determine we will not be successful in mitigating these risks or we will not realize related opportunities. Changes in estimates of net sales, costs of sales, and the related impact to operating income are recognized using a cumulative catch-up, which recognizes in the current period the cumulative effect of the changes on current and prior periods. A significant change in one or more of these estimates could affect the profitability of one or more of our contracts.
57
Stock-Based Compensation
We account for share-based payment awards, including employee stock options, restricted stock, restricted stock units (RSUs) and employee stock purchases, made to employees and directors in accordance with the FASB's guidance for share-based payment and related interpretative guidance, which requires the measurement and recognition of compensation expense for all such awards based on estimated fair value.
Xura estimates the fair value of share-based payment awards on the date of grant using an option-pricing model. Under the FASB's guidance, stock-based compensation expense is measured at the grant date based on the fair value of the award, and the cost is recognized as expense ratably over the award's vesting period. Xura uses the Black-Scholes option-pricing model to measure fair value of stock option awards. The Black-Scholes model requires judgments regarding the assumptions used within the model, the most significant of which are the stock price volatility assumption over the term of the awards and the expected life of the option award based on the actual and projected employee stock option behaviors. The inputs noted below that are factored into the option valuation model we use to measure the fair value of our stock awards are subjective estimates. Changes to these estimates could cause the fair value of our stock awards and related stock-based compensation expenses to vary materially. Except as noted below, the following key assumptions are used for all of Xura stock-based compensation awards:
• | The risk-free interest rate assumption we use is based upon U.S. Treasury interest rates appropriate for the expected life of the awards. |
• | Xura's expected dividend rate is zero since Xura does not currently pay cash dividends on their common stock and do not anticipate doing so in the foreseeable future. |
• | For the fiscal year ended January 31, 2016, the volatility was based on our historical stock volatility. For the fiscal years ended January 31, 2015 and 2014, the volatility was based on the historical stock volatility of several peer companies, as we had limited trading history to use the volatility of our own common shares. |
Xura is also required to estimate expected forfeitures of stock-based awards at the grant date and recognize compensation cost only for those awards expected to vest. Although Xura estimates forfeitures based on historical experience while a subsidiary of CTI and future expectation, actual forfeitures may differ. The forfeiture assumption is adjusted to the actual forfeitures that occur.
During the fiscal years ended January 31, 2016, 2015 and 2014, our stock-based compensation expense, was $9.8 million, $11.4 million and $10.2 million, respectively.
Recoverability of Goodwill
Goodwill represents the excess of the fair value of consideration transferred in the business combination over the fair value of tangible and intangible assets acquired net of the fair value of liabilities assumed and the fair value of any noncontrolling interest in the acquiree.
We apply the FASB's guidance when testing goodwill for impairment which permits management to make a qualitative assessment of whether goodwill is impaired, or opt to bypass the qualitative assessment, and proceed directly to performing the first step of the two-step impairment test. If management performs a qualitative assessment and concludes it is more-likely-than-not that the fair value of a reporting unit exceeds its carrying value, goodwill is not considered impaired and the two-step impairment test is unnecessary. However, if management concludes otherwise, it is then required to perform the first step of the two-step impairment test.
For reporting units where we decide to perform a qualitative assessment, our management assesses and makes judgments regarding a variety of factors which potentially impact the fair value of a reporting unit, including general economic conditions, industry and market-specific conditions, customer behavior, cost factors, our financial performance and trends, our strategies and business plans, capital requirements, management and personnel issues, and our stock price, among others. Management then considers the totality of these and other factors, placing more weight on the events and circumstances that are judged to most affect a reporting unit's fair value or the carrying amount of its net assets, to reach a qualitative conclusion regarding whether it is more-likely-than-not that the fair value of a reporting unit exceeds its carrying amount.
For reporting units where we perform the two-step goodwill impairment test, the first step requires us to compare the fair value of each reporting unit to the carrying value of its net assets. Management considers both an income-based approach using projected discounted cash flows and a market-based approach using multiples of comparable companies to determine the fair value of its reporting units. Management's estimate of fair value of each reporting unit is based on a number of subjective factors, including: (i) the appropriate weighting of valuation approaches (income-based approach
58
and market-based approach), (ii) estimates of the future revenue and cash flows, (iii) discount rate for estimated cash flows, (iv) selection of peer group companies for the market-based approach, (v) required levels of working capital, (vi) assumed terminal value, (vii) the time horizon of cash flow forecasts, and (viii) control premium.
We use the work of an independent third-party appraisal firm to assist us in considering our determination of the implied fair value of our goodwill. The fair values are calculated using the income approach and a market approach based on comparable companies. The income approach, more commonly known as the discounted cash flow approach, estimates fair value based on the cash flows that an asset can be expected to generate over its useful life. If the carrying value of a reporting unit's goodwill exceeds its implied fair value, then an impairment charge equal to the difference is recorded. Assumptions and estimates about future values of our reporting units and implied goodwill are complex and subjective. They can be affected by a variety of factors, including external factors such as industry and economic trends, and internal factors such as changes in our business strategy and our internal forecasts. Although we believe the historical assumptions and estimates we have made are reasonable and appropriate, different assumptions and estimates could materially impact our reported financial results.
The determination of reporting units also requires management judgment. We assess whether a reporting unit exists within a reportable segment by identifying the unit, determining whether the unit qualifies as a business under U.S. GAAP, and assessing the availability and regular review by segment management of discrete financial information for the unit.
Management's forecasts and estimates are based on assumptions that are consistent with the plans and estimates used to manage the business. Changes in these estimates could change the conclusion regarding an impairment of goodwill.
As a result of the Amdocs Purchase Agreement for the sale the BSS Business, we performed an interim goodwill test in conjunction with the preparation of its financial statements for the three months ended April 30, 2015.
The determination of whether or not goodwill is impaired involves a significant level of judgment in the assumptions underlying the approaches used to determine the estimated fair value of our reporting units as well as the allocation of the carrying value of the assets and liabilities to each of the reporting units which has historically been based on headcount. Management believes the analysis included sufficient tolerance for sensitivity in key assumptions. The determination of the fair value of our reporting units include a market-based approach using multiples of comparable companies to determine the fair value of its reporting units and an income-based approach using projected discounted cash flows based on our internal forecasts and projections. Management believes the assumptions and rates used in its impairment assessment are reasonable, but they are judgmental, and variations in any assumptions could result in materially different calculations of fair value and potentially result in impairment of assets.
Step one of the quantitative goodwill impairment interim test for the three months ended April 30, 2015, resulted in the determination that the estimated fair value of Digital Services exceeded its carrying amount, including goodwill; however a step two analysis was performed on the reporting unit due to the negative carrying value of continuing assets and liabilities following the classification of BSS as an asset held for sale. The fair value of the goodwill as calculated under step two of the impairment test exceeded the carrying value as recorded.
We completed our annual review for impairment as of November 1, 2015 using a market based approach in determining fair value, which did not result in an impairment.
Our forecasts and estimates are based on assumptions that are consistent with the plans and estimates used to manage the business. Changes in these estimates could change the conclusion regarding an impairment of goodwill.
For more information, see Note 1 and Note 6 to the consolidated financial statements included in Item 15 of this Annual Report.
Management's forecasts and estimates are based on assumptions that are consistent with the plans and estimates used to manage the business. Changes in these estimates could change the conclusion regarding an impairment of goodwill.
59
Recoverability of Long-Lived Assets
We periodically evaluate our long-lived assets for potential impairment. In accordance with the relevant accounting guidance, we review the carrying value of our long-lived assets or asset group that is held and used for impairment whenever circumstances occur that indicate that those carrying values are not recoverable. Under the held and used approach, assets are grouped at the lowest level for which identifiable cash flows are largely independent of the cash flows of other groups of assets and liabilities. The identification of asset groups involves judgment, assumptions, and estimates.
We make judgments about the recoverability of long-lived assets, including fixed assets and purchased finite-lived intangible assets whenever events or changes in circumstances indicate that impairment may exist. Each period we evaluate the estimated remaining useful lives of long-lived assets and whether events or changes in circumstances warrant a revision to the remaining periods of depreciation or amortization. If circumstances arise that indicate an impairment may exist, we use an estimate of the undiscounted value of expected future operating cash flows over the primary asset’s remaining useful life and salvage value to determine whether the long-lived assets are impaired. If the aggregate undiscounted cash flows and salvage values are less than the carrying amount of the assets, the resulting impairment charge to be recorded is calculated based on the excess of the carrying amount of the assets over the fair value of such assets, with the fair value generally determined using the discounted cash flow (or DCF) method. Application of the DCF method for long-lived assets requires judgment and assumptions related to the amount and timing of future expected cash flows, salvage value assumptions, and appropriate discount rates. Different judgments or assumptions could result in materially different fair value estimates.
Income Taxes
Income taxes are provided using the asset and liability method, such that income taxes (i.e., deferred tax assets, deferred tax liabilities, taxes currently payable/refunds receivable and tax expense/benefit) are recorded based on amounts refundable or payable in the current year and include the results of any difference between U.S. GAAP and tax reporting. Deferred income taxes reflect the tax effect of net operating losses, capital losses and general business credit carryforwards and the net tax effects of temporary differences between the carrying amount of assets and liabilities for financial statement and income tax purposes, as determined under enacted tax laws and rates. Valuation allowances are established when management determines that it is more-likely-than-not that some portion or all of the deferred tax asset will not be realized. The financial effect of changes in tax laws or rates is accounted for in the period of enactment. The subsequent realization of net operating loss and general business credit carryforwards acquired in acquisitions accounted for using the acquisition method of accounting is recognized in the consolidated statement of operations.
From time to time, we have business transactions in which the tax consequences are uncertain. Significant judgment is required in assessing and estimating the tax consequences of these transactions. We prepare and file tax returns based on our interpretation of tax laws. In the normal course of business, our tax returns are subject to examination by various taxing authorities. Such examinations may result in future tax, interest and penalty assessments. In determining our tax provision for financial reporting purposes, we establish a liability for uncertain tax positions unless such positions are determined to be more-likely-than-not of being sustained upon examination, based on their technical merits. That is, for financial reporting purposes, we only recognize tax benefits that we believe are more-likely-than-not of being sustained and then recognize the largest amount of benefit that is greater than 50 percent likely to be realized upon settlement. There is considerable judgment involved in determining whether positions taken on the tax return are more-likely-than-not of being sustained and determining the likelihood of various potential settlement outcomes.
We adjust our estimated liability for uncertain tax positions periodically because of new information discovered as a function of ongoing examinations by, and settlements with, the various taxing authorities, as well as changes in tax laws, regulations and interpretations. The combined tax provision of any given year includes adjustments to prior year income tax accruals that are considered appropriate as well as any related estimated interest. Our policy is to recognize all appropriately accrued interest and penalties on uncertain tax positions as part of income tax benefit (expense). For further information, see Note 19 to the consolidated financial statements included in Item 15 of this Annual Report.
As part of our accounting for business combinations, some of the purchase price is allocated to goodwill and intangible assets. Impairment expenses associated with goodwill are generally not tax deductible and will result in an increased effective income tax rate in the fiscal period any impairment is recorded. Amortization expenses associated with acquired intangible assets are generally not tax deductible pursuant to our existing tax structure; however, deferred taxes have been recorded for non-deductible amortization expenses as a part of the purchase price allocation process. We have taken into account the allocation of these identified intangibles among different taxing jurisdictions, including those with nominal or zero percent tax rates, in establishing the related deferred tax liabilities. Under the FASB's guidance, the income tax benefit from future releases of the acquisition date valuation allowances or income tax contingencies, if any,
60
are reflected in the income tax provision in the consolidated statements of operations, rather than as an adjustment to the purchase price allocation.
Litigation and Contingencies
Contingencies by their nature relate to uncertainties that require management to exercise judgment both in assessing the likelihood that a liability has been incurred as well as in estimating the amount of potential loss, if any. We accrue for costs relating to litigation, claims and other contingent matters when such liabilities become probable and reasonably estimable. We expense legal fees associated with consultations with outside counsel and defense of lawsuits as incurred. Such estimates may be based on advice from third parties or solely on management's judgment, as appropriate. Actual amounts paid may differ materially from amounts estimated, and such differences will be charged to operations in the period in which the final determination of the liability is made.
From time to time, we receive notices that our products or processes may be infringing the patent or intellectual property rights of others; and notices of other lawsuits or other claims against us. We assess each matter in order to determine if a contingent liability should be recorded. In making this determination, management may, depending on the nature of the matter, consult with internal and external legal counsel. Based on the information obtained combined with management's judgment regarding all the facts and circumstances of each matter, we determine whether a contingent loss is probable and whether the amount of such loss can be estimated. Should a loss be probable and estimable, we record a contingent loss. Should the judgments and estimates made by management not coincide with future events, such as a judicial action against us where we expected no merit on the part of the party bringing the action against us, we may need to record additional contingent losses that could materially adversely impact our results of operations. Alternatively, if the judgments and estimates made by management are incorrect and a particular contingent loss does not occur, the contingent loss recorded would be reversed thereby favorably impacting our results of operations.
Israel Employees Severance Pay
Under Israeli law, we are obligated to make severance payments under certain circumstances to employees of our Israeli subsidiaries on the basis of each individual’s current salary and length of employment. Our liability for severance pay is calculated pursuant to Israel’s Severance Pay Law based on the most recent monthly salary of the employee multiplied by the number of years of employment, as of the balance sheet date. The liability for severance pay is recognized as compensation benefits in the consolidated statements of operations. Employees are entitled to one month’s salary for each year of employment or a portion thereof. We record the obligation as if it was payable at each balance sheet date (“shut-down method”). A portion of such severance liability is funded by monthly deposits into insurance policies, which are restricted to only be used to satisfy such severance payments. Any change in the fair value of the asset is recognized as an adjustment to compensation expense in the consolidated statements of operations. The asset and liability are recognized gross and not offset on the consolidated balance sheet. Upon involuntary termination, employees will receive the balance from deposited funds from the insurance policies with the remaining balance paid by us. For voluntarily termination the employees are entitled, based on our policy, to the balance in the deposited funds. Any remaining net liability balance is reversed as compensation benefits in the consolidated statements of operations.
For employees in Israel hired after January 2011, we make regular deposits with certain insurance companies for accounts controlled by each applicable employee in order to secure the employee's rights upon termination. We are relieved from any severance pay liability with respect to deposits made on behalf of each employee. As such, the severance plan is only defined by the monthly contributions made by us, the liability accrued in respect of these employees and the amounts funded are not reflected in the consolidated balance sheets. The portion of liability not funded is included in Other long-term liabilities in the consolidated balance sheets.
During the fiscal year ended January 31, 2016, we changed our benefits policy for employees in Israel and began funding the insurance policies at levels covering the full severance liability and funding the insurance policies for all previously unfunded accrued severance liability. Upon deposit of 100% of the severance liability with the insurance companies, we are relieved from any severance pay liability with respect to deposits made on behalf of each employee.
Accounting Standards Applicable to Emerging Growth Companies
We are an emerging growth company as defined under the JOBS Act. Emerging growth companies can delay adopting new or revised accounting standards that have different effective dates for public and private companies until such time as those standards apply to private companies. We intend to take advantage of such extended transition period. Since we will not be required to comply with new or revised accounting standards on the relevant dates on which adoption of such standards is required for other public companies, our financial statements may not be comparable to the financial statements of companies that comply with public company effective dates. If we were to elect to comply with these public company effective dates, such election would be irrevocable pursuant to Section 107 of the JOBS Act.
61
RECENT ACCOUNTING PRONOUNCEMENTS
See Note 2, Recent Accounting Pronouncements, to the consolidated financial statements included in Item 15 of this Annual Report.
ITEM 7A. | QUANTITATIVE AND QUALITATIVE DISCLOSURES ABOUT MARKET RISK |
We are exposed to market risk from changes in interest rates and foreign currency exchange rates, which may adversely affect our consolidated financial position and results of operations. We seek to minimize these risks through regular operating and financing activities, and when deemed appropriate, through the use of derivative financial instruments, including foreign currency forward contracts. It is our policy to enter into derivative transactions only to the extent considered necessary to meet our risk management objectives. We do not purchase, hold or sell derivative financial instruments for trading or speculative purposes.
Investments
Cash, Cash Equivalents, Restricted Cash and Bank Deposits
We invest in cash and cash equivalents. Cash primarily consists of cash on hand and bank deposits. Cash equivalents primarily consist of interest-bearing money market accounts, commercial paper, agency notes and other highly liquid investments with an original maturity of three months or less when purchased. We maintain cash and cash equivalents in U.S. dollars and in foreign currencies, which are subject to risks related to foreign currency exchange rate fluctuations. Restricted cash and bank deposits include compensating cash balances related to existing lines of credit and deposits that are pledged as collateral or restricted for use to settle potential indemnification claims arising from the disposition of businesses, to settle specified performance guarantees to customers and vendors, letters of credit, foreign currency transactions in the ordinary course of business and pending tax judgments. Cash expected to be restricted for more than one year from the balance sheet date is classified as long-term restricted cash. Restricted bank deposits generally consist of certificates of deposit with original maturities of twelve months or less. Interest rate changes could result in an increase or decrease in interest income we generate from these interest-bearing assets. Our cash, cash equivalents, restricted cash and bank deposits are primarily maintained at high credit-quality financial institutions around the world. We maintain cash and cash equivalents in U.S. dollars and in foreign currencies, which are subject to risks related to foreign currency exchange rate fluctuations. The primary objective of our investment activities is the preservation of principal while maximizing investment income in accordance with our prescribed risk management profile. We have investment guidelines relative to diversification and maturities designed to maintain safety and liquidity.
As of January 31, 2016 and 2015, we had cash and cash equivalents totaling approximately $115.4 million and $158.1 million, respectively, and restricted cash and bank deposits of $50.1 million and $35.8 million, respectively. In addition, we had $4.4 million and $7.9 million of restricted cash classified as a long-term asset as of January 31, 2016 and 2015, respectively.
Interest Rate Risk on Our Investments
To provide a meaningful assessment of the interest rate risk associated with our investment portfolio, we performed a sensitivity analysis to determine the impact a change in interest rates would have on the value of the investment portfolio assuming an average short-term interest rate increase or decrease of 0.5%, or 50 basis points, relative to average rates realized during the fiscal year ended January 31, 2016. Such a change would cause our interest income from cash and cash equivalents and short-term investments for the fiscal year ending January 31, 2017 to increase by approximately $0.5 million, or decrease by approximately $0.3 million.
Foreign Currency Exchange Rate Risk
Although we engage in hedging activities, we are subject to risk related to foreign currency exchange rate fluctuations. The functional currency for most of our significant foreign subsidiaries is the respective local currency, of which the notable exceptions are our subsidiaries in Israel, whose functional currencies are the U.S. dollar. We are exposed to foreign currency exchange rate fluctuations as we convert the financial statements of our foreign subsidiaries into U.S. dollars for reporting purposes. If there is a change in foreign currency exchange rates, the conversion of the foreign subsidiaries’ financial statements into U.S. dollars results in a gain or loss which is recorded as a component of accumulated other comprehensive income within equity.
Our international operations subject us to risks associated with currency fluctuations. Most of our revenue is denominated in U.S. dollars, while a significant portion of our operating expenses, primarily labor expenses, are denominated in the local currencies where our foreign operations are located, primarily the United Kingdom and Israel. As a result, our combined U.S. dollar operating results are subject to the potentially adverse impact of fluctuations in foreign currency exchange rates between the U.S. dollar and the other currencies in which we conduct business.
62
In addition, we have certain assets and liabilities that are denominated in currencies other than the respective entity’s functional currency. Changes in the functional currency value of these assets and liabilities create fluctuations that result in gains or losses. We recorded foreign currency transaction gains and losses, realized and unrealized, in foreign currency transaction gain (loss), net in the consolidated statements of operations. We recorded a net foreign currency transaction loss, net, of approximately $0.2 million in the fiscal year ended January 31, 2016.
As of January 31, 2016, there were no open foreign currency forward contracts.
The counterparties to these foreign currency forward contracts are highly rated commercial banks. While we believe the risk of counterparty nonperformance, including our own, is not material, the recent volatility in the global financial markets has impacted some of the financial institutions with which we do business. A sustained decline in the financial stability of financial institutions as a result of volatility in the financial markets could affect our ability to secure creditworthy counterparties for our foreign currency hedging programs.
ITEM 8. | FINANCIAL STATEMENTS AND SUPPLEMENTARY DATA |
The financial information required by Item 8 is included in Item 15 of this Annual Report.
ITEM 9. | CHANGES IN AND DISAGREEMENTS WITH ACCOUNTANTS ON ACCOUNTING AND FINANCIAL DISCLOSURE |
None.
63
ITEM 9A. | CONTROLS AND PROCEDURES |
Evaluation of Disclosure Controls and Procedures
Our Chief Executive Officer and Chief Financial Officer have evaluated the effectiveness of the design and operation of our disclosure controls and procedures, as defined in Rules 13a-15(e) and 15d-15(e) of the Exchange Act, as of January 31, 2016. Disclosure controls and procedures are those controls and other procedures of a company that are designed to ensure that information required to be disclosed by a company in the reports it files under the Exchange Act is recorded, processed, summarized and reported within required time periods specified by the rules and forms promulgated by the SEC. Disclosure controls and procedures include, without limitation, controls and procedures designed to ensure that information required to be disclosed by us in the reports that we file or furnish under the Exchange Act is accumulated and communicated to our management, including our Chief Executive Officer and Chief Financial Officer, as appropriate, to allow timely decisions regarding required disclosure. Based on their evaluation, our principal executive officer and principal financial officer have concluded that our disclosure controls and procedures were not effective as of January 31, 2016 due to the material weaknesses described below.
Management's Report on Internal Control Over Financial Reporting
Our management is responsible for establishing and maintaining adequate internal control over financial reporting (as defined in Rules 13a-15(f) and 15d-15(f) under the Exchange Act) to provide reasonable assurance regarding the reliability of our financial reporting and the preparation of consolidated financial statements for external purposes in accordance with U.S. GAAP. Under the supervision and with the participation of our management, including our Chief Executive Officer and Chief Financial Officer, we have conducted an evaluation of the effectiveness of our internal control over financial reporting based on the framework in “Internal Control - Integrated Framework (2013)” issued by the Committee of Sponsoring Organizations of the Treadway Commission. Based on the above evaluation, management has concluded that our internal control over financial reporting was not effective as of January 31, 2016 due to material weaknesses in our internal control over the financial reporting process.
A material weakness is a deficiency, or combination of deficiencies, such that there is a reasonable possibility that a material misstatement of our annual or interim financial statements will not be prevented or detected on a timely basis.
Material Weaknesses Related to Our Acision Subsidiary
We lacked a sufficient complement of personnel at the Acision subsidiary with a level of financial reporting expertise commensurate with our financial reporting requirements. This material weakness contributed to the following material weaknesses related to Acision: a) we did not design and maintain effective controls related to period end reporting, including the review and approval of transactions and account reconciliations, b) we did not design and maintain effective controls over journal entries, and c) we did not design and maintain effective controls over segregation of duties and program changes within the Acision ERP system. These material weaknesses resulted in the revision of service costs, cash, accounts receivable, prepaid and other assets, fixed assets, deferred cost of goods sold, income taxes payable, accrued expenses and deferred tax assets and liabilities in our consolidated financial statements for the quarter ended October 31, 2015.
Material Weakness Related to Income Taxes
We also lacked a sufficient level of personnel with sufficient technical expertise and knowledge of U.S. GAAP to properly account for and disclose the income tax effects of certain significant transactions. This material weakness resulted in the revision of long-term liabilities and income from discontinued operations in our consolidated financial statements for each of the quarters ended on July 31, 2015 and October 31, 2015.
Additionally, these control deficiencies could result in misstatements of the aforementioned accounts and disclosures that would result in a material misstatement of the consolidated financial statements that would not be prevented or detected.
This Annual Report on Form 10-K does not include an attestation report of our independent registered public accounting firm on the effectiveness of our internal control over financial reporting due to a transition period established by the rules of the SEC for emerging growth companies.
Plan for Remediation of the Material Weaknesses
Control activities associated with financial statement close and reporting process. We identified material weaknesses in our control activities related to our financial statement close and reporting processes at our Acision subsidiary arising from the following deficiencies:
Staffing. We lacked a sufficient complement of personnel at the Acision subsidiary with a level of financial reporting expertise commensurate with our financial reporting requirements.
64
Reporting of significant account balances. Acision lacked effective controls related to period end reporting, including the review and approval of transactions and account reconciliations.
Journal entries. Acision lacked sufficient documentation on a consistent basis to support evidencing the timely review and approval of journal entries.
Information Technology General Controls. Acision lacked sufficient documentation to evidence of effectiveness of financial reporting controls within the local ERP system.
Remedial actions. We have implemented a reconciliation control matrix that includes reviews of all Acision balance sheet accounts by competent resources at the Ra’anana and Wakefield locations. We have also implemented enhancements to the documentation requirements in support of the journal entry review process and our information technology general controls. We will continue improving these processes and accelerate movement of certain accounting transactions to Ra’anana as appropriate. We will also continue to assess and upgrade accounting resources as needed throughout our company to ensure reliable accounting processes and effectiveness of managerial reviews. We have implemented changes in our IT infrastructure to require proper segregation of duties and change management procedures as well as automating the review and approval processing of journal entries. Furthermore, the design or operating effectiveness of any changes to internal control over financial reporting have not yet been evaluated through our remediation process.
Income taxes. We did not have adequate personnel with sufficient technical expertise to properly account for and disclose income taxes in accordance with U.S. GAAP.
Remedial actions. To remediate this material weakness, we have augmented our resources with additional personnel with sufficient training, knowledge and experience.
Changes in Internal Control Over Financial Reporting
During the three months ended January 31, 2016 we implemented additional controls related to the period end financial reporting process and enhancements to our ERP system at our Acision subsidiary that have materially affected, or are reasonably likely to materially affect, our internal control over financial reporting.
ITEM 9B. | OTHER INFORMATION |
Not applicable.
65
PART III
ITEM 10. | DIRECTORS, EXECUTIVE OFFICERS AND CORPORATE GOVERNANCE |
Code of Conduct
The Board has adopted XURAbility (our Employee Code of Conduct and Values Statement) to promote commitment to honesty, ethical behavior and lawful conduct. XURAbility applies to our principal executive officer, principal financial officer, principal accounting officer, controller, and any persons performing similar functions, as well as all of our directors, officers and employees. XURAbility provides the foundation for compliance with all corporate policies and procedures and best business practices.
XURAbility can be found on our website (www.xura.com) under the tab “Corporate Governance” on our “Investors” page. A copy of XURAbility is available in print free of charge to any stockholder who requests a copy by sending an email to compliance@xura.com or by writing to:
Xura, Inc.
200 Quannapowitt Parkway
Wakefield, MA 01880 USA
Attention: Legal Department-Corporate Secretary
We intend to disclose on our website (www.xura.com) any amendment to, or waiver from, a provision of XURAbility as required by applicable law or NASDAQ rules.
The other information called for by Item 10 will be included in an amendment to this Annual Report or incorporated by reference from our definitive proxy statement to be filed pursuant to Regulation 14A.
ITEM 11. | EXECUTIVE COMPENSATION |
The information called for by Item 11 will be included in an amendment to this Annual Report or incorporated by reference from our definitive proxy statement to be filed pursuant to Regulation 14A.
ITEM 12. | SECURITY OWNERSHIP OF CERTAIN BENEFICIAL OWNERS AND MANAGEMENT AND RELATED STOCKHOLDER MATTERS |
Equity Compensation Plan Information
The following table sets forth certain information about securities authorized for issuance under our equity compensation plan as of January 31, 2016:
Plan Category | Number of securities to be issued upon exercise of outstanding options, warrants and rights | Weighted average exercise price of outstanding options, warrants and rights | Number of securities remaining available for future issuance under equity compensation plans (excluding securities reflected in column (a)) | ||||||||||||
(a) | (b) | (c) | |||||||||||||
Equity compensation plans approved by security holders | 1,877,382 | (1) | $ | 24.92 | (2) | 3,015,859 | (3) | ||||||||
Equity compensation plans not approved by security holders | — | — | — | ||||||||||||
Total | 1,877,382 | (1) | $ | 24.92 | (2) | 3,015,859 | (3) | ||||||||
(1) | Consists of outstanding (i) options to purchase 1,384,439 shares of common stock and (ii) RSU awards (including director stock units) covering an aggregate of 492,943 shares of common stock. Shares in settlement of vested RSU awards are deliverable on the vesting date. |
(2) | Reflects the weighted average exercise price of options only. As RSU awards have no exercise price, they are excluded from the weighted average exercise price calculation set forth in column (b). |
(3) | Under the plan, a total of 5.0 million shares were reserved for issuance for awards under the 2012 Incentive Plan. As of January 31, 2016, there were 3,015,859 shares available for future grant. In addition, a total of 5.0 million shares were |
66
reserved for issuance under awards issued as part of the Share Distribution in replacement of CTI awards outstanding prior to the completion of the Share Distribution. Such reserved shares could only be issued pursuant to replacement awards and may not be issued pursuant to any awards issued after the completion of the Share Distribution. RSU and option replacement awards covering an aggregate of 1,293,310 shares of common stock were issued in connection with the Share Distribution.
The other information called for by Item 12 will be set forth in an amendment to this Form10-K or incorporated by reference from our definitive proxy statement to be filed pursuant to Regulation 14A.
ITEM 13. | CERTAIN RELATIONSHIPS AND RELATED TRANSACTIONS, AND DIRECTOR INDEPENDENCE |
The information called for by Item 13 will be set forth in an amendment to this Annual Report or incorporated by reference from our definitive proxy statement to be filed pursuant to Regulation 14A.
ITEM 14. | PRINCIPAL ACCOUNTING FEES AND SERVICES |
The information called for by Item 14 will be set forth in an amendment to this Annual Report or incorporated by reference from our definitive proxy statement to be filed pursuant to Regulation 14A.
67
PART IV
ITEM 15. | EXHIBITS, FINANCIAL STATEMENT SCHEDULES |
(a) | Documents filed as part of this Annual Report: | |
(1) Financial Statements. The consolidated financial statements filed as part of this Annual Report are listed on the index to consolidated financial statements on page F-1 and are incorporated herein by reference. | |
(2) Financial Statement Schedules. The following financial statement schedules of Xura, Inc. and subsidiaries are included in this Annual Report and should be read in conjunction with the consolidated financial statements and notes thereto: | |
Schedule I - Condensed Financial Information of Registrant | |
All other financial statement schedules required by Regulation S-X have been omitted because they are not applicable or the required information is included in the applicable consolidated financial statements or notes thereto.
(3) Exhibits.See (b) below. | |
(b) Exhibits
Exhibit No. | Exhibit Description |
2.1* | Asset Purchase Agreement, dated as of April 29, 2015, by and between Comverse, Inc. and Amdocs Limited (incorporated herein by reference to Exhibit 2.1 of the Registrant’s Quarterly Report on Form 10-Q filed with the SEC on June 15, 2015). |
2.2* | Acision Purchase Agreement, dated as of June 15, 2015, by and between Xura, Inc. and Bergkamp Coöperatief U.A. (incorporated herein by reference to Exhibit 2.1 of the Registrant’s Quarterly Report on Form 10-Q filed with the SEC on September 9, 2015). |
2.3* | Credit Agreement, dated as of December 15, 2014, by and between Acision B.V. as Parent, Fortissimo Holding B.V. as Dutch Borrower, Acision LLC as US Borrower, Elavon Financial Services Limited as Administrative Agent, U.S. Bank Trustees Limited as Collateral Agent, Jefferies Finance LLC as Sole Lead Arranger and Bookrunner and Newstar Financial Inc. as Documentation Agent (incorporated herein by reference to Exhibit 2.2 of the Registrant’s Quarterly Report on Form 10-Q filed with the SEC on September 9, 2015). |
2.4* | Consent, Waiver and First Amendment to Credit Agreement, dated as of July 13, 2015, by and between Fortissimo Holding, B.V., Acision Finance LLC and Acision B.V. (incorporated herein by reference to Exhibit 2.3 of the Registrant’s Quarterly Report on Form 10-Q filed with the SEC on September 9, 2015). |
3.1* | Amended and Restated Certificate of Incorporation of Comverse, Inc. (incorporated herein by reference to Exhibit 3.2 of the Registrant's Current Report on Form 8-K filed with the SEC on October 26, 2012). |
3.2* | Certificate of Amendment to Amended and Restated Certificate of Incorporation of Comverse, Inc. (incorporated herein by reference to Exhibit 3.1 of the Registrant’s Current Report on Form 8-K filed with the SEC on September 8, 2015). |
3.3* | First Amended and Restated Bylaws of Xura, Inc. (incorporated herein by reference to Exhibit 3.2 of the Registrant’s Current Report on Form 8-K filed with the SEC on September 8, 2015). |
3.4* | Certificate of Designation of the Series A Junior Participating Preferred Stock (incorporated herein by reference to Exhibit 3.1 of the Registrant’s Current Report on Form 8-K filed with the SEC on April 30, 2015). |
4.1* | Specimen Certificate for Common Stock of Comverse, Inc. (incorporated herein by reference to Exhibit 4.1 of the Registrant's Amendment No. 4 to Registration Statement on Form 10 filed with the SEC on September 19, 2012). |
4.2* | Form of Rights Agreement, dated as of April 29, 2015, between Comverse, Inc. and American Stock Transfer & Trust Company, LLC, as Rights Agent (incorporated herein by reference to Exhibit 3.1 of the Registrant’s Current Report on Form 8-K filed with the SEC on April 30, 2015). |
10.1* | Distribution Agreement, dated as of October 31, 2012, by and between Comverse Technology, Inc. and Comverse, Inc. (incorporated herein by reference to Exhibit 10.1 of the Registrant's Current Report on Form 8-K filed with the SEC on November 1, 2012). |
10.2* | Transition Services Agreement, dated as of October 31, 2012, by and between Comverse Technology, Inc. and Comverse, Inc. (incorporated herein by reference to Exhibit 10.2 of the Registrant's Current Report on Form 8-K filed with the SEC on November 1, 2012). |
68
10.3* | Tax Disaffiliation Agreement, dated as of October 31, 2012, by and between Comverse Technology, Inc. and Comverse, Inc. (incorporated herein by reference to Exhibit 10.3 of the Registrant's Current Report on Form 8-K filed with the SEC on November 1, 2012). |
10.4* | Employee Matters Agreement, dated as of October 31, 2012, by and between Comverse Technology, Inc. and Comverse, Inc. (incorporated herein by reference to Exhibit 10.4 of the Registrant's Current Report on Form 8-K filed with the SEC on November 1, 2012). |
10.5*† | Form of Deferred Stock Unit Award (incorporated herein by reference to Exhibit 10.6 of the Registrant's Current Report on Form 8-K filed with the SEC on November 1, 2012). |
10.6*† | Form of Employee Restricted Stock Unit Award (incorporated hereby by reference to Exhibit 10.6 of the Registrant’s Annual Report on Form 10-K filed with the SEC on May 16, 2013). |
10.7*† | Form of Executive Restricted Stock Unit Award (incorporated hereby by reference to Exhibit 10.7 of the Registrant’s Annual Report on Form 10-K filed with the SEC on May 16, 2013). |
10.8*† | Form of Employee Non-Qualified Stock Option Award (incorporated hereby by reference to Exhibit 10.8 of the Registrant’s Annual Report on Form 10-K filed with the SEC on May 16, 2013). |
10.9*† | Form of Executive Non-Qualified Stock Option Award (incorporated hereby by reference to Exhibit 10.9 of the Registrant’s Annual Report on Form 10-K filed with the SEC on May 16, 2013). |
10.10*† | Form of Comverse, Inc. 2012 Stock Incentive Compensation Plan (incorporated herein by reference to Exhibit 10.26 of the Registrant's Amendment No. 2 to Registration Statement on Form 10 filed with the SEC on August 15, 2012). |
10.11*† | Form of Comverse, Inc. 2012 Annual Performance Bonus Plan (incorporated herein by reference to Exhibit 10.27 of the Registrant's Amendment No. 2 to Registration Statement on Form 10 filed with the SEC on August 15, 2012). |
10.12* | Form of Officer Indemnification Agreement (incorporated by reference to Exhibit 10.10 of the Registrant's Quarterly Report on Form 10-Q filed with the SEC on December 14, 2012). |
10.13* | Form of Director Indemnification Agreement (incorporated herein by reference to Exhibit 10.33 of the Registrant's Amendment No. 2 to Registration Statement on Form 10 filed with the SEC on August 15, 2012). |
10.14*† | Employment Agreement, dated as of April 26, 2012, by and among Comverse, Inc., Comverse Technology, Inc. and Philippe Tartavull (incorporated herein by reference to Exhibit 10.23 of the Registrant's Amendment No. 1 to Registration Statement on Form 10 filed with the SEC on July 18, 2012). |
10.15*† | Employment Agreement, dated as of July 1, 2012, by and among Comverse, Inc., Comverse Technology, Inc. and Thomas B. Sabol (incorporated herein by reference to Exhibit 10.29 of the Registrant's Amendment No. 2 to Registration Statement on Form 10 filed with the SEC on August 15, 2012). |
10.16*† | Offer Letter, dated as of October 3, 2012, by and between Comverse, Inc. and Gani Nayak (incorporated hereby by reference to Exhibit 10.15 of the Registrant’s Annual Report on Form 10-K filed with the SEC on May 16, 2013). |
10.17*† | Form of Employee Replacement Non Qualified Stock Option Award (incorporated hereby by reference to Exhibit 10.22 of the Registrant’s Annual Report on Form 10-K filed with the SEC on May 16, 2013). |
10.18*† | Form of Director Stock Unit Award (incorporated hereby by reference to Exhibit 10.18 of the Registrant’s Annual Report on Form 10-K filed with the SEC on April 16, 2014). |
10.19* | Agreement dated as of March 12, 2014 by and among Comverse, Inc. and Steven R. Becker, Matthew A. Drapkin, Becker Drapkin Management, L.P., Becker Drapkin Partners (QP), L.P., Becker Drapkin Partners, L.P., BD Partners VII, L.P., BD Partners VII SPV, L.P., and BC Advisors, LLC (incorporated by reference to Exhibit 10.1 of the Registrant’s Current Report on Form 8-K filed with the SEC on March 12, 2014). |
10.20*† | Offer Letter, dated as of September 19, 2012, by and between Comverse, Inc. and Nassrin Tavakoli (incorporated hereby by reference to Exhibit 10.21 of the Registrant’s Annual Report on Form 10-K filed with the SEC on April 16, 2014). |
10.21*# | Master Services Agreement, dated as of April 14, 2015, by and between Comverse, Inc. and Tech Mahindra Limited (incorporated herein by reference to Exhibit 10.1 of the Registrant’s Quarterly Report on Form 10-Q filed with the SEC on June 15, 2015). |
10.22* | Amendment to Employment Agreement, dated as of May 14, 2015, by and between Comverse, Inc. and Philippe Tartavull (incorporated herein by reference to Exhibit 10.2 of the Registrant’s Quarterly Report on Form 10-Q filed with the SEC on June 15, 2015). |
10.23* | Amendment to Employment Letter, dated as of May 14, 2015, by and between Comverse, Inc. and Nassrin Tavakoli (incorporated herein by reference to Exhibit 10.3 of the Registrant’s Quarterly Report on Form 10-Q filed with the SEC on June 15, 2015). |
69
10.24* | Employment Agreement, dated as of March 12, 2015, by and between Comverse, Inc. and Jacky Wu (incorporated herein by reference to Exhibit 10.4 of the Registrant’s Quarterly Report on Form 10-Q filed with the SEC on June 15, 2015). |
10.25* | Separation Agreement, dated as of April 30, 2015, by and between Comverse, Inc. and Thomas Sabol (incorporated herein by reference to Exhibit 10.5 of the Registrant’s Quarterly Report on Form 10-Q filed with the SEC on June 15, 2015). |
10.26*† | Comverse, Inc. Amended and Restated 2012 Stock Incentive Compensation Plan (incorporated herein by reference to Exhibit 10.1 of the Registrant’s Current Report on Form 10-Q filed with the SEC on June 25, 2015). |
10.27*# | Amendment Number 1 to the Master Service Agreement, dated as of June 30, 2015, by and between Comverse, Inc. and Tech Mahindra Limited (incorporated herein by reference to Exhibit 10.1 of the Registrant’s Current Report on Form 8-K filed with the SEC on July 7, 2015) |
10.28*† | Employment Agreement, dated as of August 7, 2014, by and between Comverse, Inc. and Michael Grossi (incorporated herein by reference to Exhibit 10.1 of the Registrant’s Quarterly Report on Form 10-Q filed with the SEC on September 9, 2015). |
10.29*† | Second Amendment to Employment Agreement, dated December 4, 2015, by and between Xura, Inc. and Philippe Tartavull (incorporated herein by reference to Exhibit 10.1 of the Registrant’s Quarterly Report on Form 10-Q filed with the SEC on December 28, 2015). |
10.30*† | Amendment to Employment Agreement, dated December 4, 2015, by and between Xura, Inc. and Jacky Wu (incorporated herein by reference to Exhibit 10.2 of the Registrant’s Quarterly Report on Form 10-Q filed with the SEC on December 28, 2015). |
10.31**† | Form of Executive Performance Restricted Stock Award Agreement. |
16.1* | Letter of Deloitte & Touche LLP dated April 24, 2014 (incorporated herein by reference to Exhibit 16.1 of the Registrant’s Current Report on Form 8-K filed with the SEC on April 24, 2014). |
21.1** | Subsidiaries of Registrant. |
23.1** | Consent of PricewaterhouseCoopers LLP. |
23.2** | Consent of Deloitte & Touche LLP. |
24.1** | Power of Attorney (see signature page). |
31.1** | Certification of the Chief Executive Officer pursuant to Rules 13a-14(a) and 15d-14(a) under the Securities Exchange Act of 1934, as amended. |
31.2** | Certification of the Chief Financial Officer pursuant to Rules 13a-14(a) and 15d-14(a) under the Securities Exchange Act of 1934, as amended. |
32.1*** | Certification of the Chief Executive Officer pursuant to 18 U.S.C. Section 1350, as adopted pursuant to Section 906 of the Sarbanes-Oxley Act of 2002. |
32.2*** | Certification of the Chief Financial Officer pursuant to 18 U.S.C. Section 1350, as adopted pursuant to Section 906 of the Sarbanes-Oxley Act of 2002. |
101.1 | The following materials from the Registrant's Annual Report on Form 10-K for the fiscal year ended January 31, 2016, formatted in XBRL (eXtensible Business Reporting Language), include: (i) the Consolidated Balance Sheets, (ii) the Consolidated Statements of Operations, (iii) the Consolidated Statement of Comprehensive Income (iv) the Consolidated and Combined Statements of Equity, (v) the Consolidated and Combined Statements of Cash Flows, (vi) the Notes to the Consolidated Financial Statements. |
* | Incorporated by reference. |
** | Filed herewith. |
*** | This exhibit is being “furnished” pursuant to Item 601(b)(32) of SEC Regulation S-K and is not deemed “filed” with the Securities and Exchange Commission and is not incorporated by reference in any filing of the Registrant under the Securities Act of 1933 or the Securities Exchange Act of 1934. |
† | Constitutes a management contract or compensatory plan or arrangement. |
# | Confidential treatment was requested for certain provisions of this exhibit pursuant to Rule 24b-2 under the Securities Exchange Act of 1934, as amended. These provisions have been omitted from the filing and submitted separately to the Securities and Exchange Commission. The location of the confidential information is indicated in the exhibit with brackets and an asterisk ([*]). |
70
Pursuant to the requirements of Section 13 or 15(d) of the Securities Exchange Act of 1934, the registrant has duly caused this report to be signed on its behalf by the undersigned, thereunto duly authorized.
XURA, INC. | ||
May 23, 2016 | By: | /s/ Philippe Tartavull |
Philippe Tartavull | ||
President and Chief Executive Officer | ||
(Principal Executive Officer) | ||
May 23, 2016 | By: | /s/ Jacky Wu |
Jacky Wu | ||
Executive Vice President and Chief Financial Officer | ||
(Principal Financial Officer and Principal Accounting Officer) | ||
KNOW ALL MEN BY THESE PRESENT, that each person whose signature appears below constitutes and appoints Philippe Tartavull and Jacky Wu, and each of them, his or her true and lawful attorneys-in-fact and agents, with full power of substitution and resubstitution, for him or her and in his or her name, place and stead, in any and all capacities, to sign any and all amendments to this Annual Report on Form 10-K, and to file the same, with all exhibits thereto and other documents in connection therewith, with the Securities and Exchange Commission, granting unto said attorneys-in-fact and agents, and each of them, full power and authority to do and perform each and every act and thing requisite and necessary to be done in and about the premises, as fully and to all intents and purposes as he or she might or could do in person hereby ratifying and confirming all that said attorneys-in-fact and agents, or his or her substitute or substitutes, may lawfully do or cause to be done by virtue hereof.
71
Pursuant to the requirements of the Securities Exchange Act of 1934, this report has been signed below by the following persons on behalf of the Registrant and in the capacities and on the dates indicated.
/s/ Philippe Tartavull | May 23, 2016 |
Philippe Tartavull, President, Chief Executive Officer and Director (Principal Executive Officer) | |
/s/ Jacky Wu | May 23, 2016 |
Jacky Wu, Executive and Chief Financial Officer (Principal Financial Officer and Principal Accounting Officer) | |
/s/ Henry R. Nothhaft | May 23, 2016 |
Henry R. Nothhaft, Chairman | |
/s/ Susan D. Bowick | May 23, 2016 |
Susan D. Bowick, Director | |
/s/ James Budge | May 23, 2016 |
James Budge, Director | |
/s/ Niccolo De Masi | May 23, 2016 |
Niccolo De Masi, Director | |
/s/ Matthew A. Drapkin | May 23, 2016 |
Matthew A. Drapkin, Director | |
/s/ Doron Inbar | May 23, 2016 |
Doron Inbar, Director | |
/s/ Mark C. Terrell | May 23, 2016 |
Mark C. Terrell, Director | |
72
XURA, INC. AND SUBSIDIARIES
INDEX TO CONSOLIDATED FINANCIAL STATEMENTS
F-1
REPORT OF INDEPENDENT REGISTERED PUBLIC ACCOUNTING FIRM
To the Board of Directors and Stockholders of Xura, Inc.:
In our opinion, the consolidated financial statements listed in the index appearing under Item 15 (a) (1) present fairly, in all material respects, the financial position of Xura, Inc. and its subsidiaries at January 31, 2016 and 2015, and the results of their operations and their cash flows for each of the two years in the period ended January 31, 2016 in conformity with accounting principles generally accepted in the United States of America. In addition, in our opinion, the financial statement schedule listed in the index appearing under Item 15 (a) (2) presents fairly, in all material respects, the information set forth therein when read in conjunction with the related consolidated financial statements. These financial statements and financial statement schedule are the responsibility of the Company's management. Our responsibility is to express an opinion on these financial statements and financial statement schedule based on our audits. We conducted our audits of these statements in accordance with the standards of the Public Company Accounting Oversight Board (United States). Those standards require that we plan and perform the audit to obtain reasonable assurance about whether the financial statements are free of material misstatement. An audit includes examining, on a test basis, evidence supporting the amounts and disclosures in the financial statements, assessing the accounting principles used and significant estimates made by management, and evaluating the overall financial statement presentation. We believe that our audits provide a reasonable basis for our opinion.
As discussed in Note 2 to the consolidated financial statements, the Company changed the manner in which it classifies deferred tax assets and liabilities in fiscal 2016 due to the adoption of ASU 2015-17, Balance Sheet Classification of Deferred Taxes.
/s/ PricewaterhouseCoopers LLP
Boston, Massachusetts
May 23, 2016
F-2
REPORT OF INDEPENDENT REGISTERED PUBLIC ACCOUNTING FIRM
To the Board of Directors of Xura, Inc.
Wakefield, Massachusetts
We have audited the consolidated statements of operations, comprehensive income (loss), equity and cash flows of Xura, Inc. (formerly known as Comverse, Inc.) and subsidiaries (the “Company”) for the year ended January 31, 2014. Our audit also included the financial statement schedule listed in the Index at Item 15. These financial statements and financial statement schedule are the responsibility of the Company's management. Our responsibility is to express an opinion on these financial statements and financial statement schedule based on our audit.
We conducted our audit in accordance with the standards of the Public Company Accounting Oversight Board (United States). Those standards require that we plan and perform the audit to obtain reasonable assurance about whether the financial statements are free of material misstatement. The Company is not required to have, nor were we engaged to perform, an audit of its internal control over financial reporting. Our audit included consideration of internal control over financial reporting as a basis for designing audit procedures that are appropriate in the circumstances, but not for the purpose of expressing an opinion on the effectiveness of the Company's internal control over financial reporting. Accordingly, we express no such opinion. An audit also includes examining, on a test basis, evidence supporting the amounts and disclosures in the financial statements, assessing the accounting principles used and significant estimates made by management, as well as evaluating the overall financial statement presentation. We believe that our audit provides a reasonable basis for our opinion.
In our opinion, such consolidated financial statements present fairly, in all material respects, the results of operations and cash flows of Xura, Inc. and subsidiaries for the year ended January 31, 2014, in conformity with accounting principles generally accepted in the United States of America. Also, in our opinion, such financial statement schedule, when considered in relation to the basic consolidated financial statements taken as a whole, presents fairly in all material respects the information set forth therein.
/s/ DELOITTE & TOUCHE LLP
Boston, Massachusetts
April 16, 2014
(May 23, 2016 as to the financial statement schedule listed in the Index at Item 15 and the discontinued operations discussed in Note 17)
F-3
XURA, INC. AND SUBSIDIARIES
CONSOLIDATED BALANCE SHEETS
(In thousands, except share and per share data)
January 31, | |||||||
2016 | 2015 | ||||||
ASSETS | |||||||
Current assets: | |||||||
Cash and cash equivalents | $ | 115,445 | $ | 158,121 | |||
Restricted cash and bank deposits | 50,110 | 35,802 | |||||
Accounts receivable, net of allowance of $3,360 and $3,627, respectively | 85,034 | 35,494 | |||||
Inventories | 10,387 | 17,817 | |||||
Deferred cost of revenue | 4,261 | 3,545 | |||||
Deferred income taxes | — | 13,781 | |||||
Prepaid expenses | 18,285 | 14,310 | |||||
Other current assets | 8,295 | 5,148 | |||||
Current assets of discontinued operations | — | 158,061 | |||||
Total current assets | 291,817 | 442,079 | |||||
Property and equipment, net | 38,470 | 40,222 | |||||
Goodwill | 253,819 | 67,518 | |||||
Intangible assets, net | 201,984 | 1,658 | |||||
Deferred cost of revenue | 14,506 | 22,169 | |||||
Deferred income taxes | 9,119 | 3,064 | |||||
Long-term restricted cash | 4,416 | 7,940 | |||||
Other assets | 6,491 | 21,702 | |||||
Total assets | $ | 820,622 | $ | 606,352 | |||
LIABILITIES AND EQUITY | |||||||
Current liabilities: | |||||||
Accounts payable and accrued expenses | $ | 135,639 | $ | 99,165 | |||
Deferred revenue | 90,365 | 125,063 | |||||
Deferred income taxes | — | 1,491 | |||||
Income taxes payable | 11,022 | 2,166 | |||||
Current portion of long-term debt | 12,248 | 132 | |||||
Current liabilities of discontinued operations | — | 123,340 | |||||
Total current liabilities | 249,274 | 351,357 | |||||
Deferred revenue | 48,506 | 60,735 | |||||
Deferred income taxes | 75,652 | 56,815 | |||||
Other long-term liabilities | 107,185 | 123,065 | |||||
Long-term debt | 140,710 | 998 | |||||
Total liabilities | 621,327 | 592,970 | |||||
Commitments and contingencies (Note 24) | |||||||
Equity: | |||||||
Common stock, $0.01 par value - authorized, 100,000,000 shares; issued, 26,128,807 and 22,591,411 shares, respectively; outstanding, 25,003,715 and 21,830,081 shares, respectively | 261 | 226 | |||||
Preferred stock, $0.01 par value - authorized, 100,000 shares | — | — | |||||
Treasury stock, at cost, 1,125,092 and 761,330 shares, respectively | (24,460 | ) | (17,211 | ) | |||
Accumulated earnings (deficit) | 86,383 | (46,390 | ) | ||||
Additional paid-in-capital | 114,004 | 45,935 | |||||
Accumulated other comprehensive income | 23,107 | 30,822 | |||||
Total equity | 199,295 | 13,382 | |||||
Total liabilities and equity | $ | 820,622 | $ | 606,352 | |||
The accompanying notes are an integral part of these consolidated financial statements.
F-4
XURA, INC. AND SUBSIDIARIES
CONSOLIDATED STATEMENTS OF OPERATIONS
(In thousands, except share and per share data)
Fiscal Years Ended January 31, | |||||||||||
2016 | 2015 | 2014 | |||||||||
Revenue: | |||||||||||
Product revenue | $ | 55,187 | $ | 69,238 | $ | 154,704 | |||||
Service revenue | 215,727 | 199,736 | 261,266 | ||||||||
Total revenue | 270,914 | 268,974 | 415,970 | ||||||||
Costs and expenses: | |||||||||||
Product costs | 36,380 | 55,108 | 96,909 | ||||||||
Service costs | 157,529 | 146,624 | 167,232 | ||||||||
Research and development, net | 37,270 | 36,857 | 39,401 | ||||||||
Selling, general and administrative | 95,349 | 82,722 | 90,607 | ||||||||
Other operating expenses: | |||||||||||
Restructuring expenses and write-off of property and equipment | 12,755 | 12,111 | 9,845 | ||||||||
Total other operating expenses | 12,755 | 12,111 | 9,845 | ||||||||
Total costs and expenses | 339,283 | 333,422 | 403,994 | ||||||||
(Loss) income from operations | (68,369 | ) | (64,448 | ) | 11,976 | ||||||
Interest income | 327 | 480 | 614 | ||||||||
Interest expense | (8,654 | ) | (641 | ) | (847 | ) | |||||
Foreign currency transaction (loss) gain, net | (249 | ) | 4,659 | (10,290 | ) | ||||||
Other income (expense), net | 361 | (517 | ) | 699 | |||||||
(Loss) income before income tax benefit | (76,584 | ) | (60,467 | ) | 2,152 | ||||||
Income tax benefit (expense) | 25,234 | 3,229 | (6,579 | ) | |||||||
Net loss from continuing operations | (51,350 | ) | (57,238 | ) | (4,427 | ) | |||||
Income from discontinued operations, net of tax | 184,123 | 35,099 | 23,113 | ||||||||
Net income (loss) | 132,773 | (22,139 | ) | 18,686 | |||||||
Weighted average common shares outstanding: | |||||||||||
Basic and diluted | 23,455,088 | 22,190,630 | 22,164,131 | ||||||||
Basic and diluted earnings (loss) per share | |||||||||||
Continuing operations | $ | (2.19 | ) | $ | (2.58 | ) | $ | (0.20 | ) | ||
Discontinued operations | 7.85 | 1.58 | 1.04 | ||||||||
Basic and diluted earnings (loss) per share | $ | 5.66 | $ | (1.00 | ) | $ | 0.84 | ||||
The accompanying notes are an integral part of these consolidated financial statements.
F-5
XURA, INC. AND SUBSIDIARIES
CONSOLIDATED STATEMENTS OF COMPREHENSIVE INCOME (LOSS)
(In thousands)
Fiscal Years Ended January 31, | |||||||||||
2016 | 2015 | 2014 | |||||||||
Net income (loss) | $ | 132,773 | $ | (22,139 | ) | $ | 18,686 | ||||
Other comprehensive income ("OCI"), net of tax: | |||||||||||
Foreign currency translation adjustments | (7,832 | ) | 7,665 | 1,998 | |||||||
Changes in accumulated OCI on cash flow hedges, net of tax | 117 | (175 | ) | (417 | ) | ||||||
Other comprehensive (loss) income, net of tax | (7,715 | ) | 7,490 | 1,581 | |||||||
Comprehensive income (loss) | 125,058 | (14,649 | ) | 20,267 | |||||||
The accompanying notes are an integral part of these consolidated financial statements.
F-6
XURA, INC. AND SUBSIDIARIES
CONSOLIDATED STATEMENTS OF EQUITY
(In thousands, except share data)
Common Stock | ||||||||||||||||||||||||||||||
Number of Shares | Par Value | Preferred Stock | Treasury Stock | Additional Paid-in Capital | Accumulated Deficit | Accumulated Other Comprehensive Income | Total Equity | |||||||||||||||||||||||
Balance, January 31, 2013 | 21,934,569 | $ | 219 | $ | — | $ | (33 | ) | $ | 2,237 | $ | (42,937 | ) | $ | 21,751 | $ | (18,763 | ) | ||||||||||||
Net income | — | — | — | — | — | 18,686 | — | 18,686 | ||||||||||||||||||||||
Other comprehensive income, net of tax | — | — | — | — | — | — | 1,581 | 1,581 | ||||||||||||||||||||||
Exercise of stock options | 41,250 | 1 | — | — | 1,108 | — | — | 1,109 | ||||||||||||||||||||||
Repurchase of common stock in connection with tax liabilities upon settlement of awards | 310,304 | 3 | — | (991 | ) | (3 | ) | — | — | (991 | ) | |||||||||||||||||||
Stock-based compensation expense | — | — | — | — | 10,208 | — | — | 10,208 | ||||||||||||||||||||||
CTI contribution | — | — | — | — | 20,980 | — | — | 20,980 | ||||||||||||||||||||||
Balance, January 31, 2014 | 22,286,123 | $ | 223 | $ | — | $ | (1,024 | ) | $ | 34,530 | $ | (24,251 | ) | $ | 23,332 | $ | 32,810 | |||||||||||||
Net loss | — | — | — | — | — | (22,139 | ) | — | (22,139 | ) | ||||||||||||||||||||
Other comprehensive income, net of tax | — | — | — | — | — | — | 7,490 | 7,490 | ||||||||||||||||||||||
Exercise of stock options | 1,365 | — | — | — | 40 | — | — | 40 | ||||||||||||||||||||||
Repurchase of common stock in connection with tax liabilities upon settlement of awards | 303,923 | 3 | — | (1,053 | ) | (3 | ) | — | — | (1,053 | ) | |||||||||||||||||||
Repurchase of common stock under repurchase program | — | — | — | (15,134 | ) | — | — | — | (15,134 | ) | ||||||||||||||||||||
Stock-based compensation expense | — | — | — | — | 11,368 | — | — | 11,368 | ||||||||||||||||||||||
Balance, January 31, 2015 | 22,591,411 | $ | 226 | $ | — | $ | (17,211 | ) | $ | 45,935 | $ | (46,390 | ) | $ | 30,822 | $ | 13,382 | |||||||||||||
Net income | — | — | — | — | — | 132,773 | — | 132,773 | ||||||||||||||||||||||
Other comprehensive income, net of tax | — | — | — | — | — | — | (7,715 | ) | (7,715 | ) | ||||||||||||||||||||
Exercise of stock options | 57,984 | 1 | — | — | 1,378 | — | — | 1,379 | ||||||||||||||||||||||
Repurchase of common stock in connection with tax liabilities upon settlement of awards | 336,426 | 3 | — | (947 | ) | (3 | ) | — | — | (947 | ) | |||||||||||||||||||
Repurchase of common stock under repurchase program | — | — | — | (6,302 | ) | — | — | — | (6,302 | ) | ||||||||||||||||||||
Stock-based compensation expense | — | — | — | — | 9,794 | — | — | 9,794 | ||||||||||||||||||||||
Stock consideration issued in connection with a business combination | 3,142,986 | 31 | — | — | 56,900 | — | — | 56,931 | ||||||||||||||||||||||
Balance, January 31, 2016 | 26,128,807 | $ | 261 | $ | — | $ | (24,460 | ) | $ | 114,004 | $ | 86,383 | $ | 23,107 | $ | 199,295 | ||||||||||||||
The accompanying notes are an integral part of these consolidated financial statements.
F-7
XURA, INC. AND SUBSIDIARIES
CONSOLIDATED STATEMENTS OF CASH FLOWS
Fiscal Years Ended January 31, | |||||||||||
2016 | 2015 | 2014 | |||||||||
Cash flows from operating activities: | (In thousands) | ||||||||||
Net income (loss) | $ | (51,350 | ) | $ | (57,238 | ) | $ | (4,427 | ) | ||
Non-cash items | |||||||||||
Depreciation and amortization | 36,658 | 14,046 | 12,529 | ||||||||
Provision for doubtful accounts | 463 | 829 | 933 | ||||||||
Stock-based compensation expense | 8,502 | 9,176 | 7,999 | ||||||||
Deferred income taxes | (5,790 | ) | (296 | ) | 16,050 | ||||||
Inventory write-downs | 2,351 | 2,553 | 4,239 | ||||||||
Other non-cash items, net | 4,254 | (2,409 | ) | 2,253 | |||||||
Changes in assets and liabilities, net of acquisitions: | |||||||||||
Accounts receivable | 6,811 | (1,686 | ) | 12,656 | |||||||
Inventories | 3,806 | (6,750 | ) | 374 | |||||||
Deferred cost of revenue | 6,587 | 14,017 | 29,826 | ||||||||
Prepaid expense and other current assets | 11,877 | (44,703 | ) | 16,356 | |||||||
Accounts payable and accrued expenses | (6,986 | ) | 38,008 | (62,998 | ) | ||||||
Income tax payable | (5,322 | ) | 930 | (7,237 | ) | ||||||
Deferred revenue | (58,293 | ) | (10,217 | ) | (6,370 | ) | |||||
Tax contingencies | (21,220 | ) | (655 | ) | (24,036 | ) | |||||
Other assets and liabilities | (17,930 | ) | (3,280 | ) | 1,210 | ||||||
Net cash used in operating activities - continuing operations | (85,582 | ) | (47,675 | ) | (643 | ) | |||||
Net cash (used in) provided by operating activities - discontinued operations | (51,901 | ) | (21,920 | ) | 7,264 | ||||||
Net cash (used in) provided by operating activities | (137,483 | ) | (69,595 | ) | 6,621 | ||||||
Cash flows from investing activities: | |||||||||||
Purchase of property and equipment | (11,173 | ) | (18,977 | ) | (10,923 | ) | |||||
Acquisitions, net of cash acquired | (140,000 | ) | (2,673 | ) | — | ||||||
Net change in restricted cash and bank deposits | (13,017 | ) | 23,791 | (26,918 | ) | ||||||
Other, net | (270 | ) | 41 | 890 | |||||||
Net cash (used in) provided by investing activities - continuing operations | (164,460 | ) | 2,182 | (36,951 | ) | ||||||
Net cash provided by (used in) investing activities - discontinued operations | 271,981 | (4,335 | ) | (1,346 | ) | ||||||
Net cash provided by (used in) investing activities | 107,521 | (2,153 | ) | (38,297 | ) | ||||||
Cash flows from financing activities: | |||||||||||
CTI capital contribution | — | — | 25,000 | ||||||||
Payment for repurchase of common stock in connection with tax liabilities upon settlement of awards | (947 | ) | (1,053 | ) | (991 | ) | |||||
Payment for repurchase of common stock under repurchase program | (6,302 | ) | (15,134 | ) | — | ||||||
Proceeds from stock options exercises and issuance of subsidiary common stock | 1,379 | 40 | 1,109 | ||||||||
Borrowings | — | 87 | — | ||||||||
Repayments | (4,127 | ) | (100 | ) | — | ||||||
Other, net | (143 | ) | — | — | |||||||
Net cash (used in) provided by financing activities | (10,140 | ) | (16,160 | ) | 25,118 | ||||||
Effects of exchange rates on cash and cash equivalents | (2,574 | ) | (8,551 | ) | (1,783 | ) | |||||
Net decrease in cash and cash equivalents | (42,676 | ) | (96,459 | ) | (8,341 | ) | |||||
Cash and cash equivalents, beginning of year | 158,121 | 254,580 | 262,921 | ||||||||
Cash and cash equivalents, end of year | $ | 115,445 | $ | 158,121 | $ | 254,580 | |||||
The accompanying notes are an integral part of these consolidated financial statements.
F-8
XURA, INC. AND SUBSIDIARIES
NOTES TO CONSOLIDATED FINANCIAL STATEMENTS
1. | ORGANIZATION, BUSINESS AND SUMMARY OF SIGNIFICANT ACCOUNTING POLICIES |
Company Background
Prior to October 31, 2012, the date of the Share Distribution (as defined below), Xura, Inc. (formerly known as Comverse, Inc.) (the “Company”) was a wholly-owned subsidiary of Comverse Technology, Inc. (“CTI”). Effective September 9, 2015, the Company changed its name from Comverse, Inc. to Xura, Inc. The Company was organized as a Delaware corporation in November 1997.
The Company is a global provider of digital communications solutions for communication service providers (“CSPs”), enterprises and application providers. The Company's solutions are designed to enhance CSPs’ ability to address evolving market trends with the simplification and modernization of networks, as well as to create monetizable services with both existing and emerging technologies, such as voice over long-term evolution (“VoLTE”), rich communication services (“RCS”) credit orchestration and internet protocol (“IP”) messaging and web real-time communications (“WebRTC”). The Company also provides solutions for messaging security, network signaling security, data analytics, and machine-to-machine messaging. The Company continues to offer traditional value-added services (“VAS”) solutions, including voicemail, visual voicemail, call completion, short messaging service (“SMS”), multimedia picture and video messaging (“MMS”) and IP-messaging designed to provide CSPs the ability to augment their networks with emerging products and solutions to address opportunities provided by new types of devices, technologies, and multi-device user experiences. In addition, the Company offers CSPs innovative monetization solutions using messaging as transport to exchange billing credits between subscribers, primarily in prepaid markets. The Company's enterprise solutions are designed to accelerate the Company's enterprise customers’ shift towards mobile-enablement and to improve their customer engagement. These solutions include secure enterprise application-to-person messaging (“A2P”), two-factor authentication (or “2FA”) and developer tools for customized service creation.
The Company's solutions can be delivered via the cloud, in a “software-as-a-service” model, which allows the Company to speed up deployment and permit rapid introduction of additional services. With the acquisition of Acision (as defined below), several of the Company's monetization solutions are offered in a revenue-share model, which reduces the customers' up-front investments and ties payments to actual service usage, provides continual revenue streams and allows the Company to actively participate in service value creation.
The Share Distribution
On October 31, 2012, CTI completed the spin-off of the Company as an independent, publicly traded company, accomplished by means of a pro rata distribution of 100% of the Company's outstanding common shares to CTI's shareholders (the “Share Distribution”). Following the Share Distribution, CTI no longer held any of the Company's outstanding capital stock, and the Company became an independent publicly traded company.
In order to govern certain ongoing relationships between CTI and the Company after the Share Distribution and to provide mechanisms for an orderly transition, CTI and the Company entered into agreements pursuant to which certain services and rights are provided for following the Share Distribution, and CTI and the Company agreed to indemnify each other against certain liabilities that may rise from their respective businesses and the services that are provided under such agreements. Following the completion of CTI's merger with Verint Systems Inc. (“Verint”) discussed below, these obligations continue to apply between the Company and Verint (see Note 3, Share Distribution Agreements).
Upon completion of the Share Distribution, the Company's shares were listed, and began trading, on NASDAQ under the symbol “CNSI.” On September 9, 2015, the Company changed its trading symbol to “MESG”.
On November 1, 2012, in connection with the Share Distribution, CTI's equity-based compensation awards held by the Company's employees were replaced with the Company's equity-based compensation awards.
Merger of CTI and Verint
On August 12, 2012, CTI entered into an agreement and plan of merger (the “Verint Merger Agreement”) with Verint, its then majority owned publicly-traded subsidiary, providing for the merger of CTI with and into a subsidiary of Verint to become a wholly-owned subsidiary of Verint (the “Verint Merger”). The Verint Merger was completed on February 4, 2013. The Company agreed to indemnify CTI and its affiliates (including Verint after the Verint Merger) against certain losses that may arise as a result of the Verint Merger and the Share Distribution (see Note 3, Share Distribution Agreements). On February 4, 2013, in connection with the closing of the Verint Merger Agreement, CTI placed $25.0 million in escrow to support
F-9
indemnification claims to the extent made against the Company by Verint and any cash balance remaining in such escrow fund 18 months after the closing of the Verint Merger (the "Escrow Release Date"), less any claims made on or prior to such date, to be released to the Company. On August 6, 2014, the escrow was released in accordance with its terms and the Company received the escrow amount of approximately $25.0 million. As of the closing of the Verint Merger, the Company recognized the estimated fair value of the potential indemnification liability of $4.0 million with the remaining $21.0 million as an additional contribution from CTI. As of January 31, 2016, the indemnification liability is $3.2 million.
Amdocs Asset Purchase Agreement
On April 29, 2015, the Company entered into an Asset Purchase Agreement (including the ancillary agreements and documents thereto, the “Amdocs Purchase Agreement”) with Amdocs Limited, a Guernsey company (the “Purchaser”). Pursuant to the Amdocs Purchase Agreement, the Company agreed to sell substantially all of its assets required for operating the Company's converged, prepaid and postpaid billing and active customer management systems for wireless, wireline, cable and multi-play communication service providers (the “BSS Business”) to the Purchaser, and the Purchaser agreed to assume certain post-closing liabilities of the Company (the “Asset Sale”). The initial closing of the Asset Sale occurred on July 2, 2015. The total cash purchase price payable by the Purchaser to the Company in connection with the Asset Sale was approximately $271.7 million, including currently estimated purchase price adjustment of approximately $0.7 million, of which an aggregate of $5.5 million was paid upon certain deferred closings.
In connection with the Asset Sale, the Company agreed to indemnify the Purchaser for certain pre-closing liabilities and breaches of certain representations and warranties. Upon the closing, $26 million of the purchase price was deposited into escrow to fund potential indemnification claims and certain adjustments for a period of 12 months following the closing. This $26 million is classified as a current asset within restricted cash in the Company's consolidated balance sheet. In August 2015 and May 2016, the Company received various claims for indemnification against the escrow from the Purchaser. While the Company continues to evaluate certain claims made, it believes several pending claims are without merit and intend to vigorously defend against them.
In connection with the Amdocs Purchase Agreement, the Company and the Purchaser have also entered into a Transition Services Agreement (the “TSA”), which provides for support services between the Company and the Purchaser in connection with the transition of the BSS Business to the Purchaser, for various periods up to 12 months following the closing of the Asset Sale (see Note 17, Discontinued Operations).
Acquisition of Acision
On August 6, 2015 (the “Closing Date”), the Company completed its previously announced acquisition (the “Acquisition”) of Acision Global Limited, a private company formed under the laws of England and Wales (“Acision”) and a holding company for Acision B.V. (its sole asset), pursuant to the terms of the share sale and purchase agreement, dated June 15, 2015 (the “Purchase Agreement”), between the Company and Bergkamp Coöperatief U.A., a cooperative with excluded liability formed under the laws of the Netherlands (the “Seller”). Acision is a holding company formed on September 5, 2014 that holds all of the equity interests of Acision B.V. Other than its equity interest in Acision B.V., Acision does not have any other assets or liabilities. The assets, liabilities and operations of Acision B.V. reflect the acquired business. Acision is a provider of messaging software solutions to CSPs and enterprises, including SMS, MMS, instant messaging ("IM") and IP messaging. The Company acquired Acision to complement its solution portfolio, enhance its market leadership, penetrate growth markets and improve its operational efficiency.
F-10
Pursuant to the terms of the Purchase Agreement, on the Closing Date the Company acquired 100% of the equity interests of Acision in exchange for $171.3 million in cash (excluding cash acquired and closing costs), earnout payments (as discussed below), and 3.14 million shares of the Company’s common stock, par value $0.01 per share (the “Consideration Shares”), which were issued in a private placement transaction conducted pursuant to Section 4(a)(2) under the Securities Act of 1933, as amended (the “Securities Act”). As previously disclosed, pursuant to the terms of the Purchase Agreement, an amount up to $35.0 million of cash consideration is subject to an earnout, contingent on the achievement of revenue targets by certain of Acision’s business activities through the first quarter of 2016. Earnout revenue targets through December 31, 2015 were not achieved and accordingly, no earnout was paid in respect thereof. To secure claims the Company may have under the Purchase Agreement, $10.0 million of the initial cash consideration was retained in escrow, which amount will be increased in the event that further consideration is triggered under the earnout, up to a maximum aggregate escrow retention of $25.0 million. Such monies will be released to the Seller two years after completion of the Acquisition, subject to any claims. In addition, Acision, in consultation with the Company, entered into a consent, waiver and amendment (the “Amendment”) with the requisite lenders under Acision’s credit agreement (the “Acision Credit Agreement”) governing Acision’s existing approximately $156.0 million senior credit facility (the “Acision Senior Debt”), pursuant to which the Acision Senior Debt remains in place following completion of the Acquisition. The Acision Senior Debt matures, subject to the terms and conditions of the Acision Credit Agreement, on December 15, 2018. In connection with the Amendment, the Company agreed to pay certain costs imposed on Acision by its lenders under the Acision Senior Debt.
Each party agreed to indemnify the other for certain potential liabilities and claims, subject to certain exceptions and limitations (see Note 16, Acquisitions).
Acquisition of Solaiemes
On August 1, 2014, the Company acquired 100% of the outstanding equity of Spain-based Solaiemes, S.L. (“Solaiemes”) for approximately $2.7 million and the assumption of $1.4 million of debt. Solaiemes is an innovator focused on enabling the creation and monetization of CSPs’ digital services. Solutions from Solaiemes complement the Company's Evolved Communication Suite offering and the combined portfolio creates an end-to-end platform for service monetization of IP-based digital services. Solaiemes has been integrated into the Company’s Digital Services segment (see Note 16, Acquisition).
Agreement with Tech Mahindra
On April 14, 2015, the Company entered into a Master Services Agreement (the “MSA”) with Tech Mahindra Limited (“Tech Mahindra”) pursuant to which Tech Mahindra performs certain services for the Company’s business on a global basis. The services include research and development, project deployment and delivery and maintenance and support for certain customers of the Company. In connection with the transaction, approximately 500 employees of the Company and its subsidiaries have been rehired by Tech Mahindra or its affiliates.
Under the MSA, the Company is obligated to pay to Tech Mahindra in the aggregate approximately $212.0 million in base fees for services to be provided pursuant to the MSA for a term of six years, renewable at the Company’s option. The services under the MSA started on June 1, 2015.
The Company has the right to terminate the MSA for convenience subject to the payment of certain termination fees. The Company may terminate the MSA upon certain material breaches, certain material performance failures or violations of applicable law by Tech Mahindra without termination fees. Tech Mahindra may terminate the MSA upon certain material breaches by the Company, including the failure to pay undisputed amounts. Upon any termination or expiration, Tech Mahindra will provide reverse transition services to transition the services being provided by Tech Mahindra pursuant to the MSA back to the Company or its designee. The MSA contains certain indemnification provisions by both the Company and Tech Mahindra (see Note 24, Commitments and Contingencies).
Basis of Presentation
The consolidated financial statements included herein have been prepared in accordance with accounting principles generally accepted in the United States of America (“U.S. GAAP”).
Intercompany accounts and transactions within the Company have been eliminated.
F-11
The Company has experienced operating losses in the past two years. In addition, the Company has utilized cash to fund operations, resulting in negative operating cash flows and a decrease in cash balances. As of January 31, 2016, the Company had approximately $115.4 million of unrestricted cash on-hand. During the most recent fiscal year, the Company utilized approximately $85.6 million of cash to fund continuing operations. In connection with the acquisition of Acision, the Company assumed a senior credit facility which requires the Company to comply with certain operating financial covenants. This debt matures on December 15, 2018.
The Company’s liquidity is dependent on its ability to profitably grow revenues while further reducing costs under its restructuring initiatives announced as well as cost reduction efforts in the future, in connection with plans to consolidate further its operations and integrate the Acision business, realizing favorable cost synergies as a result. The Company’s liquidity is also dependent on its ability to satisfy the operating financial covenants required by the terms of the senior credit facility agreement. Management believes that future sources of liquidity will include cash and cash equivalents, cash flows from operations, refinancing of the senior credit facility or proceeds from the issuance of equity or debt securities.
The Company currently forecasts available cash and cash equivalents will be sufficient to meet its liquidity needs, including capital expenditures, for at least the next 12 months.
Management's current forecast is based upon a number of assumptions including, among others: assumed levels of customer order activity, revenue and collections; continued implementation of initiatives to reduce operating costs; no significant degradation in operating margins; increased spending on certain investments in the business; slight reductions in the unrestricted cash levels required to support the working capital needs of the business and other professional fees; successful integration of the Acision business; intra-period working capital fluctuations consistent with historical trends. Management believes that the above-noted assumptions are reasonable.
Discontinued Operations
As of April 30, 2015, the BSS Business met the criteria to be classified as held for sale as well as discontinued operations. As such, the BSS Business has been re-classified and reflected as discontinued operations on the consolidated statements of operations for all periods presented. The assets and liabilities of the BSS business are included in discontinued operations as separate components to the Company’s consolidated balance sheet as of January 31, 2015 (see Note 17, Discontinued Operations).
Segment Information
Prior to entering into the Amdocs Purchase Agreement, the Company’s reportable segments consisted of BSS and Digital Services. As a result of entering into the Amdocs Purchase Agreement, the results of operations of the former BSS Business segment are classified as discontinued operations. Therefore, with the reported divestiture, the Company operates as a single business segment the results of which are included in the Company's income statement from continuing operations. On August 6, 2015, the Company completed its acquisition of Acision (as defined below). The Company acquired Acision to complement its solution portfolio, enhance its market leadership, penetrate growth markets and improve its operational efficiency. Acision was integrated into Digital Services and the Company continues to operate a single segment as a global provider of digital communications solutions for communication service providers.
Use of Estimates
The preparation of the consolidated financial statements and the accompanying notes in conformity with U.S. GAAP requires the Company to make estimates and judgments that affect the reported amounts of assets, liabilities, revenue and expenses.
The most significant estimates among others include:
• | Estimates relating to the recognition of revenue, including the determination of vendor specific objective evidence (“VSOE”) of fair value and the determination of best estimate of selling price for multiple element arrangements; |
• | Fair value of stock-based compensation; |
• | Fair value of reporting units for the purpose of goodwill impairment testing; |
• | Recoverability of long-lived assets and asset groups; |
• | Realization of deferred tax assets; |
• | The identification and measurement of uncertain tax positions; |
• | Contingencies and litigation; |
• | Total estimates to complete on percentage-of-completion (“POC”) projects; |
F-12
• | Valuation of inventory; |
• | Israel employees severance pay; |
• | Allowance for doubtful accounts; |
• | Purchase price accounting valuation; |
• | Valuation of other intangible assets; and |
• | Discontinued operations. |
The Company’s actual results may differ from its estimates.
Functional Currency and Foreign Currency Translation and Transactions
The determination of the functional currency for the Company's foreign subsidiaries is made based on appropriate economic factors, including the currency in which the subsidiary sells its products, the sales market in which the subsidiary operates and the currency in which the subsidiary's financing is denominated. For foreign subsidiaries whose functional currency is not the U.S. dollar, assets and liabilities are translated using current exchange rates at the balance sheet date, and income and expense accounts using average exchange rates for the period, except revenue previously deferred which is translated using historical rates. The resulting foreign currency translation adjustments are reported as a separate component of “Other comprehensive (loss) income, net of tax” in the consolidated statements of comprehensive (loss) income. For foreign subsidiaries whose functional currency is not the local currency, re-measurement gains and losses are recorded during each period in “Foreign currency transaction gain (loss), net” in the consolidated statements of operations.
Unrealized and realized foreign currency transaction gains and losses on transactions denominated in currencies other than the functional currency of the entity are included in the consolidated statements of operations in “Other comprehensive (loss) income, net of tax” for the period in which the exchange rates changed.
Cash and Cash Equivalents
Cash primarily consists of cash on hand and bank deposits. Cash equivalents primarily consist of interest-bearing money market accounts, commercial paper, agency notes and other highly liquid investments with an original maturity of three months or less when purchased. The Company maintains cash and cash equivalents in U.S. dollars and in foreign currencies, which are subject to risks related to foreign currency exchange rate fluctuations.
Restricted Cash and Bank Deposits
Restricted cash and bank deposits include compensating cash balances related to existing lines of credit and deposits that are pledged as collateral or restricted for use to settle potential indemnification claims arising from the disposition of businesses, specified performance guarantees to customers and vendors, letters of credit, foreign currency transactions in the ordinary course of business and pending tax judgments. Cash expected to be restricted for more than one year from the balance sheet date is classified as long-term restricted cash. Restricted bank deposits generally consist of certificates of deposit with original maturities of twelve months or less.
Accounts Receivable, Net
The application of revenue recognition guidance often results in circumstances for which the Company is unable to recognize revenue relating to sales transactions that have been billed. In these circumstances, the Company does not recognize the deferred revenue or the related accounts receivable and no amounts are recognized in the consolidated balance sheets for such transactions with the exception of certain arrangements recognized in accordance with the FASB's guidance relating to accounting for performance of construction-type and certain production-type contracts. Only to the extent that the Company has recognized revenue and not received cash for such transactions are amounts included in “Accounts receivable, net.” Also, only to the extent that the Company has received cash for such transactions is the amount included in “Deferred revenue” in the consolidated balance sheets.
Allowance for Doubtful Accounts
The Company estimates the collectability of its accounts receivable balances for each accounting period and adjusts its allowance for doubtful accounts accordingly. The Company exercises judgment in assessing the collectability of accounts receivable, including consideration of current economic conditions, the creditworthiness of customers, their collection history and the related aging of past due receivables balances. The Company evaluates specific accounts when it becomes aware that a customer may be experiencing a deterioration of its financial condition due to lower credit ratings, bankruptcy or other factors
F-13
that may affect such customer's ability to meet its payment obligations. The Company expenses uncollectible trade receivables when all collection efforts have been exhausted and the Company believes the amount will not be collected.
Balance at Beginning of Fiscal Year | Additions Charged (Credited) to Expenses | Net Deductions (Recoveries) | Other | Balance at End of Fiscal Year | ||||||||||||||||
(In thousands) | ||||||||||||||||||||
Allowance for doubtful accounts: | ||||||||||||||||||||
Fiscal Year Ended January 31, 2016 | $ | 3,627 | $ | 463 | $ | (543 | ) | $ | (187 | ) | $ | 3,360 | ||||||||
Fiscal Year Ended January 31, 2015 | 5,634 | 829 | (2,191 | ) | (645 | ) | 3,627 | |||||||||||||
Fiscal Year Ended January 31, 2014 | 6,868 | 933 | (2,103 | ) | (64 | ) | 5,634 | |||||||||||||
Investments
The Company accounts for investments in accordance with the FASB's guidance relating to accounting for certain investments in debt and equity securities. Purchases are recorded on the settlement date.
Interest on short-term investments is recognized in the consolidated statements of operations when earned. Realized gains and losses on available-for-sale securities are recognized when securities are sold and are calculated using the specific identification method, and are recorded in “Other (expense) income, net” in the consolidated statements of operations. Unrealized gains and losses, net of taxes, are recorded as a component of “Accumulated other comprehensive income” in the consolidated statements of equity.
Generally, investments with original maturities of greater than three months and remaining maturities of less than one year are classified as short-term investments.
The Company reviews its investments for indications of impairment in value on a quarterly basis. The Company considers an investment to be impaired when the fair value is less than the carrying value (or amortized cost). The Company evaluates each impaired investment individually to determine whether such investment is other-than-temporarily impaired.
Inventories
Inventories are stated at the lower of cost or market. Cost is determined by the first-in, first-out method. The Company reduces the carrying value of inventory when it holds excess or obsolete inventories determined through an evaluation of both historical usage and expected future demand. Part of the raw materials comprises software licenses, which are capitalized into inventory upon purchase from a vendor when the license will be used by the Company as part of its deliverables to its customers. Such expenses are included as a component of “Product costs” in the consolidated statements of operations.
The Company evaluates slow moving or obsolete inventory for impairment. Raw material hardware is evaluated based upon utilization and projected usage. Raw material software is written-off upon determination that licenses will no longer be used in products nor can be converted to use within the organization or with other licenses/products.
Property and Equipment
Property and equipment are carried at cost less accumulated depreciation and amortization. The Company depreciates and amortizes its property and equipment on a straight-line basis. Leasehold improvements are capitalized and amortized over the shorter of their estimated useful lives or the related lease term. The cost of maintenance and repairs is expensed as incurred. Gains or losses on the sale or retirement of assets are included in income when the assets are retired or sold provided there is reasonable assurance of the collectability of the sales price and any future activities to be performed by the Company relating to the assets sold are insignificant.
F-14
The estimated useful lives of property and equipment are as follows:
Useful Life in Years | |||
Shortest | Longest | ||
Lab equipment | 5 | 5 | |
Computers and software | 2 | 4 | |
Leasehold improvements | 1 | 10 | |
Production equipment | 5 | 5 | |
Furnishings | 5 | 8 | |
Business Combinations
The Company allocates the fair value of consideration transferred in a business combination to the estimated fair value at the acquisition date of the tangible and intangible assets acquired, the liabilities assumed and any noncontrolling interest. Acquisition costs are expensed as incurred. Any residual consideration is recorded as goodwill. The fair value of consideration includes cash, equity securities, other assets and contingent consideration. The Company remeasures the fair value of contingent consideration at each reporting period and any change in the fair value from either the passage of time or events occurring after the acquisition date, is recorded in earnings. The Company's determination of the fair values of assets acquired and liabilities assumed requires the Company to make significant estimates, primarily with respect to intangible assets. These estimates can include, but are not limited to, cash flow projections for the acquired business, and the appropriate weighted-average cost of capital. The results of operations of the acquired business are included in the Company's consolidated results of operations from the date of the acquisition (See Note 16, Acquisitions).
Goodwill
Goodwill represents the excess of the fair value of consideration transferred in a business combination over the fair value of tangible and intangible assets acquired net of the fair value of liabilities assumed and the fair value of any noncontrolling interest in the acquiree. The Company has no indefinite-lived intangible assets other than goodwill. The carrying amount of goodwill is reviewed annually for impairment on November 1 and whenever events or changes in circumstances indicate that the carrying value may not be recoverable.
The Company applies the FASB's guidance when testing goodwill for impairment which permits the Company to make a qualitative assessment of whether goodwill is impaired, or opt to bypass the qualitative assessment, and proceed directly to performing the first step of the two-step impairment test. If the Company performs a qualitative assessment and concludes it is more-likely-than-not that the fair value of a reporting unit exceeds its carrying value, goodwill is not considered impaired and the two-step impairment test is unnecessary. However, if the Company concludes otherwise, it is then required to perform the first step of the two-step impairment test.
The Company has the unconditional option to bypass the qualitative assessment for any reporting unit and proceed directly to performing the first step of the goodwill impairment test. The Company may resume performing the qualitative assessment in any subsequent period.
For reporting units where the Company decides to perform a qualitative assessment, the Company's management assesses and makes judgments regarding a variety of factors which potentially impact the fair value of a reporting unit, including general economic conditions, industry and market-specific conditions, customer behavior, cost factors, financial performance and trends, strategies and business plans, capital requirements, management and personnel issues, and stock price, among others. Management then considers the totality of these and other factors, placing more weight on the events and circumstances that are judged to most affect a reporting unit's fair value or the carrying amount of its net assets, to reach a qualitative conclusion regarding whether it is more-likely-than-not that the fair value of a reporting unit exceeds its carrying amount.
For reporting units where the Company performs the two-step goodwill impairment test, the first step requires the Company to compare the fair value of each reporting unit to the carrying value of its net assets. The Company considers both an income-based approach using projected discounted cash flows and a market-based approach using multiples of comparable companies to determine the fair value of its reporting units. The Company's estimate of fair value of each reporting unit is based on a number of subjective factors, including: (i) the appropriate weighting of valuation approaches (income-based approach and market-based approach), (ii) estimates of the future revenue and cash flows, (iii) discount rate for estimated cash flows, (iv) selection of peer group companies for the market-based approach, (v) required levels of working capital, (vi) assumed terminal value, (vii) the time horizon of cash flow forecasts; and (viii) control premium.
F-15
If the fair value of the reporting unit exceeds its carrying value, goodwill is not considered impaired and no further evaluation is necessary. If the carrying value of the reporting unit is greater than the estimated fair value of the reporting unit, there is an indication that impairment may exist and the second step is required. In the second step, the implied fair value of goodwill is calculated as the excess of the fair value of a reporting unit over the fair value assigned to its assets and liabilities. If the implied fair value of goodwill is less than the carrying value of the reporting unit's goodwill, the difference is recognized as an impairment charge.
As a result of the Amdocs Purchase Agreement for the sale the BSS Business, the Company performed an interim goodwill test in conjunction with the preparation of its financial statements for the three months ended April 30, 2015 which did not result in an impairment.
The Company did not record any impairment of goodwill for the fiscal years ended January 31, 2016, 2015 and 2014.
The Company's forecasts and estimates are based on assumptions that are consistent with the plans and estimates used to manage the business. Changes in these estimates could change the conclusion regarding an impairment of goodwill.
Impairment of Long-Lived and Intangible Assets
The Company periodically evaluates its long-lived assets for potential impairment. In accordance with the relevant accounting guidance, the Company reviews the carrying value of its long-lived assets or asset group that is held and used for impairment whenever circumstances occur that indicate that those carrying values are not recoverable. Under the held and used approach, assets are grouped at the lowest level for which identifiable cash flows are largely independent of the cash flows of other groups of assets and liabilities. The identification of asset groups involves judgment, assumptions, and estimates. The lowest level of cash flows which are largely independent of one another was determined to be at the BSS and Digital Services reporting units.
The Company makes judgments about the recoverability of long-lived assets, including fixed assets and purchased finite-lived intangible assets whenever events or changes in circumstances indicate that impairment may exist. Each period the Company evaluates the estimated remaining useful lives of long-lived assets and whether events or changes in circumstances warrant a revision to the remaining periods of depreciation or amortization. If circumstances arise that indicate an impairment may exist, the Company uses an estimate of the undiscounted value of expected future operating cash flows over the primary asset’s remaining useful life and salvage value to determine whether the long-lived assets are impaired. If the aggregate undiscounted cash flows and salvage values are less than the carrying amount of the assets, the resulting impairment charge to be recorded is calculated based on the excess of the carrying amount of the assets over the fair value of such assets, with the fair value generally determined using the discounted cash flow ("DCF") method. Application of the DCF method for long-lived assets requires judgment and assumptions related to the amount and timing of future expected cash flows, salvage value assumptions, and appropriate discount rates. Different judgments or assumptions could result in materially different fair value estimates.
Any impairment of these assets must be considered prior to the Company's impairment review of goodwill.
The Company did not record any impairment of intangible assets for the fiscal years ended January 31, 2016, 2015 and 2014.
Fair Value Measurements
Under the FASB's guidance, fair value is defined as the price that would be received in the sale of an asset or paid to transfer a liability in an orderly transaction between market participants at the measurement date (i.e., “the exit price”).
In determining fair value, the Company uses various valuation approaches, including quoted market prices and discounted cash flows. The FASB's guidance also establishes a hierarchy for inputs used in measuring fair value that maximizes the use of observable inputs and minimizes the use of unobservable inputs by requiring that the most observable inputs be used when available. Observable inputs are inputs that market participants would use in pricing the asset or liability developed based on market data obtained from independent sources. Unobservable inputs are inputs that reflect a company's judgment concerning the assumptions that market participants would use in pricing the asset or liability developed based on the best information available under the circumstances. The fair value hierarchy is broken down into three levels based on the reliability of inputs as follows:
Level 1-Valuations based on quoted prices in active markets for identical instruments that the Company is able to access. Since valuations are based on quoted prices that are readily and regularly available in an active market, valuation of these instruments does not entail a significant degree of judgment.
F-16
Level 2-Valuations based on quoted prices in active markets for instruments that are similar, or quoted prices in markets that are not active for identical or similar instruments, and model-derived valuations in which all significant inputs and significant value drivers are observable in active markets.
Level 3-Valuations based on inputs that are unobservable and significant to the overall fair value measurement.
To the extent that valuation is based on models or inputs that are less observable or unobservable in the market, the determination of fair value requires more judgment. Accordingly, the degree of judgment exercised in determining fair value is greatest for instruments categorized in Level 3. In certain cases, the inputs used to measure fair value may fall into different levels of the fair value hierarchy. In such cases, an asset or liability is classified in its entirety based on the lowest level of input that is significant to the measurement of fair value.
Fair value is a market-based measure considered from the perspective of a market participant who holds the asset or owes the liability rather than an entity-specific measure. Therefore, even when market assumptions are not readily available, the Company's own assumptions are set to reflect those that market participants would use in pricing the asset or liability at the measurement date. The Company uses prices and inputs that are current as of the measurement date, including during periods of market dislocation.
The FASB's guidance requires that the valuation techniques used are consistent with at least one of the three possible approaches: the market approach, income approach, and/or cost approach. The Company's Level 2 valuations use the market approach and are based on significant other observable inputs such as quoted prices for financial instruments not traded on a daily basis.
The FASB's guidance relating to the fair value option for financial assets and financial liabilities permits an instrument-by-instrument irrevocable election to account for selected financial instruments at fair value. The Company elected not to apply the fair value option to any eligible financial assets or financial liabilities.
The Company also elected not to apply the fair value option for non-financial assets and non-financial liabilities.
Derivative Instruments and Hedge Accounting
As part of the Company's risk management strategy, it uses derivative financial instruments, primarily forward contracts, to hedge against certain foreign currency exposures. The Company recognizes all derivatives as either assets or liabilities in the consolidated balance sheets at their fair value on a trade date basis. Short-term derivatives in a gain position are reported in “Prepaid expenses and other current assets” in the consolidated balance sheets and derivatives in a loss position are recorded in “Other current liabilities” in the consolidated balance sheets.
In order to qualify for hedge accounting, the Company formally documents at the inception of each hedging relationship the hedging instrument, the hedged item, the risk management objective and strategy for undertaking each hedging relationship, and the method used to assess hedge effectiveness, which includes the Company's assessment of the creditworthiness of each party and their ability to comply with the contractual terms of the hedging derivative.
When derivative financial instruments qualify for cash flow hedge accounting, the Company records the effective portion of changes in fair value as part of other comprehensive (loss) income in the consolidated statements of equity. When the hedged item is recognized in the consolidated statements of operations, the related derivative gain or loss is reclassified from “Accumulated other comprehensive (loss) income” in the consolidated statements of equity to the consolidated statements of operations within the line item in which the hedged item is recorded. The cash flows from a derivative financial instrument qualifying for cash flow hedge accounting are classified in the consolidated statements of cash flows in the same category as the cash flows from the hedged item.
If a derivative financial instrument does not qualify for hedge accounting, the Company records the changes in fair value of derivative instruments in “Other (expense) income, net” in the consolidated statements of operations.
The Company does not purchase, hold or sell derivative financial instruments for trading and speculative purposes.
Concentration of Credit Risk
Financial instruments, which potentially expose the Company to credit risk, consist primarily of investments, derivatives and accounts receivable. From time to time, the Company invests excess cash in high credit-quality financial institutions and invests primarily in money market funds placed with major banks and financial institutions and corporate commercial paper. The Company believes that the financial institutions that hold its cash and liquid investments are financially sound and accordingly minimal credit risk exists with respect to these balances.
A significant portion of accounts receivable are with CSPs. However, the concentration of credit risk is diversified due to the large number of commercial and government entities comprising the Company's customer base and their dispersion across
F-17
different industries and geographic regions. The Company manages credit risk on trade accounts receivable by performing ongoing credit evaluations of its customers' financial condition and limiting the extension of credit when deemed necessary.
For the fiscal years ended January 31, 2016, 2015 and 2014, one customer represented approximately 16%, 17% and 30%, respectively, of total revenue.
For the fiscal year ended January 31, 2016, one customer accounted for 15% of the consolidated accounts receivable. For the fiscal year ended January 31, 2015, one customer accounted for 19% of the consolidated accounts receivable. The revenues related to these receivables are primarily deferred in each of the periods presented. The Company believes that no significant customer credit risk exists other than what is reserved.
The Company depends on a limited number of suppliers and manufacturers for certain components and is exposed to the risk that these suppliers and manufacturers will not be able to fill its orders on a timely basis and at the specifications it requires.
Revenue Recognition
The Company reports its revenue in two categories: (i) product revenue, including hardware and software products; and (ii) service revenue, including revenue from professional services, training services and post-contract customer support (“PCS”). Professional services primarily include installation, customization and consulting services.
The Company's revenue is accounted for in accordance with the FASB's guidance relating to multiple element arrangements entered into or materially modified on or after February 1, 2011 that include hardware which functions together with software to provide the essential functionality of the product. Revenue recognition for software and (or) services arrangements are accounted under the FASB's new guidance applicable to multiple element arrangements. In applying the FASB's guidance, the Company exercises judgment and uses estimates in determining the revenue to be recognized in each accounting period.
For arrangements that do not require significant customization of the underlying software, the Company recognizes revenue when it has persuasive evidence of an arrangement, the product has been shipped and the services have been provided to the customer, the sales price is fixed or determinable, collectability is probable, and all other pertinent criteria are met as required by the FASB's guidance.
In certain instances, payment terms extend beyond the Company's customary practices. In these situations, if a customer does not have an adequate history of abiding by its contractual payment terms without concessions, the sales price is not considered fixed or determinable. As such, revenue recognition commences upon collection, provided all other revenue recognition criteria have been met.
Under certain contractual arrangements, the Company is required to pay a penalty or liquidated damages if delivery of the Company's products and installation services are not completed by a certain date. In other arrangements, the Company has guaranteed product performance and warranty service response rates, which, if not met, can result in penalties. The Company assesses whether such penalties are akin to a warranty provision or a separate element. To the extent that the penalties are akin to a warranty provision, the Company accounts for such penalties or liquidated damages in accordance with the FASB's guidance relating to contingencies.
Shipping and handling amounts billed to the Company's customers are included in product revenue and the related shipping and handling costs are included in product costs.
The Company reports revenue net of any revenue-based taxes assessed by governmental authorities that are imposed on and concurrent with specific revenue producing transactions.
The following are the specific revenue recognition policies for each major category of revenue.
F-18
Multiple Element Arrangements
Revenue arrangements may incorporate one or more elements in a single transaction or combination of related transactions. In September 2009, the FASB issued revenue recognition guidance applicable to multiple element arrangements, which applies to multiple element revenue arrangements that contain both software and hardware elements, focusing on determining which revenue arrangements are within the scope of the software revenue guidance; and addresses how to separate consideration related to each element in a multiple element arrangement, excluding software arrangements, and establishes a hierarchy for determining the selling price of an element. It also eliminates the residual method of allocation by requiring that arrangement consideration be allocated at the inception of the arrangement to all elements using the relative selling price method.
Certain of the Company's multiple element arrangements include hardware that functions together with software to provide the essential functionality of the product. Therefore, such arrangements entered into or materially modified on or after February 1, 2011 are no longer accounted for in accordance with the FASB's software accounting guidance. Accordingly, the selling price used for each deliverable is based on VSOE of fair value, if available, third party evidence (“TPE”) of fair value if VSOE is not available, or the Company's best estimate of selling price (“BESP”) if neither VSOE nor TPE is available. In determining the units of accounting for these arrangements, the Company evaluates whether each deliverable has stand-alone value as defined in the FASB's guidance. Given that the hardware and software function together to provide the essential functionality of the product and each element is critical to the overall tangible product sold, neither the software nor the hardware has stand-alone value. Professional services performed prior to the product's acceptance do not have stand-alone value and are therefore combined with the related hardware and software as one non-software deliverable. After determining the fair value for each deliverable, the arrangement consideration is allocated using the relative selling price method. Revenue is recognized accordingly for each deliverable once the respective revenue recognition criteria are met for that deliverable.
The Company has not yet established VSOE of fair value for any element other than PCS for a portion of its arrangements. Generally, the Company is not able to determine TPE because its offerings contain a significant level of differentiation such that the comparable pricing of substantially similar products or services cannot be obtained. When the Company is unable to establish fair value of its non-software deliverables using VSOE or TPE, it uses BESP in its allocation of arrangement consideration. The objective of BESP is to determine the price at which it would transact a sale if the product or service were sold on a stand-alone basis, which requires significant judgment. The Company determines BESP for a product or service by considering multiple factors, including, but not limited to, cost of products, gross margin objectives, pricing practices, geographies and customer classes. The Company exercises judgment and uses estimates in determining the revenue to be recognized in each accounting period.
The majority of multiple element arrangements contain at least two of the following elements: (1) tangible product (hardware, software, and professional services performed prior to the product's acceptance), (2) PCS, (3) training, and (4) post acceptance services. The Company's tangible products are rarely sold separately. In addition, the Company's tangible products are complex, and contain a high degree of customizations such that the Company is unable to demonstrate pricing within a pricing range to establish BESP as very few contracts are comparable. Therefore, the Company has concluded that cost plus a target gross profit margin provides the best estimate of the selling price.
PCS, training, and post acceptance services have various pricing practices based on several factors, including the geographical region of the customer, the volume of services being sold and the type or class of service being performed. As noted above, the Company has VSOE of PCS for a portion of its arrangements. For PCS, under the substantive renewal rate approach, the Company uses its minimum substantive VSOE thresholds by region plus a reasonable margin as the basis to estimate BESP of PCS for transactions that do not meet the VSOE criteria. For training and post-acceptance services, the Company performs an annual study of stand-alone training and post-acceptance sales to arrive at BESP. While the study does not result in VSOE, it is useful in determining the Company's BESP.
With the exception of arrangements that require significant customization of the product to meet the particular requirements of the customer, which are accounted for using the percentage-of-completion method, the initial revenue recognition for each non-software product only deliverable is generally upon completion of the related professional services.
For all software arrangements without hardware, the Company allocates revenue to the delivered elements of the arrangement using the residual method, whereby revenue is allocated to the undelivered elements based on VSOE of fair value of the undelivered elements with the remaining arrangement fee allocated to the delivered elements and recognized as revenue assuming all other revenue recognition criteria are met. If the Company is unable to establish VSOE of fair value for the undelivered elements of the arrangement, revenue recognition is deferred for the entire arrangement until all elements of the arrangement are delivered. However, if the only undelivered element is PCS, the Company recognizes the arrangement fee ratably over the PCS period.
PCS revenue is derived primarily from providing technical software support services, unspecified software updates and upgrades to customers on a when and if available basis. PCS revenue is recognized ratably over the term of the PCS period.
F-19
When PCS is included within a multiple element arrangement and the arrangement is within the scope of the software revenue guidance, the Company utilizes the substantive renewal rate or the bell-shaped curve approach (depending on the maintenance pricing mechanism for each customer) to establish VSOE of fair value for PCS.
The Company's policy for establishing VSOE of fair value for professional services and training is based upon an analysis of separate sales of services, which are then compared with the fees charged when the same elements are included in a multiple element arrangement.
When using the substantive renewal rate method, the Company may be unable to establish VSOE of fair value for PCS because the renewal rate is deemed to be non-substantive or there are no contractually-stated renewal rates. If the stated renewal rate is non-substantive, the entire arrangement fee is recognized ratably over the estimated economic life of the product (five to eight years) beginning upon delivery of all elements other than PCS. The Company believes that the estimated economic life of the product is the best estimate of how long the customer will renew PCS. If there is no contractually stated renewal rate, the entire arrangement fee is recognized ratably over the relevant contractual PCS term beginning upon delivery of all elements other than PCS.
In certain multiple element arrangements, the Company is obligated to provide training services to customers related to the operation of the Company's software products. These training services are either provided to the customer on a “defined” basis (limited to a specified number of days or training classes) or on an “as-requested” basis (unlimited training over a contractual period).
For multiple element arrangements containing as-requested training obligations that are within the scope of the software revenue guidance, the Company recognizes the total arrangement consideration ratably over the contractual period during which the Company is required to “stand ready” to perform such training, provided that all other criteria for revenue recognition have been met.
For multiple element arrangements containing defined training obligations, the training services are typically provided to the customer prior to the completion of the installation services. For multiple element arrangements that are not within the scope of the software guidance, training is treated as a separate deliverable and recognized when delivered. For arrangements that are within the scope of the software revenue guidance, because revenue recognition does not commence until the completion of installation, the defined training obligations do not impact the timing of recognition of revenue. In certain circumstances in which training is provided after the end of the installation period, the Company commences revenue recognition upon the completion of training, provided that all other criteria for revenue recognition have been met.
In its multiple element arrangements the Company may offer a discount on future purchases of products and services. A discount is considered an additional element of an arrangement if the discount is considered more than insignificant. A more-than-insignificant discount with respect to future purchases is a discount that is: (i) incremental to the range of discounts reflected in the pricing of the other elements of the arrangement, (ii) incremental to the range of discounts typically given in comparable transactions, and (iii) significant. Insignificant discounts and discounts that are not incremental do not affect revenue recognition. If the discount is considered more than insignificant, then a portion of the fee received is deferred and recognized as revenue as the future purchases are made by the customer or upon expiration of the period that the discount is available.
Some of the Company's arrangements require significant customization of the product to meet the particular requirements of the customer. For these arrangements, revenue is typically recognized in accordance with the FASB's guidance for long-term construction type contracts using the POC method.
The determination of whether services entail significant customization requires judgment and is primarily based on alterations to the features and functionality to the standard release, complex or unusual interfaces as well as the amount of hours necessary to complete the customization solution relative to the size of the contract. Revenue from these arrangements is recognized on the POC method based on the ratio of total hours incurred to date compared to estimated total hours to complete the contract.
Management is required to make judgments to estimate the total estimated costs and progress to completion. Changes to such estimates can impact the timing of the revenue recognition period to period. The Company uses historical experience, project plans, and an assessment of the risks and uncertainties inherent in the arrangement to establish these estimates. Uncertainties in these arrangements include implementation delays or performance issues that may or may not be within the Company's control. If some level of profitability is assured, but the related revenue and costs cannot be reasonably estimated, then revenue is recognized to the extent of costs incurred until such time that the project's profitability can be estimated or the services have been completed. If the Company determines that based on its estimates its costs exceed the sales price, the entire amount of the estimated loss is accrued in the period that such losses become known.
Revenue derived from sales to distributors, resellers, and value-added resellers are recognized when the resellers in turn sell the software product to their customers and installation of the software product has occurred, provided all other revenue
F-20
recognition criteria are met. This is commonly referred to as the sell-through method. The contractual arrangements between the reseller and end user, or between the reseller and the Company, generally obligate the Company to provide services to the end user that are subject to end user acceptance. Further, payment terms are generally subject to the reseller's receiving payment from the end user and the end user's acceptance of the product. Therefore, the Company defers recognition until there is a “sell-through” by the reseller to an actual end user customer and acceptance by the end user.
In the consolidated statements of operations, the Company classifies revenue as product revenue or service revenue. For multiple element arrangements that include both product and service elements, management evaluates various available indicators of fair value and applies its judgment to reasonably classify the arrangement fee between product revenue and service revenue. The amount of multiple element arrangement fees classified as product and service revenue based on management estimates of fair value when VSOE of fair value for all elements of an arrangement does not exist could differ from amounts classified as product and service revenue if VSOE of fair value for all elements existed. The allocation of multiple element arrangement fees between product revenue and service revenue, when VSOE of fair value for all elements does not exist, is for consolidated financial statement presentation purposes only and does not affect the timing or amount of revenue recognized.
In determining the amount of a multiple element arrangement fee that should be classified between product revenue and service revenue, the Company first allocates the arrangement fee to product revenue and PCS (PCS is classified as service revenue) based on management's estimate of fair value for those elements. The remainder of the arrangement fee, which is comprised of all other service elements, is allocated to service revenue. The estimate of fair value of the product element is based primarily on management's evaluation of direct costs and reasonable profit margins on those products. This was determined to be the most appropriate methodology as the Company has historically been product-oriented with respect to pricing policies which facilitates the evaluation of product costs and related margins in arriving at a reasonable estimate of the product element fair value. Management's estimate of reasonable profit margins requires significant judgment and consideration of various factors, such as the impact of the economic environment on margins, the complexity of projects, the stability of product profit margins and the nature of products. The estimate of fair value for PCS is based on management's evaluation of the weighted-average of PCS rates for arrangements for which VSOE of fair value of PCS exists.
Post-Contract Customer Support Renewals
The Company's multiple element arrangements typically provide for renewal of PCS terms upon expiration of the original term. The amounts of these PCS renewals are recognized as revenue ratably over the specified PCS renewal period.
Professional Services Only Arrangements
Based on the type and nature of its professional-services-only arrangements, the Company recognizes revenue using either the proportional performance method, ratable recognition, completed performance method or on a time and materials basis. For fixed-fee arrangements recognized based on the proportional performance method, the Company typically measures progress to completion based on the ratio of hours incurred to total estimated project hours, an input method. For fixed-fee arrangements recognized based on the ratable method, the Company recognizes revenue on a straight line basis over the service period. For fixed-fee arrangements recognized based on the completed performance method, the Company recognizes revenue once the services are completed and there are no other obligations of the Company. The Company recognizes revenue for time and materials arrangements as the services are performed based on contractually stipulated billing rates.
Revenue share Arrangements
The Company recognizes revenue on a net basis based on the net amount that will be collected. Setup fee (if any) is recognized ratably over the expected period of the service.
Product and Service Costs
The Company's cost of revenue primarily consists of (i) material costs, (ii) compensation and related overhead expenses for personnel involved in the customization of its products, customer delivery and maintenance and professional services, (iii) contractor costs, (iv) royalties and license fees, (v) depreciation of equipment used in operations, and (vi) amortization of capitalized software costs and certain purchased intangible assets.
When revenue is recognized over multiple periods in accordance with the Company's revenue recognition policies, the material cost, including hardware and third party software license fees are deferred and amortized over the same period that product revenue is recognized. These costs are recognized as “Deferred cost of revenue” on the consolidated balance sheets. However, the Company has made an accounting policy election whereby the cost for installation and other service costs are expensed as incurred, except for arrangements recognized in accordance with the FASB's guidance for long-term construction type contracts.
F-21
For certain contracts where revenue is recognized in accordance with the FASB's guidance for long-term construction type contracts, revisions in estimates of costs are reflected in the accounting period in which the facts that require the revision become known. These costs include all direct material and labor costs and overhead related to contract performance.
Research and Development, Net
Research and development, net expenses primarily consist of personnel-related costs involved in product development and third party development and programming costs. Research and development costs are expensed as incurred.
A portion of the Company’s research and development operations are located in Israel, where certain of the Company’s subsidiaries derive benefits from participation in programs sponsored by the Government of Israel for the support of research and development activities in Israel. Certain of the Company’s research and development activities include projects partially funded by the Authority for Technological Innovation of the Israeli Ministry of the Economy, formerly known as the Office of the Chief Scientist (the “ATI”) under which the funding organization reimburses a portion of the Company’s research and development expenditures under approved project budgets. Although the Government of Israel does not own proprietary rights in the ATI-funded Products and there is no specific restriction by the ATI with regard to the export of the ATI-funded Products, under certain circumstances, there may be limitations on the ability to transfer technology, know-how and manufacturing of ATI-funded Products outside of Israel. Such limitations could result in the requirement to pay a redemption fee calculated according to the applicable regulations. The amounts reimbursable by the ATI and others for the fiscal years ended January 31, 2016, 2015 and 2014 were negligible.
Software Costs
Costs of software developed for internal use are capitalized in accordance with the FASB's guidance during the application development stage and are then amortized over the estimated useful life of the software, which to date has been five years or less once the software is ready for its intended use. These costs are included in “Property and equipment, net” in the consolidated balance sheets.
Sales and Marketing
Sales and marketing expenses include payroll, employee benefits, stock-based compensation, and other headcount-related expenses associated with sales and marketing personnel, and the costs of advertising, promotions and other programs. In addition, the Company's customer acquisition and origination costs, including sales and agent commissions are expensed when incurred, with the exception of certain sales referral fees that are capitalized and amortized ratably over the revenue recognition period. Advertising costs are expensed as incurred.
Stock-Based Compensation
The Company uses the Black-Scholes option-pricing model to estimate the fair value of certain of its stock-based awards. Stock-based compensation expense is measured at the grant date based on the fair value of the award and the cost is recognized as expense ratably over the award's vesting period, which generally vest ratably over two or three years and expire ten years from the date of grant. The Black-Scholes model requires making certain assumptions used within the model, the most significant of which are the stock price volatility assumption over the term of the awards and the expected life of the option award based on the actual and projected employee stock option behaviors. Other assumptions include the risk-free rate of return and dividends during the expected term.
The Company estimates expected forfeitures of stock-based awards at the grant date and recognizes compensation cost only for those awards expected to vest. Forfeiture rates are estimated based on historical experience of Xura employees. The forfeiture assumption is adjusted to the actual forfeitures that occur. Therefore, changes in the forfeiture assumptions may impact the amount and timing of the total amount of expense recognized over the vesting period. Estimated forfeitures are reassessed in subsequent periods and may change based on new facts and circumstances.
In connection with the Share Distribution, CTI's equity-based compensation awards held by the Company's employees were replaced with the Company's equity-based compensation awards on November 1, 2012. The replacement of CTI's equity-based compensation awards was considered a modification that resulted in a negligible increase in the fair value of the awards. The Company's consolidated statements of operations prior to the Share Distribution include expenses related to the Company's employee participation in the CTI plans.
APIC Pool
The long form method is used to determine the Company's pool of excess tax benefits available within additional paid-in capital. Excess tax benefits resulting from stock option exercises are recognized as additions to APIC in the period the benefit is
F-22
realized. In the event of a shortfall (that is, the tax benefit realized is less than the amount previously recognized through periodic stock-based compensation expense recognition and related deferred tax accounting), the shortfall is charged against APIC to the extent of previous excess benefits, if any, including the hypothetical APIC pool, and then to tax expense.
Income Taxes
Income taxes are provided using the asset and liability method, such that income taxes (i.e., deferred tax assets, deferred tax liabilities, taxes currently payable/refunds receivable and tax expense/benefit) are recorded based on amounts refundable or payable in the current year and include the results of any difference between U.S. GAAP and tax reporting. Deferred income taxes reflect the tax effect of net operating losses, capital losses and general business credit carryforwards and the net tax effects of temporary differences between the carrying amount of assets and liabilities for financial statement and income tax purposes, as determined under enacted tax laws and rates. Valuation allowances are established when management determines that it is more-likely-than-not that some portion or the entire deferred tax asset will not be realized. The financial effect of changes in tax laws or rates is accounted for in the period of enactment. The subsequent realization of net operating loss and general business credit carryforwards acquired in acquisitions accounted for using the acquisition method of accounting is recognized in the consolidated statement of operations.
From time to time, the Company has business transactions in which the tax consequences are uncertain. Significant judgment is required in assessing and estimating the tax consequences of these transactions. The Company prepares and files tax returns based on its interpretation of tax laws. In the normal course of business, the Company's tax returns are subject to examination by various taxing authorities. Such examinations may result in future tax, interest and penalty assessments. In determining the Company's tax provision for financial reporting purposes, the Company establishes a liability for uncertain tax positions unless such positions are determined to be more-likely-than-not of being sustained upon examination, based on their technical merits. That is, for financial reporting purposes, the Company only recognizes tax benefits that it believes are more-likely-than-not of being sustained and then recognizes the largest amount of benefit that is greater than 50 percent likely to be realized upon settlement. There is considerable judgment involved in determining whether positions taken on the tax return are more-likely-than-not of being sustained and determining the likelihood of various potential settlement outcomes.
The Company adjusts its estimated liability for uncertain tax positions periodically because of new information discovered as a function of ongoing examinations by, and settlements with, the various taxing authorities, as well as changes in tax laws, regulations and interpretations. The combined tax provision of any given year includes adjustments to prior year income tax accruals that are considered appropriate as well as any related estimated interest. The Company's policy is to recognize, when applicable, interest and penalties on uncertain tax positions as part of income tax benefit (expense) (see Note 19, Income Taxes).
As part of the Company's accounting for business combinations, some of the purchase price is allocated to goodwill and intangible assets. Impairment expenses associated with goodwill are generally not tax deductible and will result in an increased effective income tax rate in the fiscal period any impairment is recorded. Amortization expenses associated with acquired intangible assets are generally not tax deductible pursuant to the Company's existing tax structure; however, deferred taxes have been recorded for non-deductible amortization expenses as a part of the purchase price allocation process. The Company has taken into account the allocation of these identified intangibles among different taxing jurisdictions, including those with nominal or zero percent tax rates, in establishing the related deferred tax liabilities. Under the FASB's guidance, the income tax benefit from future releases of the acquisition date valuation allowances or income tax contingencies, if any, are reflected in the income tax provision in the consolidated statements of operations, rather than as an adjustment to the purchase price allocation.
Accumulated Other Comprehensive Income
The components of Accumulated Other Comprehensive Income (“AOCI”), net of zero tax, were as follows:
Unrealized Gains on Cash Flow Hedges | Foreign Currency Translation Adjustments | Total | |||||||||
(In thousands) | |||||||||||
Balance as of January 31, 2015 | $ | (117 | ) | $ | 30,939 | $ | 30,822 | ||||
Other comprehensive income (loss) before reclassifications | 261 | (7,832 | ) | (7,571 | ) | ||||||
Amounts reclassified from AOCI | (144 | ) | — | (144 | ) | ||||||
Other comprehensive income (loss) | 117 | (7,832 | ) | (7,715 | ) | ||||||
Balance as of January 31, 2016 | $ | — | $ | 23,107 | $ | 23,107 | |||||
F-23
Contingencies
Contingencies by their nature relate to uncertainties that require management to exercise judgment both in assessing the likelihood that a liability has been incurred as well as in estimating the amount of potential loss, if any. The Company accrues for costs relating to litigation, claims and other contingent matters when such liabilities become probable and reasonably estimable. Legal costs are expensed as incurred.
Restructuring
The Company has developed and implemented restructuring initiatives to improve efficiencies across the organization, reduce operating expenses, and better align its resources to market conditions. As a result of these plans, the Company has recorded restructuring expenses comprised principally of employee severance and associated termination costs related to the reduction of its workforce, office closures, losses on subleases and contract termination costs.
The Company recognizes a liability for costs associated with an exit or disposal activity when the liability is incurred, as opposed to when management commits to an exit plan. The Company measures the liabilities associated with exit and disposal activities at fair value. One-time termination benefits are expensed at the date the employees are notified, unless the employees must provide future services beyond a minimum retention period, in which case the benefits are expensed ratably over the future service periods.
Certain employees included in a termination plan may include employees in countries which require the Company by law to pay mandatory severance for involuntary termination based on years of service. A liability for the cost of the benefits would be recognized when payment is probable and estimable.
The Company recognizes a liability for office closures measured at its fair value when the Company ceases using the rights conveyed by the contract, based on the remaining lease rentals, adjusted for the effects of any prepaid or deferred items recognized under the lease. This liability is further reduced by estimated sublease rentals that could be reasonably obtained for the property regardless of the intention of the lessee to sublease the premises.
2. | RECENT ACCOUNTING PRONOUNCEMENTS |
The Company is currently classified as an emerging growth company and as such, can delay adopting new or revised accounting standards until such time as those standards apply to private companies. The Company has elected to follow the required adoption dates for private companies. Therefore, the adoption dates below reflect the Company's current classification.
Standards Implemented
In April 2014, the FASB issued and Accounting Standards update for Presentation of Financial Statements, Property, Plant, and Equipment and Reporting Discontinued Operations and Disclosures of Disposals of Components of an Entity. Under the new guidance, the threshold for a disposal to qualify as a discontinued operation and requires new disclosures of both discontinued operations and certain other disposals that do not meet the definition of a discontinued operation. The guidance was effective for the fiscal year ended January 31, 2016. The adoption of this guidance resulted in additional disclosures (see Note 17, Discontinued Operations).
In November 2015, the FASB issued accounting guidance that requires that deferred tax assets and liabilities be classified as noncurrent in the Consolidated Balance Sheets. The guidance was early adopted during the fiscal year ended January 31, 2016 and applied prospectively to all deferred tax liabilities and assets in our consolidated balance sheets. The prior reporting period was not retrospectively adjusted. The adoption of this guidance had no impact on the Company’s Consolidated Statements of Operations and Comprehensive Income.
Standards To Be Implemented
In May 2014, the FASB issued new accounting guidance on revenue recognition. This topic requires entities to recognize revenue in a way that depicts the transfer of promised goods or services to customers in an amount that reflects the consideration to which the entity expects to be entitled to in exchange for those goods or services. In August 2015, the FASB issued an amendment to defer the effective date of this guidance by one year and allow entities to early adopt no earlier than the original effective date. The guidance will be effective for the Company beginning February 1, 2018. The Company is currently evaluating the impact of the adoption of this accounting standard update on its financial statements.
In August 2014, the FASB issued new guidance on going concern. Under the new guidance, management will be required to assess an entity’s ability to continue as a going concern, and to provide related footnote disclosures in certain circumstances. The guidance will be effective for the Company beginning February 1, 2017. This guidance is not expected to have an impact on the Company’s financial statements or disclosures.
F-24
In September 2015, the FASB issued new guidance on Business Combinations. The new guidance requires that adjustments to provisional amounts identified during the measurement period of a business combination be recognized in the reporting period in which those adjustments are determined, including the effect on earnings, if any, calculated as if the accounting had been completed at the acquisition date. The guidance eliminates the previous requirement to retrospectively account for such adjustments and requires additional disclosures related to the income statement effects of adjustments to provisional amounts identified during the measurement period. The guidance will be effective for the Company beginning February 1, 2016. The Company does not expect the adoption of this standard to have a material impact on the consolidated financial statements.
In February 2016, the FASB issued new guidance on Leases. The new guidance requires that lessees recognize lease assets and lease liabilities on the balance sheet for all leases with a lease term greater than 12 months. The guidance will be effective for the Company beginning February 1, 2019. The Company is currently evaluating the potential impact of this standard.
In March 2016, the FASB issued new guidance on Stock Compensation. The new guidance is intended to simplify aspects of the accounting for share-based payment transactions, including income tax impacts, classification on the statement of cash flows, and forfeitures. The guidance will be effective for the Company beginning February 1, 2017. The various amendments within the standard require different approaches to adoption of either retrospective, modified retrospective or prospective. Early adoption is permitted. The Company is currently evaluating the potential impact of this standard as well as the as available transition methods.
3. | SHARE DISTRIBUTION AGREEMENTS |
Share Distribution Agreements
The Company entered into a distribution agreement (the “Distribution Agreement”), transition services agreement, tax disaffiliation agreement and employee matters agreement (collectively, the “Share Distribution Agreements”) with CTI in connection with the Share Distribution. In particular, the Distribution Agreement, among other things, provides for the allocation between the Company and CTI of various assets, liabilities and obligations attributable to periods prior to the Share Distribution. Under the Distribution Agreement, the Company agreed to indemnify CTI and its affiliates (including Verint following the Verint Merger) against certain losses that may arise as a result of the Verint Merger and the Share Distribution. Certain of the Company's indemnification obligations are capped at $25.0 million and certain are uncapped. Specifically, the capped indemnification obligations include indemnifying CTI and its affiliates (including Verint after the Verint Merger) against losses stemming from breaches by CTI of representations, warranties and covenants in the Verint Merger Agreement and for any liabilities of CTI that were known by CTI but not included on the net worth statement delivered by CTI at the closing of the Verint Merger. The Company's uncapped indemnification obligations include indemnifying CTI and its affiliates (including Verint after the Verint Merger) against liabilities relating to the Company's business; claims by any shareholder or creditor of CTI related to the Share Distribution, the Verint Merger or related transactions or disclosure documents; certain claims made by employees or former employees of CTI and any claims made by employees and former employees of the Company (including but not limited to the Israeli optionholder suits discussed in Note 24, Commitments and Contingencies); any failure by the Company to perform under any of the agreements entered into in connection with the Share Distribution; claims related to CTI's ownership or operation of the Company; claims related to the Starhome Disposition (as defined in Note 24, Commitments and Contingencies); certain retained liabilities of CTI that are not reflected on or reserved against on the net worth statement delivered by CTI at the closing of the Verint Merger; and claims arising out of the exercise of appraisal rights by a CTI shareholder in connection with the Share Distribution. On February 4, 2013, in connection with the closing of the Verint Merger Agreement, CTI placed $25.0 million in escrow to support indemnification claims to the extent made against the Company by Verint and any cash balance remaining in such escrow fund 18 months after the closing of the Verint Merger, less any claims made on or prior to such date, to be released to the Company. The escrow funds could not be used for claims related to the Israeli optionholder suits. On August 6, 2014, the escrow was released in accordance with its terms and the Company received the escrow amount of approximately $25.0 million. The Company also assumed all pre-Share Distribution tax obligations of each of the Company and CTI.
The Company and CTI entered into a tax disaffiliation agreement that governs their respective rights, responsibilities and obligations after the Share Distribution with respect to tax liabilities and benefits, tax attributes, tax contests and other tax matters regarding income taxes, other taxes and related tax returns. The Company and CTI also entered into an employee matters agreement, which allocates liabilities and responsibilities relating to employee compensation and benefit plans and programs.
F-25
4. | INVENTORIES |
Inventories consist of the following:
January 31, | |||||||
2016 | 2015 | ||||||
(In thousands) | |||||||
Raw materials | $ | 7,388 | $ | 10,455 | |||
Work in process | 2,999 | 7,362 | |||||
Finished goods | — | — | |||||
$ | 10,387 | $ | 17,817 | ||||
5. | PROPERTY AND EQUIPMENT, NET |
Property and equipment, net consist of:
January 31, | ||||||||
2016 | 2015 | |||||||
(In thousands) | ||||||||
Lab equipment | $ | 44,330 | $ | 47,973 | ||||
Technology equipment | 35,367 | 33,349 | ||||||
Software | 23,644 | 24,382 | ||||||
Leasehold improvements | 30,631 | 26,766 | ||||||
Production equipment | 3,590 | 3,492 | ||||||
Furniture and fixtures | 7,770 | 4,547 | ||||||
145,332 | 140,509 | |||||||
Less accumulated depreciation and amortization | (106,862 | ) | (100,287 | ) | ||||
Total | $ | 38,470 | $ | 40,222 | ||||
Depreciation and amortization expense of property and equipment was $13.5 million, $13.9 million and $12.5 million for the fiscal years ended January 31, 2016, 2015 and 2014, respectively. The Company also wrote off and disposed of unappreciated assets, primarily property and equipment, net of $0.6 million, $0.8 million and $0.2 million during the fiscal years ended January 31, 2016, 2015 and 2014, respectively, recorded in "Selling, general and administrative" in the consolidated statements of operations.
In December 2014, the Company commenced the lease of approximately 218,912 square feet of office space in Ra'anana, Israel to replace its then-existing office space in Tel Aviv, Israel (see Note 23, Leases). During the fiscal years ended January 31, 2016 and 2015, the Company incurred leasehold improvement of approximately $2.7 million and $12.1 million, respectively, for its new facility in Ra'anana, Israel.
F-26
6. | GOODWILL |
The changes in the carrying amount of goodwill for the fiscal years ended January 31, 2016, 2015 and 2014 are as follows:
Total | |||
For the Year Ended January 31, 2014 | |||
Goodwill, gross at January 31, 2013 | $ | 222,450 | |
Accumulated impairment losses at January 31, 2013 (1) | (156,455 | ) | |
Goodwill, net, at January 31, 2013 | 65,995 | ||
Effect of changes in foreign currencies and other | 158 | ||
Goodwill, net, at January 31, 2014 | $ | 66,153 | |
For the Year Ended at January 31, 2015 | |||
Goodwill, gross, at January 31, 2014 | 222,608 | ||
Accumulated impairment losses at January 31, 2014 | (156,455 | ) | |
Goodwill, net, at January 31, 2014 | 66,153 | ||
Goodwill acquired with the purchase of Solaiemes (2) | 2,053 | ||
Effect of changes in foreign currencies and other | (688 | ) | |
Goodwill, net, at January 31, 2015 | $ | 67,518 | |
For the Year Ended at January 31, 2016 | |||
Goodwill, gross, at January 31, 2015 | 223,973 | ||
Accumulated impairment losses at January 31, 2015 | (156,455 | ) | |
Goodwill, net, at January 31, 2015 | 67,518 | ||
Acision acquisition (3) | 186,600 | ||
Effect of changes in foreign currencies and other | (299 | ) | |
Goodwill, net, at January 31, 2016 | $ | 253,819 | |
Balance at January 31, 2016 | |||
Goodwill, gross, at January 31, 2016 | $ | 410,274 | |
Accumulated impairment losses at January 31, 2016 | (156,455 | ) | |
Goodwill, net, at January 31, 2016 | $ | 253,819 | |
(1) | The goodwill associated with Netcentrex, was impaired during the fiscal year ended January 31, 2009 and prior fiscal years. |
(2) | The resulting amount of goodwill reflects the value of the additional functionality added to the Company's Evolved Communications Suite product offering that management believes distinguishes the Company technologically in competitive bids. |
(3) | Reflects the Acquisition of Acision completed on August 6, 2015 (see Note 16, Acquisitions). |
The Company tests goodwill for impairment annually as of November 1 or more frequently if events or circumstances indicate the potential for an impairment exists. Under the Company's segment structure prior to the Asset Sale, the BSS and Digital Services segments have been evaluated and it has been determined that for each segment the fair value significantly exceeds the book value.
As a result of the Amdocs Purchase Agreement for the sale the BSS Business, the Company performed an interim goodwill test in conjunction with the preparation of its financial statements for the three months ended April 30, 2015.
The determination of whether or not goodwill is impaired involves a significant level of judgment in the assumptions underlying the approaches used to determine the estimated fair value of the Company’s reporting units as well as the allocation of the carrying value of the assets and liabilities to each of the reporting units which has historically been based on headcount. Management believes the analysis included sufficient tolerance for sensitivity in key assumptions. The determination of the fair value of the Company’s reporting units include a market-based approach using multiples of comparable companies to determine the fair value of its reporting units and an income-based approach using projected discounted cash flows based on the Company’s internal forecasts and projections. Management believes the assumptions and rates used in the Company’s
F-27
impairment assessment are reasonable, but they are judgmental, and variations in any assumptions could result in materially different calculations of fair value and potentially result in impairment of assets.
Digital Services Reporting Unit
Step one of the quantitative goodwill impairment interim test for the three months ended April 30, 2015, resulted in the determination that the estimated fair value of Digital Services exceeded its carrying amount, including goodwill; however a step two analysis was performed on the reporting unit due to the negative carrying value of continuing assets and liabilities following the classification of BSS as an asset held for sale. The fair value of the goodwill as calculated under step two of the impairment test exceeded the carrying value as recorded.
The Company completed its annual review for impairment as of November 1, 2015, using a market based approach in determining fair value, which did not result in an impairment.
7. | INTANGIBLE ASSETS, NET |
Intangible assets, net are as follows:
January 31, | ||||||||||
Useful Life | 2016 | 2015 | ||||||||
(In thousands) | ||||||||||
Gross carrying amount: | ||||||||||
Acquired technology | 5 to 10 years | $ | 56,012 | $ | 1,833 | |||||
Customer relationships | 15 years | 146,382 | — | |||||||
Backlog | 1 to 2 years | 21,192 | — | |||||||
Leasehold interest | 2 to 5 years | 921 | — | |||||||
Total Intangible Assets | 224,507 | 1,833 | ||||||||
Accumulated amortization: | ||||||||||
Acquired technology | 9,805 | 175 | ||||||||
Customer relationships | 743 | — | ||||||||
Backlog | 11,877 | — | ||||||||
Lease contracts | 98 | — | ||||||||
Total accumulated amortization | 22,523 | 175 | ||||||||
Total (1) | $ | 201,984 | $ | 1,658 | ||||||
(1) Reflects an increase in intangible assets due to the acquisition of Acision completed on August 6, 2015 (see Note 16, Acquisition).
Amortization of intangible assets from continuing operations was $22.5 million and $0.2 million for the fiscal years ended January 31, 2016 and 2015, respectively. In connection with its testing of goodwill for impairment, the Company also tested long-lived assets, including finite-lived intangible assets. The Company did not record an impairment charge related to finite-lived intangible assets for the fiscal years ended January 31, 2016, 2015 and 2014.
Estimated future amortization expense on finite-lived acquisition-related assets for each of the succeeding fiscal years is as follows:
Fiscal Years Ending January 31, | (In thousands) | |||
2017 | $ | 26,980 | ||
2018 | 25,020 | |||
2019 | 22,232 | |||
2020 | 18,868 | |||
2021 and thereafter | 108,884 | |||
$ | 201,984 | |||
F-28
8. | OTHER ASSETS |
Other assets consisted of the following:
January 31 | ||||||||
2016 | 2015 | |||||||
(In thousands) | ||||||||
Severance pay fund (1) | $ | — | $ | 18,008 | ||||
Deposits | 2,739 | 2,776 | ||||||
Other (2) | 3,752 | 918 | ||||||
$ | 6,491 | $ | 21,702 | |||||
(1) | Represents deposits into insurance policies to fund severance liability of the Company's Israeli employees. As a result of entering into a MSA with Tech Mahindra and changes to the benefits policy for employees in Israel during the fiscal year ended January 31, 2016, the Company re-classified its severance pay long-term assets to Other current assets (see Note 14, Other Long-Term Liabilities). |
(2) | Includes a $1.2 million cost-method investment in a subsidiary of a significant customer as of each of January 31, 2016 and 2015. |
9. | ACCOUNTS PAYABLE AND ACCRUED EXPENSES |
Accounts payable and accrued expenses consist of the following:
January 31, | ||||||||
2016 | 2015 | |||||||
(In thousands) | ||||||||
Accrued compensation and benefits | $ | 20,457 | $ | 17,209 | ||||
Accounts payable | 31,402 | 32,162 | ||||||
Accrued legal, audit and professional fees | 3,083 | 2,598 | ||||||
Accrued taxes-other than income taxes | 37,013 | 16,191 | ||||||
Accrued commissions | 3,314 | 6,220 | ||||||
Accrued outside services-contractors | 14,099 | 8,148 | ||||||
Accrued workforce reduction and restructuring | 4,773 | 4,869 | ||||||
Accrued travel and entertainment | 352 | 862 | ||||||
Other accrued expenses (1) | 21,146 | 10,906 | ||||||
$ | 135,639 | $ | 99,165 | |||||
(1) | Includes liabilities related to the Company’s 401(k) Plans. |
The Company maintains a 401(k) plan for its full-time employees. These plans allow eligible employees to elect to contribute up to 60% of their annual compensation, subject to the prescribed maximum amount. The Company matches employee contributions at a rate of 50%, limited to a maximum annual matched contribution of $2,000 per employee. Employee contributions are always fully vested. The continuing eligibility requirement to receive employer matching contribution is that an employee be employed on the last day of the calendar year. Participants age 50 or greater at any time during the year may contribute up to 100% of their eligible compensation.
The Company’s matching contributions for each year vest on the last day of the calendar year providing the employee remains employed with the Company on that day. The Company’s matching contributions to the 401(k) plan amounted to $0.1 million, $0.3 million and $0.4 million for each of the fiscal years ended January 31, 2016, 2015 and 2014, respectively.
10. | RESTRUCTURING |
The Company reviews its business, manages costs and aligns resources with market demand and in conjunction with various acquisitions. As a result, the Company has taken several actions to improve its cash position, reduce fixed costs, eliminate redundancies, strengthen operational focus and better position itself to respond to market pressures or unfavorable economic conditions. Restructuring expenses are recorded within Other operating expenses in the consolidated statements of operations.
F-29
2015 Initiatives
During the fiscal year ended January 31, 2016, the Company approved the commencement of a restructuring plan primarily in connection with the MSA with Tech Mahindra, the BSS Business sale and the acquisition of Acision which primarily includes a reduction of workforce included in cost of revenue, research and development and selling, general and administrative expenses. The aggregate cost of the plan is currently estimated at $27.2 million and $0.9 million in severance and facilities-related costs, respectively, which is expected to be paid by July, 2016 and December, 2024, respectively. During the fiscal year ended January 31, 2016, the Company recorded severance-related and facilities-related costs of $29.3 million and $1.0 million, respectively, and paid $24.0 million and $0.5 million respectively.
2014 Initiatives
During the fiscal year ended January 31, 2015, the Company commenced certain initiatives with a plan to further restructure its operations towards aligning operating costs and expenses with anticipated revenue. On September 9, 2014, the Company commenced an expansion of its previously disclosed 2014 restructuring plan. The restructuring plan has been facilitated by efficiencies gained through initiatives implemented in recent fiscal periods and the expectation that software will account for a higher portion of the Company's revenue in future periods. The restructuring is designed to align operating costs and expenses with currently anticipated revenue. The restructuring plan (as expanded) includes a reduction of workforce included in cost of revenue, research and development and selling, general and administrative expenses. During the fiscal year ended January 31, 2016, the Company paid severance and facilities-related costs of $2.3 million and $1.0 million, respectively. The remaining facilities-related costs accrued under the plan are expected to be paid by December, 2024.
Fourth Quarter 2012 Initiatives
During the fourth quarter of fiscal year ended January 31, 2013, following the Share Distribution, the Company commenced certain initiatives to restructure its operations and reorganize its activities and go-to-market strategy, including a plan to restructure the operations of the Company with a view towards aligning operating costs and expenses with anticipated revenue and the new go-to-market strategy. During the fiscal year ended January 31, 2016, the Company paid facilities-related costs of $1.0 million. The remaining facilities-related costs accrued under the plan are expected to be paid by October, 2019.
Third Quarter 2010 Restructuring Initiatives and Business Transformation
During the fiscal year ended January 31, 2011, the Company commenced certain initiatives to improve its cash position, including a plan to restructure its operations with a view towards aligning operating costs and expenses with anticipated revenue, reducing its annualized operating costs. During the fiscal year ended January 31, 2012, the Company implemented a second phase of measures (the “Phase II Business Transformation”) that focuses on process reengineering to maximize business performance, productivity and operational efficiency. As part of the Phase II Business Transformation, the Company restructured its operations into new business units that are designed to improve operational efficiency and business performance. One of the primary purposes of the Phase II Business Transformation is to solidify the Company’s leadership in BSS and leverage the growth in mobile data usage, while maintaining its leading market position in Digital Services and implementing further cost savings through operational efficiencies and strategic focus. The remaining facilities-related costs accrued under this plan are expected to be paid by April 2016.
F-30
The following table represent a roll forward of the workforce reduction and restructuring activities noted above:
2015 Initiative | 2014 Initiative | Fourth Quarter 2012 Initiative | 2010 and 2011 Initiatives | ||||||||||||||||||||||||||||||||
Severance-Related | Facilities-Related | Severance-Related | Facilities-Related | Severance-Related | Facilities-Related | Severance-Related | Facilities-Related | Total | |||||||||||||||||||||||||||
(In thousands) | |||||||||||||||||||||||||||||||||||
January 31, 2013 | $ | — | $ | — | $ | — | $ | — | $ | 3,713 | $ | 885 | $ | 212 | $ | 829 | $ | 5,639 | |||||||||||||||||
Expenses (1) | — | — | — | — | 7,086 | 5,259 | (126 | ) | 10 | 12,229 | |||||||||||||||||||||||||
Change in assumptions (1) | — | — | — | — | (1,702 | ) | 171 | — | 85 | (1,446 | ) | ||||||||||||||||||||||||
Translation adjustments and other (2) | — | — | — | — | 62 | 997 | (5 | ) | (8 | ) | 1,046 | ||||||||||||||||||||||||
Paid or utilized | — | — | — | — | (8,097 | ) | (1,584 | ) | (31 | ) | (511 | ) | (10,223 | ) | |||||||||||||||||||||
January 31, 2014 | $ | — | $ | — | $ | — | $ | — | $ | 1,062 | $ | 5,728 | $ | 50 | $ | 405 | $ | 7,245 | |||||||||||||||||
Expenses (1) | — | — | 13,014 | 2,366 | 106 | 173 | — | 18 | 15,677 | ||||||||||||||||||||||||||
Change in assumptions (1) | — | — | (70 | ) | (105 | ) | (82 | ) | (493 | ) | (47 | ) | (11 | ) | (808 | ) | |||||||||||||||||||
Translation adjustments and other (2) | — | — | — | 14 | (14 | ) | — | (1 | ) | (2 | ) | (3 | ) | ||||||||||||||||||||||
Paid or utilized | — | — | (10,101 | ) | (438 | ) | (1,072 | ) | (2,536 | ) | (2 | ) | (196 | ) | (14,345 | ) | |||||||||||||||||||
January 31, 2015 | $ | — | $ | — | $ | 2,843 | $ | 1,837 | $ | — | $ | 2,872 | $ | — | $ | 214 | $ | 7,766 | |||||||||||||||||
Expenses (1) | 29,291 | 966 | 50 | 634 | — | 242 | — | 19 | 31,202 | ||||||||||||||||||||||||||
Change in assumptions (1) | (2,119 | ) | (29 | ) | (558 | ) | (1,125 | ) | — | 63 | — | (4 | ) | (3,772 | ) | ||||||||||||||||||||
Translation adjustments and other (2) | (39 | ) | (3 | ) | — | — | — | — | — | — | (42 | ) | |||||||||||||||||||||||
Paid or utilized | (23,954 | ) | (536 | ) | (2,322 | ) | (962 | ) | — | (953 | ) | — | (192 | ) | (28,919 | ) | |||||||||||||||||||
January 31, 2016 (3) | $ | 3,179 | $ | 398 | $ | 13 | $ | 384 | $ | — | $ | 2,224 | $ | — | $ | 37 | $ | 6,235 | |||||||||||||||||
(1) | Includes restructuring expense associated with BSS employees of $14.7 million, $2.8 million and $0.9 million for the fiscal years ended January 31, 2016, 2015 and 2014, respectively. |
(2) | Includes deferred rent liability balance for restructured facilities. |
(3) | Includes restructuring liability relating to the BSS Business sale of $1.3 million as of January 31, 2016. |
11. | DEBT |
Spanish Government Sponsored Loans
On August 1, 2014, the Company assumed in connection with the acquisition of Solaiemes approximately $0.1 million and $1.3 million of short-term and long-term debt, respectively. The debt consists of Spain government sponsored loans extended for research and development projects. The loans are subject to certain acceleration clauses which are not considered probable.
Acision Indebtedness
In connection with the of Acision acquisition, Acision, in consultation with the Company, entered into the previously disclosed Amendment with the requisite lenders under the Acision Credit Agreement governing Acision’s existing approximately $156.0 million senior credit facility, which Amendment became effective upon completion of the Acquisition on August 6, 2015 (see Note 5 Acquisition).
F-31
The loan commenced on December 15, 2014, and accrues interest at 10.75% (9.75% plus Libor) payable quarterly. Capital repayments are also payable quarterly; 1.25% of the outstanding principal amount of the loan per quarter in 2015, 1.875% of the outstanding principal amount of the loan per quarter in 2016 and 2.5% of the outstanding principal amount of the loan per quarter in 2017 and 2018. The remaining balance is due for repayment on December 15, 2018.
The Acision Credit Agreement contains customary representations and warranties and affirmative, restrictive and financial covenants. These provisions, with certain exceptions, restrict Acision’s ability and the ability of its subsidiaries to (i) incur additional indebtedness, (ii) create, incur, assume or permit to exist any liens, (iii) enter into mergers, consolidations or similar transactions, (iv) make investments and acquisitions, (v) make certain dispositions of assets, (vi) make dividends, distributions and prepayments of certain indebtedness, and (vii) enter into certain transactions with affiliates. The Acision Credit Agreement also contains customary events of default, including, among other things, non-payment defaults, covenant defaults, material adverse effect defaults, bankruptcy and insolvency defaults and material judgment default.
The Acision Credit Agreement provides for customary events of default with corresponding grace periods, including failure to pay principal or interest under the new credit agreement when due, failure to comply with covenants, any representation or warranty made by Acision proving to be inaccurate in any material respect, a change of control (which was triggered by the acquisition of Acision and waived by the requisite lenders in the aforementioned amendment). Upon an event of default, all of Acision's indebtedness under the Acision Credit Agreement may be declared immediately due and payable, and the lenders' commitments to provide loans under the Acision Credit Agreement may be terminated.
The Acision Credit Agreement also contains a number of affirmative reporting and operational covenants, including a requirement to submit consolidated financial statements to the lenders within certain periods after the end of each fiscal year and quarter. . On May 13, 2016, the Company entered into an amendment agreement with the requisite lenders to extend the period requirement to submit consolidated financial statements for the fiscal year ended December 31, 2015 and for the three months ended March 31, 2016 to July 5, 2016.
The Acision Credit Agreement also contains a financial covenant that requires Acision to maintain under IFRS a Consolidated Debt to Consolidated Earnings before Interest, Taxes, Depreciation and Amortization (or Consolidated EBITDA) (all of the foregoing as defined in the Acision Credit Agreement) leverage ratio measured quarterly of no greater than 3.75 to 1. At the last covenant reporting date, December 31, 2015, Acision was in compliance with the financial covenant under IFRS and its consolidated leverage ratio was approximately 3.25 to 1.
As of January 31, 2016 and 2015, the balance of total outstanding debt is as follows:
January 31, | |||||||
(In thousands) | 2016 | 2015 | |||||
Acision debt: | |||||||
10.75% notes due 2018 | 152,000 | — | |||||
Solaiemes debt: | |||||||
3.98% note due 2017 | $ | 159 | $ | 216 | |||
0.53% note due 2018 | 300 | 312 | |||||
2.48% notes due 2018 | 81 | 118 | |||||
3.95% note due 2020 | 81 | 84 | |||||
0% note due 2022 | 337 | 400 | |||||
152,958 | 1,130 | ||||||
Less: current portion | 12,248 | 132 | |||||
Long-term debt | $ | 140,710 | $ | 998 | |||
Aggregate debt maturities for each of the succeeding fiscal years are as follows:
Fiscal Years Ending January 31, | (In thousands) | |||
2017 | $ | 12,248 | ||
2018 | 16,251 | |||
2019 | 124,238 | |||
2020 | 67 | |||
2021 and thereafter | 153 | |||
$ | 152,958 | |||
F-32
Xura Ltd. Lines of Credit
As of January 31, 2016 and 2015, Xura Ltd., the Company’s wholly-owned Israeli subsidiary, had a $17.0 million and 25.0 million, respectively, line of credit with a bank to be used for various performance guarantees to customers and vendors, letters of credit and foreign currency transactions in the ordinary course of business. During the fiscal year ended January 31, 2016, Xura Ltd. decreased the line of credit from $25.0 million to $17.0 million with a corresponding decrease in the cash balances Xura Ltd. is required to maintain with the bank to $17.0 million. This line of credit is not available for borrowings. The line of credit bears no interest and is subject to renewal on an annual basis. Xura Ltd. is required to maintain cash balances with the bank of no less than the capacity under the line of credit at all times regardless of amounts utilized under the line of credit. As of January 31, 2016 and 2015, Xura Ltd. had utilized $10.3 million and $19.5 million, respectively, of capacity under the line of credit for guarantees and foreign currency transactions.
As of January 31, 2016 and 2015, Xura Ltd. had an additional line of credit with a bank for $5.0 million and $10.0 million, respectively, to be used for borrowings, various performance guarantees to customers and vendors, letters of credit and foreign currency transactions in the ordinary course of business. During the fiscal year ended January 31, 2016, Xura Ltd. decreased the line of credit from $10.0 million to $5.0 million with a corresponding decrease in the cash balances Xura Ltd. is required to maintain with the bank to $5.0 million. Borrowings under the line of credit bear interest at an annual rate of London Interbank Offered Rate (“LIBOR”) plus a variable margin determined based on the bank’s underlying cost of capital. Xura Ltd. is required to maintain cash balances with the bank of no less than the capacity under the line of credit at all times regardless of amounts borrowed or utilized under the line of credit. As of January 31, 2016 and 2015, Xura Ltd. had no outstanding borrowings under the line of credit. As of January 31, 2016 and 2015, Xura Ltd. had utilized $3.7 million and $6.8 million, respectively, of capacity under the line of credit for guarantees and foreign currency transactions.
Other than Xura Ltd.’s requirement to maintain cash balances with the banks as discussed above, the lines of credit have no financial covenants. These cash balances required to be maintained with the banks were classified as “Restricted cash and bank deposits” and “Long-term restricted cash” included within the consolidated balance sheets as of January 31, 2016 and 2015.
12. | DERIVATIVES AND FINANCIAL INSTRUMENTS |
The Company entered into derivative arrangements to manage a variety of risk exposures during the fiscal years ended January 31, 2016, 2015 and 2014, including foreign currency risk related to forecasted foreign currency denominated payroll costs. The Company assesses the counterparty credit risk for each party prior to entering into its derivative financial instruments and in valuing the derivative instruments for the periods presented.
Forward Contracts
During the fiscal years ended January 31, 2016, 2015 and 2014, the Company entered into a series of short-term foreign currency forward contracts to limit the variability in exchange rates between the U.S. dollar (the “USD”) and the new Israeli shekel (“NIS”) to hedge probable cash flow exposure from expected future payroll expense. The transactions qualified for cash flow hedge accounting under the FASB’s guidance and there was no hedge ineffectiveness. Accordingly, the Company recorded all changes in fair value of the forward contracts as part of other comprehensive (loss) income in the consolidated statement of comprehensive loss. Such amounts are reclassified to the consolidated statements of operations when the effects of the item being hedged are recognized. The Company’s derivatives outstanding as of January 31, 2015 were short-term in nature and were due to contractually settle within the next twelve months. There were no outstanding currency forward contract as of January 31, 2016.
The following tables summarize the Company’s derivative positions and their respective fair values:
January 31, 2015 | ||||||||||
Type of Derivative | Notional Amount | Balance Sheet Classification | Fair Value | |||||||
(In thousands) | ||||||||||
Liabilities | ||||||||||
Derivatives designated as hedging instruments | ||||||||||
Short-term foreign currency forward | $ | 31,123 | Other current liabilities | $ | 117 | |||||
F-33
The following tables summarize the Company’s classification of gains and losses from continuing operations on derivative instruments:
January 31, 2016 | ||||||||||||
Gain (Loss) | ||||||||||||
Type of Derivative | Recognized in Other Comprehensive (Loss) Income | Reclassified from Accumulated Other Comprehensive Income into Statement of Operations (1) | Recognized in foreign currency transaction gain (loss), net | |||||||||
(In thousands) | ||||||||||||
Derivatives designated as hedging instruments | ||||||||||||
Foreign currency forward | $ | 261 | $ | 144 | $ | — | ||||||
Total | $ | 261 | $ | 144 | $ | — | ||||||
January 31, 2015 | ||||||||||||
Gain (Loss) | ||||||||||||
Type of Derivative | Recognized in Other Comprehensive (Loss) Income | Reclassified from Accumulated Other Comprehensive Income into Statement of Operations (1) | Recognized in foreign currency transaction gain (loss), net | |||||||||
(In thousands) | ||||||||||||
Derivatives designated as hedging instruments | ||||||||||||
Foreign currency forward | $ | (978 | ) | $ | (803 | ) | $ | — | ||||
Total | $ | (978 | ) | $ | (803 | ) | $ | — | ||||
January 31, 2014 | ||||||||||||
Gain (Loss) | ||||||||||||
Type of Derivative | Recognized in Other Comprehensive (Loss) Income | Reclassified from Accumulated Other Comprehensive Income into Statement of Operations (1) | Recognized in foreign currency transaction gain (loss), net | |||||||||
(In thousands) | ||||||||||||
Derivatives designated as hedging instruments | ||||||||||||
Foreign currency forward | $ | 768 | $ | 1,185 | $ | — | ||||||
Total | $ | 768 | $ | 1,185 | $ | — | ||||||
(1) | Amounts reclassified from accumulated other comprehensive income (“OCI”) into the statement of operations are classified in foreign currency transaction gain (loss), net. |
There were no gains or losses from ineffectiveness of these hedges recorded for the fiscal years ended January 31, 2016, 2015 and 2014.
F-34
The components of OCI related to cash flow hedges are as follows:
Fiscal Years Ended January 31, | ||||||||||||
2016 | 2015 | 2014 | ||||||||||
(In thousands) | ||||||||||||
Accumulated OCI related to cash flow hedges, beginning of the year | $ | (117 | ) | $ | 58 | $ | 475 | |||||
Unrealized gains (losses) on cash flow hedges | 261 | (978 | ) | 768 | ||||||||
Reclassification adjustment | (144 | ) | 803 | (1,185 | ) | |||||||
Changes in accumulated OCI on cash flow hedges, before tax(1) | 117 | (175 | ) | (417 | ) | |||||||
Changes in accumulated OCI on cash flow hedges | 117 | (175 | ) | (417 | ) | |||||||
Accumulated OCI related to cash flow hedges, end of the year | $ | — | $ | (117 | ) | $ | 58 | |||||
(1) | There was no tax impact on OCI related to cash flow hedges for the fiscal years ended January 31, 2016, 2015 and 2014. |
The amounts reclassified out of accumulated other comprehensive (loss) income into the consolidated statements of operations for continuing operations, with presentation location, loss (gain) were as follows:
Fiscal Years Ended January 31, | |||||||||||
2016 | 2015 | 2014 | |||||||||
(In thousands) | |||||||||||
Cost of revenue | $ | (52 | ) | $ | 350 | $ | (602 | ) | |||
Research and development, net | (16 | ) | 141 | (186 | ) | ||||||
Selling, general and administrative | (76 | ) | 312 | (397 | ) | ||||||
Total | $ | (144 | ) | $ | 803 | $ | (1,185 | ) | |||
13. | FAIR VALUE MEASUREMENTS |
Assets and Liabilities Measured at Fair Value on a Recurring Basis
The fair value of financial instruments is estimated by the Company, using available market information and appropriate valuation methodologies. However, considerable judgment is required in interpreting market data to develop the estimates of fair value. Accordingly, the estimates presented herein are not necessarily indicative of the amounts that the Company could realize in a market exchange. The use of different market assumptions and/or estimation methodologies may have a material effect on the estimated fair value amounts.
Commercial paper. The Company uses quoted prices for similar assets and liabilities.
Money Market Funds. The Company values these assets using quoted market prices for such funds.
Derivative assets. The fair value of derivative instruments is based on quotes or data received from counterparties and third party financial institutions. These quotes are reviewed for reasonableness by discounting the future estimated cash flows under the contracts, considering the terms and maturities of the contracts and markets rates for similar contracts using readily observable market prices thereof.
The following tables present financial instruments according to the fair value hierarchy as defined by the FASB’s guidance:
Financial Assets and Liabilities Measured at Fair Value on a Recurring Basis as of
January 31, 2016 | |||||||||||||||
Quoted Prices to Active Markets for Identical Instruments (Level 1) | Significant Other Observable Inputs (Level 2) | Significant Unobservable Inputs (Level 3) | Fair Value | ||||||||||||
(In thousands) | |||||||||||||||
Financial Assets: | |||||||||||||||
Money market funds (1) | $ | 10,403 | $ | — | $ | — | $ | 10,403 | |||||||
F-35
January 31, 2015 | |||||||||||||||
Quoted Prices to Active Markets for Identical Instruments (Level 1) | Significant Other Observable Inputs (Level 2) | Significant Unobservable Inputs (Level 3) | Fair Value | ||||||||||||
(In thousands) | |||||||||||||||
Financial Assets: | |||||||||||||||
Money market funds (1) | 20,401 | — | — | 20,401 | |||||||||||
$ | 20,401 | $ | — | $ | — | $ | 20,401 | ||||||||
Financial Liabilities: | |||||||||||||||
Derivative liability | $ | — | $ | 117 | $ | — | $ | 117 | |||||||
$ | — | $ | 117 | $ | — | $ | 117 | ||||||||
(1) | Money market funds are classified in “Cash and cash equivalents” within the consolidated balance sheet. |
Assets and Liabilities Not Measured at Fair Value on a Recurring Basis
In addition to assets and liabilities that are measured at fair value on a recurring basis, the Company also measures certain assets and liabilities at fair value on a nonrecurring basis. The Company measures non-financial assets, classified within Level 3 of the fair value hierarchy, including goodwill, intangible assets and property and equipment, at fair value when there is an indication of impairment. These assets are recorded at fair value only when an impairment expense is recognized. The Company has elected not to apply the fair value option for non-financial assets and non-financial liabilities. For further details regarding impairment reviews, see Note 1, Organization, Business and Summary of Significant Accounting Policies.
The carrying amounts of cash and cash equivalents, restricted cash and bank deposits, accounts receivable and accounts payable are reasonable estimates of their fair value.
14. | OTHER LONG-TERM LIABILITIES |
Other long-term liabilities consisted of the following:
January 31, | |||||||
2016 | 2015 | ||||||
(In thousands) | |||||||
Liability for severance pay | $ | 742 | $ | 24,732 | |||
Tax contingencies | 77,503 | 85,782 | |||||
Long-term contingencies | 22,442 | 3,591 | |||||
Other long-term liabilities | 6,498 | 8,960 | |||||
Total | $ | 107,185 | $ | 123,065 | |||
Under Israeli law, the Company is obligated to make severance payments under certain circumstances to employees of its Israeli subsidiaries hired prior to January 2011 on the basis of each individual’s current salary and length of employment. The Company’s liability for severance pay is calculated pursuant to Israel’s Severance Pay Law based on the most recent monthly salary of the employee multiplied by the number of years of employment, as of the balance sheet date. The liability for severance pay is recognized as compensation benefits in the consolidated statements of operations. Employees are entitled to one month’s salary for each year of employment or a portion thereof. The Company records the obligation as if it was payable at each balance sheet date. A portion of such severance liability is funded by monthly deposits into insurance policies, which are restricted to only be used to satisfy such severance payments. Any change in the fair value of the asset is recognized as an adjustment to compensation expense in the consolidated statements of operations. The asset and liability are recognized gross and not offset on the consolidated balance sheet. Upon involuntary termination, employees will receive the balance from deposited funds from the insurance policies with the remaining balance paid by the Company. For voluntarily termination the employees are entitled, based on Company's policy, to the balance in the deposited funds. Any remaining net liability balance is reversed as compensation benefits in the consolidated statements of operations.
F-36
For employees in Israel hired after January 2011, under Israeli law, the Company makes regular deposits with certain insurance companies for accounts controlled by each applicable employee in order to secure the employee's rights upon termination. The Company is relieved from any severance pay liability with respect to deposits made on behalf of each employee. As such, the severance plan is only defined by the monthly contributions made by the Company, the liability accrued in respect of these employees and the amounts funded are not reflected in the Company's balance sheets. The portion of liability not funded is included in Other long-term liabilities in the consolidated balance sheets.
A portion of such severance liability is funded by monthly deposits into insurance policies, which are restricted to only be used to satisfy such severance payments. The amount of deposits is classified in “Other assets” within the consolidated balance sheets as severance pay fund in the amount of $18.0 million as of January 31, 2015.
During the fiscal year ended January 31, 2016, the Company changed its benefits policy for employees in Israel and began funding the insurance policies at levels covering the full severance liability and funding the insurance policies for all previously unfunded accrued severance liability. Upon deposit of 100% of the severance liability with the insurance companies, the Company was relieved from any severance pay liability with respect to deposits made on behalf of each employee.
Severance pay expenses for continuing and discontinued operations pursuant to Israel’s Severance Pay Law were as follows:
Fiscal Years Ended January 31, | ||||||||||||
2016 | 2015 | 2014 | ||||||||||
(In thousands) | ||||||||||||
Increase due to passage of time | $ | 1,212 | $ | 3,702 | $ | 4,794 | ||||||
Increase due to salary increase | 655 | 783 | 1,370 | |||||||||
Reversal due to voluntary termination of employee | (399 | ) | (591 | ) | (1,046 | ) | ||||||
Gain from increase in fund value | (144 | ) | (295 | ) | (1,410 | ) | ||||||
Total operating expense due to Israeli Severance Law | $ | 1,324 | $ | 3,599 | $ | 3,708 | ||||||
15. | STOCK-BASED COMPENSATION |
2012 Stock Incentive Compensation Plan
In October 2012, in connection with the Share Distribution the Company adopted the 2012 Stock Incentive Compensation Plan, which was amended and restated in June 2015 (as amended, the "2012 Incentive Plan"). The 2012 Incentive Plan provides for the issuance of non-qualified stock options, incentive stock options, stock appreciation rights, restricted stock, performance-based compensation awards, and other stock-based awards (referred to collectively as the "Awards") based on shares of the Company's common stock (referred to as "Shares"). The Company's employees, non-employee directors and consultants as well as employees and consultants of its subsidiaries and affiliates are eligible to receive Awards. In June 2015, the Company registered additional shares under the 2012 Incentive Plan in connection with its amendment and restatement.
A total of 5.0 million Shares were reserved for issuance under future Awards to be granted under the 2012 Incentive Plan following the effective date of the plan (referred to as the "Future Awards"). As of January 31, 2016, an aggregate of 3.0 million Future Awards are available for grant under the plan.
The 2012 Incentive Plan is scheduled to terminate in October 2022. Options will be designated as either non-qualified stock options or incentive stock options. An option granted as an incentive stock option will, to the extent it fails to qualify as an incentive stock option, be treated as a non-qualified option. The exercise price of an option, either incentive stock option or non-qualified stock options, may not be less than the fair market value of underlying shares on the date of grant, except for individuals who hold a 10% or more interest in the Company, for whom the exercise price of any Future Award may not be less than 110% of the share price. The term of each option may not exceed ten years (or, in the case of an incentive stock option granted to a 10% shareholder, five years). The maximum number of shares with respect to which any options may be granted to any grantee in any consecutive twelve (12) month period shall be 300,000 shares. In addition, the maximum number of shares with respect to which any stock appreciation rights may be granted to any grantee in any consecutive twelve (12) month period shall be 300,000 shares. The maximum amount of compensation under an award that is intended to constitute “qualified performance-based compensation” within the meaning of Section 162(m) of the Internal Revenue Code (“Performance-Based Compensation Awards”) (other than options and stock appreciation rights) granted to any grantee in any consecutive twelve (12) month period shall be 150,000 shares and the maximum amount of Performance-Based Compensation Awards granted to any grantee in any consecutive twelve (12) month period shall be $10,000,000 if such Performance-Based Compensation Awards are denominated in cash rather than shares.
F-37
Employee Stock Purchase Plan
In June 2015, the Company adopted the Employee Stock Purchase Plan (“ESPP”). The ESPP authorizes an aggregate of 840,000 Shares to be purchased by eligible employees. The ESPP allows eligible employees to purchase Shares at certain regular purchase dates through payroll deductions of up to a maximum of 15% of the employee’s compensation. The purchase price for each offering period is 85% of the lesser of (a) the fair market value of the Shares on the offering date or (b) the fair market value of the Shares on the purchase date.
During the three months ended January 31, 2016, the Company initiated its first ESPP offering period of three months. Future offering periods will be six month in duration. The fair value of ESPP shares was estimated using the Black-Scholes option pricing model. ESPP compensation cost is recognized ratably over the term based on employee stock purchases under the plan. The fair value of the employees’ purchase rights under the ESPP was estimated using the following assumptions: dividend yield of 0.0%, expected volatility of 31.7%, risk-free interest rate of 0.21% and expected life of three months. The weighted average fair value of those purchase rights granted was $5.54.
Company Share-Based Awards
Stock-based compensation expense associated with awards included in the Company’s consolidated statements of operations are as follows:
Fiscal Years Ended January 31, | ||||||||||||
2016 | 2015 | 2014 | ||||||||||
(In thousands) | ||||||||||||
Stock options: | ||||||||||||
Service costs | 85 | 279 | 142 | |||||||||
Research and development, net | 229 | 199 | 86 | |||||||||
Selling, general and administrative | 2,417 | 2,237 | 1,430 | |||||||||
2,731 | 2,715 | 1,658 | ||||||||||
Restricted/Deferred stock awards: | ||||||||||||
Service costs | 1,255 | 2,513 | 2,749 | |||||||||
Research and development, net | 540 | 837 | 925 | |||||||||
Selling, general and administrative | 5,231 | 5,303 | 4,876 | |||||||||
7,026 | 8,653 | 8,550 | ||||||||||
ESPP: | ||||||||||||
Service costs | 14 | — | — | |||||||||
Research and development, net | 10 | — | — | |||||||||
Selling, general and administrative | 13 | — | — | |||||||||
37 | — | — | ||||||||||
Total | $ | 9,794 | $ | 11,368 | $ | 10,208 | ||||||
Stock-based compensation expense associated with awards granted includes awards granted to BSS employees of $1.3 million, $2.2 million and $2.2 million, respectively, for the fiscal years ended January 31, 2016, 2015 and 2014.
Restricted Awards and Stock Options
The Company grants restricted stock unit awards and deferred stock unit awards subject to vesting provisions (collectively, “Restricted Awards”) to certain key employees and directors. For the fiscal years ended January 31, 2016, 2015 and 2014, the Company granted Restricted Awards valued at $6.4 million, $9.0 million and $9.8 million, respectively, based on the fair market value of the Company’s common stock on the date of grant. The Company also grants stock options to certain key employees. For the fiscal years ended January 31, 2016, 2015 and 2014, the Company granted stock options valued at $3.3 million, $3.9 million and $3.1 million, respectively, based on the grant date fair value.
Included in the grants of restricted stock awards during the fiscal year ended January 31, 2016, were performance-based awards of restricted stock units covering up to an aggregate of 236,944 shares of common stock. Vesting of the performance-based RSUs in whole or in part was conditioned upon the achievement of performance objective by January 31, 2016 and service requirements of two years for vesting. Partial achievement of performance objectives have been met resulting in the issuance of 53,192 Shares with a grant date fair value of $1.2 million during the three month ended January 31, 2016 and an
F-38
additional 46,809 shares with a modification fair value of $0.9 million during the three month ended April 30, 2016. The remainder of the shares have been forfeited due to prescribed performance milestones not being achieved. There were no performance-based awards granted during the fiscal year ended January 31, 2015.
Performance-based awards of restricted stock units, included in the grants of restricted stock awards, for the issuance of 116,279 shares of common stock, with a fair value of $3.4 million, were granted, during the fiscal year ended January 31, 2014, to certain executive officers and employees of the Company. These grants vested upon achievement of prescribed performance milestones and service requirements of two years from date of grant. During the fiscal year ended January 31, 2014, 34,884 shares were forfeited due to prescribed performance milestones not being achieved. The remainder of the performance shares milestones were achieved during the fiscal years ended January 31, 2015 and 2014.
As of January 31, 2016, 1,384,439 stock options to purchase the Company’s common stock and 492,943 Restricted Awards were outstanding. There were 3,015,859 shares available for future grant under the 2012 Incentive Plan as of January 31, 2016.
The following table presents the combined activity of the Company's stock options:
Outstanding Options | |||||||||||||
Shares | Weighted Average Exercise Price | Weighted Average Remaining Contractual Term ( in years) | Aggregate Intrinsic Value (in millions) | ||||||||||
Balance, January 31, 2015 | 1,056,329 | $ | 27.65 | ||||||||||
Options granted | 600,057 | 21.22 | |||||||||||
Options expired (1) | (11,769 | ) | 58.16 | ||||||||||
Options cancelled (1) | (85,091 | ) | 29.10 | ||||||||||
Options forfeited | (117,103 | ) | 24.79 | ||||||||||
Options exercised | (57,984 | ) | 23.78 | ||||||||||
Balance, January 31, 2016 (2) | 1,384,439 | $ | 24.92 | 7.36 | $ | 0.3 | |||||||
Options exercisable as of January 31, 2016 (3) | 611,731 | $ | 27.68 | 5.13 | $ | — | |||||||
Options expected to vest thereafter (3) | 721,729 | $ | 22.77 | 9.10 | $ | 0.3 | |||||||
(1) | Awards issued under the 5.0 million shares reserved for issuance under the Assumed CTI Awards may not be reissued pursuant to any future awards. During the fiscal year ended January 31, 2016, the number of stock options expired and cancelled under the Assumed CTI Awards were 11,769 and 14,640, respectively. During the fiscal year ended January 31, 2015, the number of stock options expired and cancelled under the Assumed CTI Awards were 10,521 and 16,915, respectively. |
(2) | The outstanding stock options as of January 31, 2016 include 772,706 unvested stock options with a weighted-average modified/grant date fair value of $6.56 per share, an expected term of 4 years and a total fair value of $5.1 million. The unrecognized compensation expense, net of estimated forfeitures, related to the remaining unvested stock options was $3.5 million which is expected to be recognized over a weighted-average period of 1.97 years. The cash received from the exercise of stock options was negligible during the fiscal year ended January 31, 2016. |
(3) | During the fiscal years ended January 31, 2016, 2015 and 2014, 380,465, 235,701, 115,997 shares of stock options vested with a total grant date fair value of $3.5 million, $2.1 million and $1.1 million, respectively. |
F-39
The following table summarizes information about the Company’s stock options:
January 31, 2016 | ||||||||||||||||||
Options Outstanding | Options Exercisable | |||||||||||||||||
Range of Exercise Prices | Options Outstanding | Weighted Average Remaining Contractual Life | Weighted Average Exercise Price | Options Exercisable | Weighted Average Remaining Contractual Life | Weighted Average Exercise Price | ||||||||||||
Below $24.00 | 588,085 | 9.22 | $ | 21.32 | 23,366 | 3.40 | $ | 23.03 | ||||||||||
$24.00 - $28.99 | 540,024 | 6.35 | $ | 26.83 | 389,067 | 5.52 | $ | 27.23 | ||||||||||
$29.00 and Above | 256,330 | 5.20 | $ | 29.11 | 199,298 | 4.57 | $ | 29.09 | ||||||||||
Total | 1,384,439 | 7.36 | $ | 24.91 | 611,731 | 5.13 | $ | 27.68 | ||||||||||
Fair Value Assumptions
The Company estimated the fair value of stock options on the date of grant or modification utilizing the Black-Scholes option valuation model. Assumptions for all grants and significant modifications are detailed below.
The fair value assumptions for stock options granted during the fiscal years ended January 31, 2016, 2015 and 2014, were as follows:
Fiscal Years Ended January 31, | ||||||||||||
2016 | 2015 | 2014 | ||||||||||
Risk-Free Rate | 1.21% - 1.54% | 1.3% - 1.47% | 0.77% - 1.27% | |||||||||
Volatility | 30.14% -30.78% | 44.96% - 45.53% | 37.37% - 43.72% | |||||||||
Expected Term (years) | 4 | 4 | 4 | |||||||||
Weighted-average estimated fair value of options granted during the year | $ | 5.49 | $ | 9.43 | $ | 8.93 | ||||||
Intrinsic value of all options exercised (in millions) | $ | 0.15 | $ | 0.01 | $ | 0.2 | ||||||
The Company based the risk-free interest rate on the implied yields on U.S. Treasury zero-coupon issues with an equivalent remaining term at the time of grant.
The expected term in years represents the period of time that the awards granted are expected to be outstanding based on historical experience of the Company’s employees while the Company was a wholly-owned subsidiary of CTI prior to the Share Distribution. The assumption for dividend yield is zero because the Company has not historically paid dividends nor does it expect to do so in the foreseeable future.
For the fiscal year ended January 31, 2016, the volatility was based on the Company's historical stock volatility. For the fiscal years ended January 31, 2015 and 2014, the volatility was based on the historical stock volatility of several peer companies, as the Company has limited trading history to use the volatility of its own common shares.
F-40
The following table summarizes the activities for unvested RSUs for the year ended January 31, 2016
Unvested Restricted Awards | |||||||
Shares | Weighted Average Modified/Grant Price | ||||||
Unvested balance, January 31, 2015 | 585,183 | $ | 27.28 | ||||
Restricted/deferred shares granted | 307,373 | 20.80 | |||||
Restricted shares vested (1) | (352,044 | ) | 27.81 | ||||
Restricted shares forfeited(2) | (147,570 | ) | 25.57 | ||||
Performance shares granted | 236,944 | 22.43 | |||||
Performance shares forfeited | (136,943 | ) | 22.43 | ||||
Unvested balance, January 31, 2016 (3) | 492,943 | 22.40 | |||||
Expected to vest after January 31, 2016 (4) | 411,866 | $ | 22.44 | ||||
(1) | The total fair value of vested Restricted Awards during the fiscal years ended January 31, 2016, 2015 and 2014, was $9.8 million, $9.3 million and $9.0 million, respectively. |
(2) | Awards issued under the 5.0 million shares reserved for issuance under the Assumed CTI Awards may not be reissued pursuant to any future awards. During the fiscal year ended January 31, 2016, 2015, the number of restricted stocks units forfeited under the Assumed CTI Awards was 3,359 and 45,685, respectively. |
(3) | As of January 31, 2016, the unrecognized compensation expense, net of estimated forfeitures, related to unvested Restricted Awards was $6.5 million which is expected to be recognized over a weighted-average period of 1.79 years. |
(4) | RSUs expected to vest reflect an estimated forfeiture rate. |
F-41
16. | ACQUISITIONS |
Acision
On August 6, 2015 (the “Closing Date”), the Company completed its previously announced acquisition (the “Acquisition”) of Acision Global Limited, a private company formed under the laws of England and Wales (“Acision”) and a holding company for Acision B.V. (its sole asset), pursuant to the terms of the share sale and purchase agreement, dated June 15, 2015 (the “Purchase Agreement”), between the Company and Bergkamp Coöperatief U.A., a cooperative with excluded liability formed under the laws of the Netherlands (the “Seller”). Acision is a holding company formed on September 5, 2014 that holds all of the equity interests of Acision B.V. Other than its equity interest in Acision B.V., Acision does not have any other assets or liabilities. The assets, liabilities and operations of Acision B.V. reflect the acquired business. Acision is a provider of messaging software solutions to CSPs and enterprises, including SMS, MMS, IM and IP messaging. The Company acquired Acision to complement its solution portfolio, enhance its market leadership, penetrate growth markets and improve its operational efficiency.
Pursuant to the terms of the Purchase Agreement, on the Closing Date the Company acquired 100% of the equity interests of Acision in exchange for $171.3 million in cash (excluding cash acquired and closing costs), earnout payments (as discussed below), and 3.14 million shares of the Company’s common stock, par value $0.01 per share (the “Consideration Shares”), which were issued in a private placement transaction conducted pursuant to Section 4(a)(2) under the Securities Act of 1933, as amended (the “Securities Act”). As previously disclosed, pursuant to the terms of the Purchase Agreement, an amount up to $35.0 million of cash consideration is subject to an earnout, contingent on the achievement of revenue targets by certain of Acision’s business activities through the first quarter of 2016. Earnout revenue targets through December 31, 2015 were not achieved and accordingly, no earnout was paid in respect thereof. To secure claims the Company may have under the Purchase Agreement, $10.0 million of the initial cash consideration was retained in escrow, which amount will be increased in the event that further consideration is triggered under the earnout, up to a maximum aggregate escrow retention of $25.0 million. Such monies will be released to the Seller two years after completion of the Acquisition, subject to any claims. In addition, Acision, in consultation with the Company, entered into a consent, waiver and amendment (the “Amendment”) with the requisite lenders under Acision’s credit agreement (the “Acision Credit Agreement”) governing Acision’s existing approximately $156.0 million senior credit facility (the “Acision Senior Debt”), pursuant to which the Acision Senior Debt remains in place following completion of the Acquisition. The Acision Senior Debt matures, subject to the terms and conditions of the Acision Credit Agreement, on December 15, 2018. In connection with the Amendment, the Company agreed to pay certain costs imposed on Acision by its lenders under the Acision Senior Debt.
The Acision Credit Agreement contains customary representations and warranties and affirmative, restrictive and financial covenants. These provisions, with certain exceptions, restrict Acision’s ability and the ability of its subsidiaries to (i) incur additional indebtedness, (ii) create, incur, assume or permit to exist any liens, (iii) enter into mergers, consolidations or similar transactions, (iv) make investments and acquisitions, (v) make certain dispositions of assets, (vi) make dividends, distributions and prepayments of certain indebtedness, and (vii) enter into certain transactions with affiliates. The Acision Credit Agreement also contains customary events of default, including, among other things, non-payment defaults, covenant defaults, material adverse effect defaults, bankruptcy and insolvency defaults and material judgment default.
Each party agreed to indemnify the other for certain potential liabilities and claims, subject to certain exceptions and limitations. As of January 31, 2016, the Company had accrued approximately $2.0 million in connection with indemnification demands from two customers of Acision in connection with claims of intellectual property infringement made by third parties arising from the use of Acision’s products prior to the Company’s acquisition of Acision. Pursuant to the terms of the Purchase Agreement, the Seller agreed to indemnify the Company up to a maximum of $10.0 million for losses in connection with certain IP claims. In connection with the Acquisition, the Company reflected a $2.0 million indemnification asset for such claims for intellectual property infringement. In addition, pursuant to the Purchase Agreement, subject to the Company notifying the Seller within two years after the Closing Date of its claim against the Seller, the Seller is liable for the pre-Closing Date tax liabilities of Acision and its subsidiaries (the “Group”) up to an initial cap of $10 million. The precise cap for tax liabilities depends on whether the Company makes any payment to the Seller under the earn-out (in which case the cap may increase) and represents the aggregate liability of the Seller in respect of certain other potential claims under the Purchase Agreement. The Purchase Agreement also contains certain provisions to ensure that the Seller obtains the benefit of certain tax assets for which the Company has not paid relating broadly to pre-Closing Date periods. This is achieved generally by means of offset against payments due to the Company from the Seller. The Purchase Agreement also contains provisions relating to the preparation of tax returns for pre-Closing Date periods that have not been filed and the current period at the Closing Date, and to the conduct of tax authority claims relating to pre-Closing Date periods. The Company is liable under the Purchase Agreement for secondary tax liabilities imposed on the Seller as a result of the Company’s failure after the Closing Date to settle tax liabilities for which it is primarily responsible.
F-42
The Company's consolidated financial statements include the operating results of Acision from the Closing Date, including revenue of $63.0 million and net loss of $12.9 million in the consolidated statements of operations for the fiscal year ended January 31, 2016.
Purchase Price
The Company acquired Acision for an aggregate consideration as calculated below:
(In thousands) | ||||
Cash | $ | 171,336 | ||
Estimated fair value of Earnout (1) | 567 | |||
Common stock, $0.01 par value - 3.14 million shares issued (2) | 56,931 | |||
Total | $ | 228,834 | ||
(1) Pursuant to the terms of the Purchase Agreement, an amount up to $35.0 million of cash consideration is subject to an earnout, contingent on the achievement of revenue targets by certain of Acision’s business activities through the first quarter of 2016. Of this amount, $25.0 million is subject to targets to be achieved based on fiscal year results, while the remaining $10.0 million is subject to targets to be achieved in the first quarter of 2016. Earnout revenue targets through December 31, 2015 were not achieved and accordingly, no earnout was paid in respect thereof.
(2) The Company issued 3.14 million shares of common stock, par value $0.01 per share, which were issued in a private placement transaction conducted pursuant to Section 4(a)(2) under the Securities Act. The share consideration fair value is based upon the market price of the Company's common stock upon completion of purchase and discounted due to liquidity considerations.
F-43
The following table summarizes the purchase price allocation to the estimated fair values of the assets acquired and liabilities assumed in the Acquisition including impact of errors and measurement period adjustments on purchase price allocation.
(In thousands) | ||||
Cash and cash equivalents | $ | 31,335 | ||
Accounts receivable | 54,183 | |||
Prepaid expenses and other assets | 11,827 | |||
Property and equipment | 3,737 | |||
Goodwill | 186,600 | |||
Intangible assets | 239,152 | |||
Deferred income taxes | 17,215 | |||
Total assets acquired | 544,049 | |||
Accounts payable and accrued expenses | 61,752 | |||
Deferred revenue | 7,664 | |||
Deferred income taxes | 56,552 | |||
Debt | 156,000 | |||
Other long-term liabilities | 33,247 | |||
Total liabilities acquired | 315,215 | |||
Total purchase price | $ | 228,834 | ||
Identifiable intangible assets and their estimated useful lives consist of the following:
Weighted Average Useful life | (In thousands) | |||||
Customer relationships | 15 years | $ | 159,900 | |||
Backlog | 1 year | 22,800 | ||||
Leasehold interest | 5 years | 1,052 | ||||
Acquired Technology | 8 years | 55,400 | ||||
Total Intangible Assets | $ | 239,152 | ||||
The fair values for the intangible assets and property, plant and equipment acquired were primarily based on significant inputs that are not observable in the market and thus represent a Level 3 measurement in the fair value hierarchy. Customer relationships, backlog and developed technology were valued using the income approach, based on estimated projections of expected cash flows to be generated by the assets, discounted to the present value at discount rates commensurate with perceived risk. The discounted cash flow analyses factor in assumptions on revenue and expense growth rates including estimates of customer growth and attrition rates, technology obsolescence, and relief from royalty projections. These estimates are based upon the Company's historical customer and telecommunications industry experience and projections of future activity, factoring in customer demand, changes in technology and a cost structure necessary to achieve the related revenues. Additionally, these discounted cash flow analyses factor in expected amounts of working capital and weighted average cost of capital. The cost approach, which estimates value by determining the current cost of replacing an asset with another of equivalent economic utility, was used for property, plant and equipment.
Goodwill is attributable to the value of the synergies between the acquired company and the Company. The majority of the value assigned to goodwill will not be deductible for tax purposes.
The Company incurred acquisition-related costs for the Acision acquisition of $11.7 million included in Selling, General and administrative costs.
F-44
Pro Forma Information
The following pro forma information presents the financial results as if the acquisition of Acision had occurred on February 1, 2014. Pro forma adjustments give effect to an increase in amortization for fair value adjustments to intangible assets using an economic assumption rate and related tax effects. Pro forma adjustments also give effect to the deferred revenue amounts to arrive at fair value as of February 1, 2014. The Pro forma results do not include any anticipated cost synergies, costs or other effects of the planned integration of Acision. Accordingly, such pro forma amounts are not necessarily indicative of the results that actually would have occurred for the periods presented below had the acquisition been completed on February 1, 2014, nor are they indicative of the future operating results of the Company.
Fiscal year ended January 31, | ||||||||
2016 | 2015 | |||||||
(In thousands, except share and per share data) | ||||||||
Revenue | $ | 360,032 | $ | 441,804 | ||||
Income (loss) from continuing operations | 4,145 | (51,631 | ) | |||||
Earnings (loss) per share from continuing operations | ||||||||
Basic | $ | 0.17 | $ | (2.04 | ) | |||
Diluted | $ | 0.16 | $ | (2.04 | ) | |||
Solaiemes
On August 1, 2014, the Company acquired 100% of the outstanding equity of Solaiemes for approximately $2.7 million and the assumption of $1.4 million of debt. Solaiemes is an innovator focused on enabling the creation and monetization of CSPs’ digital services. Solutions from Solaiemes complement the Company's Evolved Communication Suite offering and the combined portfolio creates a comprehensive platform for service monetization of IP-based digital services. Solaiemes has been integrated into the Company’s Digital Services segment.
At the time of the acquisition, Solaiemes had 15 employees. Proforma and actual revenues and earnings related to Solaiemes were not material to the Company. The results of operations of Solaiemes have been included in the Company's consolidated financial statements beginning on the acquisition date. Revenue and earnings of Solaiemes since the acquisition date were not material.
The acquisition of Solaiemes has been accounted for as a business combination. Assets acquired and liabilities assumed have been recorded at their estimated fair values as of the August 1, 2014 acquisition date. The fair values of intangible asset were based on valuations using a cost approach.
The excess of the purchase price over the tangible assets, identifiable intangible assets and assumed liabilities was recorded as goodwill. The goodwill is not deductible for tax purposes.
The amounts in the table below represent the estimated fair value upon acquisition.
(In thousands) | Amount | ||
Assets: | |||
Cash | $ | 16 | |
Other current assets | 114 | ||
Intangible assets | 2,174 | ||
Goodwill | 2,053 | ||
Other assets | 129 | ||
Total assets acquired | $ | 4,486 | |
Liabilities: | |||
Current liabilities | $ | 242 | |
Current and long-term debt | 1,354 | ||
Other long-term liabilities | 201 | ||
Total liabilities acquired | $ | 1,797 | |
F-45
17. | DISCONTINUED OPERATIONS |
Amdocs Asset Purchase Agreement
On April 29, 2015, the Company entered into an Asset Purchase Agreement (including the ancillary agreements and documents thereto, the “Amdocs Purchase Agreement") with Amdocs Limited, a Guernsey company (the “Purchaser”). Pursuant to the Amdocs Purchase Agreement, the Company agreed to sell substantially all of its assets required for operating the Company's converged, prepaid and postpaid billing and active customer management systems for wireless, wireline, cable and multi-play communication service providers (the “BSS Business”) to the Purchaser, and the Purchaser agreed to assume certain post-closing liabilities of the Company (the “Asset Sale”). The initial closing of the Asset Sale occurred on July 2, 2015. The total cash purchase price payable by the Purchaser to the Company in connection with the Asset Sale was approximately $271.7 million, including currently estimated purchase price adjustment of approximately $0.7 million, of which an aggregate of $5.5 million was paid upon certain deferred closings.
In connection with the Asset Sale, the Company agreed to indemnify the Purchaser for certain pre-closing liabilities and breaches of certain representations and warranties. Upon the closing, $26 million of the purchase price was deposited into escrow to fund potential indemnification claims and certain adjustments for a period of 12 months following the closing. This $26 million is classified as a current asset within restricted cash in the Company's consolidated balance sheet. In August 2015 and May 2016, the Company received various claims for indemnification against the escrow from the Purchaser. While the Company continues to evaluate certain claims made, it believes several pending claims are without merit and intends to vigorously defend against them.
In connection with the Amdocs Purchase Agreement, the Company and the Purchaser have also entered into a Transition Services Agreement (the “TSA”), which provides for support services between the Company and the Purchaser in connection with the transition of the BSS Business to the Purchaser, for various periods up to 12 months following the closing of the Asset Sale. During the fiscal year ended January 31, 2016, approximately $8.1 million and $5.5 million have been recognized for services provided under the TSA and expenses to be reimbursed by the Purchaser, respectively. As of January 31, 2016, the balance due of $2.4 million is classified in “Other current assets” within the consolidated balance sheets.
The BSS Business met the criteria to be classified as held for sale as well as discontinued operations. As such, the BSS Business has been re-classified and reflected as discontinued operations on the consolidated statements of operations for all periods presented. The assets and liabilities of the BSS business are included in discontinued operations as separate components to the Company’s consolidated balance sheet as of January 31, 2015. The income tax on the sale of discontinued operations has been reduced by the utilization of foreign tax credits.
Upon completion of the sale, the Company paid a commission of approximately $4.0 million to its advisors.
F-46
The table below provides a breakout of the discontinued operations statements of operations.
Fiscal Year Ended January 31, | ||||||||||||
2016 | 2015 | 2014 | ||||||||||
(in thousands) | ||||||||||||
Revenue | $ | 71,092 | $ | 208,331 | $ | 236,531 | ||||||
Costs and expenses: | ||||||||||||
Product and service costs | 40,902 | 106,911 | 138,335 | |||||||||
Research and development, net | 7,694 | 19,477 | 28,111 | |||||||||
Selling, general and administrative | 11,612 | 30,572 | 43,424 | |||||||||
Other operating expenses: | ||||||||||||
Restructuring expenses | 14,676 | 2,759 | 938 | |||||||||
Total other operating expenses | 14,676 | 2,759 | 938 | |||||||||
Total costs and expenses | 74,884 | 159,719 | 210,808 | |||||||||
(Loss) income from operations | (3,792 | ) | 48,612 | 25,723 | ||||||||
Income tax benefit (expense) | 278 | (13,513 | ) | (2,610 | ) | |||||||
Discontinued operations, net of tax | (3,514 | ) | 35,099 | 23,113 | ||||||||
Gain on sale of discontinued operations, before tax | 197,720 | — | — | |||||||||
Income tax benefit (expense) | (10,083 | ) | — | — | ||||||||
Gain on sale of discontinued operations, net of tax | 187,637 | — | — | |||||||||
Net income from discontinued operations, net of tax | $ | 184,123 | $ | 35,099 | $ | 23,113 | ||||||
Supplemental information: | ||||||||||||
Depreciation | $ | 2,909 | $ | 3,512 | $ | 3,690 | ||||||
Amortization | $ | 1,160 | $ | 2,789 | $ | 2,765 | ||||||
F-47
Components of assets and liabilities held for sale are as follows:
January 31, | |||
2015 | |||
(in thousands) | |||
ASSETS | |||
Current assets: | |||
Accounts receivable, net of allowance | 36,175 | ||
Deferred cost of revenue | 3,514 | ||
Deferred income taxes | — | ||
Prepaid expenses | 846 | ||
Other current assets | 5,422 | ||
Total current assets | 45,957 | ||
Property and equipment, net | 9,008 | ||
Goodwill | 83,699 | ||
Intangible assets, net | 2,391 | ||
Deferred cost of revenue | 8,268 | ||
Deferred income taxes | — | ||
Other assets | 8,738 | ||
Total assets | $ | 158,061 | |
LIABILITIES | |||
Current liabilities: | |||
Accounts payable and accrued expenses | $ | 22,382 | |
Deferred revenue | 60,260 | ||
Deferred income taxes | — | ||
Income taxes payable | — | ||
Total current liabilities | 82,642 | ||
Deferred revenue | 29,264 | ||
Deferred income taxes | — | ||
Other long-term liabilities | 11,434 | ||
Total liabilities | $ | 123,340 | |
F-48
Stock-based compensation expense associated with awards included in the discontinued operations statements of operations is as follows:
Fiscal Year Ended January 31, | ||||||||||||
2016 | 2015 | 2014 | ||||||||||
(in thousands) | ||||||||||||
Stock options: | ||||||||||||
Service costs | 16 | 21 | 20 | |||||||||
Research and development | — | 10 | 11 | |||||||||
Selling, general and administrative | 85 | 164 | 78 | |||||||||
101 | 195 | 109 | ||||||||||
Restricted/Deferred stock awards: | ||||||||||||
Service costs | 552 | 1,122 | 1,128 | |||||||||
Research and development | 72 | 269 | 453 | |||||||||
Selling, general and administrative | 567 | 606 | 519 | |||||||||
1,191 | 1,997 | 2,100 | ||||||||||
Total | $ | 1,292 | $ | 2,192 | $ | 2,209 | ||||||
18. | (LOSS) EARNINGS PER SHARE ATTRIBUTABLE TO XURA, INC.'S STOCKHOLDERS |
Basic (loss) earnings per share attributable to the Company’s stockholders for the fiscal years ended January 31, 2016, 2015 and 2014 is computed using the weighted average number of shares of common stock outstanding. For purposes of computing diluted (loss) earnings per share attributable to the Company’s stockholders, shares issuable upon exercise of stock options and deliverable in settlement of unvested RSU awards are included in the weighted average number of shares of common stock outstanding, except when the effect would be antidilutive.
The calculation of earnings (loss) per share attributable to Xura, Inc.’s stockholders is as follows:
Fiscal Years Ended January 31, | ||||||||||||
2016 | 2015 | 2014 | ||||||||||
(In thousands, except per share data) | ||||||||||||
Numerator: | ||||||||||||
Net loss from continuing operations attributable to Xura, Inc. - basic and diluted | $ | (51,350 | ) | $ | (57,238 | ) | $ | (4,427 | ) | |||
Net income from discontinued operations, attributable to Xura, Inc. - basic and diluted | 184,123 | 35,099 | 23,113 | |||||||||
Denominator: | ||||||||||||
Basic and diluted weighted average common shares outstanding | 23,455 | 22,191 | 22,164 | |||||||||
Earnings (loss) per share basic & diluted | ||||||||||||
Loss per share from continuing operations attributable to Xura, Inc. | $ | (2.19 | ) | $ | (2.58 | ) | $ | (0.20 | ) | |||
Earnings per share from discontinued operations attributable to Xura, Inc. | 7.85 | 1.58 | 1.04 | |||||||||
Basic and diluted earnings (loss) per share | $ | 5.66 | $ | (1.00 | ) | $ | 0.84 | |||||
As a result of the Company's net loss from continuing operation in the fiscal years ended January 31, 2016, 2015 and 2014 the diluted earnings per share calculation excludes 0.2 million, 0.1 million and 0.2 million shares, respectively, of stock-based awards from the calculation because their inclusion would have been anti-dilutive.
19. | INCOME TAXES |
During the fiscal year ended January 31, 2015, the Company identified and corrected over accruals related to various tax matters recorded in the periods 2010 to 2013. The correction resulted in a $0.7 million increase of its income tax benefit during the fiscal year ended January 31, 2015. These out-of-period adjustments were not material to any previously issued annual or interim financial statements.
F-49
The components of United States and foreign (loss) income from continuing operations before income taxes are as follows:
Fiscal Years Ended January 31, | ||||||||||||
2016 | 2015 | 2014 | ||||||||||
(In thousands) | ||||||||||||
United States | $ | (16,656 | ) | $ | 940 | $ | 33,426 | |||||
Foreign | (59,929 | ) | (61,407 | ) | (31,274 | ) | ||||||
(Loss) income before income taxes | $ | (76,585 | ) | $ | (60,467 | ) | $ | 2,152 | ||||
The expense (benefit) for income taxes from continuing operations consists of the following:
Fiscal Years Ended January 31, | ||||||||||||
2016 | 2015 | 2014 | ||||||||||
(In thousands) | ||||||||||||
Current income tax benefit: | ||||||||||||
U.S. Federal | $ | 3,649 | $ | (127 | ) | $ | (10,887 | ) | ||||
U.S. States | 691 | (104 | ) | (771 | ) | |||||||
Foreign | (23,784 | ) | (2,702 | ) | 2,187 | |||||||
Total current income tax benefit | $ | (19,444 | ) | $ | (2,933 | ) | $ | (9,471 | ) | |||
Deferred income tax (benefit) expense: | ||||||||||||
U.S. Federal, net of federal (benefit) expense of state | $ | (4,728 | ) | $ | 302 | $ | 12,765 | |||||
U.S. States | (249 | ) | — | 288 | ||||||||
Foreign | (813 | ) | (598 | ) | 2,997 | |||||||
Total deferred income tax (benefit) expense | $ | (5,790 | ) | $ | (296 | ) | $ | 16,050 | ||||
Total income tax (benefit) expense | $ | (25,234 | ) | $ | (3,229 | ) | $ | 6,579 | ||||
F-50
The reconciliation of the U.S. federal statutory income tax rate to the effective tax rate on (loss) income before income tax provision and equity in (losses) earnings of consolidated affiliate is as follows:
Fiscal Years Ended January 31, | ||||||||||||
2016 | 2015 | 2014 | ||||||||||
(In thousands) | ||||||||||||
U.S. federal statutory income tax rate | 35.0 | % | 35.0 | % | 35.0 | % | ||||||
Income tax expense (benefit) at the U.S. statutory rate | $ | (26,805 | ) | $ | (21,162 | ) | $ | 747 | ||||
Valuation allowance, excluding state valuation allowances | 62,177 | 48,860 | 22,899 | |||||||||
Foreign rate differential | 10,285 | 8,617 | 15,670 | |||||||||
US tax effects of foreign operations | 1,605 | 961 | 1,015 | |||||||||
Tax contingencies | (13,955 | ) | (42,118 | ) | 11,185 | |||||||
Stock based compensation | 115 | 2,288 | 482 | |||||||||
Interest on tax refunds | (32 | ) | (727 | ) | (1 | ) | ||||||
Non-deductible expenses | (1,802 | ) | 352 | (2,278 | ) | |||||||
Change in Israeli Approved Enterprise Status | (47,670 | ) | — | (43,660 | ) | |||||||
Correction of Prior Period | (67 | ) | (651 | ) | (3,592 | ) | ||||||
Foreign exchange | (1,046 | ) | (947 | ) | (2,499 | ) | ||||||
Change in tax laws | (3,531 | ) | (975 | ) | 612 | |||||||
State tax provision, net | 285 | (33 | ) | 4,827 | ||||||||
Withholding tax, net of credits | (6,843 | ) | 2,788 | 2,122 | ||||||||
Return to provision and other adjustments | 2,050 | (482 | ) | (950 | ) | |||||||
Total income tax (benefit) expense | $ | (25,234 | ) | $ | (3,229 | ) | $ | 6,579 | ||||
Effective Income Tax Rate | 32.9 | % | 5.3 | % | 305.7 | % | ||||||
The significant differences that impact the effective tax rate relate to changes to the valuation allowance, tax credit, tax contingencies, the difference between the U.S. federal statutory rate and the rates in foreign jurisdictions, the U.S. tax effect on foreign earnings and withholding taxes. For the year ended January 31, 2016, the tax benefit for withholding tax, net of credits is primarily driven by a domestic foreign tax credit claim that was done during the fiscal year ended January 31, 2016 that resulted in a tax benefit of ($8.8) million offset by $2.0 million of withholding taxes.
“The Company's operations in Israel have been approved as an “Approved Enterprise”. Further, at the time the Company filed its 2012 Israeli tax return, the Company made an election for a “Benefited Enterprise” program. Under these programs, the Company is eligible for tax benefits under the Israeli Law for Encouragement of Capital Investments, 1959. When the “Benefited Enterprise” program is not in effect and when the other “Approved Enterprise” programs expire, an alternative income tax rate of 16% can be requested from the authorities within the “Preferred Enterprise” path. The Company’s used this 16% rate for its Israeli entity ordinary deferred tax items in the fiscal year ended Jan 31st, 2015. Due to not meeting the condition of the enterprise status for Comverse, Ltd, as a result of subcontracting most of its engineering activity to a subcontractor (Tech Mahindra) which may perform this work from outside of Israel, the Company no longer qualified for the 16% and increased its deferred rate during the fiscal year ended January 31, 2016, to 25%. This required a revaluation of the deferred tax asset on net operating losses of $529.7 million. The effect of the deferred rate change on these losses is offset fully by a valuation allowance.
Deferred income taxes are provided for the effects of temporary differences between the amounts of assets and liabilities recognized for financial reporting purposes and the amounts recognized for income tax purposes. Significant components of the Company’s deferred tax assets and deferred tax liabilities are as follows:
F-51
January 31, | ||||||||
2016 | 2015 | |||||||
(In thousands) | ||||||||
Deferred tax assets: | ||||||||
Deferred revenue | $ | 30,575 | $ | 45,927 | ||||
Loss carryforwards (1) | 159,763 | 135,423 | ||||||
Stock-based and other compensation | 5,039 | 7,183 | ||||||
Tax credits - net of foreign withholding taxes | 38,690 | 36,198 | ||||||
Other intangibles (1) | — | 14,847 | ||||||
Capitalized R&D Costs | — | 17,330 | ||||||
Property and equipment, net | 2,971 | 2,491 | ||||||
Other | 28,356 | 18,015 | ||||||
Total deferred tax assets | $ | 265,394 | $ | 277,414 | ||||
Deferred tax liabilities: | ||||||||
Deferred cost of revenue | $ | (1,797 | ) | $ | (9,820 | ) | ||
Goodwill | (18,765 | ) | (24,800 | ) | ||||
Other intangibles | (42,527 | ) | — | |||||
Total deferred tax liabilities | $ | (63,089 | ) | $ | (34,620 | ) | ||
Valuation allowance (1) | (268,838 | ) | (284,255 | ) | ||||
Net deferred income tax liability | $ | (66,533 | ) | $ | (41,461 | ) | ||
Recognized as: | ||||||||
Current deferred income tax assets | $ | — | $ | 13,781 | ||||
Noncurrent deferred income tax assets | 9,119 | 3,064 | ||||||
Current deferred income tax liabilities | — | (1,491 | ) | |||||
Noncurrent deferred income tax liabilities | (75,652 | ) | (56,815 | ) | ||||
Total | $ | (66,533 | ) | $ | (41,461 | ) | ||
(1) The change in deferred tax assets in the current year includes a $3.2 million correction of an error to gross deferred tax assets offset by a corresponding change in the valuation allowance. The out-of-period adjustment impacted the disclosure only and had no impact on the previously reported statements of operations, balance sheets, statements of cash flows or the statements of stockholders’ equity of any previously reported periods. Based on evaluation of the relevant quantitative and qualitative factors, the Company concluded that the error in the disclosures was not material to any periods affected.
U.S. income and foreign withholding taxes have not been recorded on permanently reinvested earnings of certain subsidiaries aggregating $104.6 million as of January 31, 2016. At this time, determination of the amounts of deferred U.S. federal and state income taxes and foreign withholding taxes related to these earnings is not practicable. Determination of the amount of unrecognized deferred tax liability on unremitted foreign earnings is not practicable because of the complexities of the hypothetical calculation. As of January 31, 2016, $148.5 million of earnings from certain subsidiaries are not considered to be permanently reinvested and therefore, foreign withholding taxes of $20.3 million have been accrued. A portion of the earnings of subsidiaries in the following countries are not considered permanently reinvested: Israel, Brazil, Hong Kong, New Zealand, Mexico, Portugal, Netherlands, and the United Kingdom.
The Company has net operating loss carryforwards (“NOLs”) for tax purposes and other deferred tax benefits that are available to offset future taxable income.
The Company’s gross NOLs for tax return purposes are as follows:
Fiscal Years Ended January 31, | ||||||||
2016 | 2015 | |||||||
(In thousands) | ||||||||
U.S. Federal NOLs | $ | 368,971 | $ | 451,009 | ||||
U.S. State NOLs | 300,197 | 363,080 | ||||||
Foreign NOLs | 711,489 | 621,976 | ||||||
F-52
The U.S. federal NOL carry forwards expire in various years ending from January 31, 2021 to January 31, 2035. The U.S. state NOL carry forwards expire in various years ending from January 31, 2017 to January 31, 2033. At January 31, 2016, all but $50.5 million of the foreign NOLs have indefinite carry forward periods. The table above reflects gross NOLs for tax return basis which are different from financial statement NOLs, primarily due to the reduction of the financial statement NOLs under the FASB's guidance on accounting for uncertainty in income taxes. The Company has U.S. federal, state and foreign tax credit carryforwards of approximately $43.2 million and $33.7 million as of January 31, 2016 and 2015, respectively. The utilization of these carryforwards is subject to limitations. The federal AMT credit has no expiration date. The foreign tax credit carryforwards expire in various years ending from January 31, 2017 to 2025.
In accordance with the FASB’s guidance relating to accounting for uncertainty in income taxes the Company recognizes unrecognized tax benefits in non-current tax liabilities. The following table reconciles the amounts recorded for unrecognized tax benefits for the fiscal years ended January 31, 2016, 2015 and 2014:
Fiscal Years Ended January 31, | ||||||||||||
2016 | 2015 | 2014 | ||||||||||
(In thousands) | ||||||||||||
Gross unrecognized tax benefits as of February 1 | $ | 240,285 | $ | 301,174 | $ | 278,602 | ||||||
Increase due to Acquisitions | 25,761 | — | — | |||||||||
Increases related to tax positions taken in prior years (1) | 10,856 | 29,688 | 29,520 | |||||||||
Decreases related to tax positions taken in prior years | (2,448 | ) | (541 | ) | (11,671 | ) | ||||||
Increases related to tax positions in current year | 2,639 | 5,391 | 5,970 | |||||||||
Decreases related to tax positions in current year | — | (259 | ) | — | ||||||||
Decreases due to settlements with taxing authorities | (302 | ) | (31,834 | ) | (1,500 | ) | ||||||
Reductions resulting from lapse in statute of limitations | (28,465 | ) | (51,085 | ) | (1,072 | ) | ||||||
Increases (decreases) related to foreign currency exchange rate fluctuations | (4,371 | ) | (12,249 | ) | 1,325 | |||||||
Gross unrecognized tax benefits as of January 31 | $ | 243,955 | $ | 240,285 | $ | 301,174 | ||||||
(1) The increase related to tax positions taken in prior years for the year ended January 31, 2015 included a $25.9 million correction to properly reflect gross positions which had been reported net of certain deferred tax assets in prior periods. The out-of-period adjustment impacted the disclosure only and had no impact on the previously reported statements of operations, balance sheets, statements of cash flows or the statements of stockholders’ equity of any previously reported periods. Based on evaluation of the relevant quantitative and qualitative factors, the Company concluded that the error in the disclosures was not material to any periods affected.
The balances of unrecognized tax benefits as of January 31, 2016, 2015 and 2014 are $244.0 million, $240.3 million and $301.2 million of which $77.1 million, $84.8 million and $90.5 million represent the amounts that, if recognized, may impact the effective income tax rate in future periods.
The Company recognized interest and penalties related to unrecognized tax benefits in its income tax provision. As of January 31, 2016, 2015 and 2014, the Company accrued $34.7 million, $39.2 million and $39.2 million for interest and penalties, respectively.
The Company estimates that it is reasonably possible that the balance of unrecognized tax benefits as of January 31, 2016 may decrease by approximately $18.7 million in the next twelve months, as a result of lapse of statutes of limitation and settlements with tax authorities.
The significant tax jurisdictions in which the Company is currently under examination by tax authorities include Canada, India, Indonesia and United Kingdom. The Company anticipates that it is reasonably possible that new tax matters could be raised by tax authorities that may require increases or decreases to the balance of unrecognized tax benefits; however, an estimate of such increases or decreases cannot be made.
F-53
The Company files income tax returns in the U.S. federal, various state and local, and foreign tax jurisdictions. As of January 31, 2016, the Company has open tax years which can be subject to tax audit (and in some cases are under tax audit) in the following major jurisdictions:
Jurisdiction | Tax Years Ended | |
United States | January 31, 1999 - January 31, 2016 | |
Israel | January 31, 2013 - January 31, 2016 | |
United Kingdom | December 31, 2005 - January 31, 2016 | |
India | March 31, 2002 - March 31, 2015 | |
France | January 31, 2008 - January 31, 2016 | |
Brazil | December 31, 2010 - December 31, 2015 | |
Canada | January 31, 2007, January 31, 2008, January 31, 2010, January 31, 2012 - January 31, 2016 | |
The Netherlands | December 31, 2004 - December 31, 2015 | |
Germany | December 31, 2011 - December 31, 2015 | |
Ireland | December 31, 2011 - December 31, 2015 | |
Various U.S. States | January 31, 1999 - January 31, 2016 | |
The Company regularly assesses the adequacy of its provisions for income tax contingencies in accordance with the FASB's guidance. As a result, the Company may adjust the liabilities for unrecognized tax benefits for the impact of new facts and developments, such as changes to interpretations of relevant tax law, assessments from taxing authorities, settlements with taxing authorities, and lapses of statutes of limitations.
The Company maintains valuation allowances in jurisdictions where it is more-likely-than-not that all or a portion of a deferred tax asset may not be realized. In determining whether a valuation allowance is warranted, the Company evaluates factors such as prior earnings history, expected future earnings, reversal of existing taxable temporary differences, carry-back and carry-forward periods and tax strategies that could potentially enhance the likelihood of the realization of a deferred tax asset. Changes in valuation allowances are included in the Company's tax provision in the period of change except for items related to additional paid-in capital. During the fiscal year ended January 31, 2016, the Company recorded a decrease of $15.4 million to its valuation allowance related primarily to net operating losses in the U.S. and foreign jurisdictions.
The Company’s activity in the valuation allowance is as follows:
Balance at Beginning of Fiscal Year | Additions (Charged) Credited to Expenses | Other | Balance at End of Fiscal Year | |||||||||||||
(In thousands) | ||||||||||||||||
Valuation allowance on income tax assets: | ||||||||||||||||
Fiscal Year Ended January 31, 2016 | $ | (284,255 | ) | $ | 2,897 | $ | 12,520 | $ | (268,838 | ) | ||||||
Fiscal Year Ended January 31, 2015 | $ | (266,617 | ) | $ | (50,985 | ) | $ | 33,347 | $ | (284,255 | ) | |||||
Fiscal Year Ended January 31, 2014 | $ | (195,468 | ) | $ | (31,655 | ) | $ | (39,494 | ) | $ | (266,617 | ) | ||||
F-54
20. | BUSINESS SEGMENT INFORMATION |
Prior to entering into the Amdocs Purchase Agreement, the Company’s reportable segments consisted of BSS and Digital Services. As a result of entering into the Amdocs Purchase Agreement, the results of operations of the former BSS Business segment are classified as discontinued operations. Therefore, with the reported divestiture, the Company operates as a single business segment the results of which are included in the Company's income statement from continuing operations. On August 6, 2015, the Company completed its acquisition of Acision. The Company acquired Acision to complement its solution portfolio, enhance its market leadership, penetrate growth markets and improve its operational efficiency. Acision was integrated into Digital Services and the Company continues to operate a single segment as a global provider of digital communications solutions for communication service providers.
Revenue by major geographical region is based upon the geographic location of the customers who purchase the Company's products and services. The geographical locations of distributors, resellers and systems integrators who purchase products and utilize the Company's services may be different from the geographical locations of end customers. Revenue by geographic region and revenue by geographic region as a percentage of total revenue was as follows:
Fiscal Years Ended January 31, | |||||||||||||||||||||
2016 | 2015 | 2014 | |||||||||||||||||||
(Dollars in thousands) | |||||||||||||||||||||
United States | $ | 81,029 | 30 | % | $ | 84,270 | 31 | % | $ | 167,140 | 40 | % | |||||||||
Japan | 21,389 | 8 | % | 30,280 | 11 | % | 42,502 | 10 | % | ||||||||||||
Canada | 20,064 | 7 | % | 13,893 | 5 | % | 14,028 | 3 | % | ||||||||||||
Germany | 15,805 | 6 | % | 6,180 | 2 | % | 5,442 | 1 | % | ||||||||||||
India | 9,933 | 4 | % | 19,979 | 7 | % | 29,850 | 7 | % | ||||||||||||
Ukraine | 7,628 | 3 | % | 16,362 | 6 | % | 22,376 | 5 | % | ||||||||||||
Australia | 8,739 | 3 | % | 11,698 | 4 | % | 18,753 | 5 | % | ||||||||||||
Other Foreign (1) | 106,327 | 39 | % | 86,312 | 34 | % | 115,879 | 29 | % | ||||||||||||
Total | $ | 270,914 | 100 | % | $ | 268,974 | 100 | % | $ | 415,970 | 100 | % | |||||||||
(1) | Other foreign consists of numerous countries, none of which represents more than 5% of total revenue in any fiscal year presented. |
Long-lived assets primarily consist of property and equipment, net, capitalized software development costs, net, and deferred costs of revenue. The Company believes that property and equipment, net, is exposed to the geographic area risks and uncertainties more than other long-lived assets, because these tangible assets are difficult to move and is relatively illiquid.
Property and equipment, net, by country consists of the following:
January 31, | ||||||||||||
2016 | 2015 | 2014 | ||||||||||
(In thousands) | ||||||||||||
Israel | $ | 29,659 | $ | 33,467 | $ | 22,673 | ||||||
United States | 2,761 | 4,288 | 5,189 | |||||||||
Other | 6,050 | 2,467 | 4,818 | |||||||||
$ | 38,470 | $ | 40,222 | $ | 32,680 | |||||||
F-55
21. | SUPPLEMENTAL CASH FLOW INFORMATION |
The following represents non-cash activities and supplemental information to the consolidated statements of cash flows:
Fiscal Years Ended January 31, | ||||||||||||
2016 | 2015 | 2014 | ||||||||||
(In thousands) | ||||||||||||
Non-cash investing transactions: | ||||||||||||
Accrued but unpaid purchases of property and equipment | $ | 1,692 | $ | 3,606 | $ | 3,404 | ||||||
Inventory transfers to property and equipment | $ | 1,238 | $ | 2,372 | $ | 4,001 | ||||||
Non-cash financing transactions: | ||||||||||||
Liabilities for contingent consideration recorded for business combination | $ | 567 | $ | — | $ | — | ||||||
Stock consideration issued in connection with business combination | $ | 56,931 | $ | — | ||||||||
Cash paid during the year for interest | $ | 8,486 | $ | 20 | $ | — | ||||||
Cash paid during the year for income taxes net of amounts refunded—continuing operations | $ | 3,368 | $ | 2,304 | $ | 7,417 | ||||||
22. | RELATED PARTY TRANSACTIONS |
Share Distribution Agreements
The Company entered into a distribution agreement (the “Distribution Agreement”), transition services agreement, tax disaffiliation agreement and employee matters agreement (collectively, the “Share Distribution Agreements”) with CTI in connection with the Share Distribution (see Note 3, Share Distribution Agreements).
23. | LEASES |
The Company leases office and warehouse space, as well as certain equipment and vehicles, under non-cancelable operating leases. Gross rent expense was $11.0 million, $9.5 million and $19.6 million in the fiscal years ended January 31, 2016, 2015 and 2014, respectively. Sublease income was $7.9 million, $0.9 million and $2.1 million, in the fiscal years ended January 31, 2016, 2015 and 2014 respectively.
The majority of the Company's leases include options that allow it to renew or extend the lease term beyond the initial lease period, subject to terms and conditions agreed upon at the inception of the lease. Such terms and conditions include rental rates agreed upon at the inception of the lease that could represent below-or above-market rental rates later in the life of the lease, depending upon market conditions at the time of such renewal or extension.
The Company has entered into various sublease agreements to lease excess space. As of January 31, 2016, the minimum annual rent obligations (excluding taxes, maintenance and other pass-throughs), sublease income to be received under non-cancelable subleases, and minimum net rentals of the Company are as follows for the fiscal years ending January 31:
(In thousands) | Minimum Lease Commitments | Noncancellable Subleases | Minimum Net Rentals | ||||||||
2017 | $ | 9,860 | $ | 1,616 | $ | 8,244 | |||||
2018 | 8,538 | 1,678 | 6,860 | ||||||||
2019 | 7,425 | 1,596 | 5,829 | ||||||||
2020 | 6,068 | 1,387 | 4,681 | ||||||||
2021 | 4,830 | 784 | 4,046 | ||||||||
2022 and thereafter | 18,204 | 1,027 | 17,177 | ||||||||
$ | 54,925 | $ | 8,088 | $ | 46,837 | ||||||
In connection with the 2012 restructuring initiative, certain office space, including offices in New York, New York, have been vacated or consolidated upon expiration of leases.
F-56
In May 2012, the Company entered into an agreement for the lease of a facility in Ra'anana, Israel to replace its then-existing office space in Tel Aviv, Israel. The lease includes an option to terminate up to 30% of the Company's leased space in the building subject to a penalty. During the fiscal year ended January 31, 2014, the Company exercised this option and returned 27% of the building and recognized a termination penalty of $1.7 million during such fiscal year. The term of the lease is for ten years, which commenced in December 2014. In addition, the Company has the right to extend the term of the lease by up to five years. The annual base rent under the agreement after partial return of office space, for approximately 218,912 square feet is $4.5 million.
In connection with the 2014 restructuring plan, the Company has ceased use of an additional 21% of the remaining leased space in Ra'anana, Israel. The Company recorded restructuring expense for facilities-related costs of $2.0 million and a write-off of $1.5 million in property and equipment during the fiscal year ended January 31, 2015.
In connection with the 2015 restructuring plan, the Company has ceased use of an additional 7% and has subleased 11% of the leased space in Ra'anana, Israel. The Company recorded restructuring expense net of change in assumptions for facilities-related costs of $0.8 million during the fiscal year ended January 31, 2016.
The Company continues to evaluate the existing lease commitments and reduce or expand space as warranted.
24. | COMMITMENTS AND CONTINGENCIES |
Indemnification Obligations
In the normal course of business, the Company provides indemnification to various customers against claims of intellectual property infringement made by third parties arising from the use of the Company's products. The Company evaluates its indemnification obligations for potential losses and in its evaluation considers such factors as the degree of probability of an unfavorable outcome and the ability to make a reasonable estimate of the amount of loss. Generally, the Company has not encountered significant expenses as a result of such indemnification provisions. As of January 31, 2016, the Company had accrued approximately $2.0 million in connection with indemnification demands from two customers of Acision in connection with claims of intellectual property infringement made by third parties arising from the use of Acision’s products prior to the Company's acquisition of Acision. Pursuant to the terms of the Purchase Agreement, the Seller agreed to indemnify the Company up to a maximum of $10.0 million for losses in connection with certain IP claims. In connection with the Acquisition, the Company reflected a $2.0 million indemnification asset for such claims for intellectual property infringement.
To the extent permitted under state laws or other applicable laws, the Company has agreements in which it agreed to indemnify its directors and officers for certain events or occurrences while the director or officer is, or was, serving at the Company's request in such capacity. The indemnification period covers all pertinent events and occurrences during the Company's director's or officer's lifetime. The maximum potential amount of future payments that the Company could be required to make under these indemnification agreements is unlimited; however, the Company has certain director and officer insurance coverage that limits the Company's exposure and enables the Company to recover a portion of any future amounts paid. The Company is not able to estimate the fair value of these indemnification agreements in excess of applicable insurance coverage, if any.
In addition, under the Share Distribution Agreements the Company entered into in connection with the Share Distribution, the Company agreed to indemnify CTI and its affiliates (including Verint following the Verint Merger) against certain losses that may arise as a result of the Verint Merger and the Share Distribution (see Note 3, Share Distribution Agreements). On February 4, 2013, in connection with the closing of the Verint Merger Agreement, CTI placed $25.0 million in escrow to support indemnification claims to the extent made against the Company by Verint and any cash balance remaining in such escrow fund 18 months after the closing of the Verint Merger, less any claims made on or prior to such date, to be released to the Company. On August 6, 2014, the escrow was released in accordance with its terms and the Company received the escrow amount of approximately $25.0 million.
As a result of the Verint Merger, Verint assumed certain rights and liabilities of CTI, including any liability of CTI arising out of the actions discussed below. Under the terms of the Distribution Agreement between CTI and the Company relating to the Share Distribution, Verint, as successor to CTI, is entitled to indemnification from the Company for any losses it suffers in its capacity as successor-in-interest to CTI in connection with these actions. As of the closing of the Verint Merger, the Company recognized the estimated fair value of the potential indemnification liability (see Note 1, Organization, Business and Summary of Significant Accounting Policies).
Israeli Optionholder Class Action
CTI and certain of its former subsidiaries, including Xura Ltd. (formerly Xura Ltd., a subsidiary of the Company), were named as defendants in four potential class action litigations in the State of Israel involving claims to recover damages incurred as a result of purported negligence or breach of contract due to previously-settled allegations regarding illegal backdating of
F-57
CTI options that allegedly prevented certain current or former employees from exercising certain stock options. The Company intends to vigorously defend these actions.
Two cases were filed in the Tel Aviv District Court against CTI on March 26, 2009, by plaintiffs Katriel (a former Xura Ltd. employee) and Deutsch (a former Verint Systems Ltd. employee). The Katriel case (Case Number 1334/09) and the Deutsch case (Case Number 1335/09) both seek to approve class actions to recover damages that are claimed to have been incurred as a result of CTI’s negligence in reporting and filing its financial statements, which allegedly prevented the exercise of certain stock options by certain employees and former employees. By stipulation of the parties, on September 30, 2009, the court ordered that these cases, including all claims against CTI in Israel and the motion to approve the class action, be stayed until resolution of the actions pending in the United States regarding stock option accounting, without prejudice to the parties’ ability to investigate and assert the unique facts, claims and defenses in these cases. On May 7, 2012, the court lifted the stay, and the plaintiffs have filed an amended complaint and motion to certify a class of plaintiffs in a single consolidated class action. The defendants responded to this amended complaint on November 11, 2012, and the plaintiffs filed a further reply on December 20, 2012. A pre-trial hearing for the case was held on December 25, 2012, during which all parties agreed to attempt to settle the dispute through mediation.
The mediation process ended without success. According to the parties’ consent to submit summations in the motion to certify the claims as a class action (the “Motion to Certify”), including the certification of the class of plaintiffs, the court held the following dates for submission of summations: Summations on behalf of the plaintiffs were submitted on August 31, 2014; Summations on behalf of the defendants were submitted on November 20, 2014; and summations of response by the plaintiffs were submitted on December 30, 2014. On February 9, 2015, the Judge presiding over the case recused herself due to a conflict of interests. On March 30, 2015, the plaintiffs filed a motion to the Court seeking to have the case assigned to a new presiding Judge and as a result on April 4, 2015 a new presiding judge was assigned to the case. The parties are now waiting for the Court’s decision on the Motion to Certify.
Two cases were also filed in the Tel Aviv Labor Court by plaintiffs Katriel and Deutsch, and both sought to approve class actions to recover damages that are claimed to have been incurred as a result of breached employment contracts, which allegedly prevented the exercise by certain employees and former employees of certain CTI and Verint stock options, respectively. The Katriel litigation (Case Number 3444/09) was filed on March 16, 2009, against Xura Ltd., and the Deutsch litigation (Case Number 4186/09) was filed on March 26, 2009, against Verint Systems Ltd. The Tel Aviv Labor Court has ruled that it lacks jurisdiction, and both cases have been transferred to the Tel Aviv District Court. These cases have been consolidated with the Tel Aviv District Court cases discussed above.
The Company has not accrued for these matters as the potential loss is currently not probable or estimable.
An additional case has been filed by an individual plaintiff in the Tel Aviv District Court similarly seeking to recover damages up to an aggregate of $3.3 million allegedly incurred as a result of the inability to exercise certain stock options. The case generally alleged the same causes of actions alleged in the potential class action discussed above. In December 2014, the District Court assigned the case to the Labor Court. In December 2015, the case was settled without admission of liability by the defendants for an immaterial amount.
Starhome Sale and Indemnification
Starhome was a CTI subsidiary (66.5% owned prior to the disposition). On September 19, 2012, CTI, in order to ensure it could meet the conditions of the Verint Merger, contributed to the Company its interest in Starhome, including its rights and obligations under the Starhome Share Purchase Agreement discussed below. The Starhome Disposition was completed on October 19, 2012
Under the terms of the Starhome Share Purchase Agreement, Starhome’s shareholders received aggregate cash proceeds of approximately $81.3 million, subject to adjustment for fees, transaction expenses and certain taxes. Of this amount, $10.5 million was held in escrow to cover potential post-closing indemnification claims, with $5.5 million being released after 18 months and the remainder released after 24 months, in each case, less any claims made on or prior to such dates. The Company received aggregate net cash consideration (including $4.9 million deposited in escrow at closing) of approximately $37.2 million, after payments that CTI agreed to make to certain other Starhome shareholders of up to $4.5 million. The escrow funds were available to satisfy certain indemnification claims under the Starhome Share Purchase Agreement to the extent that such claims exceeded $1.0 million. During the fiscal year ended January 31, 2015, the Company received approximately $4.7 million in settlement of escrow.
F-58
Amdocs Asset Purchase Agreement
On April 29, 2015, the Company entered into an Asset Purchase Agreement (including the ancillary agreements and documents thereto, the “Amdocs Purchase Agreement”) with Amdocs Limited, a Guernsey company (the “Purchaser”). Pursuant to the Amdocs Purchase Agreement, the Company’s BSS Business to the Purchaser, and the Purchaser agreed to assume certain post-closing liabilities of the Company (the “Asset Sale”). The initial closing of the Asset Sale occurred on July 2, 2015. The total cash purchase price payable by the Purchaser to the Company in connection with the Asset Sale was approximately $271.7 million, including currently estimated purchase price adjustment of approximately $0.7 million, of which an aggregate of $5.5 million was paid upon certain deferred closings.
In connection with the Asset Sale, the Company agreed to indemnify Amdocs for certain pre-closing liabilities and breaches of certain representations and warranties. Upon the closing, $26.0 million of the purchase price was deposited into escrow to fund potential indemnification claims and certain adjustments for a period of 12 months following the closing. This $26.0 million is classified as a current asset within restricted cash in the Company's consolidated balance sheet (see Note 17, Discontinued Operations). In August 2015 and May 2016, the Company received various claims for indemnification against the escrow from Amdocs. While the Company continues to evaluate certain claims made, it believes several pending claims are without merit and intends to vigorously defend against them.
Agreement with Tech Mahindra
On April 14, 2015, the Company entered into a MSA with Tech Mahindra pursuant to which Tech Mahindra performs certain services for the Company’s business on a global basis. The services include research and development, project deployment and delivery and maintenance and support for certain customers of the Company. In connection with the transaction, approximately 500 employees of the Company and its subsidiaries have been rehired by Tech Mahindra or its affiliates.
Under the MSA, the Company is obligated to pay to Tech Mahindra in the aggregate approximately $212.0 million in base fees for services to be provided pursuant to the MSA for a term of six years, renewable at the Company’s option. The services under the MSA started on June 1, 2015.
The Company has the right to terminate the MSA for convenience subject to the payment of certain termination fees. The Company may terminate the MSA upon certain material breaches, certain material performance failures or violations of applicable law by Tech Mahindra without termination fees. Tech Mahindra may terminate the MSA upon certain material breaches by the Company, including the failure to pay undisputed amounts. Upon any termination or expiration, Tech Mahindra will provide reverse transition services to transition the services being provided by Tech Mahindra pursuant to the MSA back to the Company or its designee. The MSA contains certain customary indemnification provisions by both the Company and Tech Mahindra.
Acision
On August 6, 2015, the Company completed its previously announced acquisition of Acision pursuant to the terms of the share sale and purchase agreement, dated June 15, 2015.
The Acision Purchase Agreement contains customary representations, warranties and covenants, by the parties thereto. Each party agreed to indemnify the other for certain potential liabilities and claims, subject to certain exceptions and limitations (see indemnification obligation included Note 16, Acquisition).
Guarantees
The Company provides certain customers in the ordinary course of business with financial performance guarantees, which in certain cases are backed by standby letters of credit or surety bonds, the majority of which are cash collateralized and accounted for as restricted cash and bank deposits. The Company is only liable for the amounts of those guarantees in the event of its nonperformance, which would permit the customer to exercise the guarantee. As of January 31, 2016 and 2015, the Company believes that it was in compliance with its performance obligations under all contracts for which there is a financial performance guarantee, and that any liabilities arising in connection with these guarantees will not have a material adverse effect on the Company’s consolidated results of operations, financial position or cash flows. The Company also obtained bank guarantees primarily to provide customer assurance relating to the performance of certain obligations required by customer agreements for the guarantee of certain payment obligations. These guarantees, which aggregated $19.1 million and $29.0 million as of January 31, 2016 and 2015, respectively, are generally scheduled to be released upon the Company’s performance of specified contract milestones, a majority of which are scheduled to be completed at various dates through July 31, 2016.
F-59
Unconditional Purchase Obligations
In the ordinary course of business, the Company enters into certain unconditional purchase obligations, which are agreements to purchase goods or services that are enforceable, legally binding and specify all significant terms, including fixed or minimum quantities to be purchased, fixed, minimum or variable price provisions, and the approximate timing of the transaction. Purchase obligations exclude agreements that are cancelable without penalty. The Company had unconditional purchase obligations of approximately $195.9 million as of January 31, 2016. Of these obligations, $50.3 million are due in the next twelve months, $75.2 million are due in one to three years, $61.0 million are due in three to five years and $9.3 million are due in more than five years.
Legal Proceedings
From time to time, the Company and its subsidiaries are subject to claims in legal proceedings arising in the normal course of business. The Company does not believe that it or its subsidiaries are currently party to any pending legal action not described herein or disclosed in the consolidated financial statements that could reasonably be expected to have a material adverse effect on its business, financial condition or results of operations.
Brazil Tax and Labor Contingencies
The Company's operations in Brazil are involved in various litigation matters and have received or been the subject of numerous governmental assessments related to indirect and other taxes, as well as disputes associated with former Company employees. The tax matters, which comprise a significant portion of the contingencies, principally relate to claims for taxes on the transfers of inventory, municipal service taxes on rentals and gross revenue taxes. The Company is disputing these tax matters and intends to vigorously defend its positions. The labor matters principally relate to claims made by former Company employees for pay wages, social security and other related labor benefits, as well as related tax obligations. As of January 31, 2016, the total amounts related to the reserved portion of the tax and labor contingencies was $8.5 million and the unreserved portion of the tax and labor contingencies totaled approximately $31.1 million. With respect to the unreserved balance, these have been assessed by management as being either remote or possible as to the likelihood of ultimately resulting in a loss to the Company. Local laws and regulations often require that the Company make deposits or post other security in connection with such proceedings. As of January 31, 2016, the Company had $4.5 million of deposits, included in Long-term restricted cash, with the government in Brazil for claims that the Company is disputing which provides security with respect to these matters. Generally, any deposits would be refundable to the extent the matters are resolved in the Company's favor. Management routinely assesses these matters as to probability of ultimately incurring a liability against the Company's Brazilian operations and the Company records its best estimate of the ultimate loss in situations where management assesses the likelihood of an ultimate loss as probable.
Italy VAT
The Company applied for Italian VAT refunds for the periods 2004 to 2010. However, collectability was deemed uncertain, as a result of the Italian financial crisis and other matters. On April 30, 2013, the Company received a refund approximating $10.9 million, which was recognized as a reduction of service costs in the consolidated statement of operations for the fiscal year ended January 31, 2014.
F-60
25. | QUARTERLY INFORMATION (UNAUDITED) |
Impact of errors and measurement period adjustments on purchase price allocation
On August 6, 2015, the Company completed the acquisition of Acision pursuant to the terms of the share sale and purchase agreement, dated June 15, 2015 (see Note 16, Acquisitions). During the three months ended January 31, 2016, the Company identified errors and measurement period adjustments to the preliminary allocations of the purchase prices as additional information was obtained about the facts and circumstances that existed as of the acquisition date. The errors and measurement period adjustment had an impact on prepaid expenses and other assets, accounts payable and accrued expenses, deferred income taxes and other long-term liabilities. The correction of these items in the three months ended January 31, 2016 resulted in an increase in goodwill.
As Reported | Impact of Errors | Measurement Period Adjustments | Adjusted Purchase Price Allocation | ||||||||||||
(In millions) | |||||||||||||||
Cash and cash equivalents | $ | 31,155 | $ | 180 | $ | — | $ | 31,335 | |||||||
Accounts receivable | 55,370 | (1,187 | ) | — | 54,183 | ||||||||||
Prepaid expenses and other assets | 25,376 | (11,549 | ) | (2,000 | ) | 11,827 | |||||||||
Property and equipment | 4,079 | (342 | ) | — | 3,737 | ||||||||||
Goodwill | 183,709 | 2,784 | 107 | 186,600 | |||||||||||
Intangible assets | 239,152 | — | — | 239,152 | |||||||||||
Deferred income taxes | 6,248 | 10,967 | — | 17,215 | |||||||||||
Total assets acquired | 545,089 | 853 | (1,893 | ) | 544,049 | ||||||||||
Accounts payable and accrued expenses | 55,762 | 1,583 | 4,407 | 61,752 | |||||||||||
Deferred revenue | 18,487 | (10,823 | ) | — | 7,664 | ||||||||||
Deferred income taxes | 52,845 | 3,707 | — | 56,552 | |||||||||||
Debt | 156,000 | — | — | 156,000 | |||||||||||
Other long-term liabilities | 33,161 | 6,386 | (6,300 | ) | 33,247 | ||||||||||
Total liabilities acquired | 316,255 | 853 | (1,893 | ) | 315,215 | ||||||||||
Total purchase price | $ | 228,834 | $ | — | $ | — | $ | 228,834 | |||||||
Revision of Previously Reported
During the three months ended January 31, 2016, in conjunction with the remediation efforts to resolve the material weaknesses disclosed in this report, the Company identified errors related to its income tax provision resulting from the usage of unavailable foreign tax credits, adjustments to Acision's accounting practices for recording deferred and accrued cost of goods sold and to revisions in Acision account balances not considered measurement period adjustments.
The Company determined that these errors were not material, individually and in the aggregate, to any of the Company’s prior interim periods consolidated financial statements and therefore, amendments of previously filed reports were not required. As such, the revision for the corrections is reflected in the financial information of the applicable prior periods in this Form 10-K filing and disclosure of the revised amount on other prior periods will be reflected in future filings containing the applicable period. There was no impact to cash flows from operations on the Consolidated Condensed Statements of Cash Flows for the periods ended July 31, 2015 and October 31, 2015.
The impact of this revision for periods presented within this annual report on Form 10-K are presented in the tables below:
F-61
Three Months Ended July 31, 2015 | Six Months Ended July 31, 2015 | ||||||||||||||||||||||
As reported | Adjustment | Revised | As reported | Adjustment | Revised | ||||||||||||||||||
(In millions, except per share data) | |||||||||||||||||||||||
Income from discontinued operations | $ | 175.1 | $ | 8.0 | $ | 183.0 | $ | 188.4 | $ | 8.0 | $ | 196.4 | |||||||||||
Earnings per share - basic & diluted | |||||||||||||||||||||||
Discontinued operations | $ | 7.95 | $ | 0.36 | $ | 8.31 | $ | 8.59 | $ | 0.36 | $ | 8.95 | |||||||||||
Three Months Ended October 31, 2015 | Nine Months Ended October 31, 2015 | ||||||||||||||||||||||
As reported | Adjustment | Revised | As reported | Adjustment | Revised | ||||||||||||||||||
(In millions, except per share data) | |||||||||||||||||||||||
Service costs | $ | 52.3 | $ | 1.5 | $ | 53.8 | $ | 110.4 | $ | 1.5 | $ | 111.8 | |||||||||||
Income tax expense | 4.4 | (0.1 | ) | 4.2 | 6.6 | (0.1 | ) | 6.5 | |||||||||||||||
Loss from continuing operations | (22.3 | ) | (1.3 | ) | (23.6 | ) | (74.4 | ) | (1.3 | ) | (75.7 | ) | |||||||||||
Income from discontinued operations | 4.4 | (2.9 | ) | 1.5 | 192.8 | 5.1 | 197.8 | ||||||||||||||||
Net Income | $ | (17.9 | ) | $ | (4.2 | ) | $ | (22.1 | ) | $ | 118.4 | $ | 3.7 | $ | 122.1 | ||||||||
(Loss) earnings per share - basic & diluted | |||||||||||||||||||||||
Continuing operations | $ | (0.90 | ) | $ | (0.05 | ) | $ | (0.95 | ) | $ | (3.25 | ) | $ | (0.06 | ) | $ | (3.30 | ) | |||||
Discontinued operations | 0.18 | (0.12 | ) | 0.06 | 8.41 | 0.22 | 8.63 | ||||||||||||||||
$ | (0.72 | ) | $ | (0.17 | ) | $ | (0.89 | ) | $ | 5.16 | $ | 0.16 | $ | 5.33 | |||||||||
During the three months ended January 31, 2016, the Company recorded the impact of the corrections resulting in an increase of continuing operations earnings per share of $0.05 and a decrease in discontinued operations earnings per share of $0.20.
F-62
The following table shows selected results of operations, as revised for prior period errors, for each of the quarters during the fiscal years ended January 31, 2016 and 2015:
Fiscal Quarters Ended | ||||||||||||||||
April 30, 2015 | July 31, 2015 | October 31, 2015 | January 31, 2016 | |||||||||||||
(In thousands, except per share data) | ||||||||||||||||
Revenue | $ | 45,705 | $ | 61,629 | $ | 81,875 | $ | 81,705 | ||||||||
Gross profit | 1,948 | 21,665 | 25,292 | 28,100 | ||||||||||||
Loss from operations | (29,613 | ) | (10,494 | ) | (18,998 | ) | (9,264 | ) | ||||||||
(Loss) income from continuing operations | (39,980 | ) | (12,163 | ) | (23,578 | ) | 24,371 | |||||||||
Income (loss) from discontinued operations | 13,319 | 183,019 | 1,492 | (13,707 | ) | |||||||||||
Net (loss) income | $ | (26,661 | ) | $ | 170,856 | $ | (22,086 | ) | $ | 10,664 | ||||||
Basic (loss) earnings per share (1) | ||||||||||||||||
Continuing operations | $ | (1.83 | ) | $ | (0.55 | ) | $ | (0.95 | ) | $ | 0.97 | |||||
Discontinued operations | 0.61 | 8.31 | 0.06 | (0.54 | ) | |||||||||||
Total | $ | (1.22 | ) | $ | 7.76 | $ | (0.89 | ) | $ | 0.43 | ||||||
Diluted (loss) earnings per share (1) | ||||||||||||||||
Continuing operations | $ | (1.83 | ) | $ | (0.55 | ) | $ | (0.95 | ) | $ | 0.97 | |||||
Discontinued operations | 0.61 | 8.31 | 0.06 | (0.55 | ) | |||||||||||
Total | $ | (1.22 | ) | $ | 7.76 | $ | (0.89 | ) | $ | 0.42 | ||||||
(1) Amounts may not total to annual loss per share attributable to stockholders because each quarter and year are calculated separately based on basic and diluted weighted-average common shares outstanding during that period.
Fiscal Quarters Ended | ||||||||||||||||
April 30, 2014 | July 31, 2014 | October 31, 2014 | January 31, 2015 | |||||||||||||
(In thousands, except per share data) | ||||||||||||||||
Revenue | $ | 65,082 | $ | 74,988 | $ | 64,510 | $ | 64,394 | ||||||||
Gross profit | 14,197 | 17,032 | 16,361 | 19,652 | ||||||||||||
Loss from operations | (21,594 | ) | (17,011 | ) | (19,249 | ) | (6,594 | ) | ||||||||
Loss from continuing operations | (22,095 | ) | (22,381 | ) | (16,681 | ) | 3,919 | |||||||||
Income from discontinued operations | 5,964 | 5,515 | 17,631 | 5,989 | ||||||||||||
Net (loss) income | $ | (16,131 | ) | $ | (16,866 | ) | $ | 950 | $ | 9,908 | ||||||
Basic & diluted (loss) earnings per share (1) | ||||||||||||||||
Continuing operations | $ | (0.99 | ) | $ | (1.00 | ) | $ | (0.75 | ) | $ | 0.18 | |||||
Discontinued operations | 0.27 | 0.25 | 0.79 | 0.27 | ||||||||||||
Total | $ | (0.72 | ) | $ | (0.75 | ) | $ | 0.04 | $ | 0.45 | ||||||
(1) Amounts may not total to annual earnings per share attributable to stockholders because each quarter and year are calculated separately based on basic and diluted weighted-average common shares outstanding during that period.
26. | SUBSEQUENT EVENTS |
On May 23, 2016, the Company entered into an Agreement and Plan of Merger (the “Merger Agreement”) with Sierra Private Holdings II Ltd., a private limited company incorporated under the laws of England and Wales (“Sierra”), and Sierra Private Merger Sub Inc., a Delaware corporation and wholly-owned subsidiary of Sierra (“Merger Sub”), under which Merger Sub will be merged with and into the Company (the “Merger”), with the Company continuing after the Merger as the surviving corporation and wholly-owned subsidiary of Sierra, subject to the terms and conditions set forth in the Merger Agreement. Parent and Merger Sub are affiliates of Siris Capital Group, LLC (“Siris”). The Merger Agreement has been unanimously approved by the Company’s Board of Directors.
F-63
Under the terms of the Merger Agreement, Sierra will acquire all of the Company's outstanding common stock for $25.00 per share in cash. The completion of the Merger is subject to approval by the Company's stockholders, certain regulatory approvals and other closing conditions.
F-64
SCHEDULE I. CONDENSED FINANCIAL INFORMATION OF REGISTRANT
XURA, INC. (PARENT COMPANY ONLY)
CONDENSED BALANCE SHEETS
(In thousands, except share and per share data)
January 31, 2016 | January 31, 2015 | ||||||
ASSETS | |||||||
Current assets: | |||||||
Cash and cash equivalents | $ | 23,093 | $ | 69,250 | |||
Restricted cash and bank time deposits | 26,005 | 44 | |||||
Accounts receivable, net of allowance | 20,455 | 9,405 | |||||
Deferred cost of revenue | 8,914 | 13,384 | |||||
Deferred income taxes | — | 9,731 | |||||
Prepaid expenses | 2,209 | 999 | |||||
Other current assets | 84 | 50 | |||||
Advances to and investments in subsidiaries | 190,217 | 1,513 | |||||
Current assets of discontinued operations | — | 43,233 | |||||
Total current assets | 270,977 | 147,609 | |||||
Property and equipment, net | 2,758 | 4,288 | |||||
Goodwill | 20,084 | 20,084 | |||||
Deferred cost of revenue | 39,569 | 51,481 | |||||
Deferred income taxes | — | — | |||||
Other assets | 1,158 | 1,228 | |||||
Total assets | $ | 334,546 | $ | 224,690 | |||
LIABILITIES AND EQUITY | |||||||
Current liabilities: | |||||||
Accounts payable and accrued expenses | $ | 17,641 | $ | 18,607 | |||
Deferred revenue | 41,402 | 60,040 | |||||
Income taxes payable | 1,141 | 907 | |||||
Current liabilities of discontinued operations | — | 33,675 | |||||
Total current liabilities | 60,184 | 113,229 | |||||
Deferred revenue | 33,931 | 40,583 | |||||
Deferred income taxes | 38,223 | 50,426 | |||||
Other long-term liabilities | 5,251 | 7,070 | |||||
Total liabilities | 137,589 | 211,308 | |||||
Commitments and contingencies | |||||||
Equity: | |||||||
Xura, Inc. shareholders’ equity: | |||||||
Common stock, $0.01 par value - authorized, 100,000,000 shares; issued, 26,130,007 and 22,591,411 shares, respectively; outstanding, 25,004,913 and 21,830,081 shares, respectively | 261 | 226 | |||||
Preferred stock, $0.01 par value - authorized, 100,000 shares | — | — | |||||
Treasury stock, at cost, 1,125,094 and 761,330 shares, respectively | (24,460 | ) | (17,211 | ) | |||
Accumulated earnings (deficit) | 83,843 | (46,390 | ) | ||||
Additional paid-in capital | 114,004 | 45,935 | |||||
Accumulated other comprehensive income | 23,309 | 30,822 | |||||
Total equity | 196,957 | 13,382 | |||||
Total liabilities and equity | $ | 334,546 | $ | 224,690 | |||
XURA, INC. (PARENT COMPANY ONLY)
S-1
CONDENSED STATEMENTS OF OPERATIONS
(In thousands)
Fiscal Years Ended January 31, | |||||||||||
2016 | 2015 | 2014 | |||||||||
Revenue: | |||||||||||
Product revenue | $ | 53,426 | $ | 48,517 | $ | 116,278 | |||||
Service revenue | 63,147 | 68,549 | 83,381 | ||||||||
Product and Service revenue | 116,573 | 117,066 | 199,659 | ||||||||
Costs and expenses: | |||||||||||
Product costs | 22,952 | 19,045 | 54,637 | ||||||||
Service costs | 25,983 | 25,923 | 31,747 | ||||||||
Research and development, net | 5,009 | 7,774 | 7,652 | ||||||||
Selling, general and administrative | 44,941 | 25,598 | 38,306 | ||||||||
Other operating expenses: | |||||||||||
Restructuring expenses and write-off of property and equipment | 2,898 | 2,944 | 5,162 | ||||||||
Total other operating expenses | 2,898 | 2,944 | 5,162 | ||||||||
Total costs and expenses | 101,783 | 81,284 | 137,504 | ||||||||
Income from operations | 14,790 | 35,782 | 62,155 | ||||||||
Interest income | 104 | 149 | 150 | ||||||||
Interest expense | (65 | ) | (97 | ) | (104 | ) | |||||
Foreign currency transaction loss, net | (1,757 | ) | (1,108 | ) | (365 | ) | |||||
Other (expense) income, net | (2 | ) | 55,134 | (3,934 | ) | ||||||
Income before income tax benefit | 13,070 | 89,860 | 57,902 | ||||||||
Income tax benefit (expense) | 135 | (553 | ) | (15,945 | ) | ||||||
Equity in (losses) gains of subsidiaries from continuing operations, net of tax | (77,175 | ) | (123,013 | ) | 59,987 | ||||||
Net (loss) income from continuing operations | (63,970 | ) | (33,706 | ) | 101,944 | ||||||
Income (loss) from discontinued operations, net of tax | 196,743 | 11,567 | (83,258 | ) | |||||||
Net income (loss) | 132,773 | (22,139 | ) | 18,686 | |||||||
Comprehensive income (loss) | 132,773 | (22,139 | ) | 18,686 | |||||||
S-2
XURA, INC. (PARENT COMPANY ONLY)
CONDENSED STATEMENTS OF CASH FLOWS
(In thousands)
Fiscal Years Ended January 31, | |||||||||||
2016 | 2015 | 2014 | |||||||||
Net cash provided by (used in) provided by operating activities | 146,799 | (95,205 | ) | 45,301 | |||||||
Cash flows from investing activities: | |||||||||||
Purchase of other assets | 1,223 | — | — | ||||||||
Acquisitions | (171,335 | ) | — | — | |||||||
Purchase of property and equipment | (74 | ) | (951 | ) | (2,055 | ) | |||||
Net change in restricted cash and bank deposits | (25,964 | ) | 25,230 | (25,000 | ) | ||||||
Other, net | 9,064 | (233 | ) | 843 | |||||||
Net cash (used in) provided by investing activities | (187,086 | ) | 24,046 | (26,212 | ) | ||||||
Cash flows from financing activities: | |||||||||||
CTI capital contribution | — | — | 25,000 | ||||||||
Payment for repurchase of common stock in connection with tax liabilities upon settlement of awards | (947 | ) | (1,053 | ) | (991 | ) | |||||
Payment for repurchase of common stock under repurchase program | (6,302 | ) | (15,134 | ) | — | ||||||
Proceeds from stock options exercises and issuance of subsidiary common stock | 1,379 | 40 | 1,108 | ||||||||
Net cash (used in) provided by financing activities | (5,870 | ) | (16,147 | ) | 25,117 | ||||||
Net (decrease) increase in cash and cash equivalents | (46,157 | ) | (87,306 | ) | 44,206 | ||||||
Cash and cash equivalents, beginning of year | 69,250 | 156,556 | 112,350 | ||||||||
Cash and cash equivalents, end of year | $ | 23,093 | $ | 69,250 | $ | 156,556 | |||||
S-3
SCHEDULE I - XURA, INC.
NOTES TO CONDENSED FINANCIAL STATEMENTS
1. | BASIS OF PRESENTATION |
The condensed financial statements of Xura, Inc. (the “Parent”) have been prepared on a parent-only basis. These parent-only financial statements do not include all of the information and notes required by GAAP for annual financial statements, and therefore these parent-only financial statements and other information included should be read in conjunction with Xura, Inc. and Subsidiaries (collectively, the “Company”) audited consolidated financial statements and notes included in Item 15 of this Annual Report.
Equity in (losses) gains of subsidiaries from continuing operations, net of tax in the condensed statement of operations includes transfer pricing adjustments and intercompany interest expense of $28.6 million, $46.7 million and $66.1 million for the fiscal years ended January 31, 2016, 2015 and 2014, respectively.
Restrictions on Access to Subsidiary Cash
Parent’s Acision subsidiary has long-term debt outstanding as of January 31,2016 that contains certain negative covenants which include restrictions on making dividends, distributions and other transactions with affiliates. The Acision Credit Agreement also contains a financial covenant that requires Acision to maintain under IFRS a Consolidated Debt to Consolidated Earnings before Interest, Taxes, Depreciation and Amortization (or Consolidated EBITDA) (all of the foregoing as defined in the Acision Credit Agreement) leverage ratio measured quarterly of no greater than 3.75 to 1. At the last covenant reporting date, December 31, 2015, Acision was in compliance with the financial covenant under IFRS and its consolidated leverage ratio was approximately 3.25 to 1.
2. | COMMITTMENTS AND CONTINGENCIES |
Indemnification Obligations
Parent is subject to significant indemnification obligations, including to customers in the ordinary course and counterparties in connection with corporate transactions. In the normal course of business, Parent provides indemnifications of varying scopes to customers against claims of intellectual property infringement made by third parties arising from the use of products. In addition, Parent is subject to significant indemnification obligations to counterparties under certain agreements with third parties in connection with corporate transactions. These indemnification obligations include obligations to (i) Verint (as successor to CTI) under the Share Distribution Agreements Parent entered into in connection with the Share Distribution, (ii) Amdocs for certain pre-closing liabilities and breaches of certain representations and warranties in connection with the Asset Sale of the BSS business to Amdocs, (iii) Tech Mahindra, under the MSA therewith; and (iv) Acision, for certain potential liabilities and claims, subject to certain exceptions and limitations in connection with the acquisition of Acision. For more information, see Note 24 to the consolidated financial statements included in Item 15 of this Annual Report. These indemnification obligations could subject Parent to significant liabilities.
Share Distribution Agreements
In connection with the Share Distribution, Parent agreed to indemnify CTI and its affiliates (including Verint following the Verint Merger) against certain losses that may arise as a result of the Verint Merger and the Share Distribution. On February 4, 2013, in connection with the closing of the Verint Merger Agreement, CTI placed $25.0 million in escrow to support indemnification claims to the extent made against Parent by Verint and any cash balance remaining in such escrow fund 18 months after the closing of the Verint Merger, less any claims made on or prior to such date, to be released to Parent. On August 6, 2014, the escrow was released in accordance with its terms and Parent received the escrow amount of approximately $25.0 million.
As a result of the Verint Merger, Verint assumed certain rights and liabilities of CTI, including any liability of CTI arising out of the actions discussed below. Under the terms of the Distribution Agreement between CTI and Parent relating to the Share Distribution, Verint, as successor to CTI, is entitled to indemnification from Parent for any losses it suffers in its capacity as successor-in-interest to CTI in connection with these actions. As of the closing of the Verint Merger, Parent recognized the estimated fair value of the potential indemnification liability of $4.0 million with the remaining $21.0 million as an additional contribution from CTI. As of January 31, 2016, the indemnification liability is $3.2 million.
S-4
Israeli Optionholder Class Action
CTI and certain of its former subsidiaries, including Xura Ltd. (formerly Xura Ltd., a subsidiary of Parent), were named as defendants in four potential class action litigations in the State of Israel involving claims to recover damages incurred as a result of purported negligence or breach of contract due to previously-settled allegations regarding illegal backdating of CTI options that allegedly prevented certain current or former employees from exercising certain stock options. Parent intends to vigorously defend these actions. For more information, see Note 24 to the consolidated financial statements.
An additional case has been filed by an individual plaintiff in the Tel Aviv District Court similarly seeking to recover damages up to an aggregate of $3.3 million allegedly incurred as a result of the inability to exercise certain stock options. The case generally alleged the same causes of actions alleged in the potential class action discussed above. In December 2014, the District Court assigned the case to the Labor Court. In December 2015, the case was settled without admission of liability by the defendants for an immaterial amount.
Amdocs Asset Purchase Agreement
On April 29, 2015, Parent entered into an Asset Purchase Agreement (including the ancillary agreements and documents thereto, the “Amdocs Purchase Agreement”) with Amdocs Limited, a Guernsey company (the “Purchaser”). Pursuant to the Amdocs Purchase Agreement, Parent’s BSS Business to the Purchaser, and the Purchaser agreed to assume certain post-closing liabilities of the Company (the “Asset Sale”). The initial closing of the Asset Sale occurred on July 2, 2015. The total cash purchase price payable by the Purchaser to Parent in connection with the Asset Sale was approximately $271.7 million, including currently estimated purchase price adjustment of approximately $0.7 million, of which an aggregate of $5.5 million was paid upon certain deferred closings.
In connection with the Asset Sale, Parent agreed to indemnify Amdocs for certain pre-closing liabilities and breaches of certain representations and warranties. Upon the closing, $26.0 million of the purchase price was deposited into escrow to fund potential indemnification claims and certain adjustments for a period of 12 months following the closing. This $26.0 million is classified as a current asset within restricted cash in Parent’s consolidated balance sheet. In August 2015 and May 2016, Parent received various claims for indemnification against the escrow from Amdocs. While Parent continues to evaluate certain claims made, it believes several pending claims are without merit and intends to vigorously defend against them.
Agreement with Tech Mahindra
On April 14, 2015, Parent entered into a MSA with Tech Mahindra pursuant to which Tech Mahindra performs certain services for Parent’s business on a global basis. The services include research and development, project deployment and delivery and maintenance and support for certain customers of Parent. In connection with the transaction, approximately 500 employees of Parent and its subsidiaries have been rehired by Tech Mahindra or its affiliates.
Under the MSA, Parent is obligated to pay to Tech Mahindra in the aggregate approximately $212.0 million in base fees for services to be provided pursuant to the MSA for a term of six years, renewable at the Company’s option. The services under the MSA started on June 1, 2015.
Parent has the right to terminate the MSA for convenience subject to the payment of certain termination fees. Parent may terminate the MSA upon certain material breaches, certain material performance failures or violations of applicable law by Tech Mahindra without termination fees. Tech Mahindra may terminate the MSA upon certain material breaches by Parent, including the failure to pay undisputed amounts. Upon any termination or expiration, Tech Mahindra will provide reverse transition services to transition the services being provided by Tech Mahindra pursuant to the MSA back to Parent or its designee. The MSA contains certain customary indemnification provisions by both Parent and Tech Mahindra.
Acision
On August 6, 2015, Parent completed its acquisition of Acision pursuant to the terms of the share sale and purchase agreement, dated June 15, 2015.
The Acision Purchase Agreement contains customary representations, warranties and covenants, by the parties thereto. Each party agreed to indemnify the other for certain potential liabilities and claims, subject to certain exceptions and limitations (see indemnification obligation included Note 16, Acquisition).
Starhome Sale and Indemnification
Starhome was a CTI subsidiary (66.5% owned prior to the disposition). On September 19, 2012, CTI, in order to ensure it could meet the conditions of the Verint Merger, contributed to the Parent its interest in Starhome, including its rights and
S-5
obligations under the Starhome Share Purchase Agreement discussed below. The Starhome Disposition was completed on October 19, 2012.
Under the terms of the Starhome Share Purchase Agreement, Starhome’s shareholders received aggregate cash proceeds of approximately $81.3 million, subject to adjustment for fees, transaction expenses and certain taxes. Of this amount, $10.5 million was held in escrow to cover potential post-closing indemnification claims, with $5.5 million being released after 18 months and the remainder released after 24 months, in each case, less any claims made on or prior to such dates. Parent received aggregate net cash consideration (including $4.9 million deposited in escrow at closing) of approximately $37.2 million, after payments that CTI agreed to make to certain other Starhome shareholders of up to $4.5 million. The escrow funds were available to satisfy certain indemnification claims under the Starhome Share Purchase Agreement to the extent that such claims exceeded $1.0 million. During the fiscal year ended January 31, 2015, Parent received approximately $4.7 million in settlement of escrow.
Guarantees
Parent provides certain customers in the ordinary course of business with financial performance guarantees, which in certain cases are backed by standby letters of credit or surety bonds, the majority of which are cash collateralized and accounted for as restricted cash and bank deposits. Parent is only liable for the amounts of those guarantees in the event of its nonperformance, which would permit the customer to exercise the guarantee. As of January 31, 2016 and 2015, Parent believes that it was in compliance with its performance obligations under all contracts for which there is a financial performance guarantee, and that any liabilities arising in connection with these guarantees will not have a material adverse effect on Parent’s consolidated results of operations, financial position or cash flows. Parent also obtained bank guarantees primarily to provide customer assurance relating to the performance of certain obligations required by customer agreements for the guarantee of certain payment obligations. These guarantees, which aggregated $0.7 million and $1.4 million as of January 31, 2016 and 2015, respectively, are generally scheduled to be released upon Parent’s performance of specified contract milestones, a majority of which are scheduled to be completed at various dates through July 31, 2017.
3. | DISCONTINUED OPERATIONS |
Amdocs Asset Purchase Agreement
On April 29, 2015, the Parent entered into an Asset Purchase Agreement (including the ancillary agreements and documents thereto, the “Amdocs Purchase Agreement”) with Amdocs Limited, a Guernsey company (the “Purchaser”). Pursuant to the Amdocs Purchase Agreement, Parent agreed to sell substantially all of its assets required for operating Parent's converged, prepaid and postpaid billing and active customer management systems for wireless, wireline, cable and multi-play communication service providers (the “BSS Business”) to the Purchaser, and the Purchaser agreed to assume certain post-closing liabilities of Parent (the “Asset Sale”). The initial closing of the Asset Sale occurred on July 2, 2015. The total cash purchase price payable by the Purchaser to Parent in connection with the Asset Sale was approximately $271.7 million. As of April 30, 2015, the BSS Business met the criteria to be classified as held for sale as well as discontinued operations. As such, the BSS Business is reflected as discontinued operations on the parent company condensed statements of operations for all periods presented. The assets and liabilities of the BSS business are included in discontinued operations as separate components to the parent company condensed balance sheet as of January 31, 2015.
4. | DIVIDENDS |
Parent's Acision subsidiaries are contractually not permitted to paid any dividends and does not expect to pay any dividends to the parent company in the near future. Any future determination as to the declaration and payment of dividends will be made by Company's Board of Directors, in its discretion, and will depend upon contractual restrictions, the Company's earnings, financial condition, capital requirements and other relevant factors.
S-6
5. | RESTRUCTURING |
The following table represent a roll forward of the workforce reduction and restructuring activities noted above:
2015 Initiative | 2014 Initiative | 2012 & Prior Initiatives | |||||||||||||||||||||
Severance-Related | Facilities-Related | Severance-Related | Severance-Related | Facilities-Related | Total | ||||||||||||||||||
(In thousands) | |||||||||||||||||||||||
January 31, 2013 | $ | — | $ | — | $ | — | $ | 1,195 | $ | 2,267 | $ | 3,462 | |||||||||||
Expenses | — | — | — | 2,080 | 3,487 | 5,567 | |||||||||||||||||
Change in assumptions | — | — | — | (234 | ) | 351 | 117 | ||||||||||||||||
Translation adjustments and other (1) | — | — | — | — | — | — | |||||||||||||||||
Paid or utilized | — | — | — | (2,428 | ) | (1,691 | ) | (4,119 | ) | ||||||||||||||
January 31, 2014 | $ | — | $ | — | $ | — | $ | 613 | $ | 4,414 | $ | 5,027 | |||||||||||
Expenses | — | — | 4,245 | 56 | 192 | 4,493 | |||||||||||||||||
Change in assumptions | — | — | (104 | ) | (58 | ) | (93 | ) | (255 | ) | |||||||||||||
Translation adjustments and other (1) | — | — | 14 | (14 | ) | — | — | ||||||||||||||||
Paid or utilized | — | — | (3,555 | ) | (597 | ) | (1,453 | ) | (5,605 | ) | |||||||||||||
January 31, 2015 | $ | — | $ | — | $ | 600 | $ | — | $ | 3,060 | $ | 3,660 | |||||||||||
Expenses | 4,820 | 59 | — | — | 253 | 5,132 | |||||||||||||||||
Change in assumptions | (25 | ) | — | (26 | ) | — | 86 | 35 | |||||||||||||||
Translation adjustments and other (1) | — | — | — | — | — | — | |||||||||||||||||
Paid or utilized | (4,291 | ) | (59 | ) | (574 | ) | — | (1,136 | ) | (6,060 | ) | ||||||||||||
January 31, 2016 | $ | 504 | $ | — | $ | — | $ | — | $ | 2,263 | $ | 2,767 | |||||||||||
(1) Includes restructuring expense associated with BSS employees of $2.0 million, $1.3 million and $0.5 million for the fiscal years ended January 31, 2016, 2015 and 2014, respectively.
6. | GOODWILL |
The carrying amount of goodwill was $20.1 million as of each of January 31, 2016, 2015 and 2014.
S-7
7. | SUBSEQUENT EVENTS |
On May 23, 2016, Parent entered into an Agreement and Plan of Merger (the “Merger Agreement”) with Sierra Private Holdings II Ltd., a private limited company incorporated under the laws of England and Wales (“Sierra”), and Sierra Private Merger Sub Inc., a Delaware corporation and wholly-owned subsidiary of Sierra (“Merger Sub”), under which Merger Sub will be merged with and into Parent (the “Merger”), with Parent continuing after the Merger as the surviving corporation and wholly-owned subsidiary of Sierra, subject to the terms and conditions set forth in the Merger Agreement. Parent and Merger Sub are affiliates of Siris Capital Group, LLC (“Siris”). The Merger Agreement has been unanimously approved by Parent’s Board of Directors. For more information, see Note 26 to the consolidated financial statements included in Item 15 of this Annual Report.
S-8