Attached files
| file | filename |
|---|---|
| 8-K - 8-K - MVB FINANCIAL CORP | mvbf-20160517x8k.htm |
|
|
Spruce Knob, West Virginia REALIZING OUR POTENTIAL Annual Shareholders Meeting Larry F. Mazza, CEO & President May 17, 2016 |
|
|
Forward Looking Statements This presentation contains forward-looking statements within the meaning of the federal securities laws, which statements involve substantial risks and uncertainties. Forward-looking statements generally relate to future events, future financial condition, future results of operations, plans, objectives, future performance and future business of MVB Financial Corp. (the “Company”) and its subsidiaries. Forward-looking statements, which may be based upon beliefs, expectations and assumptions of the Company’s management and on information available to management at the time the statements are made, are generally identifiable by the use of words such as “believe,” “expect,” “anticipate,” “bode,” “predict,” “suggest,” “project,” “appear,” “plan,” “intend,” “estimate,” “may,” “will,” “would,” “could,” “should,” “likely,” or other similar expressions. These forward-looking statements are necessarily based upon estimates and assumptions that, while considered reasonable by the Company and its management, are inherently uncertain. Factors that may cause actual results to differ materially from current expectations include, but are not limited to, those factors identified in the Company’s filings with the Securities and Exchange Commission. Nothing in this presentation should be regarded as a representation by any person that the forward-looking statements set forth herein will be achieved or that any of the contemplated results of such forward-looking statements will be achieved. You should not place undue reliance on forward-looking statements, which speak only as of the date they are made. Except as required by law, the Company undertakes no obligation to update any statement in light of new information or future events. Non-GAAP Financial Measures The Company uses certain non-GAAP financial measures, such as tangible common equity to tangible assets, to provide information useful to investors in understanding the Company’s operating performance and trends, and facilitate comparisons with the performance of the Company’s peers. The non-GAAP financial measures used may differ from the non-GAAP financial measures other financial institutions use to measure their results of operations. Non-GAAP financial measures should be viewed in addition to, and not as an alternative for, the Company’s reported results prepared in accordance with U.S. GAAP. Reconciliations of these non-GAAP financial measures to the most directly comparable U.S. GAAP financial measures are provided in the Appendix to this presentation. 2 Disclaimers |
|
|
Review MVB 2015 Performance Discuss Strategic Planning Focus 1st Update Quarter Performance Question & Answer Session 3 Agenda |
|
|
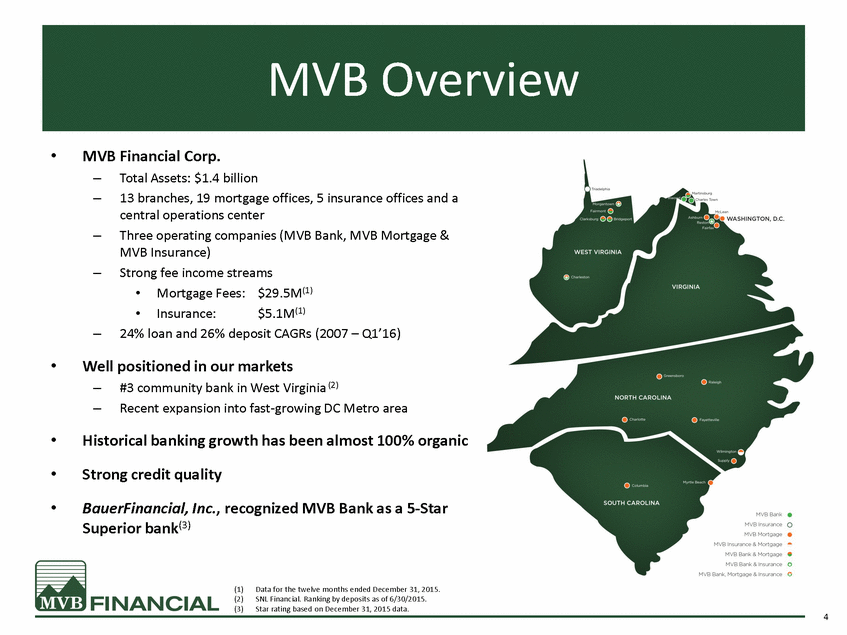
• MVB Financial Corp. – – Total Assets: $1.4 billion 13 branches, 19 mortgage offices, 5 insurance offices and a central operations center Three operating companies (MVB Bank, MVB Mortgage & MVB Insurance) Strong fee income streams – – • • Mortgage Fees:$29.5M(1) Insurance: $5.1M(1) – 24% loan and 26% deposit CAGRs (2007 – Q1’16) • Well positioned in our markets – – #3 community bank in West Virginia (2) Recent expansion into fast-growing DC Metro area • • • Historical banking growth has been almost 100% organic Strong credit quality BauerFinancial, Inc., recognized MVB Bank as a 5-Star Superior bank(3) (1) (2) (3) Data for the twelve months ended December 31, 2015. SNL Financial. Ranking by deposits as of 6/30/2015. Star rating based on December 31, 2015 data. 4 MVB Overview |
|
|
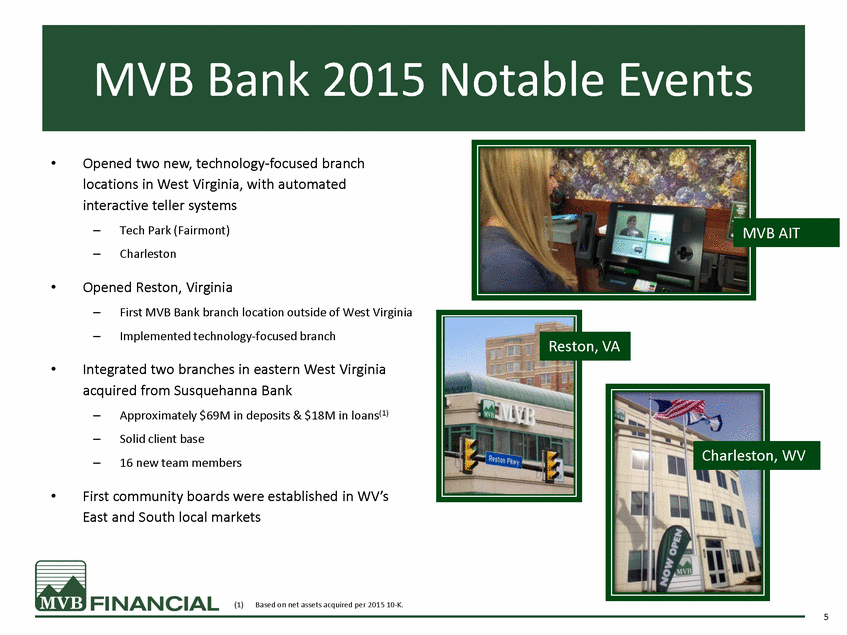
• Opened two new, technology-focused branch locations in West Virginia, with automated interactive teller systems – – Tech Park (Fairmont) Charleston MVB AIT • Opened Reston, Virginia – – First MVB Bank branch location outside of West Virginia Implemented technology-focused branch • Integrated two branches in eastern West Virginia acquired from Susquehanna Bank – – – Approximately $69M in deposits & $18M in loans(1) Solid client base 16 new team members on, WV • First community boards were established in WV’s East and South local markets (1)Based on net assets acquired per 2015 10-K. 5 Charlest Reston, VA MVB Bank 2015 Notable Events |
|
|
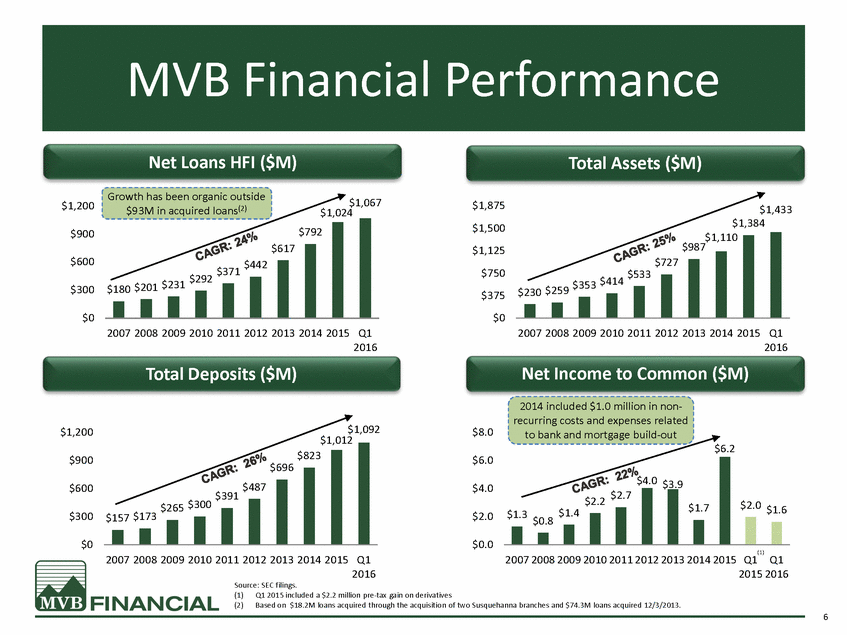
Net Loans HFI ($M) Growth has been organic outside $93M in acquired loans(2) Total Assets ($M) $1,067 $1,200 $1,875 $1,500 $1,125 $750 $375 $0 $1,433 $1,384 $1,024 $900 $600 $300 $0 2007 2008 2009 2010 2011 2012 2013 2014 2015 Q1 2016 Total Deposits ($M) 2007 2008 2009 2010 2011 2012 2013 2014 2015 Q1 2016 Net Income to Common ($M) 2014 included $1.0 million in non-recurring costs and expenses related to bank and mortgage build-out $6.2 $1,092 $1,200 $8.0 $1,012 $900 $6.0 $600 $4.0 $2.0 $1.6 $300 $2.0 $0 $0.0 (1) 2007 2008 2009 2010 2011 2012 2013 2014 2015 Q1Q1 2015 2016 2007 2008 2009 2010 2011 2012 2013 2014 2015 Q1 2016 Source: SEC filings. (1)Q1 2015 included a $2.2 million pre-tax gain on derivatives (2)Based on $18.2M loans acquired through the acquisition of two Susquehanna branches and $74.3M loans acquired 12/3/2013. 6 $4.0 $3.9 $1.7 $1.3 $0.8 $1.4 $2.2 $2.7 $823 $696 $487 $391 $265 $300 $157 $173 $1,110 $987 $727 $533 $230 $259 $353 $414 $792 $617 $442 $292 $371 $180 $201 $231 MVB Financial Performance |
|
|
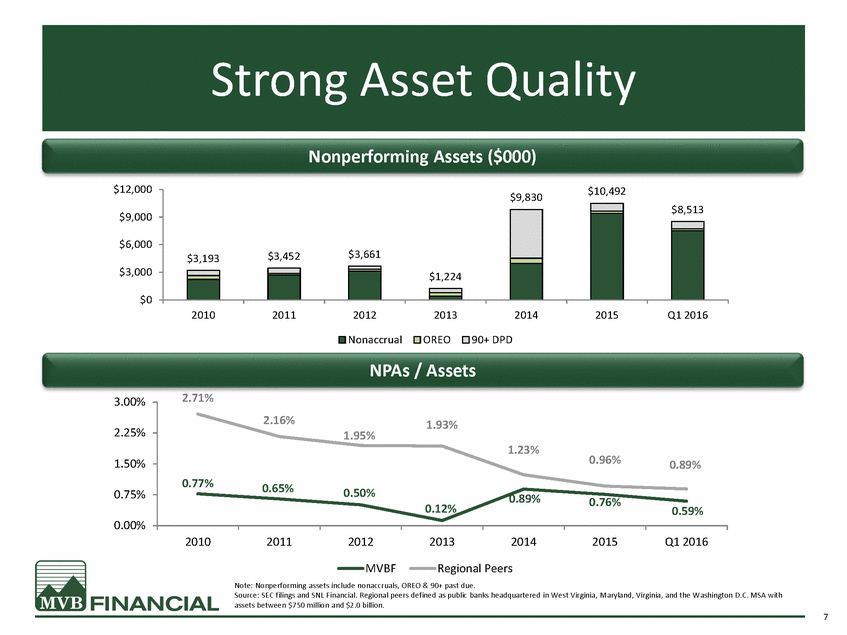
Nonperforming Assets ($000) $12,000 $9,000 $6,000 $3,000 $0 2010 2011 2012 2013 2014 2015 Q1 2016 Nonaccrual OREO 90+ DPD NPAs / Assets 2.71% 3.00% 2.25% 1.50% 0.75% 0.89% 0.76% 0.00% 2010 2011 2012 2013 2014 2015 Q1 2016 MVBF Regional Peers Note: Nonperforming assets include nonaccruals, OREO & 90+ past due. Source: SEC filings and SNL Financial. Regional peers defined as public banks headquartered in West Virginia, Maryland, Virginia, and the Washington D.C. MSA with assets between $750 million and $2.0 billion. 7 2.16% 1.93% 1.95% 1.23% 0.96%0.89% 0.77% 0.65% 0.50% 0.12%0.59% $9,830$10,492 $8,513 $3,193$3,452$3,661 $1,224 Strong Asset Quality |
|
|
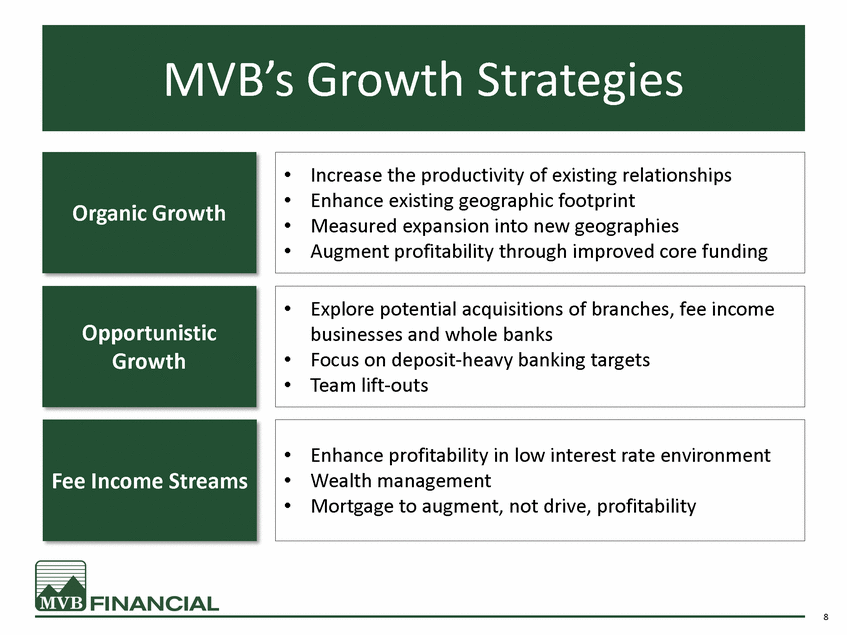
8 Fee Income Streams •Enhance profitability in low interest rate environment •Wealth management •Mortgage to augment, not drive, profitability Opportunistic Growth •Explore potential acquisitions of branches, fee income businesses and whole banks •Focus on deposit-heavy banking targets •Team lift-outs Organic Growth •Increase the productivity of existing relationships •Enhance existing geographic footprint •Measured expansion into new geographies •Augment profitability through improved core funding MVB’s Growth Strategies |
|
|
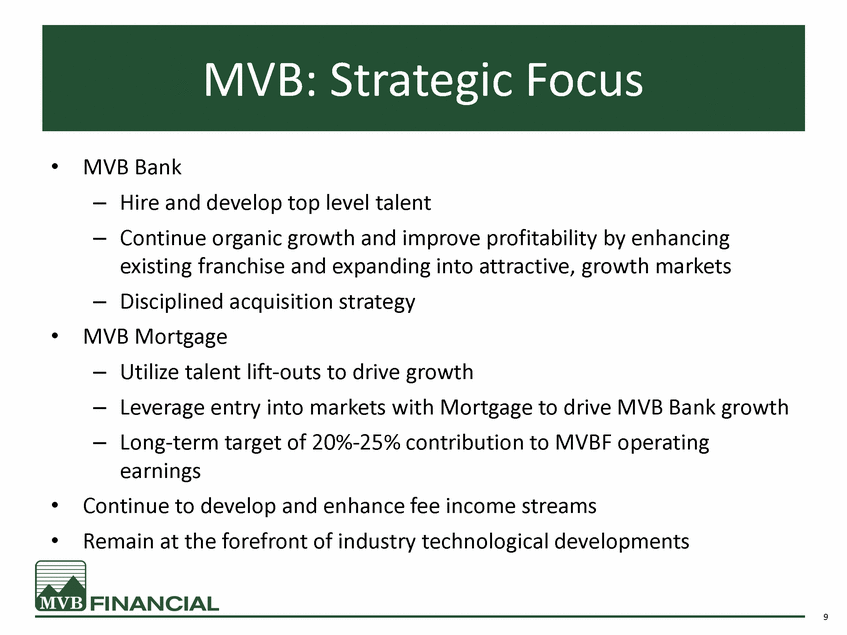
• MVB Bank – – Hire and develop top level talent Continue organic growth and improve profitability by enhancing existing franchise and expanding into attractive, growth markets Disciplined acquisition strategy – • MVB Mortgage – – – Utilize talent lift-outs to drive growth Leverage entry into markets with Mortgage to drive MVB Bank growth Long-term target of 20%-25% contribution to MVBF operating earnings • • Continue to develop and enhance fee income streams Remain at the forefront of industry technological developments 9 MVB: Strategic Focus |
|
|
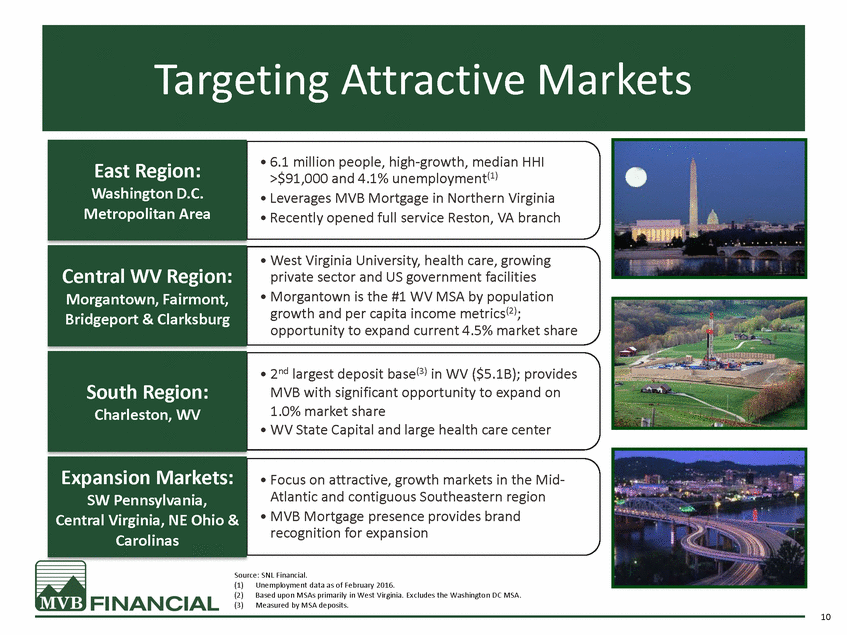
• 6.1 million people, high-growth, median HHI >$91,000 and 4.1% unemployment(1) • Leverages MVB Mortgage in Northern Virginia • Recently opened full service Reston, VA branch East Region: Washington D.C. Metropolitan Area • West Virginia University, health care, growing private sector and US government facilities • Morgantown is the #1 WV MSA by population growth and per capita income metrics(2); opportunity to expand current 4.5% market share Central WV Region: Morgantown, Fairmont, Bridgeport & Clarksburg • 2nd largest deposit base(3) in WV ($5.1B); provides MVB with significant opportunity to expand on 1.0% market share • WV State Capital and large health care center South Region: Charleston, WV Expansion Markets: SW Pennsylvania, Central Virginia, NE Ohio & Carolinas • Focus on attractive, growth markets in the Mid-Atlantic and contiguous Southeastern region • MVB Mortgage presence provides brand recognition for expansion Source: SNL Financial. (1) (2) (3) Unemployment data as of February 2016. Based upon MSAs primarily in West Virginia. Excludes the Washington DC MSA. Measured by MSA deposits. 10 Targeting Attractive Markets |
|
|
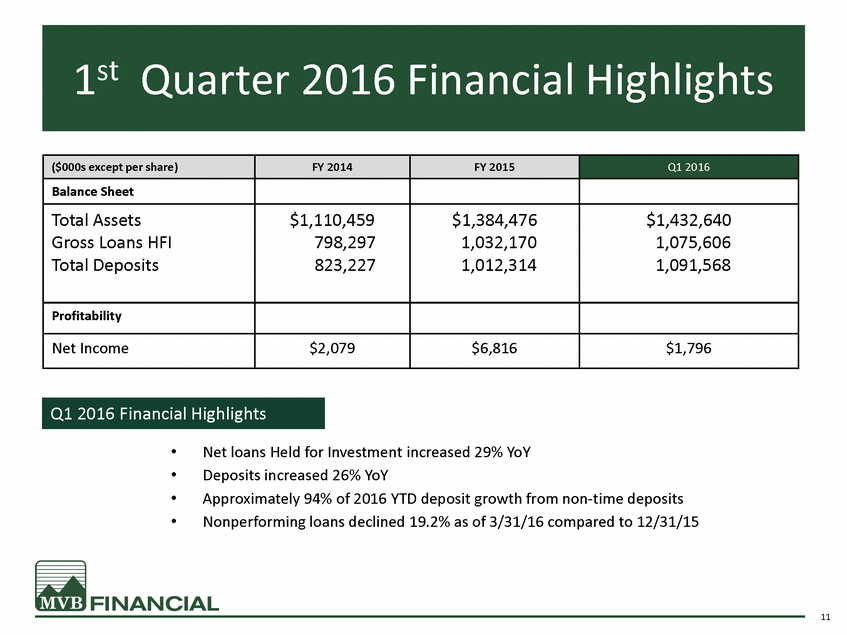
• • • • Net loans Held for Investment increased 29% YoY Deposits increased 26% YoY Approximately 94% of 2016 YTD deposit growth from non-time deposits Nonperforming loans declined 19.2% as of 3/31/16 compared to 12/31/15 11 Q1 2016 Financial Highlights ($000s except per share) FY 2014 FY 2015 Q1 2016 Balance Sheet Total Assets Gross Loans HFI Total Deposits $1,110,459 798,297 823,227 $1,384,476 1,032,170 1,012,314 $1,432,640 1,075,606 1,091,568 Profitability Net Income $2,079 $6,816 $1,796 1stQuarter 2016 Financial Highlights |
|
|
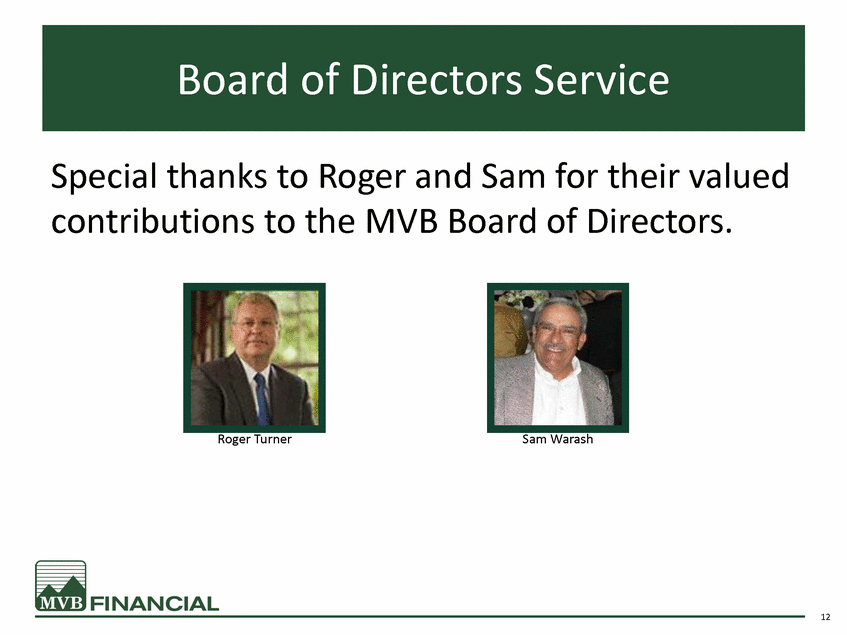
Special thanks to Roger and Sam for their valued contributions to the MVB Board of Directors. Roger Turner Sam Warash 12 Board of Directors Service |
|
|
Blue Ridge Mountains, Virginia THANK YOU! IR.MVBbanking.com 844-MVB-BANK |

