Attached files
| file | filename |
|---|---|
| 8-K - 8-K - PNMAC Holdings, Inc. | a15-17005_28k.htm |
| EX-99.2 - EX-99.2 - PNMAC Holdings, Inc. | a15-17005_2ex99d2.htm |
Exhibit 99.1
Investor Presentation May 2016

2 This presentation contains forward-looking statements within the meaning of Section 21E of the Securities Exchange Act of 1934, as amended, regarding management’s beliefs, estimates, projections and assumptions with respect to, among other things, the Company’s financial results, future operations, business plans and investment strategies, as well as industry and market conditions, all of which are subject to change. Words like “believe,” “expect,” “anticipate,” “promise,” “plan,” and other expressions or words of similar meanings, as well as future or conditional verbs such as “will,” “would,” “should,” “could,” or “may” are generally intended to identify forward-looking statements. Actual results and operations for any future period may vary materially from those projected herein, from past results discussed herein, or from illustrative examples provided herein. Factors which could cause actual results to differ materially from historical results or those anticipated include, but are not limited to: the continually changing federal, state and local laws and regulations applicable to the highly regulated industry in which the Company operates; lawsuits or governmental actions that may result from any noncompliance with the laws and regulations applicable to the Company’s businesses; the mortgage lending and servicing-related regulations promulgated by the Consumer Financial Protection Bureau and its enforcement of these regulations; the Company’s dependence on U.S. government-sponsored entities and changes in their current roles or their guarantees or guidelines; changes to government mortgage modification programs; the licensing and operational requirements of states and other jurisdictions applicable to the Company’s businesses, to which the Company’s bank competitors are not subject; foreclosure delays and changes in foreclosure practices; certain banking regulations that may limit the Company’s business activities; the Company’s dependence on the multifamily and commercial real estate sectors for future originations of commercial mortgage loans and other commercial real estate related loans; changes in macroeconomic and U.S. real estate market conditions; difficulties inherent in growing loan production volume; difficulties inherent in adjusting the size of the Company’s operations to reflect changes in business levels; purchase opportunities for mortgage servicing rights and the Company’s success in winning bids; changes in prevailing interest rates; increases in loan delinquencies and defaults; the Company’s reliance on PennyMac Mortgage Investment Trust (NYSE: PMT) as a significant source of financing for, and revenue related to, the Company’s mortgage banking business; any required additional capital and liquidity to support business growth that may not be available on acceptable terms, if at all; the Company’s obligation to indemnify third-party purchasers or repurchase loans if loans that it originates, acquires, services or assists in the fulfillment of, fail to meet certain criteria or characteristics or under other circumstances; the Company’s obligation to indemnify PMT and the Investment Funds if its services fail to meet certain criteria or characteristics or under other circumstances; decreases in the returns on the assets that the Company selects and manages for its clients, and the Company’s resulting management and incentive fees; the extensive amount of regulation applicable to the Company’s investment management segment; conflicts of interest in allocating the Company’s services and investment opportunities among itself and its advised entities; the effect of public opinion on the Company’s reputation; the Company’s recent growth; the Company’s ability to effectively identify, manage, monitor and mitigate financial risks; the Company’s initiation of new business activities or expansion of existing business activities; the Company’s ability to detect misconduct and fraud; and the Company’s ability to mitigate cybersecurity risks and cyber incidents. You should not place undue reliance on any forward-looking statement and should consider all of the uncertainties and risks described above, as well as those more fully discussed in reports and other documents filed by the Company with the Securities and Exchange Commission from time to time. The Company undertakes no obligation to publicly update or revise any forward-looking statements or any other information contained herein, and the statements made in this presentation are current as of the date of this presentation only. This presentation contains non-GAAP financial measures; Adjusted EBITDA, Adjusted EBITDA Margin and Adjusted Cashflow which are being provided only as supplemental information. Investors should consider these non-GAAP financial measures only in conjunction with the most directly comparable financial measures calculated and presented in accordance with U.S. generally accepted accounting principles (“GAAP”). Reconciliations of Adjusted EBITDA and Adjusted Cashflow to net income attributable to PFSI common stockholders, the most directly comparable GAAP financial measure; are included in this presentation. Adjusted EBITDA and Adjusted Cashflow are unaudited financial measures that are not calculated in accordance with GAAP and should not be considered as alternatives to net income, cash flow from operating activities or any other measure of financial performance or liquidity. Adjusted EBITDA and Adjusted Cashflow exclude some, but not all, items that affect net income and these measures may vary among other companies. Therefore, Adjusted EBITDA and Adjusted Cashflow may not be comparable to similarly titled measures of other companies. Adjusted EBITDA is defined as net income attributable to PFSI common stockholders plus net income attributable to noncontrolling interest, provision for income taxes, depreciation and amortization, decrease (increase) in fair value and provision for impairment of mortgage servicing rights (MSRs) carried at lower of amortized cost or fair value, increase (decrease) in fair value of excess servicing spread payable to PennyMac Mortgage Investment Trust, hedging losses (gains) associated with MSRs, and stock-based compensation expense to the extent that such items existed in the periods presented. Adjusted EBITDA Margin is defined as Adjusted EBITDA divided by net revenues. Adjusted Cashflow is defined as Adjusted EBITDA less MSRs resulting from loan sales plus amortization and realization of cashflows. Adjusted EBITDA, Adjusted EBITDA Margin and Adjusted Cashflow are metrics frequently used in our industry to measure performance and management believes that it provides supplemental information that is useful to investors. Disclaimer
Transaction Overview 3

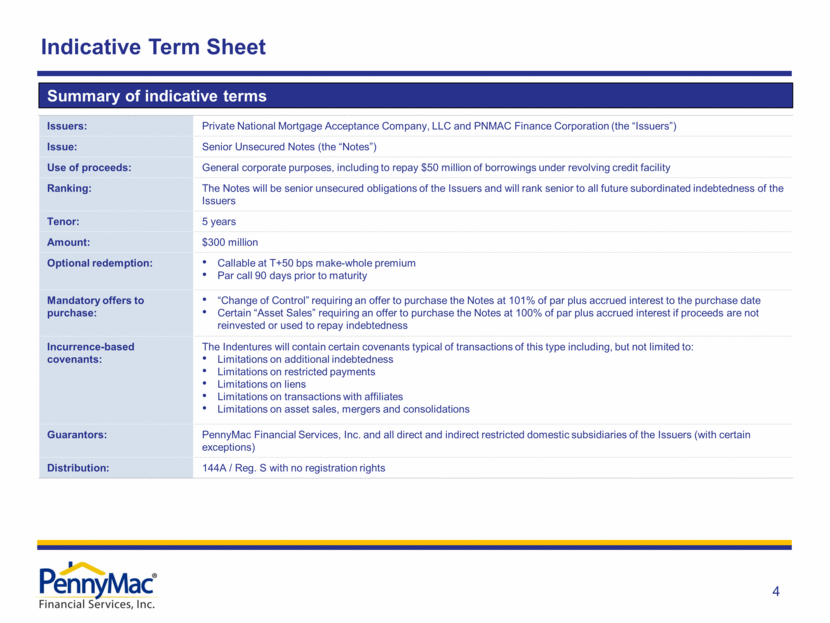
Indicative Term Sheet 4 Issuers: Private National Mortgage Acceptance Company, LLC and PNMAC Finance Corporation (the “Issuers”) Issue: Senior Unsecured Notes (the “Notes”) Use of proceeds: General corporate purposes, including to repay $50 million of borrowings under revolving credit facility Ranking: The Notes will be senior unsecured obligations of the Issuers and will rank senior to all future subordinated indebtedness of the Issuers Tenor: 5 years Amount: $300 million Optional redemption: Callable at T+50 bps make-whole premium Par call 90 days prior to maturity Mandatory offers to purchase: “Change of Control” requiring an offer to purchase the Notes at 101% of par plus accrued interest to the purchase date Certain “Asset Sales” requiring an offer to purchase the Notes at 100% of par plus accrued interest if proceeds are not reinvested or used to repay indebtedness Incurrence-based covenants: The Indentures will contain certain covenants typical of transactions of this type including, but not limited to: Limitations on additional indebtedness Limitations on restricted payments Limitations on liens Limitations on transactions with affiliates Limitations on asset sales, mergers and consolidations Guarantors: PennyMac Financial Services, Inc. and all direct and indirect restricted domestic subsidiaries of the Issuers (with certain exceptions) Distribution: 144A / Reg. S with no registration rights Summary of indicative terms
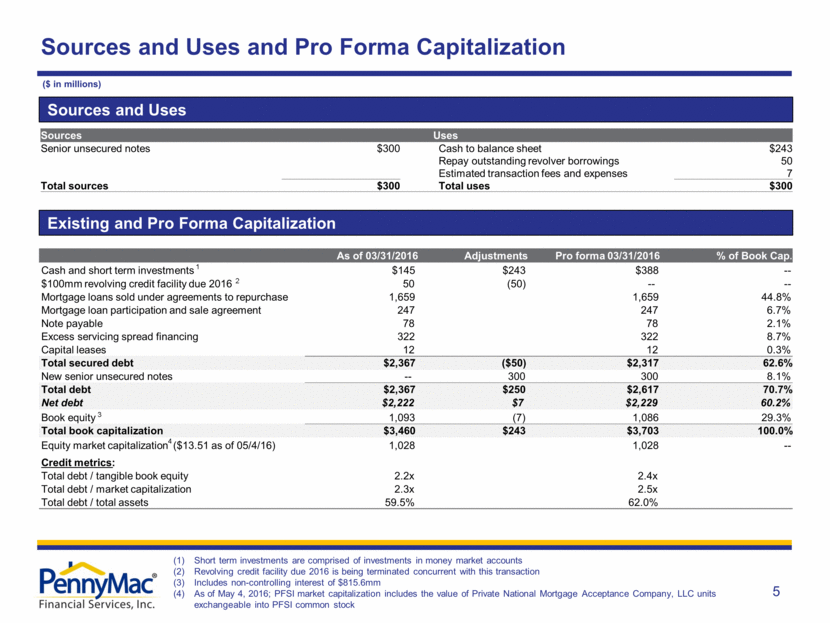
Sources and Uses and Pro Forma Capitalization 5 Sources and Uses Existing and Pro Forma Capitalization Short term investments are comprised of investments in money market accounts Revolving credit facility due 2016 is being terminated concurrent with this transaction Includes non-controlling interest of $815.6mm As of May 4, 2016; PFSI market capitalization includes the value of Private National Mortgage Acceptance Company, LLC units exchangeable into PFSI common stock ($ in millions) Sources Uses Senior unsecured notes $300 Cash to balance sheet $243 Repay outstanding revolver borrowings 50 Estimated transaction fees and expenses 7 Total sources $300 Total uses $300 As of 03/31/2016 Adjustments Pro forma 03/31/2016 % of Book Cap. Cash and short term investments 1 $145 $243 $388 -- $100mm revolving credit facility due 2016 2 50 (50) -- -- Mortgage loans sold under agreements to repurchase 1,659 1,659 44.8% Mortgage loan participation and sale agreement 247 247 6.7% Note payable 78 78 2.1% Excess servicing spread financing 322 322 8.7% Capital leases 12 12 0.3% Total secured debt $2,367 ($50) $2,317 62.6% New senior unsecured notes -- 300 300 8.1% Total debt $2,367 $250 $2,617 70.7% Net debt $2,222 $7 $2,229 60.2% Book equity 3 1,093 (7) 1,086 29.3% Total book capitalization $3,460 $243 $3,703 100.0% Equity market capitalization 4 ($13.51 as of 05/4/16) 1,028 1,028 -- Credit metrics: Total debt / tangible book equity 2.2x 2.4x Total debt / market capitalization 2.3x 2.5x Total debt / total assets 59.5% 62.0%
Presenters David Spector Executive Managing Director, President & Chief Operating Officer, and Director Member of the Board of Directors and President and Chief Operating Officer of PennyMac Financial Services, Inc. and Private National Mortgage Acceptance Company, LLC since their formations Member of the Board of Trustees of PennyMac Mortgage Investment Trust since May 2009 and Chairman of the Board of Directors of both PNMAC Mortgage Opportunity Fund, LP and PNMAC Mortgage Opportunity Fund, LLC since May 2008 Previously served as Co-Head of Global Residential Mortgages for Morgan Stanley and as Senior Managing Director for Secondary Marketing at Countrywide Financial Corporation Holds a BA from the University of California, Los Angeles Andrew Chang Senior Managing Director & Chief Business Development Officer Chief Business Development Officer of PennyMac Financial Services, Inc. and Private National Mortgage Acceptance Company, LLC since their formations Oversees PennyMac’s corporate development, portfolio acquisitions and investor relations activities Previously served as a director at BlackRock, Inc. and a senior member in its advisory services practice and Engagement Manager at McKinsey & Company Holds an AB from Harvard University 6

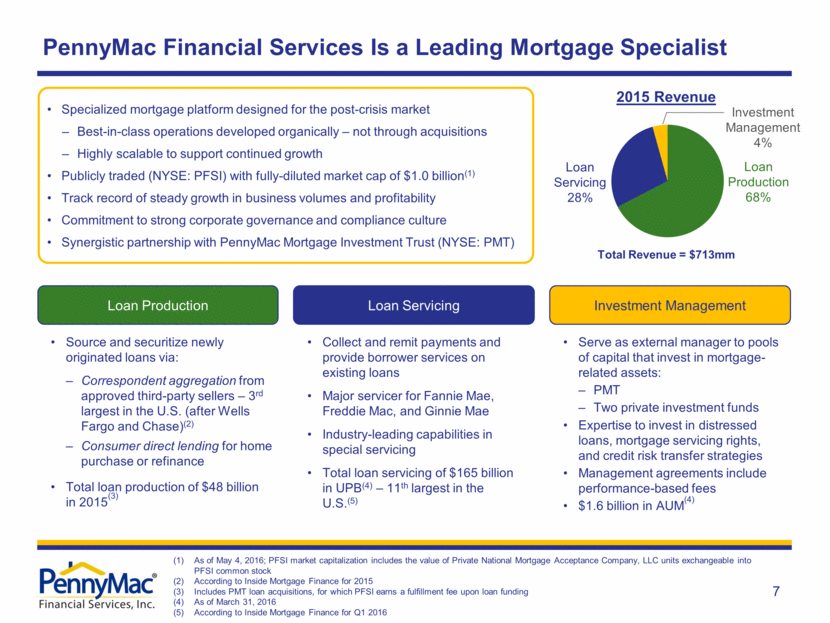
PennyMac Financial Services Is a Leading Mortgage Specialist Source and securitize newly originated loans via: Correspondent aggregation from approved third-party sellers – 3rd largest in the U.S. (after Wells Fargo and Chase)(2) Consumer direct lending for home purchase or refinance Total loan production of $48 billion in 2015(3) Specialized mortgage platform designed for the post-crisis market Best-in-class operations developed organically – not through acquisitions Highly scalable to support continued growth Publicly traded (NYSE: PFSI) with fully-diluted market cap of $1.0 billion(1) Track record of steady growth in business volumes and profitability Commitment to strong corporate governance and compliance culture Synergistic partnership with PennyMac Mortgage Investment Trust (NYSE: PMT) Collect and remit payments and provide borrower services on existing loans Major servicer for Fannie Mae, Freddie Mac, and Ginnie Mae Industry-leading capabilities in special servicing Total loan servicing of $165 billion in UPB(4) – 11th largest in the U.S.(5) Serve as external manager to pools of capital that invest in mortgage-related assets: PMT Two private investment funds Expertise to invest in distressed loans, mortgage servicing rights, and credit risk transfer strategies Management agreements include performance-based fees $1.6 billion in AUM(4) As of May 4, 2016; PFSI market capitalization includes the value of Private National Mortgage Acceptance Company, LLC units exchangeable into PFSI common stock According to Inside Mortgage Finance for 2015 Includes PMT loan acquisitions, for which PFSI earns a fulfillment fee upon loan funding As of March 31, 2016 According to Inside Mortgage Finance for Q1 2016 Loan Production Loan Servicing Investment Management Loan Production 68% Investment Management 4% Loan Servicing 28% 2015 Revenue 7 Total Revenue = $713mm
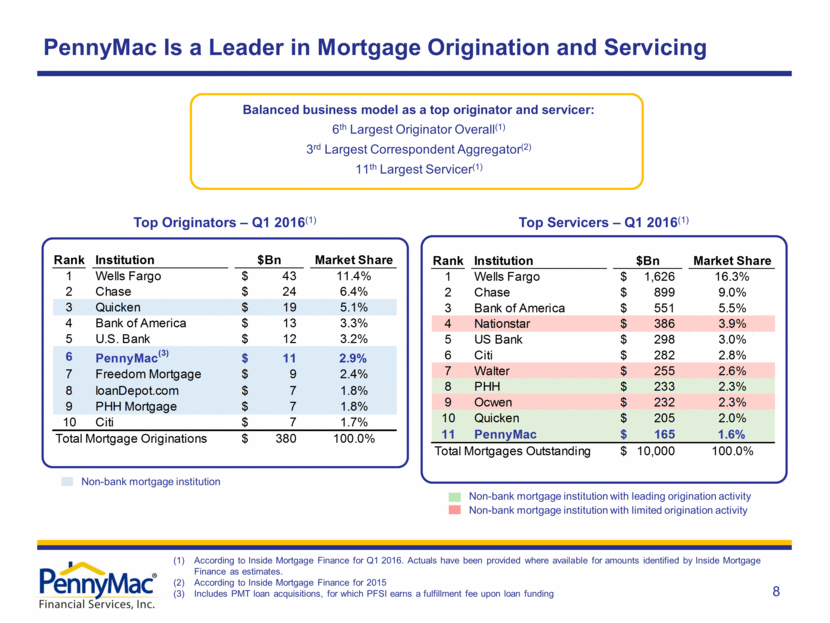
PennyMac Is a Leader in Mortgage Origination and Servicing Top Originators – Q1 2016(1) Top Servicers – Q1 2016(1) Balanced business model as a top originator and servicer: 6th Largest Originator Overall(1) 3rd Largest Correspondent Aggregator(2) 11th Largest Servicer(1) Non-bank mortgage institution with leading origination activity Non-bank mortgage institution with limited origination activity Non-bank mortgage institution According to Inside Mortgage Finance for Q1 2016. Actuals have been provided where available for amounts identified by Inside Mortgage Finance as estimates. According to Inside Mortgage Finance for 2015 Includes PMT loan acquisitions, for which PFSI earns a fulfillment fee upon loan funding 8 Rank Institution $Bn Market Share 1 Wells Fargo 1,626 $ 16.3% 2 Chase 899 $ 9.0% 3 Bank of America 551 $ 5.5% 4 Nationstar 386 $ 3.9% 5 US Bank 298 $ 3.0% 6 Citi 282 $ 2.8% 7 Walter 255 $ 2.6% 8 PHH 233 $ 2.3% 9 Ocwen 232 $ 2.3% 10 Quicken 205 $ 2.0% 11 PennyMac 165 $ 1.6% Total Mortgages Outstanding 10,000 $ 100.0% Rank Institution $Bn Market Share 1 Wells Fargo 43 $ 11.4% 2 Chase 24 $ 6.4% 3 Quicken 19 $ 5.1% 4 Bank of America 13 $ 3.3% 5 U.S. Bank 12 $ 3.2% 6 PennyMac (3) 11 $ 2.9% 7 Freedom Mortgage 9 $ 2.4% 8 loanDepot.com 7 $ 1.8% 9 PHH Mortgage 7 $ 1.8% 10 Citi 7 $ 1.7% Total Mortgage Originations 380 $ 100.0%
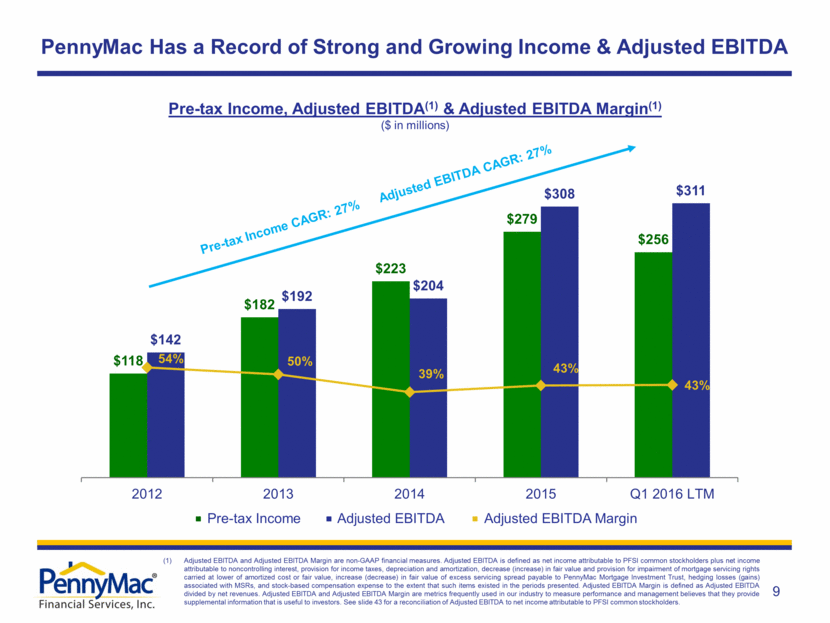
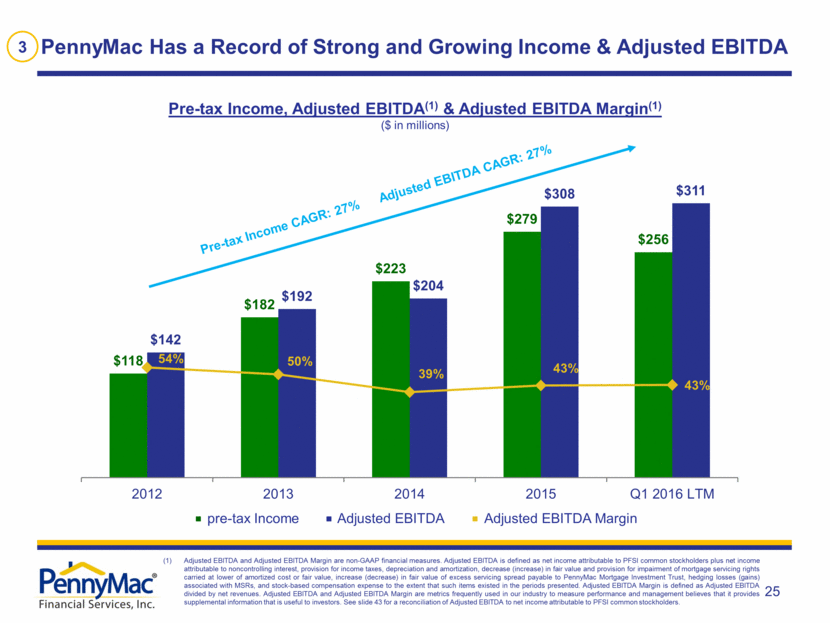
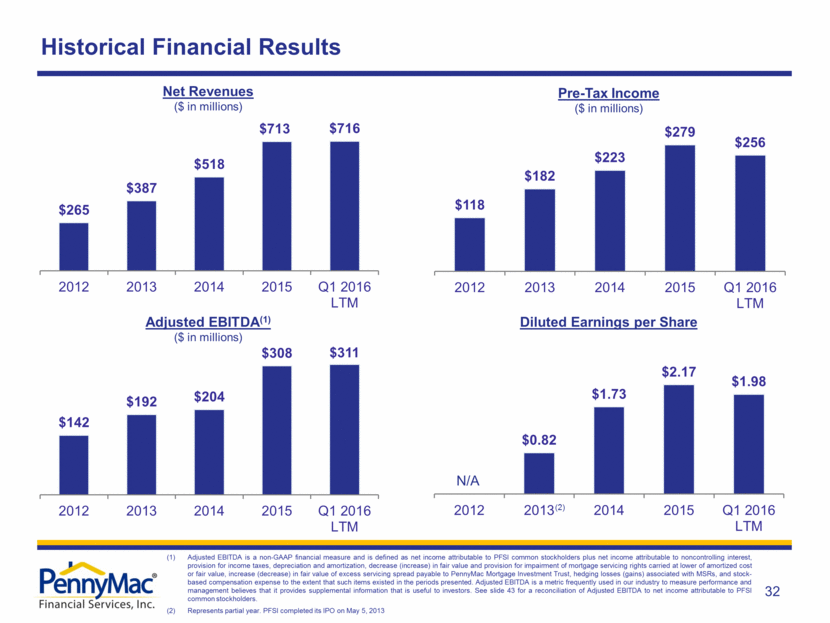
PennyMac Has a Record of Strong and Growing Income & Adjusted EBITDA Pre-tax Income, Adjusted EBITDA(1) & Adjusted EBITDA Margin(1) ($ in millions) Adjusted EBITDA Pre-tax Income Pre-tax Income CAGR: 27% Adjusted EBITDA CAGR: 27% Adjusted EBITDA Margin Adjusted EBITDA and Adjusted EBITDA Margin are non-GAAP financial measures. Adjusted EBITDA is defined as net income attributable to PFSI common stockholders plus net income attributable to noncontrolling interest, provision for income taxes, depreciation and amortization, decrease (increase) in fair value and provision for impairment of mortgage servicing rights carried at lower of amortized cost or fair value, increase (decrease) in fair value of excess servicing spread payable to PennyMac Mortgage Investment Trust, hedging losses (gains) associated with MSRs, and stock-based compensation expense to the extent that such items existed in the periods presented. Adjusted EBITDA Margin is defined as Adjusted EBITDA divided by net revenues. Adjusted EBITDA and Adjusted EBITDA Margin are metrics frequently used in our industry to measure performance and management believes that they provide supplemental information that is useful to investors. See slide 43 for a reconciliation of Adjusted EBITDA to net income attributable to PFSI common stockholders. 9 $118 $182 $223 $279 $256 $142 $192 $204 $308 $311 54% 50% 39% 43% 43% -10% 10% 30% 50% 70% 90% 110% 130% 150% 0 50 100 150 200 250 300 2012 2013 2014 2015 Q1 2016 LTM
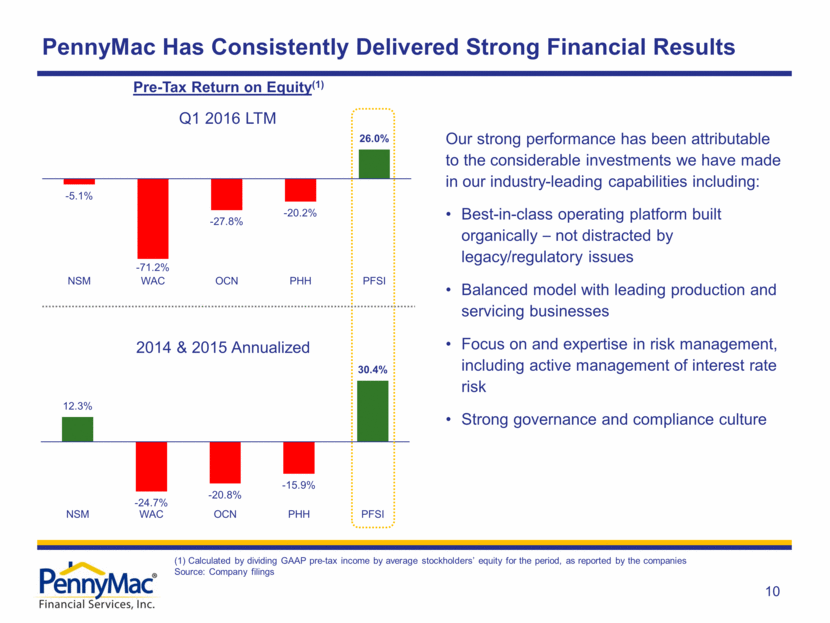
PennyMac Has Consistently Delivered Strong Financial Results Our strong performance has been attributable to the considerable investments we have made in our industry-leading capabilities including: Best-in-class operating platform built organically – not distracted by legacy/regulatory issues Balanced model with leading production and servicing businesses Focus on and expertise in risk management, including active management of interest rate risk Strong governance and compliance culture (1) Calculated by dividing GAAP pre-tax income by average stockholders’ equity for the period, as reported by the companies Source: Company filings Pre-Tax Return on Equity(1) 10 - 5.1% - 71.2% - 27.8% - 20.2% 26.0% NSM WAC OCN PHH PFSI Q1 2016 LTM 12.3% - 24.7% - 20.8% - 15.9% 30.4% NSM WAC OCN PHH PFSI 2014 & 2015 Annualized
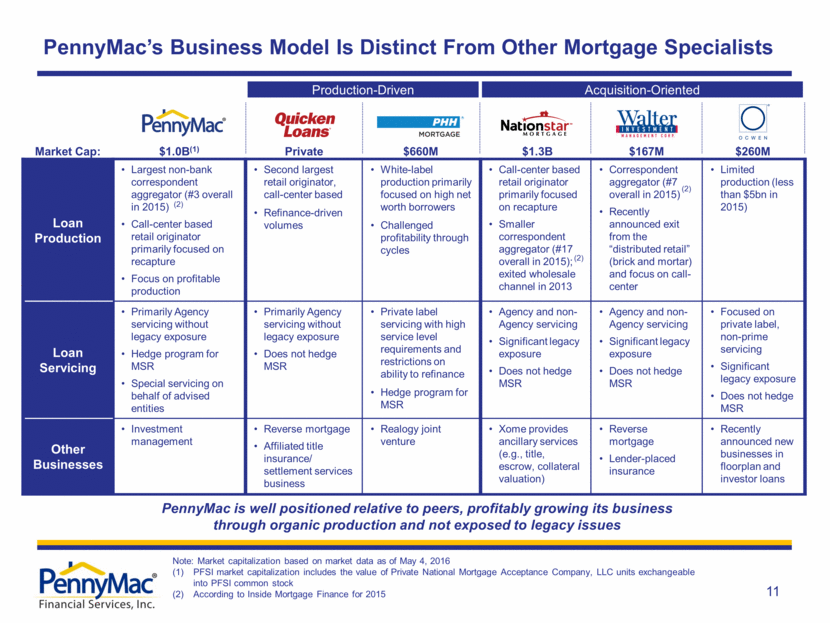
PennyMac’s Business Model Is Distinct From Other Mortgage Specialists Loan Production Largest non-bank correspondent aggregator (#3 overall in 2015) Call-center based retail originator primarily focused on recapture Focus on profitable production Second largest retail originator, call-center based Refinance-driven volumes White-label production primarily focused on high net worth borrowers Challenged profitability through cycles Call-center based retail originator primarily focused on recapture Smaller correspondent aggregator (#17 overall in 2015); exited wholesale channel in 2013 Correspondent aggregator (#7 overall in 2015) Recently announced exit from the “distributed retail” (brick and mortar) and focus on call-center Limited production (less than $5bn in 2015) Loan Servicing Primarily Agency servicing without legacy exposure Hedge program for MSR Special servicing on behalf of advised entities Primarily Agency servicing without legacy exposure Does not hedge MSR Private label servicing with high service level requirements and restrictions on ability to refinance Hedge program for MSR Agency and non-Agency servicing Significant legacy exposure Does not hedge MSR Agency and non-Agency servicing Significant legacy exposure Does not hedge MSR Focused on private label, non-prime servicing Significant legacy exposure Does not hedge MSR Other Businesses Investment management Reverse mortgage Affiliated title insurance/ settlement services business Realogy joint venture Xome provides ancillary services (e.g., title, escrow, collateral valuation) Reverse mortgage Lender-placed insurance Recently announced new businesses in floorplan and investor loans Production-Driven Acquisition-Oriented PennyMac is well positioned relative to peers, profitably growing its business through organic production and not exposed to legacy issues Market Cap: $1.0B(1) Private $660M Note: Market capitalization based on market data as of May 4, 2016 PFSI market capitalization includes the value of Private National Mortgage Acceptance Company, LLC units exchangeable into PFSI common stock According to Inside Mortgage Finance for 2015 $1.3B $167M $260M (2) (2) (2) 11
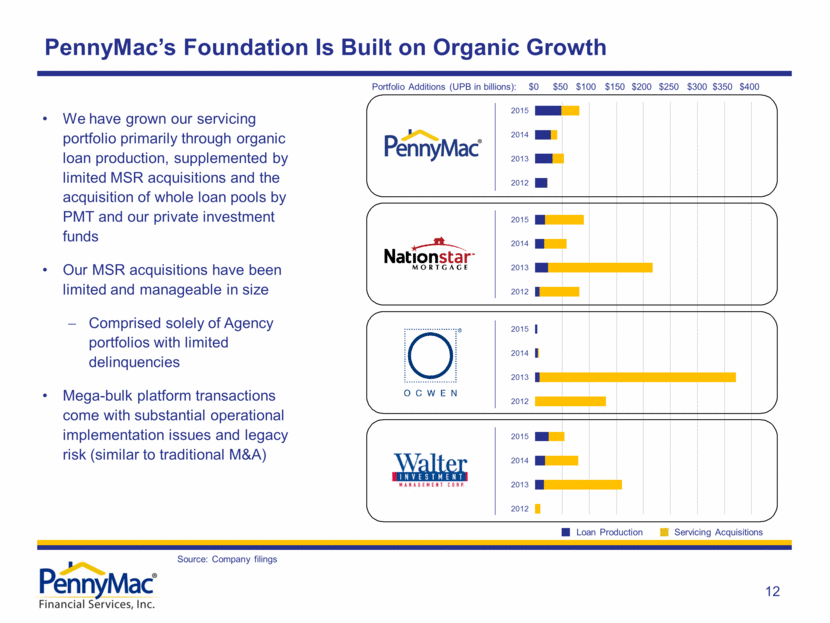
PennyMac’s Foundation Is Built on Organic Growth We have grown our servicing portfolio primarily through organic loan production, supplemented by limited MSR acquisitions and the acquisition of whole loan pools by PMT and our private investment funds Our MSR acquisitions have been limited and manageable in size Comprised solely of Agency portfolios with limited delinquencies Mega-bulk platform transactions come with substantial operational implementation issues and legacy risk (similar to traditional M&A) Source: Company filings Servicing Acquisitions Loan Production $300 $250 $200 $150 $50 Portfolio Additions (UPB in billions): $100 $350 $400 $0 12 2012 2013 2014 2015 2012 2013 2014 2015 2012 2013 2014 2015 2012 2013 2014 2015
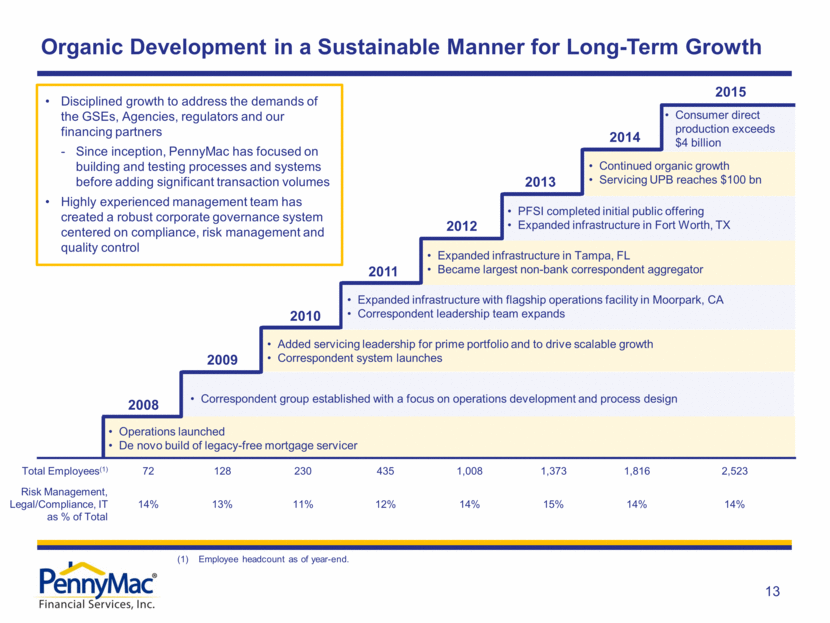
Organic Development in a Sustainable Manner for Long-Term Growth Operations launched De novo build of legacy-free mortgage servicer 2008 2009 2010 2011 2012 2013 2014 2015 Correspondent group established with a focus on operations development and process design Added servicing leadership for prime portfolio and to drive scalable growth Correspondent system launches Expanded infrastructure with flagship operations facility in Moorpark, CA Correspondent leadership team expands Expanded infrastructure in Tampa, FL Became largest non-bank correspondent aggregator PFSI completed initial public offering Expanded infrastructure in Fort Worth, TX Continued organic growth Servicing UPB reaches $100 bn Consumer direct production exceeds $4 billion Disciplined growth to address the demands of the GSEs, Agencies, regulators and our financing partners - Since inception, PennyMac has focused on building and testing processes and systems before adding significant transaction volumes Highly experienced management team has created a robust corporate governance system centered on compliance, risk management and quality control Total Employees(1) 72 128 230 435 1,008 1,373 1,816 2,523 Risk Management, Legal/Compliance, IT as % of Total 14% 13% 11% 12% 14% 15% 14% 14% Employee headcount as of year-end. 13
Technology Is a Key Element of PFSI’s Leading Operational Platform Leading Technology Currently in Place and Under Development Correspondent Production Systems allow for highly automated and scalable loan fulfillment Best-in-class customer portal that facilitates transactions and communications with seller network Proprietary technologies include optical character recognition to improve accuracy and operational efficiency Pricing and margin management systems to optimize the business opportunity and profitability Consumer Direct Lending Leading technology already in place includes web-based loan origination tools, electronic document signing and transfer, and lead management for servicing recapture and non-portfolio leads Further enhancements by leveraging tools developed in the company’s Mortgage Fulfillment Division Developing web and mobile technology to extend to more of the mortgage transaction including loan processing status and borrower communication/interaction Loan Servicing Proprietary applications in place include workflow management, loss mitigation, default process tracking, electronic document storage and rendering, and front-end user experience Ongoing investment in tools to further enhance customer interaction, automate workflows and optimize productivity Systems designed to augment the capabilities of the core loan servicing system (MSP) Technology combined with PFSI’s leading operating capabilities and management team’s substantial expertise creates a distinctive competitive edge 14
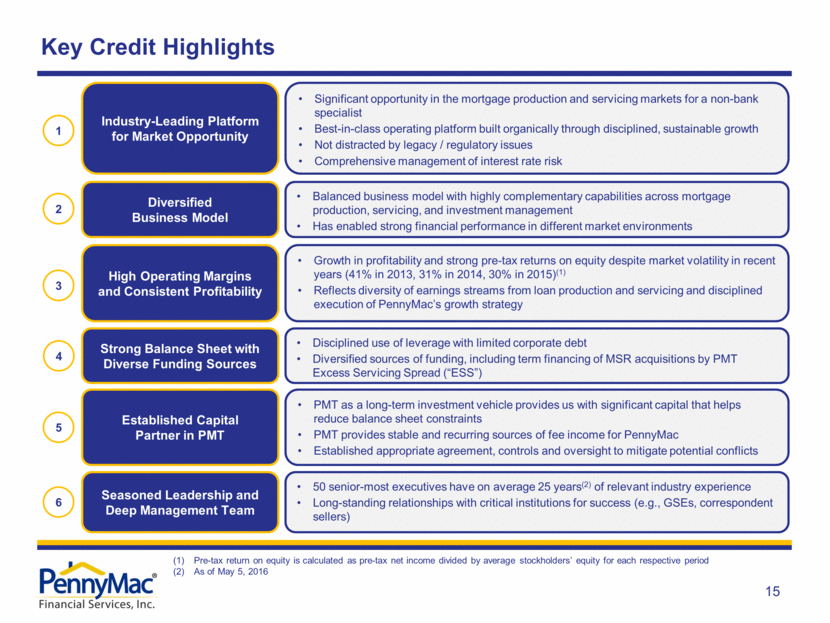
Key Credit Highlights Pre-tax return on equity is calculated as pre-tax net income divided by average stockholders’ equity for each respective period As of May 5, 2016 Industry-Leading Platform for Market Opportunity 1 Significant opportunity in the mortgage production and servicing markets for a non-bank specialist Best-in-class operating platform built organically through disciplined, sustainable growth Not distracted by legacy / regulatory issues Comprehensive management of interest rate risk Diversified Business Model 2 Balanced business model with highly complementary capabilities across mortgage production, servicing, and investment management Has enabled strong financial performance in different market environments High Operating Margins and Consistent Profitability 3 Growth in profitability and strong pre-tax returns on equity despite market volatility in recent years (41% in 2013, 31% in 2014, 30% in 2015)(1) Reflects diversity of earnings streams from loan production and servicing and disciplined execution of PennyMac’s growth strategy Strong Balance Sheet with Diverse Funding Sources Disciplined use of leverage with limited corporate debt Diversified sources of funding, including term financing of MSR acquisitions by PMT Excess Servicing Spread (“ESS”) 4 Established Capital Partner in PMT PMT as a long-term investment vehicle provides us with significant capital that helps reduce balance sheet constraints PMT provides stable and recurring sources of fee income for PennyMac Established appropriate agreement, controls and oversight to mitigate potential conflicts 5 6 Seasoned Leadership and Deep Management Team 50 senior-most executives have on average 25 years(2) of relevant industry experience Long-standing relationships with critical institutions for success (e.g., GSEs, correspondent sellers) 15
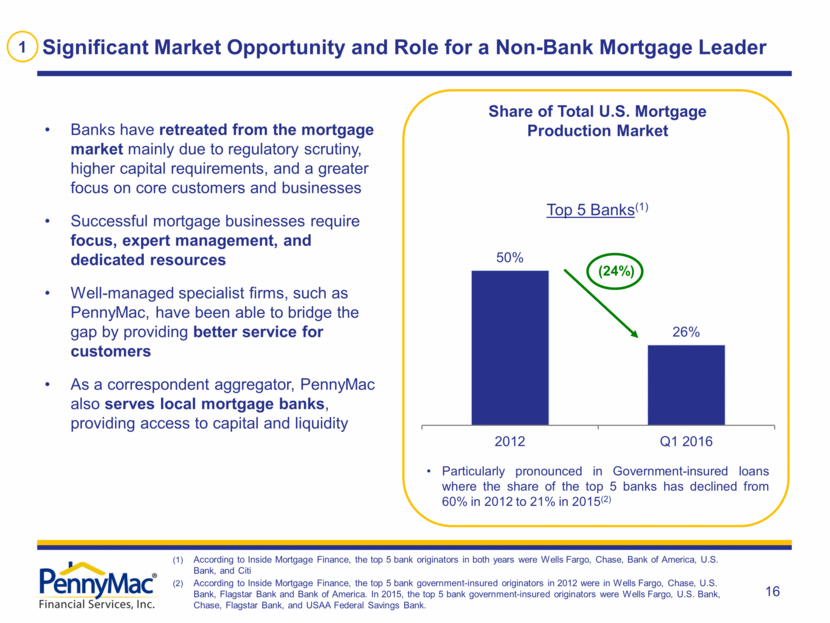
Significant Market Opportunity and Role for a Non-Bank Mortgage Leader Banks have retreated from the mortgage market mainly due to regulatory scrutiny, higher capital requirements, and a greater focus on core customers and businesses Successful mortgage businesses require focus, expert management, and dedicated resources Well-managed specialist firms, such as PennyMac, have been able to bridge the gap by providing better service for customers As a correspondent aggregator, PennyMac also serves local mortgage banks, providing access to capital and liquidity According to Inside Mortgage Finance, the top 5 bank originators in both years were Wells Fargo, Chase, Bank of America, U.S. Bank, and Citi According to Inside Mortgage Finance, the top 5 bank government-insured originators in 2012 were in Wells Fargo, Chase, U.S. Bank, Flagstar Bank and Bank of America. In 2015, the top 5 bank government-insured originators were Wells Fargo, U.S. Bank, Chase, Flagstar Bank, and USAA Federal Savings Bank. V Share of Total U.S. Mortgage Production Market Top 5 Banks(1) (24%) 1 Particularly pronounced in Government-insured loans where the share of the top 5 banks has declined from 60% in 2012 to 21% in 2015(2) 16 50% 26% 2012 Q1 2016
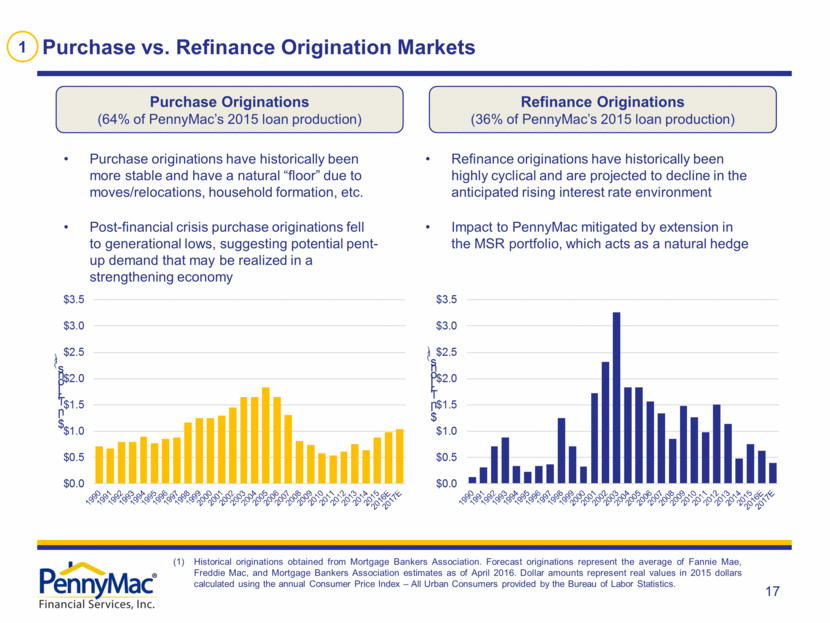
Purchase vs. Refinance Origination Markets Purchase originations have historically been more stable and have a natural “floor” due to moves/relocations, household formation, etc. Post-financial crisis purchase originations fell to generational lows, suggesting potential pent-up demand that may be realized in a strengthening economy Historical originations obtained from Mortgage Bankers Association. Forecast originations represent the average of Fannie Mae, Freddie Mac, and Mortgage Bankers Association estimates as of April 2016. Dollar amounts represent real values in 2015 dollars calculated using the annual Consumer Price Index – All Urban Consumers provided by the Bureau of Labor Statistics. Refinance originations have historically been highly cyclical and are projected to decline in the anticipated rising interest rate environment Impact to PennyMac mitigated by extension in the MSR portfolio, which acts as a natural hedge Purchase Originations (64% of PennyMac’s 2015 loan production) Refinance Originations (36% of PennyMac’s 2015 loan production) 1 17 $0.0 $0.5 $1.0 $1.5 $2.0 $2.5 $3.0 $3.5 $ i n T r i l l i o n s ( 1 ) $0.0 $0.5 $1.0 $1.5 $2.0 $2.5 $3.0 $3.5 $ i n T r i l l i o n s ( 1 )
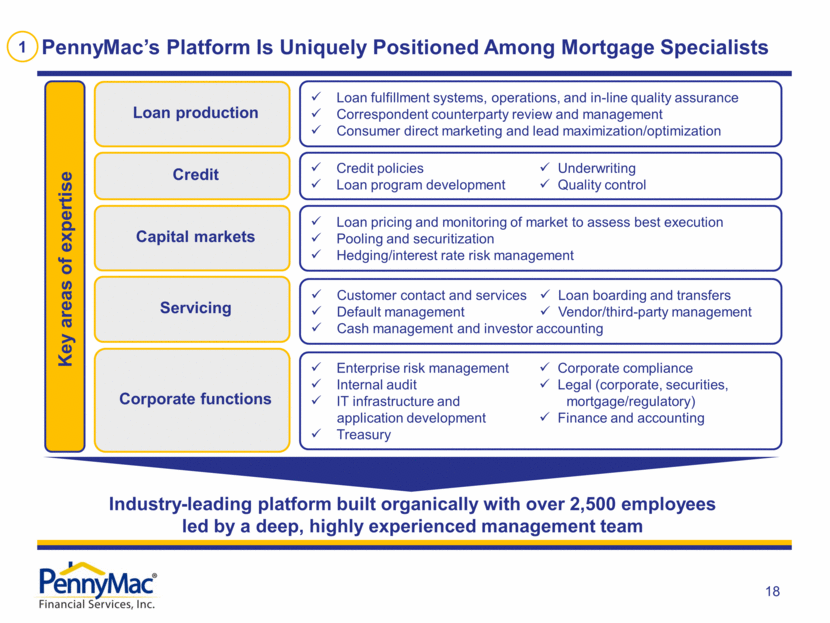
PennyMac’s Platform Is Uniquely Positioned Among Mortgage Specialists 1 Loan production Credit Capital markets Servicing Corporate functions Loan fulfillment systems, operations, and in-line quality assurance Correspondent counterparty review and management Consumer direct marketing and lead maximization/optimization Credit policies Underwriting Loan program development Quality control Enterprise risk management Corporate compliance Internal audit Legal (corporate, securities, IT infrastructure and mortgage/regulatory) application development Finance and accounting Treasury Customer contact and services Loan boarding and transfers Default management Vendor/third-party management Cash management and investor accounting Loan pricing and monitoring of market to assess best execution Pooling and securitization Hedging/interest rate risk management Industry-leading platform built organically with over 2,500 employees led by a deep, highly experienced management team Key areas of expertise 18
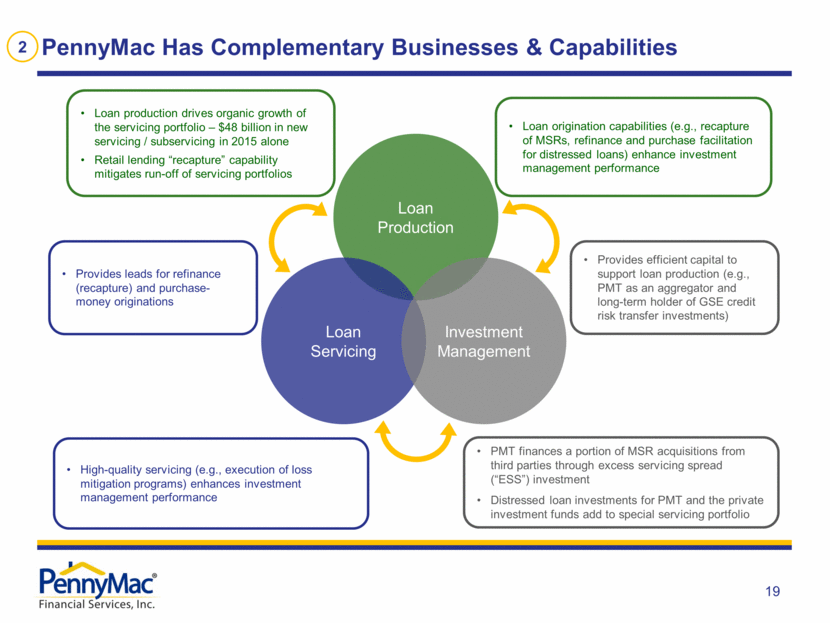
PennyMac Has Complementary Businesses & Capabilities Loan Production Loan Servicing Investment Management PMT finances a portion of MSR acquisitions from third parties through excess servicing spread (“ESS”) investment Distressed loan investments for PMT and the private investment funds add to special servicing portfolio High-quality servicing (e.g., execution of loss mitigation programs) enhances investment management performance Provides leads for refinance (recapture) and purchase-money originations Loan production drives organic growth of the servicing portfolio – $48 billion in new servicing / subservicing in 2015 alone Retail lending “recapture” capability mitigates run-off of servicing portfolios Provides efficient capital to support loan production (e.g., PMT as an aggregator and long-term holder of GSE credit risk transfer investments) Loan origination capabilities (e.g., recapture of MSRs, refinance and purchase facilitation for distressed loans) enhance investment management performance 2 19
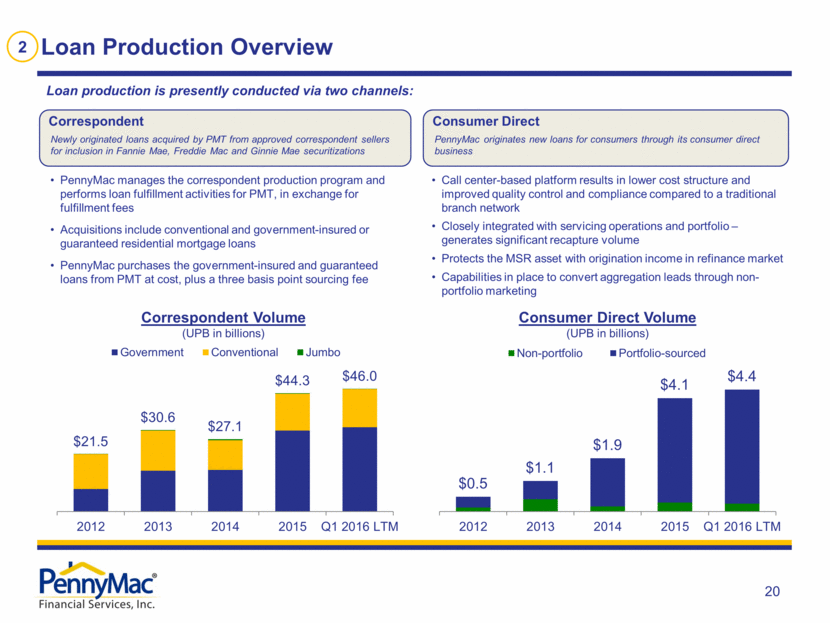
Loan production is presently conducted via two channels: Consumer Direct Volume (UPB in billions) Loan Production Overview 2 Correspondent Volume (UPB in billions) PennyMac manages the correspondent production program and performs loan fulfillment activities for PMT, in exchange for fulfillment fees Acquisitions include conventional and government-insured or guaranteed residential mortgage loans PennyMac purchases the government-insured and guaranteed loans from PMT at cost, plus a three basis point sourcing fee Call center-based platform results in lower cost structure and improved quality control and compliance compared to a traditional branch network Closely integrated with servicing operations and portfolio – generates significant recapture volume Protects the MSR asset with origination income in refinance market Capabilities in place to convert aggregation leads through non-portfolio marketing Newly originated loans acquired by PMT from approved correspondent sellers for inclusion in Fannie Mae, Freddie Mac and Ginnie Mae securitizations Correspondent PennyMac originates new loans for consumers through its consumer direct business Consumer Direct 20 $0.5 $1.1 $1.9 $4.1 $4.4 2012 2013 2014 2015 Q1 2016 LTM Non-portfolio Portfolio-sourced $21.5 $30.6 $27.1 $44.3 $46.0 2012 2013 2014 2015 Q1 2016 LTM Government Conventional Jumbo
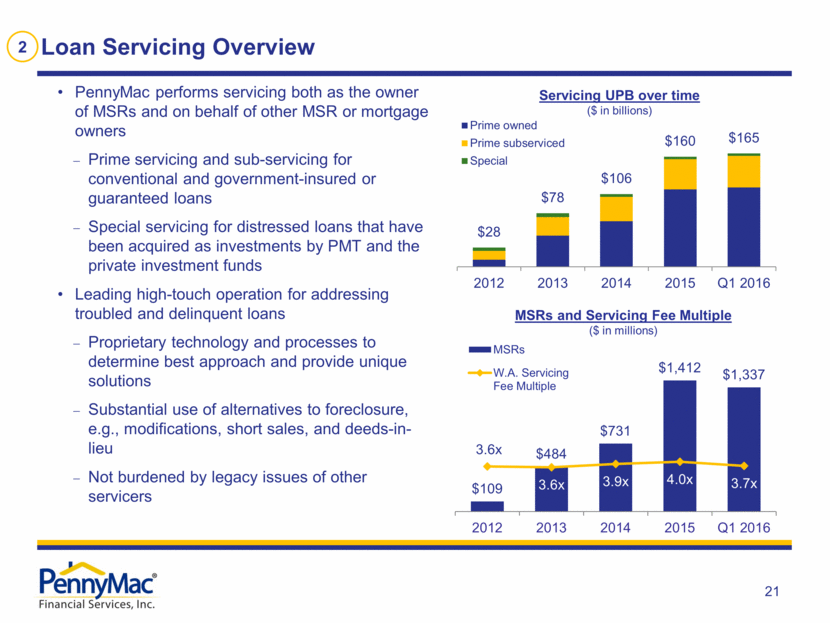
Loan Servicing Overview 2 Servicing UPB over time ($ in billions) MSRs and Servicing Fee Multiple ($ in millions) PennyMac performs servicing both as the owner of MSRs and on behalf of other MSR or mortgage owners Prime servicing and sub-servicing for conventional and government-insured or guaranteed loans Special servicing for distressed loans that have been acquired as investments by PMT and the private investment funds Leading high-touch operation for addressing troubled and delinquent loans Proprietary technology and processes to determine best approach and provide unique solutions Substantial use of alternatives to foreclosure, e.g., modifications, short sales, and deeds-in-lieu Not burdened by legacy issues of other servicers 21 $109 $484 $731 $1,412 $1,337 3.6x 3.6x 3.9x 4.0x 3.7x 0.0% 200.0% 400.0% 600.0% 800.0% 1000.0% 1200.0% 0 200 400 600 800 1000 1200 1400 1600 2012 2013 2014 2015 Q1 2016 MSRs W.A. Servicing Fee Multiple $28 $78 $106 $160 $165 2012 2013 2014 2015 Q1 2016 Prime owned Prime subserviced Special
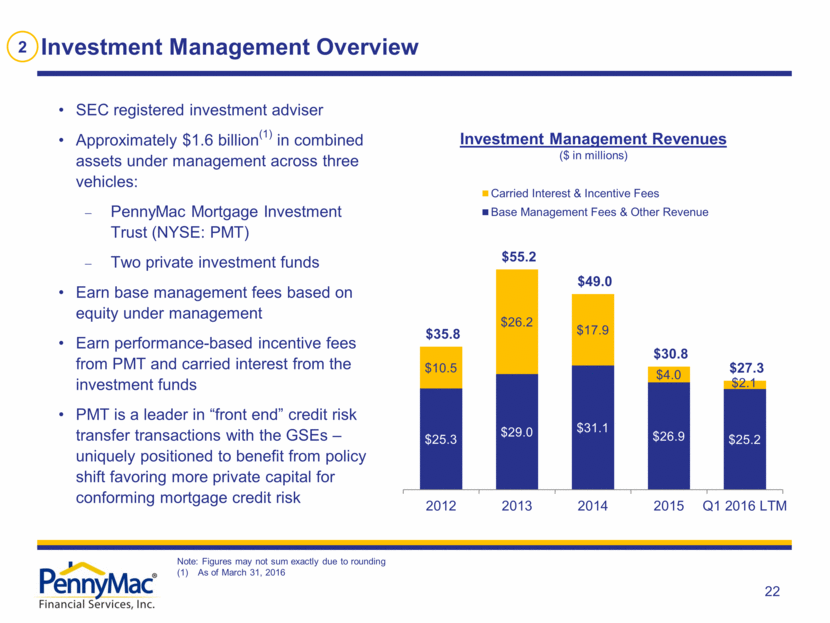
Investment Management Overview 2 SEC registered investment adviser Approximately $1.6 billion(1) in combined assets under management across three vehicles: PennyMac Mortgage Investment Trust (NYSE: PMT) Two private investment funds Earn base management fees based on equity under management Earn performance-based incentive fees from PMT and carried interest from the investment funds PMT is a leader in “front end” credit risk transfer transactions with the GSEs –uniquely positioned to benefit from policy shift favoring more private capital for conforming mortgage credit risk Investment Management Revenues ($ in millions) Note: Figures may not sum exactly due to rounding As of March 31, 2016 22 $25.3 $29.0 $31.1 $26.9 $25.2 $10.5 $26.2 $17.9 $4.0 $2.1 $35.8 $55.2 $49.0 $30.8 $27.3 2012 2013 2014 2015 Q1 2016 LTM Carried Interest & Incentive Fees Base Management Fees & Other Revenue
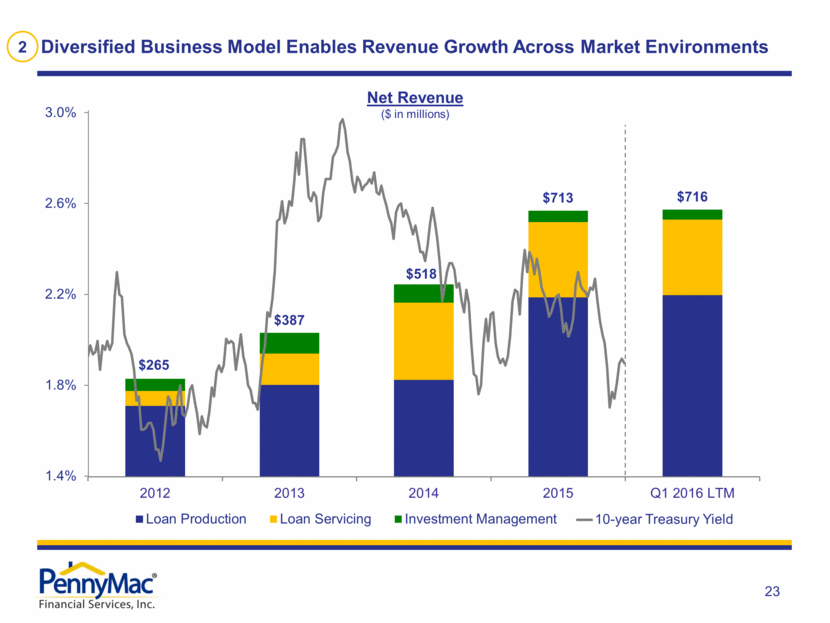
Diversified Business Model Enables Revenue Growth Across Market Environments 2 Net Revenue ($ in millions) 10-year Treasury Yield 23 $265 $387 $518 $713 $716 2012 2013 2014 2015 Q1 2016 LTM Loan Production Loan Servicing Investment Management 1.4% 1.8% 2.2% 2.6% 3.0%
Financial Hedging Approach Moderates PennyMac’s Interest Rate Risk 2 In addition to the natural hedge from our significant businesses in production and servicing, PennyMac uses a comprehensive financial hedge strategy in order to: “Lock in” margins from application/lock to loan sale in the production activities Protect the economic value of its MSR assets We employ a variety of instruments to execute our hedge strategy including: Forward sales and options for the loan inventory and pipeline Mortgage-backed securities, options, swaptions and other derivatives for the MSR assets Leverage PennyMac’s substantial capital markets expertise and manage hedging through robust operational processes and governance structure Intra-day monitoring with executive management oversight; reviewed by management and Board governance committees 24
PennyMac Has a Record of Strong and Growing Income & Adjusted EBITDA Pre-tax Income, Adjusted EBITDA(1) & Adjusted EBITDA Margin(1) ($ in millions) Adjusted EBITDA pre-tax Income Adjusted EBITDA Margin Adjusted EBITDA and Adjusted EBITDA Margin are non-GAAP financial measures. Adjusted EBITDA is defined as net income attributable to PFSI common stockholders plus net income attributable to noncontrolling interest, provision for income taxes, depreciation and amortization, decrease (increase) in fair value and provision for impairment of mortgage servicing rights carried at lower of amortized cost or fair value, increase (decrease) in fair value of excess servicing spread payable to PennyMac Mortgage Investment Trust, hedging losses (gains) associated with MSRs, and stock-based compensation expense to the extent that such items existed in the periods presented. Adjusted EBITDA Margin is defined as Adjusted EBITDA divided by net revenues. Adjusted EBITDA and Adjusted EBITDA Margin are metrics frequently used in our industry to measure performance and management believes that it provides supplemental information that is useful to investors. See slide 43 for a reconciliation of Adjusted EBITDA to net income attributable to PFSI common stockholders. 3 Pre-tax Income CAGR: 27% Adjusted EBITDA CAGR: 27% 25 $118 $182 $223 $279 $256 $142 $192 $204 $308 $311 54% 50% 39% 43% 43% -10% 10% 30% 50% 70% 90% 110% 130% 150% 0 50 100 150 200 250 300 2012 2013 2014 2015 Q1 2016 LTM
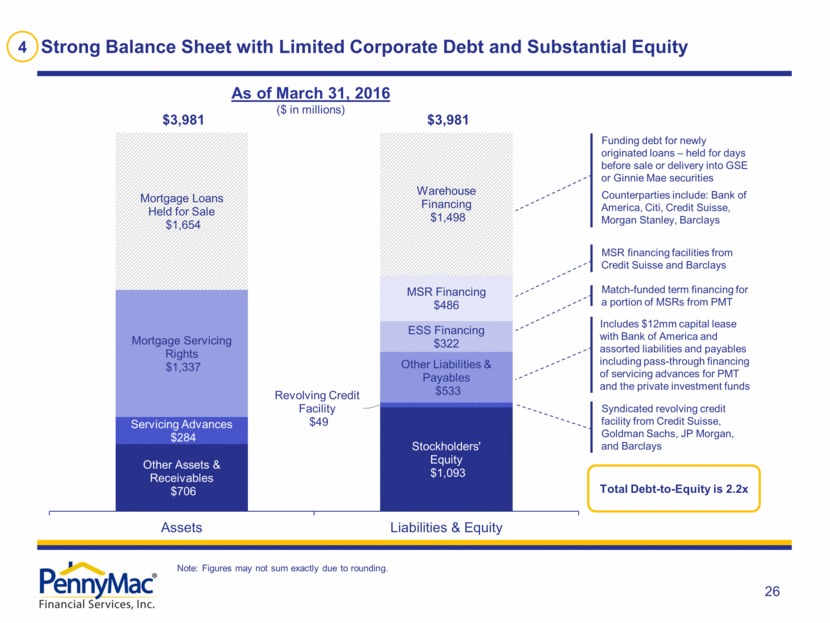
Strong Balance Sheet with Limited Corporate Debt and Substantial Equity 4 Note: Figures may not sum exactly due to rounding. Total Debt-to-Equity is 2.2x Funding debt for newly originated loans – held for days before sale or delivery into GSE or Ginnie Mae securities Counterparties include: Bank of America, Citi, Credit Suisse, Morgan Stanley, Barclays Syndicated revolving credit facility from Credit Suisse, Goldman Sachs, JP Morgan, and Barclays Match-funded term financing for a portion of MSRs from PMT Includes $12mm capital lease with Bank of America and assorted liabilities and payables including pass-through financing of servicing advances for PMT and the private investment funds MSR financing facilities from Credit Suisse and Barclays As of March 31, 2016 ($ in millions) 26 Other Assets & Receivables $706 Servicing Advances $284 Mortgage Servicing Rights $1,337 Mortgage Loans Held for Sale $1,654 Stockholders' Equity $1,093 Revolving Credit Facility $49 Other Liabilities & Payables $533 ESS Financing $322 MSR Financing $486 Warehouse Financing $1,498 $3,981 $3,981 Assets Liabilities & Equity
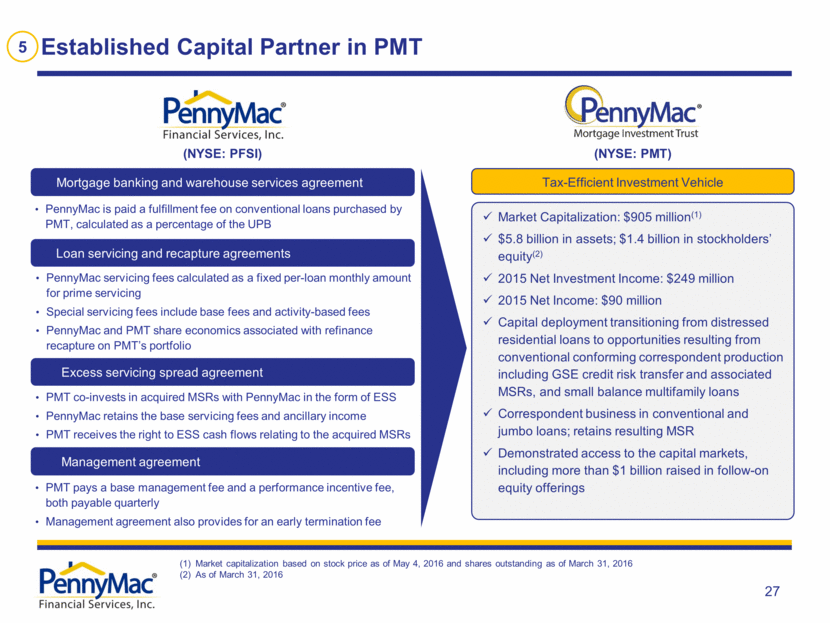
Established Capital Partner in PMT 5 PennyMac is paid a fulfillment fee on conventional loans purchased by PMT, calculated as a percentage of the UPB Mortgage banking and warehouse services agreement PennyMac servicing fees calculated as a fixed per-loan monthly amount for prime servicing Special servicing fees include base fees and activity-based fees PennyMac and PMT share economics associated with refinance recapture on PMT’s portfolio Loan servicing and recapture agreements PMT co-invests in acquired MSRs with PennyMac in the form of ESS PennyMac retains the base servicing fees and ancillary income PMT receives the right to ESS cash flows relating to the acquired MSRs Excess servicing spread agreement PMT pays a base management fee and a performance incentive fee, both payable quarterly Management agreement also provides for an early termination fee Management agreement Market Capitalization: $905 million(1) $5.8 billion in assets; $1.4 billion in stockholders’ equity(2) 2015 Net Investment Income: $249 million 2015 Net Income: $90 million Capital deployment transitioning from distressed residential loans to opportunities resulting from conventional conforming correspondent production including GSE credit risk transfer and associated MSRs, and small balance multifamily loans Correspondent business in conventional and jumbo loans; retains resulting MSR Demonstrated access to the capital markets, including more than $1 billion raised in follow-on equity offerings Market capitalization based on stock price as of May 4, 2016 and shares outstanding as of March 31, 2016 As of March 31, 2016 Tax-Efficient Investment Vehicle (NYSE: PMT) (NYSE: PFSI) 27
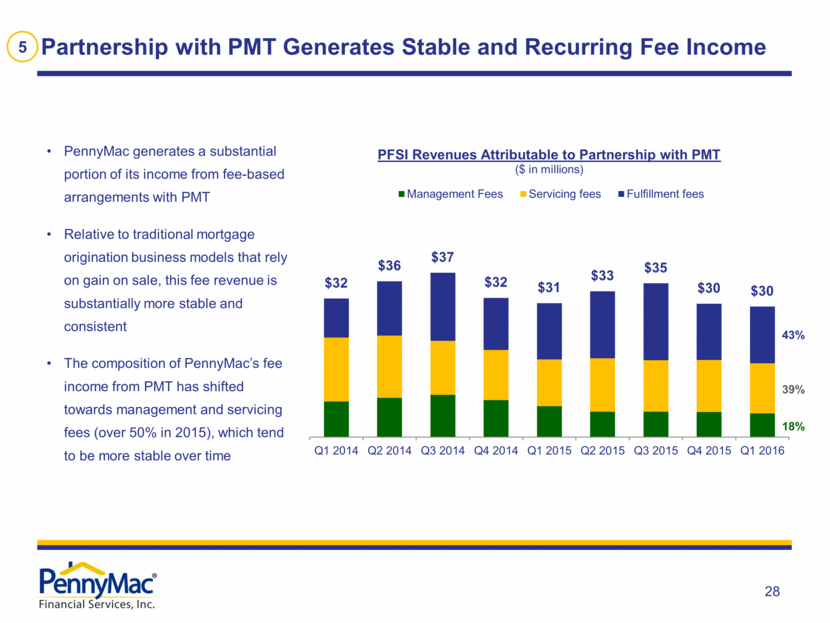
Partnership with PMT Generates Stable and Recurring Fee Income 5 PennyMac generates a substantial portion of its income from fee-based arrangements with PMT Relative to traditional mortgage origination business models that rely on gain on sale, this fee revenue is substantially more stable and consistent The composition of PennyMac’s fee income from PMT has shifted towards management and servicing fees (over 50% in 2015), which tend to be more stable over time 43% 39% 18% 28 $32 $36 $37 $32 $31 $33 $35 $30 $30 Q1 2014 Q2 2014 Q3 2014 Q4 2014 Q1 2015 Q2 2015 Q3 2015 Q4 2015 Q1 2016 PFSI Revenues Attributable to Partnership with PMT ($ in millions) Management Fees Servicing fees Fulfillment fees
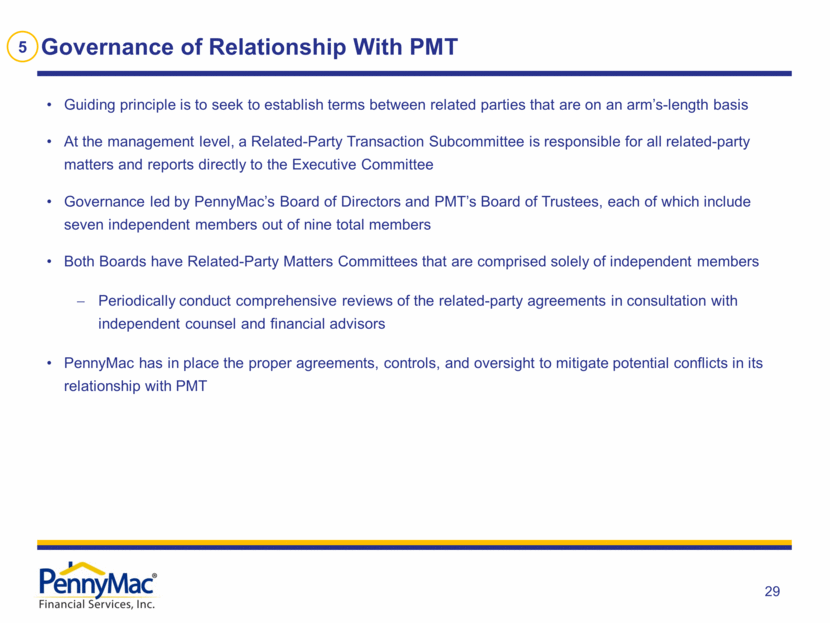
Governance of Relationship With PMT 5 Guiding principle is to seek to establish terms between related parties that are on an arm’s-length basis At the management level, a Related-Party Transaction Subcommittee is responsible for all related-party matters and reports directly to the Executive Committee Governance led by PennyMac’s Board of Directors and PMT’s Board of Trustees, each of which include seven independent members out of nine total members Both Boards have Related-Party Matters Committees that are comprised solely of independent members Periodically conduct comprehensive reviews of the related-party agreements in consultation with independent counsel and financial advisors PennyMac has in place the proper agreements, controls, and oversight to mitigate potential conflicts in its relationship with PMT 29
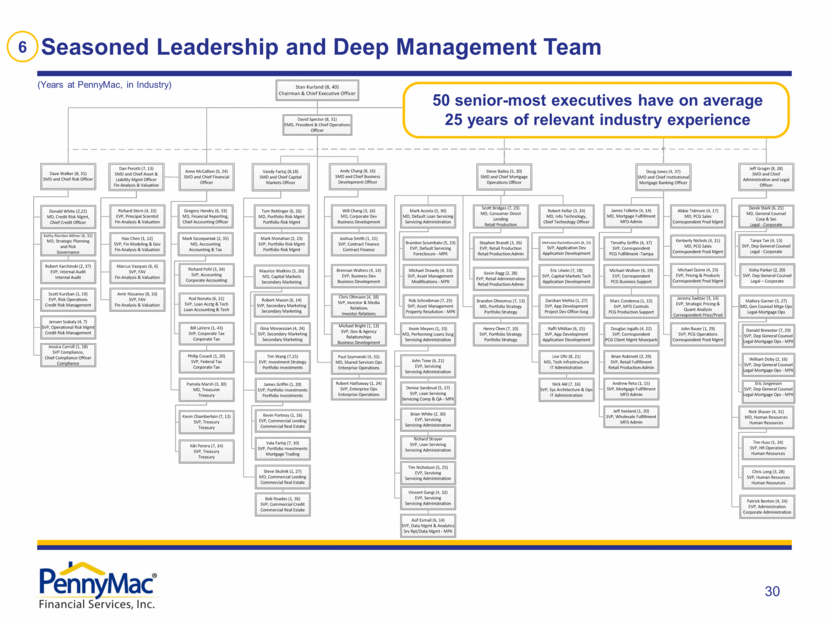
Seasoned Leadership and Deep Management Team 6 (Years at PennyMac, in Industry) 50 senior-most executives have on average 25 years of relevant industry experience 30 Stan Kurland ( 8 , 40 ) Chairman & Chief Executive Officer Anne McCallion ( 6 , 24 ) SMD and Chief Financial Officer Pamela Marsh ( 3 , 30 ) MD , Treasurer Treasury Dan Perotti ( 7 , 13 ) SMD and Chief Asset & Liability Mgmt Officer Fin Analysis & Valuation Gregory Hendry ( 6 , 33 ) MD , Financial Reporting , Chief Accounting Officer Mark Szczepaniak ( 2 , 35 ) MD , Accounting Accounting & Tax Steve Bailey ( 5 , 30 ) SMD and Chief Mortgage Operations Officer Scott Bridges ( 7 , 23 ) MD , Consumer Direct Lending Retail Production John Tone ( 6 , 21 ) EVP , Servicing Servicing Administration Tim Nicholson ( 5 , 25 ) EVP , Servicing Servicing Administration Mark Acosta ( 5 , 30 ) MD , Default Loan Servicing Servicing Administration Vincent Gangi ( 4 , 32 ) EVP , Servicing Servicing Administration Brandon Ohnemus ( 7 , 13 ) MD , Portfolio Strategy Portfolio Strategy Doug Jones ( 4 , 37 ) SMD and Chief Institutional Mortgage Banking Officer Paul Szymanski ( 4 , 31 ) MD , Shared Services Ops Enterprise Operations James Follette ( 4 , 14 ) MD , Mortgage Fulfillment MFD Admin Kimberly Nichols ( 4 , 31 ) MD , PCG Sales Correspondent Prod Mgmt Abbie Tidmore ( 4 , 17 ) MD , PCG Sales Correspondent Prod Mgmt Michael Quinn ( 4 , 23 ) EVP , Pricing & Products Correspondent Prod Mgmt Jeff Grogin ( 8 , 28 ) SMD and Chief Administrative and Legal Officer Derek Stark ( 6 , 21 ) MD , General Counsel Corp & Sec Legal - Corporate Mallory Garner ( 5 , 27 ) MD , Gen Counsel Mtge Ops Legal - Mortgage Ops Patrick Benton ( 4 , 24 ) EVP , Administration Corporate Administration Nick Shauer ( 4 , 31 ) MD , Human Resources Human Resources David Spector ( 8 , 31 ) EMD , President & Chief Operations Officer Vandy Fartaj ( 8 , 18 ) SMD and Chief Capital Markets Officer Andy Chang ( 8 , 16 ) SMD and Chief Business Development Officer Dave Walker ( 8 , 31 ) SMD and Chief Risk Officer Kathy Riordan - Milner ( 6 , 32 ) MD , Strategic Planning and Risk Governance Donald White ( 2 , 22 ) MD , Credit Risk Mgmt , Chief Credit Officer Lior Ofir ( 8 , 21 ) MD , Tech Infrastructure IT Administration Robert Kellar ( 3 , 24 ) MD , Info Technology , Chief Technology Officer Jessica Carroll ( 1 , 18 ) SVP Compliance , Chief Compliance Officer Compliance Tim Wang ( 7 , 15 ) EVP , Investment Strategy Portfolio Investments Tom Rettinger ( 6 , 26 ) MD , Portfolio Risk Mgmt Portfolio Risk Mgmt Maurice Watkins ( 5 , 26 ) MD , Capital Markets Secondary Marketing Will Chang ( 3 , 16 ) MD , Corporate Dev Business Development John Bauer ( 1 , 29 ) SVP , PCG Operations Correspondent Prod Mgmt Brian White ( 2 , 30 ) EVP , Servicing Servicing Administration Steve Skolnik ( 1 , 27 ) MD , Commercial Lending Commercial Real Estate Kevin Portnoy ( 1 , 16 ) EVP , Commercial Lending Commercial Real Estate James Griffin ( 1 , 20 ) EVP , Portfolio Investments Portfolio Investments Robert Karchinski ( 2 , 37 ) EVP , Internal Audit Internal Audit Kevin Meyers ( 1 , 33 ) MD , Performing Loans Svcg Servicing Administration Brennan Walters ( 4 , 14 ) EVP , Business Dev Business Development Tanya Tan ( 4 , 13 ) SVP , Dep General Counsel Legal - Corporate Donald Brewster ( 7 , 29 ) SVP , Dep General Counsel Legal - Mortgage Ops - MPK Tim Huss ( 1 , 24 ) SVP , HR Operations Human Resources Chris Long ( 3 , 28 ) SVP , Human Resources Human Resources Chris Oltmann ( 4 , 18 ) SVP , Investor & Media Relations Investor Relations Joshua Smith ( 1 , 15 ) SVP , Contract Finance Contract Finance Vala Fartaj ( 7 , 10 ) SVP , Portfolio Investments Mortgage Trading Robert Mason ( 6 , 14 ) SVP , Secondary Marketing Secondary Marketing Mark Monahan ( 2 , 23 ) SVP , Portfolio Risk Mgmt Portfolio Risk Mgmt Bob Roades ( 1 , 36 ) SVP , Commercial Credit Commercial Real Estate Amir Nissanov ( 8 , 10 ) SVP , FAV Fin Analysis & Valuation Marcus Vazquez ( 6 , 6 ) SVP , FAV Fin Analysis & Valuation Hao Chen ( 1 , 12 ) SVP , Fin Modeling & Gov Fin Analysis & Valuation Kevin Chamberlain ( 7 , 13 ) SVP , Treasury Treasury Kiki Perera ( 7 , 14 ) SVP , Treasury Treasury Richard Pohl ( 3 , 34 ) SVP , Accounting Corporate Accounting Rod Nonato ( 6 , 21 ) SVP , Loan Acctg & Tech Loan Accounting & Tech Bill LaVere ( 1 , 43 ) SVP , Corporate Tax Corporate Tax Nick Akl ( 7 , 16 ) SVP , Sys Architecture & Ops IT Administration Henry Chen ( 7 , 10 ) SVP , Portfolio Strategy Portfolio Strategy Kevin Ragg ( 2 , 28 ) EVP , Retail Administration Retail Production : Admin Stephen Brandt ( 3 , 26 ) EVP , Retail Production Retail Production : Admin Denise Sandoval ( 5 , 17 ) SVP , Loan Servicing Servicing Comp & QA - MPK Michael Drawdy ( 4 , 33 ) SVP , Asset Management Modifications - MPK Rob Schreibman ( 7 , 25 ) SVP , Asset Management Property Resolution - MPK Brandon Sciumbato ( 5 , 23 ) EVP , Default Servicing Foreclosure - MPK Asif Esmail ( 6 , 14 ) SVP , Data Mgmt & Analytics Srv Rpt / Data Mgmt - MPK Eric Litwin ( 7 , 18 ) SVP , Capital Markets Tech Application Development Mehrdad Rashidfarrukhi ( 8 , 23 ) SVP , Application Dev Application Development Douglas Ingalls ( 4 , 22 ) SVP , Correspondent PCG Client Mgmt Moorpark Michael Woliver ( 4 , 19 ) EVP , Correspondent PCG Business Support Timothy Griffin ( 4 , 37 ) SVP , Correspondent PCG Fulfillment - Tampa Brian Robinett ( 3 , 29 ) SVP , Retail Fulfillment Retail Production : Admin Marc Condensa ( 1 , 15 ) SVP , MFD Controls PCG Production Support Jeremy Switzer ( 3 , 14 ) EVP , Strategic Pricing & Quant Analysis Correspondent Price / Prod Darshan Mehta ( 1 , 27 ) SVP , App Development Project Dev Office - Svcg Michael Bright ( 1 , 13 ) SVP , Gov & Agency Relationships Business Development Scott Kurzban ( 1 , 19 ) EVP , Risk Operations Credit Risk Management Philip Cusack ( 1 , 20 ) SVP , Federal Tax Corporate Tax Gina Movsessian ( 4 , 24 ) SVP , Secondary Marketing Secondary Marketing Jensen Szakaly ( 4 , 7 ) SVP , Operational Risk Mgmt Credit Risk Management Raffi Mitilian ( 6 , 15 ) SVP , App Development Application Development William Doby ( 2 , 16 ) SVP , Dep General Counsel Legal - Mortgage Ops - MPK Robert Hathaway ( 1 , 24 ) SVP , Enterprise Ops Enterprise Operations Andrew Reta ( 1 , 15 ) SVP , Mortgage Fulfillment MFD Admin Jeff Keeland ( 1 , 20 ) SVP , Wholesale Fulfillment MFD Admin Richard Stern ( 4 , 22 ) EVP , Principal Scientist Fin Analysis & Valuation Kisha Parker ( 2 , 20 ) SVP , Dep General Counsel Legal – Corporate Richard Strayer SVP , Loan Servicing Servicing Administration Eric Jorgensen SVP , Dep General Counsel Legal - Mortgage Ops - MPK
Financial Highlights 31

Historical Financial Results Pre-Tax Income ($ in millions) Adjusted EBITDA is a non-GAAP financial measure and is defined as net income attributable to PFSI common stockholders plus net income attributable to noncontrolling interest, provision for income taxes, depreciation and amortization, decrease (increase) in fair value and provision for impairment of mortgage servicing rights carried at lower of amortized cost or fair value, increase (decrease) in fair value of excess servicing spread payable to PennyMac Mortgage Investment Trust, hedging losses (gains) associated with MSRs, and stock-based compensation expense to the extent that such items existed in the periods presented. Adjusted EBITDA is a metric frequently used in our industry to measure performance and management believes that it provides supplemental information that is useful to investors. See slide 43 for a reconciliation of Adjusted EBITDA to net income attributable to PFSI common stockholders. Represents partial year. PFSI completed its IPO on May 5, 2013 Net Revenues ($ in millions) Diluted Earnings per Share Adjusted EBITDA(1) ($ in millions) (2) N/A 32 $118 $182 $223 $279 $256 2012 2013 2014 2015 Q1 2016 LTM $0.82 $1.73 $2.17 $1.98 2012 2013 2014 2015 Q1 2016 LTM $142 $192 $204 $308 $311 2012 2013 2014 2015 Q1 2016 LTM $265 $387 $518 $713 $716 2012 2013 2014 2015 Q1 2016 LTM
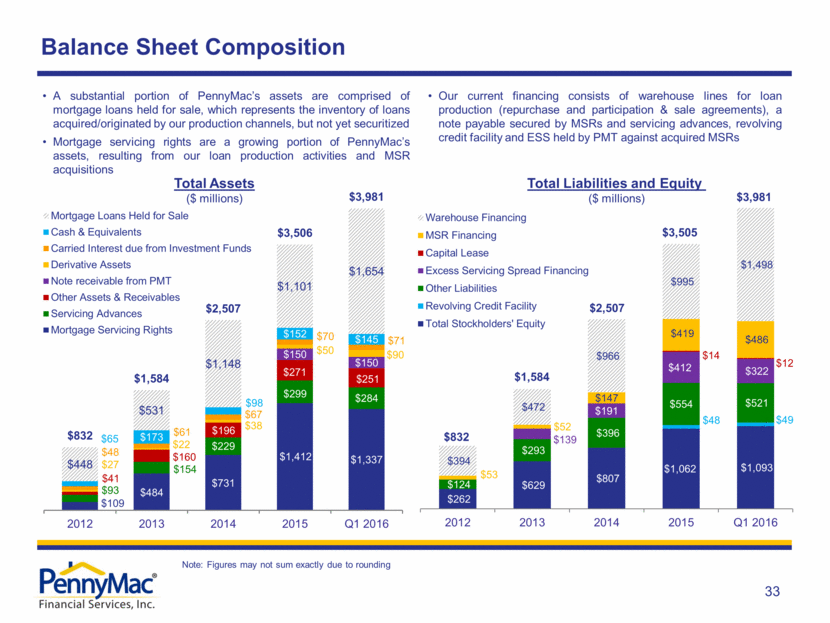
Balance Sheet Composition Note: Figures may not sum exactly due to rounding Total Liabilities and Equity ($ millions) Total Assets ($ millions) A substantial portion of PennyMac’s assets are comprised of mortgage loans held for sale, which represents the inventory of loans acquired/originated by our production channels, but not yet securitized Mortgage servicing rights are a growing portion of PennyMac’s assets, resulting from our loan production activities and MSR acquisitions Our current financing consists of warehouse lines for loan production (repurchase and participation & sale agreements), a note payable secured by MSRs and servicing advances, revolving credit facility and ESS held by PMT against acquired MSRs $832 $1,584 $2,507 $3,505 $3,981 33 $262 $629 $807 $1,062 $1,093 $48 $49 $124 $293 $396 $554 $521 $139 $191 $412 $322 $14 $12 $53 $52 $147 $419 $486 $394 $472 $966 $995 $1,498 2012 2013 2014 2015 Q1 2016 Warehouse Financing MSR Financing Capital Lease Excess Servicing Spread Financing Other Liabilities Revolving Credit Facility Total Stockholders' Equity $109 $484 $731 $1,412 $1,337 $93 $154 $229 $299 $284 $41 $160 $196 $271 $251 $150 $150 $27 $22 $38 $50 $90 $48 $61 $67 $70 $71 $65 $173 $98 $152 $145 $448 $531 $1,148 $1,101 $1,654 $832 $1,584 $2,507 $3,506 $3,981 2012 2013 2014 2015 Q1 2016 Mortgage Loans Held for Sale Cash & Equivalents Carried Interest due from Investment Funds Derivative Assets Note receivable from PMT Other Assets & Receivables Servicing Advances Mortgage Servicing Rights
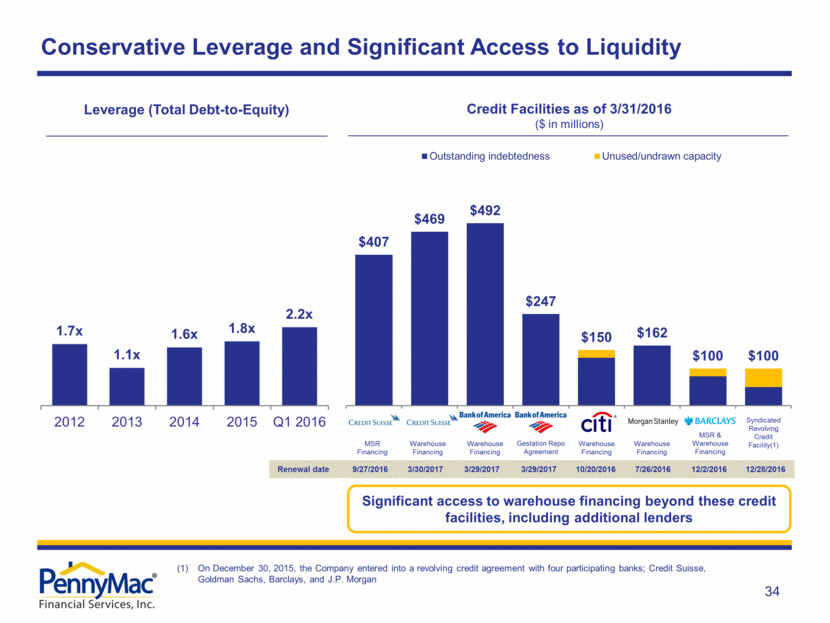
Conservative Leverage and Significant Access to Liquidity Credit Facilities as of 3/31/2016 ($ in millions) Renewal date 9/27/2016 3/30/2017 3/29/2017 3/29/2017 10/20/2016 7/26/2016 12/2/2016 12/28/2016 Gestation Repo Agreement Syndicated Revolving Credit Facility(1) Leverage (Total Debt-to-Equity) On December 30, 2015, the Company entered into a revolving credit agreement with four participating banks; Credit Suisse, Goldman Sachs, Barclays, and J.P. Morgan MSR Financing Warehouse Financing Warehouse Financing Warehouse Financing Warehouse Financing MSR & Warehouse Financing Significant access to warehouse financing beyond these credit facilities, including additional lenders 34 $407 $469 $492 $247 $150 $162 $100 $100 Outstanding indebtedness Unused/undrawn capacity 1.7x 1.1x 1.6x 1.8x 2.2x 2012 2013 2014 2015 Q1 2016
Key Investment Highlights Industry-Leading Platform for Market Opportunity Diversified Business Model High Operating Margins and Consistent Profitability Strong Balance Sheet with Diverse Funding Sources Established Capital Partner in PMT Seasoned Leadership and Deep Management Team 35
Appendix 36

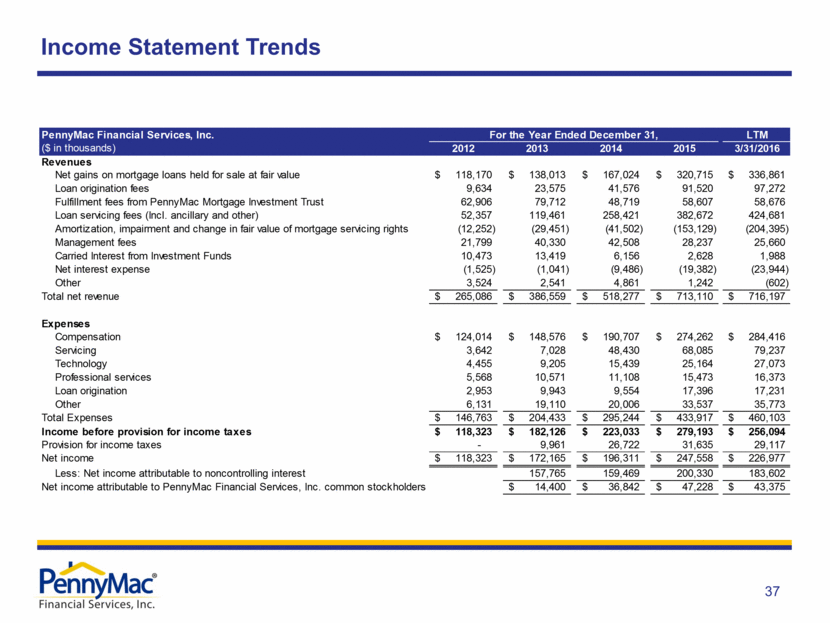
Income Statement Trends 37 PennyMac Financial Services, Inc. For the Year Ended December 31, LTM ($ in thousands) 2012 2013 2014 2015 3/31/2016 Revenues Net gains on mortgage loans held for sale at fair value 118,170 $ 138,013 $ 167,024 $ 320,715 $ 336,861 $ Loan origination fees 9,634 23,575 41,576 91,520 97,272 Fulfillment fees from PennyMac Mortgage Investment Trust 62,906 79,712 48,719 58,607 58,676 Loan servicing fees (Incl. ancillary and other) 52,357 119,461 258,421 382,672 424,681 Amortization, impairment and change in fair value of mortgage servicing rights (12,252) (29,451) (41,502) (153,129) (204,395) Management fees 21,799 40,330 42,508 28,237 25,660 Carried Interest from Investment Funds 10,473 13,419 6,156 2,628 1,988 Net interest expense (1,525) (1,041) (9,486) (19,382) (23,944) Other 3,524 2,541 4,861 1,242 (602) Total net revenue 265,086 $ 386,559 $ 518,277 $ 713,110 $ 716,197 $ Expenses Compensation 124,014 $ 148,576 $ 190,707 $ 274,262 $ 284,416 $ Servicing 3,642 7,028 48,430 68,085 79,237 Technology 4,455 9,205 15,439 25,164 27,073 Professional services 5,568 10,571 11,108 15,473 16,373 Loan origination 2,953 9,943 9,554 17,396 17,231 Other 6,131 19,110 20,006 33,537 35,773 Total Expenses 146,763 $ 204,433 $ 295,244 $ 433,917 $ 460,103 $ Income before provision for income taxes 118,323 $ 182,126 $ 223,033 $ 279,193 $ 256,094 $ Provision for income taxes - 9,961 26,722 31,635 29,117 Net income 118,323 $ 172,165 $ 196,311 $ 247,558 $ 226,977 $ Less: Net income attributable to noncontrolling interest 157,765 159,469 200,330 183,602 Net income attributable to PennyMac Financial Services, Inc. common stockholders 14,400 $ 36,842 $ 47,228 $ 43,375 $
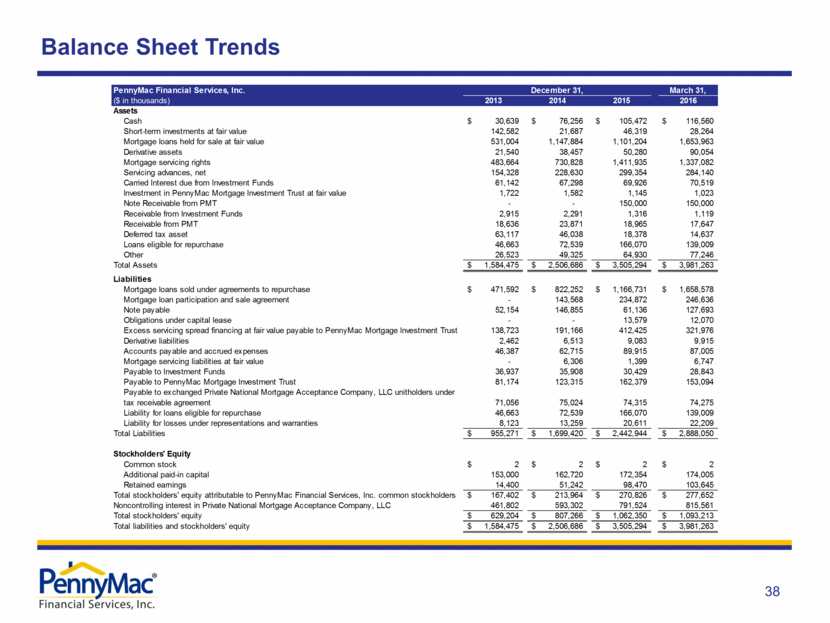
Balance Sheet Trends 38 PennyMac Financial Services, Inc. December 31, March 31, ($ in thousands) 2013 2014 2015 2016 Assets Cash 30,639 $ 76,256 $ 105,472 $ 116,560 $ Short-term investments at fair value 142,582 21,687 46,319 28,264 Mortgage loans held for sale at fair value 531,004 1,147,884 1,101,204 1,653,963 Derivative assets 21,540 38,457 50,280 90,054 Mortgage servicing rights 483,664 730,828 1,411,935 1,337,082 Servicing advances, net 154,328 228,630 299,354 284,140 Carried Interest due from Investment Funds 61,142 67,298 69,926 70,519 Investment in PennyMac Mortgage Investment Trust at fair value 1,722 1,582 1,145 1,023 Note Receivable from PMT - - 150,000 150,000 Receivable from Investment Funds 2,915 2,291 1,316 1,119 Receivable from PMT 18,636 23,871 18,965 17,647 Deferred tax asset 63,117 46,038 18,378 14,637 Loans eligible for repurchase 46,663 72,539 166,070 139,009 Other 26,523 49,325 64,930 77,246 Total Assets 1,584,475 $ 2,506,686 $ 3,505,294 $ 3,981,263 $ Liabilities Mortgage loans sold under agreements to repurchase 471,592 $ 822,252 $ 1,166,731 $ 1,658,578 $ Mortgage loan participation and sale agreement - 143,568 234,872 246,636 Note payable 52,154 146,855 61,136 127,693 Obligations under capital lease - - 13,579 12,070 Excess servicing spread financing at fair value payable to PennyMac Mortgage Investment Trust 138,723 191,166 412,425 321,976 Derivative liabilities 2,462 6,513 9,083 9,915 Accounts payable and accrued expenses 46,387 62,715 89,915 87,005 Mortgage servicing liabilities at fair value - 6,306 1,399 6,747 Payable to Investment Funds 36,937 35,908 30,429 28,843 Payable to PennyMac Mortgage Investment Trust 81,174 123,315 162,379 153,094 Payable to exchanged Private National Mortgage Acceptance Company, LLC unitholders under tax receivable agreement 71,056 75,024 74,315 74,275 Liability for loans eligible for repurchase 46,663 72,539 166,070 139,009 Liability for losses under representations and warranties 8,123 13,259 20,611 22,209 Total Liabilities 955,271 $ 1,699,420 $ 2,442,944 $ 2,888,050 $ Stockholders' Equity Common stock 2 $ 2 $ 2 $ 2 $ Additional paid-in capital 153,000 162,720 172,354 174,005 Retained earnings 14,400 51,242 98,470 103,645 Total stockholders' equity attributable to PennyMac Financial Services, Inc. common stockholders 167,402 $ 213,964 $ 270,826 $ 277,652 $ Noncontrolling interest in Private National Mortgage Acceptance Company, LLC 461,802 593,302 791,524 815,561 Total stockholders' equity 629,204 $ 807,266 $ 1,062,350 $ 1,093,213 $ Total liabilities and stockholders' equity 1,584,475 $ 2,506,686 $ 3,505,294 $ 3,981,263 $
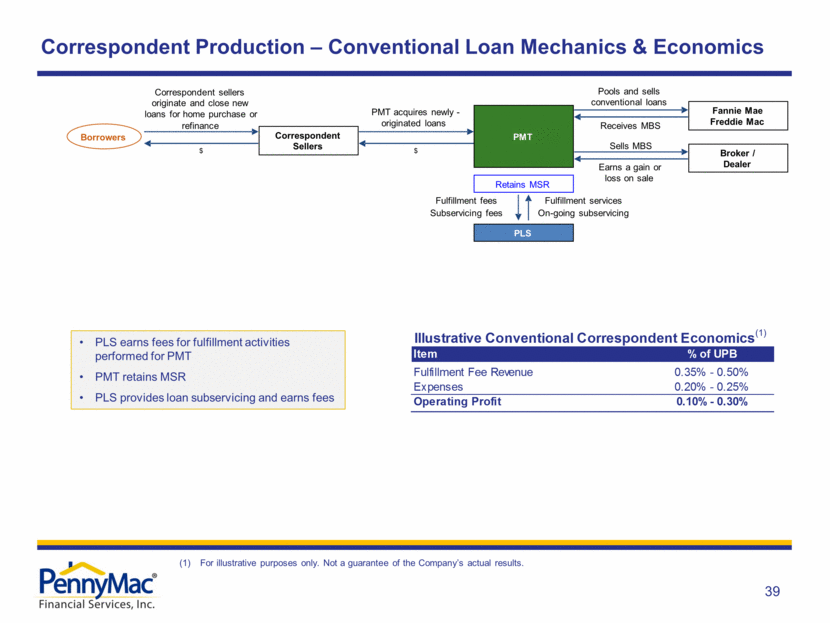
Correspondent Production – Conventional Loan Mechanics & Economics PLS earns fees for fulfillment activities performed for PMT PMT retains MSR PLS provides loan subservicing and earns fees (1) For illustrative purposes only. Not a guarantee of the Company’s actual results. 39 Fannie Mae Freddie Mac Correspondent sellers originate and close new loans for home purchase or refinance Fulfillment fees Subservicing fees Fulfillment services On - going subservicing Correspondent Sellers PMT acquires newly - originated loans Retains MSR Pools and sells conventional loans Earns a gain or loss on sale PMT PLS Broker / Dealer $ Receives MBS Sells MBS $ Borrowers Illustrative Conventional Correspondent Economics Item % of UPB Fulfillment Fee Revenue 0.35% - 0.50% Expenses 0.20% - 0.25% Operating Profit 0.10% - 0.30%
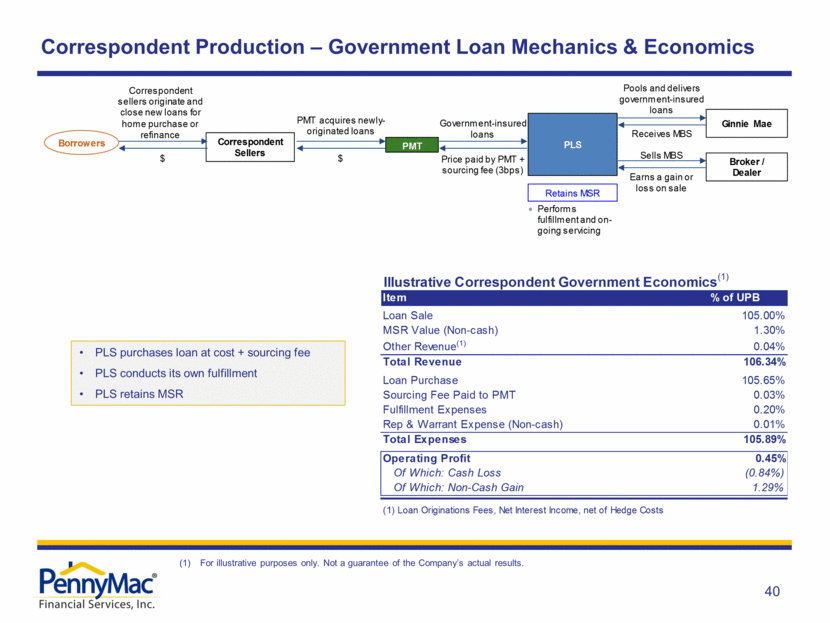
Correspondent Production – Government Loan Mechanics & Economics PLS purchases loan at cost + sourcing fee PLS conducts its own fulfillment PLS retains MSR (1) For illustrative purposes only. Not a guarantee of the Company’s actual results. 40 Ginnie Mae Correspondent sellers originate and close new loans for home purchase or refinance Price paid by PMT + sourcing fee (3bps) Government - insured loans Correspondent Sellers PMT acquires newly - originated loans Retains MSR Pools and delivers government - insured loans PMT PLS Broker / Dealer $ Receives MBS · Performs fulfillment and on - going servicing Sells MBS $ Earns a gain or loss on sale Correspondent Government Lending Mechanics Fannie Mae Freddie Mac Correspondent sellers originate and close new loans for home purchase or refinance Fulfillment fees Subservicing fees Fulfillment services On - going subservicing Correspondent Sellers PMT acquires newly - originated loans Retains MSR Pools and sells conventional loans Earns a gain or loss on sale PMT PLS Broker / Dealer $ Receives MBS Sells MBS $ Correspondent Conventional Lending Mechanics • PLS earns fees for fulfillment activities performed for PMT • PMT retains MSR • PLS provides loan subservicing and earns fees • PLS purchases loan at cost + sourcing fee • PLS conducts its own fulfillment • PLS retains MSR Borrowers Borrowers Illustrative Correspondent Government Economics Item % of UPB Loan Sale 105.00% MSR Value (Non-cash) 1.30% Other Revenue (1) 0.04% Total Revenue 106.34% Loan Purchase 105.65% Sourcing Fee Paid to PMT 0.03% Fulfillment Expenses 0.20% Rep & Warrant Expense (Non-cash) 0.01% Total Expenses 105.89% Operating Profit 0.45% Of Which: Cash Loss (0.84%) Of Which: Non-Cash Gain 1.29% (1) Loan Originations Fees, Net Interest Income, net of Hedge Costs
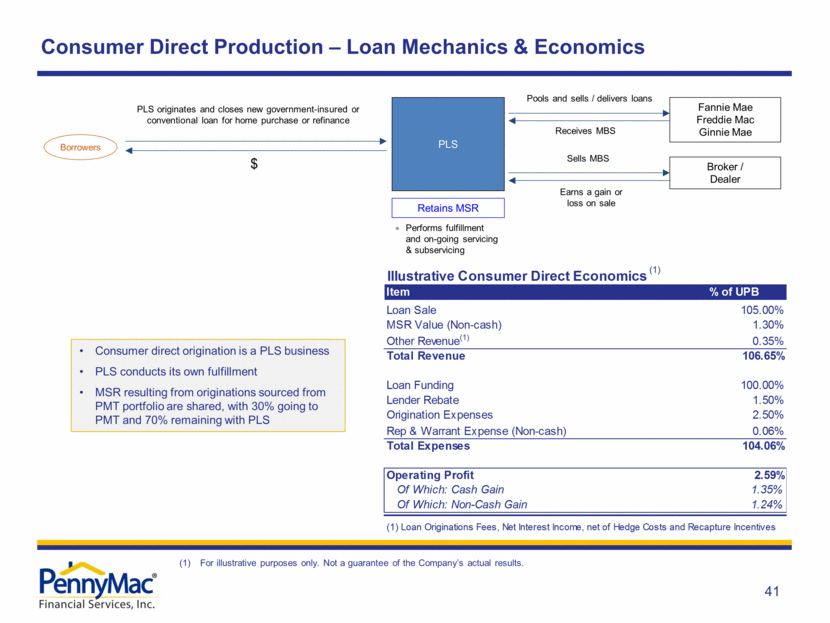
Consumer Direct Production – Loan Mechanics & Economics Fannie Mae Freddie Mac Ginnie Mae PLS originates and closes new government-insured or conventional loan for home purchase or refinance PLS Performs fulfillment and on-going servicing & subservicing Pools and sells / delivers loans Borrowers Broker / Dealer Receives MBS Retains MSR Sells MBS $ Earns a gain or loss on sale Consumer direct origination is a PLS business PLS conducts its own fulfillment MSR resulting from originations sourced from PMT portfolio are shared, with 30% going to PMT and 70% remaining with PLS (1) For illustrative purposes only. Not a guarantee of the Company’s actual results. 41 Illustrative Consumer Direct Economics Item % of UPB Loan Sale 105.00% MSR Value (Non-cash) 1.30% Other Revenue (1) 0.35% Total Revenue 106.65% Loan Funding 100.00% Lender Rebate 1.50% Origination Expenses 2.50% Rep & Warrant Expense (Non-cash) 0.06% Total Expenses 104.06% Operating Profit 2.59% Of Which: Cash Gain 1.35% Of Which: Non-Cash Gain 1.24% (1) Loan Originations Fees, Net Interest Income, net of Hedge Costs and Recapture Incentives
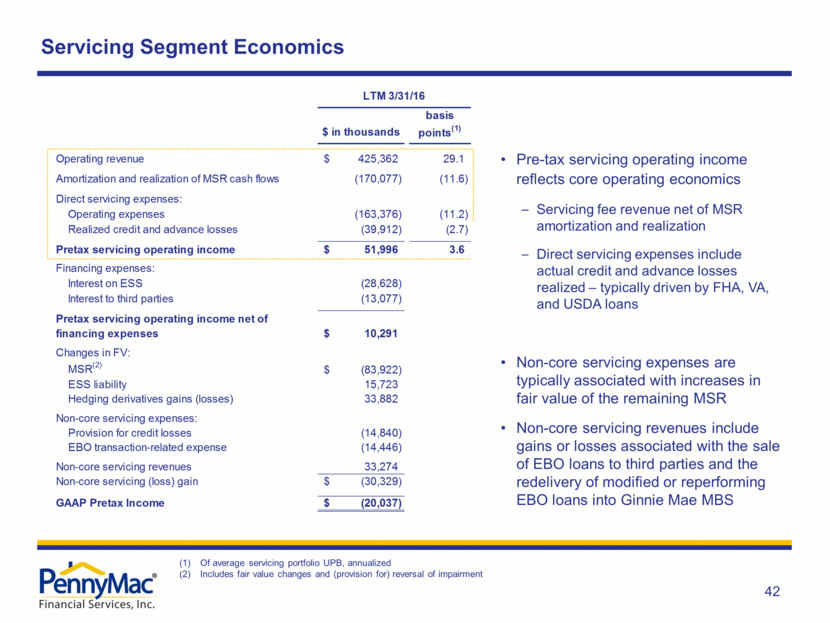
Servicing Segment Economics Pre-tax servicing operating income reflects core operating economics Servicing fee revenue net of MSR amortization and realization Direct servicing expenses include actual credit and advance losses realized – typically driven by FHA, VA, and USDA loans Non-core servicing expenses are typically associated with increases in fair value of the remaining MSR Non-core servicing revenues include gains or losses associated with the sale of EBO loans to third parties and the redelivery of modified or reperforming EBO loans into Ginnie Mae MBS Of average servicing portfolio UPB, annualized Includes fair value changes and (provision for) reversal of impairment 42 $ in thousands basis points (1) Operating revenue 425,362 $ 29.1 Amortization and realization of MSR cash flows (170,077) (11.6) Direct servicing expenses: Operating expenses (163,376) (11.2) Realized credit and advance losses (39,912) (2.7) Pretax servicing operating income 51,996 $ 3.6 Financing expenses: Interest on ESS (28,628) Interest to third parties (13,077) Pretax servicing operating income net of financing expenses 10,291 $ Changes in FV: MSR (2) (83,922) $ ESS liability 15,723 Hedging derivatives gains (losses) 33,882 Non-core servicing expenses: Provision for credit losses (14,840) EBO transaction-related expense (14,446) Non-core servicing revenues 33,274 Non-core servicing (loss) gain (30,329) $ GAAP Pretax Income (20,037) $ LTM 3/31/16
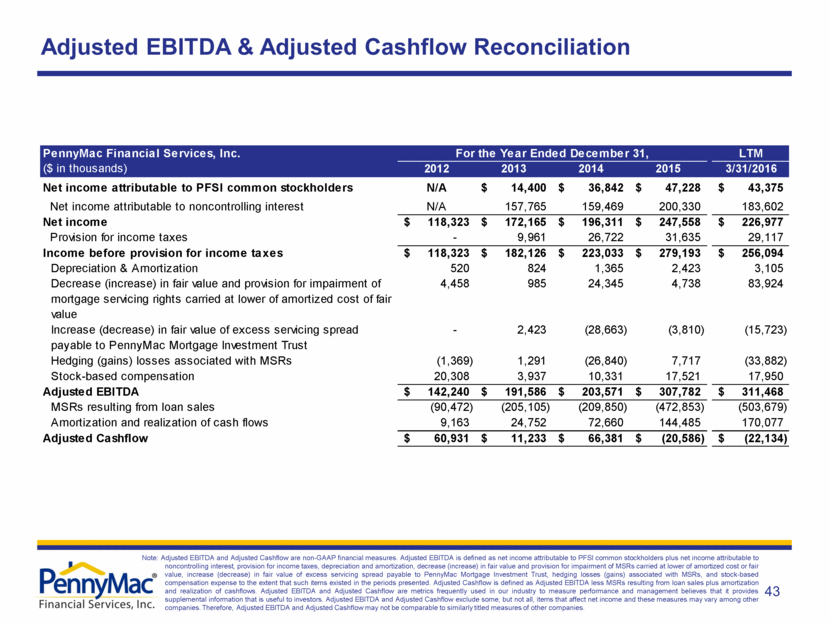
Adjusted EBITDA & Adjusted Cashflow Reconciliation 43 Note: Adjusted EBITDA and Adjusted Cashflow are non-GAAP financial measures. Adjusted EBITDA is defined as net income attributable to PFSI common stockholders plus net income attributable to noncontrolling interest, provision for income taxes, depreciation and amortization, decrease (increase) in fair value and provision for impairment of MSRs carried at lower of amortized cost or fair value, increase (decrease) in fair value of excess servicing spread payable to PennyMac Mortgage Investment Trust, hedging losses (gains) associated with MSRs, and stock-based compensation expense to the extent that such items existed in the periods presented. Adjusted Cashflow is defined as Adjusted EBITDA less MSRs resulting from loan sales plus amortization and realization of cashflows. Adjusted EBITDA and Adjusted Cashflow are metrics frequently used in our industry to measure performance and management believes that it provides supplemental information that is useful to investors. Adjusted EBITDA and Adjusted Cashflow exclude some, but not all, items that affect net income and these measures may vary among other companies. Therefore, Adjusted EBITDA and Adjusted Cashflow may not be comparable to similarly titled measures of other companies. PennyMac Financial Services, Inc. For the Year Ended December 31, LTM ($ in thousands) 2012 2013 2014 2015 3/31/2016 Net income attributable to PFSI common stockholders N/A 14,400 $ 36,842 $ 47,228 $ 43,375 $ Net income attributable to noncontrolling interest N/A 157,765 159,469 200,330 183,602 Net income 118,323 $ 172,165 $ 196,311 $ 247,558 $ 226,977 $ Provision for income taxes - 9,961 26,722 31,635 29,117 Income before provision for income taxes 118,323 $ 182,126 $ 223,033 $ 279,193 $ 256,094 $ Depreciation & Amortization 520 824 1,365 2,423 3,105 Decrease (increase) in fair value and provision for impairment of mortgage servicing rights carried at lower of amortized cost of fair value 4,458 985 24,345 4,738 83,924 Increase (decrease) in fair value of excess servicing spread payable to PennyMac Mortgage Investment Trust - 2,423 (28,663) (3,810) (15,723) Hedging (gains) losses associated with MSRs (1,369) 1,291 (26,840) 7,717 (33,882) Stock-based compensation 20,308 3,937 10,331 17,521 17,950 Adjusted EBITDA 142,240 $ 191,586 $ 203,571 $ 307,782 $ 311,468 $ MSRs resulting from loan sales (90,472) (205,105) (209,850) (472,853) (503,679) Amortization and realization of cash flows 9,163 24,752 72,660 144,485 170,077 Adjusted Cashflow 60,931 $ 11,233 $ 66,381 $ (20,586) $ (22,134) $
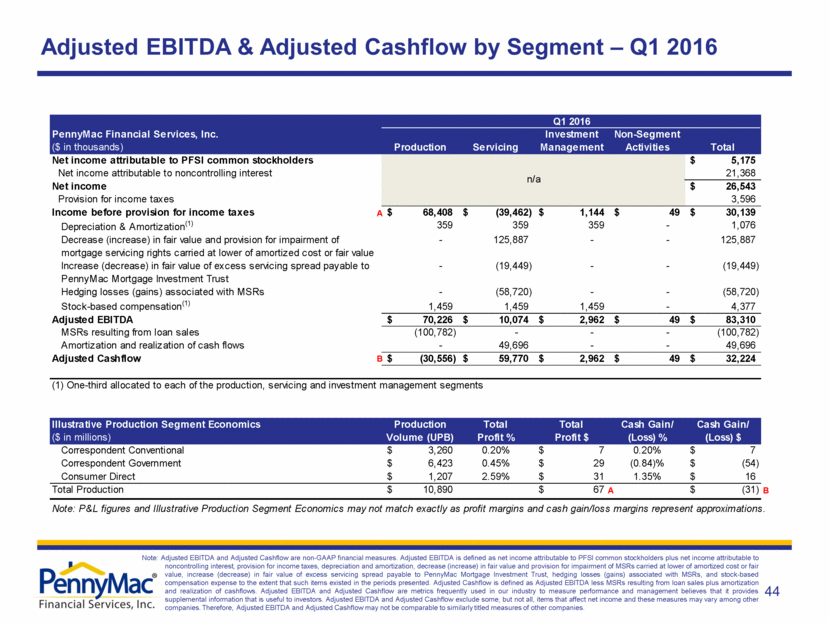
Adjusted EBITDA & Adjusted Cashflow by Segment – Q1 2016 44 Note: Adjusted EBITDA and Adjusted Cashflow are non-GAAP financial measures. Adjusted EBITDA is defined as net income attributable to PFSI common stockholders plus net income attributable to noncontrolling interest, provision for income taxes, depreciation and amortization, decrease (increase) in fair value and provision for impairment of MSRs carried at lower of amortized cost or fair value, increase (decrease) in fair value of excess servicing spread payable to PennyMac Mortgage Investment Trust, hedging losses (gains) associated with MSRs, and stock-based compensation expense to the extent that such items existed in the periods presented. Adjusted Cashflow is defined as Adjusted EBITDA less MSRs resulting from loan sales plus amortization and realization of cashflows. Adjusted EBITDA and Adjusted Cashflow are metrics frequently used in our industry to measure performance and management believes that it provides supplemental information that is useful to investors. Adjusted EBITDA and Adjusted Cashflow exclude some, but not all, items that affect net income and these measures may vary among other companies. Therefore, Adjusted EBITDA and Adjusted Cashflow may not be comparable to similarly titled measures of other companies. PennyMac Financial Services, Inc. Investment Non-Segment ($ in thousands) Production Servicing Management Activities Total Net income attributable to PFSI common stockholders 5,175 $ Net income attributable to noncontrolling interest 21,368 Net income 26,543 $ Provision for income taxes 3,596 Income before provision for income taxes 68,408 $ (39,462) $ 1,144 $ 49 $ 30,139 $ Depreciation & Amortization (1) 359 359 359 - 1,076 Decrease (increase) in fair value and provision for impairment of mortgage servicing rights carried at lower of amortized cost or fair value - 125,887 - - 125,887 Increase (decrease) in fair value of excess servicing spread payable to PennyMac Mortgage Investment Trust - (19,449) - - (19,449) Hedging losses (gains) associated with MSRs - (58,720) - - (58,720) Stock-based compensation (1) 1,459 1,459 1,459 - 4,377 Adjusted EBITDA 70,226 $ 10,074 $ 2,962 $ 49 $ 83,310 $ MSRs resulting from loan sales (100,782) - - - (100,782) Amortization and realization of cash flows - 49,696 - - 49,696 Adjusted Cashflow (30,556) $ 59,770 $ 2,962 $ 49 $ 32,224 $ (1) One-third allocated to each of the production, servicing and investment management segments Illustrative Production Segment Economics Production Total Total Cash Gain/ Cash Gain/ ($ in millions) Volume (UPB) Profit % Profit $ (Loss) % (Loss) $ Correspondent Conventional 3,260 $ 0.20% 7 $ 0.20% 7 $ Correspondent Government 6,423 $ 0.45% 29 $ (0.84)% (54) $ Consumer Direct 1,207 $ 2.59% 31 $ 1.35% 16 $ Total Production 10,890 $ 67 $ (31) $ Note: P&L figures and Illustrative Production Segment Economics may not match exactly as profit margins and cash gain/loss margins represent approximations. Q1 2016 n/a A A B B
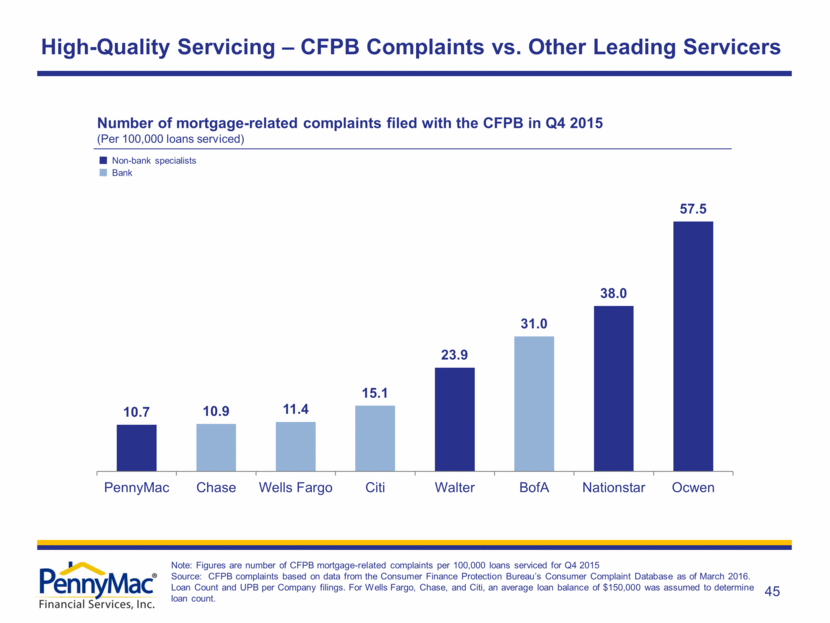
High-Quality Servicing – CFPB Complaints vs. Other Leading Servicers Note: Figures are number of CFPB mortgage-related complaints per 100,000 loans serviced for Q4 2015 Source: CFPB complaints based on data from the Consumer Finance Protection Bureau’s Consumer Complaint Database as of March 2016. Loan Count and UPB per Company filings. For Wells Fargo, Chase, and Citi, an average loan balance of $150,000 was assumed to determine loan count. Bank Non-bank specialists Number of mortgage-related complaints filed with the CFPB in Q4 2015 (Per 100,000 loans serviced) 45 10.7 10.9 11.4 15.1 23.9 31.0 38.0 57.5 PennyMac Chase Wells Fargo Citi Walter BofA Nationstar Ocwen
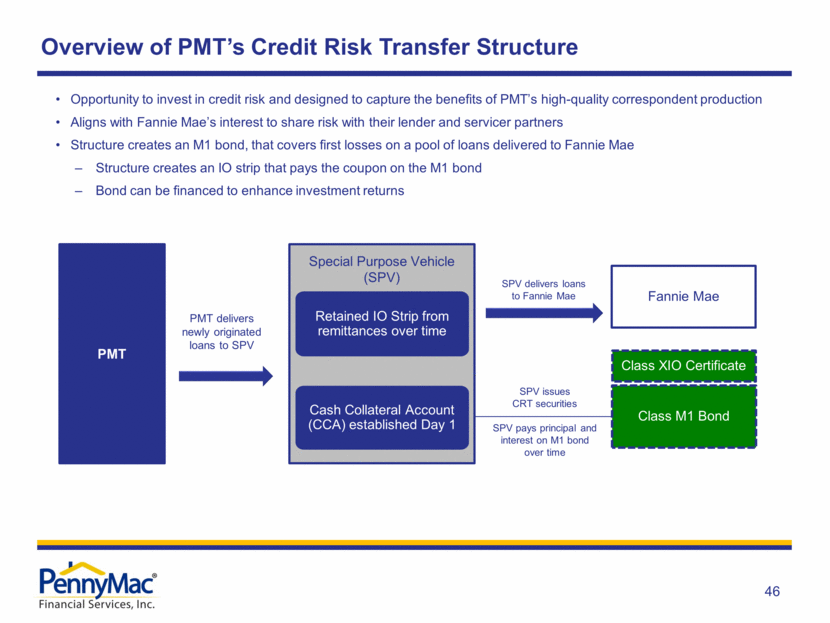
Overview of PMT’s Credit Risk Transfer Structure Opportunity to invest in credit risk and designed to capture the benefits of PMT’s high-quality correspondent production Aligns with Fannie Mae’s interest to share risk with their lender and servicer partners Structure creates an M1 bond, that covers first losses on a pool of loans delivered to Fannie Mae Structure creates an IO strip that pays the coupon on the M1 bond Bond can be financed to enhance investment returns Special Purpose Vehicle (SPV) PMT delivers newly originated loans to SPV Retained IO Strip from remittances over time Fannie Mae Cash Collateral Account (CCA) established Day 1 SPV delivers loans to Fannie Mae SPV pays principal and interest on M1 bond over time SPV issues CRT securities Class XIO Certificate PMT Class M1 Bond 46
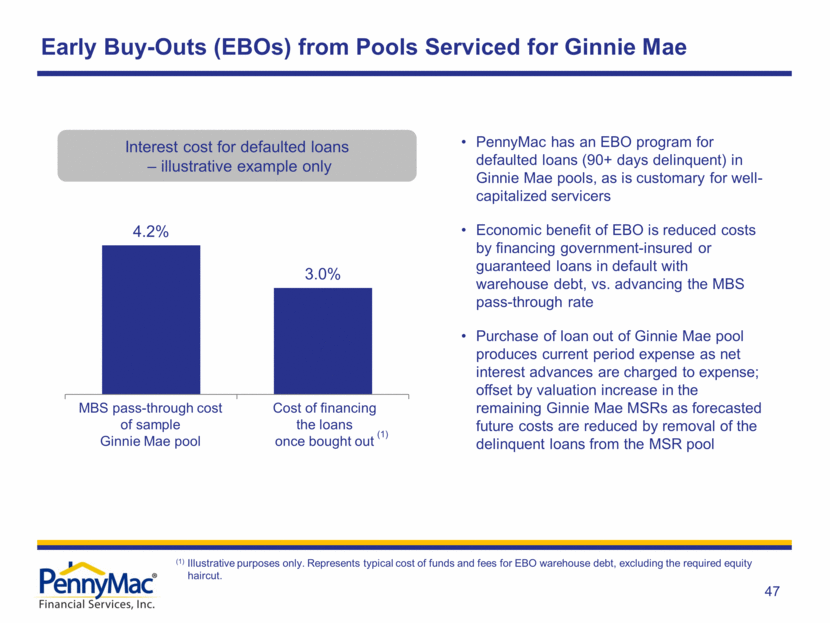
Early Buy-Outs (EBOs) from Pools Serviced for Ginnie Mae PennyMac has an EBO program for defaulted loans (90+ days delinquent) in Ginnie Mae pools, as is customary for well-capitalized servicers Economic benefit of EBO is reduced costs by financing government-insured or guaranteed loans in default with warehouse debt, vs. advancing the MBS pass-through rate Purchase of loan out of Ginnie Mae pool produces current period expense as net interest advances are charged to expense; offset by valuation increase in the remaining Ginnie Mae MSRs as forecasted future costs are reduced by removal of the delinquent loans from the MSR pool Interest cost for defaulted loans – illustrative example only (1) (1) Illustrative purposes only. Represents typical cost of funds and fees for EBO warehouse debt, excluding the required equity haircut. MBS pass-through cost of sample Ginnie Mae pool Cost of financing the loans once bought out 47 4.2% 3.0%