Attached files
| file | filename |
|---|---|
| EX-99.1 - EXHIBIT 99.1 - HOOPER HOLMES INC | q12016pressreleasevfinal.htm |
| 8-K - 8-K - HOOPER HOLMES INC | hh8-kreq12016earningsrelea.htm |

1 Hooper Holmes, Inc. May 12, 2016 Earnings Presentation Speakers: Henry Dubois, Chief Executive Officer Steven Balthazor, Chief Financial Officer

2 Safe Harbor Statement 2 This presentation contains forward-looking statements, as such term is defined in the Private Securities Litigation Reform Act of 1995, concerning the Company’s plans, objectives, goals, strategies, future events or performances, which are not statements of historical fact and can be identified by words such as: “expect,” “continue,” “should,” “may,” “will,” “project,” “anticipate,” “believe,” “plan,” “goal,” and similar references to future periods. The forward-looking statements contained in this presentation reflect our current beliefs and expectations. Actual results or performance may differ materially from what is expressed in the forward looking statements. Among the important factors that could cause actual results to differ materially from those expressed in, or implied by, the forward-looking statements contained in this presentation are risks related to customer concerns about our financial health, our liquidity, uncertainty as to our working capital requirements over the next 12 to 24 months, our ability to maintain compliance with the financial covenants contained in our credit facility and term loan, declines in our business, our competition, and our ability to retain and grow our customer base and its related impact on revenue, our ability to recognize operational efficiencies and reduce costs, our ability to realize the expected benefits from the acquisition of Accountable Health Solutions, and such other factors as discussed in Part I, Item 1A, Risk Factors, and Part II, Item 7, Management’s Discussion and Analysis of Financial Conditions and Results of Operations of our Annual Report on Form 10-K for the year ended December 31, 2015. The Company undertakes no obligation to update or release any revisions to these forward-looking statements to reflect events or circumstances, or to reflect the occurrence of unanticipated events, after the date of this presentation, except as required by law. This presentation contains information from third-party sources, including data from studies conducted by others and market data and industry forecasts obtained from industry publications. Although the Company believes that such information is reliable, the Company has not independently verified any of this information and the Company does not guarantee the accuracy or completeness of this information.

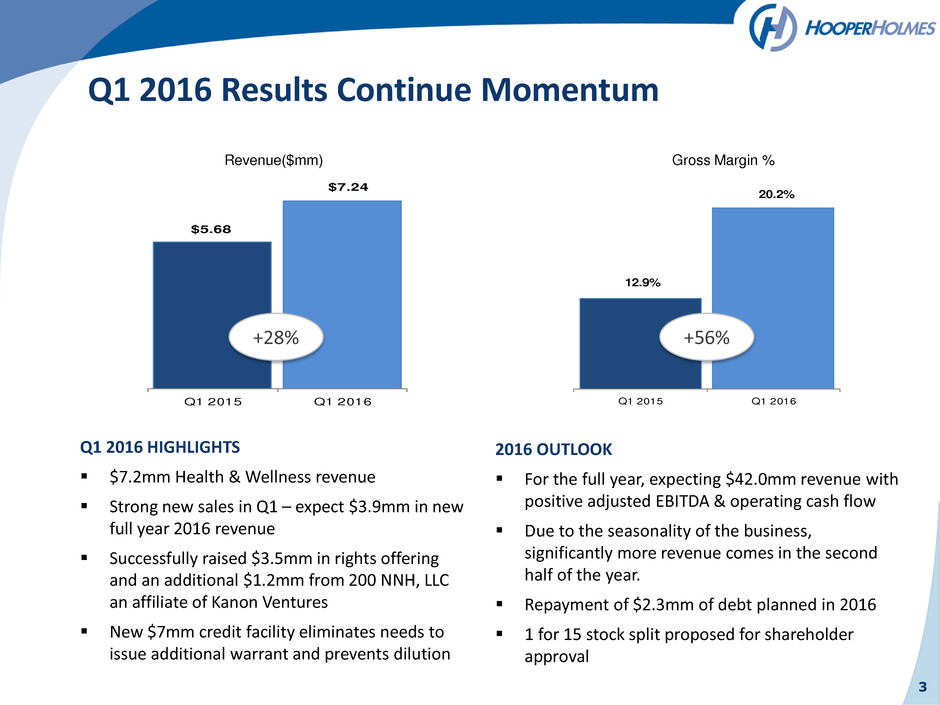
3 Q1 2016 HIGHLIGHTS $7.2mm Health & Wellness revenue Strong new sales in Q1 – expect $3.9mm in new full year 2016 revenue Successfully raised $3.5mm in rights offering and an additional $1.2mm from 200 NNH, LLC an affiliate of Kanon Ventures New $7mm credit facility eliminates needs to issue additional warrant and prevents dilution Q1 2016 Results Continue Momentum 2016 OUTLOOK For the full year, expecting $42.0mm revenue with positive adjusted EBITDA & operating cash flow Due to the seasonality of the business, significantly more revenue comes in the second half of the year. Repayment of $2.3mm of debt planned in 2016 1 for 15 stock split proposed for shareholder approval $5.68 $7.24 Q1 2015 Q1 2016+28% 12.9% 20.2% Q1 2015 Q1 2016 +56% Revenue($mm) Gross Margin %

25% 47% 69% 50% 6% 3% 0% 10% 20% 30% 40% 50% 60% 70% 80% 90% 100% Q1 2015 Q1 2016 4 4 Revenue % Key Takeaways Q1 2016 Revenue by Sales Channels R ev en u e C la ss if ic atio n b y sal e s c h an n e ls Biometric screenings sold through all sales channels Blended book of business is evolving - we expect continued growth in coaching and portal revenue Direct sales channel reflects customers who contract directly with us for one or more services. These contracts are typically multi- year contracts. Channel Partners remain largest segment– expect growth in second half of the year due to historical seasonality Revenue from clinical research organizations expected to increase during the year, reflecting project milestones Clinical Research Organizations Channel Partners Direct Customers

5 5 Adjusted EBITDA ($mm) 10% Improvement A d ju st ed E B IT D A in mill io n $ Q1 2016 Results vs. Q1 2015 - continued Q1 2016 adjusted EBITDA improvement of 10% over Q1 2015 ▫ Q1 2016 adjusted EBITDA is in line with expectations and covenants. ▫ Expecting positive adjusted EBITDA and operating cash flow for full year 2016 Q1 2015 Q1 2016 Net Loss ($2.1) ($3.4) Interest expense $0.0 $0.2 Other debt related costs in Int exp $0.1 $0.6 Income taxes $0.0 $0.0 Depreciation & amortization $0.3 $0.7 Share-based compensation $0.1 $0.1 Stock payments $0.0 $0.2 Transaction Costs $0.1 $0.1 Transition Costs $0.0 $0.1 Portamedic Contingent Liability $0.0 $0.2 Adjusted EBITDA ($1.6) ($1.4)

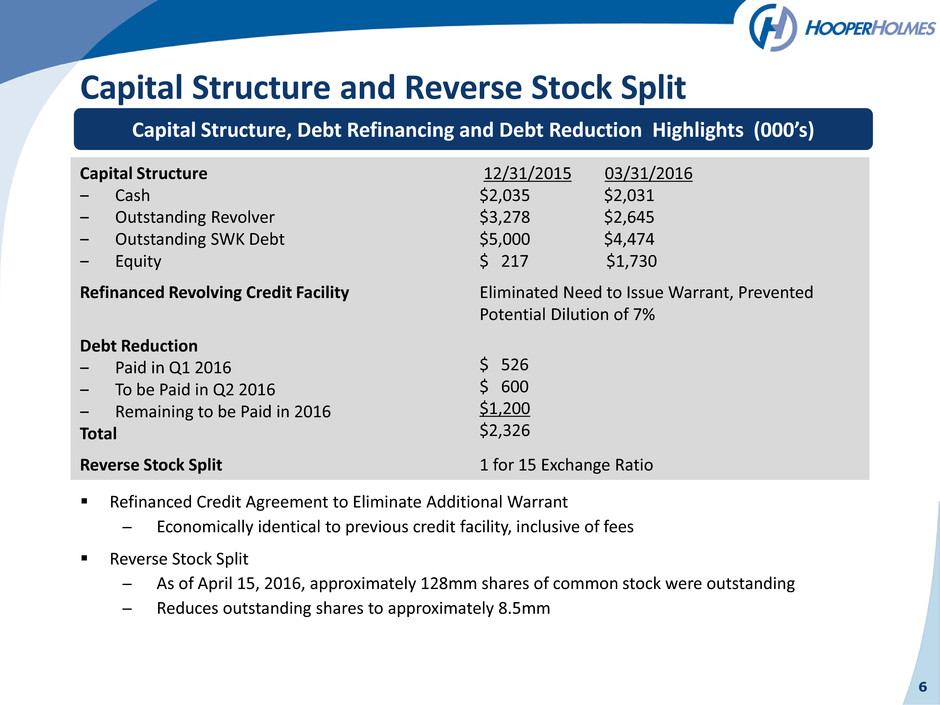
6 Capital Structure and Reverse Stock Split Capital Structure ‒ Cash ‒ Outstanding Revolver ‒ Outstanding SWK Debt ‒ Equity 12/31/2015 03/31/2016 $2,035 $2,031 $3,278 $2,645 $5,000 $4,474 $ 217 $1,730 Refinanced Revolving Credit Facility Eliminated Need to Issue Warrant, Prevented Potential Dilution of 7% Debt Reduction ‒ Paid in Q1 2016 ‒ To be Paid in Q2 2016 ‒ Remaining to be Paid in 2016 Total $ 526 $ 600 $1,200 $2,326 Reverse Stock Split 1 for 15 Exchange Ratio Capital Structure, Debt Refinancing and Debt Reduction Highlights (000’s) Refinanced Credit Agreement to Eliminate Additional Warrant ̶ Economically identical to previous credit facility, inclusive of fees Reverse Stock Split ̶ As of April 15, 2016, approximately 128mm shares of common stock were outstanding ̶ Reduces outstanding shares to approximately 8.5mm

Quality Leadership in Biometric Screenings 7 Full Year 2015 Metrics “The Site Manager and her group did a fantastic job working our event. They were courteous and quick and the professionals everyone wants at their event. Thank you for making our event a true success.” – Channel Partner end customer “This has been the most well organized, and professionally orchestrated Screening clinic in the history of our onsite program.” – HR Director for a direct customer “I want to express my gratitude for your prompt response and professionalism in carrying out exams for my wife and me. You were able to confirm the status and the examiner was at our door when most people were operating on delayed schedules. She was very thorough, insightful, and articulate in explaining our exam and the impact wellness screening should have on our overall health. Thanks for your help and professionalism!” – Screening Participant

8 Momentum Continues – YTD Sales Growth in All Areas 2 0 1 6 n ew sal e s re ve n u e in mill io n $ Strong YTD Sales Growth Expected to Deliver $3.9mm in 2016 Revenues $0.7 $1.1 $1.1 $1.0 $3.9 $0 $1 $2 $3 $4 2016 Estimated Revenue Impact New Clinical Research Organizations New Channel Partners New End Customers Through Channel Partners New Direct Customers New Clinical Research Organization Projects Estimated $1.0mm in 2016 Large contract extension estimated at $12.0mm in revenue over the life of the contract, $0.8mm in 2016 New Channel Partners Estimated $1.1mm in 2016 New End Customers Through Existing Channel Partners Estimated $1.1mm in 2016 Well positioned to grow with our Channel Partners New Direct Customer Estimated $0.7mm in 2016 Contracts are typically multi-year

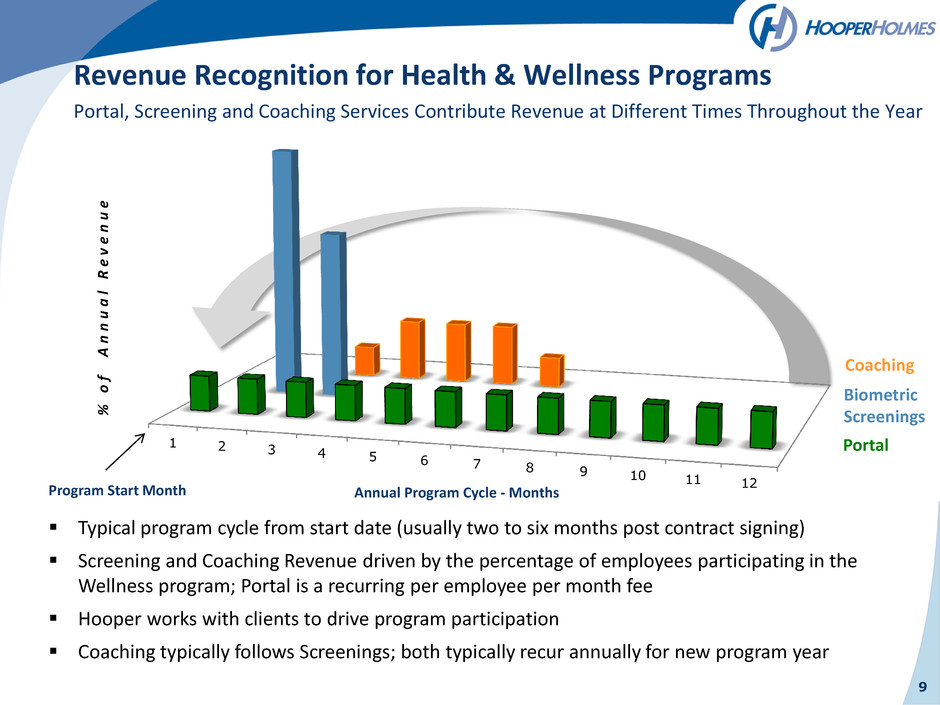
9 1 2 3 4 5 6 7 8 9 10 11 12 Portal Coaching Biometric Screenings % o f A n n u a l R e v e n u e Revenue Recognition for Health & Wellness Programs Program Start Month Annual Program Cycle - Months Portal, Screening and Coaching Services Contribute Revenue at Different Times Throughout the Year Typical program cycle from start date (usually two to six months post contract signing) Screening and Coaching Revenue driven by the percentage of employees participating in the Wellness program; Portal is a recurring per employee per month fee Hooper works with clients to drive program participation Coaching typically follows Screenings; both typically recur annually for new program year

10 $3.9mm of new 2016 revenue won through sales efforts already this year, including the addition of full service wellness clients Q2 2016 continues toward annual target of $42mm For full year 2016, expecting $42mm revenue representing 30% growth as compared to 2015 and continued progress toward achieving our $100mm revenue target Expecting positive adjusted EBITDA and operating cash flow for the full year New Sales Financial Growth Corporate Execution Driving Shareholder Value Improved capital structure creates foundation for growth Preparation for second half volumes well underway Drive scale to realize margin improvements Drive Shareholder Value
