Attached files
| file | filename |
|---|---|
| 8-K - SBT BANCORP, INC. 8-K - SBT Bancorp, Inc. | a51340725.htm |
Exhibit 99.1

Annual Shareholders Meeting May 10, 2016

Welcome
George B. Odlum, Jr., DMD

Item 1: Election of Directors Martin J. Geitz Gary R. Kevorkian Jerry W. Long Peter C. Pabich
Item 2: Non-binding Advisory Vote on Compensation of Named Executive Officers “Say on Pay”
Item 3: Ratification of Appointment of Independent Registered Public Accounting Firm
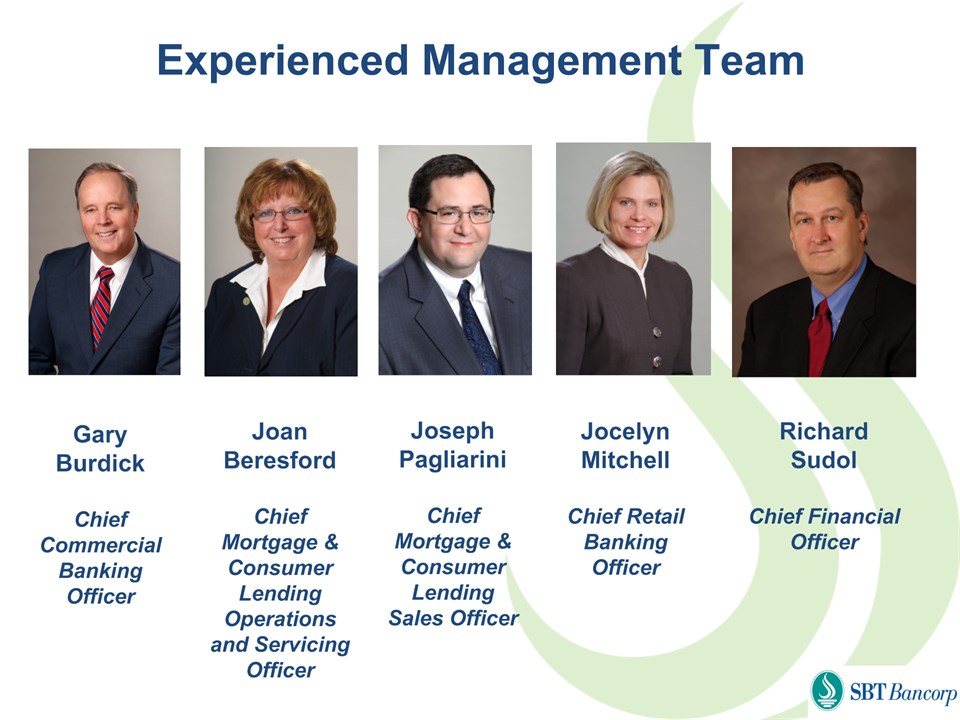
Experienced Management Team Gary BurdickChief Commercial Banking Officer JoanBeresfordChief Mortgage & Consumer Lending Operations and Servicing Officer Jocelyn MitchellChief Retail Banking Officer Richard SudolChief Financial Officer Joseph PagliariniChief Mortgage & Consumer Lending Sales Officer

2015 Overview
The foregoing contains forward-looking statements within the meaning of Section 27A of the Securities Act of 1933, as amended, and Section 21E of the Securities Exchange Act of 1934, as amended (the “Exchange Act”), and are intended to be covered by the safe harbor provisions of the Private Securities Litigation Reform Act of 1995. These statements, which are based on certain assumptions and describe our future plans, strategies and expectations, can generally be identified by the use of words such as “may,” “will,” “should,” “could,” “would,” “plan,” “believe,” “expect,” “anticipate,” “intend,” “estimate” or words of similar meaning. These forward-looking statements include statements relating to our anticipated future financial performance, projected growth and management’s long-term performance goals, as well as statements relating to the anticipated effects on results of operations and financial condition from developments or events, our business and growth strategies. These forward-looking statements are subject to significant risks, assumptions and uncertainties, and could be affected by many factors. The following, which is not intended to be an all-encompassing list of risks and uncertainties affecting us, summarizes several factors that could cause our actual results to differ materially from those anticipated or expected in these forward-looking statements: economic conditions (both generally and in our markets) being less favorable than expected; a general decline in the real estate and lending market; inaccuracies in management’s assumptions used in calculating the appropriate amount to be placed into our allowance for loan and lease losses; restrictions or conditions imposed by regulators on our operations; legislative and regulatory changes (including the unexpected impact of the Dodd-Frank Wall Street Reform and Consumer Protection Act and related regulations) that may subject us to additional regulatory oversight; changes in accounting standards and compliance requirements; competitive pressures among depository and other financial institutions increasing significantly; changes in the interest rate environment; competitors having greater financial resources and developing products that enable them to compete more successfully than we can; our ability to attract and retain key personnel; adverse changes occurring in the equity markets; war or terrorist activities causing further deterioration in the economy or instability in credit markets; and economic, governmental or other factors that may prevent the projected population and residential and commercial growth in the markets in which we operate. A detailed discussion of factors that could affect our results is included in our SEC filings, including our Form 10-K for the year ended December 31, 2015 and our Quarterly Report on Form 10-Q for the quarterly period ended March 31, 2016. We do not undertake any obligation to update any forward-looking statement to reflect circumstances or events that occur after the date of forward-looking statements are made. Forward-looking statements speak only as of the date on which they are made. Although we believe that the expectations reflected in the forward-looking statements are reasonable, we cannot guarantee future results, levels of activity, performance or achievements. Forward-Looking Statements
2015 Financial Performance Overview2015 HighlightsCapital RaiseCommercial Banking GrowthMortgage Banking Improvement Mobile BankingWest Hartford Branch Agenda
2015 Financial Performance Overview
AdvantagesStrong Organic Growth since 2008Strong Capital Position & Balance Sheet Market Share Leader in Key CategoriesExperienced Management TeamChallengesEarningsEarnings DiversificationScale State of the Bank
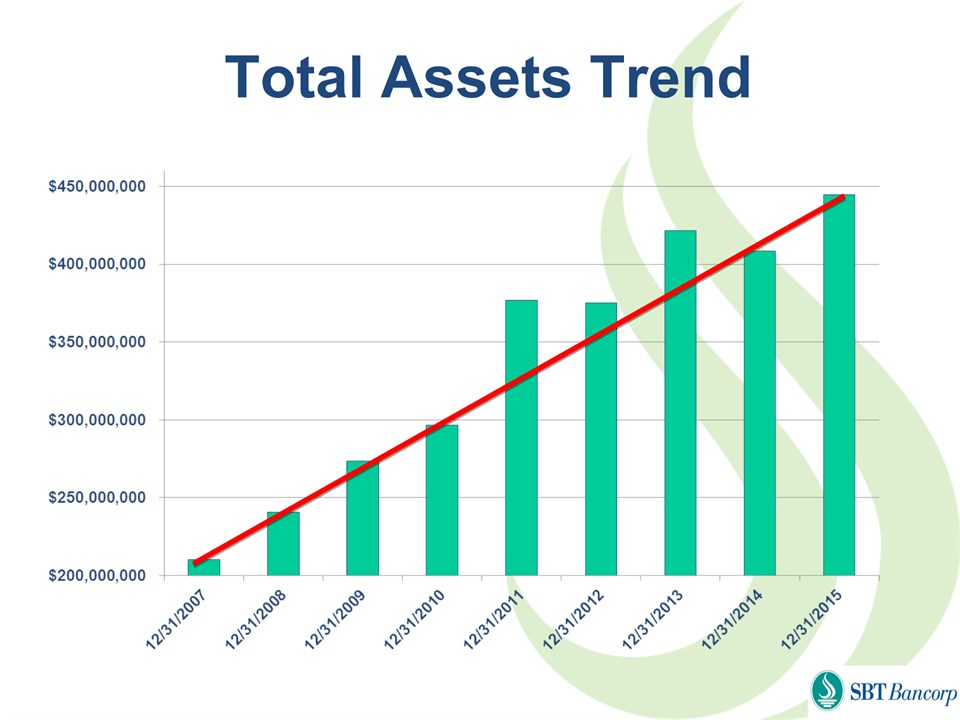
Total Assets Trend
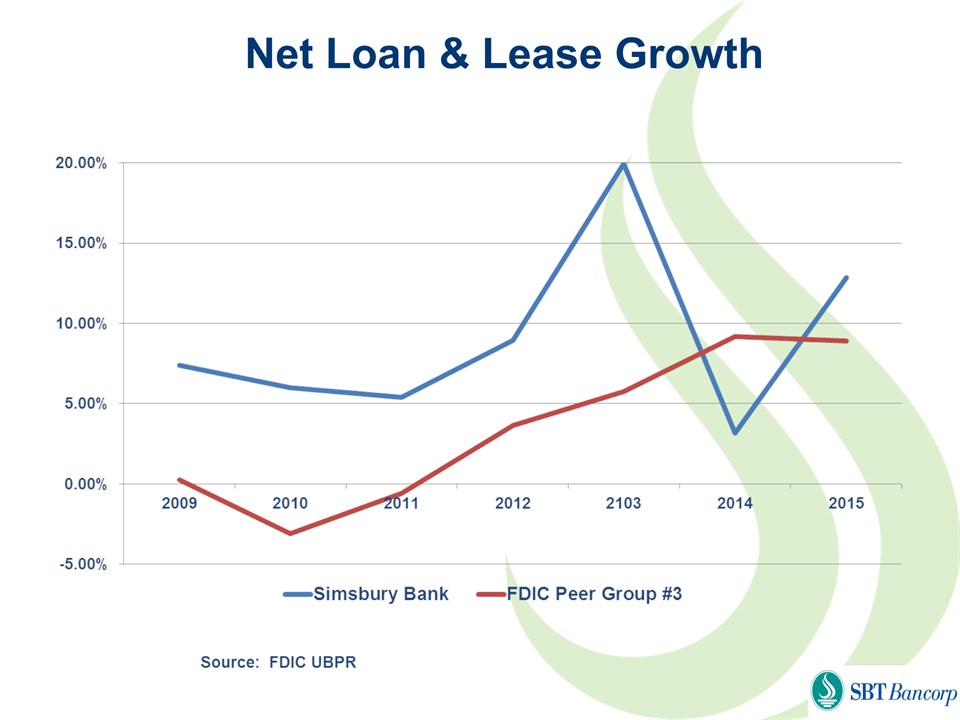
Net Loan & Lease Growth
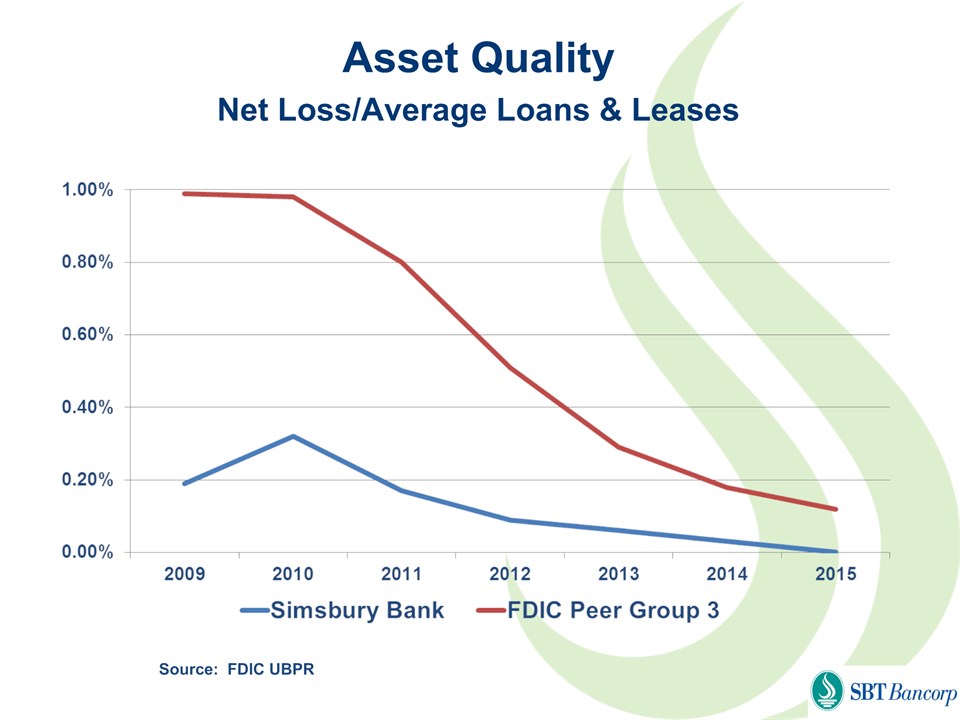
Asset Quality Net Loss/Average Loans & Leases Source: FDIC UBPR
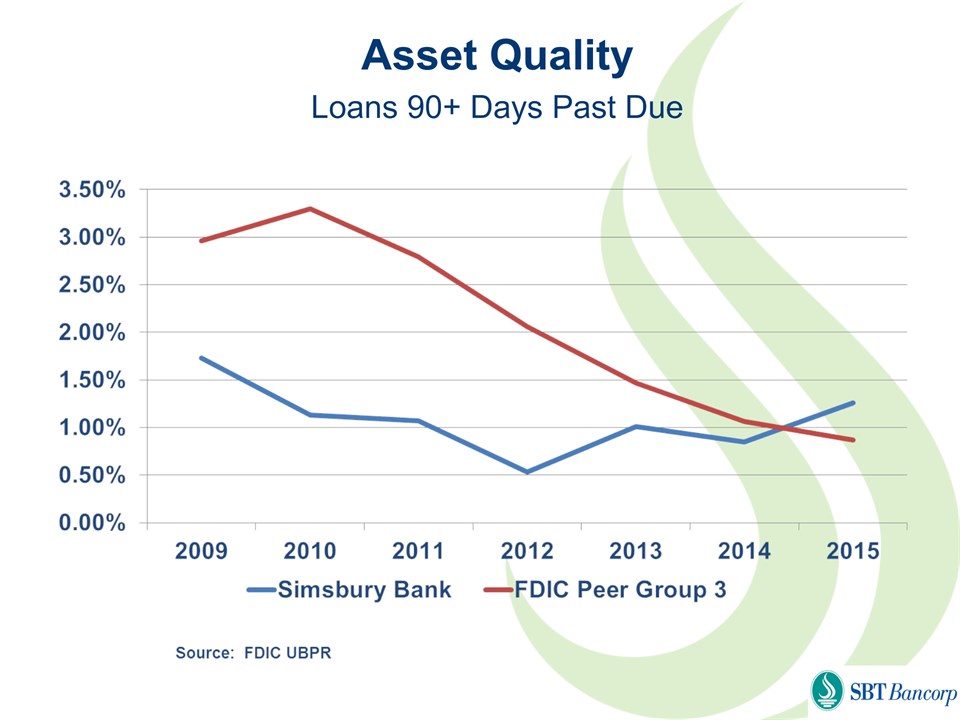
Asset QualityLoans 90+ Days Past Due
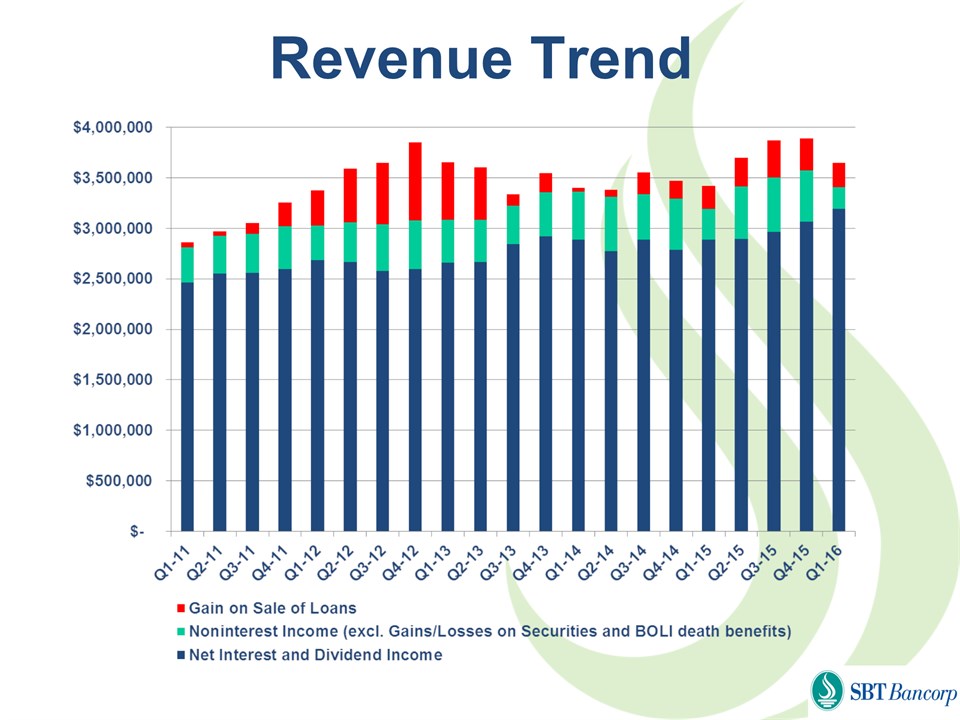
Revenue Trend
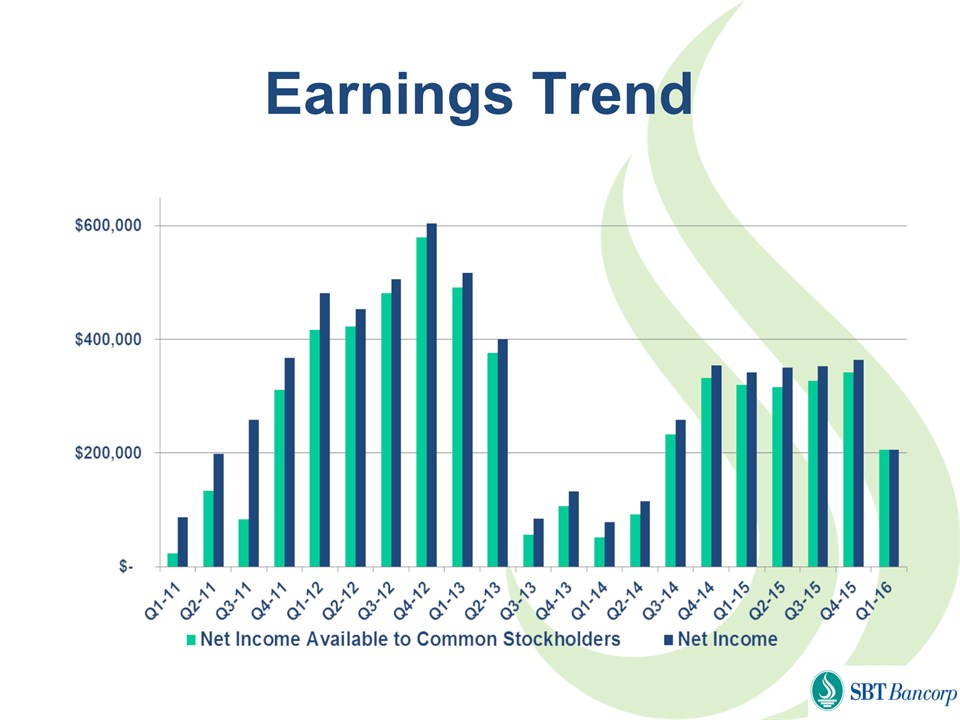
Earnings Trend
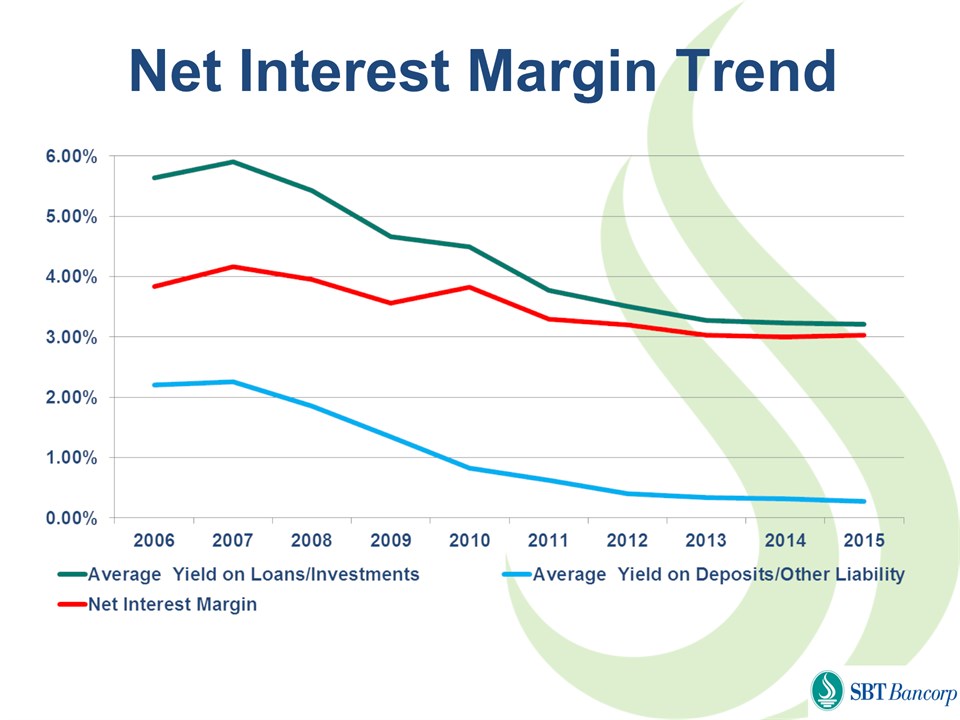
Net Interest Margin Trend
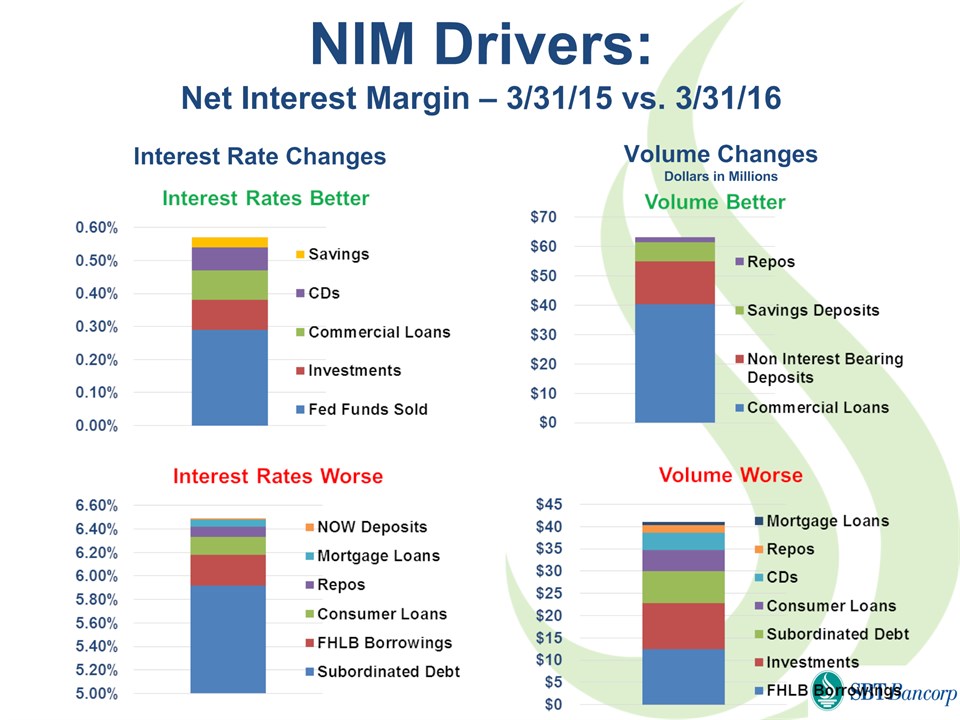
NIM Drivers:Net Interest Margin – 3/31/15 vs. 3/31/16 Volume ChangesDollars in Millions Interest Rate Changes
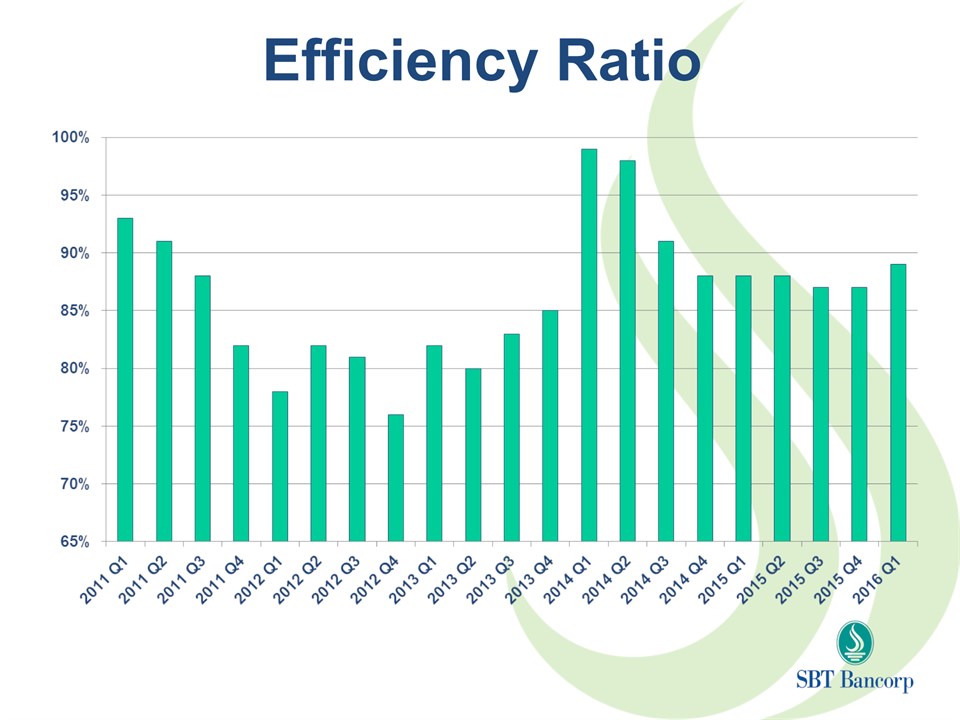
Efficiency Ratio
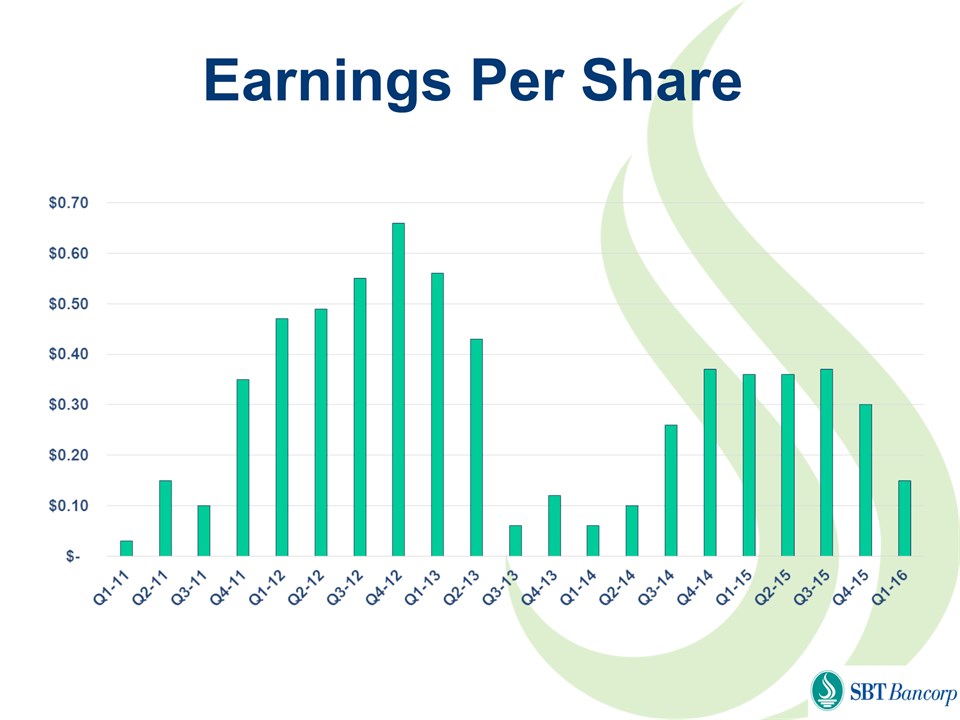
Earnings Per Share
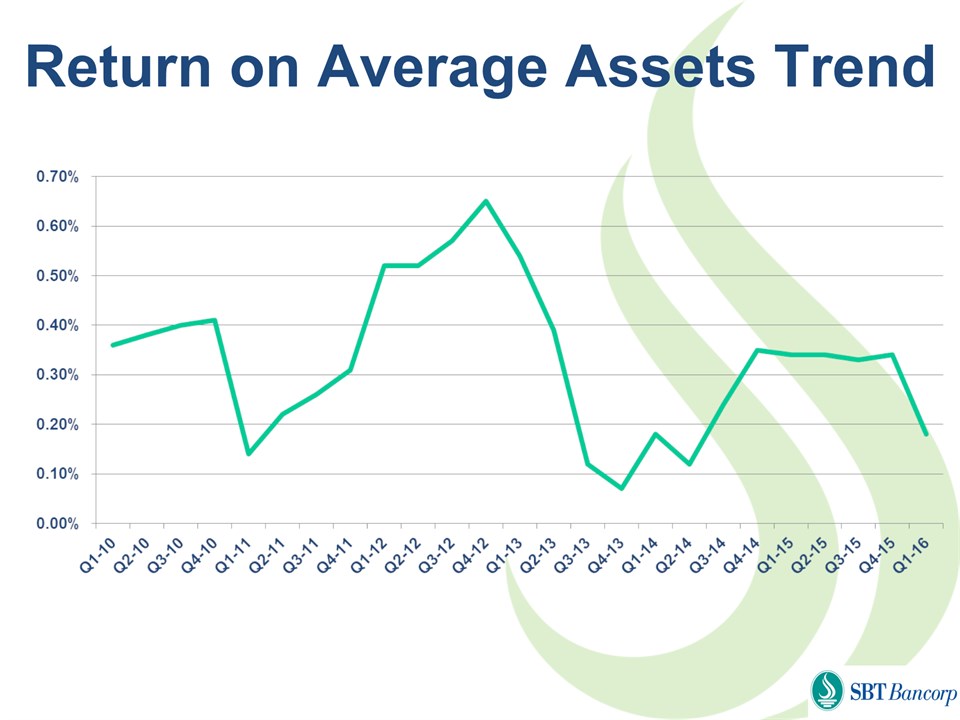
Return on Average Assets Trend
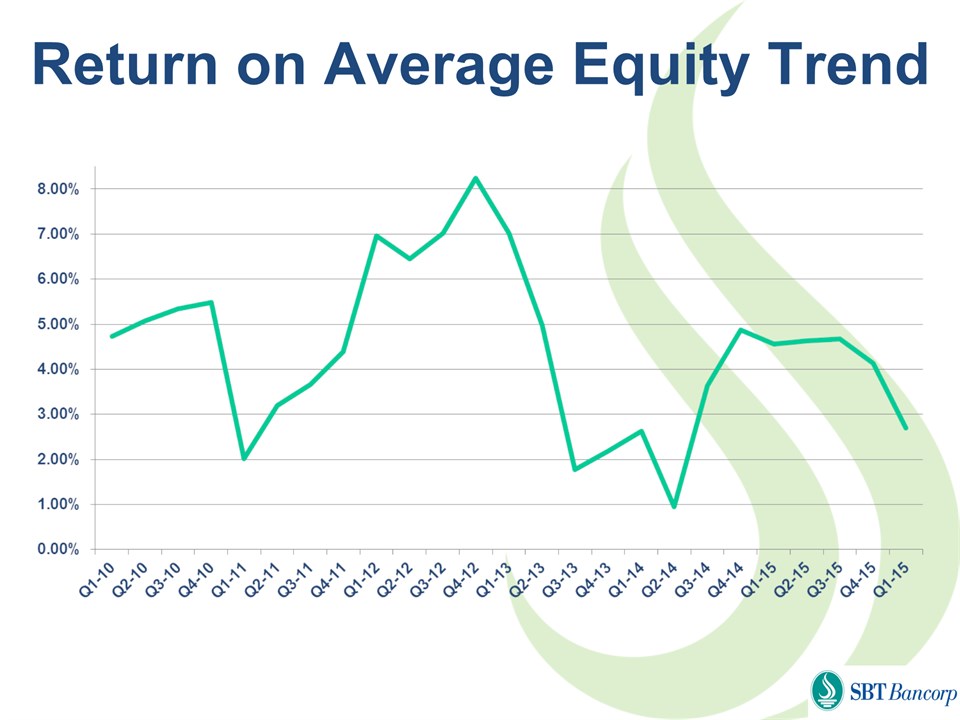
Return on Average Equity Trend
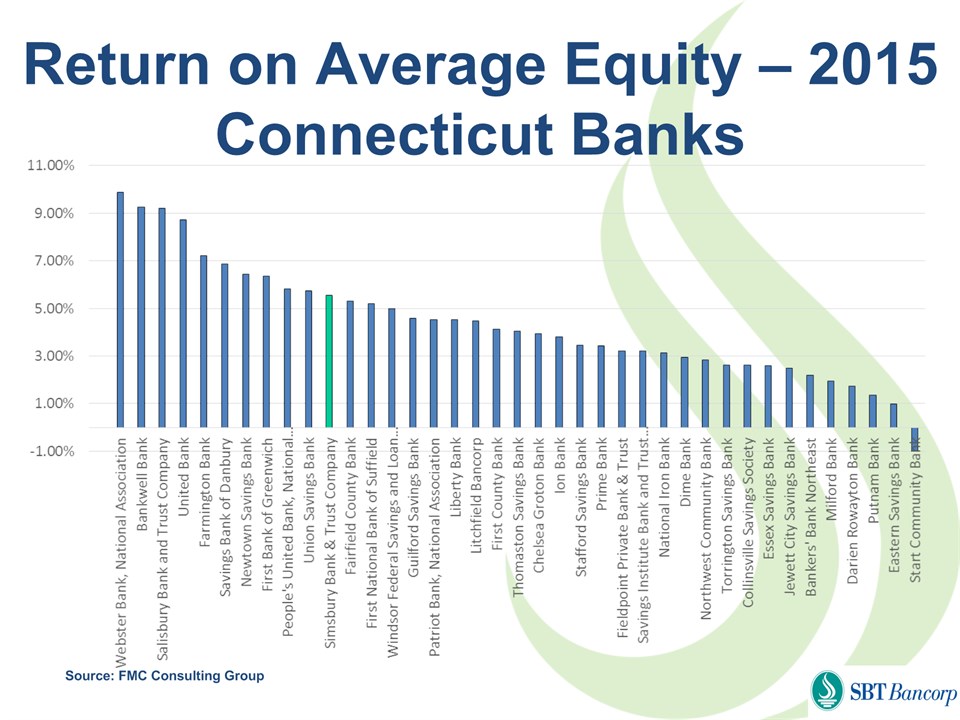
Return on Average Equity – 2015Connecticut Banks Source: FMC Consulting Group
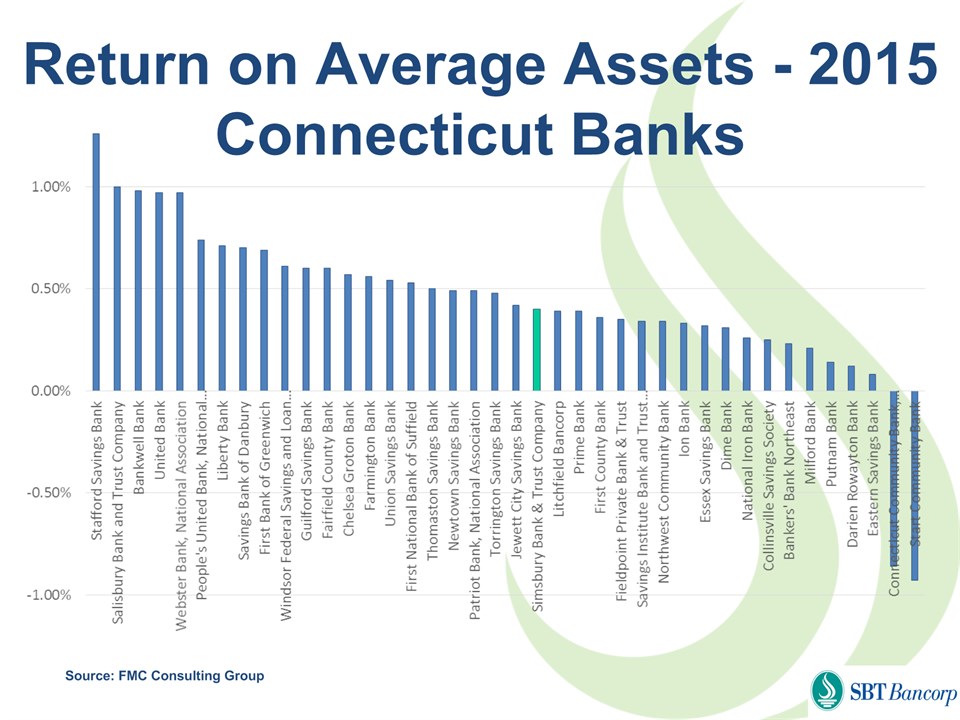
Return on Average Assets - 2015Connecticut Banks Source: FMC Consulting Group
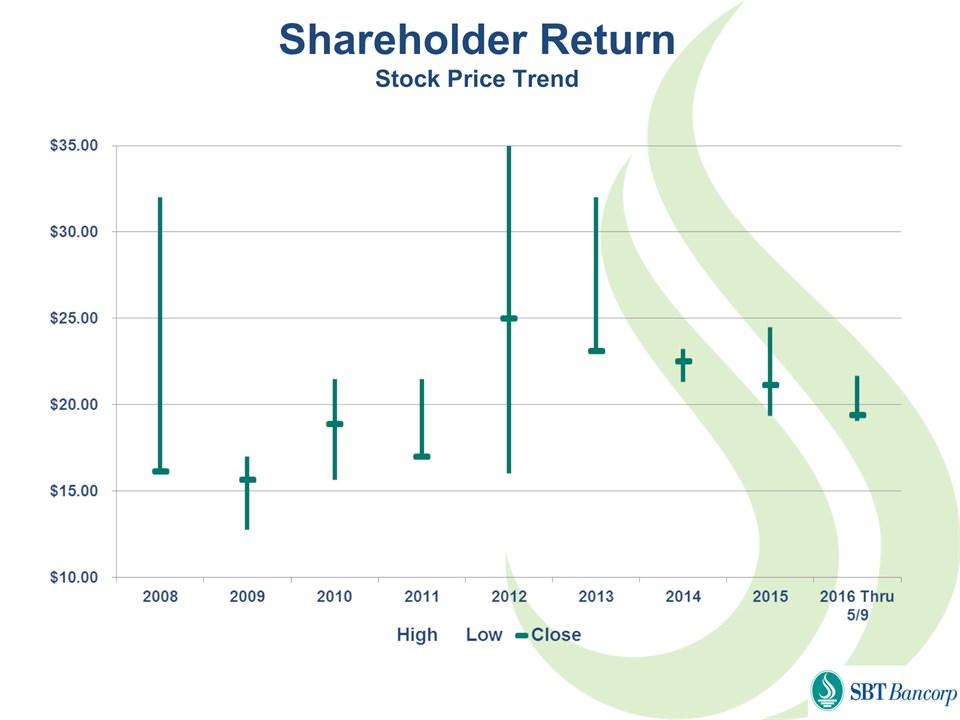
Shareholder ReturnStock Price Trend
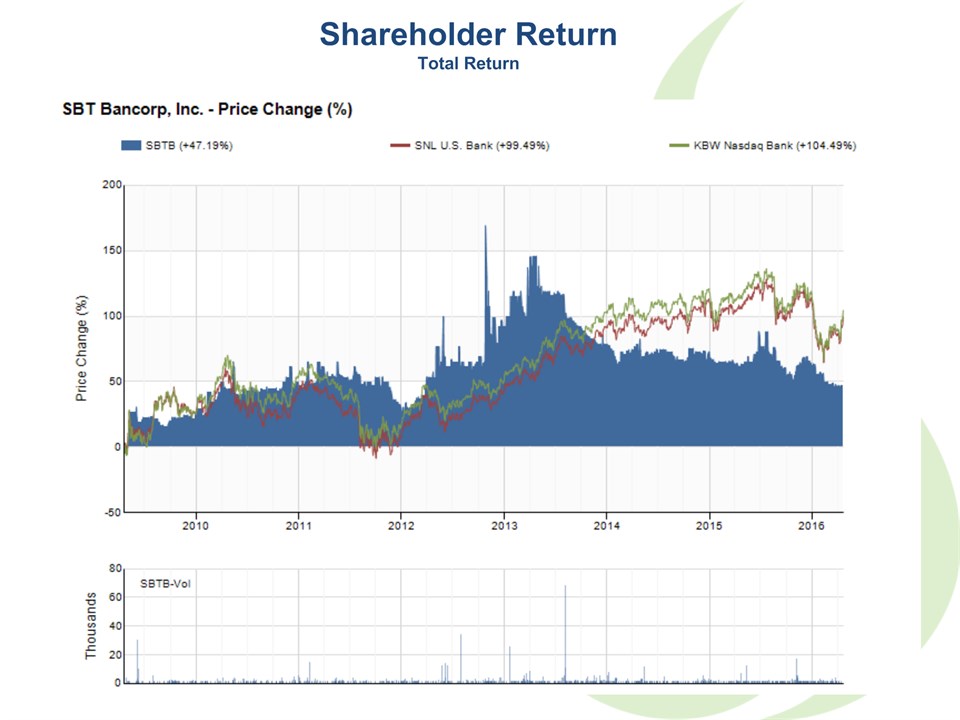
Shareholder ReturnTotal Return

2015 Highlights

Capital Raise
Cost of SBLF set to increase In Q1 2016Rate increase from 1% to 9%Additional $720,000 annual dividend paymentSupport Loan GrowthSupport West Hartford OpportunityStrengthen Regulatory Capital RatiosHolding Company Common RatioBank BASEL III Ratios Catalyst for Capital Raise
Subordinated DebtDebt lowers the Cost of CapitalReduces Ownership DilutionMinimizes Book Value DilutionCommon StockStrengthens Holding Company CapitalReduces Subordinated debt interest payments Subordinated Debt & Common Mix
Additions$7.2 million (net) of Subordinated DebtMatures 2025; callable after 20206.75% Interest Rate (4.75%, net of taxes)$8.9 million (net) of Common Stock400,000 shares at $21 per shareOverallotment $1.08 million (51,473 shares)ReductionsPayoff $9.0 million of SBLF Preferred StockRate resets Q1 2016 to 9.0% from 1.0% New Capital Structure
Supports Asset GrowthUp to $85 millionWest Hartford branchReduces Preferred Dividend/Interest ObligationFrom $810,000 to $450,000 (after tax) Strengthens Capital RatiosHolding Company Common Ratio improves to 6.73% from 4.77% . Net New Capital - $7 million
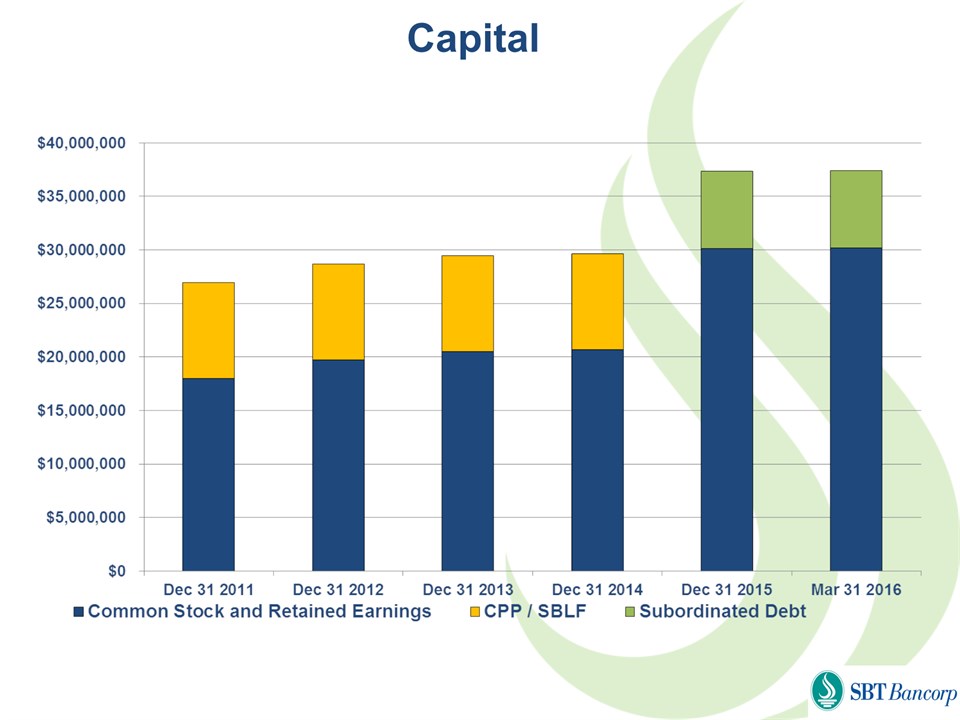
Capital
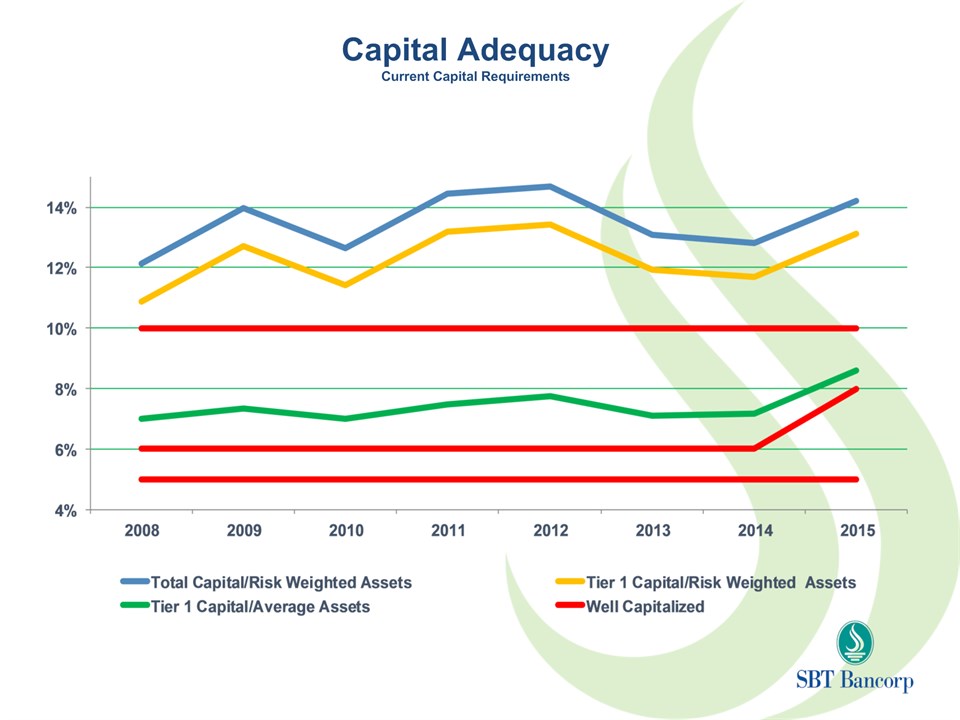
Capital AdequacyCurrent Capital Requirements
Commercial Banking
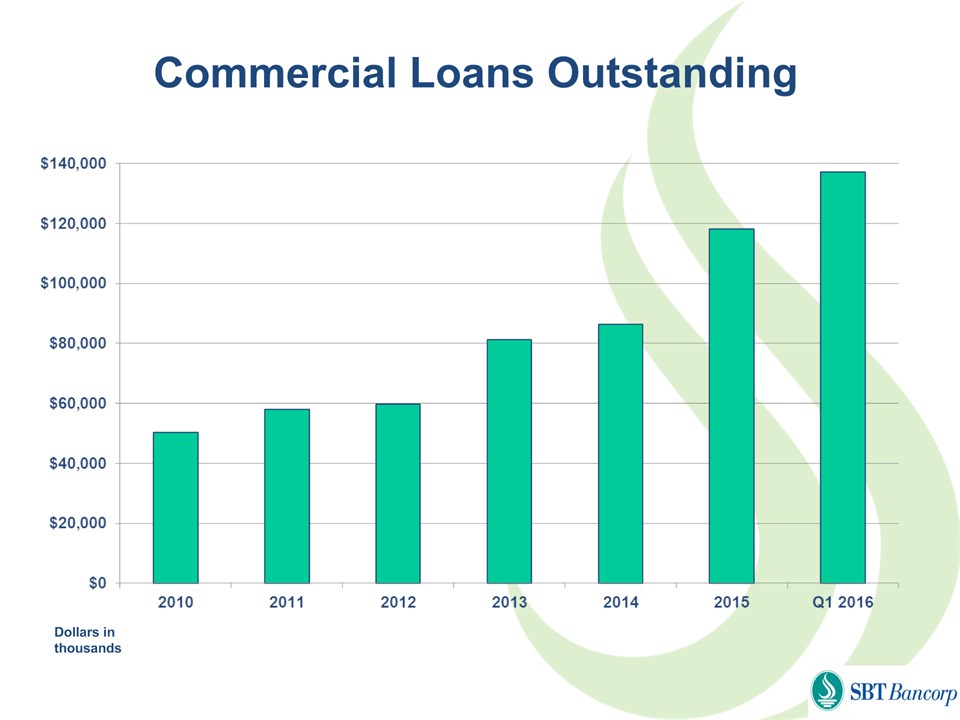
Commercial Loans Outstanding Dollars in thousands
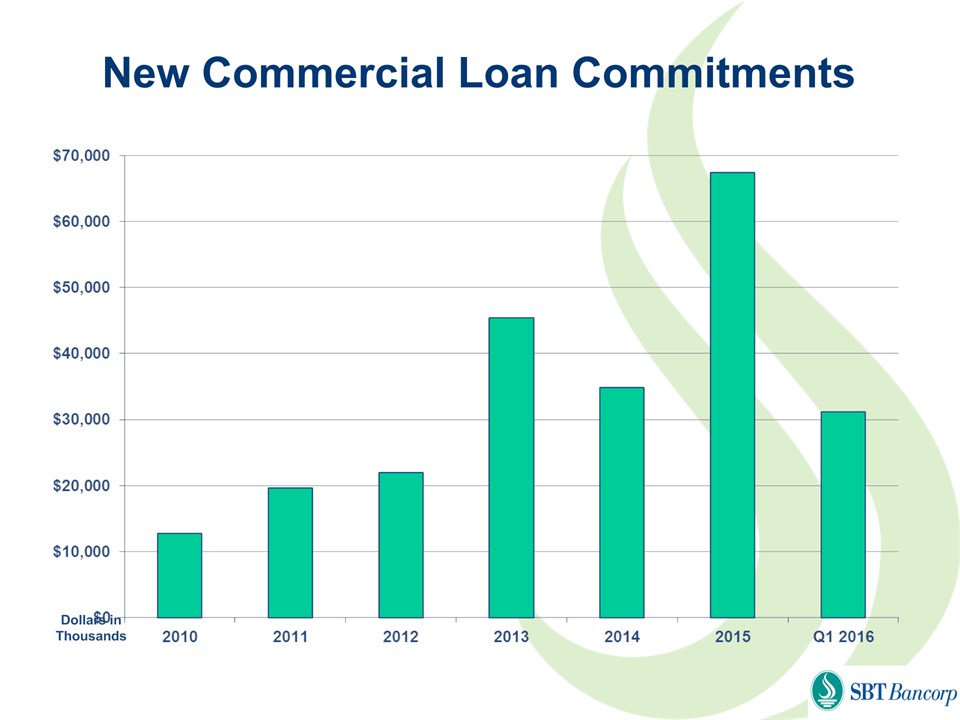
New Commercial Loan Commitments Dollars in Thousands
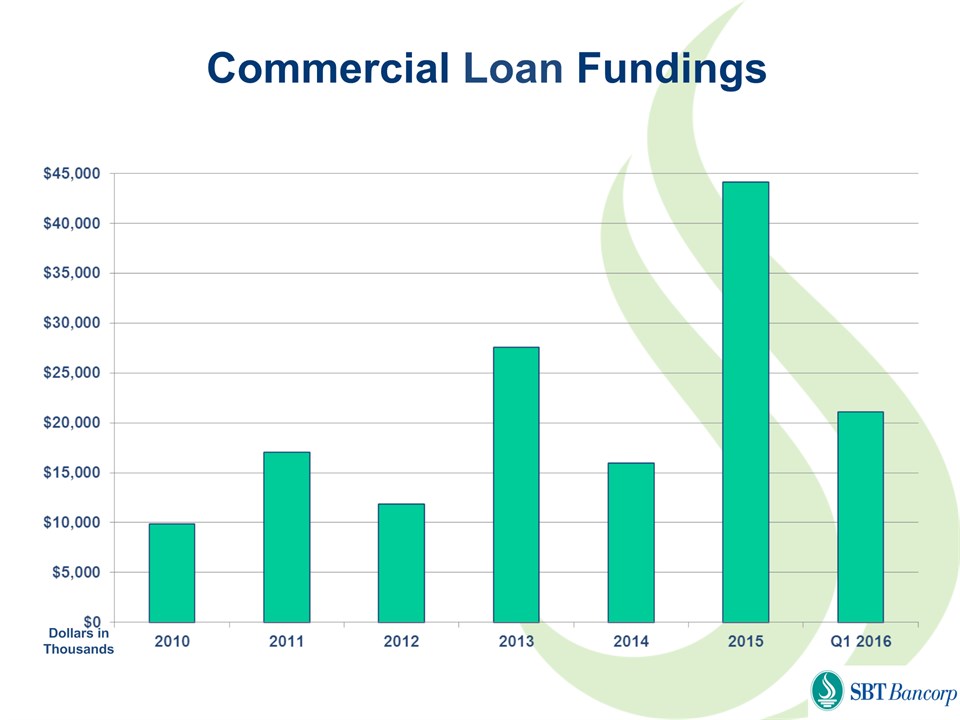
Commercial Loan Fundings Dollars in Thousands
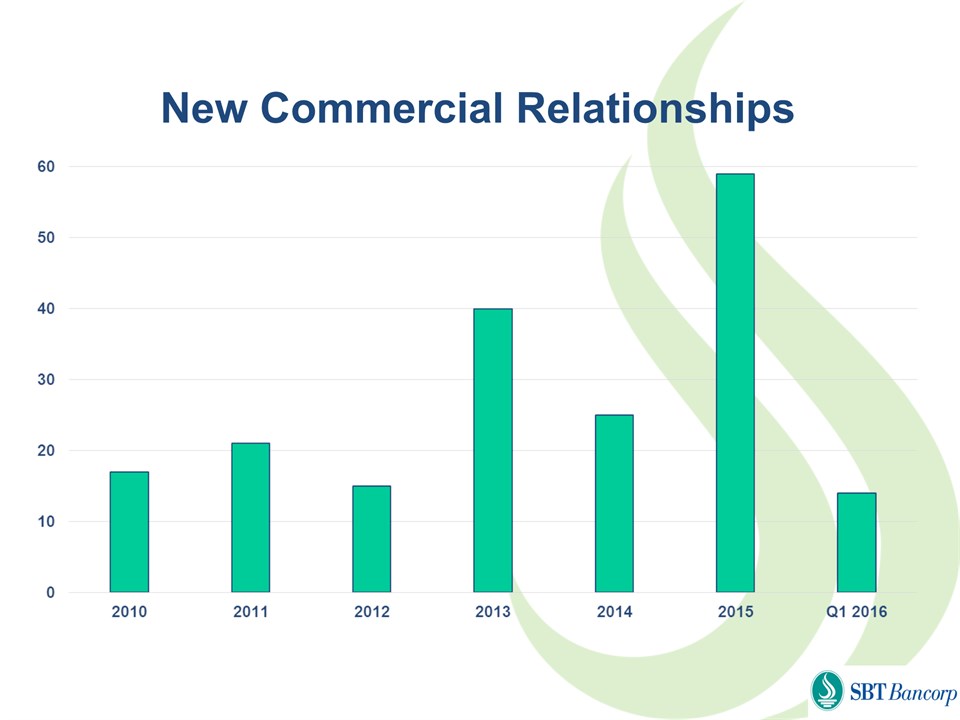
New Commercial Relationships
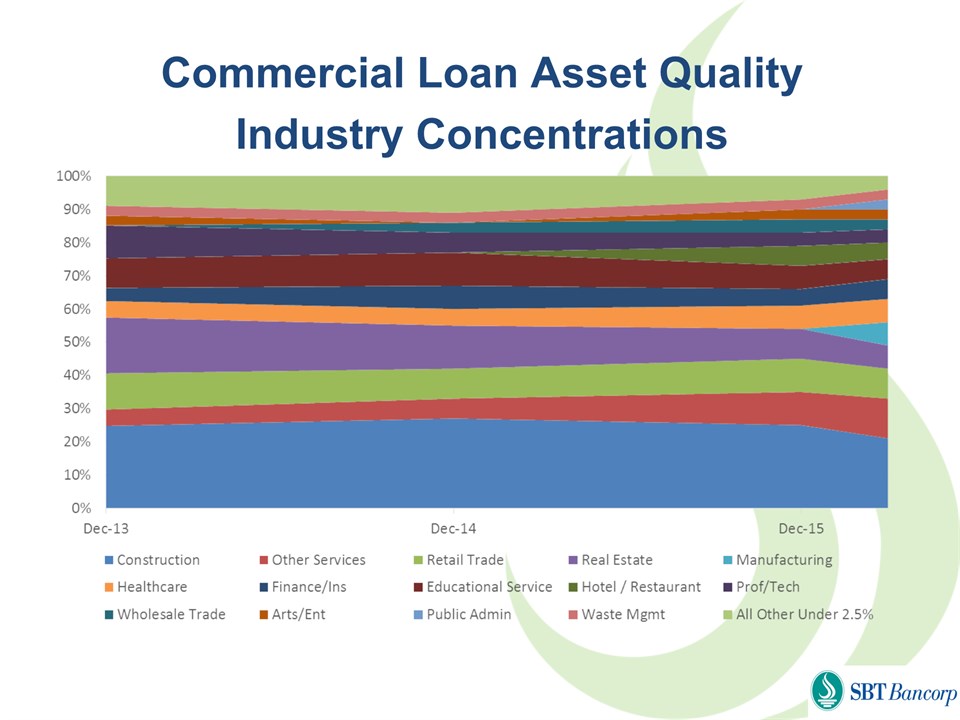
Commercial Loan Asset QualityIndustry Concentrations
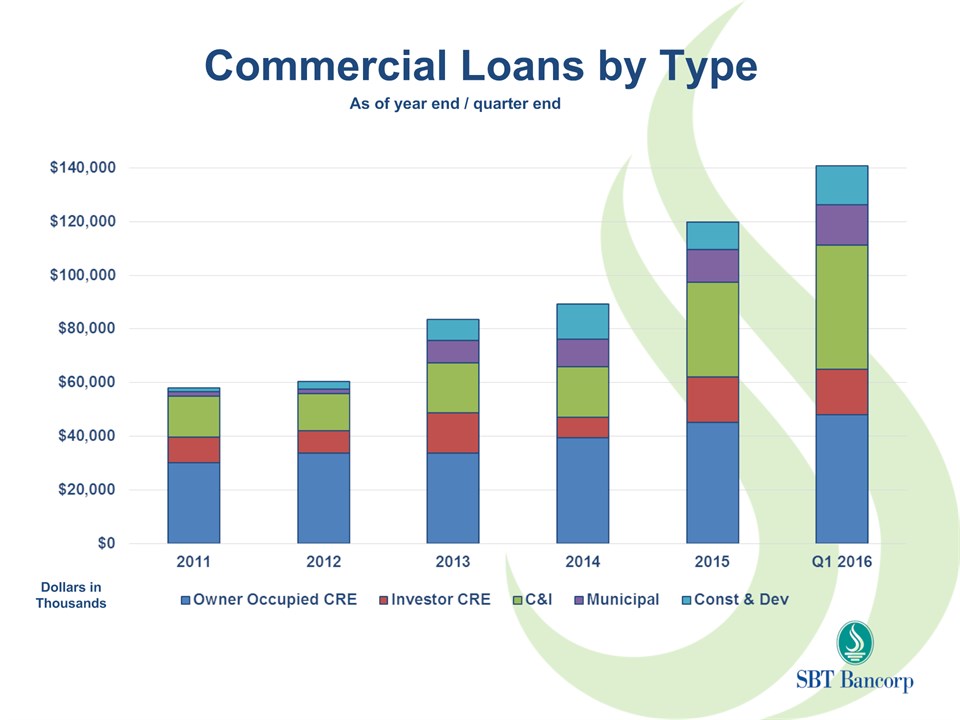
Commercial Loans by Type Dollars in Thousands As of year end / quarter end
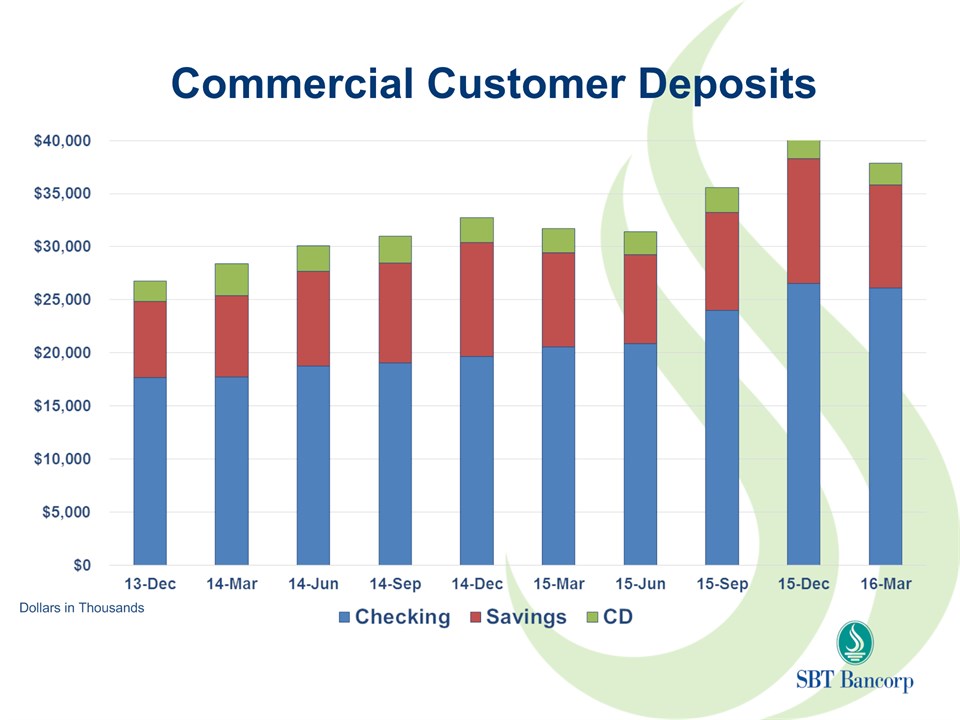
Commercial Customer Deposits Dollars in Thousands
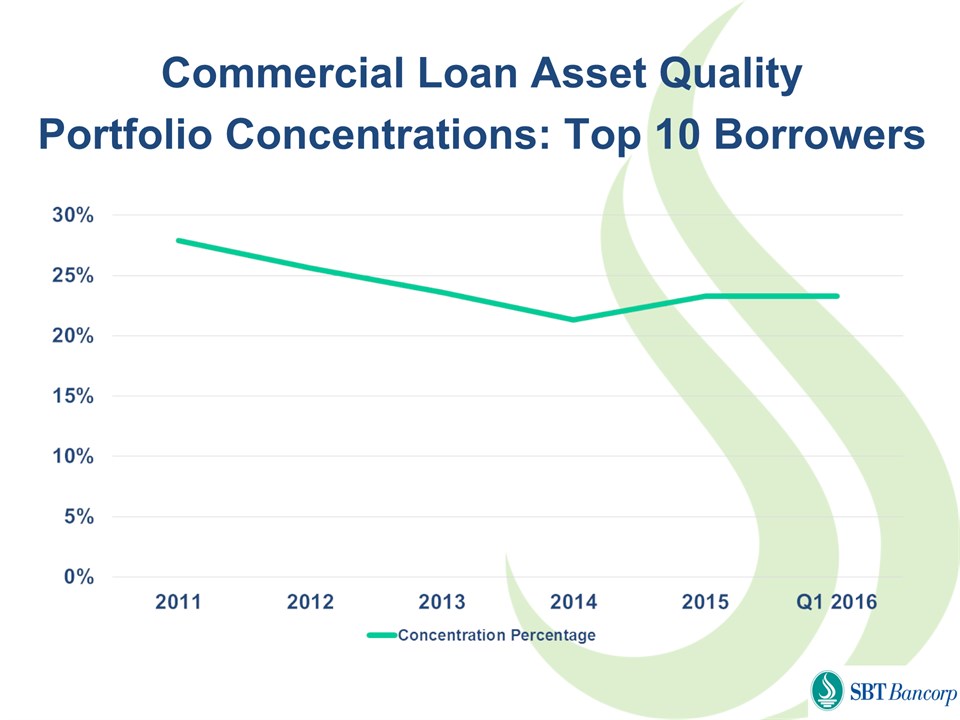
Commercial Loan Asset QualityPortfolio Concentrations: Top 10 Borrowers
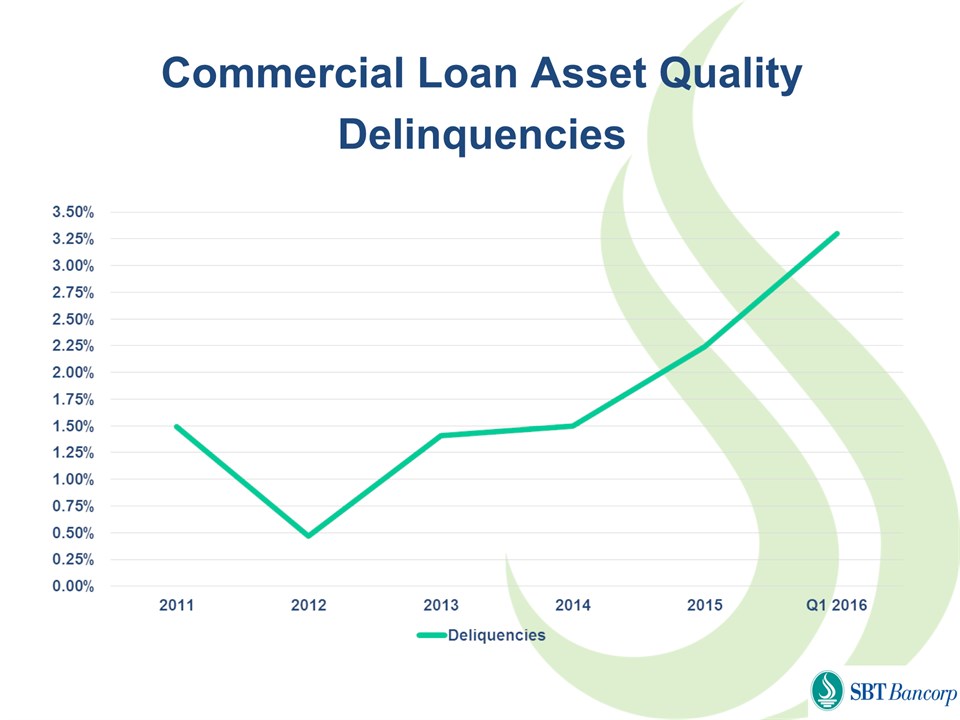
Commercial Loan Asset QualityDelinquencies
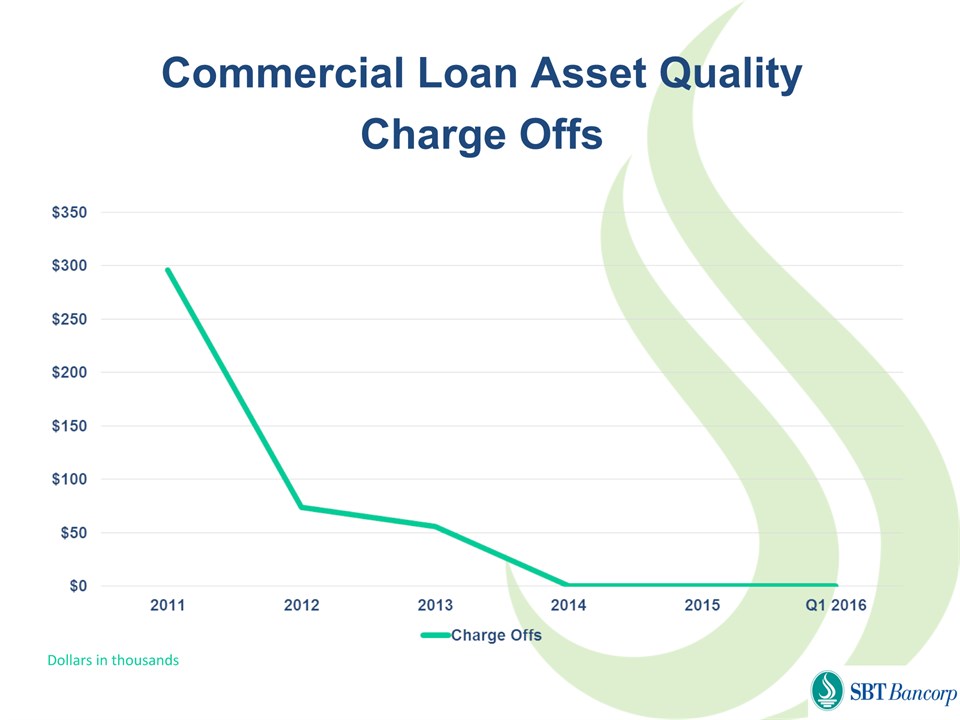
Commercial Loan Asset QualityCharge Offs Dollars in thousands
Mortgage Banking
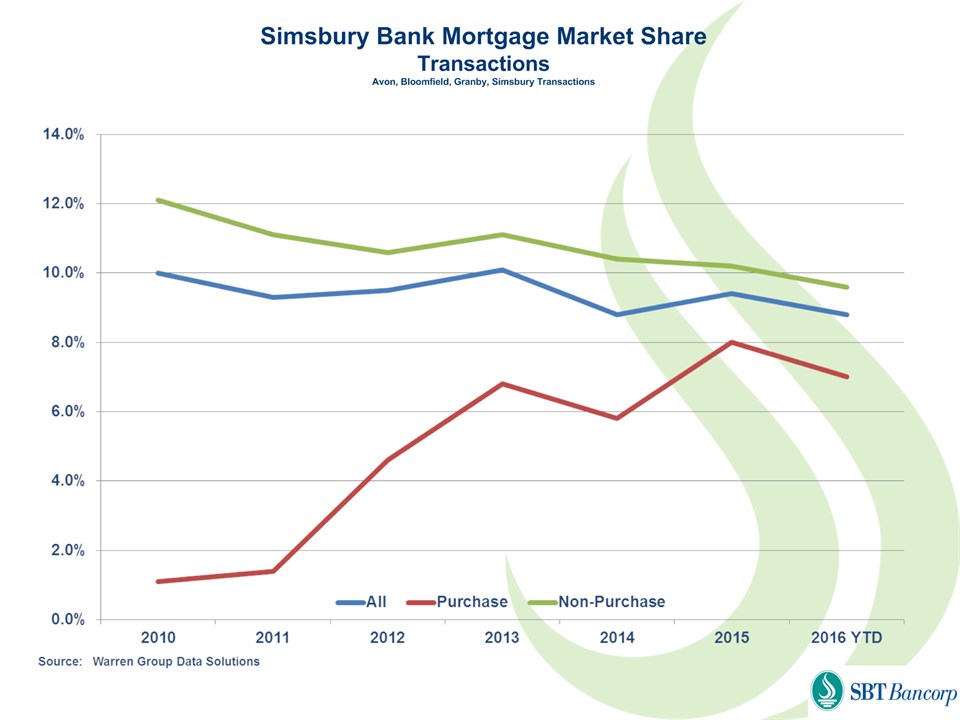
Simsbury Bank Mortgage Market ShareTransactionsAvon, Bloomfield, Granby, Simsbury Transactions
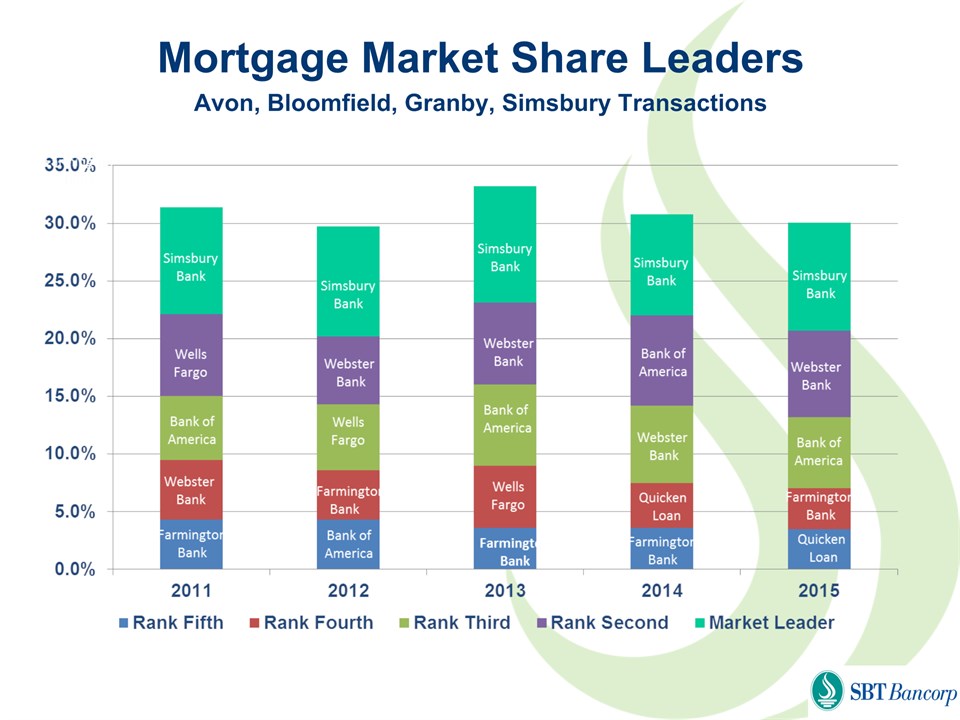
Mortgage Market Share LeadersAvon, Bloomfield, Granby, Simsbury Transactions
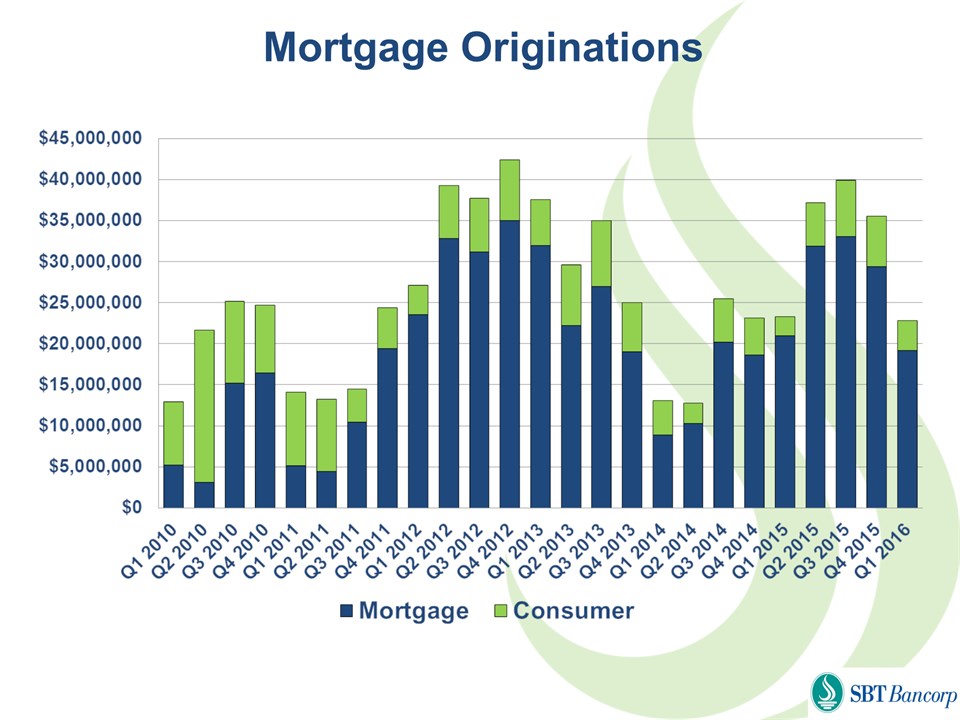
Mortgage Originations
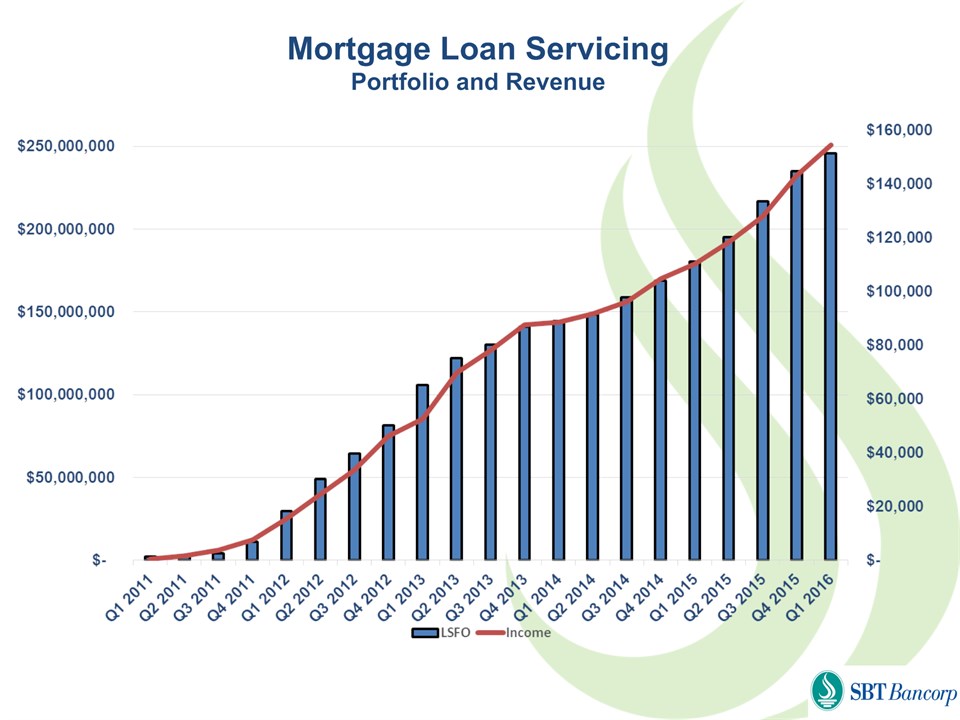
Mortgage Loan ServicingPortfolio and Revenue
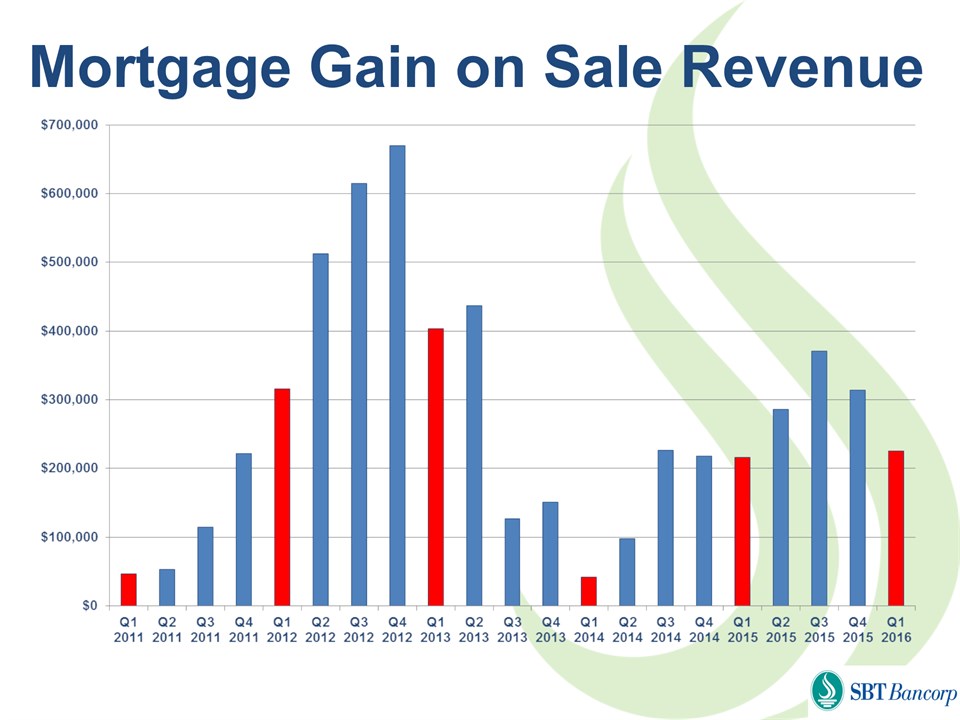
Mortgage Gain on Sale Revenue *

Retail Banking
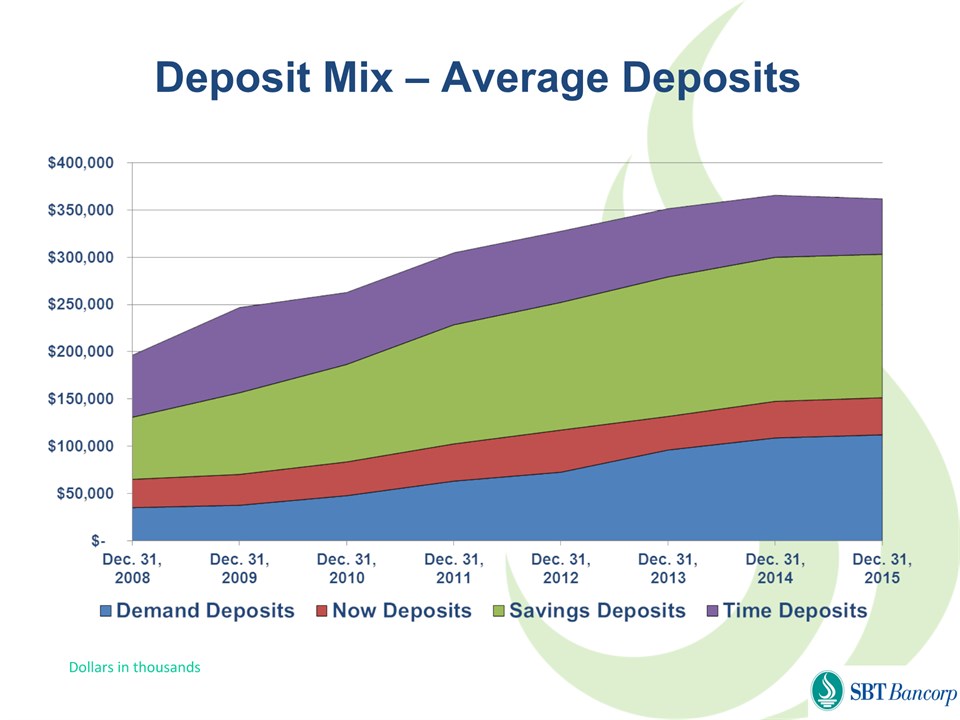
Deposit Mix – Average Deposits Dollars in thousands
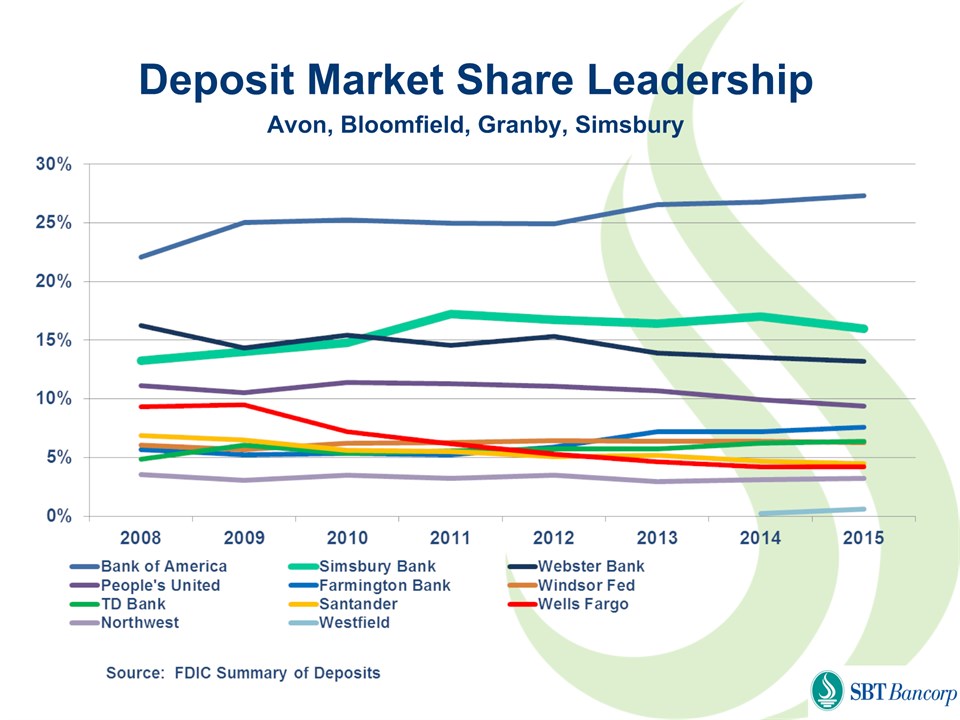
Deposit Market Share LeadershipAvon, Bloomfield, Granby, Simsbury
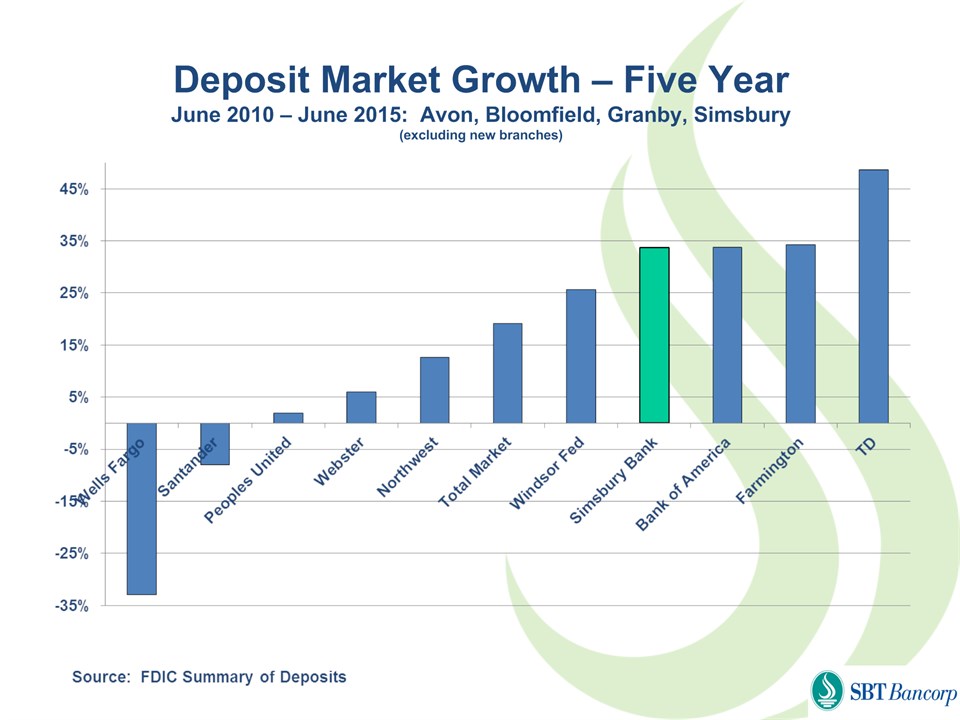
Deposit Market Growth – Five YearJune 2010 – June 2015: Avon, Bloomfield, Granby, Simsbury(excluding new branches)
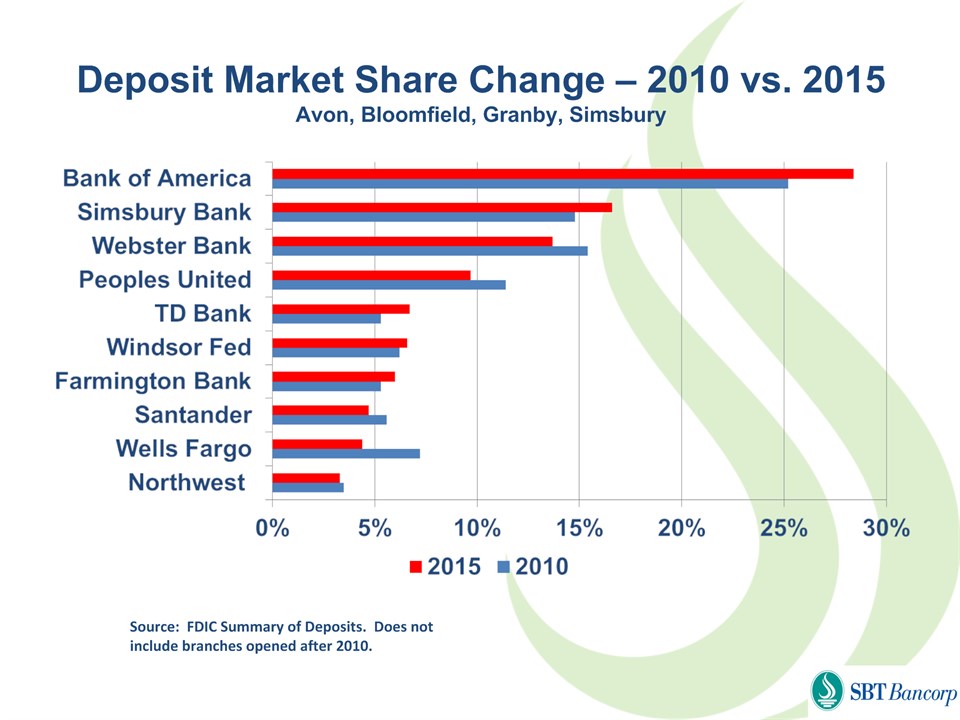
Deposit Market Share Change – 2010 vs. 2015Avon, Bloomfield, Granby, Simsbury Source: FDIC Summary of Deposits. Does not include branches opened after 2010.
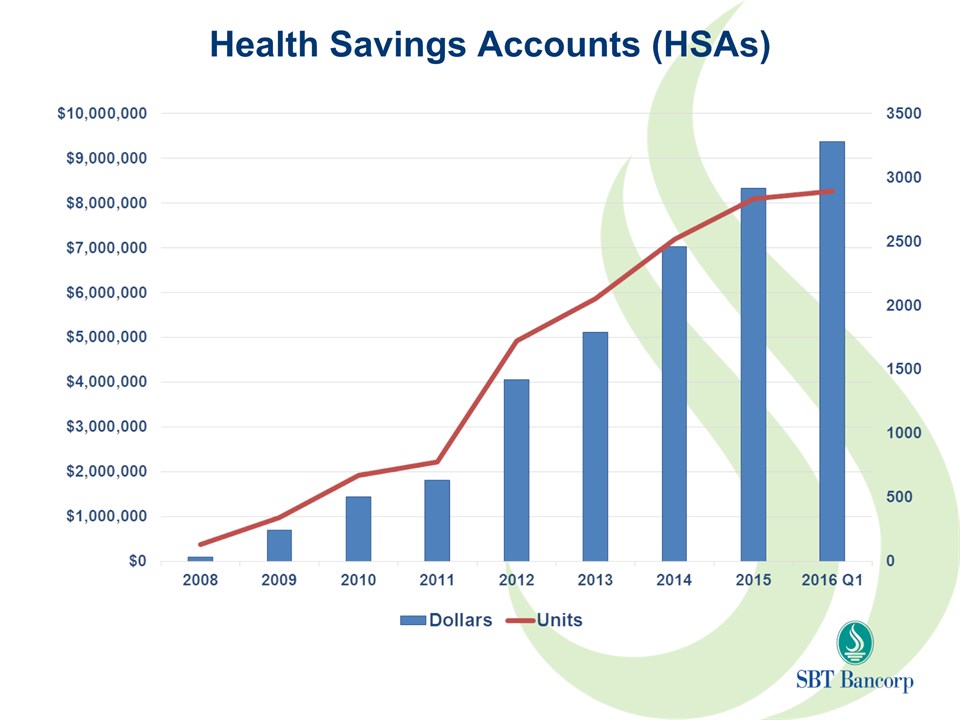
Health Savings Accounts (HSAs)

Mobile Banking
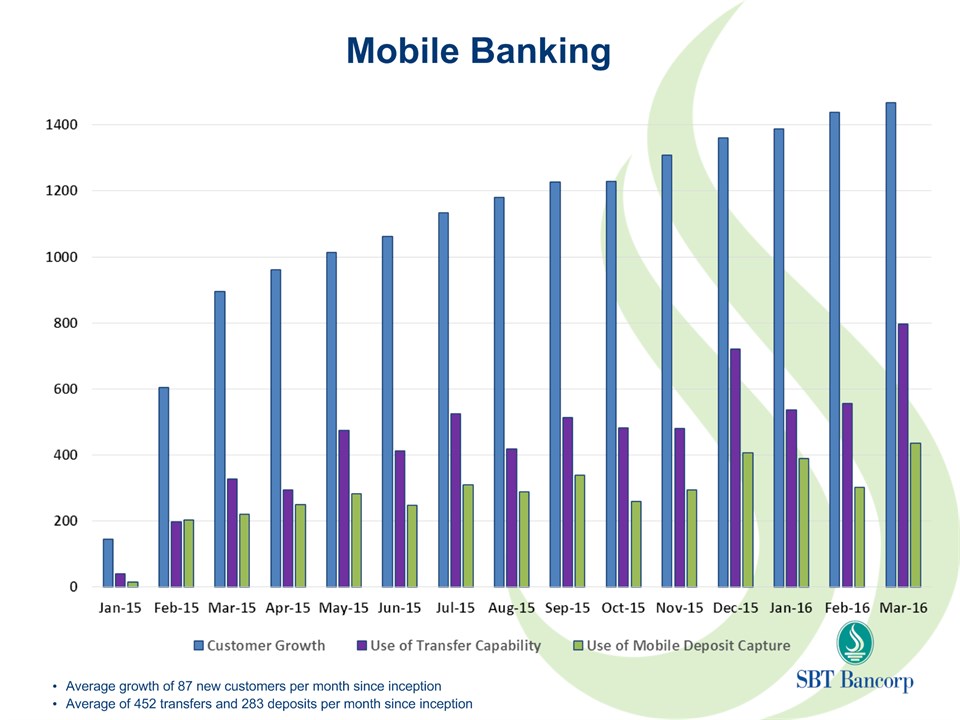
Mobile Banking Average growth of 87 new customers per month since inceptionAverage of 452 transfers and 283 deposits per month since inception
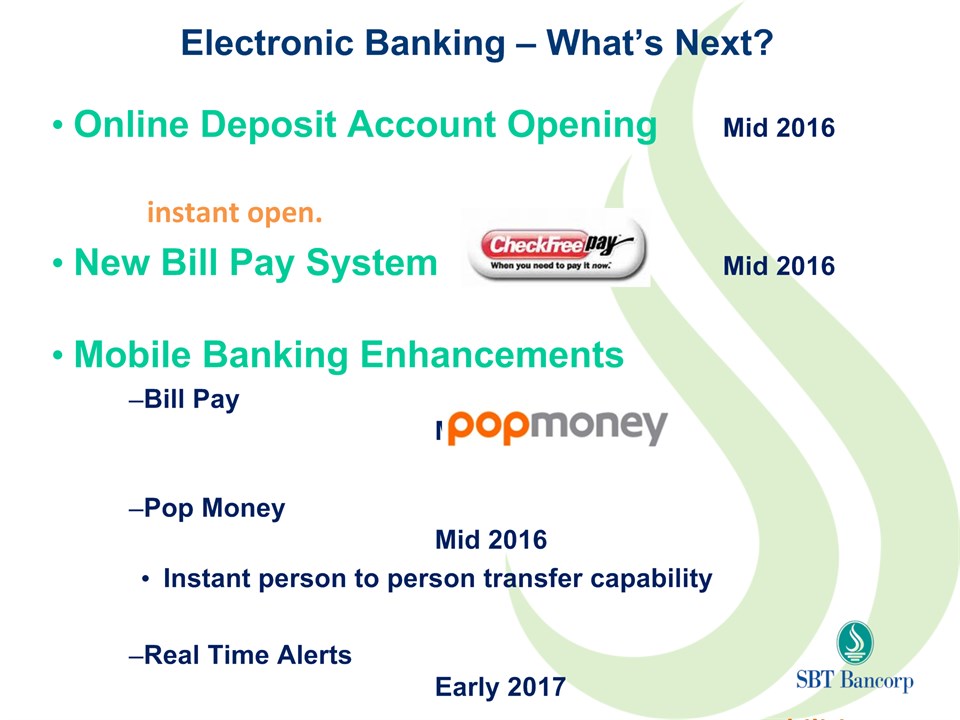
Electronic Banking – What’s Next? Online Deposit Account Opening Mid 2016 instant open.New Bill Pay System Mid 2016Mobile Banking EnhancementsBill Pay Mid 2016Pop Money Mid 2016Instant person to person transfer capabilityReal Time Alerts Early 2017 Mobiliti BusinessMobile Banking for Business Customers Early 2017

West Hartford
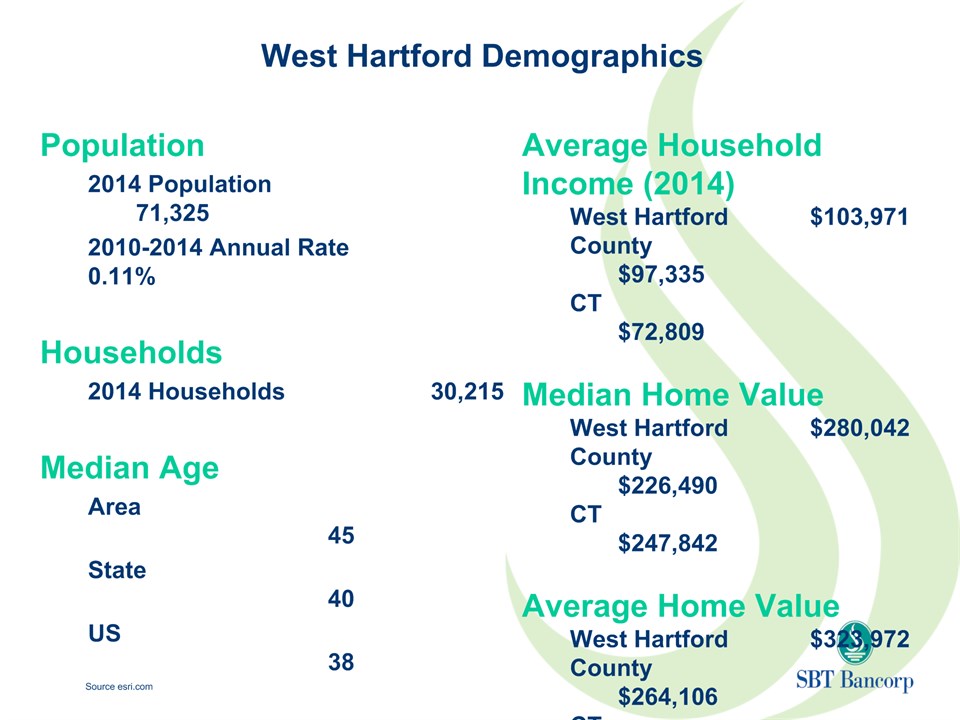
West Hartford Demographics Population2014 Population 71,3252010-2014 Annual Rate 0.11%Households2014 Households 30,215Median AgeArea 45State 40US 38 Average Household Income (2014)West Hartford $103,971County $97,335CT $72,809Median Home ValueWest Hartford $280,042County $226,490CT $247,842Average Home ValueWest Hartford $323,972County $264,106CT $326,435 Source esri.com
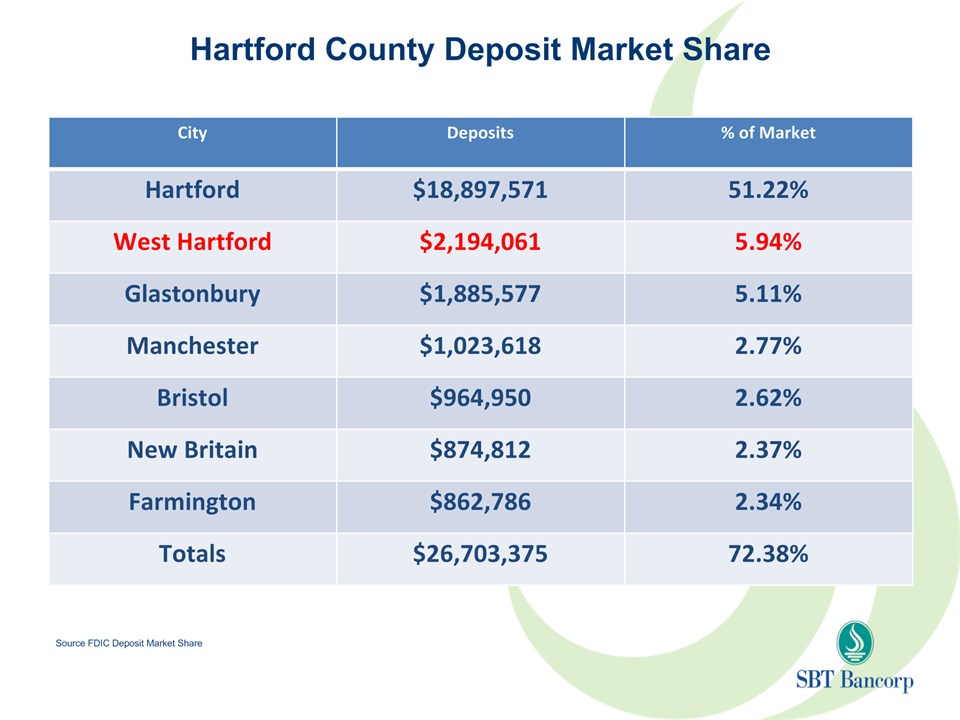
Hartford County Deposit Market Share City Deposits % of Market Hartford $18,897,571 51.22% West Hartford $2,194,061 5.94% Glastonbury $1,885,577 5.11% Manchester $1,023,618 2.77% Bristol $964,950 2.62% New Britain $874,812 2.37% Farmington $862,786 2.34% Totals $26,703,375 72.38% Source FDIC Deposit Market Share
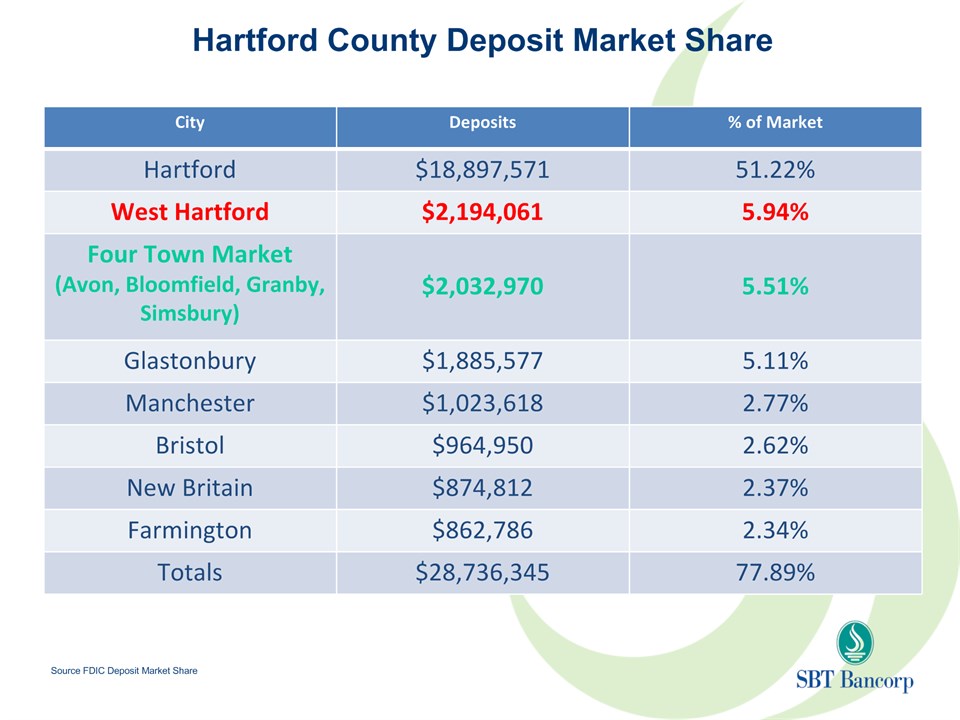
Hartford County Deposit Market Share City Deposits % of Market Hartford $18,897,571 51.22% West Hartford $2,194,061 5.94% Four Town Market (Avon, Bloomfield, Granby, Simsbury) $2,032,970 5.51% Glastonbury $1,885,577 5.11% Manchester $1,023,618 2.77% Bristol $964,950 2.62% New Britain $874,812 2.37% Farmington $862,786 2.34% Totals $28,736,345 77.89% Source FDIC Deposit Market Share
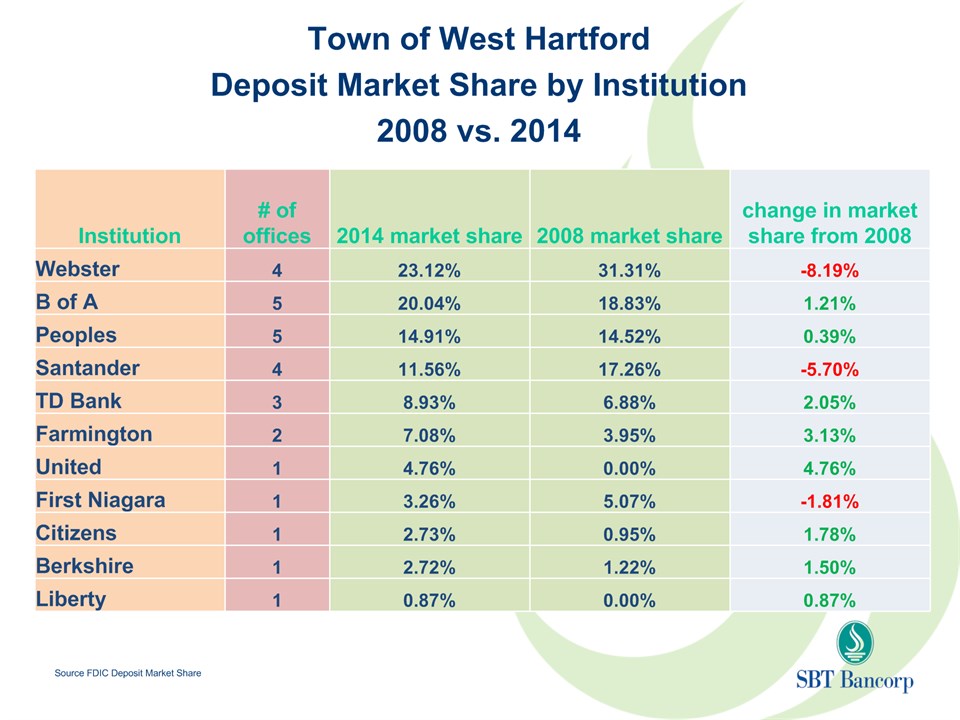
Town of West Hartford Deposit Market Share by Institution 2008 vs. 2014 Source FDIC Deposit Market Share Institution # of offices 2014 market share 2008 market share change in market share from 2008 Webster 4 23.12% 31.31% -8.19% B of A 5 20.04% 18.83% 1.21% Peoples 5 14.91% 14.52% 0.39% Santander 4 11.56% 17.26% -5.70% TD Bank 3 8.93% 6.88% 2.05% Farmington 2 7.08% 3.95% 3.13% United 1 4.76% 0.00% 4.76% First Niagara 1 3.26% 5.07% -1.81% Citizens 1 2.73% 0.95% 1.78% Berkshire 1 2.72% 1.22% 1.50% Liberty 1 0.87% 0.00% 0.87%
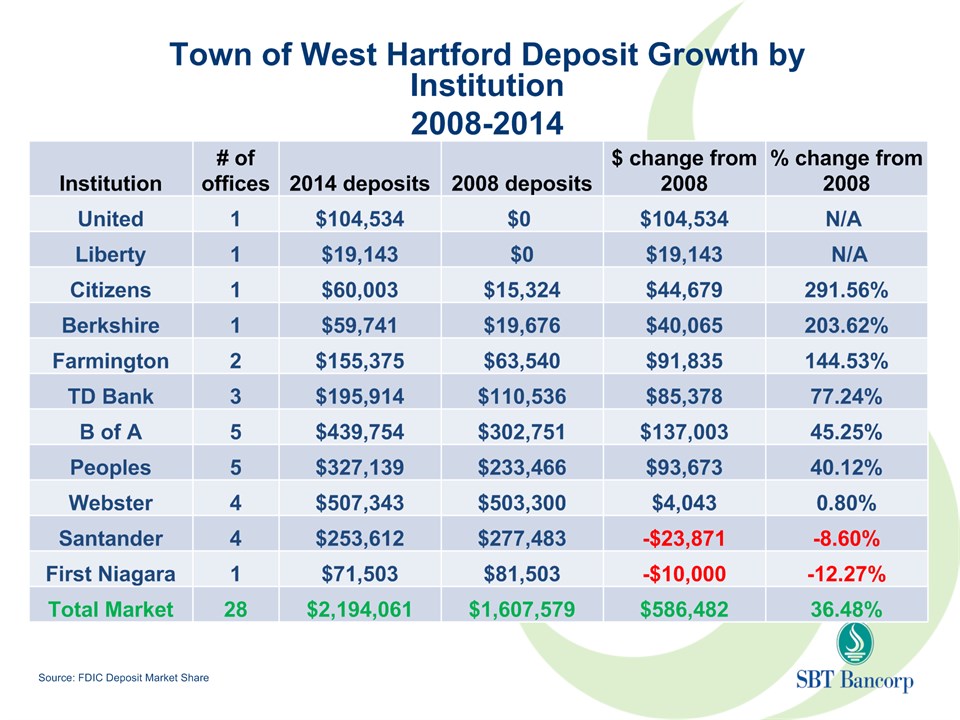
Town of West Hartford Deposit Growth by Institution2008-2014(dollars in thousands) Source: FDIC Deposit Market Share Institution # of offices 2014 deposits 2008 deposits $ change from 2008 % change from 2008 United 1 $104,534 $0 $104,534 N/A Liberty 1 $19,143 $0 $19,143 N/A Citizens 1 $60,003 $15,324 $44,679 291.56% Berkshire 1 $59,741 $19,676 $40,065 203.62% Farmington 2 $155,375 $63,540 $91,835 144.53% TD Bank 3 $195,914 $110,536 $85,378 77.24% B of A 5 $439,754 $302,751 $137,003 45.25% Peoples 5 $327,139 $233,466 $93,673 40.12% Webster 4 $507,343 $503,300 $4,043 0.80% Santander 4 $253,612 $277,483 -$23,871 -8.60% First Niagara 1 $71,503 $81,503 -$10,000 -12.27% Total Market 28 $2,194,061 $1,607,579 $586,482 36.48%
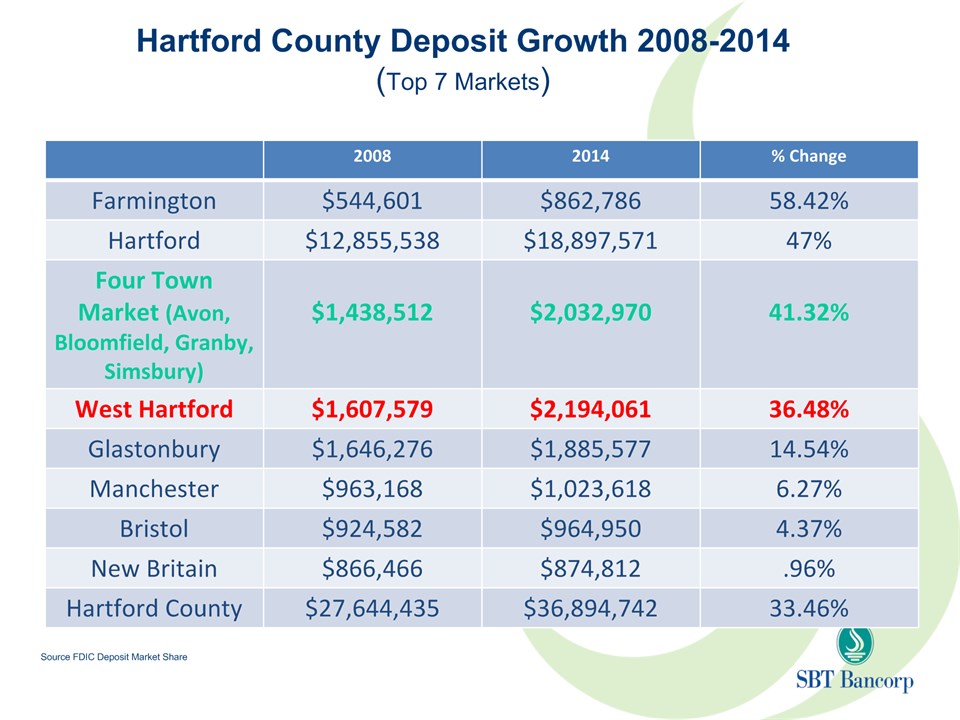
Hartford County Deposit Growth 2008-2014(Top 7 Markets) 2008 2014 % Change Farmington $544,601 $862,786 58.42% Hartford $12,855,538 $18,897,571 47% Four Town Market (Avon, Bloomfield, Granby, Simsbury) $1,438,512 $2,032,970 41.32% West Hartford $1,607,579 $2,194,061 36.48% Glastonbury $1,646,276 $1,885,577 14.54% Manchester $963,168 $1,023,618 6.27% Bristol $924,582 $964,950 4.37% New Britain $866,466 $874,812 .96% Hartford County $27,644,435 $36,894,742 33.46% Source FDIC Deposit Market Share

West Hartford Branch
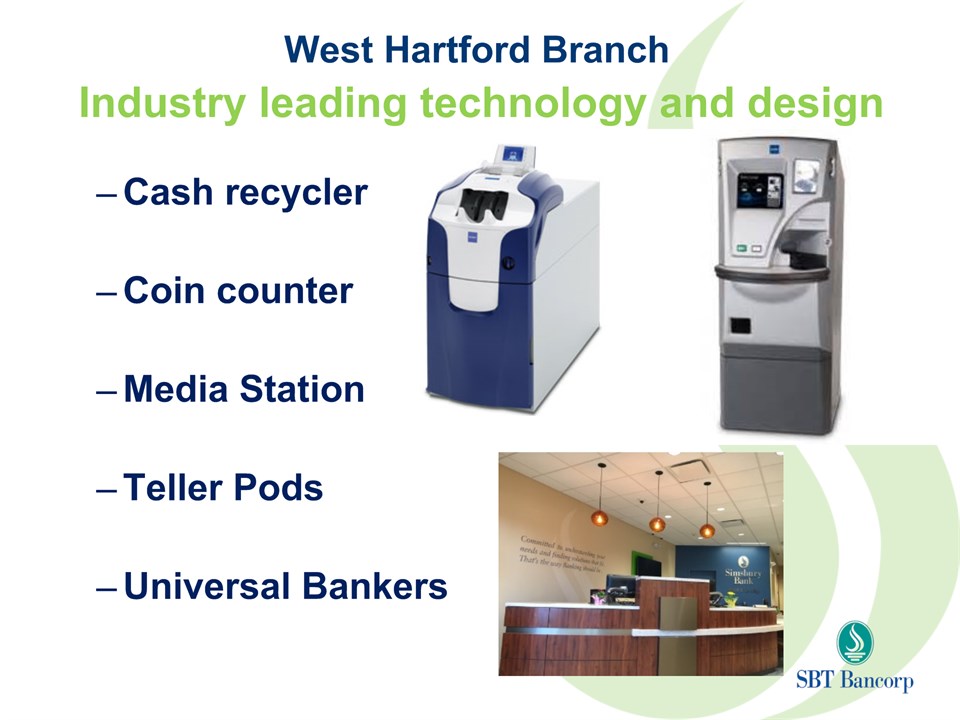
West Hartford Branch Industry leading technology and designCash recyclerCoin counterMedia StationTeller PodsUniversal Bankers

Questions & Comments
Election of DirectorsNon-binding Advisory Vote on Compensation of Named Executive OfficersRatification of Appointment of Baker, Newman, Noyes as Independent Registered Public Accounting Firm Proxy Voting Results

Thank You