Attached files
| file | filename |
|---|---|
| 8-K - 8-K - HERC HOLDINGS INC | q12016earnings8-k.htm |
| EX-99.1 - EXHIBIT 99.1 - HERC HOLDINGS INC | pressreleaseq12016.htm |

1 1Q 2016 Earnings Call May 10, 2016 8:00am ET

2 Safe Harbor Statement Certain statements made within this presentation contain forward-looking statements, within the meaning of the Private Securities Litigation Reform Act of 1995. Forward-looking statements are not guarantees of performance and by their nature are subject to inherent uncertainties. Actual results may differ materially. Any forward-looking information relayed in this presentation speaks only as of May 9, 2016, and the Company undertakes no obligation to update that information to reflect changed circumstances. Additional information concerning these statements is contained in the Company’s press release regarding its First Quarter 2016 results issued on May 9, 2016, and the Risk Factors and Forward- Looking Statements sections of the Company’s 2015 Annual Report on Form 10-K filed on February 29, 2016, and its First Quarter 2016 Quarterly Report on Form 10-Q filed on May 9, 2016. Copies of these filings are available from the SEC, the Hertz website or the Company’s Investor Relations Department. 1Q

3 Non-GAAP Measures THE FOLLOWING NON-GAAP* MEASURES WILL BE USED IN THE PRESENTATION: Adjusted corporate EBITDA Adjusted corporate EBITDA margin Adjusted pre-tax income Adjusted net income Adjusted earnings per share (Adjusted EPS) Revenue per available car day (RACD) Total RPD Net depreciation per unit per month Net corporate debt Net fleet debt Free cash flow *Definitions and reconciliations of these non-GAAP measures are provided in the Company’s first quarter 2016 press release. 1Q

4 Agenda BUSINESS OVERVIEW John Tague President & Chief Executive Officer Hertz Global Holdings, Inc. FINANCIAL RESULTS OVERVIEW Tom Kennedy Chief Financial Officer Hertz Global Holdings, Inc. HERC OVERVIEW Larry Silber President & Chief Executive Officer Hertz Equipment Rental Corporation 1Q

5 Capacity is Key Focus 1Q • Reduced U.S. fleet by 2% in 2015; guided to another step down of 2-3% for 2016 • Capacity plan based on conservative GDP projections and softening commercial business demand across all travel sectors • 1Q:16 average U.S. RAC fleet reduced by 6% YoY • Maintained tight fleet through 1Q:16, driving U.S. RAC fleet efficiency 500 bps higher to 78% • Room for further utilization improvement • RPD remained under pressure primarily due to excess industry capacity • Signs of recently improving U.S. pricing trends moving into summer peak

6 Progress Toward Full Potential 1Q Winning with technology Leading cost and quality Earnings customer preference and delivering revenue growth • Outsourced legacy IT systems • Selected CRM system – Installation expected to be complete by year end, well ahead of schedule • Expect implementation of new Fleet system 1H:17 • On track with total system transformation timing • 1Q:16 global NPS increased across all brands; Hertz brand rose to record high • Worldwide RAC unit costs* improved 5% • Approximately $70 million of incremental net cost savings in the first quarter – On track to deliver net $350M realized cost savings FY:16 • Finalized brand architecture; facility improvement plan • Continued development of new ancillary products • Stabilized and improved e-commerce performance – On target with functionality and customer interface improvement by YE:2016 • Moving to next-generation revenue management platform, on track for 3Q:16 launch … Creates Leverage as Pricing Recovers * Unit costs are defined as direct operating (DOE) and selling, general & administrative (SG&A) costs divided by transaction days

7 TOM KENNEDY CHIEF FINANCIAL OFFICER Hertz Global Holdings, Inc. Quarterly Overview

8 1Q:16 Progress Toward RAC Full Potential 1Q Global fleet capacity reduced by 4% Worldwide RAC fleet efficiency increased 400 bps YoY Global direct operating/SG&A expense per transaction day reduced by 5% Outsourced legacy IT systems; New CRM system installation ahead of schedule $2.3B of liquidity; net leverage ratio reduced to 3.6x Cost savings of ~$70M toward $350M annual goal; incremental to $230M realized in 2015 HERC separation on track for mid-year completion

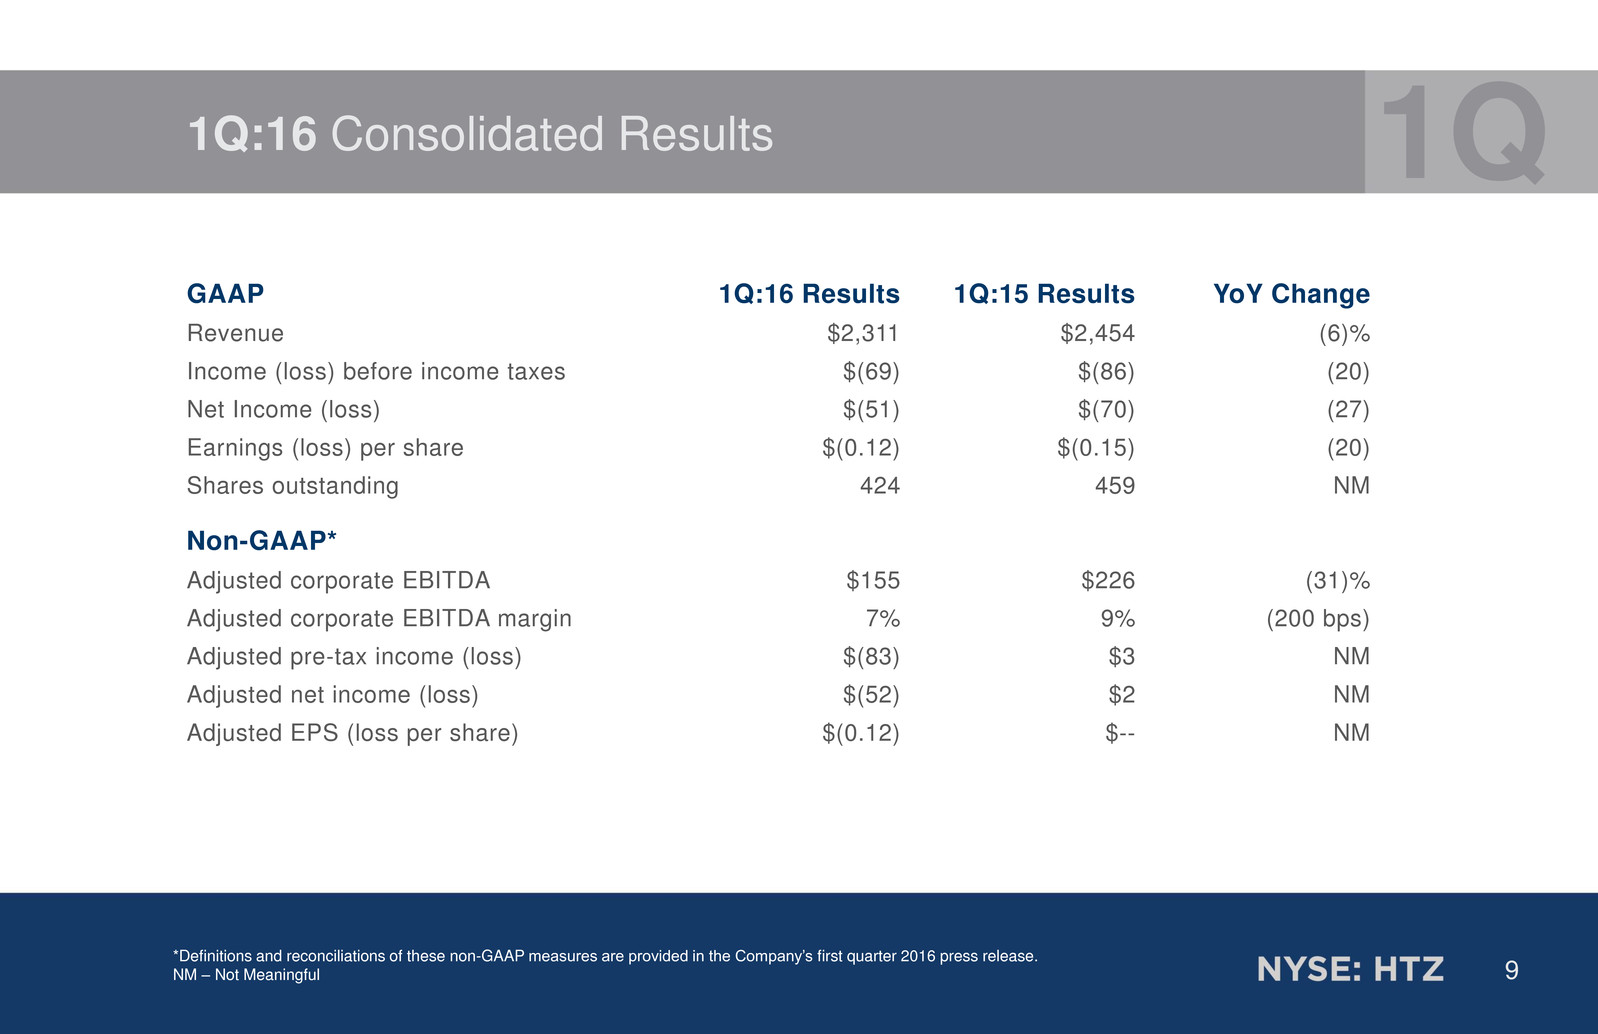
9 1Q:16 Consolidated Results *Definitions and reconciliations of these non-GAAP measures are provided in the Company’s first quarter 2016 press release. NM – Not Meaningful 1Q GAAP 1Q:16 Results 1Q:15 Results YoY Change Revenue $2,311 $2,454 (6)% Income (loss) before income taxes $(69) $(86) (20) Net Income (loss) $(51) $(70) (27) Earnings (loss) per share $(0.12) $(0.15) (20) Shares outstanding 424 459 NM Non-GAAP* Adjusted corporate EBITDA $155 $226 (31)% Adjusted corporate EBITDA margin 7% 9% (200 bps) Adjusted pre-tax income (loss) $(83) $3 NM Adjusted net income (loss) $(52) $2 NM Adjusted EPS (loss per share) $(0.12) $-- NM

10 US RAC 1Q:16 Revenue by Location Type Excludes Donlen 1Q:16 Revenue By Geography Excludes Donlen 76%24% 74% 26% Worldwide RAC Revenue Overview Int’l RAC 1Q:16 Revenue by Location Type Excludes Donlen 56% 44% US RAC1 1Q:16 Revenue by Customer Type Excludes Donlen 64% 36% Leisure Commercial Int’l RAC 1Q:16 Revenue by Customer Type Excludes Donlen 48%52% LeisureCommercial 1Q 1 Excludes ancillary retail car-sales revenue

11 Worldwide RAC Cost Initiatives Ramp up Through Year Consolidated Global RAC Cost Savings • FY:16 Target $350M realized savings – 1Q:16 realized savings of ~$70M • FY:15 realized $230M of savings Corporate/ Operations Overhead Fleet Management Sales and Marketing Global RAC Cost Savings • 2016 savings more heavily weighted to 2H:16 • 2015 savings cadence 1H = 35%; 2H = 65% 1Q Unit Cost Metrics Reflect Cost Management Progress • Excludes affects of revenue change • DOE & SG&A per transaction day declined 5% YoY • DOE & SG&A per transaction declined 3% YoY

12 1Q:16 U.S. Rental Car Total Revenue Note: Total RPD calculated using Total Revenue less ancillary retail car sales revenue divided by transaction days 1 The alignment of methodologies beginning in 3Q:15 recognizes a greater volume of transaction days on Dollar Thrifty as compar ed to its previous practices; estimated impact of approximately 1% to transaction days prospectively, relative to the historic calculat ion through 3Q:16 (8.0)% Total Revenue 1Q 10.0% 2.2% • Total Revenue Per Day: - RPD decrease primarily due to decline in industry published pricing and transaction days methodology adjustment for Dollar and Thrifty brands • Also, increase in proportion of small cars rented, lower fuel- related ancillary revenue, unfavorable customer segment mix • Total Transaction Days: - Off Airport volume flat YoY on 2Q:15 store closures and tightened debit card acceptance policies; same store volume increased YoY - Airport leisure volume growth partially offset by lower business demand, primarily driven by weakness in overall business travel and due to focus on margin discipline • Conversion from Dollar Thrifty transaction day calculation to Hertz methodology1 - No impact to total revenue - ~120 bps positive impact to transaction days; ~120 bps negative impact to Total RPD Volume Total RPD

13 Note: Total RPD calculated using Total Revenue less ancillary retail car sales revenue 1 RACD calculated as Total Revenue / number of days in period X average total fleet size; captures the combined result of both revenue management and fleet management in one measurement Higher Fleet Efficiency Offset by Lower RPD U.S. RAC Revenue per Available Car Day (RACD1) 1Q -4.7% -6.0% 1.0% 0.3% -3.3% 1Q 2Q 3Q 4Q U.S. RAC RACD 2015 YoY 73% 78% 1Q:15 1Q:16 U.S. RAC Fleet Efficiency • Better alignment of rental volume with available fleet supply • Optimized fleet rotation, time, sales distribution • Improved out-of-service levels 1Q:16 Fleet Efficiency +500 bps 2% 3% -3% -5% -6% 1Q:15 2Q:15 3Q:15 4Q:15 1Q:16 U.S. RAC Avg. Fleet Capacity YoY2 • Average fleet units 6% lower YoY on 2% volume growth 2 U.S. RAC average fleet used to calculate fleet efficiency

14 U.S. RAC Fleet Management 1Q • 1Q:16 monthly depreciation per unit $303, a 6% increase primarily due to lower residual values, higher program car costs and shorter hold period for certain vehicles • Improved processes increased cars available-for-rent as a % of total fleet by 34% YoY • Successful use of higher return remarketing channels • FY:16E monthly depreciation per unit unchanged at $290-$300 - FY:16E (2.5)% in residual values 1Q:16 Unit Sales Mix Wholesale Auction 34% Alternative Channels 66% Wholesale Auction 38% Alternative Channels 62% 1Q:15 Unit Sales Mix U.S. RAC Used Car Sales Channels

15 1Q:16 International Rental Car 1Q • 1Q:16 Revenue increased 6% YoY, excluding FX - Volume 3% higher primarily due to strength in APAC countries as well as Southern Europe - Total RPD 2% higher, in constant currency, benefitting from higher yielding inbound business • Revenue per available car day increased 1% YoY in constant currency • Fleet efficiency stable YoY at 75% • Customer service scores continue to improve • Net monthly depreciation per unit decreased 7% in constant currency due to improvements in fleet procurement, fleet mix and increased use of alternative disposition channels • Excluding impact of favorable non-recurring item in Q1:15, adjusted Corporate EBITDA improved $11M YoY

16 HERC OVERVIEW LARRY SILBER PRESIDENT & CHIEF EXECUTIVE OFFICER Hertz Equipment Rental Corporation

17 1Q:16: Focused on Expanding Revenue and Operational Efficiencies Revenue Growth and Expansion1 – Q1:16 versus Q1:15 • Total revenues excluding upstream oil & gas branch markets increased 12% • Worldwide pricing was flat, but pricing excluding oil & gas branch markets was up 1% • New account revenue increased approximately 20% • New customer accounts increased 41% • Worldwide volume increased 1% Operational Improvements • Improved vendor management and fleet available for rent • In-house equipment maintenance improved efficiency and reduced costs in the branches • Continued to reduce costs and expenditures in upstream oil & gas markets • Realigned fleet mix with equipment to support Specialty Solutions and ProContractor business Upstream Oil & Gas 18% Non-Upstream Oil & Gas 82% % Contribution to Total Revenue1 1 On a constant currency basis as of December 31, 2015 excluding the results of operations in France and Spain sold in October 2015.

18 Market Leader with Significant Scale and Broad Footprint in North America 1 IHS Global Insight (April 2016) 2 International operations are located in the United Kingdom, China, Saudi Arabia and Qatar. 18 >9% 6-9% 3-6% 0-3% <0% Industry Rental Growth 1 4-Year CAGR Herc Rentals Location

19 $3.5 Billion in Fleet at an Average Age of 47 Months Aerial 27% Earth Moving 19% Material Handling 17% Truck 11% Electrical 9% Other 17% Average fleet original equipment cost (OEC). 1Q Capital Expenditures • Reported a positive $6 million net fleet capex Fleet Mix by OEC

20 Q2 2015 Current Improve N.A. Vendor Management and Fleet Availability Driving operational gains through buying efficiency and increased availability Consolidate Brands and OEMs Substantially Increased Fleet Available to Rent 19% 18% 15% 13% 10% 2013 2014 2015 1Q2016 Target ~ 40% # of Suppliers Fleet Unavailable for Rent (FUR) Improving Vendor Management and Fleet Availability *Data is based on North America

21 Adjusted Corporate EBITDA YOY Growth, Excl. Upstream Oil & Gas, Improved Each Quarter New initiatives began to take hold in second half of 2015 Adj. Corp. EBITDA (YOY % Δ)* 1Q-15 2Q-15 3Q-15 4Q-15 Q1-16 Excl. upstream oil & gas 7% 7% 11% 21% 14% Total (7)% (8)% (3)% (0.2)% (4)% *Data is based on constant FX rates as of December 31, 2015 and excludes France and Spain operations sold in October 2015

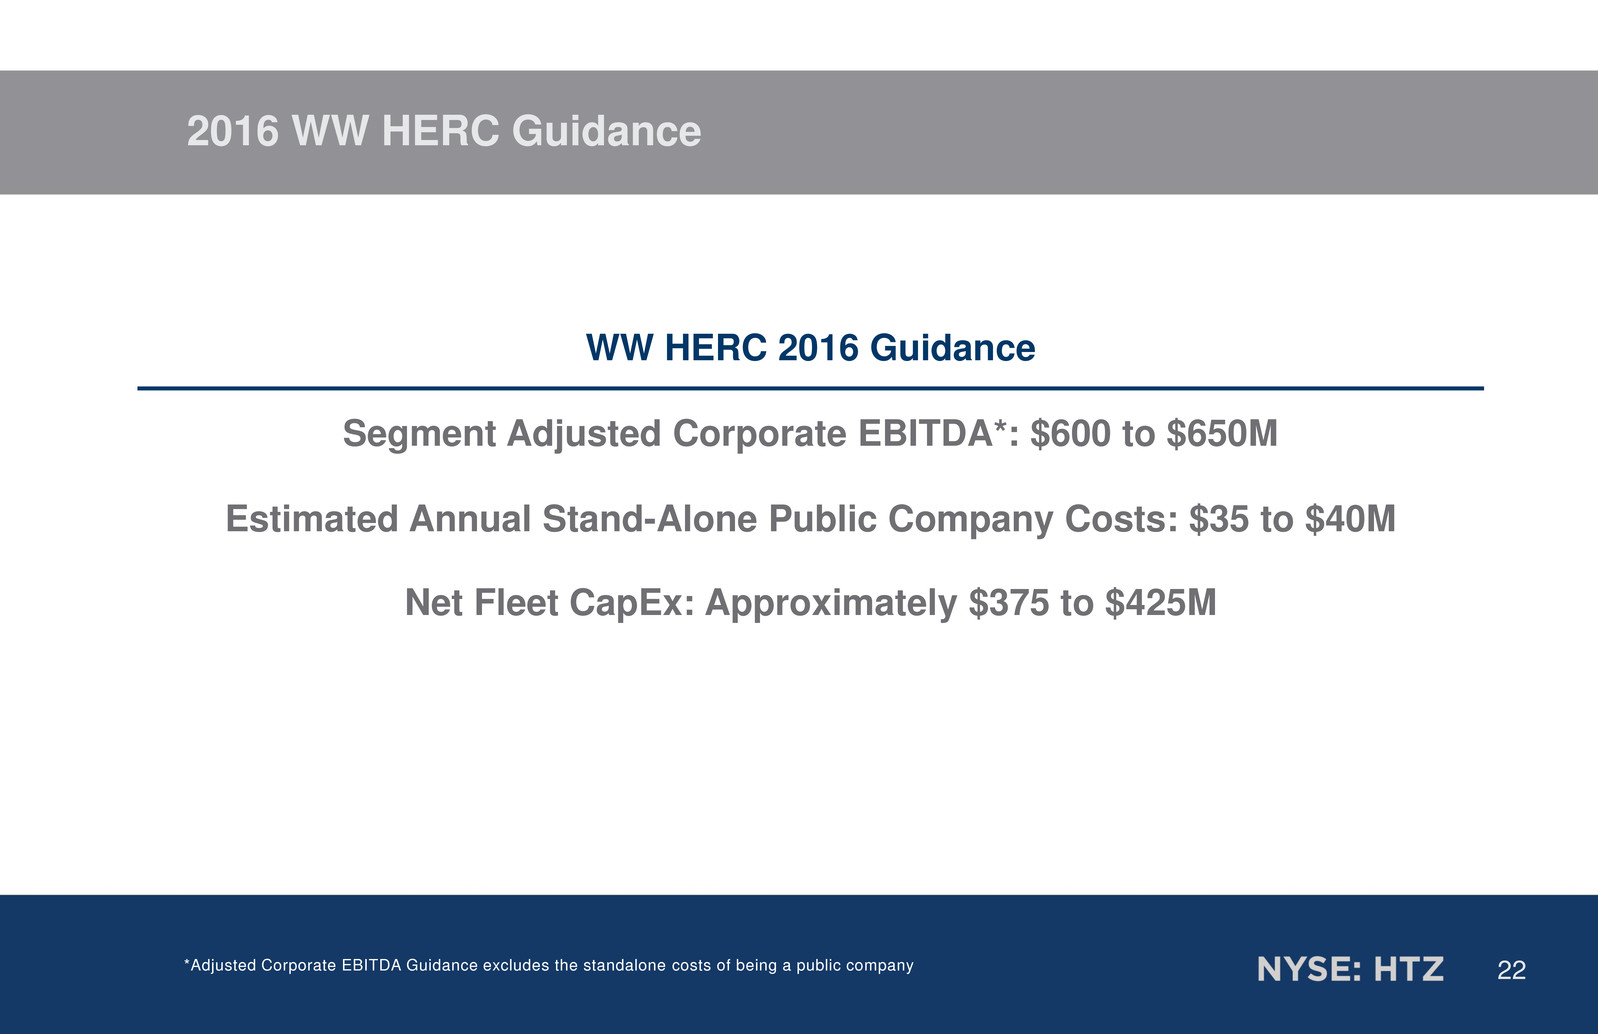
22 2016 WW HERC Guidance WW HERC 2016 Guidance Segment Adjusted Corporate EBITDA*: $600 to $650M Estimated Annual Stand-Alone Public Company Costs: $35 to $40M Net Fleet CapEx: Approximately $375 to $425M *Adjusted Corporate EBITDA Guidance excludes the standalone costs of being a public company

23 • Form 10 Update - Initial Form 10 filed 12/21/15 - Amendment #1 filed 2/4/16 - Amendment #2 filed 4/18/2016: included FY:15 results • Operational Readiness Update - Senior leadership team in place - Prospective Board of Directors recruiting on track - Rating agency meetings completed - Capital market discussion underway • Timing Update • Targeting mid-year 2016 completion RAC and HERC Remain On Track for mid-2016 Separation

24 Unique Opportunity to Build Value Strong brand recognition and reputation – 50 + years Strategically positioned to generate above market growth Strong asset base including $3.5 billion of OEC Industry savvy and experienced leadership team Commitment to disciplined capital management Significant opportunity for operational and financial improvement Attractive long term industry fundamentals

25 Our New Look and Brand

26 CASH FLOW / BALANCE SHEET OVERVIEW TOM KENNEDY CHIEF FINANCIAL OFFICER Hertz Global Holdings, Inc.

27 Free Cash Flow ($ in millions) 1Q16 1Q15 GAAP Pretax Income (loss) $(69) $(86) PP&E (non fleet) depr. exp. + amortization exp. 77 86 Amortization of debt items 15 16 Cash Taxes, net of refunds (16) (4) Net Working Capital/Other (121) 81 Operating Cash Flow excl. fleet depr. add-back $(114) $93 RAC Fleet Growth (net capex + depr. exp. & net fleet financing) 196 191 HERC Fleet Growth (net capex + depr. exp.) 96 18 All Other Operations, Rental Fleet Growth (17) (38) PP&E Net Capital Expenditures (31) (75) Net Investment $244 $96 FREE CASH FLOW $130 $189

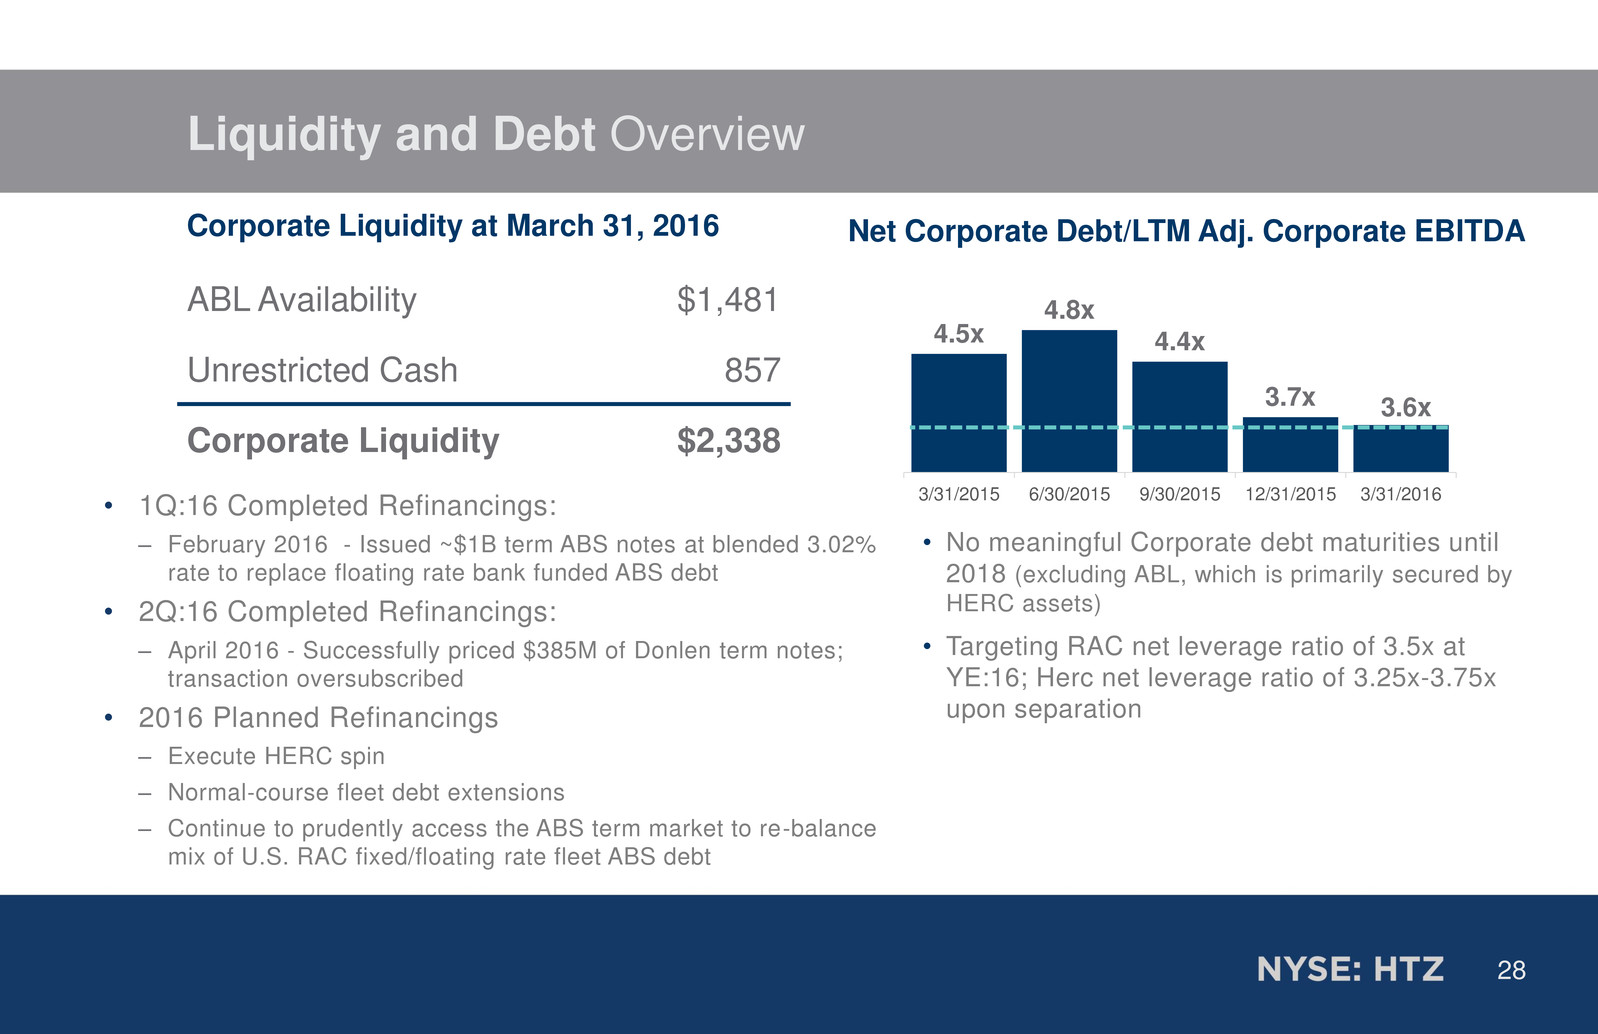
28 • No meaningful Corporate debt maturities until 2018 (excluding ABL, which is primarily secured by HERC assets) • Targeting RAC net leverage ratio of 3.5x at YE:16; Herc net leverage ratio of 3.25x-3.75x upon separation Liquidity and Debt Overview Corporate Liquidity at March 31, 2016 ABL Availability $1,481 Unrestricted Cash 857 Corporate Liquidity $2,338 4.5x 4.8x 4.4x 3.7x 3.6x 3/31/2015 6/30/2015 9/30/2015 12/31/2015 3/31/2016 Net Corporate Debt/LTM Adj. Corporate EBITDA • 1Q:16 Completed Refinancings: – February 2016 - Issued ~$1B term ABS notes at blended 3.02% rate to replace floating rate bank funded ABS debt • 2Q:16 Completed Refinancings: – April 2016 - Successfully priced $385M of Donlen term notes; transaction oversubscribed • 2016 Planned Refinancings – Execute HERC spin – Normal-course fleet debt extensions – Continue to prudently access the ABS term market to re-balance mix of U.S. RAC fixed/floating rate fleet ABS debt

29 OUTLOOK

30 FY:2016 Financial Guidance FY:2016 assumptions include: • U.S. RAC residual decline of ~2.5% • $350M incremental RAC cost savings • HERC net non-fleet capex of ~$50M – Included in Consolidated guidance • HERC net fleet capex of $375M-$425M • Consolidated 37% effective tax rate • 424M shares outstanding FY:2016 Guidance Adj. Corporate EBITDA Consolidated HGH $1,600M - $1,700M Adj. Corporate EBITDA W.W. HERC $600M - $650M Consolidated net non-fleet capex $200M – $225M Consolidated corporate interest expense $330M – $345M Consolidated cash taxes $125M – $150M Consolidated Free Cash Flow $400M – $500M U.S. RAC net monthly depreciation per unit $290 - $300 U.S. RAC fleet capacity growth (2.0)% to (3.0)% U.S. RAC revenue growth --% to (1.5)% Adj. EPS $0.95-$1.10

31 Q&A
