Attached files
| file | filename |
|---|---|
| 8-K - FORM 8K FBC - FIRST BUSEY CORP /NV/ | form8k_fbc.htm |


2016 :
•Balance Sheet Strength
•Maintain Organic Growth
•Entry Into St. Louis - Pulaski
•Build Out Indianapolis
•Continue Culture Enhancements

Busey Summary
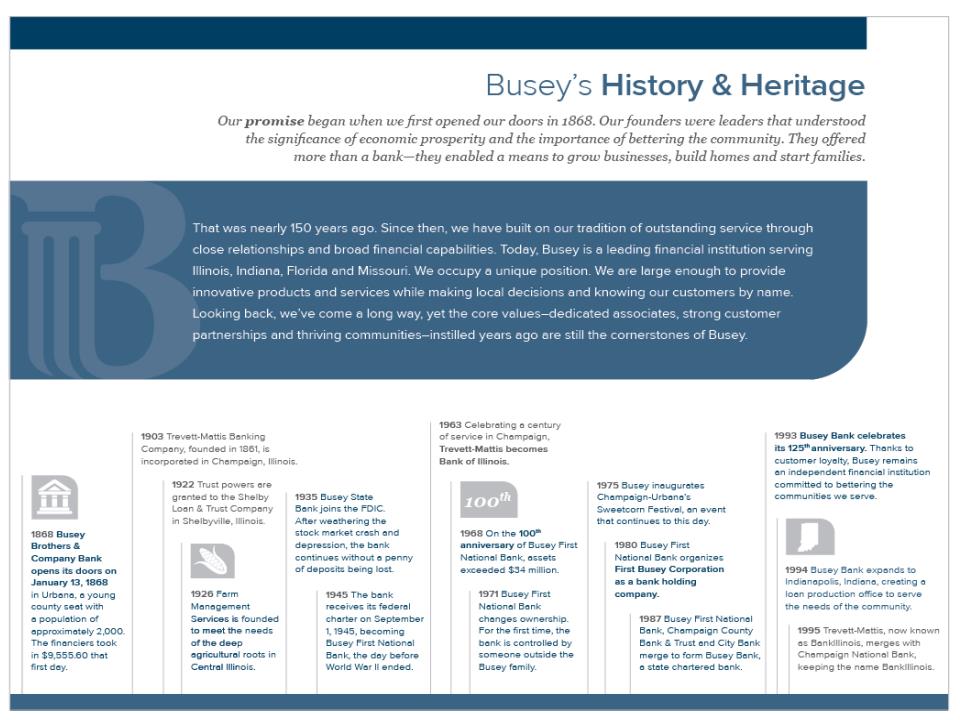
- Founded in 1868 - Same Name, Same Charter
- Built on Numerous Acquisitions in Central Illinois
- Two Banks - Busey Bank and Pulaski Bank
- Busey Bank - $3.9 Billion
- 28 Illinois Branches, 1 Indianapolis, 6 Southwest Florida
- Pulaski Bank - $1.6 Billion
- Acquired April 30, 2016
- 13 Branches in St. Louis MSA
- Wealth Management - $5.0 Billion Assets Under Care
- Busey Wealth Management - Illinois Based Wealth Management
- Trevett Capital Partners - Boutique High Net Worth
- Busey Ag Management - 90,000+ Acres
- FirsTech - A Remittance Processing Company
- Shortening and Automating Cash Collections for Large Companies
- Delivers Customized Solutions to the Middle Market

Balance Sheet Strength
- Balance Sheet Strength, Profitability and Growth . . . In that Order
- Asset Quality Solid - Q1 2016
- ALL to Loans - 1.75%
- ALL to NPLs - 253.5%
- Classified Assets Ratio - 15.5%
- NPL Largely Consist of Three Credits
- Strong Capital Base - Q1 2016
- Redeemed SBLF Q4 2015 - $72.3 million
- 9+% Tangible Common Equity, Ample Room for Growth
- Strong Dividend Yield at 3.2% based upon $21.00 BUSE
54%
5Y Total Return of
BUSE1
BUSE1
1 SNL May 6, 2016
70%
3Y Total Return of
BUSE1
BUSE1
Balance Sheet Strength
- Balance Sheet Strength, Profitability and Growth . . . In that Order
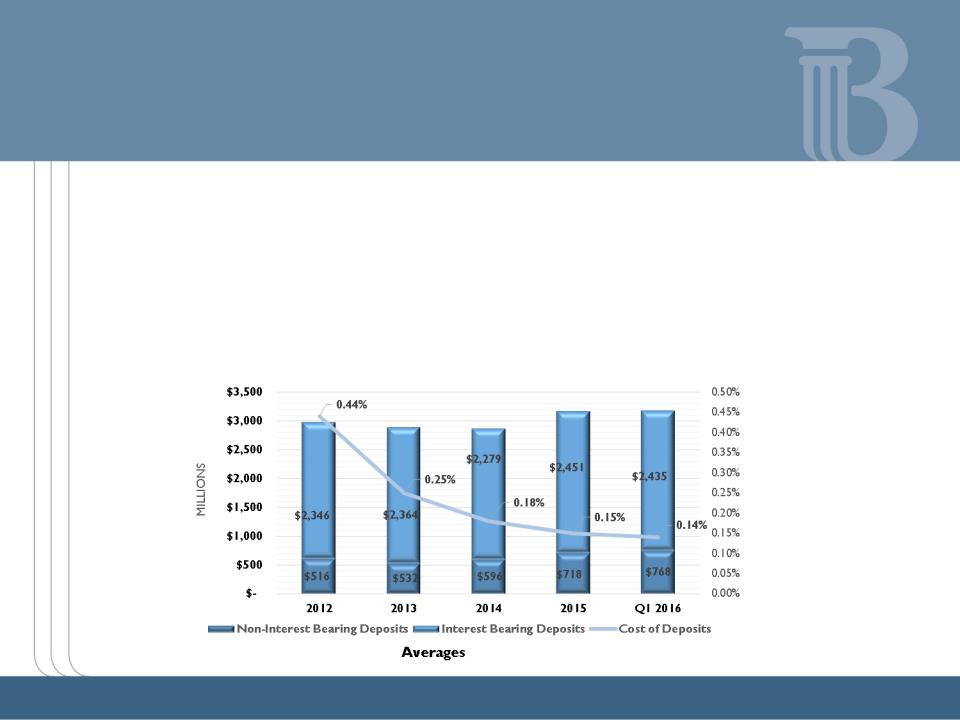
- Solid Core Funding Base
-Q1 Cost of Deposits - 14 bps
-24% Non-interest Bearing Deposits

Loan Growth
- Strategic Investment in 2011 and 2012 into Commercial Organic Growth
- Compounded Annual Growth Rate YE 2011 to YE 2015 - 5.6%
- Ex-Q1 2015 Herget Acquisition
- Herget All Cash Acquisition, Contributed ~$90 million in Loans
- Seasonal Q1 Annual Decline - Typically 1.5%-2.0% Loan Balances
- Q1 2016 Down 2% vs. December 31, 2015

Non-Interest Income
- 36.1% of Total Revenue is Non-Interest Income1
- 14.2% Revenues from Wealth Management
- 6.7% Revenues from FirsTech
- Busey Wealth Management2
- $23.9 Million Revenue
- $7.9 Million Pre-tax Margin
- FirsTech2
- $11.4 Million Revenue3
- $2.9 Million Pre-tax Margin
1 - At March 31, 2016, Excludes Security Gains/ Losses
2 - Graph and Data - Full year 2015

5 Year Earnings Growth

Expands into Saint Louis

Transaction Rationale
Strategically
Compelling
Compelling
Financially
Attractive
Attractive
Low Risk
q Comprehensive due diligence process and thorough loan review completed
q PULB has an experienced and deep management team to assist in post merger operations,
integration, and market expansion
integration, and market expansion
q PULB has a similar culture which will facilitate a successful integration process
q Creates a $5.5 billion asset Midwest community bank with greater scale, operating
efficiency, along with geographic and balance sheet diversification
efficiency, along with geographic and balance sheet diversification
q Franchise expansion into attractive St. Louis market
q Significant transaction with top-tier institution
q Provides strong St. Louis commercial banking platform with cross-sale opportunities for
BUSE wealth management and complimentary mortgage strategies
BUSE wealth management and complimentary mortgage strategies
q Clayton, MO is hub for FirsTech, BUSE’s payment processing subsidiary - natural market
expansion because of BUSE’s presence in the St. Louis market
expansion because of BUSE’s presence in the St. Louis market
q Significant accretion to core earnings
q Tangible book value dilution earn back of approximately 3 years
q Robust internal rate of return
q Pricing multiples in line with other recent transactions for banks similar in size and
geography to PULB
geography to PULB
q Leverages excess capital of BUSE

Transaction Pro Forma Financial Implications
|
Earnings Accretion 1st Full Year of Operations
|
10% - 12%
|
|
Tangible Book Value Dilution at Close
|
3.8%
|
|
Tangible Book Value Per Share Earn Back at Close
|
~3 years
|
|
8.2%
|
|
|
Pro Forma Tier 1 Common Ratio
|
10.5%
|
|
Pro Forma Total Risk Based Capital Ratio
|
13.3%
|
Pro Forma TCE Ratio
Earnings, Tangible Book Value and Capital Ratios

Transaction Meets All M&A Disciplines
|
Key Attributes
|
PULB
|
Rationale1
|
|
Franchise:
|
||
|
q High-density metro market with growth
opportunities in commercial & wealth
management |
Significant entry in the attractive St. Louis
market, Midwest’s 4th largest MSA |
|
|
q Mature franchise with an attractive deposit base
|
ü
|
More than $1.1 billion deposits, 79% core,
overall cost of deposits 39 bps, 93 year old institution |
|
q Strong commercial lending platform
|
ü
|
43% of PULB loans in C&I and Comm. RE, significant
cross selling opportunities for BUSE wealth management product line |
|
q Complimentary mortgage strategies
|
ü
|
Ability to enhance value of PULB’s strong
mortgage originations through cross selling BUSE retail and wealth management products |
|
q Complementary culture
|
ü
|
Similar culture, efficient transition
|
|
q Attractive TBV earn back period
|
Approximately 3 years
|
|
Key Attributes
PULB
Rationale1
Franchise:
ü
q Complementary culture
ü
Similar culture, efficient transition
Financial:
q Accretive to EPS
ü
Immediately accretive to earnings excluding transaction costs,
first full year accretion approximately 10% - 12%
first full year accretion approximately 10% - 12%
q Attractive TBV earn back period
ü
Approximately 3 years
q Conservative credit marks and reasonable cost
saves
saves
ü
2.3% of total loans and over 100% of NPAs; 25%
cost savings
cost savings
1 As of September 30, 2015

Indianapolis
14
- Presence in Indianapolis for Over 20 Years
- $210MM + In Loans
- $40MM Deposits
- Hired Experienced Market President April 2016
- First Full Service Location January 2017

Continued Culture Enhancements
- Associates
- Full Training Program for Vast Majority of Associates
- Wellness Program with over 75% Adoption
- 4.15 of 5 Associate Engagement Score (Gallup), Up 0.3% from Prior Year
- Customers
- Net Promoter Score - Widely Used Customer Promoter Score
- Results and Trends are Positive
- Internal Service Scores
- Communities
- Financial - $1MM + by Busey and Associates
- Human - 13,000 + Hours by 700+ Associates
- Social - Leaders at the Table