Attached files
| file | filename |
|---|---|
| EX-99.1 - EX-99.1 - Ares Management Corp | a16-10519_1ex99d1.htm |
| 8-K - 8-K - Ares Management Corp | a16-10519_18k.htm |
First Quarter 2016 Earnings Presentation Exhibit 99.2
Important Notice This presentation contains “forward looking statements” within the meaning of Section 21E of the Securities Exchange Act of 1934, as amended, that are subject to risks and uncertainties. Actual outcomes and results could differ materially from those suggested by this presentation due to the impact of many factors beyond the control of Ares Management, L.P. (“Ares”), including those listed in the “Risk Factors” section of our filings with the Securities and Exchange Commission (“SEC”). Any such forward-looking statements are made pursuant to the safe harbor provisions available under applicable securities laws and Ares assumes no obligation to update or revise any such forward-looking statements. Certain information discussed in this presentation was derived from third party sources and has not been independently verified and, accordingly, Ares makes no representation or warranty in respect of this information. The following slides contain summaries of certain financial and statistical information about Ares. The information contained in this presentation is summary information that is intended to be considered in the context of Ares’ SEC filings and other public announcements that Ares may make, by press release or otherwise, from time to time. Ares undertakes no duty or obligation to publicly update or revise the forward-looking statements or other information contained in this presentation. In addition, this presentation contains information about Ares, its affiliated funds and certain of their respective personnel and affiliates, and their respective historical performance. You should not view information related to the past performance of Ares and its affiliated funds, as indicative of future results. Certain information set forth herein includes estimates and targets and involves significant elements of subjective judgment and analysis. Further, such information, unless otherwise stated, is before giving effect to management and incentive fees and deductions for taxes. No representations are made as to the accuracy of such estimates or targets or that all assumptions relating to such estimates or targets have been considered or stated or that such estimates or targets will be realized. This presentation does not constitute an offer to sell or the solicitation of an offer to buy any securities of Ares. Management uses certain non-GAAP financial measures, including assets under management, fee earning assets under management, economic net income and distributable earnings, to evaluate Ares’ performance and that of its business segments. Management believes that these measures provide investors with a greater understanding of Ares’ business and that investors should review the same supplemental non-GAAP financial measures that management uses to analyze Ares’ performance. The measures described herein represent those non-GAAP measures used by management, in each case, before giving effect to the consolidation of certain funds that the company consolidates with its results in accordance with GAAP. These measures should be considered in addition to, and not in lieu of, Ares’ financial statements prepared in accordance with GAAP. The definitions and reconciliations of these measures to the most directly comparable GAAP measures, as well as an explanation of why we use these measures, are included in the Appendix. Amounts and percentages may reflect rounding adjustments and consequently totals may not appear to sum. 2
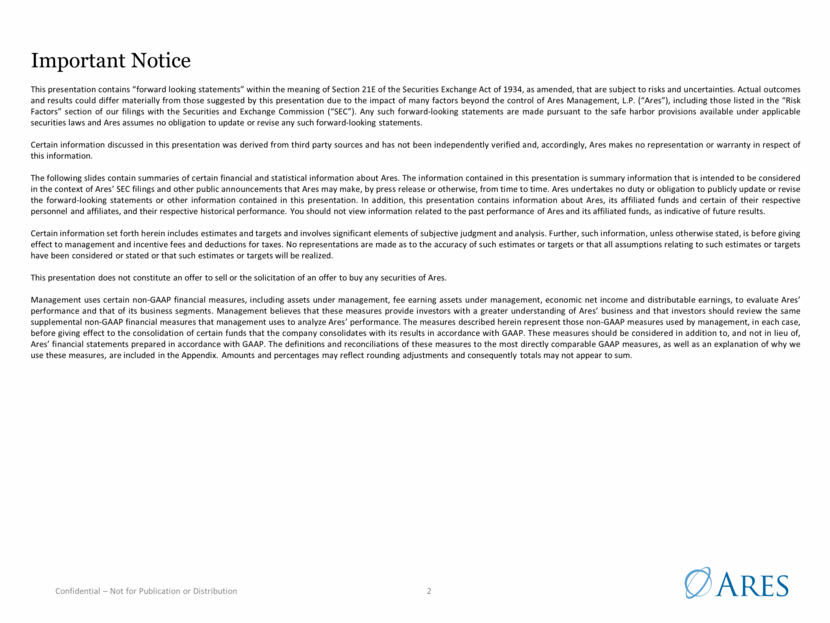
First Quarter Highlights Net inflows represents gross commitments less redemptions. Held final closing of $7.85 billion for ACOF V, including $35 million in Q2-16. Includes ARCC Part I Fees of $28.6 million for the three months ended March 31, 2016. Total units of 213,555,557 includes the sum of common units, Ares Operating Group Units that are exchangeable for common units on a one-for-one basis and the dilutive effects of the Company’s equity-based awards. Please refer to slides 15 and 30 in this presentation for further information. Payable on June 7, 2016 to unitholders of record as of May 24, 2016. Assets Under Management Total Assets Under Management of $93.5 billion Total Fee Earning AUM of $66.6 billion Available Capital increased to $23.0 billion AUM Not Yet Earning Fees increased to $16.5 billion Raised $3.0 billion in gross new capital with net inflows of $2.3 billion(1) Raised $2.1 billion in Ares Corporate Opportunities Fund V bringing total commitments to $7.85 billion(2) Capital deployment of $2.1 billion of which $1.1 billion was related to our drawdown funds Financial Results Distributable Earnings and Distributions Management fees of $162.7 million(3) Fee Related Earnings of $39.0 million Performance Related Earnings of ($14.9) million Economic Net Income of $24.1 million After-tax Economic Net Income of $0.08 per unit(4) GAAP net loss attributable to Ares Management, L.P. of $3.1 million Distributable Earnings of $41.3 million Distributable Earnings (after-tax) of $0.15 per common unit Declared Q1-16 distribution of $0.15 per common unit(5) 3
Gross New Capital Commitments – First Quarter(1) Third Structured Products Fund $222 New and additional equity commitments New equity commitments bringing total raised to date to $2.1 billion in equity and $0.9 billion in debt Third Commingled European Direct Lending Fund $163 commitments ARCC and Related Funds $299 New debt commitments Other Credit Funds $101 New and additional equity commitments to various funds Ares Corporate Opportunities Fund V ("ACOF V") $2,119 Additional equity commitments (subsequent final close in Q2-16 brought total commitments to $7.85 billion) Second European Value Add Fund $114 Additional equity commitments bringing total equity commitments to date to $491 million 1. Represents gross new commitments during Q1-16, including equity and debt commitments and gross inflows into our open-ended managed accounts and sub-advised accounts, as well as equity offerings by our publicly traded vehicles. Confidential – Not for Publication or Distribution 4 Total Real Estate Group$114 Total$3,018 Total Private Equity Group$2,119 Real Estate Group Total Credit Group$785 Private Equity Group $ in millionsQ1 2016Comments Credit Group
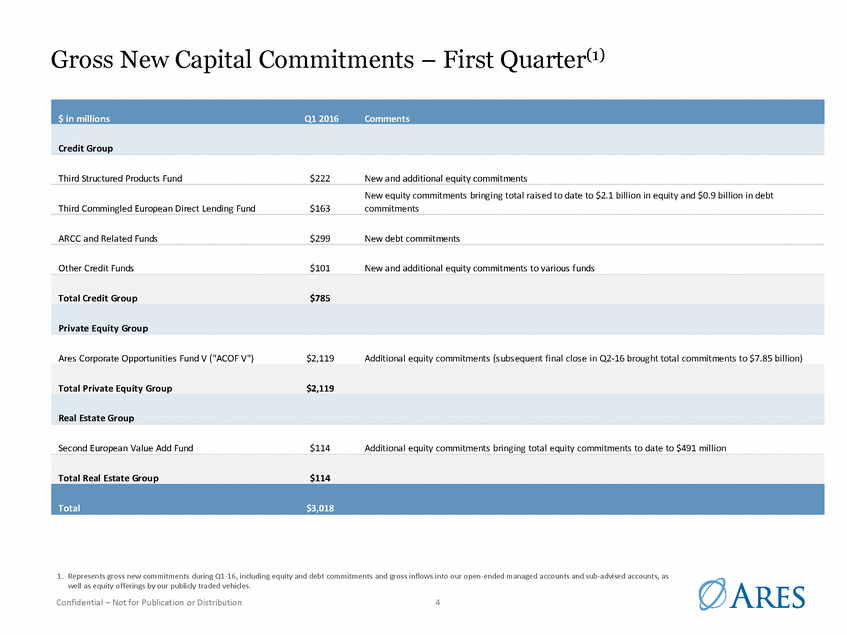
Assets Under Management and Fee Earning Assets Under Management Note: For definitions of AUM and FEAUM please refer to the “Glossary” slide in the appendix. Capital reduction represents a change in leverage. Past performance is not indicative of future results. Asset growth involved a combination of net new capital raised, asset appreciation and asset acquisition. AUM of $93.5 billion as of March 31, 2016 increased 7.6% year over year Q1-16 gross new commitments of $3.0 billion included $2.7 billion in equity commitments and $0.3 billion in debt commitments Of the $3.0 billion raised during the first quarter, $0.5 billion is already earning fees and another $2.4 billion is expected to become FEAUM upon deployment or initiation of the investment period Capital reductions(1) of $2.7 billion, primarily driven by the paydown of loans in the SSLP program within ARCC, a repayment of convertible notes issued by ARCC, and to a lesser extent, a reduction in leverage in a Credit Opportunities fund FEAUM of $66.6 billion as of March 31, 2016 increased 1.4% year over year Growth was primarily attributable to capital deployment and new capital raises FEAUM does not yet include $7.6 billion in fee eligible AUM from ACOF V FEAUM(2) ($ in billions) AUM(2) ($ in billions) 5 $62.1 $62.2 $60.0 $14.8 $21.1 $23.3 $10.0 $10.3 $10.2 $86.9 $93.6 $93.5 Q1-15 Q4-15 Q1-16 Credit Private Equity Real Estate $48.6 $50.1 $48.8 $11.1 $11.4 $11.1 $6.0 $6.8 $6.7 $65.7 $68.3 $66.6 Q1-15 Q4-15 Q1-16 Credit Private Equity Real Estate
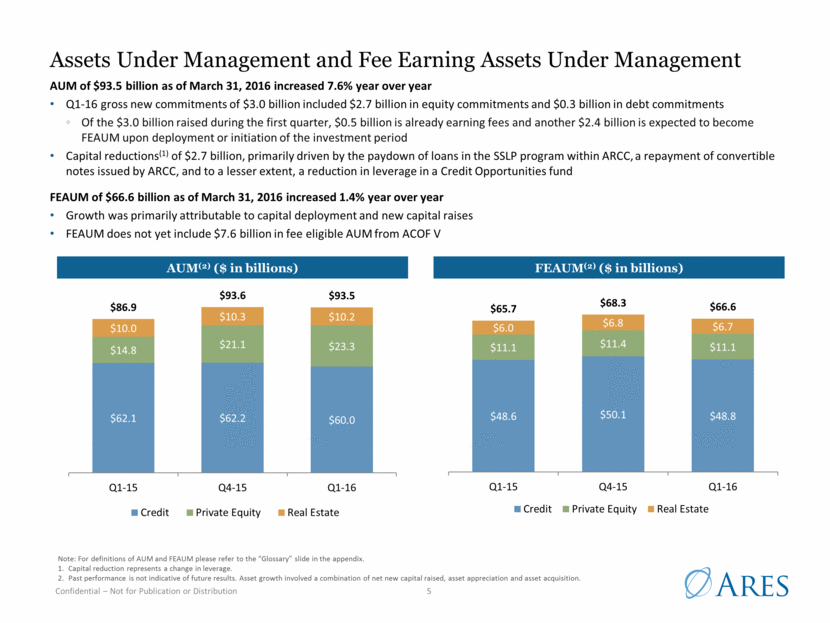
AUM and FEAUM Breakdown by Duration As of March 31, 2016, approximately 79% of AUM and 76% of FEAUM was in capital with a duration greater than 3 years • Managed accounts are typically evergreen Permanent Capital Permanent Capital Managed Accounts Managed Accounts 13% 15% 15% 19% Fewer than 3 years 10 or more years Fewer than 3 years 9% 15% 10 or more years 5% 22% 3 to 6 years 20% 3 to 6 years 32% 29% 7 to 9 years 7 to 9 years Confidential – Not for Publication or Distribution 6 FEAUM AUM
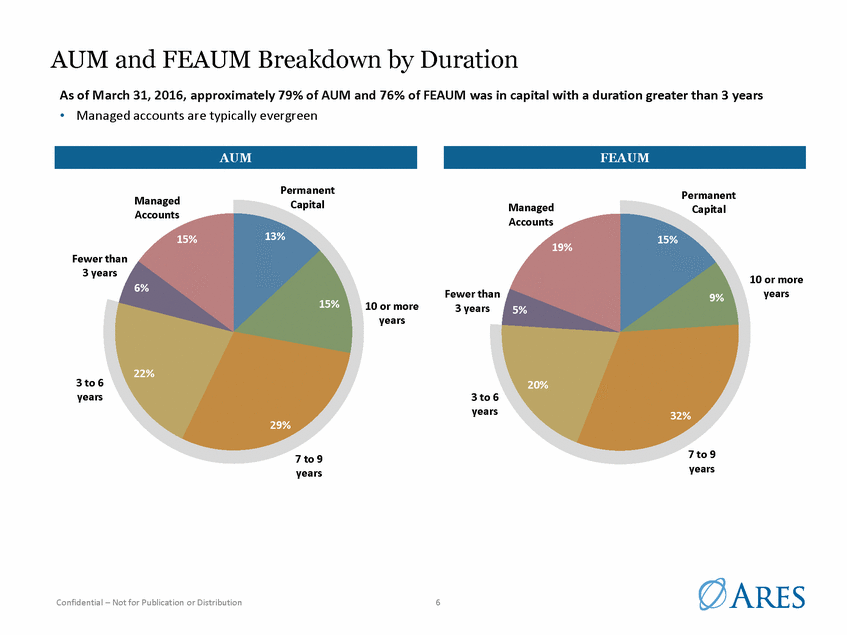
Incentive Generating AUM and Incentive Eligible AUM Incentive Eligible AUM of $47.9 billion as of March 31, 2016 grew 4.6% quarter over quarter Incentive Generating AUM of $10.6 billion as of March 31, 2016 decreased 23.8% quarter over quarter, primarily driven by funds in our Private Equity and Credit Groups ($ in millions) Incentive Eligible AUM: $47.9 billion Incentive Generating AUM: $10.6 billion $47,878 $45,772 $8,801 $10,592 $2,169 $10,031 $4,343 $18,454 Incentive Generating To Be Invested Not Above Hurdle ARCC Part II Fees Not Above Hurdle(2) Credit Real Estate Private Equity Q1-15 Q4-15 Private Equity Q1-16 Real Estate Credit Note: For definitions of IGAUM and IEAUM please refer to the “Glossary” slide in the appendix. 1. Significant funds not contributing incentive fees as of March 31, 2016 included ACOF IV, ACOF Asia, Ares European Real Estate Fund IV, ACRE and ARCC. ARCC did not generate ARCC Part II Fees during Q1-16 (although it continued to generate ARCC Part I Fees, which are treated as management fees). 2. ARCC Part II fees are paid when cumulative realized gains exceed cumulative realized losses and unrealized losses less any amounts paid in previous periods. As of March 31, 2016, cumulative realized gains were below the required hurdle in an amount totaling approximately 1% of the underlying portfolio o f $8.8 billion. Confidential – Not for Publication or Distribution 7 $6,846 $37,551 $6,784 $17,829 $15,216 $6,240 $9,809 $23,772 $23,203 $21,502 Incentive Eligible AUM(1)
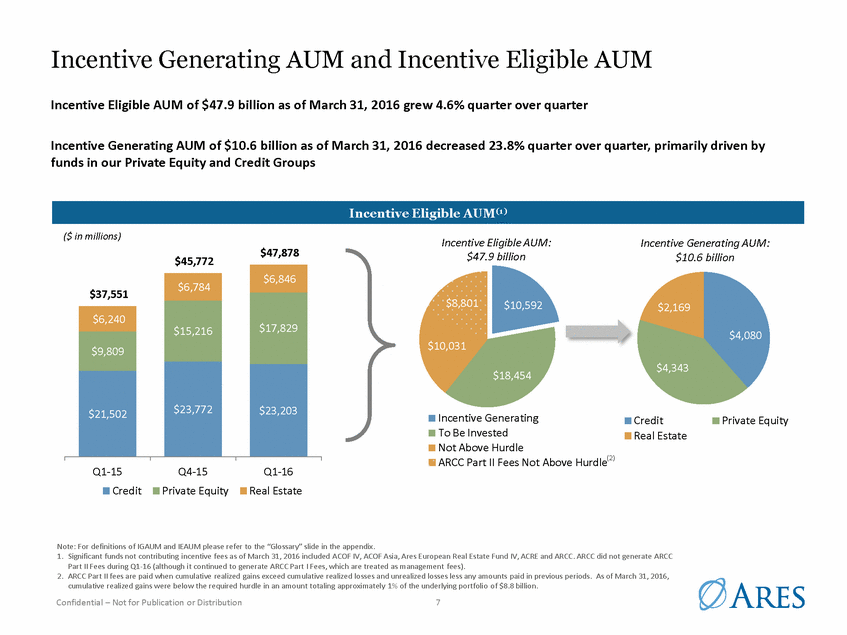
Available Capital and AUM Not Yet Earning Fees Summary Available Capital as of March 31, 2016 increased 21.9% year over year Available Capital increased from $22.4 billion in Q4-15 to $23.0 billion in Q1-16 The increase was driven by new equity commitments in the Private Equity Group and was largely offset by the reduction in leverage of funds in the Credit Group AUM Not Yet Earning Fees as of March 31, 2016 increased 63.1% year over year AUM Not Yet Earning Fees increased from $15.5 billion in Q4-15 to $16.5 billion in Q1-16, primarily driven by additional capital raised for ACOF V, offset by deployment in other funds and debt reductions in certain credit funds Available Capital ($ in millions) AUM Not Yet Earning Fees ($ in millions) 8 $11,697 $10,260 $8,976 $3,577 $8,553 $10,413 $3,580 $3,606 $3,591 $18,854 $22,419 $22,980 Q1-15 Q4-15 Q1-16 Credit Private Equity Real Estate $7,955 $8,338 $7,557 $909 $6,185 $8,051 $1,255 $934 $892 $10,119 $15,457 $ 16,499 Q1-15 Q4-15 Q1-16 Credit Private Equity Real Estate
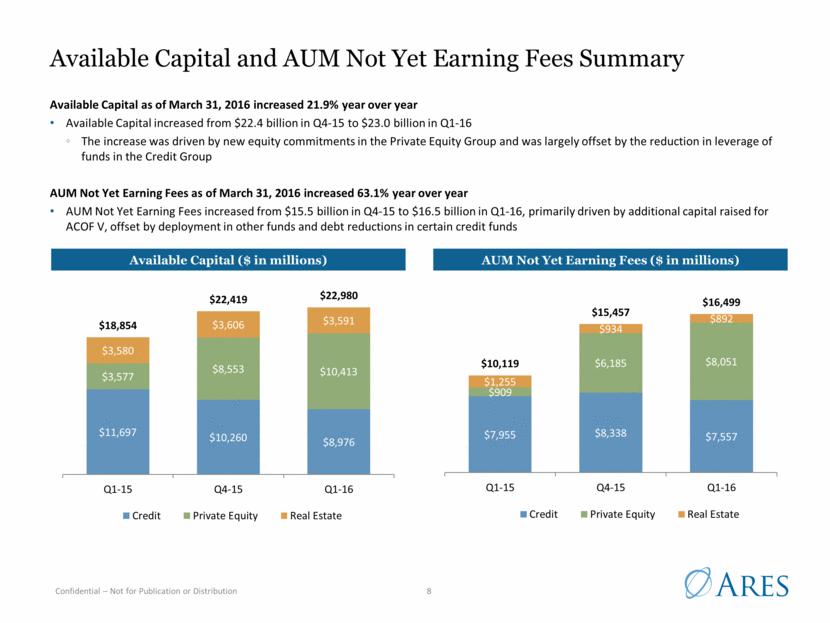
AUM Not Yet Earning Fees Summary As of March 31, 2016, AUM Not Yet Earning Fees of $16.5 billion could generate approximately $197.6 million in potential incremental annual management fees* $14.2 billion of AUM Not Yet Earning Fees was available for deployment as of March 31, 2016 The $14.2 billion in AUM includes, among other funds, $7.6 billion in ACOF V, $1.9 billion in U.S. Direct Lending separately managed accounts, $1.7 billion in our third commingled European Direct Lending fund and $1.0 billion in SSF IV AUM Not Yet Earning Fees: $16.5 billion AUM Not Yet Earning Fees Available for Deployment:$14.2 billion *No assurance can be made that such results will be achieved. Assumes the AUM not yet earning fees as of March 31, 2016 is invested and such fees are paid on an annual basis. Includes approximately $14.5 million in potential incremental management fees from deploying undrawn/available credit facilities at ARCC, which may not be drawn due to leverage target limitations and restrictions. Excludes any potential ARCC Part I Fees. Includes management fees from ACOF V, which will be activated upon the fund’s first investment; however, does not reflect the associated step down in ACOF IV management fees at such time. Capital Available for Follow-on Investments represents capital committed to funds that are past their investment periods but for which capital is available to be called for follow-on investments. $14.2 billion of AUM Not Yet Earning Fees was available for deployment as of March 31, 2016 ($ in millions) ($ in millions) Capital Available for Deployment Capital Available for Deployment for Follow-on Investments(1) Available Capital Currently in Funds Unlikely to be Drawn due to Leverage Targets and Restrictions Funds in or Expected to be in Wind-Down 9 $14,199 $867 $967 $465 $5,996 $7,565 $639 Credit Private Equity Real Estate
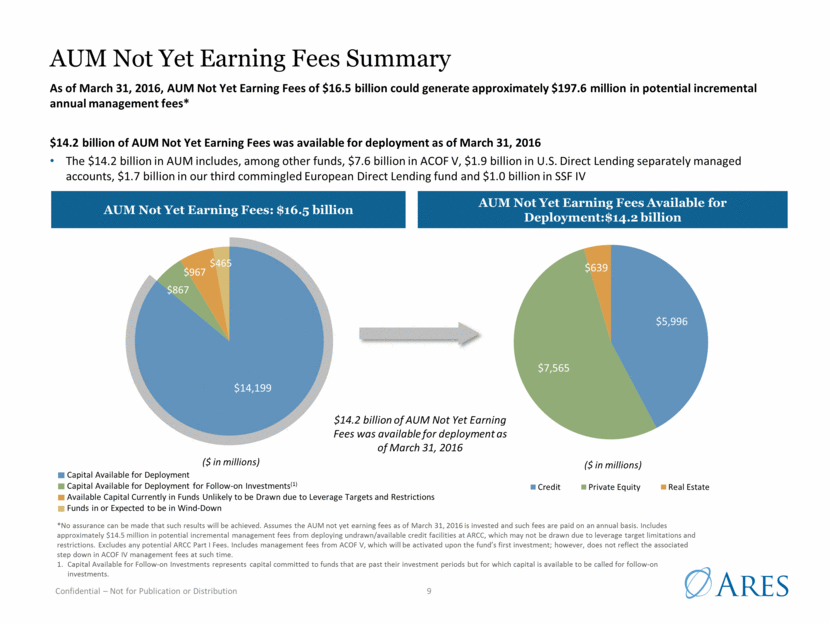
Capital Deployment • Total gross invested capital during Q1-16 of $2.1 billion compared to $4.8 billion in Q1-15 ($ in millions) Of the total amount, $1.1 billion was related to deployment in our drawdown funds compared to $2.1 billion for the same period in 2015 Of our drawdown funds, the most active investment strategies were E.U. and U.S. Direct Lending, followed by Corporate Private Equity and E.U. Real Estate Equity $247 $1,702 Credit Private Equity Real Estate ($ in millions) $2,112 Q1-16 Strategies $262 • • • E.U. Direct Lending U.S. Direct Lending Corporate Private Equity E.U. Real Estate Equity $1,089 $770 • Drawdown Funds Non-drawdown Funds Permanent Capital Q1-15 Q1-16 (1) Credit Private Equity Real Estate 1. Non-drawdown funds includes new capital deployed by managed accounts and CLOs but excludes recycled capital. Confidential – Not for Publication or Distribution 10 $230 $1,089 $449 $1,433 $779 Capital Deployment in our Drawdown Funds: $1.1 billion Capital Deployment by Type: $2.1 billion Capital Deployment by Group: $2.1 billion
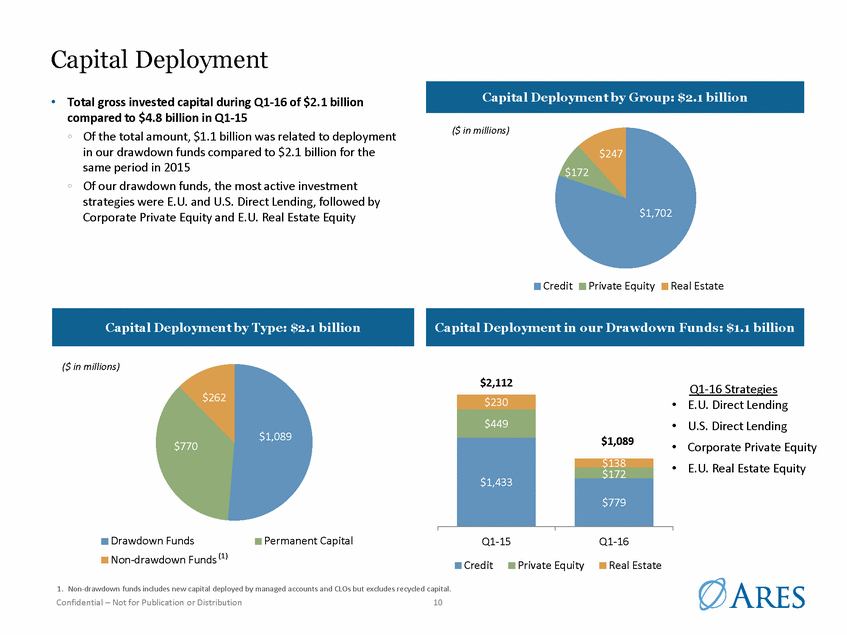
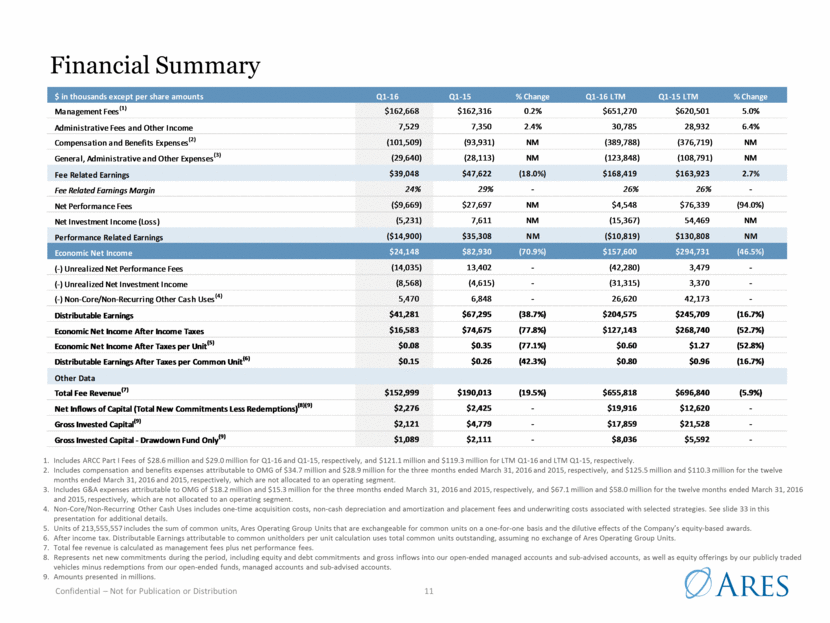
Financial Summary Includes ARCC Part I Fees of $28.6 million and $29.0 million for Q1-16 and Q1-15, respectively, and $121.1 million and $119.3 million for LTM Q1-16 and LTM Q1-15, respectively. Includes compensation and benefits expenses attributable to OMG of $34.7 million and $28.9 million for the three months ended March 31, 2016 and 2015, respectively, and $125.5 million and $110.3 million for the twelve months ended March 31, 2016 and 2015, respectively, which are not allocated to an operating segment. Includes G&A expenses attributable to OMG of $18.2 million and $15.3 million for the three months ended March 31, 2016 and 2015, respectively, and $67.1 million and $58.0 million for the twelve months ended March 31, 2016 and 2015, respectively, which are not allocated to an operating segment. Non-Core/Non-Recurring Other Cash Uses includes one-time acquisition costs, non-cash depreciation and amortization and placement fees and underwriting costs associated with selected strategies. See slide 33 in this presentation for additional details. Units of 213,555,557 includes the sum of common units, Ares Operating Group Units that are exchangeable for common units on a one-for-one basis and the dilutive effects of the Company’s equity-based awards. After income tax. Distributable Earnings attributable to common unitholders per unit calculation uses total common units outstanding, assuming no exchange of Ares Operating Group Units. Total fee revenue is calculated as management fees plus net performance fees. Represents net new commitments during the period, including equity and debt commitments and gross inflows into our open-ended managed accounts and sub-advised accounts, as well as equity offerings by our publicly traded vehicles minus redemptions from our open-ended funds, managed accounts and sub-advised accounts. Amounts presented in millions. 11
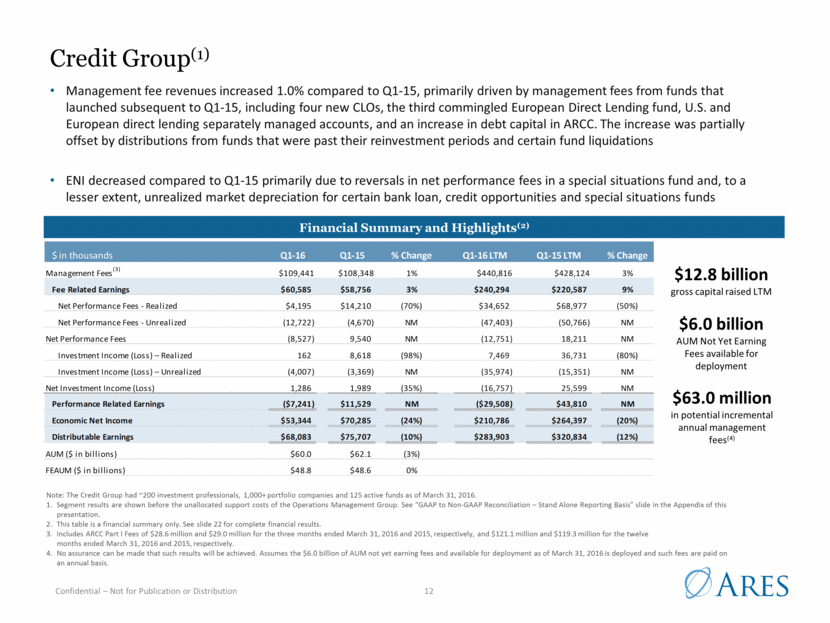
Credit Group(1) Note: The Credit Group had ~200 investment professionals, 1,000+ portfolio companies and 125 active funds as of March 31, 2016. Segment results are shown before the unallocated support costs of the Operations Management Group. See “GAAP to Non-GAAP Reconciliation – Stand Alone Reporting Basis” slide in the Appendix of this presentation. This table is a financial summary only. See slide 22 for complete financial results. Includes ARCC Part I Fees of $28.6 million and $29.0 million for the three months ended March 31, 2016 and 2015, respectively, and $121.1 million and $119.3 million for the twelve months ended March 31, 2016 and 2015, respectively. No assurance can be made that such results will be achieved. Assumes the $6.0 billion of AUM not yet earning fees and available for deployment as of March 31, 2016 is deployed and such fees are paid on an annual basis. Management fee revenues increased 1.0% compared to Q1-15, primarily driven by management fees from funds that launched subsequent to Q1-15, including four new CLOs, the third commingled European Direct Lending fund, U.S. and European direct lending separately managed accounts, and an increase in debt capital in ARCC. The increase was partially offset by distributions from funds that were past their reinvestment periods and certain fund liquidations ENI decreased compared to Q1-15 primarily due to reversals in net performance fees in a special situations fund and, to a lesser extent, unrealized market depreciation for certain bank loan, credit opportunities and special situations funds Financial Summary and Highlights(2) $63.0 million in potential incremental annual management fees(4) $12.8 billion gross capital raised LTM $6.0 billion AUM Not Yet Earning Fees available for deployment 12
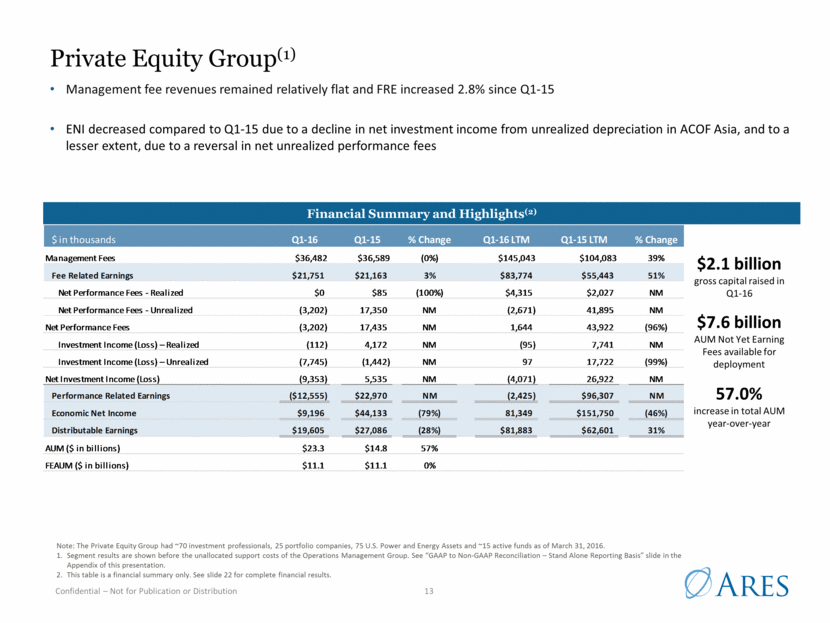
Private Equity Group(1) Note: The Private Equity Group had ~70 investment professionals, 25 portfolio companies, 75 U.S. Power and Energy Assets and ~15 active funds as of March 31, 2016. Segment results are shown before the unallocated support costs of the Operations Management Group. See “GAAP to Non-GAAP Reconciliation – Stand Alone Reporting Basis” slide in the Appendix of this presentation. This table is a financial summary only. See slide 22 for complete financial results. Management fee revenues remained relatively flat and FRE increased 2.8% since Q1-15 ENI decreased compared to Q1-15 due to a decline in net investment income from unrealized depreciation in ACOF Asia, and to a lesser extent, due to a reversal in net unrealized performance fees $2.1 billion gross capital raised in Q1-16 Financial Summary and Highlights(2) $7.6 billion AUM Not Yet Earning Fees available for deployment 57.0% increase in total AUM year-over-year 13
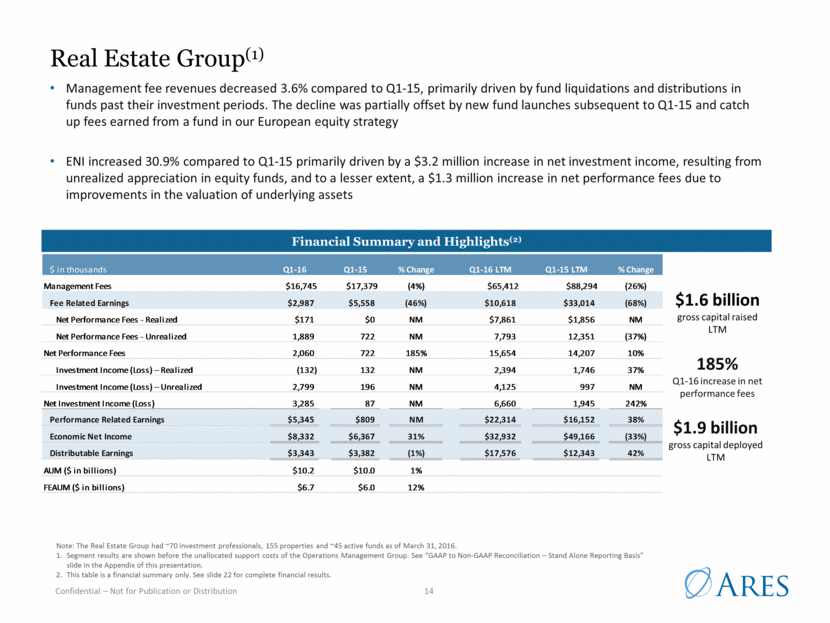
Real Estate Group(1) Note: The Real Estate Group had ~70 investment professionals, 155 properties and ~45 active funds as of March 31, 2016. Segment results are shown before the unallocated support costs of the Operations Management Group. See “GAAP to Non-GAAP Reconciliation – Stand Alone Reporting Basis” slide in the Appendix of this presentation. This table is a financial summary only. See slide 22 for complete financial results. Management fee revenues decreased 3.6% compared to Q1-15, primarily driven by fund liquidations and distributions in funds past their investment periods. The decline was partially offset by new fund launches subsequent to Q1-15 and catch up fees earned from a fund in our European equity strategy ENI increased 30.9% compared to Q1-15 primarily driven by a $3.2 million increase in net investment income, resulting from unrealized appreciation in equity funds, and to a lesser extent, a $1.3 million increase in net performance fees due to improvements in the valuation of underlying assets Financial Summary and Highlights(2) 185% Q1-16 increase in net performance fees $1.6 billion gross capital raised LTM $1.9 billion gross capital deployed LTM 14
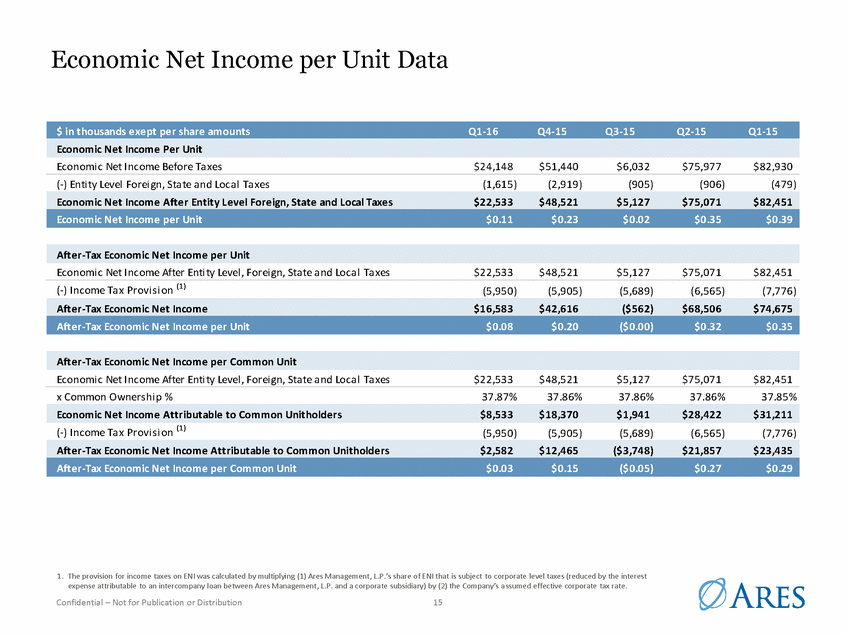
Economic Net Income per Unit Data Economi c Net Income Before Ta xes $24,148 $51,440 $6,032 $75,977 $82,930 (-) Enti ty Level Forei gn, Sta te a nd Loca l Ta xes (1,615) (2,919) (905) (906) (479) Economi c Net Income After Enti ty Level , Forei gn, Sta te a nd Loca l Ta xes $22,533 $48,521 $5,127 $75,071 $82,451 (-) Income Ta x Provi s i on (1) (5,950) (5,905) (5,689) (6,565) (7,776) Economi c Net Income After Enti ty Level , Forei gn, Sta te a nd Loca l Ta xes $22,533 $48,521 $5,127 $75,071 $82,451 x Common Owners hi p % 37.87% 37.86% 37.86% 37.86% 37.85% (-) Income Ta x Provi s i on (1) (5,950) (5,905) (5,689) (6,565) (7,776) 1. The provision for income taxes on ENI was calculated by multiplying (1) Ares Management, L.P.’s share of ENI that is subject to corporate level taxes (reduced by the interest expense attributable to an intercompany loan between Ares Management, L.P. and a corporate subsidiary) by (2) the Company’s a ssumed effective corporate tax rate. Confidential – Not for Publication or Distribution 15 After-Tax Economic Net Income Attributable to Common Unitholders $2,582 $12,465 ($3,748) $21,857 $23,435 After-Tax Economic Net Income per Common Unit $0.03 $0.15 ($0.05) $0.27 $0.29 Economic Net Income Attributable to Common Unitholders $8,533 $18,370 $1,941 $28,422 $31,211 After-Tax Economic Net Income per Common Unit After-Tax Economic Net Income $16,583 $42,616 ($562) $68,506 $74,675 After-Tax Economic Net Income per Unit $0.08 $0.20 ($0.00) $0.32 $0.35 After-Tax Economic Net Income per Unit Economic Net Income After Entity Level Foreign, State and Local Taxes $22,533 $48,521 $5,127 $75,071 $82,451 Economic Net Income per Unit $0.11 $0.23 $0.02 $0.35 $0.39 $ in thousands exept per share amounts Q1-16 Q4-15 Q3-15 Q2-15 Q1-15 Economic Net Income Per Unit
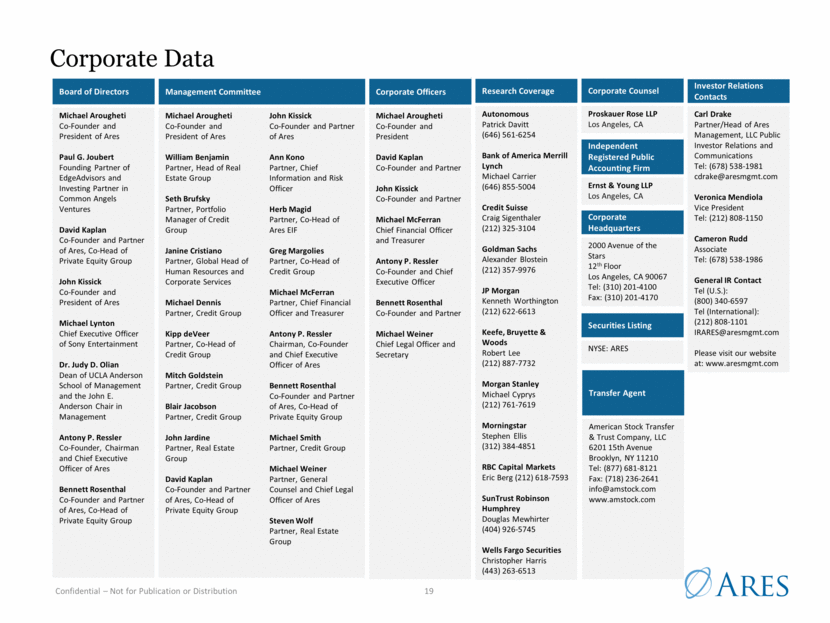
Distributable Earnings per Unit Data Di s tri buta bl e Ea rni ngs $41,281 $50,754 $39,584 $72,956 $67,295 x Ares Opera ti ng Group Uni ts (1) Owners hi p % 62.13% 62.14% 62.14% 62.14% 62.15% Di s tri buta bl e Ea rni ngs $41,281 $50,754 $39,584 $72,956 $67,295 x Common Uni thol der Owners hi p % 37.87% 37.86% 37.86% 37.86% 37.85% (-) Current Provi s i on for Income Ta xes (2) (3,445) (298) (3,724) (4,714) (4,513) 1. Exchangeable into common units. 2. The current provision for income taxes of Ares Management, L.P. on Distributable Earnings (DE) represents the current provision for income taxes on pre-tax net income or loss (reduced by the pro forma interest expense attributable to an intercompany loan between Ares Management, L.P. and a corporate subsidiary), adjusted to reflect Ares Management, L.P.’s post-IPO ownership percentage (which differed slightly from the pre-IPO ownership percentage) of the Company’s tax paying corporate subsidiaries. Confidential – Not for Publication or Distribution 16 Di s tri buta bl e Ea rni ngs After Ta x Attri buta bl e to Common Uni thol ders $12,187 $18,917 $11,263 $22,907 $20,960 Distributable Earnings per Common Unit Outstanding $0.15 $0.23 $0.14 $0.28 $0.26 Actual Distribution per Common Unit $0.15 $0.20 $0.13 $0.26 $0.25 Di s tri buta bl e Ea rni ngs Attri buta bl e to Common Uni thol ders $15,632 $19,215 $14,987 $27,621 $25,473 Distributable Earnings per Common Unit Outstanding Di s tri buta bl e Ea rni ngs Attri buta bl e to Ares Opera ti ng Group Uni ts (1) $25,649 $31,538 $24,597 $45,335 $41,822 Distributable Earnings per Ares Operating Group Unit Outstanding(1) $0.19 $0.24 $0.19 $0.34 $0.32 $ in thousands exept per share amounts Q1-16 Q4-15 Q3-15 Q2-15 Q1-15 Distributable Earnings per Ares Operating Group Unit (1) Outstanding
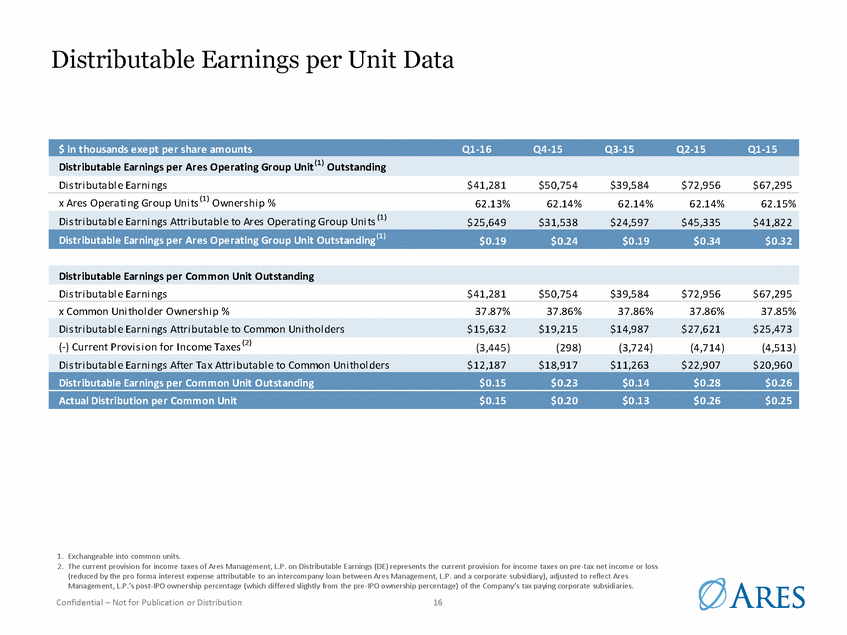
Balance Sheet Highlights • $109.9 million in cash & cash equivalents and $192.0 million drawn against the $1.03 billion revolving credit facility as of March 31, 2016 • Substantial balance sheet value related to investments in Ares managed vehicles and net performance fees receivable As of March 31, 2016, investments reported on a GAAP basis were $496.0 million. On a stand-alone basis, the investments were $646.9 million(1) As of March 31, 2016, gross performance fees receivable reported on a GAAP basis were $524.3 million. On a stand-alone basis, the performance fees receivable were $529.8 million — As of March 31, 2016, net performance fees receivable reported on a GAAP basis were $129.6 million. On a stand-alone basis, the performance fees receivable were $135.2 million Q1-16: $135,170 $ in thousands Cash & cash equivalents $109,934 $121,483 $ Investments 646,910 636,092 7% $48,791 36% Debt obligations 471,274 389,120 Net performance fees receivable 135,170 140,137 $77,532 57% Credit Private Equity Real Estate 1. As of March 31, 2016, $91.2 million was invested in non-Ares managed vehicles. Confidential – Not for Publication or Distribution 17 Balance Sheet Summary - Standalone $ in thousands Q1-16 Q4-15 Net Performance Fees Receivable by Group - Standalone
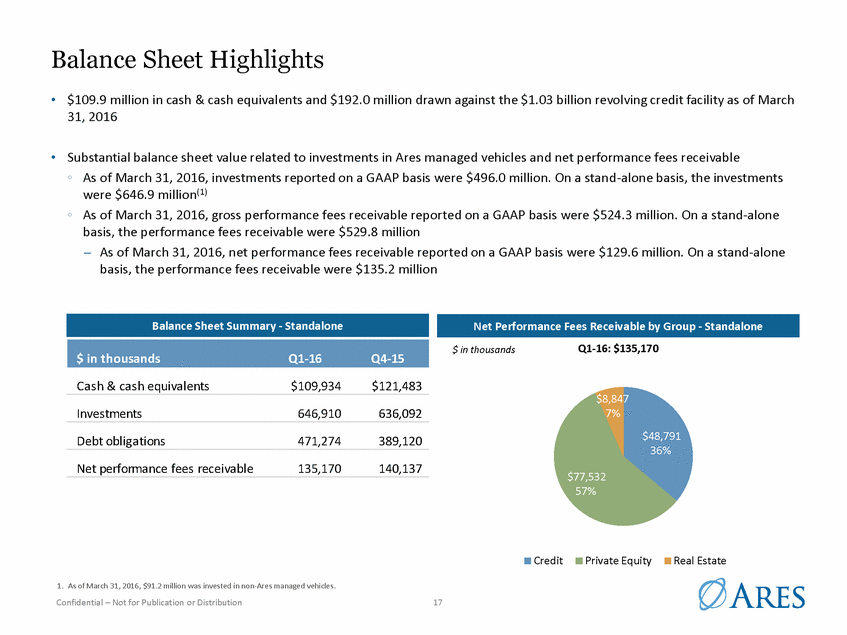
GAAP Statement of Operations Management fees (includes ARCC Part I Fees of $28,625 and $29,042 for the three months ended March 31, 2016 and 2015, res pectively) $158,433 $158,701 Performance fees (29,947) 104,925 Other fees 7,529 6,279 Compensation and benefits 110,679 101,851 Performance fee compensation (21,330) 76,392 General, administrative and other expenses 39,962 45,547 Consolidated Funds' expenses 227 10,673 Net interes t and inves tment income (net of interes t expense of $4,855 and $3,684 for the three months ended March 31, 2016 and 2015, res pectively) (3,359) 1,413 Other income (expense), net 5,241 (1,876) Net realized and unrealized gain on inves tments 5,142 14,839 Net interest and investment income of the Consolidated Funds (net of interest expense of $22,449 and $17,101 for the three months ended March 31, 2016 and 2015, res pectively) 7,332 8,905 Net realized and unrealized loss on investments of Consolidated Funds (29,807) (12,274) Income before taxes (8,974) 46,449 Income tax expense 4,665 4,059 Basic ($0.04) $0.23 Dilute ($0.04) $0.23 Basic 80,683,051 80,667,664 Diluted 80,683,051 80,667,664 Confidential – Not for Publication or Distribution 18 Distribution declared and paid per common unit $0.20 $0.24 Weighted-average common units Net income (13,639) 42,390 Less: Net loss attributable to non-controlling interests in Consolidated Funds (11,979) (11,115) Less: Net income attributable to redeemable interests in Ares Operating Group entities 10 243 Less: Net income attributable to non-controlling interests in Ares Operating Group entities 1,420 34,806 Net income attributable to Ares Management, L.P. ($3,090) $18,456 Net income attributable to Ares Management, L.P. per common unit Total other income (15,451) 11,007 Total expenses 129,538 234,463 Other income (expense) Total revenues 136,015 269,905 Expenses $ in thousands exept per share amounts For the Three Months Ended March 31, 20162015 Revenues
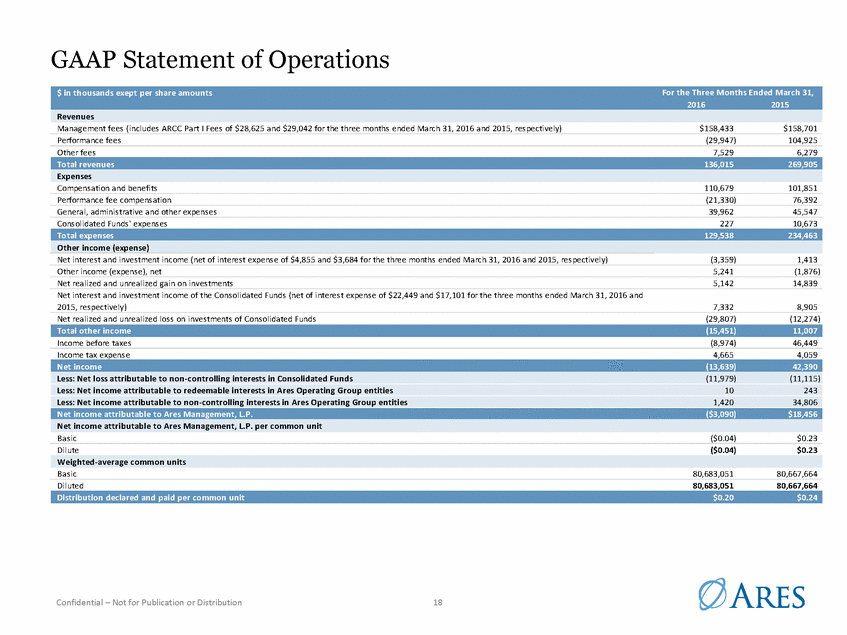
Corporate Data Board of Directors Michael Arougheti Co-Founder and President of Ares Paul G. Joubert Founding Partner of Edge Advisors and Investing Partner in Common Angels Ventures David Kaplan Co-Founder and Partner of Ares, Co-Head of Private Equity Group John Kissick Co-Founder and President of Ares Michael Lynton Chief Executive Officer of Sony Entertainment Dr. Judy D. Olian Dean of UCLA Anderson School of Management and the John E. Anderson Chair in Management Antony P. Ressler Co-Founder, Chairman and Chief Executive Officer of Ares Bennett Rosenthal Co-Founder and Partner of Ares, Co-Head of Private Equity Group Management Committee Michael Arougheti Co-Founder and President of Ares William Benjamin Partner, Head of Real Estate Group Seth Brufsky Partner, Portfolio Manager of Credit Group Janine Cristiano Partner, Global Head of Human Resources and Corporate Services Michael Dennis Partner, Credit Group Kipp deVeer Partner, Co-Head of Credit Group Mitch Goldstein Partner, Credit Group Blair Jacobson Partner, Credit Group John Jardine Partner, Real Estate Group David Kaplan Co-Founder and Partner of Ares, Co-Head of Private Equity Group John Kissick Co-Founder and Partner of Ares Ann Kono Partner, Chief Information and Risk Officer Herb Magid Partner, Co-Head of Ares EIF Greg Margolies Partner, Co-Head of Credit Group Michael McFerran Partner, Chief Financial Officer and Treasurer Antony P. Ressler Chairman, Co-Founder and Chief Executive Officer of Ares Bennett Rosenthal Co-Founder and Partner of Ares, Co-Head of Private Equity Group Michael Smith Partner, Credit Group Michael Weiner Partner, General Counsel and Chief Legal Officer of Ares Steven Wolf Partner, Real Estate Group Corporate Officers Michael Arougheti Co-Founder and President David Kaplan Co-Founder and Partner John Kissick Co-Founder and Partner Michael McFerran Chief Financial Officer and Treasurer Antony P. Ressler Co-Founder and Chief Executive Officer Bennett Rosenthal Co-Founder and Partner Michael Weiner Chief Legal Officer and Secretary Research Coverage Autonomous Patrick Davitt (646) 561-6254 Bank of America Merrill Lynch Michael Carrier (646) 855-5004 Credit Suisse Craig Sigenthaler (212) 325-3104 Goldman Sachs Alexander Blostein (212) 357-9976 JP Morgan Kenneth Worthington (212) 622-6613 Keefe, Bruyette & Woods Robert Lee (212) 887-7732 Morgan Stanley Michael Cyprys (212) 761-7619 Morningstar Stephen Ellis (312) 384-4851 RBC Capital Markets Eric Berg (212) 618-7593 SunTrust Robinson Humphrey Douglas Mewhirter (404) 926-5745 Wells Fargo Securities Christopher Harris (443) 263-6513 Corporate Counsel Proskauer Rose LLP Los Angeles, CA Corporate Headquarters 2000 Avenue of the Stars 12th Floor Los Angeles, CA 90067 Tel: (310) 201-4100 Fax: (310) 201-4170 Independent Registered Public Accounting Firm Ernst & Young LLP Los Angeles, CA Securities Listing NYSE: ARES Transfer Agent American Stock Transfer & Trust Company, LLC 6201 15th Avenue Brooklyn, NY 11210 Tel: (877) 681-8121 Fax: (718) 236-2641 info@amstock.com www.amstock.com Investor Relations Contacts Carl Drake Partner/Head of Ares Management, LLC Public Investor Relations and Communications Tel: (678) 538-1981 cdrake@aresmgmt.com Veronica Mendiola Vice President Tel: (212) 808-1150 Cameron Rudd Associate Tel: (678) 538-1986 General IR Contact Tel (U.S.): (800) 340-6597 Tel (International): (212) 808-1101 IRARES@aresmgmt.com Please visit our website at: www.aresmgmt.com 19
Appendix
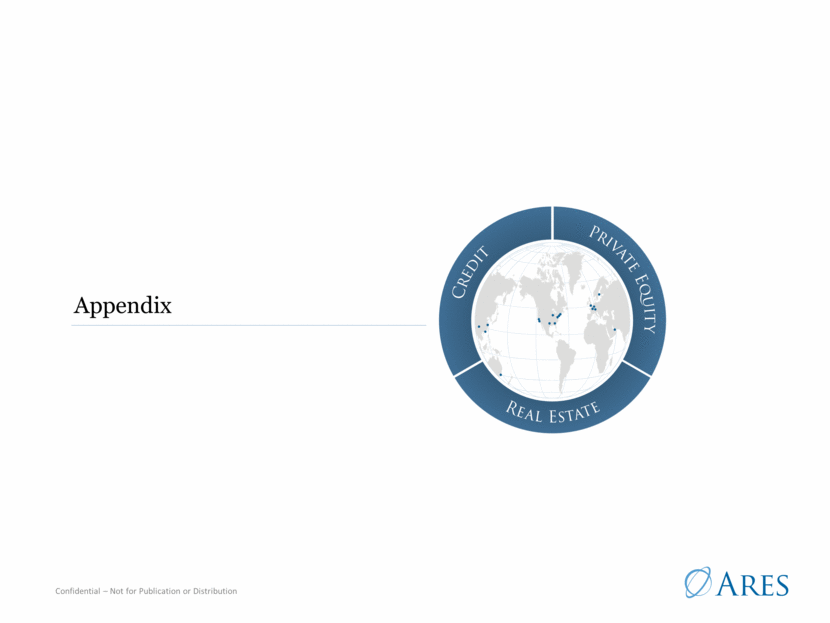
Financial Details - Total Standalone(1) Stand alone results represent the operating segments plus OMG but exclude the effect of Consolidated Funds. Includes ARCC Part I Fees of $28.6 million, $31.5 million, $31.7 million, $29.3 million, and $29.0 million for Q1-16, Q4-15, Q3-15, Q2-15, and Q1-15, respectively. Includes administrative fees and other income attributable to OMG of $6.7 million, $6.8 million, $6.7 million, $6.2 million, and $6.4 million for Q1-16, Q4-15, Q3-15, Q2-15, and Q1-15, respectively, which are not allocated to an operating segment. Includes compensation and benefits expenses attributable to OMG of $34.7 million, $31.8 million, $31.9 million, $27.0 million, and $28.9 million for Q1-16, Q4-15, Q3-15, Q2-15, and Q1-15, respectively, which are not allocated to an operating segment. Includes G&A expenses attributable to OMG of $18.2 million, $17.7 million, $15.1 million, $16.0 million, and $15.3 million for Q1-16, Q4-15, Q3-15, Q2-15, and Q1-15, respectively, which are not allocated to an operating segment. All periods shown are annualized. 21
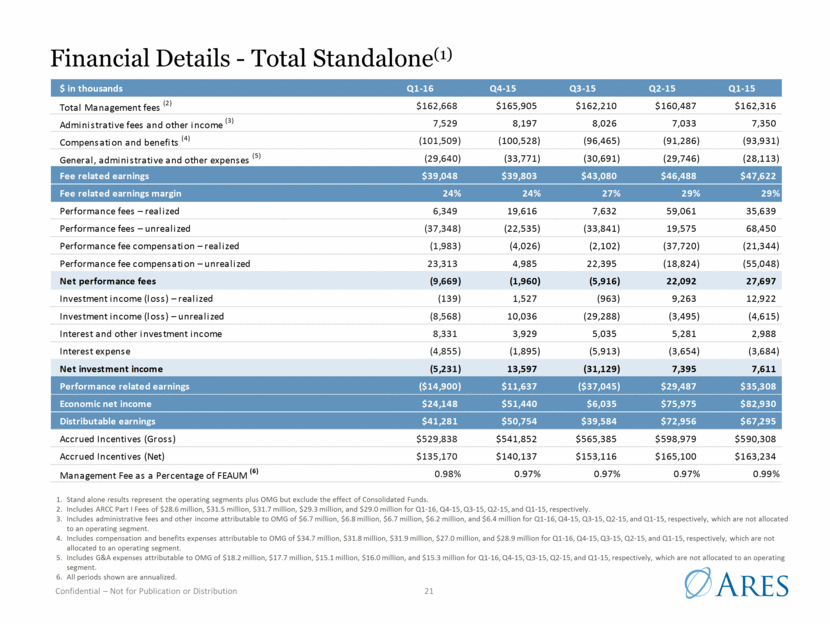
Financial Details - Segments $ in thousands Private Real Operations Total Credit Equity Estate Total Management Stand Group Group Group Segments Group Alone Management Fees (includes ARCC Part I Fees of $28,625) $109,441 $36,482 $16,745 $162,668 - $162,668 Administrative Fees and Other Income 1 09 3 40 4 06 8 55 6 ,674 7 ,529 Compensation and Benefits (43,914) (12,167) (10,714) (66,795) (34,714) (101,509) General, Administrative and Other Expenses (5,051) (2,904) (3,450) (11,405) (18,235) (29,640) Fee Related Earnings (Loss) 60,585 21,751 2,987 85,323 (46,275) 39,048 Performance Fees - Realized 6,178 - 1 71 6 ,349 - 6 ,349 Performance Fees - Unrealized (29,327) (12,143) 4,122 (37,348) - (37,348) Performance Fee Compensation - Realized (1,983) - - (1,983) - (1,983) Performance Fee Compensation - Unrealized 16,605 8,941 (2,233) 2 3,313 - 2 3,313 Net Performance Fees (8,527) (3,202) 2,060 (9,669) - (9,669) Investment Income (Loss) - Realized 162 (112) (132) (82) (57) (139) Investment Income (Loss) - Unrealized (4,007) (7,745) 2 ,799 (8,953) 385 (8,568) Interest and Other Investment Income 7 ,579 (91) 8 92 8 ,380 (49) 8 ,331 Interest Expense (2,448) (1,405) (274) (4,127) (728) (4,855) Net Investment Income (Loss) 1,286 (9,353) 3,285 (4,782) (449) (5,231) Performance Related Earnings (Loss) (7,241) (12,555) 5,345 (14,451) (449) (14,900) Economic Net Income (Loss) $53,344 $9,196 $8,332 $70,872 ($46,724) $24,148 Distributable Earnings (Loss) $68,083 $19,605 $3,343 $91,031 ($49,750) $41,281 $ in thousands Private Real Operations Total Credit Equity Estate Total Management Stand Group Group Group Segments Group Alone Management Fees (includes ARCC Part I Fees of $29,042) $108,348 $36,589 $17,379 $162,316 - $162,316 Administrative Fees and Other Income 9 8 1 3 8 54 9 65 6 ,385 7 ,350 Compensation and Benefits (42,565) (12,321) (10,131) (65,017) (28,914) (93,931) General, Administrative and Other Expenses (7,125) (3,118) (2,544) (12,787) (15,326) (28,113) Fee Related Earnings (Loss) 58,756 21,163 5,558 85,477 (37,855) 47,622 Performance Fees - Realized 35,214 425 - 3 5,639 - 3 5,639 Performance Fees - Unrealized (19,201) 8 7,331 320 6 8,450 - 6 8,450 Performance Fee Compensation - Realized (21,004) (340) - (21,344) - (21,344) Performance Fee Compensation - Unrealized 14,531 (69,981) 402 (55,048) - (55,048) Net Performance Fees 9,540 17,435 722 27,697 - 27,697 Investment Income (Loss) - Realized 8,618 4 ,172 132 1 2,922 - 1 2,922 Investment Income (Loss) - Unrealized (3,369) (1,442) 196 (4,615) - (4,615) Interest and Other Investment Income (1,526) 4,485 29 2 ,988 - 2 ,988 Interest Expense (1,734) (1,680) (270) (3,684) - (3,684) Net Investment Income (Loss) 1,989 5,535 87 7,611 - 7,611 Performance Related Earnings (Loss) 11,529 22,970 809 35,308 - 35,308 Economic Net Income (Loss) $70,285 $44,133 $6,367 $120,785 ($37,855) $82,930 Distributable Earnings (Loss) $75,707 $27,086 $3,382 $106,175 ($38,880) $67,295
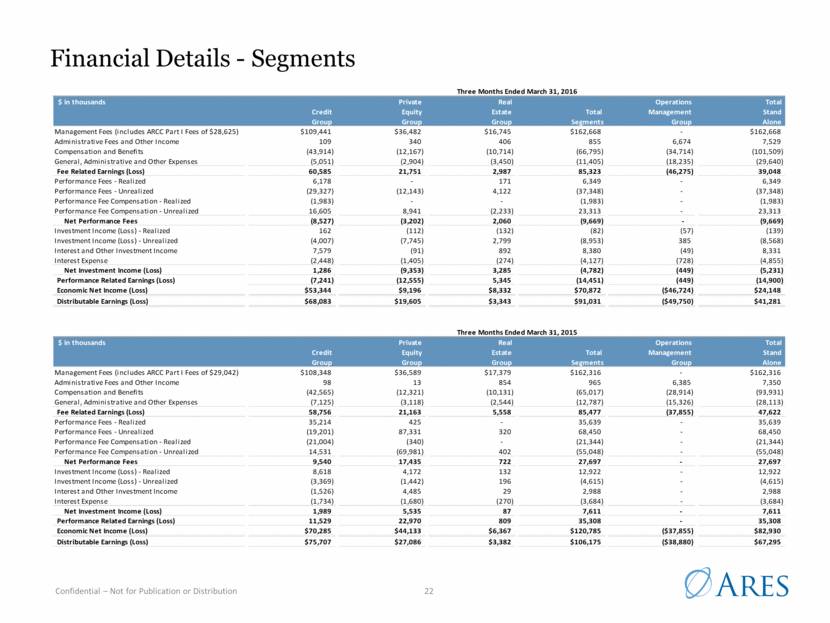
Assets Under Management and Fee Earning Assets Under Management Commitments 785 2,119 114 3,018 Commitments 12,031 8,409 1,615 22,055 Capital reductions (2,613) - (69) (2,682) Capital reductions (11,110) (6) (223) (11,339) Distributions/redemptions (990) (17) (237) (1,243) Distributions/redemptions (3,301) (657) (1,707) (5,666) Changes in fund value 617 59 107 783 Changes in fund value 358 708 465 1,531 Commitments 212 - 114 326 Commitments 3,906 523 937 5,366 Subscriptions/deployment/increase in leverage 935 3 34 972 Subscriptions/deployment/increase in leverage 5,013 107 761 5,880 Distributions/redemptions/decrease in leverage (2,692) - (160) (2,852) Distributions/redemptions/decrease in leverage (8,512) (218) (807) (9,537) Changes in fund value 287 (21) 38 304 Changes in fund value 95 (21) 36 109 Change in fee basis (63) (278) (108) (449) Change in fee basis (295) (382) (233) (910) notes issued by ARCC, and to a lesser extent, a reduction in leverage in a fund in the Credit Opportunities strategy equity commitments Note: For definitions of AUM please refer to the “Glossary” slide in the appendix. 1. Past performance is not indicative of future results. Asset growth involved a combination of net new capital raised, asset appreciation and asset acquisition. 2. Capital reduction represents a change in leverage. Confidential – Not for Publication or Distribution 23 Credit • Capital reduction was primarily driven by the paydown of loans in the SSLP program of ARCC, a repayment of convertible Private Equity • AUM increased 10.2% from Q4-15 primarily driven by new equity commitments of $2.1 billion into ACOF V Real Estate • AUM remained relatively flat from Q4-15 as the decline from distributions was primarily offset by $114 million in new Q1-16 $ 48,783 $ 11,115 $ 6,675 $ 66,573 YoY increase $ 206 $ 8 $ 695 $ 908 Q1-16 $ 48,783 $ 11,115 $ 6,675 $ 66,573 QoQ increase $ (1,321) $ (296) $ (82) $ (1,699) Q1-16 Total FEAUM Rollforward(1) ($ in billions) Private Credit Equity Real Estate Total Q4-15 $ 50,104 $ 11,411 $ 6,757 $ 68,272 Q1-16 $ 60,048 $ 23,276 $ 10,183 $ 93,507 YoY increase $ (2,023) $ 8,453 $ 150 $ 6,581 LTM Total FEAUM Rollforward(1) ($ in billions) Private Credit Equity Real Estate Total 1Q'15 $ 48,577 $ 11,107 $ 5,980 $ 65,664 Q1-16 $ 60,048 $ 23,276 $ 10,183 $ 93,507 QoQ increase $ (2,201) $ 2,161 $ (86) $ (125) LTM Total AUM Rollforward(1)(2) ($ in billions) Private Credit Equity Real Estate Total Q1-15 $ 62,070 $ 14,823 $ 10,033 $ 86,926 Q1-16 Total AUM Rollforward(1)(2) ($ in billions) Private Credit Equity Real Estate Total Q4-15 $ 62,249 $ 21,115 $ 10,268 $ 93,632
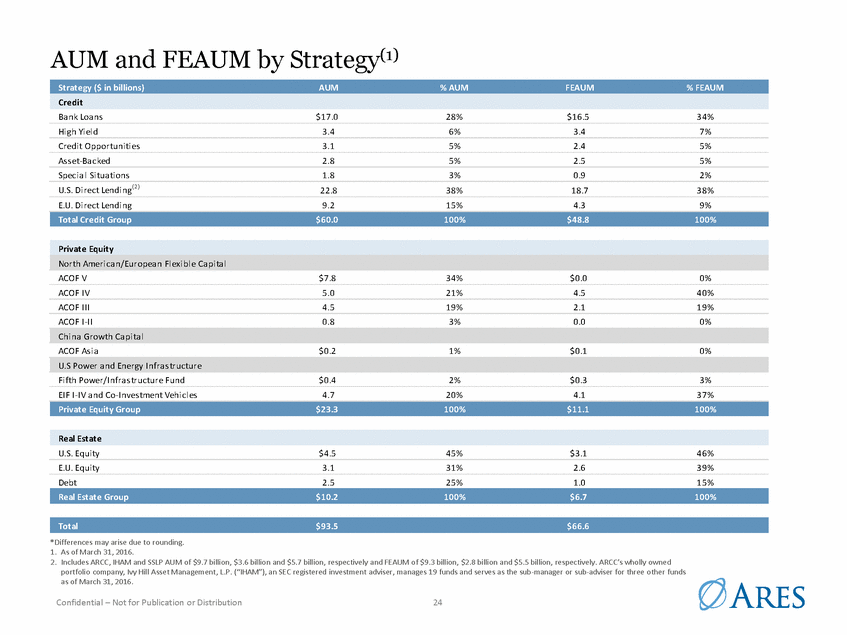
Strategy(1) AUM and FEAUM by Bank Loans $17.0 28% $16.5 34% High Yi el d 3.4 6% 3.4 7% Credit Opportunities 3.1 5% 2.4 5% Asset-Backed 2.8 5% 2.5 5% Special Situations 1.8 3% 0.9 2% U.S. Direct Lending(2) 22.8 38% 18.7 38% E.U. Direct Lending 9.2 15% 4.3 9% ACOF V $7.8 34% $0.0 0% ACOF IV 5.0 21% 4.5 40% ACOF III 4.5 19% 2.1 19% ACOF I-II 0.8 3% 0.0 0% ACOF Asia $0.2 1% $0.1 0% Fifth Power/Infrastructure Fund $0.4 2% $0.3 3% EIFI-IV and Co-Investment Vehicles 4.7 20% 4.1 37% U.S. Equity $4.5 45% $3.1 46% E.U. Equity 3.1 31% 2.6 39% Debt 2.5 25% 1.0 15% *Differences may arise due to rounding. 1. As of March 31, 2016. 2. Includes ARCC, IHAM and SSLP AUM of $9.7 billion, $3.6 billion and $5.7 billion, respectively and FEAUM of $9.3 billion, $2.8 billion and $5.5 billion, respectively. ARCC’s wholly owned portfolio company, Ivy Hill Asset Management, L.P. (“IHAM”), an SEC registered investment adviser, manages 19 funds and serves as the sub-manager or sub-adviser for three other funds as of March 31, 2016. Confidential – Not for Publication or Distribution 24 Total $93.5 $66.6 Real Estate Group $10.2 100% $6.7 100% Real Estate Private Equity Group $23.3 100% $11.1 100% U.S Power and Energy Infrastructure China Growth Capital Private Equity North America n/European Flexible Capital Total Credit Group $60.0 100% $48.8 100% Strategy ($ in billions) AUM% AUM FE AUM% FE AUM Credit
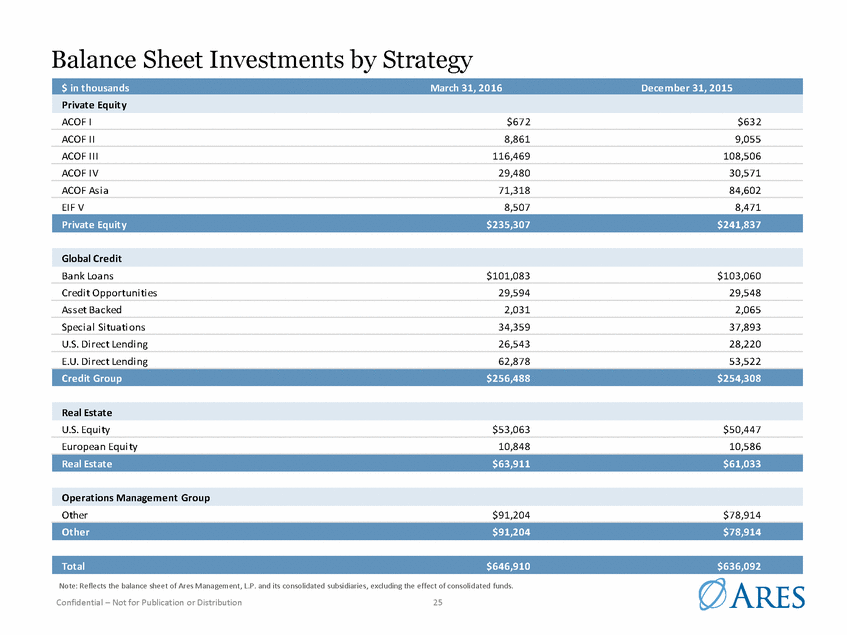
Balance Sheet Investments by Strategy ACOF I $672 $632 ACOF II 8,861 9,055 ACOF III 116,469 108,506 ACOF IV 29,480 30,571 ACOF As i a 71,318 84,602 EIF V 8,507 8,471 Ba nk Loa ns $101,083 $103,060 Credi t Opportuni ti es 29,594 29,548 As s et Ba cked 2,031 2,065 Speci a l Si tua ti ons 34,359 37,893 U.S. Di rect Lendi ng 26,543 28,220 E.U. Di rect Lendi ng 62,878 53,522 U.S. Equi ty $53,063 $50,447 Europea n Equi ty 10,848 10,586 Other $91,204 $78,914 Note: Reflects the balance sheet of Ares Management, L.P. and its consolidated subsidiaries, excluding the effect of consolid ated funds. Confidential – Not for Publication or Distribution 25 Total$646,910$636,092 Other$91,204$78,914 Operations Management Group Real Estate$63,911$61,033 Real Estate Credit Group$256,488$254,308 Global Credit Private Equity$235,307$241,837 $ in thousandsMarch 31, 2016December 31, 2015 Private Equity
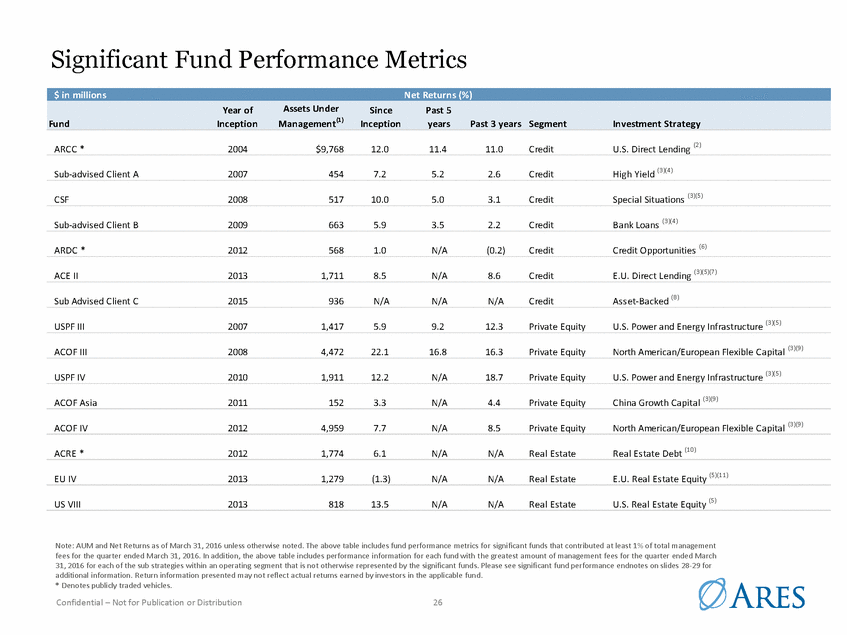
Significant Fund Performance Metrics ARCC * 2004 $9,768 12.0 11.4 11.0 Credit U.S. Direct Lending (2) Sub-advised Client A 2007 454 7.2 5.2 2.6 Credit High Yield (3)(4) CSF 2008 517 10.0 5.0 3.1 Credit Special Situations (3)(5) Sub-advised Client B 2009 663 5.9 3.5 2.2 Credit Bank Loans (3)(4) ARDC * 2012 568 1.0 N/A (0.2) Credit Credit Opportunities (6) ACE II 2013 1,711 8.5 N/A 8.6 Credit E.U. Direct Lending (3)(5)(7) Sub Advised Client C 2015 936 N/A N/A N/A Credit Asset-Backed (8) USPF III 2007 1,417 5.9 9.2 12.3 Private Equity U.S. Power and Energy Infrastructure (3)(5) ACOF III 2008 4,472 22.1 16.8 16.3 Private Equity North American/European Flexible Capital (3)(9) USPF IV 2010 1,911 12.2 N/A 18.7 Private Equity U.S. Power and Energy Infrastructure (3)(5) ACOF Asia 2011 152 3.3 N/A 4.4 Private Equity China Growth Capital (3)(9) ACOF IV 2012 4,959 7.7 N/A 8.5 Private Equity North American/European Flexible Capital (3)(9) ACRE * 2012 1,774 6.1 N/A N/A Real Estate Real Estate Debt (10) EU IV 2013 1,279 (1.3) N/A N/A Real Estate E.U. Real Estate Equity (5)(11) US VIII 2013 818 13.5 N/A N/A Real Estate U.S. Real Estate Equity (5) Note: AUM and Net Returns as of March 31, 2016 unless otherwise noted. The above table includes fund performance metrics for significant funds that contributed at least 1% of total management fees for the quarter ended March 31, 2016. In addition, the above table includes performance information for each fund with t he greatest amount of management fees for the quarter ended March 31, 2016 for each of the sub strategies within an operating segment that is not otherwise represented by the significant funds. Please see significant fund performance endnotes on slides 28-29 for additional information. Return information presented may not reflect actual returns earned by investors in the applicable fund. * Denotes publicly traded vehicles. Confidential – Not for Publication or Distribution 26 $ in millions Net Returns (%) Year of Assets Under Since Past 5 Fund Inception Management(1) Inception years Past 3 years Segment Investment Strategy
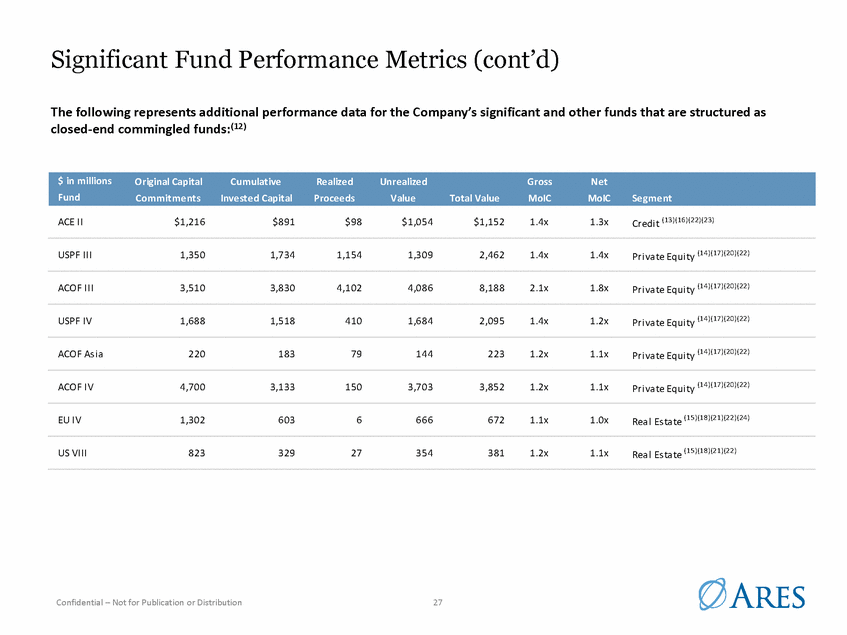
Significant Fund Performance Metrics (cont’d) The following represents additional performance data for the Company’s significant and other funds that are structured as closed-end commingled funds:(12) Credi t (13)(16)(22)(23) ACE II $1,216 $891 $98 $1,054 $1,152 1.4x 1.3x Pri va te Equi ty (14)(17)(20)(22) USPF III 1,350 1,734 1,154 1,309 2,462 1.4x 1.4x Pri va te Equi ty (14)(17)(20)(22) ACOF III 3,510 3,830 4,102 4,086 8,188 2.1x 1.8x Pri va te Equi ty (14)(17)(20)(22) USPF IV 1,688 1,518 410 1,684 2,095 1.4x 1.2x Pri va te Equi ty (14)(17)(20)(22) ACOF As i a 220 183 79 144 223 1.2x 1.1x Pri va te Equi ty (14)(17)(20)(22) ACOF IV 4,700 3,133 150 3,703 3,852 1.2x 1.1x Rea l Es ta te (15)(18)(21)(22)(24) EU IV 1,302 603 6 666 672 1.1x 1.0x US VIII 823 329 27 354 381 1.2x 1.1x Rea l Es ta te (15)(18)(21)(22) Confidential – Not for Publication or Distribution 27 $ in millions Original Capital Cumulative Realized Unrealized Gross Net Fund Commitments Invested Capital Proceeds Value Total Value MoIC MoIC Segment
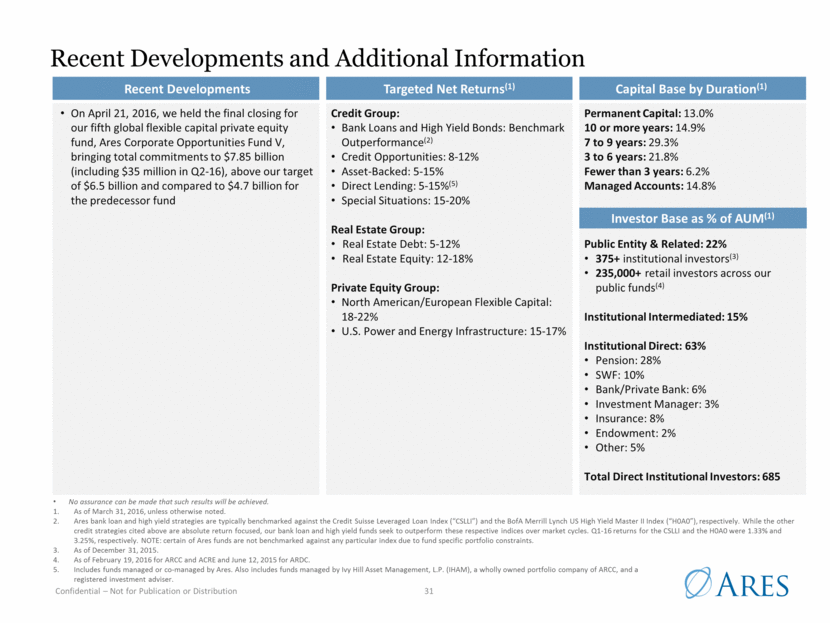
Significant Fund Performance Metrics Endnotes Assets under management equals the sum of the NAV for such fund, the drawn and undrawn debt (at the fund-level including amounts subject to restrictions) and uncalled committed capital. The AUM for ARCC does not include AUM of General Electric Company’s co-investment in the SSLP (through which ARCC co-invests with affiliates of General Electric Company) or Ivy Hill Asset Management, L.P. (a wholly owned portfolio company of ARCC). The AUM for CSF, a fund of funds, includes AUM that has been committed to other Ares funds. Net returns are annualized net returns and are calculated using the fund's net asset value per share (NAV) and assume dividends are reinvested at the closest quarter-end NAV to the relevant quarterly ex-dividend dates. ARCC files public financial statements with the Securities and Exchange Commission (“SEC”), which are not part of this quarterly report. Net returns are net of management fees and performance fees as applicable. CSF, ACE II, ACOF III, ACOF IV, ACOF Asia, USPF III, USPF IV, US VIII, and EU IV net returns are also after giving effect to other expenses. Returns are expressed in U.S. Dollars. Net returns for the past three year, five year, and since inception periods are annualized net returns calculated by linking monthly net returns. Monthly net returns are calculated by linking daily returns. Prior to January 1, 2015 monthly net returns were calculated using the modified Dietz method, which is an estimate of the time-weighted return and weights portfolio cash flows according to the time they were invested in the portfolio. The net return is an annualized net internal rate of return of cash flows to and from the fee-paying partners, and the fee-paying partners’ ending capital for the period. The past five and three years net returns are calculated using the beginning partners’ capital for the fee-paying partners for such period. Cash flows for net return calculations are based on the actual dates of the cash flows. Net returns are annualized net returns and are calculated using the fund's net asset value per share (NAV) and assume dividends are reinvested at the NAV. ARDC files public financial statements with the SEC, which are not part of this quarterly report. ACE II is made up of two feeder funds, one denominated in U.S. Dollars and one denominated in Euros. The since inception net IRR presented in the chart is for the U.S. Dollar denominated feeder fund. All other values for ACE II are for the combined fund and are converted to U.S. Dollars at the prevailing quarter-end exchange rate. The since inception net IRR for the Euro denominated feeder fund is 11.5%, and is calculated using the same methodology described in footnotes 3 and 5 above. The variance between the since inception net IRRs for the U.S. Dollar denominated and Euro denominated feeder funds is driven by the U.S. GAAP mark-to-market reporting of the foreign currency hedging program in the U.S. Denominated feeder fund. The feeder fund is expected to hold the foreign currency hedges until maturity, and therefore is expected to ultimately recognize a gain while mitigating the currency risk associated with the initial principle investments. Information not yet meaningful due to limited operating history. The net return is an annualized net internal rate of return of cash flows on investments and the investments’ ending valuations for the period. The past five and three years net returns are calculated using beginning investment valuations for such period. For ACOF III and ACOF IV, cash flows and beginning and ending valuations include those attributable to the interests of the fee-paying limited partners and exclude those attributable to the non-fee paying limited partners and the general partner. For ACOF Asia, cash flows and beginning and ending valuations include those attributable to the interests of all partners, including the general partner and Schedule I limited partners, which both pay reduced performance fees and do not pay management fees, since the commitments of these partners account for approximately 75% of total fund commitments. Cash flows for all net return calculations are assumed to occur at month-end. AUM and net returns are presented as of March 31, 2016. The return shown is an effective yield that represents the dollar weighted average of the unleveraged effective yield of ACRE’s principal lending portfolio measured at the end of the sixteen quarterly periods ending March 31, 2015. Unleveraged effective yield is based on the contractual interest rate (adjusted for any deferred loan fees, costs, premium or discount) and assumes no dispositions, early prepayments or defaults and does not take into consideration the impact of leverage utilized by ACRE, fees, expenses and other costs incurred by ACRE or its stockholders, which are expected to be significant. Unleveraged effective yield does not represent net returns to investors of ACRE. ACRE files public financial statements with the SEC, which are not part of this quarterly report. EU IV is made up of two parallel funds, one denominated in Euros and one denominated in U.S. Dollars. The net returns in this presentation are for the U.S. Dollar denominated fund. All other values for EU IV are for the combined fund and are converted to U.S. Dollars at the prevailing quarter-end exchange rate. Since inception net IRR for the Euro denominated fund is (1.0%), and is calculated using the same methodology described in footnote 5 above. Unrealized value is a component of total value. There can be no assurance that unrealized investments will be realized at the valuations shown. Realized proceeds represent the sum of all cash distributions to all partners. Realized proceeds represents the sum of all cash dividends, interest income, other fees and cash proceeds from realizations of interests in portfolio investments. Realized proceeds include distributions of operating income, sales and financing proceeds received through March 31, 2016. Unrealized value represents the fund’s net asset value as of March 31, 2016. Unrealized value represents the fair market value of remaining investments as of March 31, 2016. Unrealized value represents the fair market value of remaining real estate investments as of March 31, 2016 (excluding balance sheet items). There can be no assurance that unrealized investments will be realized at the valuations shown. 28
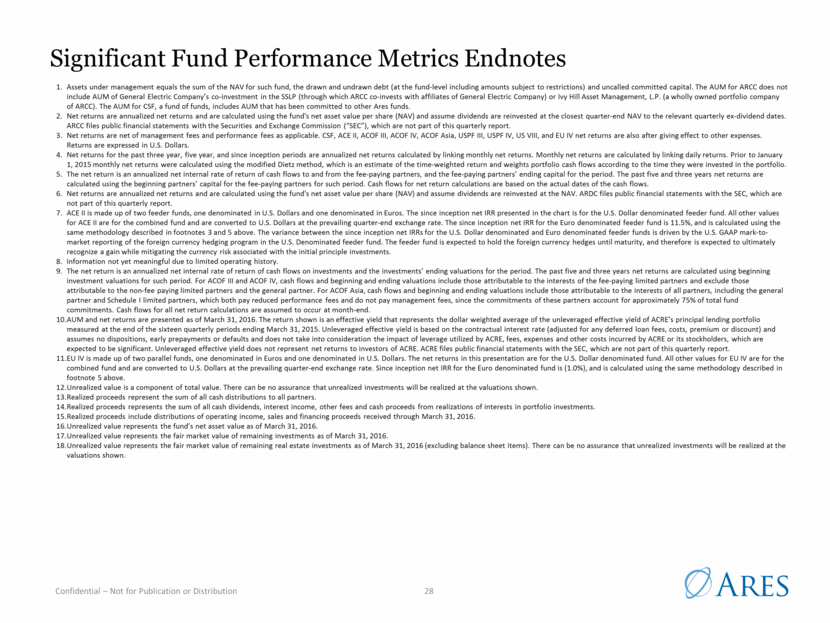
Significant Fund Performance Metrics Endnotes (cont’d) 20. 21. 22. 23. 24. 25. The Gross MoIC as of March 31, 2016 is before giving effect to management fees, performance fees and other expenses. The multiple is calculated at the fund-level and is based on the interests of all partners. The Gross MoIC as of March 31, 2016 is before giving effect to management fees, performance fees and other expenses. The multiple is calculated at the investment-level and is based on the interests of all partners. The Gross MoIC as of March 31, 2016 is before giving effect to management fees, performance fees and other expenses. The multiple is calculated at the investment-level and is based on the interests of the fee-paying partners. The Net MoIC as of March 31, 2016 is after giving effect to management fees, performance fees and other expenses. For ACE II, the multiple is calculated at the fund-level and is based on the interests of the fee-paying limited partners and excludes those interests attributable to the non-fee paying limited partners and general partner. For ACOF III and ACOF IV, the multiple is calculated at the investment-level and is based on the interests of the fee-paying limited partners and excludes those interests attributable to the non-fee paying limited partners and the general partner. For ACOF Asia, the multiple is calculated at the investment-level and is based on the interests of all partners, including the general partner and Schedule I limited partners, which both pay reduced performance fees and do not pay management fees, since the commitments of these partners account for approximately 75% of total fund commitments. For USPF III and USPF IV, the multiple is calculated at the fund-level and is based on the interests of the fee-paying limited partners. For E.U. IV and U.S. VIII, the multiple is calculated at the fund-level and is based on the interests of the fee-paying partners. ACE II is made up of two feeder funds, one denominated in U.S. Dollars and one denominated in Euros. The gross and net MoIC presented in the chart are for the U.S. Dollar denominated feeder fund. The gross and net MoIC for the Euro denominated feeder fund are 1.3x and 1.2x, respectively. Original capital commitments are converted to U.S. Dollars at the prevailing exchange rate at the time of the fund’s closing. All other values for ACE II are for the combined fund and are converted to U.S. Dollars at the prevailing quarter-end exchange rate. The variance between the gross and net MoICs for the U.S. Dollar denominated and Euro denominated feeder funds is driven by the U.S. GAAP mark-to-market reporting of the foreign currency hedging program in the U.S. Dollar denominated feeder fund. The feeder fund is expected to hold the foreign currency hedges until maturity, and therefore is expected to ultimately recognize a gain while mitigating the currency risk associated with the initial principal investments. E.U. IV is made up of two parallel funds, one denominated in Euros and one denominated in U.S. Dollars. The gross and net MoIC presented in the chart are for the U.S. dollar-denominated fund. The gross and net MoIC for the Euro fund are 1.1x and 1.0x, respectively. Original capital commitments are converted to U.S. Dollars at the prevailing exchange rate at the time of fund’s closing. All other values for E.U. IV are for the combined fund and are converted to U.S. Dollars at the prevailing quarter-end exchange rate. 29
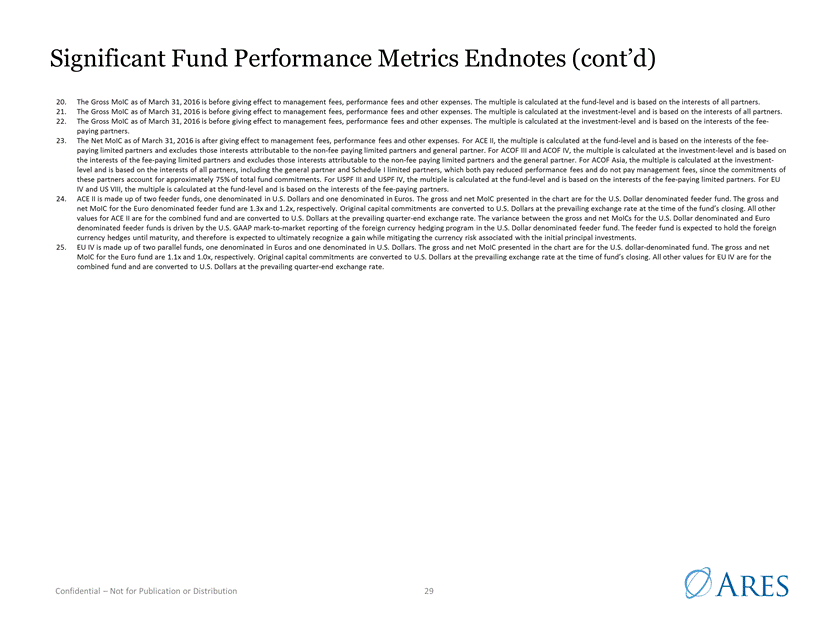
Weighted Average Unit Information Q1-16 Q4-15 GAAP Units Adjusted Common Units GAAP Units Adjusted Common Units Ares Management, L.P. Common Units Outstanding 80,683,051 80,683,051 80,678,042 80,678,042 Ares Operating Group Units Exchangeable into Common Units(1) 132,382,815 - 132,405,131 - Dilutive Effect of Unvested Restricted Common Units(2)(3) 489,691 185,435 685,353 259,475 Total Pro Forma Units 213,555,557 80,868,486 213,768,526 80,937,517 1. 2. 3. Represents units exchangeable for Ares Management, L.P. common units on a one-for-one basis. We apply the treasury stock method to determine the dilutive weighted-average common units represented by our restricted stock to be settled in common units and options to acquire common units. Under the treasury stock method, compensation expense attributed to future services and not yet recognized is presumed to be used to acquire outstanding common units, thus reducing the weighted-average number of units and the dilutive effect of these awards. Represents proportional dilutive impact based upon the percentage of Ares Operating Group owned by Ares Management, L.P. (37.87% and 37.86% as of March 31, 2016 and December 31, 2015, respectively). 30
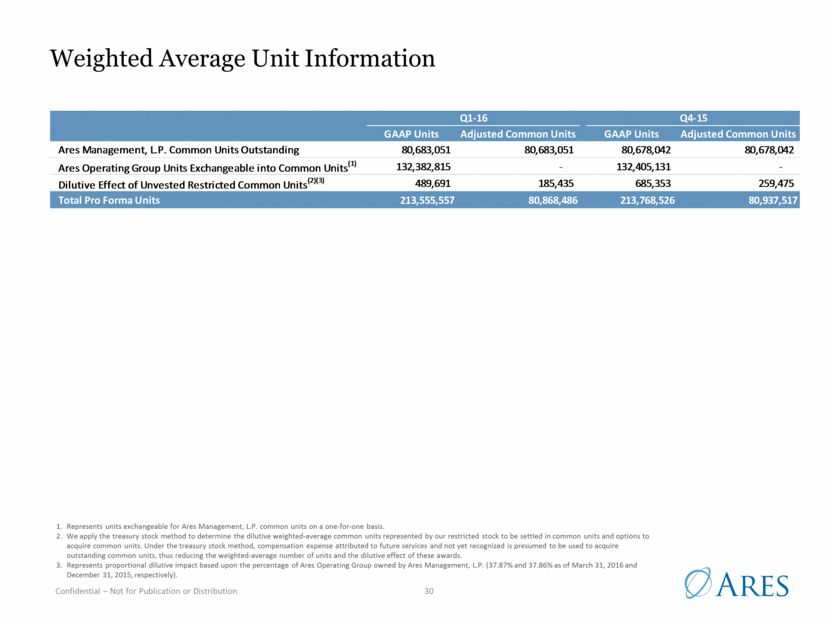
Recent Developments and Additional Information Recent Developments Targeted Net Returns(1) Capital Base by Duration(1) On April 21, 2016, we held the final closing for our fifth global flexible capital private equity fund, Ares Corporate Opportunities Fund V, bringing total commitments to $7.85 billion (including $35 million in Q2-16), above our target of $6.5 billion and compared to $4.7 billion for the predecessor fund Credit Group: Bank Loans and High Yield Bonds: Benchmark Outperformance(2) Credit Opportunities: 8-12% Asset-Backed: 5-15% Direct Lending: 5-15%(5) Special Situations: 15-20% Real Estate Group: Real Estate Debt: 5-12% Real Estate Equity: 12-18% Private Equity Group: North American/European Flexible Capital: 18-22% U.S. Power and Energy Infrastructure: 15-17% Permanent Capital: 13.0% 10 or more years: 14.9% 7 to 9 years: 29.3% 3 to 6 years: 21.8% Fewer than 3 years: 6.2% Managed Accounts: 14.8% Public Entity & Related: 22% 375+ institutional investors(3) 235,000+ retail investors across our public funds(4) Institutional Intermediated: 15% Institutional Direct: 63% Pension: 28% SWF: 10% Bank/Private Bank: 6% Investment Manager: 3% Insurance: 8% Endowment: 2% Other: 5% Total Direct Institutional Investors: 685 No assurance can be made that such results will be achieved. As of March 31, 2016, unless otherwise noted. Ares bank loan and high yield strategies are typically benchmarked against the Credit Suisse Leveraged Loan Index (“CSLLI”) and the BofA Merrill Lynch US High Yield Master II Index (“H0A0”), respectively. While the other credit strategies cited above are absolute return focused, our bank loan and high yield funds seek to outperform these respective indices over market cycles. Q1-16 returns for the CSLLI and the H0A0 were 1.33% and 3.25%, respectively. NOTE: certain of Ares funds are not benchmarked against any particular index due to fund specific portfolio constraints. As of December 31, 2015. As of February 19, 2016 for ARCC and ACRE and June 12, 2015 for ARDC. Includes funds managed or co-managed by Ares. Also includes funds managed by Ivy Hill Asset Management, L.P. (IHAM), a wholly owned portfolio company of ARCC, and a registered investment adviser. Investor Base as % of AUM(1) 31
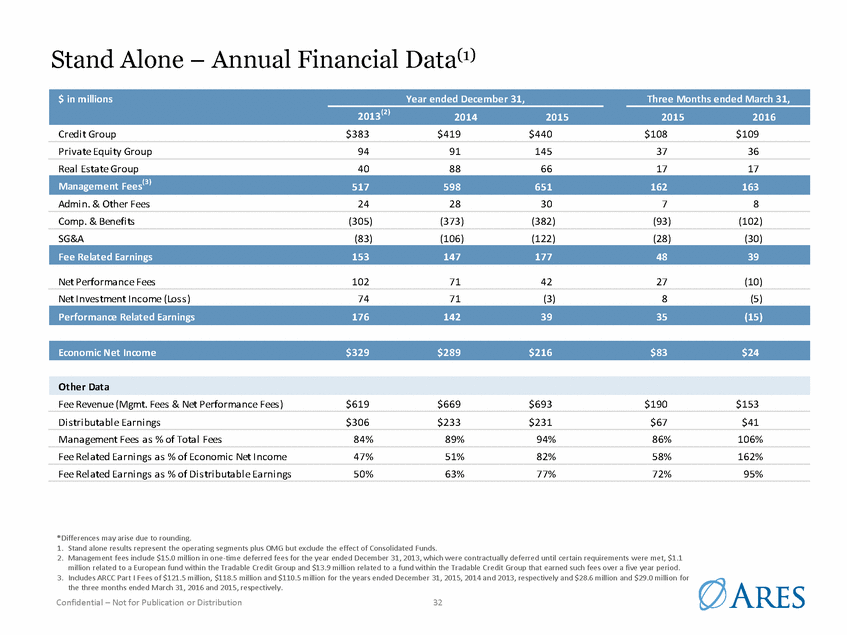
Data(1) Stand Alone – Annual Financial Credi t Group $383 $419 $440 $108 $109 Pri vate Equi ty Group 94 91 145 37 36 Real Es tate Group 40 88 66 17 17 Admi n. & Other Fees 24 28 30 7 8 Comp. & Benefi ts (305) (373) (382) (93) (102) SG&A (83) (106) (122) (28) (30) Net Performance Fees 102 71 42 27 (10) Net Inves tment Income (Los s ) 74 71 (3) 8 (5) Fee Revenue (Mgmt. Fees & Net Performance Fees ) $619 $669 $693 $190 $153 Di s tri butabl e Earni ngs $306 $233 $231 $67 $41 Management Fees as % of Total Fees 84% 89% 94% 86% 106% Fee Rel ated Earni ngs as % of Economi c Net Income 47% 51% 82% 58% 162% Fee Rel ated Earni ngs as % of Di s tri butabl e Earni ngs 50% 63% 77% 72% 95% *Differences may arise due to rounding. 1. Stand alone results represent the operating segments plus OMG but exclude the effect of Consolidated Funds. 2. Management fees include $15.0 million in one-time deferred fees for the year ended December 31, 2013, which were contractually deferred until certain requirements were met, $1.1 million related to a European fund within the Tradable Credit Group and $13.9 million related to a fund within the Tradable Credit Group that earned such fees over a five year period. 3. Includes ARCC Part I Fees of $121.5 million, $118.5 million and $110.5 million for the years ended December 31, 2015, 2014 and 2013, respectively and $28.6 million and $29.0 million for the three months ended March 31, 2016 and 2015, respectively. Confidential – Not for Publication or Distribution 32 Other Data Economic Net Income$329$289$216$83$24 Performance Related Earnings1761423935(15) Fee Related Earnings1531471774839 Management Fees(3)517598651162163 $ in millionsYear ended December 31, 2013(2)20142015 Three Months ended March 31, 20152016
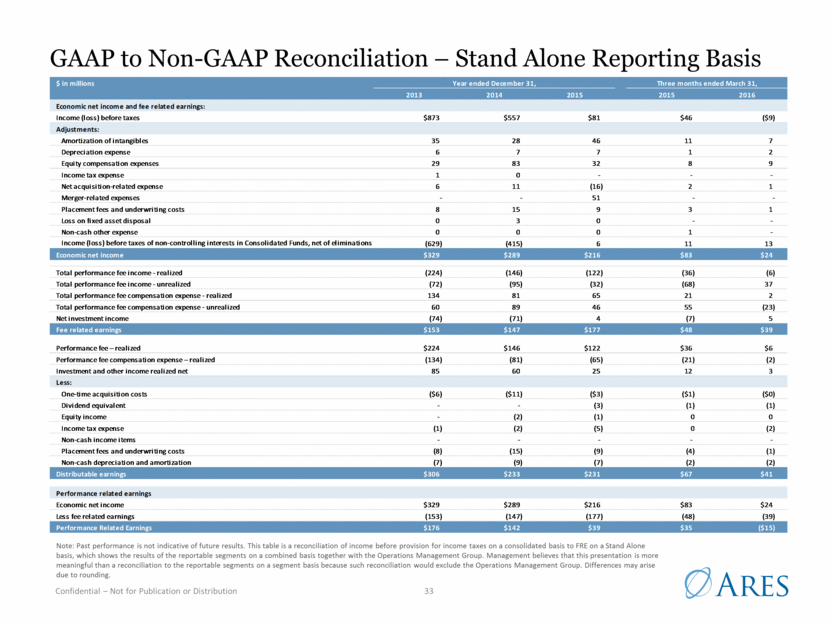
GAAP to Non-GAAP Reconciliation – Stand Alone Reporting Basis $ in millions Year ended December 31, Three months ended March 31, 2013 2014 2015 2015 2016 Economic net income and fee related earnings: Income (loss) before taxes $873 $557 $81 $46 ($9) Adjustments: Amortization of intangibles 35 28 46 11 7 Depreciation expense 6 7 7 1 2 Equity compensation expenses 29 83 32 8 9 Income tax expense 1 0 - - - Net acquisition-related expense 6 11 (16) 2 1 Merger-related expenses - - 51 - - Placement fees and underwriting costs 8 15 9 3 1 Loss on fixed asset disposal 0 3 0 - - Non-cash other expense 0 0 0 1 - Income (loss) before taxes of non-controlling interests in Consolidated Funds, net of eliminations (629) (415) 6 11 13 Economic net income $329 $289 $216 $83 $24 Total performance fee income - realized (224) (146) (122) (36) (6) Total performance fee income - unrealized (72) (95) (32) (68) 37 Total performance fee compensation expense - realized 134 81 65 21 2 Total performance fee compensation expense - unrealized 60 89 46 55 (23) Net investment income (74) (71) 4 (7) 5 Fee related earnings $153 $147 $177 $48 $39 Performance fee – realized $224 $146 $122 $36 $6 Performance fee compensation expense – realized (134) (81) (65) (21) (2) Investment and other income realized net 85 60 25 12 3 Less: One-time acquisition costs ($6) ($11) ($3) ($1) ($0) Dividend equivalent - - (3) (1) (1) Equity income - (2) (1) 0 0 Income tax expense (1) (2) (5) 0 (2) Non-cash income items - - - - - Placement fees and underwriting costs (8) (15) (9) (4) (1) Non-cash depreciation and amortization (7) (9) (7) (2) (2) Distributable earnings $306 $233 $231 $67 $41 Performance related earnings Economic net income $329 $289 $216 $83 $24 Less fee related earnings (153) (147) (177) (48) (39) Performance Related Earnings $176 $142 $39 $35 ($15) Note: Past performance is not indicative of future results. This table is a reconciliation of income before provision for income taxes on a consolidated basis to FRE on a Stand Alone basis, which shows the results of the reportable segments on a combined basis together with the Operations Management Group. Management believes that this presentation is more meaningful than a reconciliation to the reportable segments on a segment basis because such reconciliation would exclude the Operations Management Group. Differences may arise due to rounding. 33
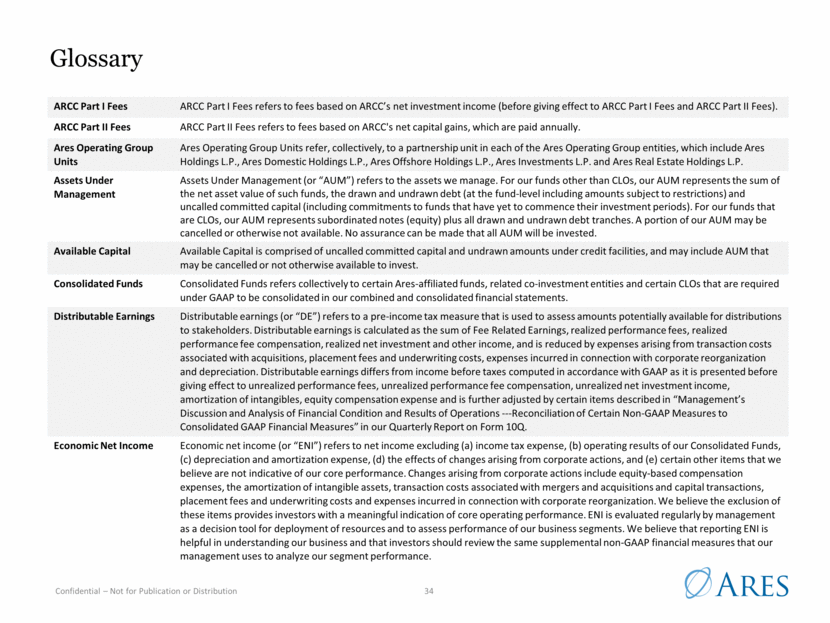
Glossary ARCC Part I Fees ARCC Part I Fees refers to fees based on ARCC’s net investment income (before giving effect to ARCC Part I Fees and ARCC Part II Fees). ARCC Part II Fees ARCC Part II Fees refers to fees based on ARCC's net capital gains, which are paid annually. Ares Operating Group Units Ares Operating Group Units refer, collectively, to a partnership unit in each of the Ares Operating Group entities, which include Ares Holdings L.P., Ares Domestic Holdings L.P., Ares Offshore Holdings L.P., Ares Investments L.P. and Ares Real Estate Holdings L.P. Assets Under Management Assets Under Management (or “AUM”) refers to the assets we manage. For our funds other than CLOs, our AUM represents the sum of the net asset value of such funds, the drawn and undrawn debt (at the fund-level including amounts subject to restrictions) and uncalled committed capital (including commitments to funds that have yet to commence their investment periods). For our funds that are CLOs, our AUM represents subordinated notes (equity) plus all drawn and undrawn debt tranches. A portion of our AUM may be cancelled or otherwise not available. No assurance can be made that all AUM will be invested. Available Capital Available Capital is comprised of uncalled committed capital and undrawn amounts under credit facilities, and may include AUM that may be cancelled or not otherwise available to invest. Consolidated Funds Consolidated Funds refers collectively to certain Ares-affiliated funds, related co-investment entities and certain CLOs that are required under GAAP to be consolidated in our combined and consolidated financial statements. Distributable Earnings Distributable earnings (or “DE”) refers to a pre-income tax measure that is used to assess amounts potentially available for distributions to stakeholders. Distributable earnings is calculated as the sum of Fee Related Earnings, realized performance fees, realized performance fee compensation, realized net investment and other income, and is reduced by expenses arising from transaction costs associated with acquisitions, placement fees and underwriting costs, expenses incurred in connection with corporate reorganization and depreciation. Distributable earnings differs from income before taxes computed in accordance with GAAP as it is presented before giving effect to unrealized performance fees, unrealized performance fee compensation, unrealized net investment income, amortization of intangibles, equity compensation expense and is further adjusted by certain items described in “Management’s Discussion and Analysis of Financial Condition and Results of Operations ---Reconciliation of Certain Non-GAAP Measures to Consolidated GAAP Financial Measures” in our Quarterly Report on Form 10Q. Economic Net Income Economic net income (or “ENI”) refers to net income excluding (a) income tax expense, (b) operating results of our Consolidated Funds, (c) depreciation and amortization expense, (d) the effects of changes arising from corporate actions, and (e) certain other items that we believe are not indicative of our core performance. Changes arising from corporate actions include equity-based compensation expenses, the amortization of intangible assets, transaction costs associated with mergers and acquisitions and capital transactions, placement fees and underwriting costs and expenses incurred in connection with corporate reorganization. We believe the exclusion of these items provides investors with a meaningful indication of core operating performance. ENI is evaluated regularly by management as a decision tool for deployment of resources and to assess performance of our business segments. We believe that reporting ENI is helpful in understanding our business and that investors should review the same supplemental non-GAAP financial measures that our management uses to analyze our segment performance. 34
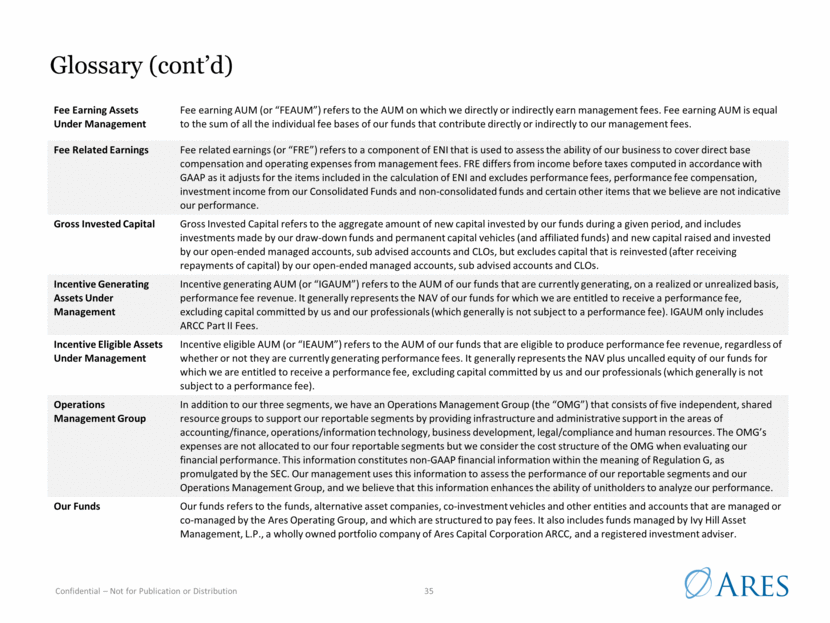
Glossary (cont’d) Fee Earning Assets Under Management Fee earning AUM (or “FEAUM”) refers to the AUM on which we directly or indirectly earn management fees. Fee earning AUM is equal to the sum of all the individual fee bases of our funds that contribute directly or indirectly to our management fees. Fee Related Earnings Fee related earnings (or “FRE”) refers to a component of ENI that is used to assess the ability of our business to cover direct base compensation and operating expenses from management fees. FRE differs from income before taxes computed in accordance with GAAP as it adjusts for the items included in the calculation of ENI and excludes performance fees, performance fee compensation, investment income from our Consolidated Funds and non-consolidated funds and certain other items that we believe are not indicative our performance. Gross Invested Capital Gross Invested Capital refers to the aggregate amount of new capital invested by our funds during a given period, and includes investments made by our draw-down funds and permanent capital vehicles (and affiliated funds) and new capital raised and invested by our open-ended managed accounts, sub advised accounts and CLOs, but excludes capital that is reinvested (after receiving repayments of capital) by our open-ended managed accounts, sub advised accounts and CLOs. Incentive Generating Assets Under Management Incentive generating AUM (or “IGAUM”) refers to the AUM of our funds that are currently generating, on a realized or unrealized basis, performance fee revenue. It generally represents the NAV of our funds for which we are entitled to receive a performance fee, excluding capital committed by us and our professionals (which generally is not subject to a performance fee). IGAUM only includes ARCC Part II Fees. Incentive Eligible Assets Under Management Incentive eligible AUM (or “IEAUM”) refers to the AUM of our funds that are eligible to produce performance fee revenue, regardless of whether or not they are currently generating performance fees. It generally represents the NAV plus uncalled equity of our funds for which we are entitled to receive a performance fee, excluding capital committed by us and our professionals (which generally is not subject to a performance fee). Operations Management Group In addition to our three segments, we have an Operations Management Group (the “OMG”) that consists of five independent, shared resource groups to support our reportable segments by providing infrastructure and administrative support in the areas of accounting/finance, operations/information technology, business development, legal/compliance and human resources. The OMG’s expenses are not allocated to our four reportable segments but we consider the cost structure of the OMG when evaluating our financial performance. This information constitutes non-GAAP financial information within the meaning of Regulation G, as promulgated by the SEC. Our management uses this information to assess the performance of our reportable segments and our Operations Management Group, and we believe that this information enhances the ability of unitholders to analyze our performance. Our Funds Our funds refers to the funds, alternative asset companies, co-investment vehicles and other entities and accounts that are managed or co-managed by the Ares Operating Group, and which are structured to pay fees. It also includes funds managed by Ivy Hill Asset Management, L.P., a wholly owned portfolio company of Ares Capital Corporation ARCC, and a registered investment adviser. 35
Glossary (cont’d) Performance Related Earnings Performance related earnings (or “PRE”) refers to a measure used to assess our investment performance and our ability to cover performance fee compensation from performance fees and total investment income. PRE differs from income (loss) before taxes computed in accordance with GAAP as it only includes performance fees, performance fee compensation and total investment and other income earned from our Consolidated Funds and non-consolidated funds. Permanent Capital Permanent capital refers to capital of our funds that do not have redemption provisions or a requirement to return capital to investors upon exiting the investments made with such capital, except as required by applicable law, which funds currently consist of Ares Capital Corporation (“ARCC”), Ares Commercial Real Estate Corporation (“ACRE”), and Ares Dynamic Credit Allocation Fund, Inc. (“ARDC”); such funds may be required, or elect, to return all or a portion of capital gains and investment income. Senior Secured Loan Fund LLC Senior Secured Loan Fund LLC (or “SSLP”) is a program co-managed by a subsidiary of Ares through which ARCC co-invests with affiliates of General Electric Company. Total Fee Revenue Total fee revenue refers to the sum of segment management fees and net performance fees. 36
