Attached files
| file | filename |
|---|---|
| EX-31.2 - EXHIBIT 31.2 - EZCORP INC | a2016-q210qxex312_3312016.htm |
| EX-31.1 - EXHIBIT 31.1 - EZCORP INC | a2016-q210qxex311_3312016.htm |
| EX-32.1 - EXHIBIT 32.1 - EZCORP INC | a2016-q210qxex321_3312016.htm |
UNITED STATES
SECURITIES AND EXCHANGE COMMISSION
WASHINGTON, DC 20549
FORM 10-Q
x | QUARTERLY REPORT PURSUANT TO SECTION 13 OR 15(d) OF THE SECURITIES EXCHANGE ACT OF 1934 |
For the quarterly period ended March 31, 2016
or
¨ | TRANSITION REPORT PURSUANT TO SECTION 13 OR 15(d) OF THE SECURITIES EXCHANGE ACT OF 1934 |
For the transition period from to
Commission File No. 0-19424

EZCORP, INC.
(Exact name of registrant as specified in its charter)
Delaware | 74-2540145 |
(State or other jurisdiction of incorporation or organization) | (I.R.S. Employer Identification No.) |
2500 Bee Cave Road, Rollingwood, Texas | 78746 |
(Address of principal executive offices) | (Zip Code) |
Registrant’s telephone number, including area code: (512) 314-3400
Indicate by check mark whether the registrant (1) has filed all reports required to be filed by Section 13 or 15(d) of the Securities Exchange Act of 1934 during the preceding 12 months (or for such shorter period that the registrant was required to file such reports), and (2) has been subject to such filing requirements for the past 90 days. Yes x No ¨
Indicate by check mark whether the registrant has submitted electronically and posted on its corporate Web site, if any, every Interactive Data File required to be submitted and posted pursuant to Rule 405 of Regulation S-T (§232.405 of this chapter) during the preceding 12 months (or for such shorter period that the registrant was required to submit and post such files). Yes x No ¨
Indicate by check mark whether the registrant is a large accelerated filer, an accelerated filer, a non-accelerated filer, or a smaller reporting company. See definition of “large accelerated filer,” “accelerated filer” and “smaller reporting company” in Rule 12b-2 of the Exchange Act.
Large accelerated filer | ¨ | Accelerated filer | x |
Non-accelerated filer | ¨ (Do not check if a smaller reporting company) | Smaller reporting company | ¨ |
Indicate by check mark whether the registrant is a shell company (as defined in Rule 12b-2 of the Exchange Act). Yes ¨ No x
APPLICABLE ONLY TO CORPORATE ISSUERS:
The only class of voting securities of the registrant issued and outstanding is the Class B Voting Common Stock, par value $.01 per share, all of which is owned by an affiliate of the registrant. There is no trading market for the Class B Voting Common Stock.
As of May 2, 2016, 50,976,110 shares of the registrant’s Class A Non-voting Common Stock, par value $.01 per share, and 2,970,171 shares of the registrant’s Class B Voting Common Stock, par value $.01 per share, were outstanding.
EZCORP, Inc.
INDEX TO FORM 10-Q
PART I — FINANCIAL INFORMATION
ITEM 1. FINANCIAL STATEMENTS
EZCORP, Inc. CONDENSED CONSOLIDATED BALANCE SHEETS (in thousands, except share and per share amounts) | |||||||||||
March 31, 2016 | March 31, 2015 | September 30, 2015 | |||||||||
(Unaudited) | |||||||||||
Assets: | |||||||||||
Current assets: | |||||||||||
Cash and cash equivalents | $ | 75,336 | $ | 138,173 | $ | 59,124 | |||||
Restricted cash | 13,817 | 47,909 | 15,137 | ||||||||
Pawn loans | 140,195 | 127,929 | 159,964 | ||||||||
Consumer loans, net | 26,362 | 55,529 | 36,533 | ||||||||
Pawn service charges receivable, net | 27,626 | 24,909 | 30,852 | ||||||||
Consumer loan fees and interest receivable, net | 13,226 | 13,063 | 19,802 | ||||||||
Inventory, net | 126,446 | 116,144 | 124,084 | ||||||||
Income taxes receivable | 557 | 52,234 | 45,175 | ||||||||
Prepaid expenses and other current assets | 32,505 | 32,383 | 21,076 | ||||||||
Total current assets | 456,070 | 608,273 | 511,747 | ||||||||
Investment in unconsolidated affiliate | 56,677 | 94,510 | 56,182 | ||||||||
Property and equipment, net | 64,962 | 102,252 | 75,594 | ||||||||
Restricted cash, non-current | 2,308 | 2,880 | 2,883 | ||||||||
Goodwill | 254,782 | 344,931 | 327,460 | ||||||||
Intangible assets, net | 40,197 | 49,674 | 41,263 | ||||||||
Non-current consumer loans, net | 62,673 | 79,860 | 75,824 | ||||||||
Deferred tax asset, net | 77,125 | 35,213 | 69,121 | ||||||||
Other assets, net | 19,655 | 60,041 | 42,985 | ||||||||
Total assets (1)(3) | $ | 1,034,449 | $ | 1,377,634 | $ | 1,203,059 | |||||
Liabilities, temporary equity and equity: | |||||||||||
Current liabilities: | |||||||||||
Current maturities of long-term debt | $ | 82,174 | $ | 71,471 | $ | 74,345 | |||||
Current capital lease obligations | — | 93 | — | ||||||||
Accounts payable and other accrued expenses | 85,836 | 89,711 | 107,871 | ||||||||
Other current liabilities | 2,595 | 6,230 | 15,384 | ||||||||
Customer layaway deposits | 11,370 | 10,484 | 10,470 | ||||||||
Income taxes payable | 6,632 | — | — | ||||||||
Total current liabilities | 188,607 | 177,989 | 208,070 | ||||||||
Long-term debt, less current maturities, net | 252,808 | 344,960 | 297,166 | ||||||||
Deferred gains and other long-term liabilities | 2,751 | 7,673 | 6,157 | ||||||||
Total liabilities (2)(4) | 444,166 | 530,622 | 511,393 | ||||||||
Commitments and contingencies (Note 11) | |||||||||||
Temporary equity: | |||||||||||
Class A Non-voting Common Stock, subject to possible redemption at $10.06 per share; none as of March 31, 2016 and 1,168,456 shares issued and outstanding at redemption value as of March 31, 2015 and September 30, 2015 | — | 11,696 | 11,696 | ||||||||
Redeemable noncontrolling interest | (1,229 | ) | 16,827 | 3,235 | |||||||
Total temporary equity | (1,229 | ) | 28,523 | 14,931 | |||||||
Stockholders’ equity: | |||||||||||
Class A Non-voting Common Stock, par value $.01 per share; shares authorized: 100 million as of March 31, 2016 and 2015 and September 30, 2015; issued and outstanding: 50,989,430 as of March 31, 2016; 50,681,477 as of March 31, 2015; and 50,726,289 as of September 30, 2015 | 510 | 506 | 507 | ||||||||
Class B Voting Common Stock, convertible, par value $.01 per share; 3 million shares authorized; issued and outstanding: 2,970,171 | 30 | 30 | 30 | ||||||||
Additional paid-in capital | 312,569 | 329,973 | 307,080 | ||||||||
Retained earnings | 341,538 | 522,541 | 423,137 | ||||||||
Accumulated other comprehensive loss | (62,805 | ) | (34,561 | ) | (54,019 | ) | |||||
EZCORP, Inc. stockholders’ equity | 591,842 | 818,489 | 676,735 | ||||||||
Noncontrolling interest | (330 | ) | — | — | |||||||
Total equity | 591,512 | 818,489 | 676,735 | ||||||||
Total liabilities, temporary equity and equity | $ | 1,034,449 | $ | 1,377,634 | $ | 1,203,059 | |||||
See accompanying notes to unaudited interim condensed consolidated financial statements.
1
Assets and Liabilities of Consolidated Variable Interest Entities (See Note 16)
(1) Our consolidated assets as of March 31, 2016 and 2015 and September 30, 2015 include the following assets of our consolidated variable interest entities:
March 31, 2016 | March 31, 2015 | September 30, 2015 | |||||||||
(Unaudited) | |||||||||||
(in thousands) | |||||||||||
Restricted cash | $ | 397 | $ | 2,084 | $ | 1,361 | |||||
Consumer loans, net | 6,607 | 14,826 | 5,846 | ||||||||
Consumer loan fees and interest receivable, net | 3,559 | 3,577 | 6,399 | ||||||||
Non-current consumer loans, net | 17,245 | 32,511 | 27,162 | ||||||||
Total assets | $ | 27,808 | $ | 52,998 | $ | 40,768 | |||||
(2) Our consolidated liabilities as of March 31, 2016 and 2015 and September 30, 2015 include the following liabilities of our consolidated variable interest entities:
March 31, 2016 | March 31, 2015 | September 30, 2015 | ||||||||||
(Unaudited) | ||||||||||||
(in thousands) | ||||||||||||
Accounts payable and other accrued expenses | $ | 6,065 | $ | 3,153 | $ | 4,313 | ||||||
Current maturities of long-term debt | 37,177 | 48,246 | 42,017 | * | ||||||||
Long-term debt, less current maturities | 13,704 | 51,888 | 31,247 | * | ||||||||
Total liabilities | $ | 56,946 | $ | 103,287 | $ | 77,577 | ||||||
* | This amount has been revised from the originally filed amount due to an immaterial reclassification error between current and non-current amounts as of September 30, 2015. The consolidated amounts previously reported in the balance sheet were correct. |
Assets and Liabilities of Grupo Finmart Securitization Trust (See Note 16)
(3) Our consolidated assets as of March 31, 2016 and 2015 and September 30, 2015 include the following assets of Grupo Finmart's securitization trust that can only be used to settle its liabilities:
March 31, 2016 | March 31, 2015 | September 30, 2015 | |||||||||
(Unaudited) | |||||||||||
(in thousands) | |||||||||||
Restricted cash | $ | 4,869 | $ | 21,835 | $ | 12,033 | |||||
Consumer loans* | 39,453 | 34,803 | 36,845 | ||||||||
Consumer loan fees and interest receivable, net | 7,424 | 5,182 | 6,067 | ||||||||
Restricted cash, non-current | 196 | 119 | 197 | ||||||||
Total assets | $ | 51,942 | $ | 61,939 | $ | 55,142 | |||||
* | These amounts include the current and non-current portions of active consumer loans considered to be performing under the terms of the Grupo Finmart securitization trust. These balances, which represent the total collateral that can be used to settle the liabilities of the securitization trust, exclude loan loss allowances as described in Note 13, and are presented on a net basis in the condensed consolidated balance sheets including allowances. |
(4) Our consolidated liabilities as of March 31, 2016 and 2015 and September 30, 2015 include the following liabilities for which the creditors of Grupo Finmart's securitization trust do not have recourse to the general credit of EZCORP, Inc.:
March 31, 2016 | March 31, 2015 | September 30, 2015 | |||||||||
(Unaudited) | |||||||||||
(in thousands) | |||||||||||
Long-term debt, less current maturities | $ | 33,613 | $ | 44,837 | $ | 40,493 | |||||
See accompanying notes to unaudited interim condensed consolidated financial statements.
2
EZCORP, Inc. CONDENSED CONSOLIDATED STATEMENTS OF OPERATIONS | |||||||||||||||
Three Months Ended March 31, | Six Months Ended March 31, | ||||||||||||||
2016 | 2015 | 2016 | 2015 | ||||||||||||
(Unaudited) | |||||||||||||||
(in thousands, except per share amounts) | |||||||||||||||
Revenues: | |||||||||||||||
Merchandise sales | $ | 109,343 | $ | 107,852 | $ | 217,927 | $ | 217,491 | |||||||
Jewelry scrapping sales | 12,780 | 18,399 | 22,401 | 36,933 | |||||||||||
Pawn service charges | 64,130 | 59,470 | 130,724 | 124,397 | |||||||||||
Consumer loan fees and interest | 15,616 | 18,544 | 28,804 | 37,515 | |||||||||||
Other revenues | 30 | 910 | 497 | 1,565 | |||||||||||
Total revenues | 201,899 | 205,175 | 400,353 | 417,901 | |||||||||||
Merchandise cost of goods sold | 68,332 | 72,492 | 134,591 | 144,970 | |||||||||||
Jewelry scrapping cost of goods sold | 11,085 | 14,354 | 19,161 | 29,029 | |||||||||||
Consumer loan bad debt | 8,683 | 4,761 | 21,286 | 13,276 | |||||||||||
Net revenues | 113,799 | 113,568 | 225,315 | 230,626 | |||||||||||
Operating expenses: | |||||||||||||||
Operations | 80,282 | 77,190 | 165,888 | 157,277 | |||||||||||
Administrative | 15,621 | 14,800 | 35,604 | 27,352 | |||||||||||
Depreciation and amortization | 7,082 | 8,095 | 15,141 | 16,103 | |||||||||||
Loss on sale or disposal of assets | 649 | 387 | 682 | 643 | |||||||||||
Restructuring | 218 | 704 | 1,910 | 726 | |||||||||||
Total operating expenses | 103,852 | 101,176 | 219,225 | 202,101 | |||||||||||
Operating income | 9,947 | 12,392 | 6,090 | 28,525 | |||||||||||
Interest expense | 8,449 | 11,296 | 17,641 | 23,330 | |||||||||||
Interest income | (127 | ) | (512 | ) | (267 | ) | (1,043 | ) | |||||||
Equity in net (income) loss of unconsolidated affiliate | (1,877 | ) | 3,678 | (3,932 | ) | 1,484 | |||||||||
Impairment of goodwill | 73,921 | — | 73,921 | — | |||||||||||
Other expense | 89 | 1,862 | 959 | 2,621 | |||||||||||
(Loss) income from continuing operations before income taxes | (70,508 | ) | (3,932 | ) | (82,232 | ) | 2,133 | ||||||||
Income tax expense | 6,189 | 362 | 2,493 | 3,626 | |||||||||||
Loss from continuing operations, net of tax | (76,697 | ) | (4,294 | ) | (84,725 | ) | (1,493 | ) | |||||||
(Loss) income from discontinued operations, net of tax | (1,094 | ) | 4,731 | (1,332 | ) | 11,608 | |||||||||
Net (loss) income | (77,791 | ) | 437 | (86,057 | ) | 10,115 | |||||||||
Net loss from continuing operations attributable to noncontrolling interest | (3,666 | ) | (906 | ) | (4,458 | ) | (2,840 | ) | |||||||
Net (loss) income attributable to EZCORP, Inc. | $ | (74,125 | ) | $ | 1,343 | $ | (81,599 | ) | $ | 12,955 | |||||
Basic (loss) earnings per share attributable to EZCORP, Inc.: | |||||||||||||||
Continuing operations | $ | (1.33 | ) | $ | (0.06 | ) | $ | (1.46 | ) | $ | 0.02 | ||||
Discontinued operations | (0.02 | ) | 0.09 | (0.02 | ) | 0.22 | |||||||||
Basic (loss) earnings per share | $ | (1.35 | ) | $ | 0.03 | $ | (1.48 | ) | $ | 0.24 | |||||
Diluted (loss) earnings per share attributable to EZCORP, Inc.: | |||||||||||||||
Continuing operations | $ | (1.33 | ) | $ | (0.06 | ) | $ | (1.46 | ) | $ | 0.02 | ||||
Discontinued operations | (0.02 | ) | 0.09 | (0.02 | ) | 0.22 | |||||||||
Diluted (loss) earnings per share | $ | (1.35 | ) | $ | 0.03 | $ | (1.48 | ) | $ | 0.24 | |||||
Weighted-average shares outstanding: | |||||||||||||||
Basic | 54,843 | 54,184 | 54,869 | 53,915 | |||||||||||
Diluted | 54,843 | 54,184 | 54,869 | 53,972 | |||||||||||
Net (loss) income from continuing operations attributable to EZCORP, Inc. | $ | (73,031 | ) | $ | (3,388 | ) | $ | (80,267 | ) | $ | 1,347 | ||||
Net (loss) income from discontinued operations attributable to EZCORP, Inc. | (1,094 | ) | 4,731 | (1,332 | ) | 11,608 | |||||||||
Net (loss) income attributable to EZCORP, Inc. | $ | (74,125 | ) | $ | 1,343 | $ | (81,599 | ) | $ | 12,955 | |||||
See accompanying notes to unaudited interim condensed consolidated financial statements.
3
EZCORP, Inc. CONDENSED CONSOLIDATED STATEMENTS OF COMPREHENSIVE LOSS | |||||||||||||||
Three Months Ended March 31, | Six Months Ended March 31, | ||||||||||||||
2016 | 2015 | 2016 | 2015 | ||||||||||||
(Unaudited) | |||||||||||||||
(in thousands) | |||||||||||||||
Net (loss) income | $ | (77,791 | ) | $ | 437 | $ | (86,057 | ) | $ | 10,115 | |||||
Other comprehensive income (loss): | |||||||||||||||
Foreign currency translation loss, net of income tax (expense) benefit for our investment in unconsolidated affiliate of ($752) and $1,851 for the three and six-months ended March 31, 2016, respectively, and ($199) and $220 for the three and six-months ended March 31, 2015, respectively | (2,204 | ) | (6,897 | ) | (9,144 | ) | (27,999 | ) | |||||||
Cash flow hedges: | |||||||||||||||
Amounts reclassified from accumulated other comprehensive loss | — | 35 | 22 | 387 | |||||||||||
Other comprehensive loss, net of tax | (2,204 | ) | (6,862 | ) | (9,122 | ) | (27,612 | ) | |||||||
Comprehensive loss | $ | (79,995 | ) | $ | (6,425 | ) | $ | (95,179 | ) | $ | (17,497 | ) | |||
Attributable to noncontrolling interest: | |||||||||||||||
Net loss | (3,666 | ) | (906 | ) | (4,458 | ) | (2,840 | ) | |||||||
Foreign currency translation loss | (272 | ) | (825 | ) | (337 | ) | (3,227 | ) | |||||||
Amounts reclassified from accumulated other comprehensive loss | — | 8 | 1 | 94 | |||||||||||
Comprehensive loss attributable to noncontrolling interest | (3,938 | ) | (1,723 | ) | (4,794 | ) | (5,973 | ) | |||||||
Comprehensive loss attributable to EZCORP, Inc. | $ | (76,057 | ) | $ | (4,702 | ) | $ | (90,385 | ) | $ | (11,524 | ) | |||
See accompanying notes to unaudited interim condensed consolidated financial statements.
4
EZCORP, Inc. CONDENSED CONSOLIDATED STATEMENTS OF CASH FLOWS | |||||||
Six Months Ended March 31, | |||||||
2016 | 2015 | ||||||
(Unaudited) | |||||||
(in thousands) | |||||||
Operating activities: | |||||||
Net (loss) income | $ | (86,057 | ) | $ | 10,115 | ||
Adjustments to reconcile net (loss) income to net cash provided by operating activities: | |||||||
Depreciation and amortization | 15,141 | 18,097 | |||||
Amortization of debt discount and consumer loan premium, net | 4,357 | 4,229 | |||||
Consumer loan loss provision | 18,662 | 14,023 | |||||
Deferred income taxes | (8,004 | ) | (5,536 | ) | |||
Impairment of goodwill | 73,921 | — | |||||
Amortization of deferred financing costs | 1,575 | 2,625 | |||||
Amortization of prepaid commissions | 7,754 | 6,200 | |||||
Other adjustments | (2,149 | ) | 380 | ||||
Loss on sale or disposal of assets | 682 | 950 | |||||
Stock compensation expense (benefit) | 2,149 | (1,928 | ) | ||||
(Income) loss from investment in unconsolidated affiliate | (3,932 | ) | 1,484 | ||||
Changes in operating assets and liabilities, net of business acquisitions: | |||||||
Service charges and fees receivable | 10,140 | 2,542 | |||||
Inventory | (993 | ) | 2,499 | ||||
Prepaid expenses, other current assets and other assets | (5,935 | ) | (16,949 | ) | |||
Accounts payable, other accrued expenses, deferred gains and other long-term liabilities | (12,112 | ) | (5,925 | ) | |||
Customer layaway deposits | 851 | 1,947 | |||||
Restricted cash | (4,860 | ) | (835 | ) | |||
Income taxes receivable | 51,250 | 4,427 | |||||
Payments of restructuring charges | (6,701 | ) | (2,962 | ) | |||
Dividends from unconsolidated affiliate | — | 2,407 | |||||
Net cash provided by operating activities | 55,739 | 37,790 | |||||
Investing activities: | |||||||
Loans made | (323,980 | ) | (417,014 | ) | |||
Loans repaid | 225,138 | 334,888 | |||||
Recovery of pawn loan principal through sale of forfeited collateral | 121,830 | 138,885 | |||||
Additions to property and equipment | (2,976 | ) | (15,934 | ) | |||
Acquisitions, net of cash acquired | (6,000 | ) | (4,750 | ) | |||
Investment in unconsolidated affiliate | — | (12,140 | ) | ||||
Proceeds from sale of assets | 26 | — | |||||
Net cash provided by investing activities | 14,038 | 23,935 | |||||
Financing activities: | |||||||
Payout of deferred consideration | (14,875 | ) | (6,000 | ) | |||
Repurchase of redeemable common stock issued due to acquisitions | (11,750 | ) | — | ||||
Proceeds from settlement of forward currency contracts | 3,557 | 2,313 | |||||
Change in restricted cash | 6,519 | 11,476 | |||||
Proceeds from bank borrowings, net of debt issuance costs | 14,302 | 69,384 | |||||
Payments on bank borrowings and capital lease obligations | (47,698 | ) | (51,677 | ) | |||
Net cash (used in) provided by financing activities | (49,945 | ) | 25,496 | ||||
Effect of exchange rate changes on cash and cash equivalents | (3,620 | ) | (4,373 | ) | |||
Net increase in cash and cash equivalents | 16,212 | 82,848 | |||||
Cash and cash equivalents at beginning of period | 59,124 | 55,325 | |||||
Cash and cash equivalents at end of period | $ | 75,336 | $ | 138,173 | |||
5
EZCORP, Inc. CONDENSED CONSOLIDATED STATEMENTS OF CASH FLOWS | |||||||
Non-cash investing and financing activities: | |||||||
Pawn loans forfeited and transferred to inventory | $ | 122,709 | $ | 119,028 | |||
Issuance of common stock, subject to possible redemption, due to acquisition | — | 11,696 | |||||
Deferred consideration | — | 250 | |||||
See accompanying notes to unaudited interim condensed consolidated financial statements.
6
EZCORP, Inc. CONDENSED CONSOLIDATED STATEMENTS OF STOCKHOLDERS' EQUITY | ||||||||||||||||||||||
Common Stock | Additional Paid-in Capital | Retained Earnings | Accumulated Other Comprehensive Loss | EZCORP, Inc. Stockholders’ Equity | ||||||||||||||||||
Shares | Par Value | |||||||||||||||||||||
(Unaudited, except balances as of September 30, 2015 and 2014) | ||||||||||||||||||||||
(in thousands) | ||||||||||||||||||||||
Balances as of September 30, 2014 | 53,585 | $ | 536 | $ | 332,264 | $ | 509,586 | $ | (10,082 | ) | $ | 832,304 | ||||||||||
Issuance of common stock related to 401(k) match | 1 | — | — | — | — | — | ||||||||||||||||
Stock compensation | — | — | (1,928 | ) | — | — | (1,928 | ) | ||||||||||||||
Release of restricted stock | 66 | — | — | — | — | — | ||||||||||||||||
Excess tax benefit from stock compensation | — | — | (167 | ) | — | — | (167 | ) | ||||||||||||||
Taxes paid related to net share settlement of equity awards | — | — | (196 | ) | — | — | (196 | ) | ||||||||||||||
Amounts reclassified from accumulated other comprehensive loss | — | — | — | — | 293 | 293 | ||||||||||||||||
Foreign currency translation adjustment | — | — | — | — | (24,772 | ) | (24,772 | ) | ||||||||||||||
Net income attributable to EZCORP, Inc. | — | — | — | 12,955 | — | 12,955 | ||||||||||||||||
Balances as of March 31, 2015 | 53,652 | $ | 536 | $ | 329,973 | $ | 522,541 | $ | (34,561 | ) | $ | 818,489 | ||||||||||
Balances as of September 30, 2015 | 53,696 | $ | 537 | $ | 307,080 | $ | 423,137 | $ | (54,019 | ) | $ | 676,735 | ||||||||||
Stock compensation | — | — | 5,954 | — | — | 5,954 | ||||||||||||||||
Release of restricted stock | 264 | 3 | — | — | — | 3 | ||||||||||||||||
Excess tax benefit from stock compensation | — | — | (372 | ) | — | — | (372 | ) | ||||||||||||||
Taxes paid related to net share settlement of equity awards | — | — | (93 | ) | — | — | (93 | ) | ||||||||||||||
Amounts reclassified from accumulated other comprehensive loss | — | — | — | — | 21 | 21 | ||||||||||||||||
Foreign currency translation adjustment | — | — | — | — | (8,807 | ) | (8,807 | ) | ||||||||||||||
Net loss attributable to EZCORP, Inc. | — | — | — | (81,599 | ) | — | (81,599 | ) | ||||||||||||||
Balances as of March 31, 2016 | 53,960 | $ | 540 | $ | 312,569 | $ | 341,538 | $ | (62,805 | ) | $ | 591,842 | ||||||||||
See accompanying notes to unaudited interim condensed consolidated financial statements.
7
EZCORP, Inc.
Notes to Interim Condensed Consolidated Financial Statements (Unaudited)
March 31, 2016
NOTE 1: ORGANIZATION AND SUMMARY OF SIGNIFICANT ACCOUNTING POLICIES
Description of Business
We are a leading provider of pawn loans in the United States and Mexico and consumer loans in Mexico. In the United States and Mexico, we offer pawn loans, which are non-recourse loans collateralized by tangible property, and we sell merchandise, primarily collateral forfeited from pawn lending operations and used merchandise purchased from customers.
Through our 94%-owned subsidiary, Prestaciones Finmart, S.A.P.I. de C.V., SOFOM, E.N.R. ("Grupo Finmart"), headquartered in Mexico City, we offer unsecured installment loans to employees of various Mexican employers (principally federal, state and local government agencies), which are repaid through payroll deductions.
We also own approximately 32% of Cash Converters International Limited ("Cash Converters International"), based in Australia and publicly-traded on the Australian Stock Exchange, which franchises and operates a worldwide network of over 700 locations that provide pawn loans, short-term unsecured loans and other consumer finance products, and buy and sell second-hand goods, with significant store concentration in Australia and the United Kingdom.
Basis of Presentation
The accompanying unaudited interim condensed consolidated financial statements have been prepared in accordance with generally accepted accounting principles for interim financial information and with the instructions to Form 10-Q and Article 10 of Regulation S-X. Accordingly, they do not include all the information and footnotes required by generally accepted accounting principles for complete financial statements. Our management has included all adjustments it considers necessary for a fair presentation. These adjustments are of a normal, recurring nature except for those related to discontinued operations described in Note 2.
The accompanying financial statements should be read in conjunction with the condensed consolidated financial statements and notes included in our Annual Report on Form 10-K for the year ended September 30, 2015. The balance sheet as of September 30, 2015 has been derived from the audited financial statements at that date but does not include all of the information and footnotes required by generally accepted accounting principles for complete financial statements. Our business is subject to seasonal variations, and operating results for the three and six-months ended March 31, 2016 (the "current quarter" and "current six-months," respectively) are not necessarily indicative of the results of operations for the full fiscal year.
These condensed consolidated financial statements include the accounts of EZCORP, Inc. and its consolidated subsidiaries (collectively, "EZCORP"). All intercompany accounts and transactions have been eliminated in consolidation.
To determine if we hold a controlling financial interest in an entity, we first evaluate if we are required to apply the variable interest entity ("VIE") model to the entity; otherwise, the entity is evaluated under the voting interest model. Where we hold current or potential rights that give us the power to direct the activities of a VIE that most significantly impact the VIE's economic performance combined with a variable interest that gives us the right to receive potentially significant benefits or the obligation to absorb potentially significant losses, we have a controlling financial interest in that VIE. Rights held by others to remove the party with power over the VIE are not considered unless one party can exercise those rights unilaterally. Grupo Finmart has completed several transfers of consumer loans to various securitization trusts. We consolidate those securitization entities under the VIE model as described in Note 16.
We account for our investment in our unconsolidated affiliate Cash Converters International using the equity method.
There have been no changes in significant accounting policies as described in our Annual Report on Form 10-K for the year ended September 30, 2015, other than those described below.
8
Recasting of Certain Prior Period Information
Certain reclassifications of prior period amounts have been made to conform to the current period presentation. These reclassifications, other than those pertaining to the recasting of prior period segment information and discontinued operations discussed in our Annual Report on Form 10-K for the year ended September 30, 2015 and the adoption of Financial Accounting Standards Board ("FASB") Accounting Standards Updates ("ASU") discussed below, primarily include the following:
• | Removal of historical corporate overhead allocations totaling $3.9 million and $8.2 million for the three and six-months ended March 31, 2015, respectively, from segment level "Operations" expense and inclusion in corporate "Administrative" expense. These allocations were reclassified to provide greater clarity into the results of our segment operations. These changes primarily impacted Note 12 with no net impact on our consolidated financial position, results of operations or cash flows. |
• | Reclassification of "Prepaid income taxes" to "Income taxes receivable" of $7.9 million as of September 30, 2015 to conform to current period presentation. |
Use of Estimates and Assumptions
The preparation of these financial statements requires us to make estimates and assumptions that affect the reported amounts of assets, liabilities, revenues and expenses and related disclosure of contingent assets and liabilities. On an ongoing basis, we evaluate our estimates and judgments, including those related to revenue recognition, inventory, loan loss allowances, long-lived and intangible assets, share-based compensation, income taxes, contingencies and litigation. We base our estimates on historical experience, observable trends and various other assumptions that we believe are reasonable under the circumstances. We use this information to make judgments about the carrying values of assets and liabilities that are not readily apparent from other sources. Actual results may differ materially from these estimates under different assumptions or conditions.
Recently Adopted Accounting Policies
Simplification of Adjustments to Provisional Amounts Identified During a Measurement Period
In September 2015, the FASB issued ASU 2015-16, Business Combinations (Topic 805). This ASU requires reporting entities to recognize adjustments to provisional amounts that are identified during the measurement period in the reporting period in which the adjustment amounts are determined, with the effect on earnings of changes in depreciation, amortization, or other income effects, if any, as a result of the change to the provisional amounts, calculated as if the accounting had been completed at the acquisition date. The provisions of this ASU are effective for fiscal years, and interim periods within those fiscal years, beginning after December 15, 2015. Early adoption is permitted. A reporting entity should apply the amendment prospectively to adjustments to provisional amounts that occur after the date of adoption. We early adopted ASU 2015-16 during the current quarter to reduce the cost and complexity of accounting for and reporting business combinations. There was no material impact of adopting ASU 2015-16 on our consolidated financial position, results of operations or cash flows.
Share-Based Awards with Performance Targets that could be Achieved after the Requisite Service Period
In June 2014, the FASB issued ASU 2014-12, Compensation — Stock Compensation (Topic 718): Accounting for Share-Based Payments When the Terms of an Award Provide That a Performance Target Could Be Achieved after the Requisite Service Period. This ASU requires reporting entities to recognize compensation costs for share-based awards with performance targets in the period in which it becomes probable that the performance targets will be achieved and should represent the compensation cost attributable to the periods for which the requisite service has already been rendered. The provisions of this ASU are effective for fiscal years, and interim periods within those fiscal years, beginning after December 15, 2015. Early adoption is permitted. A reporting entity may apply the amendment prospectively or retrospectively. We early adopted ASU 2015-16 during the current quarter and applied the amendments prospectively to all awards granted or modified after the effective date. There was no material impact of adopting ASU 2014-12 on our consolidated financial position, results of operations or cash flows.
Classification of Deferred Tax Assets
In November 2015, the FASB issued ASU 2015-17, Income Taxes (Topic 740): Balance Sheet Classification of Deferred Taxes. This ASU requires reporting entities to classify deferred income taxes as non-current on the condensed consolidated balance sheets. Deferred income taxes were previously required to be classified as current or non-current on the condensed consolidated balance sheets. The provisions of this ASU are effective for fiscal years, and interim periods within those fiscal years, beginning after December 15, 2016. Early adoption is permitted. A reporting entity may apply the amendment prospectively or retrospectively. We early adopted ASU 2015-17 during the three-months ended December 31, 2015 on a retrospective basis. The impact of adopting ASU 2015-17 on our current period condensed consolidated financial statements was the classification of all deferred tax assets as non-current in addition to the reclassification of current "Deferred tax asset, net" to non-current
9
"Deferred tax asset, net" as of March 31, 2015 and September 30, 2015 of $24.4 million and $44.1 million, respectively, within the condensed consolidated balance sheets to conform to the current period presentation. Other than these reclassifications, the adoption of ASU 2015-17 did not have an impact on our consolidated financial position, results of operations or cash flows.
Presentation of Debt Issuance Costs
In April 2015, the FASB issued ASU 2015-03, Interest — Imputation of Interest (Subtopic 835-30): Simplifying the Presentation of Debt Issuance Costs. This ASU requires reporting entities to record costs paid to third parties that are directly related to issuing debt, and that otherwise would not be incurred, as a deduction to the corresponding debt for presentation purposes. In addition, in August 2015, FASB issued ASU 2015-15, Interest — Imputation of Interest (Subtopic 835-30): Presentation and Subsequent Measurement of Debt Issuance Costs Associated with Line-of-Credit Arrangements-Amendments to SEC Paragraphs Pursuant to Staff Announcement at the June 18, 2015 Emerging Issues Task Force ("EITF") Meeting. Given the absence of authoritative guidance within ASU 2015-03 for debt issuance costs related to line-of-credit arrangements, ASU 2015-15 states the SEC staff would not object to an entity deferring and presenting debt issuance costs as an asset and subsequently amortizing the deferred debt issuance costs ratably over the term of the line-of-credit arrangement, regardless of whether there are any outstanding borrowings on the line-of-credit arrangement. The provisions of each ASU are effective for fiscal years, and interim periods within those fiscal years, beginning after December 15, 2015. Early adoption is permitted for each. A reporting entity should apply each amendment retrospectively. We early adopted ASU 2015-03 during the three-months ended December 31, 2015 on a retrospective basis. The impact of adopting ASU 2015-03 on our current period condensed consolidated financial statements was the classification of all deferred financing costs as a deduction to the corresponding debt in addition to the reclassification of deferred financing costs in "Intangible assets, net" to "Long-term debt less current maturities, net" as of March 31, 2015 and September 30, 2015 of $11.4 million and $9.2 million, respectively, within the condensed consolidated balance sheets to conform to the current period presentation. Other than these reclassifications and additional disclosures, the adoption of ASU 2015-03 did not have an impact on our consolidated financial position, results of operations or cash flows.
Reporting Discontinued Operations
In April 2014, the FASB issued ASU 2014-08, Presentation of Financial Statements (Topic 205) and Property, Plant, and Equipment (Topic 360) — Reporting Discontinued Operations and Disclosures of Disposals of Components of an Entity. This ASU provides guidance for the reporting of discontinued operations if (1) a component or group of components of an entity meets the criteria in FASB Accounting Standards Codification ("ASC") Paragraph 205-20-45-1E to be classified as held for sale; (2) the component of an entity or group of components of an entity is disposed of by sale; or (3) the component of an entity or group of components of an entity is disposed of other than by sale (for example, by abandonment or in a distribution to owners in a spinoff). Among other disclosures, ASU 2014-08 requires an entity to present, for each comparative period, the assets and liabilities of a disposal group that includes a discontinued operation separately in the asset and liability sections, respectively, of the statement of financial position. ASU 2014-08 is effective prospectively for (1) all disposals of components that occur within annual periods beginning on or after December 15, 2014, and interim periods within those years; and (2) all businesses or nonprofit activities that, on acquisition, are classified as held for sale that occur within annual periods beginning on or after December 15, 2014, and interim periods within those years. There was no impact of adopting ASU 2014-08 on our consolidated financial position, results of operations or cash flows.
Recently Issued Accounting Pronouncements
In March 2016, the FASB issued ASU 2016-09, Compensation — Stock Compensation (Topic 718): Improvements to Employee Share-Based Payment Accounting. This ASU simplifies several aspects of the accounting for share-based payment transactions, including the income tax consequences, classification of awards as either equity or liabilities, and classification on the statement of cash flows. The provisions of this ASU are effective for fiscal years, and interim periods within those fiscal years, beginning after December 15, 2016. Early adoption is permitted. A reporting entity should apply the amendment using transition guidance for each aspect of the ASU. We are in the process of evaluating the impact of adopting ASU 2016-09 on our financial position, results of operations and cash flows.
In March 2016, the FASB issued ASU 2016-06, Derivatives and Hedging (Topic 815): Contingent Put and Call Options in Debt Instruments a consensus of the FASB Emerging Issues Task Force. This ASU clarifies what steps are required when assessing whether the economic characteristics and risks of call (put) options are clearly and closely related to the economic characteristics and risks of their debt hosts, which is one of the criteria for bifurcating an embedded derivative. The provisions of this ASU are effective for fiscal years, and interim periods within those fiscal years, beginning after December 15, 2016. Early adoption is permitted. A reporting entity should apply the amendment modified retrospective basis to existing debt instruments as of the beginning of the fiscal year for which the amendments are effective. We are in the process of evaluating the impact of adopting ASU 2016-06 on our financial position, results of operations and cash flows.
10
In February 2016, the FASB issued ASU 2016-02, Leases (Topic 842). This ASU requires companies to generally recognize on the balance sheet operating and financing lease liabilities and corresponding right-of-use assets. The provisions of this ASU are effective for fiscal years, and interim periods within those fiscal years, beginning after December 15, 2018. Early adoption is permitted based upon guidance issued within the ASU. We anticipate adoption of this ASU on a modified retrospective basis using various practical expedients. We are in the process of evaluating the impact of adopting ASU 2016-02 on our financial position, results of operations and cash flows.
In January 2016, the FASB issued ASU 2016-01, Financial Instruments — Overall (Subtopic 825-10): Recognition and Measurement of Financial Assets and Financial Liabilities. This ASU makes targeted improvements to the accounting for, and presentation and disclosure of, financial assets and liabilities. The ASU further requires separate presentation of financial assets and financial liabilities by measurement category on the balance sheet or the accompanying notes to the financial statements. The provisions of this ASU are effective for fiscal years, and interim periods within those fiscal years, beginning after December 15, 2017. Early adoption is permitted based upon guidance issued within the ASU. A reporting entity should apply the amendment prospectively, with a cumulative-effect adjustment to the balance sheet as of the beginning of the fiscal year of adoption. We are in the process of evaluating the impact of adopting ASU 2016-01 on our financial position, results of operations and cash flows.
In May 2014, the FASB issued ASU 2014-09, Revenue from Contracts with Customers (Topic 606). On August 12, 2015, the FASB issued ASU 2015-14, Revenue from Contracts with Customers (Topic 606) to defer the effective date to December 15, 2017 for annual reporting periods beginning after that date. The FASB also permitted early adoption of the standard, but not before the original effective date of December 15, 2016. The amendments in ASU 2014-09 will be added to the Accounting Standards Codification as Topic 606, Revenue from Contracts with Customers, and will supersede the revenue recognition requirements in Topic 605, Revenue Recognition, as well as some cost guidance in Subtopic 605-35, Revenue Recognition - Construction-Type and Production-Type Contracts. The core principle of ASU 2014-09 is that an entity should recognize revenue to depict the transfer of promised goods or services to customers in an amount that reflects the consideration to which the entity expects to be entitled in exchange for those goods or services. To achieve this core principle, the guidance provides that an entity should apply the following steps: (1) identify the contract(s) with a customer; (2) identify the performance obligations in the contract; (3) determine the transaction price; (4) allocate the transaction price to the performance obligations in the contract; and (5) recognize revenue when, or as, the entity satisfies a performance obligation. Notably, the existing requirements for the recognition of a gain or loss on the transfer of non-financial assets that are not in a contract with a customer (e.g., assets within the scope of Topic 360, Property, Plant, and Equipment, and intangible assets within the scope of Topic 350, Intangibles — Goodwill and Other) are amended to be consistent with the guidance on recognition and measurement in ASU 2014-09. The new standard allows for two methods of adoption: (a) full retrospective adoption, meaning the standard is applied to all periods presented, or (b) modified retrospective adoption, meaning the cumulative effect of applying the new standard is recognized as an adjustment to the fiscal 2017 opening retained earnings balance. In April 2016 and March 2016, the FASB issued ASU 2016-10, Revenue from Contracts with Customers (Topic 606): Consensuses of the FASB Emerging Issues Task Force and ASU 2016-08, Revenue from Contracts with Customers (Topic 606): Principal versus Agent Considerations (Reporting Revenue Gross versus Net), respectively. ASU 2016-10 and ASU 2016-08 clarify identifying performance obligations and licensing implementation guidance and implementation guidance on principal versus agent considerations in ASU 2014-09, respectively, and are effective upon adoption of ASU 2014-09. We are evaluating the impact that will result from adopting ASU 2014-09 on our financial position, results of operations, and cash flows.
11
NOTE 2: DISCONTINUED OPERATIONS AND RESTRUCTURING
Discontinued Operations
During the fourth quarter of fiscal 2015, in the context of a transformational change in strategy following an intensive six-month review of all Company activities, we implemented a plan that included exiting our U.S. financial services business ("USFS"). During the fourth quarter of fiscal 2014, as part of our new strategy to concentrate on an integrated, customer-centric financial services model that is focused on our core businesses of pawn and unsecured payroll lending, we implemented a plan to exit our online lending businesses in the United States (EZOnline) and the United Kingdom (Cash Genie). These costs are included under "(Loss) income from discontinued operations, net of tax" in our condensed consolidated statements of operations.
The following table summarizes the pre-tax charges, inclusive of the charges presented in the accrued lease termination costs, severance costs and other costs rollforward below, pertaining to the above discontinued operations:
Three Months Ended March 31, 2016 | Three Months Ended March 31, 2015 | Six Months Ended March 31, 2016 | Six Months Ended March 31, 2015 | ||||||||||||
(in thousands) | |||||||||||||||
Other (a) | $ | 1,203 | $ | 4,025 | $ | 2,733 | $ | 4,025 | |||||||
(a) | Includes estimated costs related to employee severance and accelerated amortization of prepaid expenses and other assets in addition to a one-time charge of $3.3 million related to Cash Genie regulatory compliance recorded during the six-months ended March 31, 2015. The costs incurred during fiscal 2016 are primarily the result of final payments associated with the physical exit of USFS stores. |
Accrued lease termination costs, severance costs and other costs related to discontinued operations are included under "Accounts payable and other accrued expenses" in our condensed consolidated balance sheets and are primarily expected to be paid during fiscal 2016. Changes in these amounts during the three and six-months ended March 31, 2016 and 2015 are summarized as follows:
Three Months Ended March 31, 2016 | Three Months Ended March 31, 2015 | Six Months Ended March 31, 2016 | Six Months Ended March 31, 2015 | ||||||||||||
(in millions) | |||||||||||||||
Beginning balance (a) | $ | 9.0 | $ | 7.8 | $ | 16.9 | $ | 8.9 | |||||||
Charged to expense | 1.2 | 4.0 | 2.7 | 4.0 | |||||||||||
Cash payments | (2.0 | ) | (0.7 | ) | (11.5 | ) | (1.4 | ) | |||||||
Other (b) | (0.1 | ) | (0.9 | ) | — | (1.3 | ) | ||||||||
Ending balance | $ | 8.1 | $ | 10.2 | $ | 8.1 | $ | 10.2 | |||||||
(a) | Beginning balance as of September 30, 2015 includes a $10.5 million charge associated with the settlement of outstanding issues with the U.S. Consumer Financial Protection Bureau. We expect this amount to primarily be paid out during fiscal 2016; however ultimate settlement of certain portions may occur in fiscal 2017. |
(b) | Includes adjustments due to foreign currency effects and other individually immaterial adjustments. |
Total revenue included in "(Loss) income from discontinued operations, net of tax" in our condensed consolidated statements of operations for the three-months ended March 31, 2016 were nominal. Total revenue included in "(Loss) income from discontinued operations, net of tax" in our condensed consolidated statements of operations for the six-months ended March 31, 2016 was $2.1 million. Total revenue included in "(Loss) income from discontinued operations, net of tax" in our condensed consolidated statements of operations for the three and six-months ended March 31, 2015 was $36.5 million and $77.8 million, respectively. All revenue, expense and income reported in these condensed consolidated financial statements have been adjusted to reflect reclassification of all discontinued operations.
Restructuring
Fiscal 2015
During the fourth quarter of fiscal 2015, in the context of a transformational change in strategy following an intensive six-month review of all Company activities, we implemented a plan that included streamlining our structure and operating model to improve overall efficiency and reduce costs. The costs of streamlining our structure and operating model are included under "Restructuring" expenses in our condensed consolidated statements of operations and are allocated to certain of our segments as presented in Note 12.
12
The following table summarizes the pre-tax charges, inclusive of the charges presented in the changes in the balance of restructuring costs rollforward below:
Three Months Ended March 31, 2016 | Six Months Ended March 31, 2016 | ||||||
(in thousands) | |||||||
Other (a) | $ | 218 | $ | 768 | |||
Asset disposals | — | 323 | |||||
Lease termination costs | — | 819 | |||||
$ | 218 | $ | 1,910 | ||||
(a) | Includes costs related to employee severance and other. |
Accrued lease termination costs, severance costs and other costs related to restructuring are included under "Accounts payable and other accrued expenses" in our condensed consolidated balance sheets. Changes in these amounts during the three and six-months ended March 31, 2016 are summarized as follows:
Three Months Ended March 31, 2016 | Six Months Ended March 31, 2016 | ||||||
(in thousands) | |||||||
Beginning balance | $ | 6,718 | $ | 8,076 | |||
Charged to expense | 218 | 1,594 | |||||
Cash payments | (1,758 | ) | (3,800 | ) | |||
Other (a) | — | (692 | ) | ||||
Ending balance | $ | 5,178 | $ | 5,178 | |||
(a) | Includes other individually immaterial adjustments. |
The above amount includes accrued lease termination costs of $4.9 million that we expect to be partially offset by future sublease payments through 2029. The remaining other amounts accrued are expected to be paid during fiscal 2016.
Fiscal 2014
During the fourth quarter of fiscal 2014, we conducted a company-wide operational review to realign our organization to streamline operations and create synergies and efficiencies. Restructuring charges related to this action are considered corporate costs and therefore are not allocated to specific segments. Changes in these amounts during the three and six-months ended March 31, 2016 and 2015 are summarized as follows:
Three Months Ended March 31, 2016 | Three Months Ended March 31, 2015 | Six Months Ended March 31, 2016 | Six Months Ended March 31, 2015 | ||||||||||||
(in thousands) | |||||||||||||||
Beginning balance | $ | — | $ | 3,858 | $ | 2,901 | $ | 6,121 | |||||||
Charged to expense | — | 726 | — | 726 | |||||||||||
Cash payments | — | (699 | ) | (2,901 | ) | (2,962 | ) | ||||||||
Ending Balance | $ | — | $ | 3,885 | $ | — | $ | 3,885 | |||||||
NOTE 3: ACQUISITIONS
On February 1, 2016, we acquired six pawn stores in the Houston, Texas area doing business under the "Pawn One" brand. The aggregate purchase price was $6.2 million in cash, inclusive of all ancillary arrangements, of which $3.2 million was recorded as goodwill in the U.S. Pawn segment. The acquisition was made as part of our continuing strategy to enhance our earnings over the long-term. The factors contributing to the recognition of goodwill were based on several strategic and synergistic benefits we expect to realize from the acquisition. These benefits include a greater presence in the Houston area, as well as the ability to further leverage our expense structure through increased scale. We expect no goodwill recorded as a result of the acquisition to be deductible for tax purposes. We have concluded that this acquisition was immaterial to our overall consolidated financial results and, therefore, have omitted the information that would otherwise be required by FASB ASC 805-10-50-2(h).
13
NOTE 4: EARNINGS PER SHARE
Components of basic and diluted (loss) earnings per share and excluded anti-dilutive potential common shares are as follows:
Three Months Ended March 31, | Six Months Ended March 31, | ||||||||||||||
2016 | 2015 | 2016 | 2015 | ||||||||||||
(in thousands, except per share amounts) | |||||||||||||||
Net (loss) income from continuing operations attributable to EZCORP (A) | $ | (73,031 | ) | $ | (3,388 | ) | $ | (80,267 | ) | $ | 1,347 | ||||
Income (loss) from discontinued operations, net of tax (B) | (1,094 | ) | 4,731 | (1,332 | ) | 11,608 | |||||||||
Net (loss) income attributable to EZCORP (C) | $ | (74,125 | ) | $ | 1,343 | $ | (81,599 | ) | $ | 12,955 | |||||
Weighted-average outstanding shares of common stock (D) | 54,843 | 54,184 | 54,869 | 53,915 | |||||||||||
Dilutive effect of restricted stock* | — | — | — | 57 | |||||||||||
Weighted-average common stock and common stock equivalents (E) | 54,843 | 54,184 | 54,869 | 53,972 | |||||||||||
Basic (loss) earnings per share attributable to EZCORP: | |||||||||||||||
Continuing operations (A / D) | $ | (1.33 | ) | $ | (0.06 | ) | $ | (1.46 | ) | $ | 0.02 | ||||
Discontinued operations (B / D) | (0.02 | ) | 0.09 | (0.02 | ) | 0.22 | |||||||||
Basic (loss) earnings per share (C / D) | $ | (1.35 | ) | $ | 0.03 | $ | (1.48 | ) | $ | 0.24 | |||||
Diluted (loss) earnings per share attributable to EZCORP: | |||||||||||||||
Continuing operations (A / E) | $ | (1.33 | ) | $ | (0.06 | ) | $ | (1.46 | ) | $ | 0.02 | ||||
Discontinued operations (B / E) | (0.02 | ) | 0.09 | (0.02 | ) | 0.22 | |||||||||
Diluted (loss) earnings per share (C / E) | $ | (1.35 | ) | $ | 0.03 | $ | (1.48 | ) | $ | 0.24 | |||||
Potential common shares excluded from the calculation of diluted (loss) earnings per share: | |||||||||||||||
Restricted stock** | 1,608 | 273 | 1,545 | 6 | |||||||||||
Warrants*** | 14,317 | 14,317 | 14,317 | 14,317 | |||||||||||
Total potential common shares excluded | 15,925 | 14,590 | 15,862 | 14,323 | |||||||||||
* | As required by FASB ASC 260-10-45-19, amount excludes all potential common shares for periods when there is a loss from continuing operations. |
** | Includes antidilutive share-based awards as well as performance-based and market conditioned share-based awards that are contingently issuable, but for which the condition for issuance has not been met as of the end of the reporting period. |
*** | See Note 7 for discussion of the terms and conditions of these potential common shares. |
Weighted-average outstanding shares of common stock for the three and six-months ended March 31, 2016 include the impact of redeemable common stock repurchased as discussed in Note 9.
14
NOTE 5: STRATEGIC INVESTMENTS
As of March 31, 2016, we owned 151,948,000 shares, or approximately 32%, of our unconsolidated affiliate Cash Converters International. The following tables present summary financial information for Cash Converters International’s most recently reported results as of March 31, 2016 after translation to U.S. dollars:
December 31, | |||||||
2015 | 2014 | ||||||
(in thousands) | |||||||
Current assets | $ | 176,105 | $ | 200,682 | |||
Non-current assets | 143,466 | 157,737 | |||||
Total assets | $ | 319,571 | $ | 358,419 | |||
Current liabilities | $ | 68,857 | $ | 75,700 | |||
Non-current liabilities | 48,263 | 54,256 | |||||
Shareholders’ equity: | |||||||
Equity attributable to owners of the parent | 202,450 | 228,462 | |||||
Noncontrolling interest | 1 | 1 | |||||
Total liabilities and shareholders’ equity | $ | 319,571 | $ | 358,419 | |||
Half Year Ended December 31, | |||||||
2015 | 2014 | ||||||
(in thousands) | |||||||
Gross revenues | $ | 143,575 | $ | 167,206 | |||
Gross profit | 93,573 | 104,852 | |||||
Profit (loss) attributable to: | |||||||
Owners of the parent | $ | 11,483 | $ | (4,717 | ) | ||
Noncontrolling interest | — | (179 | ) | ||||
Profit (loss) for the year | $ | 11,483 | $ | (4,896 | ) | ||
NOTE 6: GOODWILL AND OTHER INTANGIBLE ASSETS
In accordance with FASB ASC 350-20-35, Goodwill — Subsequent Measurement, we test goodwill and intangible assets with an indefinite useful life for potential impairment annually, or more frequently when there are events or circumstances that indicate that it is more likely than not that an impairment exists. During the three-months ended March 31, 2016, we evaluated such events and circumstances and concluded that there were indicators of impairment under FASB ASC 350-20-35-3C. These indicators of impairment primarily included a continued decline in our stock price, as well as negative developments in bad debt experience at our Grupo Finmart segment. We performed a quantitative Step 1 analysis as of February 29, 2016 under FASB ASC 350-20-35 and determined that the fair value of each of our reporting units exceeded their carrying value, with the exception of our Grupo Finmart reporting unit. The fair values of each reporting unit were determined based on a discounted cash flow approach using significant unobservable inputs (Level 3) developed using company-specific information. During the quarter ended March 31, 2016, there were no material changes in the fair values of our U.S. Pawn and Mexico Pawn reporting units as compared to their carrying values. There is no goodwill attributable to our Other International reporting unit. We will further perform our required annual impairment test in the fourth quarter of our fiscal 2016.
The Step 1 analysis of our Grupo Finmart reporting unit yielded a valuation of $46.5 million. Under Step 2 of FASB ASC 350-20-35, we compared the fair value of the reporting unit to the fair value of the reporting unit's net assets and determined that all of the goodwill attributable to the Grupo Finmart reporting unit ($73.9 million), should be impaired. This impairment was recorded under "Impairment of goodwill" in the condensed consolidated statements of operations under the Grupo Finmart segment during the three-months ended March 31, 2016. No other assets held by Grupo Finmart were determined to be impaired as of March 31, 2016.
See Note 3 for additional information regarding goodwill acquired in business combinations during the three-months ended March 31, 2016.
15
NOTE 7: LONG-TERM DEBT AND CAPITAL LEASE OBLIGATIONS
The following table presents our long-term debt instruments and balances under capital lease obligations outstanding as of March 31, 2016 and 2015 and September 30, 2015:
March 31, 2016 | March 31, 2015 | September 30, 2015 | |||||||||||||||||||||
Carrying Amount | Debt (Discount) and (Issuance Costs) | Carrying Amount | Debt (Discount) Premium and (Issuance Costs) | Carrying Amount | Debt (Discount) and (Issuance Costs) | ||||||||||||||||||
(in thousands) | |||||||||||||||||||||||
Recourse to EZCORP: | |||||||||||||||||||||||
2.125% Cash convertible senior notes due 2019 | $ | 192,565 | $ | (37,435 | ) | $ | 182,276 | $ | (47,724 | ) | $ | 187,471 | $ | (42,529 | ) | ||||||||
Cash convertible senior notes due 2019 embedded derivative | 3,219 | — | 27,215 | — | 10,505 | — | |||||||||||||||||
Capital lease obligations | — | — | 93 | — | — | — | |||||||||||||||||
Non-recourse to EZCORP*: | |||||||||||||||||||||||
8.2% Secured foreign currency debt up to $14 million due 2016 (a) (b) | 82 | (101 | ) | 2,044 | (451 | ) | 938 | (204 | ) | ||||||||||||||
14.5% Secured foreign currency debt up to $17 million due 2017 (a) | 17,393 | — | 19,682 | — | 17,567 | — | |||||||||||||||||
5.8% Consumer loans facility due 2019 (b) | 33,613 | (1,714 | ) | 44,837 | (2,989 | ) | 40,493 | (2,196 | ) | ||||||||||||||
8.5% Unsecured notes due 2015 | — | — | 12,329 | (187 | ) | 12,330 | (42 | ) | |||||||||||||||
10% Unsecured notes due 2015 | — | — | — | — | 1,500 | — | |||||||||||||||||
11% Unsecured notes due 2015 | — | — | 4,334 | — | 3,868 | — | |||||||||||||||||
17% Secured notes due 2015 consolidated from VIEs | — | — | 937 | — | — | — | |||||||||||||||||
10% Unsecured notes due 2016 | 1,500 | — | 844 | — | 1,885 | — | |||||||||||||||||
12% Secured notes due 2016 | — | — | 2,691 | 67 | 2,928 | — | |||||||||||||||||
13% Unsecured notes due 2016 | — | — | 656 | — | 1,171 | — | |||||||||||||||||
15% Unsecured notes due 2016 | 3,829 | — | — | — | 233 | — | |||||||||||||||||
15% Secured notes due 2016 consolidated from VIEs | 3,192 | — | 7,755 | — | 5,397 | — | |||||||||||||||||
18% Unsecured notes due 2016 | 5,797 | — | — | — | — | — | |||||||||||||||||
10% Unsecured notes due 2017 | 174 | — | — | — | — | — | |||||||||||||||||
11% Secured notes due 2017 consolidated from VIEs (c) | 37,901 | — | 76,545 | — | 56,113 | — | |||||||||||||||||
12% Secured notes due 2017 | 2,898 | — | — | — | — | — | |||||||||||||||||
13.5% Unsecured notes due 2017 | 5,797 | — | — | — | — | — | |||||||||||||||||
14.5% Secured notes due 2017 consolidated from VIEs | 9,788 | — | 14,897 | — | 11,754 | — | |||||||||||||||||
12.4% Secured notes due 2020 | 17,234 | (214 | ) | 19,389 | (358 | ) | 17,358 | (268 | ) | ||||||||||||||
Total | 334,982 | (39,464 | ) | 416,524 | (51,642 | ) | 371,511 | (45,239 | ) | ||||||||||||||
Less current portion | 82,174 | — | 71,564 | 67 | 74,345 | — | |||||||||||||||||
Total long-term debt and capital lease obligations | $ | 252,808 | $ | (39,464 | ) | $ | 344,960 | $ | (51,709 | ) | $ | 297,166 | $ | (45,239 | ) | ||||||||
* | Even though Grupo Finmart debt may be non-recourse to EZCORP, a default on more than $25 million of such debt could constitute an event of default under our Cash Convertible Notes (described below). See "Part II, Item 1A — Risk Factors." |
(a) | Maximum amounts of debt are translated from Mexican pesos to United States dollars as of the most current period end date in which outstanding debt is presented. |
(b) | Interest is charged at the Mexican Interbank Equilibrium rate (“TIIE”) plus an applicable margin. The rate presented is as of March 31, 2016. |
(c) | Grupo Finmart has entered into foreign exchange forward contracts to mitigate the VIE's currency risk, as described in Notes 15 and 16, and EZCORP has guaranteed the future cash outflows of the forward contracts. See "Part II, Item 1A — Risk Factors." |
2.125% Cash Convertible Senior Notes Due 2019
In June 2014 ("Original Issuance Date"), we issued $200 million aggregate principal amount of 2.125% Cash Convertible Senior Notes due 2019 (the “Cash Convertible Notes”). We granted the initial purchasers the option to purchase up to an additional $30 million aggregate principal amount of Cash Convertible Notes. That option was exercised in full on June 27,
16
2014, and we issued an additional $30 million principal amount of Cash Convertible Notes on July 2, 2014. All of the Cash Convertible Notes were issued pursuant to an indenture dated June 23, 2014 (the "Indenture") by and between us and Wells Fargo Bank, National Association, as the trustee. The Cash Convertible Notes were issued in a private offering and resold under Rule 144A under the Securities Act of 1933. The Cash Convertible Notes pay interest semi-annually in arrears at a rate of 2.125% per annum on June 15 and December 15 of each year, commencing December 15, 2014, and will mature on June 15, 2019 (the "Maturity Date").
Prior to December 15, 2018, the Cash Convertible Notes will be convertible only upon the occurrence of certain events and during certain periods, and thereafter, at any time prior to the close of business on the second scheduled trading day immediately preceding the Maturity Date. At maturity, the holders of the Cash Convertible Notes will be entitled to receive cash equal to the principal amount of the Cash Convertible Notes plus unpaid accrued interest.
The Cash Convertible Notes are unsubordinated unsecured obligations and rank senior in right of payment to any of our indebtedness that is expressly subordinated in right of payment to the Cash Convertible Notes, equal in right of payment with all of our other unsecured unsubordinated indebtedness, and effectively junior to all debt or other obligations (including trade payables) of our wholly-owned subsidiaries. The Indenture governing the Cash Convertible Notes does not contain any financial covenants.
We incurred transaction costs of approximately $8.8 million related to the issuance of the Cash Convertible Notes, which we recorded as deferred financing costs and have included as a deduction to the corresponding debt liability. Deferred financing costs are being amortized to interest expense using the effective interest method over the expected term of the Cash Convertible Notes.
Under the terms of our Cash Convertible Notes, payment of dividends requires a conversion rate adjustment equal to the conversion rate in effect immediately prior to the open of business on the ex-dividend date for such dividend multiplied by the last reported sale price of the Class A Non-voting Common Stock (“Class A Common Stock”) on the trading day immediately preceding the ex-dividend date for such dividend, divided by the difference between the last reported sale price of the Class A Common Stock on the trading day immediately preceding the ex-dividend date for such dividend and the amount in cash per share we distribute to all or substantially all holders of Class A Common Stock. Should we pay dividends in the future, our certificate of incorporation provides that cash dividends on common stock, when declared, must be declared and paid at the same per share amounts on both classes of stock. Any future determination to pay cash dividends will be at the discretion of our Board of Directors.
Cash Convertible Notes Embedded Derivative
We account for the cash conversion feature of the Cash Convertible Notes as a separate derivative instrument (the “Cash Convertible Notes Embedded Derivative”), which had a fair value of $46.5 million on the issuance date that was recognized as the original issue discount of the Cash Convertible Notes. This original issue discount is being amortized to interest expense over the term of the Cash Convertible Notes using the effective interest method. As of March 31, 2016 and 2015 and September 30, 2014, the Cash Convertible Notes Embedded Derivative was recorded as a non-current liability under "Long-term debt, less current maturities" in our condensed consolidated balance sheets, and will be marked to market in subsequent reporting periods. The classification of the Cash Convertible Notes Embedded Derivative liability as current or non-current on the condensed consolidated balance sheets corresponds with the classification of the net balance of the Cash Convertible Notes as discussed below.
The Cash Convertible Notes are convertible into cash, subject to satisfaction of certain conditions and during the periods described below, based on an initial "Conversion Rate" of 62.2471 shares of Class A Common Stock per $1,000 principal amount of Cash Convertible Notes (equivalent to an initial "Conversion Price" of approximately $16.065 per share of our Class A Common Stock). Upon conversion of a note, we will pay cash based on a daily conversion value calculated on a proportionate basis for each trading day in the applicable 80 trading day observation period as described in the Indenture. The conversion rate will not be adjusted for any accrued and unpaid interest.
Holders may surrender their Cash Convertible Notes for conversion into cash prior to December 15, 2018 only under the following circumstances (the “Early Conversion Conditions”): (1) during any fiscal quarter commencing after the fiscal quarter ending on September 30, 2014 (and only during such fiscal quarter), if the last reported sale price of our Class A Common Stock for at least 20 trading days (whether or not consecutive) during a period of 30 consecutive trading days ending on the last trading day of the immediately preceding fiscal quarter is greater than or equal to 130% of the conversion price on each applicable trading day; (2) during the five business day period after any five consecutive trading day period (the “measurement period”) in which the trading price, as defined in the Indenture, per $1,000 principal amount of notes for each trading day of the measurement period was less than 98% of the product of the last reported sale price of our Class A Common Stock and the conversion rate on such trading day; or (3) upon the occurrence of specified corporate events, as defined in the Indenture. On or
17
after December 15, 2018 until the close of business on the second scheduled trading day immediately preceding the Maturity Date, holders may convert their notes into cash at any time, regardless of the foregoing circumstances.
If a holder elects to convert its Cash Convertible Notes in connection with certain make-whole fundamental changes, as that term is defined in the Indenture, that occur prior to the Maturity Date, we will in certain circumstances increase the conversion rate for Cash Convertible Notes converted in connection with such make-whole fundamental changes by a specified number of shares of Class A Common Stock. In addition, the conversion rate is subject to customary anti-dilution adjustments (for example, certain dividend distributions or tender or exchange offer of our Class A Common Stock).
Upon the occurrence of a fundamental change, as defined in the Indenture, holders may require us to repurchase for cash all or any portion of the then outstanding Cash Convertible Notes at a repurchase price equal to 100% of the principal amount of the notes to be repurchased, plus accrued and unpaid interest.
Impact of Early Conversion Conditions on Financial Statements
As of March 31, 2016, the Cash Convertible Notes were not convertible because the Early Conversion Conditions described above had not been met. Accordingly, the net balance of the Cash Convertible Notes was classified as a non-current liability in our condensed consolidated balance sheets as of March 31, 2016 and 2015 and September 30, 2015. The classification of the Cash Convertible Notes as current or non-current in the condensed consolidated balance sheets is evaluated at each balance sheet date and may change from time to time depending on whether any of the Early Conversion Conditions has been met.
If any of the Early Conversion Conditions is met in any future fiscal quarter, we would classify our net liability under the Cash Convertible Notes as a current liability in the condensed consolidated balance sheets as of the end of that fiscal quarter. If none of the Early Conversion Conditions have been met in a future fiscal quarter prior to the one year period immediately preceding the Maturity Date, we would classify our net liability under the Cash Convertible Notes as a non-current liability in the condensed consolidated balance sheets as of the end of that fiscal quarter. If the note holders elect to convert their Cash Convertible Notes prior to maturity, any unamortized discount and transaction costs will be expensed at the time of conversion. If the entire outstanding principal amount had been converted on March 31, 2016, we would have recorded an expense of $37.4 million associated with the conversion, comprised of $31.7 million of unamortized debt discount and $5.7 million of unamortized debt issuance costs. As of March 31, 2016, none of the note holders had elected to convert their Cash Convertible Notes.
Cash Convertible Notes Hedges
In connection with the issuance of the Cash Convertible Notes, we purchased cash-settled call options (the “Cash Convertible Notes Hedges”) in privately negotiated transactions with certain of the initial purchasers or their affiliates (in this capacity, the “Option Counterparties”). The Cash Convertible Notes Hedges provide us with the option to acquire, on a net settlement basis, approximately 14.3 million shares of our Class A Common Stock at a strike price of $16.065, which is equal to the number of shares of our Class A Common Stock that notionally underlie the Cash Convertible Notes and corresponds to the Conversion Price of the Cash Convertible Notes. The Cash Convertible Notes Hedges have an expiration date that is the same as the Maturity Date of the Cash Convertible Notes, subject to earlier exercise. The Cash Convertible Notes Hedges have customary anti-dilution provisions similar to the Cash Convertible Notes. If we exercise the Cash Convertible Notes Hedges, the aggregate amount of cash we will receive from the option counterparties to the Cash Convertible Notes Hedges will cover the aggregate amount of cash that we would be required to pay to the holders of the converted Cash Convertible Notes, less the principal amount thereof. As of March 31, 2016, we have not purchased any shares under the Cash Convertible Notes Hedges.
The aggregate cost of the Cash Convertible Notes Hedges was $46.5 million (or $21.3 million net of the total proceeds from the Warrants sold, as discussed below). The Cash Convertible Notes Hedges are accounted for as a derivative asset and are recorded in the condensed consolidated balance sheets at their estimated fair value under "Other assets, net." The Cash Convertible Notes Embedded Derivative liability and the Cash Convertible Notes Hedges asset will be adjusted to fair value each reporting period and unrealized gains and losses will be reflected in the condensed consolidated statements of operations. The Cash Convertible Notes Embedded Derivative and the Cash Convertible Notes Hedges are designed to have similar fair values. Accordingly, the changes in the fair values of these instruments are expected to offset and not have a net impact on the condensed consolidated statements of operations.
The classification of the Cash Convertible Notes Hedges asset as current or long-term on the condensed consolidated balance sheets corresponds with the classification of the Cash Convertible Notes, which is evaluated at each balance sheet date and may change from time to time depending on whether any of the Early Conversion Conditions has been met.
18
Cash Convertible Notes Warrants
In connection with the issuance of the Cash Convertible Notes, we also sold net-share-settled warrants (the “Warrants”) in privately negotiated transactions with the Option Counterparties for the purchase of up to approximately 14.3 million shares of our Class A Common Stock at a strike price of $20.83 per share, for total proceeds of $25.1 million, net of issuance costs, which was recorded as an increase in stockholders' equity. The Warrants have customary anti-dilution provisions similar to the Cash Convertible Notes. As a result of the Warrants, we will experience dilution to our diluted earnings per share if our average closing stock price exceeds $20.83 for any fiscal quarter. The Warrants expire on various dates from September 2019 through February 2020 and must be settled in net shares of our Class A Common Stock. Therefore, upon expiration of the Warrants, we will issue shares of Class A Common Stock to the purchasers of the Warrants that represent the value by which the price of the Class A Common Stock exceeds the strike price stipulated within the particular warrant agreement. As of March 31, 2016, there were 14.3 million warrants outstanding.
Cash Convertible Notes Interest Expense
Total interest expense attributable to the Cash Convertible Notes for the three-months ended March 31, 2016 and 2015 was $4.0 million and $3.8 million, respectively, comprised of contractual interest expense of $1.2 million and $1.2 million, respectively, and debt discount and deferred financing cost amortization of $2.8 million and $2.6 million, respectively. Total interest expense attributable to the Cash Convertible Notes for the six-months ended March 31, 2016 and 2015 was $7.7 million and $7.4 million, respectively, comprised of contractual interest expense of $2.4 million and $2.5 million, respectively, and debt discount and deferred financing cost amortization of $5.3 million and $4.9 million, respectively. The effective interest rate approximates 8% after inclusion of deferred financing costs upon adoption of ASU 2015-03, from the effective interest rate of approximately 7% during fiscal 2015.
As of March 31, 2016, the remaining unamortized issuance discount and costs will be amortized over the next three years assuming no early conversion.
Non-Recourse Debt to EZCORP
Non-recourse debt amounts in the table above represent Grupo Finmart’s third-party debt, including secured notes consolidated from VIEs. Amounts due in Mexican pesos are translated each reporting period. Effective interest rates approximate stated rates.
Secured Foreign Currency Debt, Secured Notes not Consolidated from VIEs and Unsecured Notes
Foreign currency debt and secured notes (not including secured notes consolidated from VIEs, which are discussed below) are secured by Grupo Finmart's loan portfolio or collateralized cash at Grupo Finmart’s option. As of March 31, 2016 and 2015, Grupo Finmart’s secured foreign currency debt and notes, excluding secured notes consolidated from VIEs, were secured by consumer loans totaling $36.5 million and $24.9 million, respectively, included in “Consumer loans, net” and “Non-current consumer loans, net” in our condensed consolidated balance sheets, and collateralized cash totaling $3.0 million and $19.2 million, respectively, included in “Restricted cash” and “Restricted cash, non-current” in our condensed consolidated balance sheets. All unsecured notes are collateralized with Grupo Finmart’s assets.
During the six-months ended March 31, 2016, Grupo Finmart issued $6.1 million of 13.5% unsecured notes due September 2016 (repayment term extended through 2017 during the three-months ended March 31, 2016), $6.1 million of 18% unsecured notes due September 2016 and $2.3 million of 20% unsecured notes due March 2016 (repaid in full during the three-months ended March 31, 2016). Amounts of debt issued are stated at exchange rates in effect at time of issuance.
During the six-months ended March 31, 2016, Grupo Finmart repaid the following amounts of debt that were outstanding as of September 30, 2015: the remaining $0.9 million 8.2% secured foreign currency debt due 2016; $12.3 million 8.5% unsecured notes due 2015; $1.5 million 10% unsecured notes due 2015; $3.9 million 11% unsecured notes due 2015; $2.9 million 12% secured notes due 2016; and $1.2 million 13% unsecured notes due 2016. Such amounts include the impact of foreign exchange effects and amortization of deferred costs. In addition, portions of other debt amounts still outstanding as of March 31, 2016 were repaid.
Notes Consolidated from VIEs
During the year ended September 30, 2014, Grupo Finmart entered into three separate agreements with third party investors and variable interest entities (“VIEs”) to securitize selected loans providing asset backed financing for operations. The VIEs issued promissory notes to the third party first beneficiaries of the VIEs. The debt described below is collateralized by all of the assets of the VIEs as presented in our condensed consolidated balance sheets described in Note 16.
19
The secured notes consolidated from VIEs contain certain prepayment clauses. Where the collections on consumer loans held by the VIEs are greater than anticipated in future reporting periods, we expect an accelerated repayment of the secured notes. See “Assets and Liabilities of Consolidated Variable Interest Entities” included in our condensed consolidated balance sheets.
During the six-months ended March 31, 2016, the VIEs repaid a net $22.4 million of debt that was outstanding as of September 30, 2015, including the impact of foreign exchange effects and amortization of deferred costs.
Consumer Loans Facility Due 2019
On February 17, 2014, Grupo Finmart entered into a new securitization transaction to transfer collection rights of certain eligible consumer loans to a bankruptcy remote trust in exchange for cash as discussed in Note 16.
In addition to the initial net payment of $6.9 million during the six-months ended March 31, 2016, including the impact of foreign exchange effects and amortization of deferred costs, the facility began amortizing at a monthly rate of $1.0 million beginning March 2016, which includes principal and interest at TIIE plus an applicable margin, through maturity of the facility in 2019.
NOTE 8: STOCK COMPENSATION
During fiscal 2015, we granted awards to employees based upon underlying shares that were not issued, and therefore we accounted for these as phantom share-based awards under FASB ASC 718-30. These awards were classified as a current liability and recorded at their fair value of $3.9 million in “Accounts payable and other accrued expenses” in our condensed consolidated balance sheets as of September 30, 2015. During the six-months ended March 31, 2016, we issued sufficient shares to allow treatment of these phantom share-based awards as equity awards under FASB ASC 718-20 and reclassified these awards to "Additional paid-in capital" in our condensed consolidated balance sheets. We continue recognizing compensation costs for these awards based on the original grant date fair value as the fair value of these awards have declined since the issuance and thus there were no incremental compensation costs. See Note 14 for additional information regarding the phantom share-based awards.
On May 1, 2010 our Board of Directors approved the adoption of the EZCORP, Inc. 2010 Long-Term Incentive Plan (the “2010 Plan”). The 2010 Plan permits grants of options, restricted stock awards and stock appreciation rights covering up to 1,575,750 shares of our Class A Common Stock plus any shares that become available for issuance under either the 2010 Plan or prior plans as a result of forfeitures or cancellations of awards without delivery of shares or as a result of withholding shares to satisfy tax withholding obligations. In February and March 2015, the Board of Directors and the voting stockholder approved the addition of 643,673 shares and 1,081,200 shares, respectively, to the 2010 Plan. In March 2016, the Board of Directors and the voting stockholder approved the addition of 185,026 shares to the 2010 Plan.
In March 2016, we granted 961,718 restricted stock unit awards (exclusive of canceled and replaced awards discussed below) to employees which were allocated based on the October 1, 2015 price of $6.17 per share and 130,000 restricted stock awards to non-employee directors with a grant date fair value of $2.96 per share. The awards granted to employees vest on September 30, 2018 subject to the achievement of certain performance targets. As of March 31, 2016, we considered the achievement of these performance targets probable. The awards granted to non-employee directors vest over two years, 50% on September 30, 2016 and 50% on September 30, 2017. We record compensation costs ratably over the requisite service periods for these awards.
In connection with the March 2016 grant discussed above, we canceled 720,000 previously issued restricted stock awards that were subject to vesting based on certain stock price levels and had a grant date fair value of $3.4 million and replaced them with 421,394 performance-based restricted stock awards described above. The cancellation and replacement of these awards was treated as a modification with unrecognized compensation cost from the original awards of $1.5 million plus incremental compensation costs resulting from the modification of $0.8 million recognized over the new requisite service period through September 30, 2018.
20
NOTE 9: TEMPORARY EQUITY AND NONCONTROLLING INTEREST
The following table provides a summary of the activity in our temporary equity and noncontrolling interest balances during the six-months ended March 31, 2016 and 2015:
Common Stock, Subject to Possible Redemption | Redeemable Noncontrolling Interest | Total Temporary Equity | Noncontrolling Interest | ||||||||||||
(in thousands) | |||||||||||||||
Balance as of September 30, 2014 | $ | — | $ | 22,800 | $ | 22,800 | $ | — | |||||||
Issuance of common stock, subject to possible redemption | 11,696 | — | 11,696 | — | |||||||||||
Net loss attributable to noncontrolling interest | — | (2,840 | ) | (2,840 | ) | — | |||||||||
Foreign currency translation adjustment attributable to noncontrolling interest | — | (3,227 | ) | (3,227 | ) | — | |||||||||
Amounts reclassified from accumulated other comprehensive loss | — | 94 | 94 | — | |||||||||||
Balance as of March 31, 2015 | $ | 11,696 | $ | 16,827 | $ | 28,523 | $ | — | |||||||
Balances as of September 30, 2015 | $ | 11,696 | $ | 3,235 | $ | 14,931 | $ | — | |||||||
Repurchase of redeemable common stock | (11,696 | ) | — | (11,696 | ) | — | |||||||||
Net loss attributable to noncontrolling interest | — | (4,134 | ) | (4,134 | ) | (324 | ) | ||||||||
Foreign currency translation adjustment attributable to noncontrolling interest | — | (331 | ) | (331 | ) | (6 | ) | ||||||||
Amounts reclassified from accumulated other comprehensive loss | — | 1 | 1 | — | |||||||||||
Balances as of March 31, 2016 | $ | — | $ | (1,229 | ) | $ | (1,229 | ) | $ | (330 | ) | ||||
Common Stock, Subject to Possible Redemption
On February 19, 2015, we completed the acquisition of 12 pawn stores in Central Texas doing business under the "Cash Pawn" brand. The aggregate purchase price for the acquisition was $16.5 million, comprised of $5.0 million cash and 1,168,456 shares of our Class A Non-voting Common Stock (the "Shares"), valued at $10.01 per share less a $0.2 million Holding Period Adjustment discussed below. The Shares were issued in an unregistered private placement transaction pursuant to Section 4(a)(2) of the Securities Act of 1933 to a small number of related individuals and entities (the "Sellers") who were either "accredited investors" or "sophisticated investors." On the first anniversary of the closing date, the Sellers exercised their right to require us to repurchase the Shares for an aggregate price of $11.8 million (the "Put Option").
The Put Option was not accounted for separately from the Shares and did not require bifurcation. The Shares were accounted for as common stock, subject to possible redemption under FASB ASC 480 Distinguishing Liabilities from Equity and were included in temporary equity in our condensed consolidated balance sheets prior to March 31, 2016. The Holding Period Adjustment was accounted for as a contingent consideration asset under FASB ASC 805 Business Combinations, was adjusted to fair value each reporting period, and was recorded in our condensed consolidated balance sheets at its estimated fair value under "Other assets, net" prior to March 31, 2016. See Note 14 for additional information regarding the Holding Period Adjustment.
Grupo Finmart
On January 30, 2012, we acquired a 60% interest in Grupo Finmart. On June 30, 2014, we acquired an additional 16% of the ordinary shares outstanding of Grupo Finmart, increasing our ownership percentage to 76%. On August 31, 2015, we acquired an additional 18% of the outstanding ordinary shares of Grupo Finmart, increasing our ownership percentage to 94%. The holders of the remaining 6% of the outstanding ordinary shares of Grupo Finmart have the right, exercisable once in fiscal 2016 and once in fiscal 2017, to require us to purchase their remaining shares at a purchase price based on an independent valuation of the business.
21
Noncontrolling Interest
During the six-months ended March 31, 2016, a consolidated subsidiary included in the Other International segment began operations in building an IT marketing platform to provide targeted solutions for our pawn customers. The noncontrolling interest is attributable to the 40% of this subsidiary held by the minority shareholder.
NOTE 10: INCOME TAXES
The effective tax rate from continuing operations for the three and six-months ended March 31, 2016 was (9)% and (3)%, respectively, of pre-tax (loss) income compared to (9)% and 170%, respectively, for the three and six-months ended March 31, 2015. The effective tax rates changed for the fiscal 2016 periods as a result of losses in foreign jurisdictions with a lower tax rate and permanently non-deductible items, which included the impairment of non-deductible goodwill associated with Grupo Finmart. The effective tax rate for the three-months ended March 31, 2015 was reduced by foreign tax credits and costs paid to offshore affiliates.
In March 2016, we received $34.2 million as a result of the carryback of fiscal 2015 tax net operating losses.
NOTE 11: CONTINGENCIES
We are involved in various claims, suits, investigations and legal proceedings, including those described below. We are unable to determine the ultimate outcome of any current litigation or regulatory actions. An unfavorable outcome could have a material adverse effect on our financial condition, results of operations or liquidity. We have not recorded a liability for any of these matters as of March 31, 2016 because we do not believe at this time that any loss is probable or that the amount of any probable loss can be reasonably estimated. The following is a description of significant proceedings.
Shareholder derivative litigation — On July 28, 2014, Lawrence Treppel, a purported holder of Class A Non-voting Common Stock, filed a derivative action in the Court of Chancery of the State of Delaware styled Treppel v. Cohen, et al. (C.A. No. 9962-VCP). The complaint, as originally filed and as amended on September 23, 2014, names as defendants Phillip E. Cohen, the beneficial owner of all of our outstanding Class B Voting Common Stock; several current and former members of our Board of Directors (Joseph J. Beal, Sterling B. Brinkley, John Farrell, Pablo Lagos Espinosa, William C. Love, Thomas C. Roberts and Paul E. Rothamel); three entities controlled by Mr. Cohen (MS Pawn Limited Partnership, the record holder of our Class B Voting Common Stock; MS Pawn Corporation, the general partner of MS Pawn Limited Partnership; and Madison Park LLC); and EZCORP, Inc., as nominal defendant. The amended complaint asserts the following claims:
• | Claims against the current and former Board members for breach of fiduciary duties and waste of corporate assets in connection with the Board’s decision to enter into advisory services agreements with Madison Park from October 2004 to June 2014 (Counts I and II, respectively); |
• | Claims against Mr. Cohen and MS Pawn Limited Partnership for aiding and abetting the breaches of fiduciary duties relating to the advisory services agreements with Madison Park (Count III); and |
• | Claims against Mr. Cohen and Madison Park for unjust enrichment for payments under the advisory services agreements (Count IV). |
The plaintiff seeks (a) recovery for the Company in the amount of the damages the Company has sustained as a result of the alleged breach of fiduciary duties, waste of corporate assets and aiding and abetting, (b) disgorgement by Mr. Cohen and Madison Park of the benefits they received as a result of the related party transactions and (c) reimbursement of costs and expenses, including reasonable attorney’s fees.
On November 13, 2014, pursuant to the parties’ stipulation, the Court dismissed the action as to Mr. Brinkley, Mr. Rothamel and Mr. Lagos.
The remaining defendants filed motions to dismiss, and a hearing on those motions was held before the Court on September 8, 2015. Prior to that hearing, the plaintiff proposed a dismissal without prejudice for the claims against Mr. Beal, Mr. Love and Mr. Farrell. Those defendants continued to seek a dismissal with prejudice that would bind all potential plaintiffs. On January 15, 2016, the Court issued an opinion dismissing the action as to Mr. Beal, Mr. Love and Mr. Farrell with prejudice only as to the plaintiff.
On January 25, 2016, the Court issued a separate opinion granting in part and denying in part the motions to dismiss filed by the remaining defendants. Specifically, the Court granted the motion to dismiss Count IV (unjust enrichment) for failure to state a claim. The Court also dismissed Count III (aiding and abetting) as to Mr. Cohen, but interpreted Count I (breach of fiduciary
22
duty) to state a claim against Mr. Cohen and MS Pawn, as well as Mr. Roberts. The Court otherwise denied the motions to dismiss, including the motion to dismiss Count III (aiding and abetting) against MS Pawn.
On February 4, 2016, the remaining defendants filed an Application for Certification of Interlocutory Appeal, which the plaintiff opposed on February 15, 2016, and the Court set a hearing on the application. On February 22, 2016, the Court denied the Application for Certification of Interlocutory Appeal and provided the plaintiff the opportunity to amend its complaint to add a fiduciary-duty claim as to Mr. Cohen and Madison Park, staying proceedings pending a ruling from the Delaware Supreme Court. After the Application for Certification of Interlocutory Appeal was denied, Mr. Roberts, MS Pawn Corporation and MS Pawn Limited Partnership filed notices of appeal from the interlocutory opinion and order denying the motions to dismiss. On March 10, 2016, the Delaware Supreme Court denied those petitions for an interlocutory appeal.
On March 4, 2016, the plaintiff filed a Second Amended Derivative Complaint against Mr. Roberts, Mr. Cohen, Madison Park, MS Pawn Corporation and MS Pawn Limited Partnership with EZCORP, Inc., as nominal defendant.
We intend to continue to defend vigorously against the claims asserted in this lawsuit. Although the lawsuit does not seek relief against the Company, we have certain indemnification obligations to the other defendants (including Madison Park and Mr. Cohen), which obligations include the payment of attorney’s fees in advance of the outcome. We cannot predict the outcome of this lawsuit, or the amount of time and expense that will be required to resolve it.
Federal securities litigation (SDNY) — On August 22, 2014, Jason Close, a purported holder of Class A Non-voting Common Stock, for himself and on behalf of other similarly situated holders of Class A Non-voting Common Stock, filed a lawsuit in the United States District Court for the Southern District of New York styled Close v. EZCORP, Inc., et al. (Case No. 1:14-cv-06834-ALC). The complaint names as defendants EZCORP, Inc., Paul E. Rothamel (our former chief executive officer) and Mark Kuchenrither (our former chief financial officer and former chief operating officer) and asserts violations of Sections 10(b) and 20(a) of the Securities Exchange Act of 1934. In general, the complaint alleges that the implementation of certain strategic and growth initiatives were less successful than represented by the defendants, that certain of the Company’s business units and investments were not performing as well as represented by the defendants and that, as a result, the defendants’ disclosures and statements about the Company’s business and operations were materially false and misleading at all relevant times.
On October 17, 2014, the Automotive Machinists Pension Plan, also purporting to be the holder of Class A Non-voting Common Stock and acting for itself and on behalf of other similarly situated holders of Class A Non-voting Common Stock, filed a lawsuit in the United Stated District Court for the Southern District of New York styled Automotive Machinists Pension Plan v. EZCORP, Inc., et al. (Case No. 1:14-cv-8349-ALC). The complaint names EZCORP, Inc., Mr. Rothamel and Mr. Kuchenrither as defendants, but also names Mr. Cohen and MS Pawn Limited Partnership. The complaint likewise asserts violations of Sections 10(b) and 20(a) of the Securities Exchange Act of 1934, as well as Rule 10b-5 promulgated thereunder, alleging generally that (1) EZCORP and the officer defendants (Mr. Rothamel and Mr. Kuchenrither) issued false and misleading statements and omissions concerning the business and prospects, and compliance history, of the Company’s online lending operations in the U.K. and the nature of the Company’s consulting relationship with entities owned by Mr. Cohen and the process the Board of Directors used in agreeing to it, and (2) Mr. Cohen and MS Pawn Limited Partnership, as controlling persons of EZCORP, participated in the preparation and dissemination of the Company’s disclosures and controlled the Company’s business strategy and activities.
On October 21, 2014, the plaintiff in the Automotive Machinists Pension Plan action filed a motion to consolidate the Close action and the Automotive Machinists Pension Plan action and to appoint the Automotive Machinists Pension Plan as the lead plaintiff. On November 18, 2014, the court consolidated the two lawsuits under the caption In Re EZCORP, Inc. Securities Litigation (Case No. 1:14-cv-06834-ALC), and on January 26, 2015, appointed the lead plaintiff and lead counsel.
On March 12, 2015, the lead plaintiff filed a Consolidated Amended Class Action Complaint (the "Amended Complaint"). The Amended Complaint asserts violations of Sections 10(b) and 20(a) of the Securities Exchange Act of 1934, as well as Rule 10b-5 promulgated thereunder, alleging generally that:
• | EZCORP and the officer defendants (Mr. Rothamel and Mr. Kuchenrither) issued false and misleading statements and omissions regarding the Company's online lending operations in the U.K. (Cash Genie) and Cash Genie's compliance history; |
• | EZCORP and the officer defendants issued false and misleading statements and omissions regarding the nature of the Company's consulting relationship with Madison Park LLC (as entity owned by Mr. Cohen) and the process the Board of Directors used in agreeing to it; |
• | EZCORP's financial statements were false and misleading, and violated GAAP and SEC rules and regulations, by failing to properly recognize impairment charges with respect to the Company's investment in Albemarle & Bond; and |
23
• | Mr. Cohen and MS Pawn Limited Partnership, as controlling persons of EZCORP, were aware of and controlled the Company's alleged false and misleading statements and omissions. |
On April 27 2015, the defendants filed motions to dismiss, and the parties submitted their respective supporting and opposing briefs. On March 31, 2016, the Court granted in part and denied in part the defendants' motions to dismiss. Specifically, it dismissed the Section 10(b) and Rule 10b-5 claims insofar as they were based on (1) the alleged misstatements about the nature of and approval process related to the Company's consulting relationship with Madison Park, (2) the alleged misstatements regarding the impairment of the Company's investment in Albemarle & Bond, and (3) some of the alleged misstatements about Cash Genie. The Section 10(b) and Rule 10b-5 claims survived the motions to dismiss insofar as they were based on certain alleged misstatements about Cash Genie. The Section 20(a) claims also survived the motions to dismiss.
We cannot predict the outcome of the litigation, but we intend to continue to defend vigorously against all allegations and claims.
Federal Securities Litigation (WDT) — On July 20, 2015, Wu Winfred Huang, a purported holder of Class A Non-voting Common Stock, for himself and on behalf of other similarly situated holders of Class A Non-voting Common Stock, filed a lawsuit in the United States District Court for the Western District of Texas styled Huang v. EZCORP, Inc., et al. (Case No. 1:15-cv-00608-SS). The complaint names as defendants EZCORP, Inc., Stuart I. Grimshaw (our chief executive officer) and Mark E. Kuchenrither (our former chief financial officer) and asserts violations of Sections 10(b) and 20(a) of the Securities Exchange Act of 1934 and Rule 10b-5 promulgated thereunder. The original complaint related to the Company’s announcement on July 17, 2015 that it will restate the financial statements for fiscal 2014 and the first quarter of fiscal 2015, and alleged generally that the Company issued materially false or misleading statements concerning the Company, its finances, business operations and prospects and that the Company misrepresented the financial performance of the Grupo Finmart business.
On August 14, 2015, a substantially identical lawsuit, styled Rooney v. EZCORP, Inc., et al. (Case No. 1:15-cv-00700-SS) was also filed in the United States District Court for the Western District of Texas. On September 28, 2015, the plaintiffs in these 2 lawsuits filed an agreed stipulation to be appointed co-lead plaintiffs and agreed that their two actions should be consolidated. On November 3, 2015, the Court entered an order consolidating the two actions under the caption In re EZCORP, Inc. Securities Litigation (Master File No. 1:15-cv-00608-SS), and appointed the two plaintiffs as co-lead plaintiffs, with their respective counsel appointed as co-lead counsel.
On January 11, 2016, the plaintiffs filed an Amended Class Action Complaint (the "Amended Complaint"). In the Amended Complaint, the plaintiffs seek to represent a class of purchasers of our Class A Common Stock between November 6, 2015 and October 20, 2015. The Amended Complaint asserts that the Company and Mr. Kuchenrither violated Section 10(b) of the Securities Exchange Act and Rule 10b-5, issued materially false or misleading statements throughout the proposed class period concerning the Company and its internal controls, specifically regarding the financial performance of Grupo Finmart. The plaintiffs also allege that Mr. Kuchenrither, as a controlling person of the Company, violated Section 20(a) of the Securities Exchange Act. The Amended Complaint does not assert any claims against Mr. Grimshaw. On February 25, 2016, defendants filed a motion to dismiss the lawsuit. The plaintiff filed an opposition to the motion to dismiss on April 11, 2016, and the defendants' reply is due on May 11, 2016.
We cannot predict the outcome of the litigation, but we intend to defend vigorously against all allegations and claims.
SEC Investigation — On October 23, 2014, we received a notice from the Fort Worth Regional Office of the SEC that it was conducting an investigation into certain matters involving EZCORP, Inc. The notice was accompanied by a subpoena, directing us to produce a variety of documents, including all minutes and materials related to Board of Directors and Board committee meetings since January 1, 2009 and all documents and communications relating to our historical advisory services relationship with Madison Park (the business advisory firm owned by Mr. Cohen) and LPG Limited (a business advisory firm owned by Lachlan P. Given, our current Executive Chairman of the Board). The SEC has also issued subpoenas to current and former members of our Board of Directors requesting production of similar documents, as well as to certain third parties, and has conducted interviews with certain individuals. We continue to cooperate fully with the SEC in its investigation.
NOTE 12: SEGMENT INFORMATION
We currently report our segments as follows:
• | U.S. Pawn — All pawn activities in the United States |
• | Mexico Pawn — All pawn activities in Mexico and other parts of Latin America |
• | Grupo Finmart — All payroll lending activities in Mexico and other parts of Latin America |
24
• | Other International — Primarily our equity interest in the net income of Cash Converters International and consumer finance activities in Canada |
There are no inter-segment revenues, and the amounts below were determined in accordance with the same accounting principles used in our condensed consolidated financial statements. The following tables present operating segment information for the three and six-months ended March 31, 2016 and 2015, including reclassifications discussed in Note 1 and adjustments to reflect reclassification of all discontinued operations discussed in Note 2.
Three Months Ended March 31, 2016 | |||||||||||||||||||||||||||
U.S. Pawn | Mexico Pawn | Grupo Finmart | Other International | Total Segments | Corporate Items | Consolidated | |||||||||||||||||||||
(in thousands) | |||||||||||||||||||||||||||
Revenues: | |||||||||||||||||||||||||||
Merchandise sales | $ | 94,740 | $ | 14,603 | $ | — | $ | — | $ | 109,343 | $ | — | $ | 109,343 | |||||||||||||
Jewelry scrapping sales | 11,599 | 1,181 | — | — | 12,780 | — | 12,780 | ||||||||||||||||||||
Pawn service charges | 56,614 | 7,516 | — | — | 64,130 | — | 64,130 | ||||||||||||||||||||
Consumer loan fees and interest | — | — | 13,589 | 2,027 | 15,616 | — | 15,616 | ||||||||||||||||||||
Other revenues | 49 | (117 | ) | 98 | — | 30 | — | 30 | |||||||||||||||||||
Total revenues | 163,002 | 23,183 | 13,687 | 2,027 | 201,899 | — | 201,899 | ||||||||||||||||||||
Merchandise cost of goods sold | 58,241 | 10,090 | — | 1 | 68,332 | — | 68,332 | ||||||||||||||||||||
Jewelry scrapping cost of goods sold | 10,128 | 957 | — | — | 11,085 | — | 11,085 | ||||||||||||||||||||
Consumer loan bad debt | — | — | 8,252 | 431 | 8,683 | — | 8,683 | ||||||||||||||||||||
Net revenues | 94,633 | 12,136 | 5,435 | 1,595 | 113,799 | — | 113,799 | ||||||||||||||||||||
Segment and corporate expenses (income): | |||||||||||||||||||||||||||
Operations | 61,240 | 9,024 | 8,026 | 1,992 | 80,282 | — | 80,282 | ||||||||||||||||||||
Administrative | — | — | — | — | — | 15,621 | 15,621 | ||||||||||||||||||||
Depreciation and amortization | 3,042 | 764 | 476 | 56 | 4,338 | 2,744 | 7,082 | ||||||||||||||||||||
Loss on sale or disposal of assets | 546 | 103 | — | — | 649 | — | 649 | ||||||||||||||||||||
Restructuring | 91 | 215 | — | (2 | ) | 304 | (86 | ) | 218 | ||||||||||||||||||
Interest expense | 39 | 38 | 4,498 | — | 4,575 | 3,874 | 8,449 | ||||||||||||||||||||
Interest income | — | — | (120 | ) | — | (120 | ) | (7 | ) | (127 | ) | ||||||||||||||||
Equity in net income of unconsolidated affiliate | — | — | — | (1,877 | ) | (1,877 | ) | — | (1,877 | ) | |||||||||||||||||
Impairment of goodwill | — | — | 73,921 | — | 73,921 | — | 73,921 | ||||||||||||||||||||
Other expense (income) | — | (79 | ) | (124 | ) | 6 | (197 | ) | 286 | 89 | |||||||||||||||||
Segment (loss) contribution | $ | 29,675 | $ | 2,071 | $ | (81,242 | ) | $ | 1,420 | $ | (48,076 | ) | |||||||||||||||
Loss from continuing operations before income taxes | $ | (48,076 | ) | $ | (22,432 | ) | $ | (70,508 | ) | ||||||||||||||||||
25
Three Months Ended March 31, 2015 | |||||||||||||||||||||||||||
U.S. Pawn | Mexico Pawn | Grupo Finmart | Other International | Total Segments | Corporate Items | Consolidated | |||||||||||||||||||||
(in thousands) | |||||||||||||||||||||||||||
Revenues: | |||||||||||||||||||||||||||
Merchandise sales | $ | 92,472 | $ | 14,883 | $ | — | $ | 497 | $ | 107,852 | $ | — | $ | 107,852 | |||||||||||||
Jewelry scrapping sales | 17,391 | 917 | — | 91 | 18,399 | — | 18,399 | ||||||||||||||||||||
Pawn service charges | 52,317 | 7,153 | — | — | 59,470 | — | 59,470 | ||||||||||||||||||||
Consumer loan fees and interest | — | — | 16,391 | 2,153 | 18,544 | — | 18,544 | ||||||||||||||||||||
Other revenues | 224 | 269 | 49 | 368 | 910 | — | 910 | ||||||||||||||||||||
Total revenues | 162,404 | 23,222 | 16,440 | 3,109 | 205,175 | — | 205,175 | ||||||||||||||||||||
Merchandise cost of goods sold | 61,490 | 10,680 | — | 322 | 72,492 | — | 72,492 | ||||||||||||||||||||
Jewelry scrapping cost of goods sold | 13,463 | 820 | — | 71 | 14,354 | — | 14,354 | ||||||||||||||||||||
Consumer loan bad debt | — | — | 4,110 | 651 | 4,761 | — | 4,761 | ||||||||||||||||||||
Net revenues | 87,451 | 11,722 | 12,330 | 2,065 | 113,568 | — | 113,568 | ||||||||||||||||||||
Segment and corporate expenses (income): | |||||||||||||||||||||||||||
Operations | 57,920 | 10,406 | 7,109 | 1,755 | 77,190 | — | 77,190 | ||||||||||||||||||||
Administrative | — | — | — | — | — | 14,800 | 14,800 | ||||||||||||||||||||
Depreciation and amortization | 3,607 | 1,101 | 626 | 162 | 5,496 | 2,599 | 8,095 | ||||||||||||||||||||
Loss on sale or disposal of assets | 17 | 1 | — | — | 18 | 369 | 387 | ||||||||||||||||||||
Restructuring | — | — | — | — | — | 704 | 704 | ||||||||||||||||||||
Interest expense | 5 | 1 | 6,376 | — | 6,382 | 4,914 | 11,296 | ||||||||||||||||||||
Interest income | (15 | ) | (24 | ) | (423 | ) | — | (462 | ) | (50 | ) | (512 | ) | ||||||||||||||
Equity in net loss of unconsolidated affiliate | — | — | — | 3,678 | 3,678 | — | 3,678 | ||||||||||||||||||||
Other expense | — | 282 | 1,272 | 7 | 1,561 | 301 | 1,862 | ||||||||||||||||||||
Segment contribution (loss) | $ | 25,917 | $ | (45 | ) | $ | (2,630 | ) | $ | (3,537 | ) | $ | 19,705 | ||||||||||||||
Loss from continuing operations before income taxes | $ | 19,705 | $ | (23,637 | ) | $ | (3,932 | ) | |||||||||||||||||||
26
Six Months Ended March 31, 2016 | |||||||||||||||||||||||||||
U.S. Pawn | Mexico Pawn | Grupo Finmart | Other International | Total Segments | Corporate Items | Consolidated | |||||||||||||||||||||
(in thousands) | |||||||||||||||||||||||||||
Revenues: | |||||||||||||||||||||||||||
Merchandise sales | $ | 186,734 | $ | 31,189 | $ | — | $ | 4 | $ | 217,927 | $ | — | $ | 217,927 | |||||||||||||
Jewelry scrapping sales | 21,199 | 1,181 | — | 21 | 22,401 | — | 22,401 | ||||||||||||||||||||
Pawn service charges | 115,235 | 15,489 | — | — | 130,724 | — | 130,724 | ||||||||||||||||||||
Consumer loan fees and interest | — | — | 24,403 | 4,401 | 28,804 | — | 28,804 | ||||||||||||||||||||
Other revenues | 242 | 74 | 181 | — | 497 | — | 497 | ||||||||||||||||||||
Total revenues | 323,410 | 47,933 | 24,584 | 4,426 | 400,353 | — | 400,353 | ||||||||||||||||||||
Merchandise cost of goods sold | 113,702 | 20,888 | — | 1 | 134,591 | — | 134,591 | ||||||||||||||||||||
Jewelry scrapping cost of goods sold | 18,188 | 957 | — | 16 | 19,161 | — | 19,161 | ||||||||||||||||||||
Consumer loan bad debt | — | — | 20,243 | 1,043 | 21,286 | — | 21,286 | ||||||||||||||||||||
Net revenues | 191,520 | 26,088 | 4,341 | 3,366 | 225,315 | — | 225,315 | ||||||||||||||||||||
Segment and corporate expenses (income): | |||||||||||||||||||||||||||
Operations | 124,785 | 20,217 | 17,614 | 3,272 | 165,888 | — | 165,888 | ||||||||||||||||||||
Administrative | — | — | — | — | — | 35,604 | 35,604 | ||||||||||||||||||||
Depreciation and amortization | 6,602 | 1,565 | 993 | 107 | 9,267 | 5,874 | 15,141 | ||||||||||||||||||||
Loss on sale or disposal of assets | 553 | 129 | — | — | 682 | — | 682 | ||||||||||||||||||||
Restructuring | 982 | 543 | — | 202 | 1,727 | 183 | 1,910 | ||||||||||||||||||||
Interest expense | 125 | 78 | 9,563 | — | 9,766 | 7,875 | 17,641 | ||||||||||||||||||||
Interest income | (1 | ) | — | (251 | ) | — | (252 | ) | (15 | ) | (267 | ) | |||||||||||||||
Equity in net income of unconsolidated affiliate | — | — | — | (3,932 | ) | (3,932 | ) | — | (3,932 | ) | |||||||||||||||||
Impairment of goodwill | — | — | 73,921 | — | 73,921 | — | 73,921 | ||||||||||||||||||||
Other expense | — | 49 | 644 | 3 | 696 | 263 | 959 | ||||||||||||||||||||
Segment (loss) contribution | $ | 58,474 | $ | 3,507 | $ | (98,143 | ) | $ | 3,714 | $ | (32,448 | ) | |||||||||||||||
Loss from continuing operations before income taxes | $ | (32,448 | ) | $ | (49,784 | ) | $ | (82,232 | ) | ||||||||||||||||||
27
Six Months Ended March 31, 2015 | |||||||||||||||||||||||||||
U.S. Pawn | Mexico Pawn | Grupo Finmart | Other International | Total Segments | Corporate Items | Consolidated | |||||||||||||||||||||
(in thousands) | |||||||||||||||||||||||||||
Revenues: | |||||||||||||||||||||||||||
Merchandise sales | $ | 181,914 | $ | 34,463 | $ | — | $ | 1,114 | $ | 217,491 | $ | — | $ | 217,491 | |||||||||||||
Jewelry scrapping sales | 34,398 | 2,324 | — | 211 | 36,933 | — | 36,933 | ||||||||||||||||||||
Pawn service charges | 109,352 | 15,045 | — | — | 124,397 | — | 124,397 | ||||||||||||||||||||
Consumer loan fees and interest | — | — | 32,706 | 4,809 | 37,515 | — | 37,515 | ||||||||||||||||||||
Other revenues | 408 | 509 | 105 | 543 | 1,565 | — | 1,565 | ||||||||||||||||||||
Total revenues | 326,072 | 52,341 | 32,811 | 6,677 | 417,901 | — | 417,901 | ||||||||||||||||||||
Merchandise cost of goods sold | 120,107 | 24,164 | — | 699 | 144,970 | — | 144,970 | ||||||||||||||||||||
Jewelry scrapping cost of goods sold | 26,796 | 2,081 | — | 152 | 29,029 | — | 29,029 | ||||||||||||||||||||
Consumer loan bad debt | — | — | 11,850 | 1,426 | 13,276 | — | 13,276 | ||||||||||||||||||||
Net revenues | 179,169 | 26,096 | 20,961 | 4,400 | 230,626 | — | 230,626 | ||||||||||||||||||||
Segment and corporate expenses (income): | |||||||||||||||||||||||||||
Operations | 117,427 | 20,926 | 15,397 | 3,527 | 157,277 | — | 157,277 | ||||||||||||||||||||
Administrative | — | — | — | — | — | 27,352 | 27,352 | ||||||||||||||||||||
Depreciation and amortization | 7,059 | 2,345 | 1,192 | 353 | 10,949 | 5,154 | 16,103 | ||||||||||||||||||||
Loss on sale or disposal of assets | 17 | 257 | — | — | 274 | 369 | 643 | ||||||||||||||||||||
Restructuring | — | — | — | — | — | 726 | 726 | ||||||||||||||||||||
Interest expense | 13 | 2 | 14,657 | — | 14,672 | 8,658 | 23,330 | ||||||||||||||||||||
Interest income | (31 | ) | (24 | ) | (904 | ) | — | (959 | ) | (84 | ) | (1,043 | ) | ||||||||||||||
Equity in net loss of unconsolidated affiliate | — | — | — | 1,484 | 1,484 | — | 1,484 | ||||||||||||||||||||
Other expense | — | 720 | 1,446 | 10 | 2,176 | 445 | 2,621 | ||||||||||||||||||||
Segment contribution (loss) | $ | 54,684 | $ | 1,870 | $ | (10,827 | ) | $ | (974 | ) | $ | 44,753 | |||||||||||||||
Income from continuing operations before income taxes | $ | 44,753 | $ | (42,620 | ) | $ | 2,133 | ||||||||||||||||||||
NOTE 13: ALLOWANCE FOR LOSSES AND CREDIT QUALITY OF CONSUMER LOANS
Grupo Finmart customers obtain installment loans with a series of payments due over the stated term, which can be as long as four years. We recognize consumer loan interest related to loans we originate based on the percentage of consumer loans made that we believe to be collectible, and reserve the percentage of interest we expect not to collect, over the period in which payments are expected to be received under the effective interest method.
Loans to Grupo Finmart customers whose employment is continuing are referred to as “in-payroll” loans, while loans to Grupo Finmart customers whose employment is discontinued are referred to as “out-of-payroll” loans. A customer is generally considered to have discontinued their employment if they are no longer employed by the employer that is responsible for the payroll withholding. We do not reclassify non-performing loans to performing status if there are subsequent collections on the non-performing loans. We establish reserves for Grupo Finmart loans as follows:
• | We reserve 100% of non-performing loans, which for this purpose we consider to be: |
◦ | Out-of-payroll loans for which Grupo Finmart is not receiving payments; and |
◦ | In-payroll loans for which Grupo Finmart has not received any payments for 180 consecutive days. |
• | We also establish additional reserves on loan principal and accrued interest reserves for performing loans based on historical experience. |
28
When we reserve 100% of a Grupo Finmart loan, we charge the loan principal to consumer loan bad debt expense, reduce interest revenue by the amount of unpaid interest theretofore accrued on the loan and cease accruing interest revenue. Future collections are recorded as a reduction of consumer loan bad debt expense (in the case of written-off principal) and an increase in consumer loan fee revenue (in the case of written-off accrued interest) after principal has been recovered. Long-term unsecured consumer loan bad debt expense is included in "Consumer loan bad debt" expense in our condensed consolidated statements of operations.
Grupo Finmart provides an allowance for losses on performing, in-payroll loans and related interest receivable based on historical collection experience. Changes in the principal valuation allowance are charged to "Consumer loan bad debt" expense and changes in the interest receivable valuation allowance are charged to "Consumer loan fees and interest" in our condensed consolidated statements of operations.
29
The following table presents changes in the allowance for credit losses, as well as the recorded investment in our financing receivables by portfolio segment for the periods presented and excludes items such as non-sufficient funds fees, repossession fees, auction fees and interest:
Description | Allowance Balance at Beginning of Period | Charge-offs | Recoveries | Provision (Benefit) | Translation Adjustment | Allowance Balance at End of Period (a) | Financing Receivable at End of Period (a) | |||||||||||||||||||||
(in thousands) | ||||||||||||||||||||||||||||
Unsecured short-term consumer loans: (b) | ||||||||||||||||||||||||||||
Three Months Ended March 31, 2016 | $ | 8,992 | $ | (1,152 | ) | $ | 568 | $ | 318 | $ | (267 | ) | $ | 8,459 | $ | 10,724 | ||||||||||||
Three Months Ended March 31, 2015 | 13,368 | (7,029 | ) | 3,495 | 2,862 | (479 | ) | 12,217 | 26,265 | |||||||||||||||||||
Six Months Ended March 31, 2016 | 11,498 | (4,229 | ) | 2,209 | (500 | ) | (519 | ) | 8,459 | 10,724 | ||||||||||||||||||
Six Months Ended March 31, 2015 | 14,645 | (16,080 | ) | 6,786 | 7,858 | (992 | ) | 12,217 | 26,265 | |||||||||||||||||||
Secured short-term consumer loans: (c) | ||||||||||||||||||||||||||||
Three Months Ended March 31, 2016 | $ | — | $ | — | $ | — | $ | — | $ | — | $ | — | $ | — | ||||||||||||||
Three Months Ended March 31, 2015 | 1,134 | (12,955 | ) | 11,748 | 889 | — | 816 | 5,299 | ||||||||||||||||||||
Six Months Ended March 31, 2016 | 2,004 | (2,229 | ) | 436 | (211 | ) | — | — | — | |||||||||||||||||||
Six Months Ended March 31, 2015 | 1,049 | (27,392 | ) | 24,737 | 2,422 | — | 816 | 5,299 | ||||||||||||||||||||
Unsecured long-term consumer loans: (a) | ||||||||||||||||||||||||||||
Three Months Ended March 31, 2016 | $ | 61,158 | $ | (469 | ) | $ | — | $ | 8,432 | $ | 478 | $ | 69,599 | $ | 156,369 | |||||||||||||
Three Months Ended March 31, 2015 | 42,182 | (101 | ) | — | 4,052 | (1,412 | ) | 44,721 | 161,579 | |||||||||||||||||||
Six Months Ended March 31, 2016 | 50,645 | (1,213 | ) | — | 20,234 | (67 | ) | 69,599 | 156,369 | |||||||||||||||||||
Six Months Ended March 31, 2015 | 38,087 | (268 | ) | — | 11,663 | (4,761 | ) | 44,721 | 161,579 | |||||||||||||||||||
(a) | Portions of these amounts are included in "Consumer loans, net" and "Non-current consumer loans, net" in our condensed consolidated balance sheets. These amounts pertain to Grupo Finmart consumer loans. |
(b) | No aging allowance disclosure provided for these amounts as our policy is to charge-off all amounts on the first day after the due date. These amounts primarily include activity pertaining to our Canadian operations in the Other International segment. |
(c) | As a result of our discontinuance of USFS, our secured short-term consumer loan balance was reduced to zero as of December 31, 2015. As such, no further aging allowance disclosure has been provided for these amounts. Refer to Note 2 for further detail on discontinued operations. |
The following table presents an aging analysis of past due financing receivables held by Grupo Finmart:
Days Past Due | Total Past Due | Current Receivable | Translation Adjustment | Total Financing Receivable | Allowance Balance | Recorded Investment > 90 Days Accruing | |||||||||||||||||||||||||||||||||
1-30 | 31-60 | 61-90 | >90 | ||||||||||||||||||||||||||||||||||||
(in thousands) | |||||||||||||||||||||||||||||||||||||||
Unsecured long-term consumer loans: | |||||||||||||||||||||||||||||||||||||||
March 31, 2016 | |||||||||||||||||||||||||||||||||||||||
Performing loans | $ | 6,537 | $ | 3,856 | $ | 2,485 | $ | 5,651 | $ | 18,529 | $ | 72,642 | $ | 106 | $ | 91,277 | $ | 4,507 | $ | 5,651 | |||||||||||||||||||
Non-performing loans | 875 | 835 | 868 | 59,810 | 62,388 | 2,704 | — | 65,092 | 65,092 | — | |||||||||||||||||||||||||||||
$ | 7,412 | $ | 4,691 | $ | 3,353 | $ | 65,461 | $ | 80,917 | $ | 75,346 | $ | 106 | $ | 156,369 | $ | 69,599 | $ | 5,651 | ||||||||||||||||||||
March 31, 2015 | |||||||||||||||||||||||||||||||||||||||
Performing loans | $ | 9,536 | $ | 4,133 | $ | 1,813 | $ | 834 | $ | 16,316 | $ | 105,524 | $ | 1,110 | $ | 122,950 | $ | 6,092 | $ | 834 | |||||||||||||||||||
Non-performing loans | 1,092 | 1,801 | 1,813 | 32,611 | 37,317 | 1,312 | — | 38,629 | 38,629 | — | |||||||||||||||||||||||||||||
$ | 10,628 | $ | 5,934 | $ | 3,626 | $ | 33,445 | $ | 53,633 | $ | 106,836 | $ | 1,110 | $ | 161,579 | $ | 44,721 | $ | 834 | ||||||||||||||||||||
September 30, 2015 | |||||||||||||||||||||||||||||||||||||||
Performing loans | $ | 6,783 | $ | 6,179 | $ | 6,776 | $ | 5,766 | $ | 25,504 | $ | 87,272 | $ | — | $ | 112,776 | $ | 5,128 | $ | 5,766 | |||||||||||||||||||
Non-performing loans | 553 | 701 | 613 | 41,670 | 43,537 | 1,980 | — | 45,517 | 45,517 | — | |||||||||||||||||||||||||||||
$ | 7,336 | $ | 6,880 | $ | 7,389 | $ | 47,436 | $ | 69,041 | $ | 89,252 | $ | — | $ | 158,293 | $ | 50,645 | $ | 5,766 | ||||||||||||||||||||
30
NOTE 14: FAIR VALUE MEASUREMENTS
In accordance with FASB ASC 820-10, our assets and liabilities discussed below are classified in one of the following three categories based on the inputs used to develop their fair values:
• | Level 1: Quoted market prices in active markets for identical assets or liabilities |
• | Level 2: Other observable market-based inputs or unobservable inputs that are corroborated by market data |
• | Level 3: Unobservable inputs that are not corroborated by market data |
Recurring Fair Value Measurements
The tables below present our financial assets (liabilities) that were measured at fair value on a recurring basis as of March 31, 2016 and 2015 and September 30, 2015:
March 31, 2016 | Fair Value Measurements Using | |||||||||||||||
Financial assets (liabilities) | Level 1 | Level 2 | Level 3 | |||||||||||||
(in thousands) | ||||||||||||||||
Foreign currency forwards | $ | 7,694 | $ | — | $ | 7,694 | $ | — | ||||||||
Cash Convertible Notes Hedges | 3,219 | — | 3,219 | — | ||||||||||||
Cash Convertible Notes Embedded Derivative | (3,219 | ) | — | (3,219 | ) | — | ||||||||||
Contingent consideration | (2,575 | ) | — | — | (2,575 | ) | ||||||||||
Net financial assets (liabilities) | $ | 5,119 | $ | — | $ | 7,694 | $ | (2,575 | ) | |||||||
March 31, 2015 | Fair Value Measurements Using | |||||||||||||||
Financial assets (liabilities) | Level 1 | Level 2 | Level 3 | |||||||||||||
(in thousands) | ||||||||||||||||
Foreign currency forwards | $ | 8,563 | $ | — | $ | 8,563 | $ | — | ||||||||
Holding Period Adjustment | 132 | — | 132 | — | ||||||||||||
Cash Convertible Notes Hedges | 27,215 | — | 27,215 | — | ||||||||||||
Cash Convertible Notes Embedded Derivative | (27,215 | ) | — | (27,215 | ) | — | ||||||||||
Contingent consideration | (2,914 | ) | — | — | (2,914 | ) | ||||||||||
Net financial assets (liabilities) | $ | 5,781 | $ | — | $ | 8,695 | $ | (2,914 | ) | |||||||
September 30, 2015 | Fair Value Measurements Using | |||||||||||||||
Financial assets (liabilities) | Level 1 | Level 2 | Level 3 | |||||||||||||
(in thousands) | ||||||||||||||||
Foreign currency forwards | $ | 14,169 | $ | — | $ | 14,169 | $ | — | ||||||||
Holding Period Adjustment | 4 | — | 4 | — | ||||||||||||
Cash Convertible Notes Hedges | 10,505 | — | 10,505 | — | ||||||||||||
Cash Convertible Notes Embedded Derivative | (10,505 | ) | — | (10,505 | ) | — | ||||||||||
Phantom share-based awards | (3,932 | ) | — | — | (3,932 | ) | ||||||||||
Contingent consideration | (2,601 | ) | — | — | (2,601 | ) | ||||||||||
Net financial assets (liabilities) | $ | 7,640 | $ | — | $ | 14,173 | $ | (6,533 | ) | |||||||
We measured the value of the forward currency forwards using Level 2 inputs such as estimations of expected cash flows, appropriately risk-adjusted discount rates and available observable inputs (term of the forward, notional amount, discount rates based on local and foreign rate curves, and a credit value adjustment to consider the likelihood of nonperformance). Forward contracts are recorded in the condensed consolidated balance sheets under “Other assets, net.”
We measured the fair value of the Holding Period Adjustment using an option pricing model based on observable Level 1 and Level 2 inputs such as conversion price of underlying shares, current share price, implied volatility, risk free interest rate and
31
other factors. The Holding Period Adjustment is recorded in the condensed consolidated balance sheets under "Other assets, net" and had no value as of March 31, 2016.
We measured the fair value of the Cash Convertible Notes Hedges and the Cash Convertible Notes Embedded Derivative using an option pricing model based on observable Level 1 and Level 2 inputs such as conversion price of underlying shares, current share price, implied volatility, risk free interest rate and other factors. The Cash Convertible Notes Hedges are recorded in the condensed consolidated balance sheets under “Other assets, net.” The Cash Convertible Notes Embedded Derivative is recorded in the condensed consolidated balance sheets under “Long-term debt, less current maturities.”
On April 26, 2013, Grupo Finmart purchased 100% of the outstanding shares of Fondo ACH, S.A. de C.V., a specialty consumer finance company. The total purchase price was performance-based and will be determined over a period of four years from the date of purchase. Total contingent consideration due on January 2, 2017 is based on interest income generated by the acquired portfolios and new loans made through Fondo ACH's contractual relationships. We used an income approach to measure the fair value of the contingent consideration using a probability-weighted discounted cash flow approach. Some of the significant inputs used for the valuation are not observable in the market and are thus Level 3 inputs. Contingent consideration is recorded in the condensed consolidated balance sheets under "Deferred gains and other long-term liabilities." Significant increases or decreases in the underlying assumptions used to value the contingent consideration could significantly increase or decrease the fair value estimates recorded in the condensed consolidated balance sheets. During the three and six-months ended March 31, 2016, we recorded no valuation adjustment to the $2.6 million balance of the contingent consideration liability.
During fiscal 2015, we granted awards to employees based upon underlying shares that were not issued, and therefore we accounted for these as phantom share-based awards under FASB ASC 718-30. These awards are recorded in the condensed consolidated balance sheets under “Accounts payable and other accrued expenses” for unvested share-based payment awards. The fair value of fiscal 2015 phantom share-based awards that were estimated using the Monte Carlo simulation model incorporated the closing share price of our Class A Common Stock on the date of grant (considered, for this purpose, to be October 1, 2014), as well as the following assumptions, which we consider to be Level 3 inputs under the fair value hierarchy:
Expected volatility of EZCORP, Inc. Class A Common Stock | 49.7 | % |
Risk-free interest rate | 1.9 | % |
Expected term in years | 6 | |
Cost of equity | 11.5 | % |
Dividend yield | — | |
During the six-months ended March 31, 2016, we settled and released $0.1 million of phantom share-based awards and reclassified $3.8 million of phantom share-based awards from liability awards to equity awards recorded in the condensed consolidated balance sheets under "Additional paid-in capital" reducing our balance in phantom share-based awards to zero as of March 31, 2016.
There were no transfers in or out of Level 1 or Level 2 for financial assets or liabilities measured at fair value on a recurring basis during the periods presented.
32
Financial Assets, Temporary Equity and Financial Liabilities Not Measured at Fair Value
Our financial assets, temporary equity and financial liabilities as of March 31, 2016 and 2015 and September 30, 2015 that are not measured at fair value in our condensed consolidated balance sheets are as follows:
Carrying Value | Estimated Fair Value | |||||||||||||||||||
March 31, 2016 | March 31, 2016 | Fair Value Measurement Using | ||||||||||||||||||
Level 1 | Level 2 | Level 3 | ||||||||||||||||||
(in thousands) | ||||||||||||||||||||
Financial assets: | ||||||||||||||||||||
Cash and cash equivalents | $ | 75,336 | $ | 75,336 | $ | 75,336 | $ | — | $ | — | ||||||||||
Restricted cash | 13,817 | 13,817 | 13,817 | — | — | |||||||||||||||
Pawn loans | 140,195 | 140,195 | — | — | 140,195 | |||||||||||||||
Consumer loans, net | 26,362 | 42,975 | — | — | 42,975 | |||||||||||||||
Pawn service charges receivable, net | 27,626 | 27,626 | — | — | 27,626 | |||||||||||||||
Consumer loan fees and interest receivable, net | 13,226 | 13,226 | — | — | 13,226 | |||||||||||||||
Investment in unconsolidated affiliate | 56,677 | 59,307 | 59,307 | — | — | |||||||||||||||
Restricted cash, non-current | 2,308 | 2,308 | 2,308 | — | — | |||||||||||||||
Non-current consumer loans, net | 62,673 | 105,879 | — | — | 105,879 | |||||||||||||||
$ | 418,220 | $ | 480,669 | $ | 150,768 | $ | — | $ | 329,901 | |||||||||||
Temporary equity: | ||||||||||||||||||||
Redeemable noncontrolling interest | $ | (1,229 | ) | $ | 2,894 | $ | — | $ | — | $ | 2,894 | |||||||||
Financial liabilities: | ||||||||||||||||||||
Cash Convertible Notes | $ | 192,565 | $ | 156,400 | $ | — | $ | 156,400 | $ | — | ||||||||||
Foreign currency debt | 17,475 | * | 17,880 | — | 17,880 | — | ||||||||||||||
Consumer loans facility due 2019 | 33,613 | 38,312 | — | 38,312 | — | |||||||||||||||
Foreign currency unsecured notes | 17,097 | * | 19,793 | — | 19,793 | — | ||||||||||||||
Foreign currency secured notes | 20,132 | * | 20,678 | — | 20,678 | — | ||||||||||||||
Secured notes consolidated from VIEs | 50,881 | * | 47,592 | — | 47,592 | — | ||||||||||||||
$ | 331,763 | $ | 300,655 | $ | — | $ | 300,655 | $ | — | |||||||||||
33
Carrying Value | Estimated Fair Value | |||||||||||||||||||
March 31, 2015 | March 31, 2015 | Fair Value Measurement Using | ||||||||||||||||||
Level 1 | Level 2 | Level 3 | ||||||||||||||||||
(in thousands) | ||||||||||||||||||||
Financial assets: | ||||||||||||||||||||
Cash and cash equivalents | $ | 138,173 | $ | 138,173 | $ | 138,173 | $ | — | $ | — | ||||||||||
Restricted cash | 47,909 | 47,909 | 47,909 | — | — | |||||||||||||||
Pawn loans | 127,929 | 127,929 | — | — | 127,929 | |||||||||||||||
Consumer loans, net | 55,529 | 75,184 | — | — | 75,184 | |||||||||||||||
Pawn service charges receivable, net | 24,909 | 24,909 | — | — | 24,909 | |||||||||||||||
Consumer loan fees and interest receivable, net | 13,063 | 13,063 | — | — | 13,063 | |||||||||||||||
Investment in unconsolidated affiliate | 94,510 | 105,150 | 105,150 | — | — | |||||||||||||||
Restricted cash, non-current | 2,880 | 2,880 | 2,880 | — | — | |||||||||||||||
Non-current consumer loans, net | 79,860 | 122,286 | — | — | 122,286 | |||||||||||||||
$ | 584,762 | $ | 657,483 | $ | 294,112 | $ | — | $ | 363,371 | |||||||||||
Temporary equity: | ||||||||||||||||||||
Common Stock, subject to possible redemption | $ | 11,696 | $ | 11,049 | $ | — | $ | — | $ | 11,049 | ||||||||||
Redeemable noncontrolling interest | 16,827 | 43,048 | — | — | 43,048 | |||||||||||||||
$ | 28,523 | $ | 54,097 | $ | — | $ | — | $ | 54,097 | |||||||||||
Financial liabilities: | ||||||||||||||||||||
Cash Convertible Notes | $ | 182,276 | $ | 195,233 | $ | — | $ | 195,233 | $ | — | ||||||||||
Foreign currency debt | 21,726 | * | 24,213 | — | 24,213 | — | ||||||||||||||
Consumer loans facility due 2019 | 44,837 | 46,982 | — | 46,982 | — | |||||||||||||||
Foreign currency unsecured notes | 18,163 | * | 18,550 | — | 18,550 | — | ||||||||||||||
Foreign currency secured notes | 22,080 | * | 25,650 | — | 25,650 | — | ||||||||||||||
Secured notes consolidated from VIEs | 100,134 | * | 97,712 | — | 97,712 | |||||||||||||||
$ | 389,216 | $ | 408,340 | $ | — | $ | 408,340 | $ | — | |||||||||||
34
Carrying Value | Estimated Fair Value | |||||||||||||||||||
September 30, 2015 | September 30, 2015 | Fair Value Measurement Using | ||||||||||||||||||
Level 1 | Level 2 | Level 3 | ||||||||||||||||||
(in thousands) | ||||||||||||||||||||
Financial assets: | ||||||||||||||||||||
Cash and cash equivalents | $ | 59,124 | $ | 59,124 | $ | 59,124 | $ | — | $ | — | ||||||||||
Restricted cash | 15,137 | 15,137 | 15,137 | — | — | |||||||||||||||
Pawn loans | 159,964 | 159,964 | — | — | 159,964 | |||||||||||||||
Consumer loans, net | 36,533 | 48,440 | — | — | 48,440 | |||||||||||||||
Pawn service charges receivable, net | 30,852 | 30,852 | — | — | 30,852 | |||||||||||||||
Consumer loan fees and interest receivable, net | 19,802 | 19,802 | — | — | 19,802 | |||||||||||||||
Investment in unconsolidated affiliate | 56,182 | 56,182 | 56,182 | — | — | |||||||||||||||
Restricted cash, non-current | 2,883 | 2,883 | 2,883 | — | — | |||||||||||||||
Non-current consumer loans, net | 75,824 | 104,194 | — | — | 104,194 | |||||||||||||||
$ | 456,301 | $ | 496,578 | $ | 133,326 | $ | — | $ | 363,252 | |||||||||||
Temporary equity: | ||||||||||||||||||||
Common stock, subject to possible redemption | $ | 11,696 | $ | 11,438 | $ | — | $ | — | $ | 11,438 | ||||||||||
Redeemable noncontrolling interest | 3,235 | 5,467 | — | — | 5,467 | |||||||||||||||
$ | 14,931 | $ | 16,905 | $ | — | $ | — | $ | 16,905 | |||||||||||
Financial liabilities: | ||||||||||||||||||||
Cash Convertible Notes | $ | 187,471 | $ | 169,050 | $ | — | $ | 169,050 | $ | — | ||||||||||
Foreign currency debt | 18,505 | * | 19,851 | — | 19,851 | — | ||||||||||||||
Consumer loans facility due 2019 | 40,493 | 40,774 | — | 40,774 | — | |||||||||||||||
Foreign currency unsecured notes | 20,987 | * | 20,477 | — | 20,477 | — | ||||||||||||||
Foreign currency secured notes | 20,286 | * | 22,476 | — | 22,476 | — | ||||||||||||||
Secured notes consolidated from VIEs | 73,264 | * | 68,685 | — | 68,685 | — | ||||||||||||||
$ | 361,006 | $ | 341,313 | $ | — | $ | 341,313 | $ | — | |||||||||||
* Portions of these amounts are included in "Current maturities of long-term debt" and "Long-term debt, less current maturities" in our condensed consolidated balance sheets.
Based on the short-term nature of cash and cash equivalents, restricted cash, pawn loans, pawn service charges receivable and consumer loan fees and interest receivable, we estimate that their carrying value approximates fair value. Significant increases or decreases in the underlying assumptions used to value the pawn loans, pawn service charges receivable and consumer loan fees and interest receivable could significantly increase or decrease the fair value estimates disclosed above.
Consumer loans, other than those made by Grupo Finmart, have relatively short maturity periods that are generally 12 months; therefore, we estimate that their carrying value approximates fair value. Consumer loans made by Grupo Finmart have an average contractual term of approximately 30 months. We estimated the fair value of the Grupo Finmart consumer loans by applying an income approach (the present value of future cash flows). Key assumptions include an annualized probability of default as well as a discount rate based on the funding rate plus the portfolio liquidity risk. Significant increases or decreases in the underlying assumptions used to value the consumer loans could significantly increase or decrease the fair value estimates disclosed above.
The inputs used to generate the fair value of our investment in unconsolidated affiliate Cash Converters International were considered Level 1 inputs. These inputs are comprised of (a) the quoted stock price on the Australian Stock Exchange multiplied by (b) the number of shares we owned multiplied by (c) the applicable foreign currency exchange rate as of the end of our reporting period. We included no control premium for owning a large percentage of outstanding shares.
The fair value of the redeemable noncontrolling interest was estimated by applying an income approach. This fair value measurement is based on significant Level 3 inputs that are not observable in the market. Key assumptions include discount
35
rates up to 24%, representing the discount that market participants would consider when estimating the fair value of the noncontrolling interest. Significant increases or decreases in the underlying assumptions used to value the redeemable noncontrolling interest could significantly increase or decrease the fair value estimates disclosed above.
The fair value of the common stock, subject to possible redemption was estimated by applying an income approach. This fair value measurement is based on significant Level 3 inputs that are not observable in the market. Key assumptions include a discount rate of 7%, which approximated the Company’s incremental borrowing rate.
We measured the fair value of our Cash Convertible Notes using quoted price inputs from Bloomberg. The Cash Convertible Notes are not actively traded and thus the price inputs represent a Level 2 measurement. As the Cash Convertible Notes are not actively traded, the quoted price inputs obtained from Bloomberg are highly variable from day to day and thus the fair value estimates disclosed above could significantly increase or decrease.
We utilize credit quality-related zero rate curves, quoted price and yield inputs for Mexican Pesos built by a price vendor authorized by the Comisión Nacional Bancaria y de Valores to determine the fair value measurements of the remaining financial liabilities that are classified as Level 2 measurements.
NOTE 15: DERIVATIVE INSTRUMENTS AND HEDGING ACTIVITIES
See Note 14 for a discussion of the Cash Convertible Notes Hedges and Cash Convertible Notes Embedded Derivative presented below.
During the fiscal years ended September 30, 2015 and 2014, Grupo Finmart entered into cross-currency forward contracts to hedge foreign exchange rate fluctuations in connection with the formation of the VIEs and related transfer of certain loans as described in Note 16. The Company guarantees the future cash outflows of the forward contracts, which are included in the Company’s condensed consolidated balance sheets and adjusted to fair value each reporting period through earnings.
Grupo Finmart received proceeds of $3.6 million, net with the settlement of remaining foreign currency forwards attributable to the cross-border 8.5% unsecured notes due 2015 which were repaid during the three-months ended December 31, 2015.
The following tables set forth certain information regarding our derivative instruments not designated as hedging instruments:
Fair Value Asset (Liability) of Derivative Instruments | ||||||||||||||
Derivative Instrument | Balance Sheet Location | March 31, 2016 | March 31, 2015 | September 30, 2015 | ||||||||||
(in thousands) | ||||||||||||||
Foreign currency forwards | Prepaid expenses and other current assets | $ | 7,694 | $ | 2,530 | $ | 14,169 | |||||||
Cash Convertible Notes Hedges | Other assets, net | 3,219 | 27,215 | 10,505 | ||||||||||
Cash Convertible Notes Embedded Derivative | Long-term debt, less current maturities | (3,219 | ) | (27,215 | ) | (10,505 | ) | |||||||
Amount of Unrealized Gain (Loss) on Derivatives | ||||||||||||||||||
Three Months Ended March 31, | Six Months Ended March 31, | |||||||||||||||||
Derivative Instrument | Income Statement Location | 2016 | 2015 | 2016 | 2015 | |||||||||||||
(in thousands) | ||||||||||||||||||
Foreign currency forwards | Other expense* | $ | (1,805 | ) | $ | 784 | $ | (2,918 | ) | $ | 7,798 | |||||||
*Amount is partially offset by gains and losses caused by related foreign currency fluctuations.
36
NOTE 16: VARIABLE INTEREST ENTITIES
The Company performs ongoing qualitative assessments of VIEs it is involved with to determine if it has a controlling financial interest in the VIE and therefore is the VIE’s primary beneficiary. If it is determined to be the primary beneficiary, the Company consolidates the VIE in its condensed consolidated financial statements.
Consolidated Variable Interest Entities
During the year ended September 30, 2014 and the first quarter of fiscal 2015, Grupo Finmart participated in the formation of three VIEs that purchased Mexican Peso denominated long-term unsecured Mexican consumer loans originated by Grupo Finmart whose borrowers were Mexican government employees at the time of loan origination. During fiscal 2014 and the first quarter of fiscal 2015, Grupo Finmart completed six transfers of consumer loans to various securitization trusts. We consolidate those securitization trusts under the VIE model. Each VIE issued its notes to third party investors and used the related net proceeds to purchase the loans from Grupo Finmart at a premium over their principal amount. We consolidate these VIEs as we have the power to direct the activities that significantly affect each VIE’s economic performance and have the right to receive benefits or the obligation to absorb losses that could potentially be significant to each VIE.
The first VIE (“VIE C”) was formed in October 2013 as a trust with third party "Investor C" as the purchaser of its Mexican Peso denominated notes and the VIE’s first beneficiary. The second VIE (“VIE B”) was formed in March 2014 (amended in June, September and December 2014) as a trust with "Investor B" as the purchaser of the VIE’s U.S. Dollar denominated notes and the VIE’s first beneficiary. The third VIE (“VIE A”) was formed in June 2014 as a trust with "Investor A" as the purchaser of the VIE’s Mexican Peso denominated notes and the VIE’s first beneficiary. Grupo Finmart is the servicer of the VIEs’ loans. In August 2014, "Investors D" and "E" purchased a portion of VIE A’s notes from Investor A and became additional VIE A first beneficiaries. Each VIEs’ notes are payable solely from the VIE’s assets. Grupo Finmart receives 100% of VIE C and VIE B cash flows and 50% of VIE A cash flows after (1) the VIE’s operating expenses are paid and (2) the VIE's notes are repaid. Grupo Finmart has an option to repurchase VIE A’s loans. VIE A is the only VIE for which Grupo Finmart can be terminated as servicer for reasons other than cause, with termination requiring unanimous first beneficiary approval.
Grupo Finmart has entered into foreign exchange forward contracts with a third party to provide U.S. dollars on the payment of Mexican Pesos, and has assigned the rights under those contracts to VIE B to mitigate the risk associated with its U.S. dollar denominated liabilities and Mexican peso denominated assets. EZCORP has guaranteed the future cash outflows under those foreign exchange forward contracts.
The assets of the VIEs can be used only to settle obligations of the VIEs. Information about our involvement with VIEs has been aggregated as the VIEs are similar and we believe separate reporting would not provide more useful information. The assets and liabilities of our consolidated VIEs described above are presented in our condensed consolidated balance sheets and are net of intercompany balances which are eliminated in our condensed consolidated financial statements.
The loans the VIEs purchased from Grupo Finmart are reflected in our condensed consolidated financial statements at amortized cost based on Grupo Finmart’s pre-transfer basis. We did not recognize any gain or loss as a result of the loan transfer to the VIEs or from the consolidation of the VIEs. The excess of the principal amount of each VIE’s notes payable over the principal amount of the VIE’s loans (this is the unamortized loan premium paid by the VIEs) is to be repaid using a portion of the VIE’s loan interest, as the coupon of the VIE’s loans are greater than the coupon of the VIE’s notes payable.
Income (principally, interest and fees on loans) earned by our consolidated VIEs was $4.1 million and $9.3 million for the three-months ended March 31, 2016 and 2015, respectively, and $7.3 million and $19.9 million for the six-months ended March 31, 2016 and 2015, respectively. Related expenses, consisting primarily of interest expense, foreign exchange losses and consumer loan bad debt expense were $1.6 million and $6.0 million for the three-months ended March 31, 2016 and 2015, respectively, and $5.8 million and $17.0 million for the six-months ended March 31, 2016 and 2015, respectively. These amounts do not include intercompany transactions which are eliminated in our condensed consolidated financial statements.
Grupo Finmart Securitization Trust
On February 17, 2014, Grupo Finmart entered into a new securitization transaction to transfer collection rights of certain eligible consumer loans to a bankruptcy remote trust in exchange for cash. The trust received financing as a result of the issuance of debt securities and delivered the proceeds of the financing to Grupo Finmart. The 5.8% consumer loans facility due 2019 debt securities pertaining to the Grupo Finmart Securitization Trust are presented in Note 7. Grupo Finmart is the primary beneficiary of the securitization trust because Grupo Finmart has the power to direct the most significant activities of the trust through its role as servicer of all the receivables held by the trust and through its obligation to absorb losses or receive benefits that could potentially be significant to the trust. Consequently, we consolidate the trust. The assets and liabilities of the Grupo
37
Finmart Securitization Trust described above are presented in our condensed consolidated balance sheets and are net of intercompany balances which are eliminated in our condensed consolidated financial statements.
Non-Consolidated Variable Interest Entities
The Company historically held a significant variable interest in two VIEs for which it was not the primary beneficiary and, therefore, were not consolidated. Prior to our discontinuance of USFS as discussed in Note 2, we issued letters of credit to enhance the creditworthiness of our customers seeking unsecured loans from unaffiliated lenders. We had no further substantial involvement with such lenders as of December 31, 2015.
NOTE 17: SUPPLEMENTAL CONSOLIDATED FINANCIAL INFORMATION
Supplemental Condensed Consolidated Balance Sheets Information
The following table provides information on net amounts included under "Pawn service charges receivable, net," "Consumer loan fees and interest receivable, net," "Inventory, net" and "Property and equipment, net" in our condensed consolidated balance sheets:
March 31, 2016 | March 31, 2015 | September 30, 2015 | |||||||||
(in thousands) | |||||||||||
Pawn service charges receivable, net: | |||||||||||
Gross pawn service charges receivable | $ | 35,239 | $ | 31,940 | $ | 39,877 | |||||
Allowance for uncollectible pawn service charges receivable | (7,613 | ) | (7,031 | ) | (9,025 | ) | |||||
$ | 27,626 | $ | 24,909 | $ | 30,852 | ||||||
Consumer loan fees and interest receivable, net: | |||||||||||
Gross consumer loan fees and interest receivable | $ | 26,118 | $ | 28,595 | $ | 31,847 | |||||
Allowance for uncollectible consumer loan fees and interest receivable | (12,892 | ) | (15,532 | ) | (12,045 | ) | |||||
$ | 13,226 | $ | 13,063 | $ | 19,802 | ||||||
Inventory, net: | |||||||||||
Gross inventory | $ | 132,334 | $ | 124,188 | $ | 131,174 | |||||
Inventory reserves | (5,888 | ) | (8,044 | ) | (7,090 | ) | |||||
$ | 126,446 | $ | 116,144 | $ | 124,084 | ||||||
Property and equipment, net: | |||||||||||
Property and equipment, gross | $ | 212,321 | $ | 245,458 | $ | 212,384 | |||||
Accumulated depreciation | (147,359 | ) | (143,206 | ) | (136,790 | ) | |||||
$ | 64,962 | $ | 102,252 | $ | 75,594 | ||||||
See Note 13 for information on net amounts included under "Consumer loans, net" and "Non-current consumer loans, net" in our condensed consolidated balance sheets.
38
NOTE 18: SUBSEQUENT EVENTS
On February 8, 2016 in conjunction with ongoing evaluation our strategic direction, we announced that we were conducting a comprehensive review of strategic options for Grupo Finmart to be completed by the end of the third quarter of fiscal 2016. Subsequent to March 31, 2016, a special committee of our board of directors, after reviewing a variety of strategic alternatives with management and the company's financial advisors, concluded that a sale of the business was the preferred alternative and authorized management to proceed with a process to solicit proposals from interested buyers. Should that process result in an acceptable proposal, we would anticipate that the disposition would be completed during the fourth quarter of fiscal 2016.
As the criteria in FASB ASC 360-10-45-9 for classification of Grupo Finmart as held for sale were met after the balance sheet date but before the financial statements were issued, we have included the below information in accordance with FASB ASC 205-20-50-1(a) as required by FASB ASC 360-10-45-13. We expect to classify Grupo Finmart as held for sale during the third quarter of fiscal 2016 and recast all historical segment operations of Grupo Finmart as discontinued operations.
The following table summarizes the carrying values of major classes of Grupo Finmart assets and liabilities held and used in the condensed consolidated balance sheets, excluding intercompany debt of $35.8 million, in addition to other intercompany items, as of the dates indicated:
March 31, 2016 | March 31, 2015 | September 30, 2015 | ||||||||||
(in thousands) | ||||||||||||
Current assets | $ | 60,712 | $ | 115,452 | $ | 90,898 | ||||||
Non-current assets | 127,632 | 209,885 | 213,581 | |||||||||
Current liabilities | 102,149 | 84,904 | 89,000 | |||||||||
Non-current liabilities | 60,159 | 138,461 | 100,831 | |||||||||
The following table summarizes the carrying values of major classes of assets and liabilities attributable to all other operations of the Company, excluding intercompany accounts:
March 31, 2016 | March 31, 2015 | September 30, 2015 | ||||||||||
(in thousands) | ||||||||||||
Current assets | $ | 395,358 | $ | 492,821 | $ | 420,849 | ||||||
Non-current assets | 450,747 | 559,476 | 477,731 | |||||||||
Current liabilities | 86,458 | 93,085 | 119,070 | |||||||||
Non-current liabilities | 195,400 | 214,172 | 202,492 | |||||||||
39
ITEM 2. MANAGEMENT'S DISCUSSION AND ANALYSIS OF FINANCIAL CONDITION AND RESULTS OPERATIONS
The discussion in this section contains forward-looking statements that are based on our current expectations. Actual results could differ materially from those expressed or implied by the forward-looking statements due to a number of risks, uncertainties and other factors, including those identified in "Part I, Item 1A — Risk Factors" of our Annual Report on Form 10-K for the year ended September 30, 2015, as supplemented by the information set forth in “Part I, Item 3 — Quantitative and Qualitative Disclosures about Market Risk,” "Part II, Item 1 — Legal Proceedings" and "Part II, Item 1A — Risk Factors" of this Quarterly Report.
Overview
EZCORP is a Delaware corporation headquartered in Austin, Texas. We are a leading provider of pawn loans in the United States and Mexico.
Our vision is to be the market leader in North America, within three years, in responsibly and respectfully meeting our customers' desire for access to cash when they want it. That vision is supported by four key imperatives:
• | Market Leading Customer Satisfaction; |
• | Exceptional Staff Engagement; |
• | Attractive Shareholder Returns; and |
• | Most Efficient Provider of Cash. |
At our pawn stores, we offer pawn loans, which are non-recourse loans collateralized by tangible personal property, and sell merchandise to customers looking for good value. The merchandise we sell consists of second-hand collateral forfeited from our pawn lending activities or purchased from customers.
Through our 94%-owned subsidiary, Prestaciones Finmart, S.A.P.I. de C.V., SOFOM, E.N.R. ("Grupo Finmart" doing business under the names "Crediamigo" and "Adex"), headquartered in Mexico City, we offer unsecured installment loans to employees of various Mexican employers (principally federal, state and local government agencies), which are repaid through payroll deductions.
The following charts present sources of net revenue including measures of gross profit ("GP") and pawn service charges ("PSC") for the three and six-months ended March 31, 2016 and 2015:
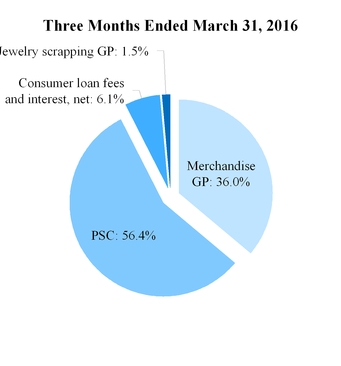
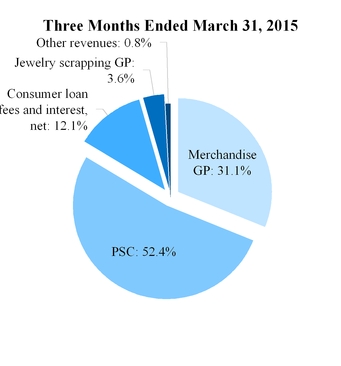
40
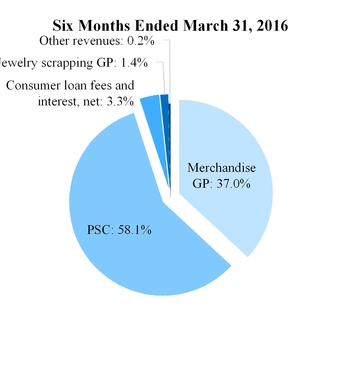
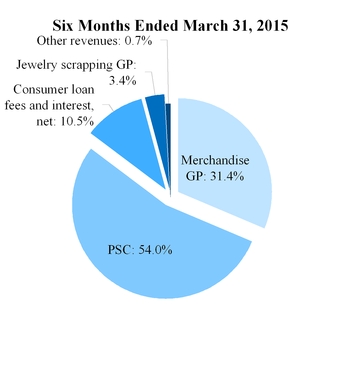
Pawn Activities
At our pawn stores, we offer secured loans, which are typically small, non-recourse loans collateralized by tangible personal property. As of March 31, 2016, we had an aggregate pawn loan principal balance of $140.2 million. We earn pawn service charge revenue on our pawn loans which varies primarily based upon statutory rates by state and loan valuations.
In our pawn stores, we acquire inventory for retail sales through pawn loan forfeitures and purchases of customers’ merchandise. We believe our ability to offer quality secondhand goods and refurbished goods at prices significantly lower than original retail prices attracts value-conscious customers. The gross profit on sales of inventory depends primarily on our assessment of the loan or purchase value at the time the property is either accepted as loan collateral or purchased. As part of the lending or purchasing process, we work with customers to establish appropriate value assessments which ultimately drive margins on the sale of merchandise.
Collateral for our pawn loans consists of tangible personal property, jewelry, consumer electronics, tools, sporting goods and musical instruments. We do not evaluate the creditworthiness of a pawn customer, but rely on the estimated resale value of the collateral and the perceived probability of the loan's redemption. We then determine the appropriate amount to lend based on the pledged property's estimated resale value depending on an evaluation of these factors. The sources of information we use to determine the resale value of collateral include our computerized valuation software, gold values, internal retail and auction sites, catalogues, newspaper advertisements and previous sales of similar merchandise.
The collateral is held through the duration of the loan, which the customer may renew or extend by paying accrued pawn service charges. If a customer does not repay, renew or extend a loan, the collateral is forfeited to us and becomes inventory available for sale. We do not record loan losses or charge-offs of pawn loans because the principal amount of an unpaid loan becomes the inventory carrying cost of the forfeited collateral.
Our inventory is stated at the lower of cost or market. We record a valuation allowance for obsolete or slow-moving inventory based on the type and age of merchandise. We generally establish a higher allowance percentage on general merchandise, as it is more susceptible to obsolescence, and establish a lower allowance percentage on jewelry, as it retains much greater commodity value. The total allowance, excluding shrinkage and product protection plan returns as described below, was 3.3% of gross inventory (a blended rate comprising 3.9% of gross general merchandise inventory and 2.1% of gross jewelry inventory) as of March 31, 2016, compared to 5.1% (comprising 5.5% of gross general merchandise inventory and 4.7% of gross jewelry inventory) as of March 31, 2015 and 4.1% (comprising 3.8% of gross general merchandise inventory and 3.5% of gross jewelry inventory) as of September 30, 2015. The decrease in valuation allowance from September 30, 2015 to March 31, 2016 is reflective of maintaining similar levels of aged merchandise but higher total inventory balances.
41
Additional reserves are recorded for estimated unrealized inventory shrinkage and product protection plan returns. Combined these were 1.1% of total gross inventory as of March 31, 2016 compared to 1.4% as of March 31, 2015 and 1.3% as of September 30, 2015.
Customers may purchase an extended return plan (called a “product protection plan”) that allows them to return or exchange certain general (non-jewelry) merchandise sold through our retail pawn operations within six months of purchase. We recognize the fees for this service as revenue ratably over the six month period.
We also offer a jewelry VIP package, which guarantees customers a minimum future pawn loan amount on the item sold, allows them full credit if they trade in the item to purchase a more expensive piece of jewelry, and provides minor repair service on the item sold. These fees are recognized upon sale. Customers may also purchase an item on layaway by paying a minimum layaway deposit of typically 10% to 20% of the item’s sale price. We hold the item for a 60 to 180-day period, during which the customer is required to pay the balance of the sales price. The initial deposit and subsequent payments are recorded as customer layaway deposits. Layaways are recorded as sales when paid in full. We record product protection, jewelry VIP and layaway fees as sales revenue, as they are incidental to sales of merchandise.
Growth and Expansion
We plan to expand the number of locations we operate through opening de novo locations and through acquisitions. We believe that the largest growth opportunities are with de novo stores in Mexico and pawn store acquisitions in the U.S. We continually evaluate and test new products and formats, which may result in expansion opportunities or strategic investments. Our ability to add new stores is dependent on several variables, such as the availability of acceptable sites or acquisition candidates, the regulatory environment, local zoning ordinances, access to capital and the availability of qualified personnel.
Payroll Withholding Loans
In Mexico, Grupo Finmart offers payroll withholding loans or unsecured consumer loans. Grupo Finmart enters into payroll withholding agreements (called “convenios”) with Mexican employers, primarily federal, state and local governments and agencies, and provides unsecured installment consumer loans to the employees of the various employers. Interest and principal payments are collected through payroll deductions.
On February 8, 2016, in conjunction with ongoing evaluation of our strategic direction, we announced that we were conducting a comprehensive review of the strategic options for Grupo Finmart to be completed by the end of the third quarter of fiscal 2016. The board of directors formed a special committee, consisting of only independent directors, and empowered it to supervise the strategic review process and approve the ultimate outcome of that process. UBS Investment Bank ("UBS") is acting as financial advisor to the company. On April 19, 2016, the special committee, after reviewing a variety of strategic alternatives with management and UBS, concluded that a sale of the business was the preferred alternative. This conclusion was based primarily on our overall preference to invest in and grow our core pawn businesses in the U.S. and Mexico, the amount of incremental capital required to support and grow the Grupo Finmart business to produce acceptable returns, and our current and expected ability to provide that incremental capital from existing resources.
The special committee authorized management, with the assistance of UBS, to proceed with a process to solicit proposals from interested buyers. Should that process result in an acceptable proposal, we would anticipate that the disposition would be completed during the fourth quarter of fiscal 2016. If we are unable to dispose of Grupo Finmart by the end of fiscal 2016, we will need to secure additional financing, restructure existing financing or take other measures to generate liquidity in order to support the Grupo Finmart Business. See "Part I, Item 2 — Management's Discussion and Analysis of Financial Condition and Results of Operations — Liquidity and Capital Resources" and "Part II, Item 1A — Risk Factors — Our financial condition and liquidity could be materially and adversely affected by Grupo Finmart's liquidity needs."
We expect to classify Grupo Finmart as held for sale during the third quarter of fiscal 2016 and beginning with that quarter will recast all historical segment operations of Grupo Finmart as discontinued operations. See Note 18 of Notes to Interim Condensed Consolidated Financial Statements included in "Part I, Item 1 — Financial Statements."
Seasonality and Quarterly Results
Historically, U.S. pawn service charges on a GAAP basis are highest in our fourth fiscal quarter (July through September) due to a higher average loan balance during the summer lending season. U.S. merchandise sales are highest in the first and second fiscal quarters (October through March) due to the holiday season with jewelry sales surrounding Valentine’s Day and additionally impacted by tax refunds in the United States. As a result of the seasonality of sales in the first and second fiscal quarters, earning asset balances are usually lower at second quarter end as compared to other fiscal quarters.
42
Store Data by Segment
Three Months Ended March 31, 2016 | |||||||||||||||||
Company-owned Stores | |||||||||||||||||
U.S. Pawn | Mexico Pawn* | Grupo Finmart | Other International | Consolidated | Franchises | ||||||||||||
As of December 31, 2015 | 516 | 237 | * | 46 | 27 | 826 | 1 | ||||||||||
Locations acquired | 6 | — | — | — | 6 | — | |||||||||||
Locations sold, combined or closed | — | — | (3 | ) | — | (3 | ) | (1 | ) | ||||||||
As of March 31, 2016 | 522 | 237 | 43 | 27 | 829 | — | |||||||||||
* Includes five buy/sell stores which were converted to Mexico Pawn stores during the period.
Three Months Ended March 31, 2015 | |||||||||||||||||
Company-owned Stores | |||||||||||||||||
U.S. Pawn | Mexico Pawn* | Grupo Finmart | Other International | Consolidated | Franchises | ||||||||||||
As of December 31, 2014 | 509 | 262 | * | 53 | 39 | 863 | 4 | ||||||||||
New locations opened | — | 1 | 1 | — | 2 | — | |||||||||||
Locations acquired | 12 | — | — | — | 12 | — | |||||||||||
Locations sold, combined or closed | (2 | ) | (1 | ) | (4 | ) | — | (7 | ) | (2 | ) | ||||||
As of March 31, 2015 | 519 | 262 | 50 | 39 | 870 | 2 | |||||||||||
* Includes 21 buy/sell stores.
Six Months Ended March 31, 2016 | |||||||||||||||||
Company-owned Stores | |||||||||||||||||
U.S. Pawn | Mexico Pawn* | Grupo Finmart | Other International | Consolidated | Franchises | ||||||||||||
As of September 30, 2015 | 522 | 237 | * | 53 | 27 | 839 | 1 | ||||||||||
Locations acquired | 6 | 1 | — | — | 7 | — | |||||||||||
Locations sold, combined or closed | (6 | ) | (1 | ) | (10 | ) | — | (17 | ) | (1 | ) | ||||||
As of March 31, 2016 | 522 | 237 | 43 | 27 | 829 | — | |||||||||||
* Includes five buy/sell stores which were converted to Mexico Pawn stores during the period.
Six Months Ended March 31, 2015 | |||||||||||||||||
Company-owned Stores | |||||||||||||||||
U.S. Pawn | Mexico Pawn* | Grupo Finmart | Other International | Consolidated | Franchises | ||||||||||||
As of September 30, 2014 | 504 | 261 | * | 53 | 39 | 857 | 5 | ||||||||||
New locations opened | 5 | 2 | * | 1 | — | 8 | — | ||||||||||
Locations acquired | 12 | — | — | — | 12 | — | |||||||||||
Locations sold, combined or closed | (2 | ) | (1 | ) | (4 | ) | — | (7 | ) | (3 | ) | ||||||
As of March 31, 2015 | 519 | 262 | 50 | 39 | 870 | 2 | |||||||||||
* Includes 19 buy/sell stores. We acquired two additional buy/sell stores during the period.
43
Financial Highlights for the Three and Six-Months Ended March 31, 2016
The following discussion presents selected consolidated summary financial data from continuing operations on a constant currency basis unless otherwise noted. The discussion includes consolidated results including constant currency results from Mexico Pawn, after translation to U.S. dollars from its functional currency of the Mexican peso. See “Results of Operations — Non-GAAP Financial Information” below.
The following presents selected, unaudited, consolidated financial data for our three-months ended March 31, 2016 and 2015 (the "current quarter" or "current three-months" and "prior-year quarter," respectively) and our six-months ended March 31, 2016 and 2015 (the "current six-months" and "prior-year six-months," respectively).
Three Months Ended March 31, | |||||||||||||||||
2016 | 2016 Constant Currency (a) | 2015 | Percentage Change GAAP | Percentage Change Constant Currency | |||||||||||||
Consolidated pawn loans outstanding | $ | 140,195 | $ | 142,581 | $ | 127,929 | 10 | % | 11 | % | |||||||
Consolidated pawn service charges | 64,130 | 65,694 | 59,470 | 8 | % | 10 | % | ||||||||||
U.S. pawn service charges | 56,614 | 56,614 | 52,317 | 8 | % | 8 | % | ||||||||||
Mexico pawn service charges | 7,516 | 9,080 | 7,153 | 5 | % | 27 | % | ||||||||||
Consolidated merchandise sales gross profit | 41,011 | 41,951 | 35,360 | 16 | % | 19 | % | ||||||||||
Consolidated gross margin on merchandise sales | 38 | % | 37 | % | 33 | % | 15 | % | 12 | % | |||||||
Consolidated annualized return on pawn earning assets (d) | 152 | % | 152 | % | 150 | % | 1 | % | 1 | % | |||||||
Consolidated inventory yield (e) | 130 | % | 130 | % | 127 | % | 2 | % | 2 | % | |||||||
U.S. pawn loan redemption rate (b) | 85 | % | 85 | % | 85 | % | 0bps | 0bps | |||||||||
Mexico pawn loan redemption rate (b) | 78 | % | 78 | % | 79 | % | -100bps | -100bps | |||||||||
U.S. aged general merchandise inventory (c) | 5 | % | 5 | % | 6 | % | (17 | )% | (17 | )% | |||||||
U.S. aged jewelry inventory (c) | 15 | % | 15 | % | 20 | % | (25 | )% | (25 | )% | |||||||
Mexico aged general merchandise inventory (c) | 4 | % | 4 | % | 11 | % | (64 | )% | (64 | )% | |||||||
Mexico aged jewelry inventory (c) | — | % | — | % | 3 | % | (100 | )% | (100 | )% | |||||||
44
Six Months Ended March 31, | |||||||||||||||||
2016 | 2016 Constant Currency (a) | 2015 | Percentage Change GAAP | Percentage Change Constant Currency | |||||||||||||
Consolidated pawn service charges | $ | 130,724 | $ | 133,951 | $ | 124,397 | 5 | % | 8 | % | |||||||
U.S. pawn service charges | 115,235 | 115,235 | 109,352 | 5 | % | 5 | % | ||||||||||
Mexico pawn service charges | 15,489 | 18,716 | 15,045 | 3 | % | 24 | % | ||||||||||
Consolidated merchandise sales gross profit | 83,336 | 85,479 | 72,521 | 15 | % | 18 | % | ||||||||||
Consolidated gross margin on merchandise sales | 38 | % | 38 | % | 33 | % | 15 | % | 15 | % | |||||||
Consolidated annualized return on pawn earning assets (d) | 152 | % | 152 | % | 147 | % | 3 | % | 3 | % | |||||||
Consolidated inventory yield (e) | 132 | % | 132 | % | 121 | % | 9 | % | 9 | % | |||||||
* | Represents an increase or decrease in excess of 100% or not meaningful. |
(a) | For income statement items, the average closing daily exchange rate for the applicable period was used. For balance sheet items, the end of the period rate for the applicable period end was used. |
(b) | Our pawn loan redemption rate represents the percentage of loans made that are repaid, renewed or extended. |
(c) | Calculated as inventory aged greater than 360 days as a percentage of total inventory as of the applicable period end. |
(d) | Calculated as the annualized merchandise and scrap sales gross profit and pawn service charges, divided by average pawn loans and inventory balances outstanding. |
(e) | Calculated as average annual merchandise and scrap sales gross profit yield on inventory balances outstanding as of the applicable period end. |
Overall Core Pawn Business Improvement
Pawn Lending Momentum Continues
• | Quality loan growth continued with pawn loans outstanding increasing 11% from the end of the prior-year quarter (10% increase on a GAAP basis, including ending U.S. Pawn and Mexico Pawn loan balance increase of $10.6 million to $122.9 million and $1.7 million to $17.3 million, respectively). |
• | Same store loan balances increased 9% from the prior-year quarter (8% increase on a GAAP basis, including a 7% and 13% increase in U.S. Pawn and Mexico Pawn same store loan balances, respectively). |
• | Pawn loan redemption rates remain relatively constant as compared to the prior-year quarter. |
• | Pawn service charges increased 10% from the prior-year quarter (8% increase on a GAAP basis, including U.S. Pawn and Mexico Pawn pawn service charge increases of $4.3 million to $56.6 million and $0.4 million to $7.5 million, respectively). Pawn service charges increased 8% from the prior-year six-months (5% increase on a GAAP basis, including U.S. Pawn and Mexico Pawn pawn service charge increases of $5.9 million to $115.2 million and $0.4 million to $15.5 million, respectively). |
Improved Merchandise Sales Margin and Inventory Position
• | Merchandise margin increased from 33% in the prior-year quarter and prior-year six-months to 38% in the current quarter and current six-months, a result of disciplined loan valuations and effective product lifecycle pricing. |
• | Merchandise sales gross profit increased 16% from $35.4 million in the prior-year quarter to $41.0 million in the current quarter on a GAAP basis. Merchandise sales gross profit increased from $72.5 million in the prior-year six-months to $83.3 million in the current six-months on a GAAP basis. |
• | Aged inventory reduced to 10% for U.S. Pawn at the end of the current quarter from 13% at the end of the prior-year quarter, comprised of a reduction of aged general merchandise inventory to 5% from 6% and a reduction of aged jewelry inventory to 15% from 20% at the end of the prior-year quarter. Aged inventory reduced to 3% for Mexico Pawn at the end of the current quarter from 11% at the end of the prior-year quarter, comprised of a reduction of aged general merchandise inventory to 4% from 11% and a reduction of aged jewelry inventory to a nominal amount from 3% at the end of the prior-year quarter. |
45
Growing Return on Pawn Earning Assets
• | Annualized return on pawn earning assets increased to 152% in the current quarter on a GAAP basis versus 150% in the prior-year quarter. Annualized return on pawn earning assets increased to 152% in the current six-months on a GAAP basis versus 147% in the prior-year six-months. |
• | Inventory yield increased to 130% in the current quarter on a GAAP basis from 127% in the prior-year quarter, driven by improved gross margin on merchandise sales. Inventory yield increased to 132% in the current six-months on a GAAP basis from 121% in the prior-year six-months. |
46
Results of Operations
Three Months Ended March 31, 2016 vs. Three Months Ended March 31, 2015
Summary Financial Data
The following tables present selected, unaudited, financial data for our three-months ended March 31, 2016 and 2015 (the "current quarter" or "current three-months" and "prior quarter" or "prior-year three-months," respectively). This table, as well as the discussion that follows, should be read with the accompanying condensed consolidated financial statements and related notes.
Three Months Ended March 31, | Percentage Change | |||||||||
2016 | 2015 | |||||||||
(in thousands) | ||||||||||
Net Revenues: | ||||||||||
Pawn service charges | $ | 64,130 | $ | 59,470 | 8 | % | ||||
Merchandise sales | 109,343 | 107,852 | 1 | % | ||||||
Merchandise sales gross profit | 41,011 | 35,360 | 16 | % | ||||||
Gross margin on merchandise sales | 38 | % | 33 | % | 15 | % | ||||
Jewelry scrapping sales | 12,780 | 18,399 | (31 | )% | ||||||
Jewelry scrapping sales gross profit | 1,695 | 4,045 | (58 | )% | ||||||
Gross margin on jewelry scrapping sales | 13 | % | 22 | % | (41 | )% | ||||
Consumer loan fees and interest, net | 6,933 | 13,783 | (50 | )% | ||||||
Other revenues | 30 | 910 | (97 | )% | ||||||
Net revenues | 113,799 | 113,568 | — | % | ||||||
Operating expenses | 103,852 | 101,176 | 3 | % | ||||||
Impairment of goodwill (non-operating expense) | 73,921 | — | * | |||||||
Other non-operating expenses | 6,534 | 16,324 | (60 | )% | ||||||
Loss from continuing operations before income taxes | (70,508 | ) | (3,932 | ) | * | |||||
Income tax expense | 6,189 | 362 | * | |||||||
Loss from continuing operations, net of tax | (76,697 | ) | (4,294 | ) | * | |||||
(Loss) income from discontinued operations, net of tax | (1,094 | ) | 4,731 | * | ||||||
Net (loss) income | (77,791 | ) | 437 | * | ||||||
Net loss from continuing operations attributable to noncontrolling interest | (3,666 | ) | (906 | ) | * | |||||
Net (loss) income attributable to EZCORP | $ | (74,125 | ) | $ | 1,343 | * | ||||
Net earning assets: | ||||||||||
Pawn loans | $ | 140,195 | $ | 127,929 | 10 | % | ||||
Consumer loans, net | 26,362 | 55,529 | (53 | )% | ||||||
Inventory, net | 126,446 | 116,144 | 9 | % | ||||||
Non-current consumer loans, net | 62,673 | 79,860 | (22 | )% | ||||||
Total net earning assets | $ | 355,676 | $ | 379,462 | (6 | )% | ||||
* | Represents an increase or decrease in excess of 100% or not meaningful. |
Loss from continuing operations, net of tax, was $76.7 million in the current quarter, an increase of $72.4 million from the prior-year quarter's loss of $4.3 million. The increased loss was the result of a $73.9 million goodwill impairment charge recorded in our Grupo Finmart segment in the current quarter, which offset continued improvements in our U.S. and Mexico Pawn segments. For further discussion of the Grupo Finmart goodwill impairment charge, see "Grupo Finmart" below.
47
The $10.3 million increase in core pawn net revenue (pawn service charges and merchandise sales) was primarily due to:
• | A $4.7 million, or 8%, increase in pawn service charges primarily due to same store growth in the U.S. Pawn segment, in addition to an increase in average monthly ending pawn loans outstanding in comparison to the prior-year quarter in both our U.S. Pawn and Mexico Pawn segments; and |
• | A $5.7 million, or 16%, increase in merchandise sales gross profit primarily due to improved margins in both our U.S. Pawn and Mexico Pawn segments in comparison to the prior-year quarter as a result of better merchandise lending valuations and improvements in early lifecycle pricing. |
The $2.4 million, or 58%, decrease in jewelry scrapping net revenue was primarily due to a decrease in proceeds realized per gram of gold jewelry scrapped coupled with a decrease in gold volume primarily as a result of our strategy to sell rather than scrap jewelry during our peak selling season. Jewelry scrapping gross profit continued to decline as a percentage of overall net revenue.
Consumer loan net revenue decreased $6.9 million, or 50%, primarily as a result of continued delays in collections at our Grupo Finmart segment as further described within our Grupo Finmart segment discussion.
Other revenue decreased $0.9 million, or 97%, as a result of wind down of nominal activities as we refocus on our core pawn operations.
The $2.7 million increase in operating expenses was primarily due to:
• | A $3.1 million increase in operations expense primarily due to a $3.3 million increase in expense incurred at our U.S. Pawn segment as a result of staffing enhancements and a revision to incentive compensation plans in our field organization to better serve and satisfy our customers; and |
• | A $0.8 million increase in administrative expense due to an overall net increase in labor expenses and associated costs; partially offset by |
• | A $1.0 million decrease in depreciation and amortization expense due to lower capital asset acquisitions as a result of our strategic review completed in fiscal 2015; and |
• | A $0.5 million decrease in restructuring expense due to restructuring actions initiated in prior fiscal years which are winding down. |
The $64.1 million increase in non-operating expenses was primarily due to:
• | The $73.9 million goodwill impairment charge recorded in our Grupo Finmart segment in the current quarter; partially offset by |
• | A $5.6 million increase in equity in net income of unconsolidated affiliate due to improvement in performance of our equity method investment Cash Converters International; |
• | A $2.8 million decrease in interest expense attributable to a decrease in the weighted-average debt outstanding related to our Grupo Finmart segment during the current quarter as compared to the prior-year quarter, and a $1.2 million ($0.8 million, net of taxes) charge associated with an interest payment made to the Internal Revenue Service pertaining to the audit of our fiscal 2010 return included in the prior-year quarter; and |
• | A $1.8 million decrease in other expense, primarily attributable to smaller foreign currency translation losses due to movement in exchange rates during the current quarter. |
Income tax expense increased $5.8 million to $6.2 million in the current quarter, primarily due to discrete tax expense related to a change in estimate of prior year taxes and permanently non-deductible items, which included the impairment of non-deductible goodwill associated with Grupo Finmart. The effective tax rate from continuing operations for the three-months ended March 31, 2016 was (9)% of pre-tax loss compared to (9)% of pre-tax loss for the three-months ended March 31, 2015.
The decrease in (loss) income from discontinued operations, net of tax, was due to substantial exit of our USFS business during the fourth quarter of fiscal 2015 resulting in minimal activity during the current quarter other than additional wind down charges of $1.2 million due to final payments associated with the physical exit of USFS stores.
48
U.S. Pawn
The following table presents selected summary financial data from continuing operations for the U.S. Pawn segment:
Three Months Ended March 31, | Percentage Change | |||||||||
2016 | 2015 | |||||||||
(in thousands) | ||||||||||
Net revenues: | ||||||||||
Pawn service charges | $ | 56,614 | $ | 52,317 | 8 | % | ||||
Merchandise sales | 94,740 | 92,472 | 2 | % | ||||||
Merchandise sales gross profit | 36,499 | 30,982 | 18 | % | ||||||
Gross margin on merchandise sales | 39 | % | 34 | % | 15 | % | ||||
Jewelry scrapping sales | 11,599 | 17,391 | (33 | )% | ||||||
Jewelry scrapping sales gross profit | 1,471 | 3,928 | (63 | )% | ||||||
Gross margin on jewelry scrapping sales | 13 | % | 23 | % | (43 | )% | ||||
Other revenues | 49 | 224 | (78 | )% | ||||||
Net revenues | 94,633 | 87,451 | 8 | % | ||||||
Segment operating expenses: | ||||||||||
Operations | 61,240 | 57,920 | 6 | % | ||||||
Depreciation and amortization | 3,042 | 3,607 | (16 | )% | ||||||
Segment operating contribution | 30,351 | 25,924 | 17 | % | ||||||
Other segment expenses | 676 | 7 | * | |||||||
Segment contribution | $ | 29,675 | $ | 25,917 | 15 | % | ||||
Other data: | ||||||||||
Net earning assets — continuing operations | $ | 231,956 | $ | 210,728 | 10 | % | ||||
Inventory turnover — general merchandise (b) | 2.8 | 3.2 | (13 | )% | ||||||
Inventory turnover — jewelry (b) | 1.2 | 1.3 | (8 | )% | ||||||
Average monthly ending pawn loan balance per store (a) | $ | 254 | $ | 234 | 9 | % | ||||
Average annual yield on pawn loans outstanding | 168 | % | 169 | % | -100bps | |||||
Pawn loan redemption rate (c) | 85 | % | 85 | % | 0bps | |||||
* | Represents an increase or decrease in excess of 100% or not meaningful. |
(a) | Balance is calculated based upon the average of the monthly ending balance averages during the applicable period. |
(b) | Calculation of inventory turnover excludes the effects of scrapping. |
(c) | Our pawn loan redemption rate represents the percentage of loans made that are repaid, renewed or extended. |
49
Net revenues increased 8%, or $7.2 million, with core pawn revenue increasing $6.6 million, or 5%, from the prior-year quarter. The increase in core pawn revenue attributable to same stores and new stores added since the prior-year quarter is summarized as follows:
Current Quarter from Prior-Year Quarter Change in Core Pawn Revenue | |||||||||||
Pawn Service Charges | Merchandise Sales | Total | |||||||||
(in millions) | |||||||||||
Same stores | $ | 2.7 | $ | 1.0 | $ | 3.7 | |||||
New stores | 1.6 | 1.3 | 2.9 | ||||||||
Total | $ | 4.3 | $ | 2.3 | $ | 6.6 | |||||
Pawn service charges increased 8% from the prior-year quarter primarily due to an increase in average monthly ending pawn loan balances outstanding of 9% as a result of same store growth.
Gross margin on merchandise sales increased to 39% from 34% in the prior-year quarter as a result of better merchandise lending valuations and improvements in early lifecycle pricing. Additionally, we reduced total aged inventory (as a percentage of total inventory) to 10% from 13%, comprised of a reduction of aged general merchandise inventory to 5% from 6% and a reduction of aged jewelry inventory to 15% from 20% in the prior-year quarter. These positive operating developments drove an increase in merchandise sales gross profit of $5.5 million.
Gross margin on jewelry scrapping sales decreased to 13% from 23% in the prior-year quarter as a result of a 5% decrease in proceeds realized per gram of gold jewelry scrapped, coupled with a 29% decrease in gold volume, primarily as a result of our strategy to sell rather than scrap jewelry during our peak selling season. Jewelry scrapping sales gross profit decreased to 2% of net revenues from 4% in the prior-year quarter.
Total segment expenses increased to $65.0 million (40% of revenues) in the current quarter from $61.5 million (38% of revenues) in the prior-year quarter primarily due to:
• | A $3.3 million, or 6%, increase in operations expense as a result of staffing enhancements and a revision to incentive compensation plans in our field organization to better serve and satisfy our customers in addition to additional costs associated with new stores opened and other smaller items; and |
• | A $0.5 million increase in other segment expenses as a result of the abandonment of assets resulting from the ongoing streamlining of our structure and operating model to improve overall efficiency and reduce costs; partially offset by |
• | A $0.6 million, or 16%, decrease in depreciation and amortization as a result of savings realized from lower capital asset acquisitions as a result of our strategic review completed in fiscal 2015. |
50
Non-GAAP Financial Information
In addition to the financial information prepared in conformity with generally accepted accounting principles in the United States of America ("GAAP"), we provide certain other non-GAAP financial information on a constant currency basis ("constant currency"). We use constant currency and ongoing segment contribution results to evaluate results of the Mexico Pawn and Grupo Finmart segment operations, which are denominated in Mexican pesos and believe that presentation of constant currency results are meaningful and useful in understanding the activities and business metrics of our Mexico Pawn and Grupo Finmart operations and reflect an additional way of viewing aspects of our business that, when viewed with its GAAP results, provide a more complete understanding of factors and trends affecting our business. We provide non-GAAP financial information for informational purposes and to enhance understanding of our GAAP condensed consolidated financial statements. We use this non-GAAP financial information to evaluate and compare operating results across accounting periods. Readers should consider the information in addition to, but not instead of or superior to, our financial statements prepared in accordance with GAAP. This non-GAAP financial information may be determined or calculated differently by other companies, limiting the usefulness of those measures for comparative purposes.
Constant currency results reported herein are calculated by translating condensed consolidated balance sheet and condensed consolidated statement of operations items denominated in Mexican pesos to U.S. dollars using the exchange rate from the prior-year comparable period, as opposed to the current comparable period, in order to exclude the effects of foreign currency rate fluctuations. For condensed consolidated balance sheet items, the end of period rate as of March 31, 2016 of 17.3 to 1 was used, compared to the end of period rate as of March 31, 2015 of 15.2 to 1. For condensed consolidated statement of operations items, the average closing daily exchange rate for the appropriate period was used. The average exchange rates for the current three and six-months ended March 31, 2016 were 18.0 to 1 and 17.4 to 1, respectively, as compared to the prior year three and six-months ended March 31, 2015 rates of 14.9 to 1 and 14.4 to 1, respectively. Constant currency results, where presented, also exclude foreign currency gain or loss and the related foreign currency derivative gain or loss impact.
51
Mexico Pawn
The following table presents selected summary financial data from continuing operations for the Mexico Pawn segment, including constant currency results, after translation to U.S. dollars from its functional currency of the Mexican peso. The following discussion is in constant currency results. See “Results of Operations — Non-GAAP Financial Information” above.
Three Months Ended March 31, | Percentage Change GAAP | Percentage Change Constant Currency | |||||||||||||||
2016 | 2016 Constant Currency (a) | 2015 | |||||||||||||||
(in USD thousands) | |||||||||||||||||
Net revenues: | |||||||||||||||||
Pawn service charges | $ | 7,516 | $ | 9,080 | $ | 7,153 | 5 | % | 27 | % | |||||||
Merchandise sales | 14,603 | 17,641 | 14,883 | (2 | )% | 19 | % | ||||||||||
Merchandise sales gross profit | 4,513 | 5,452 | 4,203 | 7 | % | 30 | % | ||||||||||
Gross margin on merchandise sales | 31 | % | 31 | % | 28 | % | 11 | % | 11 | % | |||||||
Jewelry scrapping sales | 1,181 | 1,427 | 917 | 29 | % | 56 | % | ||||||||||
Jewelry scrapping sales gross profit | 224 | 271 | 97 | * | * | ||||||||||||
Gross margin on jewelry scrapping sales | 19 | % | 19 | % | 11 | % | 73 | % | 73 | % | |||||||
Other revenues | (117 | ) | (141 | ) | 269 | * | * | ||||||||||
Net revenues | 12,136 | 14,662 | 11,722 | 4 | % | 25 | % | ||||||||||
Segment operating expenses: | |||||||||||||||||
Operations | 9,024 | 10,901 | 10,406 | (13 | )% | 5 | % | ||||||||||
Depreciation and amortization | 764 | 923 | 1,101 | (31 | )% | (16 | )% | ||||||||||
Segment operating contribution | 2,348 | 2,838 | 215 | * | * | ||||||||||||
Other segment expenses (b) | 277 | 430 | 260 | 7 | % | 65 | % | ||||||||||
Segment contribution (loss) | $ | 2,071 | $ | 2,408 | $ | (45 | ) | * | * | ||||||||
Other data: | |||||||||||||||||
Net earning assets — continuing operations | $ | 34,793 | $ | 39,600 | $ | 33,032 | 5 | % | 20 | % | |||||||
Inventory turnover (e) | 2.4 | 2.4 | 2.2 | 9 | % | 9 | % | ||||||||||
Average monthly ending pawn loan balance per store (c) | $ | 66 | $ | 75 | $ | 64 | 3 | % | 17 | % | |||||||
Average annual yield on pawn loans outstanding | 197 | % | 202 | % | 203 | % | -600bps | -100bps | |||||||||
Pawn loan redemption rate (d) | 78 | % | 78 | % | 79 | % | -100bps | -100bps | |||||||||
* | Represents an increase or decrease in excess of 100% or not meaningful. |
(a) | For income statement items, the average closing daily exchange rate for the applicable period was used. For balance sheet items, the end of the period rate for the applicable period end was used. |
(b) | The three-months ended March 31, 2016 constant currency balance excludes $0.1 million of net foreign currency transaction gains resulting from movement in exchange rates. The net foreign currency transaction losses for the three-months ended March 31, 2015 were $0.3 million and are not excluded from the above results. |
(c) | Balance is calculated based upon the average of the monthly ending balance averages during the applicable period. |
(d) | Our pawn loan redemption rate represents the percentage of loans made that are repaid, renewed or extended. |
(e) | Calculation of inventory turnover excludes the effects of scrapping. |
52
Our Mexico pawn operations continued to grow strongly, with core pawn revenue increasing $4.7 million, or 21%, from the prior-year quarter. Merchandise sales increased $2.8 million, or 19%, from the prior-year quarter to $17.6 million. The increase in core pawn revenue attributable to same store and new stores added since the prior-year quarter is summarized as follows:
Current Quarter from Prior-Year Quarter Change in Core Pawn Revenue | |||||||||||
Pawn Service Charges | Merchandise Sales | Total | |||||||||
(in millions) | |||||||||||
Same stores | $ | 1.8 | $ | 2.6 | $ | 4.4 | |||||
New stores | 0.1 | 0.2 | 0.3 | ||||||||
Total | $ | 1.9 | $ | 2.8 | $ | 4.7 | |||||
Pawn service charges increased 27% from the prior-year quarter driven by an increase in average monthly ending pawn loan balances outstanding of 17% as a result of same store growth.
Gross margin on merchandise sales increased to 31% from 28% in the prior-year quarter as a result of better merchandise lending valuations and improvements in early lifecycle pricing. Additionally, we reduced total aged inventory to 3% from 11%, comprised of a reduction of aged general merchandise inventory to 4% from 11% and a reduction of aged jewelry inventory to a nominal amount from 3% in the prior-year quarter. These positive operating developments drove an increase in merchandise sales gross profit of $1.2 million.
Total segment expenses increased to $12.3 million (44% of revenues) in the current quarter from $11.8 million (51% of revenues) in the prior-year quarter primarily due to a $0.5 million increase in operations expense as a result of staffing enhancements and a revision to incentive compensation plans in our field organization to better serve and satisfy our customers in addition to other smaller items.
53
Grupo Finmart
The table below presents selected summary financial data from continuing operations for the Grupo Finmart segment, including constant currency results, after translation to U.S. dollars from its functional currency of the Mexican peso. The following discussion is in constant currency results. See “Results of Operations — Non-GAAP Financial Information” above.
Three Months Ended March 31, | Percentage Change GAAP | Percentage Change Constant Currency | |||||||||||||||
2016 | 2016 Constant Currency (a) | 2015 | |||||||||||||||
(in thousands) | |||||||||||||||||
Revenues: | |||||||||||||||||
Consumer loan fees and interest | $ | 13,589 | $ | 16,416 | $ | 16,391 | (17 | )% | — | % | |||||||
Other revenues | 98 | 118 | 49 | 100 | % | * | |||||||||||
Total revenues | 13,687 | 16,534 | 16,440 | (17 | )% | 1 | % | ||||||||||
Consumer loan bad debt | 8,252 | 9,969 | 4,110 | * | * | ||||||||||||
Net revenues | 5,435 | 6,565 | 12,330 | (56 | )% | (47 | )% | ||||||||||
Segment expenses (income): | |||||||||||||||||
Operations | 8,026 | 9,696 | 7,109 | 13 | % | 36 | % | ||||||||||
Depreciation and amortization | 476 | 575 | 626 | (24 | )% | (8 | )% | ||||||||||
Impairment of goodwill (e) | 73,921 | 73,921 | — | * | * | ||||||||||||
Interest expense | 4,498 | 5,434 | 6,376 | (29 | )% | (15 | )% | ||||||||||
Interest income | (120 | ) | (145 | ) | (423 | ) | (72 | )% | (66 | )% | |||||||
Other (income) expense (b) | (124 | ) | — | 1,272 | * | * | |||||||||||
Segment loss | $ | (81,242 | ) | $ | (82,916 | ) | $ | (2,630 | ) | * | * | ||||||
Other data: | |||||||||||||||||
Net earning assets — continuing operations | $ | 86,771 | $ | 98,759 | $ | 116,857 | (26 | )% | (15 | )% | |||||||
Consumer loan originations (c) | 5,349 | 6,462 | 20,061 | (73 | )% | (68 | )% | ||||||||||
Consumer loan bad debt as a percentage of gross average consumer loan balance (d) | 14 | % | 14 | % | 4 | % | * | * | |||||||||
* | Represents an increase or decrease in excess of 100% or not meaningful. | |||
(a) | For income statement items, the average closing daily exchange rate for the applicable period was used. For balance sheet items, the end of the period rate for the applicable period end was used. | |||
(b) | The three-months ended March 31, 2016 constant currency balance excludes a $0.1 million of net foreign currency transaction gains resulting from movement in exchange rates. The net foreign currency transaction losses for the three-months ended March 31, 2015 were $1.3 million and are not excluded from the above results. | |||
(c) | Constant currency result is calculated as the average monthly consumer loan origination balance translated at the average closing daily exchange rate for the applicable period. | |||
(d) | Represents consumer loan bad debt expense during the applicable period as a percentage of the average monthly consumer loan balance during the applicable period. Constant currency consumer loan balance is calculated using the end of period rate for each month. | |||
(e) | Amount not adjusted on a constant currency basis as charge occurred at a single point in time. | |||
During January 2012 we acquired a 60% controlling interest in Grupo Finmart and began consolidating its results of operations. As of March 31, 2016 and 2015 we owned a 94% and 76% controlling interest, respectively, in Grupo Finmart. The results presented above and discussed below include the noncontrolling interest portion of Grupo Finmart’s segment loss.
Consumer loan bad debt increased $5.9 million from the prior-year quarter to $10.0 million. The overall increase in consumer loan bad debt was a result of delays in collections. We continue to monitor collections and may revise our reserve rate on performing loans in future reporting periods as a result of additional information that becomes known. Grupo Finmart’s non-performing loans represented 42% of its overall portfolio as of March 31, 2016, up from 34% of the overall portfolio as of December 31, 2015.
54
Consumer loan originations decreased 68% from the prior-year quarter to $6.5 million with focus on performing convenios and targeted shorter duration loans.
We analyze cost recovery of the non-performing loan balance of $65.1 million as of March 31, 2016 in two buckets:
a. | 76% of the non-performing loan balance was related to "in-payroll" loans that were reserved under of our accounting policies due to delays in the timing of cash receipts. During the three months ended March 31, 2016, we collected $5.5 million on previously reserved loans, inclusive of principal and interest. |
b. | 24% of the non-performing loan balance was attributable to “out-of-payroll” loans, for which no significant future collections from employees are expected. |
Total segment expenses increased to $89.5 million in the current quarter from $13.7 million (excluding foreign currency expense) in the prior-year quarter, primarily due to:
• | The $73.9 million goodwill impairment charge in the current quarter, discussed more fully below; and |
• | A $2.6 million increase in operations expense primarily attributable to a $1.4 million increase in amortization of deferred commissions, a $0.8 million increase in business and professional fees, and a $0.8 million contingent consideration fair value gain in the prior-year quarter, in addition to other smaller items; partially offset by |
• | A $0.9 million decrease in interest expense due to a decrease in weighted-average debt outstanding during the current quarter as compared to the prior-year quarter. |
As discussed in Note 6 of Notes to Interim Condensed Consolidated Financial Statements included in "Part I, Item 1 — Financial Statements," we tested goodwill and intangible assets with an indefinite useful life for potential impairment during the current quarter due to the existence of certain indicators of impairment, including a continued decline in our stock price, as well as continued delays in collections and bad debt experience at Grupo Finmart. Our Step 1 analysis determined that the fair value of the Grupo Finmart reporting unit (estimated to be $46.5 million) was below its carrying value. Thus, under Step 2, we compared that fair value with the fair value of Grupo Finmart's net assets, and determined that we should impair the goodwill attributable to Grupo Finmart by $73.9 million. This impairment charge was recorded in the current quarter. No other assets held by Grupo Finmart were determined to be impaired as of March 31, 2016.
In February 2016, we announced that we were conducting a comprehensive review of the strategic options for Grupo Finmart. In April 2016, a special committee of our board of directors, after reviewing a variety of strategic alternatives with management and the company's financial advisors, concluded that a sale of the business was the preferred alternative and authorized management to proceed with a process to solicit proposals from interested buyers. The determination of U.S. GAAP fair value for purposes of determining the degree of impairment was based on a discounted cash flow methodology, using assumptions based on our capacity to continue to operate the business under its current capital structure. We would expect that prospective buyers would have their own valuation methodologies and assumptions. Furthermore, the U.S. GAAP fair value is net of Grupo Finmart debt obligations, including approximately $35.8 million of intercompany debt that is owed to EZCORP. Therefore, we do not consider the U.S. GAAP fair value to represent the sales price that a prospective buyer will pay or the cash proceeds that we might realize from any such sale.
55
Other International
The following table presents selected financial data from continuing operations for the Other International segment after translation to U.S. dollars from its reporting units' functional currency of primarily Canadian and Australian dollars:
Three Months Ended March 31, | Percentage Change | |||||||||
2016 | 2015 | |||||||||
(in thousands) | ||||||||||
Revenues: | ||||||||||
Merchandise sales | $ | — | $ | 497 | (100 | )% | ||||
Jewelry scrapping sales | — | 91 | (100 | )% | ||||||
Consumer loan fees and interest | 2,027 | 2,153 | (6 | )% | ||||||
Other revenues | — | 368 | (100 | )% | ||||||
Total revenues | 2,027 | 3,109 | (35 | )% | ||||||
Merchandise cost of goods sold | 1 | 322 | (100 | )% | ||||||
Jewelry scrapping cost of goods sold | — | 71 | (100 | )% | ||||||
Consumer loan bad debt | 431 | 651 | (34 | )% | ||||||
Net revenues | 1,595 | 2,065 | (23 | )% | ||||||
Segment operating expenses (income): | ||||||||||
Operations | 1,992 | 1,755 | 14 | % | ||||||
Depreciation and amortization | 56 | 162 | (65 | )% | ||||||
Equity in net (income) loss of unconsolidated affiliate | (1,877 | ) | 3,678 | * | ||||||
Segment operating contribution (loss) | 1,424 | (3,530 | ) | * | ||||||
Other segment expenses | 4 | 7 | (43 | )% | ||||||
Segment contribution (loss) | $ | 1,420 | $ | (3,537 | ) | * | ||||
* | Represents an increase or decrease in excess of 100% or not meaningful. |
Segment contribution from the Other International segment increased $5.0 million from the prior-year quarter to $1.4 million in the current quarter, primarily due to a $5.6 million increase in equity in net income of unconsolidated affiliate due to improvement in performance of our equity method investment Cash Converters International; partially offset by a $0.5 million decrease in segment net revenues due to wind down of Canadian pawn operations. Operations expenses increased $0.2 million due primarily to an investment in an IT marketing platform to provide targeted solutions for our pawn customers, offset by other smaller items.
On February 29, 2016, Cash Converters International announced the results of its strategic review initiated in September 2015 which included growth of its business in Australia and New Zealand, restructuring of its United Kingdom operations and repositioning of its Carboodle operations. In additional to other measures, Cash Converters International has disclosed maximum pre-tax costs (a mixture of cash, provisions and write-downs) of $8.5 million (impact to EZCORP at exchange rates in effect as of March 31, 2016) related to the strategic review to occur in future periods. We anticipate the recognition of the majority of these costs in our fourth quarter of fiscal 2016, however, we are unable to quantify the ultimate impact or timing of these charges.
56
Other Items
The following table reconciles our consolidated segment contribution discussed above to net (loss) income attributable to EZCORP, Inc., including items that affect our consolidated financial results but are not allocated among segments:
Three Months Ended March 31, | Percentage Change | |||||||||
2016 | 2015 | |||||||||
(in thousands) | ||||||||||
Segment (loss) contribution | $ | (48,076 | ) | $ | 19,705 | * | ||||
Corporate expenses (income): | ||||||||||
Administrative | 15,621 | 14,800 | 6 | % | ||||||
Depreciation and amortization | 2,744 | 2,599 | 6 | % | ||||||
Loss on sale or disposal of assets | — | 369 | (100 | )% | ||||||
Interest expense | 3,874 | 4,914 | (21 | )% | ||||||
Interest income | (7 | ) | (50 | ) | (86 | )% | ||||
Restructuring | (86 | ) | 704 | * | ||||||
Other expense | 286 | 301 | (5 | )% | ||||||
Loss from continuing operations before income taxes | (70,508 | ) | (3,932 | ) | * | |||||
Income tax expense | 6,189 | 362 | * | |||||||
Loss from continuing operations, net of tax | (76,697 | ) | (4,294 | ) | * | |||||
(Loss) income from discontinued operations, net of tax | (1,094 | ) | 4,731 | * | ||||||
Net (loss) income | (77,791 | ) | 437 | * | ||||||
Net loss from continuing operations attributable to noncontrolling interest | (3,666 | ) | (906 | ) | * | |||||
Net (loss) income attributable to EZCORP, Inc. | $ | (74,125 | ) | $ | 1,343 | * | ||||
* | Represents an increase or decrease in excess of 100% or not meaningful. |
Administrative expenses increased $0.8 million, 6%, due primarily to an overall net increase in short-term and long-term incentive programs.
Interest expense decreased $1.0 million, or 21%, primarily due to a $1.2 million ($0.8 million, net of taxes) one-time charge associated with an interest payment made to the Internal Revenue Service pertaining to the audit of our fiscal 2010 return included in the prior-year quarter.
Restructuring expense decreased $0.8 million due to restructuring actions initiated in prior fiscal years which are winding down.
Income tax expense increased $5.8 million to $6.2 million in the current quarter, primarily due to discrete tax expense related to a change in estimate of prior year taxes and permanently non-deductible items, which included the impairment of non-deductible goodwill associated with Grupo Finmart. The effective tax rate from continuing operations for the three-months ended March 31, 2016 was (9)% of pre-tax loss compared to (9)% of pre-tax loss for the three-months ended March 31, 2015.
The decrease in (loss) income from discontinued operations, net of tax, was due to substantial exit of our USFS business during the fourth quarter of fiscal 2015 resulting in minimal activity during the current quarter other than additional wind down charges of $1.2 million in the current quarter due to final payments associated with the physical exit of USFS stores.
57
Six Months Ended March 31, 2016 vs. Six Months Ended March 31, 2015
Summary Financial Data
The following tables present selected, unaudited, financial data for our six-months ended March 31, 2016 and 2015 (the "current six-months" and "prior-year six-months," respectively). This table, as well as the discussion that follows, should be read with the accompanying condensed consolidated financial statements and related notes.
Six Months Ended March 31, | Percentage Change | |||||||||
2016 | 2015 | |||||||||
(in thousands) | ||||||||||
Revenues: | ||||||||||
Pawn service charges | $ | 130,724 | $ | 124,397 | 5 | % | ||||
Merchandise sales | 217,927 | 217,491 | — | % | ||||||
Merchandise sales gross profit | 83,336 | 72,521 | 15 | % | ||||||
Gross margin on merchandise sales | 38 | % | 33 | % | 15 | % | ||||
Jewelry scrapping sales | 22,401 | 36,933 | (39 | )% | ||||||
Jewelry scrapping gross profit | 3,240 | 7,904 | (59 | )% | ||||||
Gross margin on jewelry scrapping sales | 14 | % | 21 | % | (33 | )% | ||||
Consumer loan fees and interest, net | 7,518 | 24,239 | (69 | )% | ||||||
Other revenues | 497 | 1,565 | (68 | )% | ||||||
Net revenues | 225,315 | 230,626 | (2 | )% | ||||||
Operating expenses | 219,225 | 202,101 | 8 | % | ||||||
Impairment of goodwill (non-operating expense) | 73,921 | — | * | |||||||
Other non-operating expenses | 14,401 | 26,392 | (45 | )% | ||||||
(Loss) income from continuing operations before income taxes | (82,232 | ) | 2,133 | * | ||||||
Income tax expense | 2,493 | 3,626 | (31 | )% | ||||||
Loss from continuing operations, net of tax | (84,725 | ) | (1,493 | ) | * | |||||
(Loss) income from discontinued operations, net of tax | (1,332 | ) | 11,608 | * | ||||||
Net (loss) income | (86,057 | ) | 10,115 | * | ||||||
Net loss from continuing operations attributable to noncontrolling interest | (4,458 | ) | (2,840 | ) | 57 | % | ||||
Net (loss) income attributable to EZCORP | $ | (81,599 | ) | $ | 12,955 | * | ||||
* Represents an increase or decrease in excess of 100% or not meaningful. |
Loss from continuing operations, net of tax, increased $83.2 million from the prior-year six-months to $84.7 million in the current six-months. This change was primarily the result of continued improvements at our U.S. and Mexico Pawn segments, which were offset by an $87.3 million increase in loss from our Grupo Finmart segment.
The $17.1 million increase in core pawn net revenue was primarily due to:
• | A $6.3 million, or 5%, increase in pawn service charges primarily due to same store growth and new stores acquired in the U.S. Pawn segment in addition to an increase in average monthly ending pawn loans outstanding in comparison to the prior-year six-months in both our U.S. Pawn and Mexico Pawn segments; and |
• | A $10.8 million, or 15%, increase in merchandise sales gross profit attributable to improved margins in both our U.S. Pawn and Mexico Pawn segments in comparison to the prior-year quarter as a result of better merchandise lending valuations and improvements in early lifecycle pricing. |
The $4.7 million, or 59%, decrease in jewelry scrapping net revenue due to a decrease in proceeds realized per gram of gold jewelry scrapped coupled with a decrease in gold volume primarily as a result of our strategy to sell rather than scrap jewelry during our peak selling season. Jewelry scrapping gross profit continues to decline as a percentage of overall net revenue.
58
Consumer loan net revenue decreased $16.7 million, or 69%, primarily as a result of continued delays in collections at our Grupo Finmart segment as further described within our Grupo Finmart segment discussion.
Other revenue decreased $1.1 million, or 68%, as a result of wind down of nominal activities as we refocus on our core pawn operations.
The $17.1 million increase in operating expenses was primarily attributable to:
• | An $8.3 million increase in administrative expense due to a $4.9 million increase in labor expenses and associated costs and a $3.2 million increase in legal and professional fees from the prior-year six-months. The increase in labor expenses and associated costs is primarily attributable to a $3.3 million increase in stock compensation due to the timing of reversal of compensation costs in the prior-year six-months as a result of forfeitures, in addition to an overall net increase in short-term and long-term incentive programs, as well as other smaller items. The increase in professional fees is primarily associated with the restatement of previously-issued financial statements that we finalized during the current six-months; |
• | A $8.6 million increase in operations expense due to a $7.4 million increase in expense incurred at our U.S. Pawn segment due to staffing enhancements and a revision to incentive compensation plans in our field organization to better serve and satisfy our customers and costs associated with new stores acquired, in addition to other smaller items and a $1.7 million increase in amortization of deferred commissions and labor at our Grupo Finmart segment associated with strengthening of the executive team and talent acquisition, partially offset by other smaller items; and |
• | A $1.2 million increase in restructuring costs due to wind down of costs that were expensed in the current six-months relative to services being performed related to our fiscal 2015 restructuring plan; partially offset by |
• | A $1.0 million decrease in depreciation and amortization expense as a result of savings realized from lower capital asset acquisitions as a result of our strategic review completed in fiscal 2015. |
The $61.9 million increase in non-operating expenses was primarily attributable to:
• | A $73.9 million goodwill impairment charge recorded in our Grupo Finmart segment in the current six-months; partially offset by |
• | A $4.9 million decrease in net interest expense attributable to a decrease in the weighted-average debt outstanding related to our Grupo Finmart segment during the current six-months as compared to the prior-year six-months, and a $1.2 million ($0.8 million, net of taxes) one-time charge associated with an interest payment made to the Internal Revenue Service pertaining to the audit of our fiscal 2010 return included in the prior-year six-months; |
• | A $5.4 million increase in equity in net income of unconsolidated affiliate due to improvement in performance of our equity method investment Cash Converters International; and |
• | A $1.7 million decrease in other expense, primarily attributable to fewer foreign currency translation losses resulting from movement in exchange rates during the current quarter. |
Income tax expense decreased $1.1 million to $2.5 million in the current six-months, primarily due to a discrete tax expense related to a change in estimate of prior year taxes and permanently non-deductible items, which included the impairment of non-deductible goodwill associated with Grupo Finmart. The effective tax rate from continuing operations for the six-months ended March 31, 2016 was (3)% compared to 170% for the six-months ended March 31, 2015.
The decrease in (loss) income from discontinued operations, net of tax, was due to substantial exit of our USFS business during the fourth quarter of fiscal 2015 resulting in minimal activity during the current quarter other than additional wind down charges of $2.7 million in the current six-months due to final payments associated with the physical exit of USFS stores, partially offset by other smaller items.
59
U.S. Pawn
The following table presents selected summary financial data from continuing operations for the U.S. Pawn segment:
Six Months Ended March 31, | Percentage Change | |||||||||
2016 | 2015 | |||||||||
(in thousands) | ||||||||||
Net revenues: | ||||||||||
Pawn service charges | $ | 115,235 | $ | 109,352 | 5 | % | ||||
Merchandise sales | 186,734 | 181,914 | 3 | % | ||||||
Merchandise sales gross profit | 73,032 | 61,807 | 18 | % | ||||||
Gross margin on merchandise sales | 39 | % | 34 | % | 15 | % | ||||
Jewelry scrapping sales | 21,199 | 34,398 | (38 | )% | ||||||
Jewelry scrapping sales gross profit | 3,011 | 7,602 | (60 | )% | ||||||
Gross margin on jewelry scrapping sales | 14 | % | 22 | % | (36 | )% | ||||
Other revenues | 242 | 408 | (41 | )% | ||||||
Net revenues | 191,520 | 179,169 | 7 | % | ||||||
Segment operating expenses: | ||||||||||
Operations | 124,785 | 117,427 | 6 | % | ||||||
Depreciation and amortization | 6,602 | 7,059 | (6 | )% | ||||||
Segment operating contribution | 60,133 | 54,683 | 10 | % | ||||||
Other segment expenses (income) | 1,659 | (1 | ) | * | ||||||
Segment contribution | $ | 58,474 | $ | 54,684 | 7 | % | ||||
Other data: | ||||||||||
Average monthly ending pawn loan balance per store (a) | $ | 265 | $ | 254 | 4 | % | ||||
Average annual yield on pawn loans outstanding | 166 | % | 166 | % | 0bps | |||||
Pawn loan redemption rate (b) | 84 | % | 84 | % | 0bps | |||||
* | Represents an increase or decrease in excess of 100% or not meaningful. |
(a) | Balance is calculated based upon the average of the monthly ending balance averages during the applicable period. |
(b) | Our pawn loan redemption rate represents the percentage of loans made that are repaid, renewed or extended. |
Net revenues increased 7%, or $12.4 million, with core pawn revenue increasing $10.7 million, or 4%, from the prior-year six-months. The increase in core pawn revenue attributable to same stores and new stores added since the prior-year six-months in addition to change in pawn loan originations is summarized as follows:
Current Six-Months Ended from Prior-Year Six-Months Ended Change in Core Pawn Revenue | |||||||||||
Pawn Service Charges | Merchandise Sales | Total | |||||||||
(in millions) | |||||||||||
Same stores | $ | 2.3 | $ | 1.2 | $ | 3.5 | |||||
New stores | 3.6 | 3.6 | 7.2 | ||||||||
Total | $ | 5.9 | $ | 4.8 | $ | 10.7 | |||||
60
Pawn service charges increased 5%, due to an increase in average monthly ending pawn loans outstanding of 4% as a result of same store growth, in addition to contributions from new stores acquired.
Gross margin on merchandise sales increased to 39% from 34% in the prior-year six-months as a result of liquidating aged inventory during fiscal 2015. We reduced total aged inventory (as a percentage of total inventory) to 10% from 13%, comprised of a reduction of aged general merchandise inventory to 5% from 6% and a reduction of aged jewelry inventory to 15% from 20% in the prior-year quarter. These positive operating developments drove an increase in merchandise sales gross profit of $11.2 million.
Gross margin on jewelry scrapping sales decreased to 14% from 22% in the prior-year six-months as a result of a 6% decrease in proceeds realized per gram of gold jewelry scrapped, coupled with a 33% decrease in gold volume, primarily as a result of our strategy to sell rather than scrap jewelry during our peak selling season. Jewelry scrapping sales gross profit decreased to 2% of net revenues from 4% in the prior-year six-months.
Total segment expenses increased to $133.0 million (41% of revenues) in the current six-months from $124.5 million (38% of revenues) in the prior-year six-months primarily due to:
• | A $7.4 million, or 6%, increase in operations expense as a result of staffing enhancements and a revision to incentive compensation plans in our field organization to better serve and satisfy our customers in addition to costs associated with new stores acquired and other smaller items; |
• | A $1.0 million increase in restructuring costs due to wind down of costs that were expensed in the current six-months relative to services being performed related to our fiscal 2015 restructuring plan; and |
• | A $0.5 million increase in other segment expenses as a result of the abandonment of assets resulting from the ongoing streamlining of our structure and operating model to improve overall efficiency and reduce costs; partially offset by |
• | A $0.5 million decrease in depreciation and amortization expense as a result of savings realized from lower capital asset acquisitions as a result of our strategic review completed in fiscal 2015. |
61
Mexico Pawn
The following table presents selected summary financial data from continuing operations for the Mexico Pawn segment, including constant currency results, after translation to U.S. dollars from its functional currency of the Mexican peso. The following discussion is in constant currency results. See “Results of Operations — Non-GAAP Financial Information” above.
Six Months Ended March 31, | Percentage Change GAAP | Percentage Change Constant Currency | |||||||||||||||
2016 | 2016 Constant Currency (a) | 2015 | |||||||||||||||
(in USD thousands) | |||||||||||||||||
Net revenues: | |||||||||||||||||
Pawn service charges | $ | 15,489 | $ | 18,716 | $ | 15,045 | 3 | % | 24 | % | |||||||
Merchandise sales | 31,189 | 37,687 | 34,463 | (10 | )% | 9 | % | ||||||||||
Merchandise sales gross profit | 10,301 | 12,447 | 10,299 | — | % | 21 | % | ||||||||||
Gross margin on merchandise sales | 33 | % | 33 | % | 30 | % | 10 | % | 10 | % | |||||||
Jewelry scrapping sales | 1,181 | 1,427 | 2,324 | (49 | )% | (39 | )% | ||||||||||
Jewelry scrapping sales gross profit | 224 | 271 | 243 | (8 | )% | 12 | % | ||||||||||
Gross margin on jewelry scrapping sales | 19 | % | 19 | % | 10 | % | 90 | % | 90 | % | |||||||
Other revenues | 74 | 89 | 509 | (85 | )% | (83 | )% | ||||||||||
Net revenues | 26,088 | 31,523 | 26,096 | — | % | 21 | % | ||||||||||
Segment operating expenses: | |||||||||||||||||
Operations | 20,217 | 24,429 | 20,926 | (3 | )% | 17 | % | ||||||||||
Depreciation and amortization | 1,565 | 1,891 | 2,345 | (33 | )% | (19 | )% | ||||||||||
Segment operating contribution | 4,306 | 5,203 | 2,825 | 52 | % | 84 | % | ||||||||||
Other segment expenses (b) | 799 | 906 | 955 | (16 | )% | (5 | )% | ||||||||||
Segment contribution | $ | 3,507 | $ | 4,297 | $ | 1,870 | 88 | % | * | ||||||||
Other data: | |||||||||||||||||
Average monthly ending pawn loan balance per store (c) | $ | 67 | $ | 76 | $ | 62 | 8 | % | 23 | % | |||||||
Average annual yield on pawn loans outstanding | 195 | % | 196 | % | 199 | % | -400bps | -300bps | |||||||||
Pawn loan redemption rate (d) | 78 | % | 78 | % | 78 | % | 0bps | 0bps | |||||||||
* | Represents an increase or decrease in excess of 100% or not meaningful. |
(a) | For income statement items, the average closing daily exchange rate for the applicable period was used. For balance sheet items, the end of the period rate for the applicable period end was used. |
(b) | The six-months ended March 31, 2016 constant currency balance excludes nominal net foreign currency transaction losses resulting from movement in exchange rates. The net foreign currency transaction losses for the six-months ended March 31, 2015 were $0.7 million and are not excluded from the above results. |
(c) | Balance is calculated based upon the average of the monthly ending balance averages during the applicable period. |
(d) | Our pawn loan redemption rate represents the percentage of loans made that are repaid, renewed or extended. |
62
Our Mexico pawn operations continued to grow strongly, with core pawn revenue increasing $6.9 million, or 14%, from the prior-year six-months. Merchandise sales increased $3.2 million, or 9%, from the prior-year six-months to $37.7 million. The increase in core pawn revenue attributable to same store and new stores added since the prior-year six-months is summarized as follows:
Current Six-Months Ended from Prior-Year Six-Months Ended Change in Core Pawn Revenue | |||||||||||
Pawn Service Charges | Merchandise Sales | Total | |||||||||
(in millions) | |||||||||||
Same stores | $ | 3.6 | $ | 3.0 | $ | 6.6 | |||||
New stores | 0.1 | 0.2 | 0.3 | ||||||||
Total | $ | 3.7 | $ | 3.2 | $ | 6.9 | |||||
Pawn service charges increased 24% from the prior-year six-months driven by an increase in average monthly ending pawn loans outstanding of 23% as a result of same store growth, partially offset by the annualized average yield decreasing to 196% from 199% in the prior-year six-months.
Gross margin on merchandise sales increased to 33% from 30% in the prior-year six-months as a result of better merchandise lending valuations and improvements in early lifecycle pricing. Additionally, we reduced total aged inventory to 3% from 11%, comprised of a reduction of aged general merchandise inventory to 4% from 11% and a reduction of aged jewelry inventory to a nominal amount from 3% in the prior-year quarter. These positive operating developments drove an increase in merchandise sales gross profit of $2.1 million.
Total segment expenses increased to $27.2 million (47% of revenues) in the current six-months from $24.2 million (46% of revenues) in the prior-year six-months primarily due to:
• | A $1.0 million increase in operations expense as a result of staffing enhancements and a revision to incentive compensation plans in our field organization to better serve and satisfy our customers in addition to other smaller items; |
• | A $0.7 million increase in marketing expenses as a result of growth initiatives; |
• | A $0.6 million increase in professional and other fees; and |
• | A $0.4 million increase in restructuring expense for certain costs that were expensed in the current six-months relative to services being performed related to our fiscal 2015 restructuring plan aimed to streamline our structure and operating model to improve overall efficiency and reduce costs. |
63
Grupo Finmart
The table below presents selected summary financial data from continuing operations for the Grupo Finmart segment, including constant currency results, after translation to U.S. dollars from its functional currency of the Mexican peso. The following discussion is in constant currency results. See “Results of Operations — Non-GAAP Financial Information” above.
Six Months Ended March 31, | Percentage Change GAAP | Percentage Change Constant Currency | |||||||||||||||
2016 | 2016 Constant Currency (a) | 2015 | |||||||||||||||
(in thousands) | |||||||||||||||||
Revenues: | |||||||||||||||||
Consumer loan fees and interest | $ | 24,403 | $ | 29,487 | $ | 32,706 | (25 | )% | (10 | )% | |||||||
Other revenues | 181 | 219 | 105 | 72 | % | * | |||||||||||
Total revenues | 24,584 | 29,706 | 32,811 | (25 | )% | (9 | )% | ||||||||||
Consumer loan bad debt | 20,243 | 24,460 | 11,850 | 71 | % | * | |||||||||||
Net revenues | 4,341 | 5,246 | 20,961 | (79 | )% | (75 | )% | ||||||||||
Segment expenses (income): | |||||||||||||||||
Operations | 17,614 | 21,284 | 15,397 | 14 | % | 38 | % | ||||||||||
Depreciation and amortization | 993 | 1,200 | 1,192 | (17 | )% | 1 | % | ||||||||||
Impairment of goodwill (e) | 73,921 | 73,921 | — | * | * | ||||||||||||
Interest expense | 9,563 | 11,555 | 14,657 | (35 | )% | (21 | )% | ||||||||||
Interest income | (251 | ) | (303 | ) | (904 | ) | (72 | )% | (66 | )% | |||||||
Other expense (b) | 644 | — | 1,446 | (55 | )% | * | |||||||||||
Segment loss | $ | (98,143 | ) | $ | (102,411 | ) | $ | (10,827 | ) | * | * | ||||||
Other data: | |||||||||||||||||
Consumer loan originations (c) | $ | 21,319 | $ | 25,761 | $ | 41,958 | (49 | )% | (39 | )% | |||||||
Consumer loan bad debt as a percentage of gross average consumer loan balance (d) | 26 | % | 26 | % | 10 | % | * | * | |||||||||
* | Represents an increase or decrease in excess of 100% or not meaningful. | |||
(a) | For income statement items, the average closing daily exchange rate for the applicable period was used. For balance sheet items, the end of the period rate for the applicable period end was used. | |||
(b) | The six-months ended March 31, 2016 constant currency balance excludes a $0.6 million of net foreign currency transaction losses resulting from movement in exchange rates. The net foreign currency transaction losses for the six-months ended March 31, 2015 were $1.4 million and are not excluded from the above results. | |||
(c) | Constant currency result is calculated as the average monthly consumer loan origination balance translated at the average closing daily exchange rate for the applicable period. | |||
(d) | Represents consumer loan bad debt expense during the applicable period as a percentage of the average monthly consumer loan balance during the applicable period. Constant currency consumer loan balance is calculated using the end of period rate for each month. | |||
(e) | Amount not adjusted on a constant currency basis as charge occurred at a single point in time. | |||
During January 2012 we acquired a 60% controlling interest in Grupo Finmart and began consolidating its results of operations. As of March 31, 2016 and 2015 we owned a 94% and 76% controlling interest, respectively, in Grupo Finmart. The results presented above and discussed below include the noncontrolling interest portion of Grupo Finmart’s segment loss.
Total revenues decreased $3.1 million, or 9%, from the prior-year six-months to $29.7 million. This decrease is inclusive of a $10.2 million in reversal of previously accrued interest as a result of reclassification of loans from performing to non-performing during the current quarter. Consumer loan bad debt increased $12.6 million from the prior-year six-months to $24.5 million. The overall decrease in net revenue was as a result of delays in collections. We continue to monitor collections and may revise our reserve rate on performing loans in future reporting periods as a result of additional information that becomes known. Grupo Finmart’s non-performing loans represented 42% of its overall portfolio as of March 31, 2016, up from 29% of the overall portfolio as of September 30, 2015.
64
Consumer loan originations decreased 39% from the prior-year six-months to $25.8 million with focus on performing convenios and targeted shorter duration loans.
The Company analyzes cost recovery of our non-performing loan balance of $65.1 million as of March 31, 2015 in two buckets:
a. | 76% of the non-performing loan balance was related to "in-payroll" loans that were reserved under our accounting policies due to delays in the timing of cash receipts. During the six months ended March 31, 2016, we collected $8.1 million on previously reserved loans, inclusive of principal and interest. |
b. | 24% of the non-performing loan balance was attributable to “out-of-payroll” loans, for which no significant future collections from employees are expected. |
Total segment expenses increased to $107.7 million in the current six months from $31.8 million in the prior-year six-months, primarily due to:
• | The $73.9 million goodwill impairment charge in the current quarter, discussed more fully above; and |
• | A $5.9 million, or 38%, increase in operations expense primarily attributable to a $3.3 million amortization of deferred commissions in addition to a $1.2 million increase in labor and related expenses associated with strengthening of the executive team and talent acquisition, in addition to other smaller item; partially offset by |
• | A $3.1 million, or 21%, decrease in interest expense due to a decrease in weighted-average debt outstanding during the current six-months as compared to the prior-year six-months. |
65
Other International
The following table presents selected financial data from continuing operations for the Other International segment after translation to U.S. dollars from its reporting units' functional currency of primarily Canadian and Australian dollars:
Six Months Ended March 31, | Percentage Change | |||||||||
2016 | 2015 | |||||||||
(in thousands) | ||||||||||
Revenues: | ||||||||||
Merchandise sales | $ | 4 | $ | 1,114 | (100 | )% | ||||
Consumer loan fees and interest | 4,401 | 4,809 | (8 | )% | ||||||
Jewelry scrapping sales | 21 | 211 | (90 | )% | ||||||
Other revenues | — | 543 | (100 | )% | ||||||
Total revenues | 4,426 | 6,677 | (34 | )% | ||||||
Merchandise cost of goods sold | 1 | 699 | (100 | )% | ||||||
Jewelry scrapping cost of goods sold | 16 | 152 | (89 | )% | ||||||
Consumer loan bad debt | 1,043 | 1,426 | (27 | )% | ||||||
Net revenues | 3,366 | 4,400 | (24 | )% | ||||||
Segment operating expenses (income): | ||||||||||
Operations | 3,272 | 3,527 | (7 | )% | ||||||
Depreciation and amortization | 107 | 353 | (70 | )% | ||||||
Equity in net (income) loss of unconsolidated affiliate | (3,932 | ) | 1,484 | * | ||||||
Segment operating contribution (loss) | 3,919 | (964 | ) | * | ||||||
Other segment expenses | 205 | 10 | * | |||||||
Segment contribution (loss) | $ | 3,714 | $ | (974 | ) | * | ||||
* | Represents an increase or decrease in excess of 100% or not meaningful. |
Segment contribution from the Other International segment increased $4.7 million from the prior-year six-months to $3.7 million in the current six-months, primarily due to a $5.4 million increase in equity in net income of unconsolidated affiliate due to improvement in performance of our equity method investment Cash Converters International; partially offset by a $1.0 million decrease in segment net revenues due to wind down of Canadian pawn operations. Operations expenses decreased $0.3 million due to other smaller items, offset by an investment in an IT marketing platform to provide targeted solutions for our pawn customers.
On February 29, 2016, Cash Converters International announced the results of its strategic review initiated in September 2015 which included growth of its business in Australia and New Zealand, restructuring of its United Kingdom operations and repositioning of its Carboodle operations. In additional to other measures, Cash Converters International has disclosed maximum pre-tax costs (a mixture of cash, provisions and write-downs) of $8.5 million (impact to EZCORP at exchange rates in effect as of March 31, 2016) related to the strategic review to occur in future periods. We anticipate the recognition of the majority of these costs in our fourth quarter of fiscal 2016, however, we are unable to quantify the ultimate impact or timing of these charges.
66
Other Items
The following table reconciles our consolidated segment contribution discussed above to net (loss) income attributable to EZCORP, Inc., including items that affect our consolidated financial results but are not allocated among segments:
Six Months Ended March 31, | Percentage Change | |||||||||
2016 | 2015 | |||||||||
(in thousands) | ||||||||||
Segment (loss) contribution | $ | (32,448 | ) | $ | 44,753 | * | ||||
Corporate expenses (income): | ||||||||||
Administrative | 35,604 | 27,352 | 30 | % | ||||||
Depreciation and amortization | 5,874 | 5,154 | 14 | % | ||||||
Loss on sale or disposal of assets | — | 369 | (100 | )% | ||||||
Interest expense | 7,875 | 8,658 | (9 | )% | ||||||
Interest income | (15 | ) | (84 | ) | (82 | )% | ||||
Restructuring | 183 | 726 | (75 | )% | ||||||
Other expense | 263 | 445 | (41 | )% | ||||||
(Loss) income from continuing operations before income taxes | (82,232 | ) | 2,133 | * | ||||||
Income tax expense | 2,493 | 3,626 | (31 | )% | ||||||
Loss from continuing operations, net of tax | (84,725 | ) | (1,493 | ) | * | |||||
(Loss) income from discontinued operations, net of tax | (1,332 | ) | 11,608 | * | ||||||
Net (loss) income | (86,057 | ) | 10,115 | * | ||||||
Net loss from continuing operations attributable to noncontrolling interest | (4,458 | ) | (2,840 | ) | 57 | % | ||||
Net (loss) income attributable to EZCORP, Inc. | $ | (81,599 | ) | $ | 12,955 | * | ||||
* | Represents an increase or decrease in excess of 100% or not meaningful. |
Administrative expense increased $8.3 million, or 30%, due to a $4.9 million increase in labor expenses and associated costs and a $3.2 million increase in legal and professional fees from the prior-year six-months. The increase in labor expenses and associated costs was primarily attributable to a $3.3 million increase in stock compensation due to the timing of reversal of compensation costs in the prior-year six-months as a result of forfeitures as well as new grants during the current six-months, in addition to an overall net increase in short-term and long-term incentive programs, as well as other smaller items. The increase in professional fees was primarily associated with the restatement of previously-issued financial statements that we finalized during the three-months ended December 31, 2015.
Depreciation and amortization expense increased $0.7 million, or 14%, primarily due to the change in estimated useful lives of certain IT assets during fiscal 2015.
Interest expense decreased $0.8 million, or 9%, primarily due to a $1.2 million ($0.8 million, net of taxes) one-time charge associated with an interest payment made to the Internal Revenue Service pertaining to the audit of our fiscal 2010 return included in the prior-year six-months.
Restructuring expense decreased $0.5 million, or 75%, primarily due to restructuring actions initiated in prior fiscal years which are winding down.
Loss on sale or disposal of assets decreased $0.4 million, or 100%, due to no disposals in the current six-months.
Income tax expense decreased $1.1 million to $2.5 million in the current six-months, primarily due to a discrete tax expense related to a change in estimate of prior year taxes and permanently non-deductible items, which included the impairment of non-deductible goodwill associated with Grupo Finmart. The effective tax rate from continuing operations for the six-months ended March 31, 2016 was (3)% compared to 170% for the six-months ended March 31, 2015.
The decrease in (loss) income from discontinued operations, net of tax, was due to substantial exit of our USFS business during the fourth quarter of fiscal 2015 resulting in minimal activity during the current quarter other than additional wind down charges of $2.7 million in the current six-months due to final payments associated with the physical exit of USFS stores, partially offset by other smaller items.
67
Liquidity and Capital Resources
Cash Flows
The table below presents a summary of the sources and uses of our cash:
Six Months Ended March 31, | Percentage Change | |||||||||
2016 | 2015 | |||||||||
(in thousands) | ||||||||||
Cash flows from operating activities | $ | 55,739 | $ | 37,790 | 47 | % | ||||
Cash flows from investing activities | 14,038 | 23,935 | (41 | )% | ||||||
Cash flows from financing activities | (49,945 | ) | 25,496 | * | ||||||
Effect of exchange rate changes on cash and cash equivalents | (3,620 | ) | (4,373 | ) | (17 | )% | ||||
Net increase in cash and cash equivalents | $ | 16,212 | $ | 82,848 | (80 | )% | ||||
* | Represents an increase or decrease in excess of 100% or not meaningful. |
Cash Flows from Operating Activities
Cash flows from net (loss) income exclusive of non-cash items for the six-month period ended March 31, 2016 were $24.1 million. We further had net receipts of $38.3 million pertaining to working capital items, primarily driven by $34.2 million received in March 2016 as a result of the carryback of fiscal 2015 tax net operating losses, offset by $6.7 million in restructuring payments and other items. The net result of these cash flows was $55.7 million of cash provided by operating activities for the six-months ended March 31, 2016.
Our unconsolidated affiliate Cash Converters International declared a dividend in March 2016. We expect to include approximately $2.3 million in cash flows from operating activities during the third quarter of fiscal 2016 upon receipt of the dividend.
Change in Cash and Cash Equivalents for the Current Six-Months Compared to the Prior-Year Six-Months
There was an overall decrease in cash flows from operating and investing activities during the current six-months as compared to the prior-year six-months as the results of businesses discontinued during fiscal 2015 and prior continue to anniversary through the fourth quarter of fiscal 2016.
The increase in cash flows from operating activities year over year was due to a $50.6 million increase from changes in operating assets and liabilities including $34.2 million received in March 2016 as a result of the carryback of fiscal 2015 tax net operating losses, offset by a $26.5 million decrease in net (loss) income exclusive of non-cash items including no net impact due to a non-cash goodwill charge of $73.9 million, a $3.7 million increase in restructuring payments and a $2.4 million decrease in dividends from unconsolidated affiliates.
The decrease in cash flows from investing activities year over year was due to a $33.8 million net decrease in proceeds related to loan activities (net loans repaid and recovery of pawn loan principal through sale of forfeited collateral), inclusive of the closure of USFS activities in fiscal 2015, and a $1.3 million increase in cash paid for acquisitions, offset by a $12.1 million decrease in investments in unconsolidated affiliate and a $13.0 million decrease in additions to property and equipment. We completed one acquisition during the current six-months of six pawn stores in Houston, Texas doing business under the "Pawn One" brand on February 1, 2016. Consumer loan originations at Grupo Finmart decreased $20.6 million, or 49% from the prior-year six-months due to local cash requirements to repay current debt maturities.
The decrease in cash flows from financing activities year over year was primarily due to a $51.1 million increase in net debt repayments, an $11.8 million repurchase of redeemable common stock issued for the acquisition of Cash Pawn in fiscal 2015 as discussed below, an $8.9 million increase in payout of deferred consideration pertaining to prior acquisitions and a $5.0 million decrease in restricted cash as a result of the decrease in outstanding debt held by Grupo Finmart and its VIEs requiring collateralization, partially offset by a $1.2 million increase in proceeds from settlement of forward currency contracts.
Total debt and capital lease obligations outstanding, net of the impact of foreign exchange effects and amortization of deferred costs, decreased by $36.5 million, or 10%, to $335.0 million from September 30, 2015. Grupo Finmart received proceeds of $3.6 million from settlement of remaining foreign currency forwards attributable to the cross-border 8.5% unsecured notes due 2015 which were repaid during the three-months ended December 31, 2015, which nominally increased our exposure to foreign currency rate movements.
68
The net effect of these and other smaller items was a $16.2 million decrease in cash on hand, providing a $75.3 million ending cash balance, $5.9 million of which was held by foreign subsidiaries and is not available to fund domestic operations as we intend to permanently reinvest earnings from foreign operations.
Contractual Obligations
In "Part II, Item 7 — Management's Discussion and Analysis of Financial Condition and Results of Operations " of our Annual Report on Form 10-K for the year ended September 30, 2015, we reported that we had $742.1 million in total contractual obligations as of September 30, 2015. There have been no material changes to this total obligation during the current six-month period ended March 31, 2016, other than ordinary fulfillment of obligations in addition to the remaining accrual of $7.5 million associated with the settlement of outstanding issues with the U.S. Consumer Financial Protection Bureau as described in Note 2 of Notes to Interim Condensed Financial Statements included in "Part I, Item 1 — Financial Statements."
We are responsible for the maintenance, property taxes and insurance at most of our locations. In the fiscal year ended September 30, 2015, these collectively amounted to $25.1 million.
Sources and Uses of Cash
We received $34.2 million in March 2016 as a result of the carryback of fiscal 2015 tax net operating losses.
On February 1, 2016, we acquired six pawn stores in the Houston, Texas area doing business under the "Pawn One" brand. The aggregate purchase price was $6.2 million in cash, inclusive of all ancillary arrangements. There was no additional deferred or contingent consideration.
In February 2015, we completed the acquisition of 12 pawn stores in Central Texas doing business under the "Cash Pawn" brand. The aggregate purchase price for the acquisition was $16.5 million, comprised of $5.0 million cash and 1,168,456 shares of our Class A Non-voting Common Stock (the "Shares"), valued at $10.06 per share (the average closing sales price of the stock on The Nasdaq Stock Market for the five trading days immediately preceding the closing). Under the terms of the transaction, on the first anniversary of the closing date, the Sellers had the right to require us to repurchase the Shares for an aggregate price of $11.8 million (the "Put Option"). On the first anniversary of the closing date, the Sellers exercised their right to require us to repurchase the Shares for an aggregate price of $11.8 million (the "Put Option").
During the six-months ended March 31, 2016, we paid $3.0 million of $10.5 million accrued associated with the settlement of outstanding issues with the U.S. Consumer Financial Protection Bureau as described in Note 2 of Notes to Interim Condensed Financial Statements included in "Part I, Item 1 — Financial Statements."
In June and July 2014, we issued $230.0 million aggregate principal amount of Cash Convertible Notes. All of the Cash Convertible Notes were issued pursuant to an indenture dated June 23, 2014 (the "Indenture") by and between us and Wells Fargo Bank, National Association as the trustee. The Cash Convertible Notes were issued in a private offering and resold pursuant to Rule 144A under the Securities Act of 1933. The Cash Convertible Notes pay interest semi-annually in arrears at a rate of 2.125% per annum on June 15 and December 15 of each year, commencing on December 15, 2014, and will mature on June 15, 2019 (the "Maturity Date"). Upon conversion or maturity, the Cash Convertible Notes will be settled only in cash (including, in the case of conversion, an amount of cash representing the net value attributable to certain increases in the price of our Class A Non-voting Common Stock).
Prior to December 15, 2018, the Cash Convertible Notes will be convertible only upon the occurrence of certain events and during certain periods, and thereafter, at any time prior to the close of business on the second scheduled trading day immediately preceding the Maturity Date, as described in the indenture. The Cash Convertible Notes are convertible into cash based on an initial conversion rate of 62.2471 shares of Class A Non-voting Common Stock per $1,000 principal amount of Cash Convertible Notes (equivalent to an initial conversion price of approximately $16.065 per share of our Class A Non-voting Common Stock). The conversion rate will not be adjusted for any accrued and unpaid interest.
We entered into hedges with counterparties to limit our exposure to the additional cash payments above the $230.0 million aggregate principal amount of the Cash Convertible Notes that may be due to the holders upon conversion. In separate transactions, we sold warrants with a strike price of $20.83 per share.
The Cash Convertible Notes are unsubordinated unsecured obligations and rank senior in right of payment to any of our indebtedness that is expressly subordinated in right of payment to the Cash Convertible Notes; equal in right of payment with all of our other unsecured unsubordinated indebtedness; and effectively junior to all debt or other obligations (including trade payables) of our wholly-owned subsidiaries.
69
As of March 31, 2016, the Cash Convertible Notes were not convertible because the conversion conditions have not been met. Accordingly, the net balance of the Cash Convertible Notes of $192.6 million was classified as a non-current liability on our condensed consolidated balance sheets as of March 31, 2016.
For an additional description of the Cash Convertible Notes, the conversion terms thereof and the hedges and warrants transactions, see Note 7 of Notes to Interim Condensed Consolidated Financial Statements included in "Part I, Item 1 — Financial Statements." See also "Part II, Item 1A — Risk Factors."
During the six-months ended March 31, 2016, Grupo Finmart issued $6.1 million of 13.5% unsecured notes due September 2016 (repayment term extended through 2017 during the three-months ended March 31, 2016), $6.1 million of 18% unsecured notes due September 2016 and $2.3 million of 20% unsecured notes due March 2016 (repaid in full during the three-months ended March 31, 2016). Amounts of debt issued are stated at exchange rates in effect at time of issuance.
During the six-months ended March 31, 2016, Grupo Finmart repaid the following amounts of debt that was outstanding as of September 30, 2015: the remaining $0.9 million 8.2% secured foreign currency debt due 2016; $12.3 million 8.5% unsecured notes due 2015; $1.5 million 10% unsecured notes due 2015; $3.9 million 11% unsecured notes due 2015; $2.9 million 12% secured notes due 2016; and $1.2 million 13% unsecured notes due 2016, including the impact of foreign exchange effects and amortization of deferred costs. In addition, portions of other debt amounts still outstanding as of March 31, 2016 were repaid.
During the six-months ended March 31, 2016, the VIEs repaid a net $22.4 million of debt that was outstanding as of September 30, 2015, including the impact of foreign exchange effects and amortization of deferred costs.
In addition to the initial net payment of $6.9 million during the six-months ended March 31, 2016, including the impact of foreign exchange effects and amortization of deferred costs, the consumer loans facility due 2019 began amortizing at a monthly rate of $1.0 million beginning March 2016, which includes principal and interest at TIIE plus an applicable margin, through maturity of the facility in 2019. With the application of the existing collateral held within the facility and collections, additional funding is not expected to be required to support the amortization profile.
We currently anticipate that cash flow from operations and our cash on hand will be adequate to fund our contractual obligations, planned capital expenditures and working capital requirements during the remainder of the fiscal year. However, the amount of capital Grupo Finmart will require to continue to originate consumer loans and satisfy its obligations will increase over the next several quarters as Grupo Finmart's existing debt obligations begin to amortize. We believe we have sufficient liquidity to support Grupo Finmart into the first quarter of fiscal 2017. Our preference, however, is to invest in our core pawn businesses in the U.S. and Mexico, and consequently, we are currently conducting a process to solicit proposals from parties who may be interested in buying our Grupo Finmart business. If we are unable to dispose of Grupo Finmart by the end of fiscal 2016, we will need to secure additional financing, restructure existing financing or take other measures to generate liquidity in order to support the Grupo Finmart business. See "Part II, Item 1A — Risk Factors — Our financial condition and liquidity could be materially and adversely affected by Grupo Finmart's liquidity needs."
Off-Balance Sheet Arrangements
As a result of exiting USFS, our off-balance sheet arrangements discussed in "Part II, Item 7 — Management's Discussion and Analysis of Financial Condition and Results of Operations" of our Annual Report on Form 10-K for the year ended September 30, 2015 have been substantially eliminated as of December 31, 2015.
70
Critical Accounting Policies
In "Part II, Item 8 — Financial Statements and Supplementary Data" of our Annual Report on Form 10-K for the year ended September 30, 2015, we disclosed certain critical accounting policies, including Grupo Finmart revenue recognition and bad debt and allowance for losses, inventory and cost of goods sold, and goodwill and other intangible assets. The following provides supplementary discussion of those accounting policies during the current six-months.
Grupo Finmart Revenue Recognition for Long-Term Unsecured Consumer Loan Revenue and Bad Debt Allowance for Losses
During the three-months ended December 31, 2015 we became aware of processing and timing delays from certain agencies in remitting cash to Grupo Finmart. We do not believe this will have a significant impact upon ultimate cash collection. We continue to evaluate the collectability of all Grupo Finmart convenios to ensure timely future receipt of cash. Any future cash collections for loans that are currently non-performing will be accounted for under the cost recovery method.
Our allowance recorded on Grupo Finmart performing loans as of March 31, 2016 was 5.0%. We continue to monitor collections and may revise our reserve rate on performing loans in future reporting periods as a result of additional information that becomes known.
Inventory and Cost of Goods Sold
With respect to the Company’s foreign pawn operations, collateral underlying forfeited pawn loans is not owned by the Company; however, the Company assumes the risk of loss on such collateral and is solely responsible for its care and disposition. The amount of inventory from our foreign operations classified as “Inventory, net” was $17.4 million as of March 31, 2016. We have provided this additional discussion in order to clarify the accounting treatment of our foreign inventory.
Goodwill and Other Intangible Assets
During the current quarter, we continued to experience a decline in share price which reduced our overall market capitalization. We calculated enterprise fair value as part an interim goodwill impairment assessment as further described in Note 6 of Notes to Interim Condensed Consolidated Financial Statements included in "Part I, Item 1 — Financial Statements." The fair values of each reporting unit were determined based upon a discounted cash flow approach. There were no material changes in the fair values of our U.S. Pawn and Mexico Pawn reporting units as compared to their carrying values as of February 29, 2016 with respect to our annual impairment test performed in the fourth quarter of our fiscal 2015. There is no goodwill attributable to our Other International reporting unit.
The Step 1 analysis of our Grupo Finmart reporting unit yielded a valuation of $46.5 million. Under Step 2 of FASB ASC 350-20-35, we compared the fair value of the reporting unit to the fair value of the reporting unit's net assets and determined that $73.9 million, all of the goodwill attributable to the Grupo Finmart reporting unit, should be impaired. This impairment was recorded under "Impairment of goodwill" in the condensed consolidated statements of operations under the Grupo Finmart segment during the three-months ended March 31, 2016. No other assets held by Grupo Finmart were determined to be impaired as of March 31, 2016. We will further perform our required annual impairment test in the fourth quarter of our fiscal 2016.
In conjunction with the interim test for goodwill impairment, we performed a market capitalization reconciliation as of February 29, 2016. Given the substantial decline in share price during the current quarter, we considered both the market capitalization calculated using the ending share price as of February 29, 2016 multiplied by the number of shares outstanding as of February 29, 2016, in addition to the market capitalization calculated using the 90-day average share price for the current quarter multiplied by the average number of shares outstanding during the current quarter. In reviewing these reconciliations of enterprise fair value to market capitalization, we noted that the implied control premium remained within what we consider to be a reasonable range. We continue to evaluate future declines in stock price in addition to other factors including those in FASB ASC 350-20-35-3C to determine whether goodwill shall be tested for impairment based on changes in events or circumstances that would more likely than not reduce the fair value of our reporting units below their carrying amounts.
Recently Adopted Accounting Policies and Recently Issued Accounting Pronouncements
See Note 1 of Notes to Interim Condensed Consolidated Financial Statements included in "Part I, Item 1 — Financial Statements."
71
Cautionary Statement Regarding Risks and Uncertainties that May Affect Future Results
This Quarterly Report on Form 10-Q, including Management’s Discussion and Analysis of Financial Condition and Results of Operations, includes "forward-looking statements" within the meaning of Section 27A of the Securities Act of 1933 and Section 21E of the Securities Exchange Act of 1934. We intend that all forward-looking statements be subject to the safe harbors created by these laws. All statements, other than statements of historical facts, regarding our strategy, future operations, financial position, future revenues, projected costs, prospects, plans and objectives are forward-looking statements. These statements are often, but not always, made with words or phrases like "may," "should," "could," "will," "predict," "anticipate," "believe," "estimate," "expect," "intend," "plan," "projection" and similar expressions. Such statements are only predictions of the outcome and timing of future events based on our current expectations and currently available information and, accordingly, are subject to substantial risks, uncertainties and assumptions. Actual results could differ materially from those expressed in the forward-looking statements due to a number of risks and uncertainties, many of which are beyond our control. In addition, we cannot predict all of the risks and uncertainties that could cause our actual results to differ from those expressed in the forward-looking statements. Accordingly, you should not regard any forward-looking statements as a representation that the expected results will be achieved. Important risk factors that could cause results or events to differ from current expectations are identified and described in "Part I, Item 1A — Risk Factors" of our Annual Report on Form 10-K for the year ended September 30, 2015, supplemented by those described in "Part II, Item 1A — Risk Factors" of this Quarterly Report.
We specifically disclaim any responsibility to publicly update any information contained in a forward-looking statement except as required by law. All forward-looking statements attributable to us are expressly qualified in their entirety by this cautionary statement.
ITEM 3. QUANTITATIVE AND QUALITATIVE DISCLOSURES ABOUT MARKET RISK
Market risks relating to our operations result primarily from changes in interest rates, gold values and foreign currency exchange rates, and are described in detail in "Part II, Item 7A — Quantitative and Qualitative Disclosures about Market Risk" of our Annual Report on Form 10-K for the year ended September 30, 2015. There have been no material changes to our exposure to market risks since September 30, 2015.
ITEM 4. CONTROLS AND PROCEDURES
This report includes the certifications of our Chief Executive Officer and Chief Financial Officer required by Rule 13a-14 of the Securities Exchange Act of 1934 (the "Exchange Act"). See Exhibits 31.1 and 31.2. This Item 4 includes information concerning the controls and control evaluations referred to in those certifications.
Evaluation of Disclosure Controls and Procedures
Disclosure controls and procedures (as defined in Rules 13a-15(e) and 15d-15(e) under the Exchange Act) are designed to ensure that information required to be disclosed in the reports we file or submit under the Securities Exchange Act is recorded, processed, summarized and reported within the time periods specified in SEC rules and forms and that such information is accumulated and communicated to our management, including our Chief Executive Officer and Chief Financial Officer, to allow timely decisions regarding required disclosures.
In connection with the preparation of this Quarterly Report, our management, under the supervision and with the participation of our Chief Executive Officer and Chief Financial Officer, evaluated the effectiveness of the design and operation of our disclosure controls and procedures as of March 31, 2016. Based on that evaluation, our Chief Executive Officer and Chief Financial Officer concluded that our disclosure controls and procedures were not effective as of March 31, 2016 due to the existence of the material weaknesses in internal control over financial reporting described below (which we view as an integral part of our disclosure controls and procedures). Based on the performance of additional procedures designed to ensure the reliability of our financial reporting, we believe that the condensed consolidated financial statements included in this Quarterly Report fairly present, in all material respects, our financial position, results of operations and cash flows as of the dates, and for the periods, presented, in conformity with U.S. GAAP.
Management's Report on Internal Control Over Financial Reporting
Management, under the supervision of the Chief Executive Officer and the Chief Financial Officer, is responsible for establishing and maintaining adequate internal control over financial reporting and for the assessment of the effectiveness of our internal control over financial reporting. Internal control over financial reporting (as defined in Rules 13a-15(f) and 15d(f) under the Exchange Act) is a process designed to provide reasonable assurance regarding the reliability of financial reporting and the preparation of financial statements for external reporting purposes in accordance with U.S. GAAP. Internal control over financial reporting includes those policies and procedures that (a) pertain to the maintenance of records that, in reasonable
72
detail, accurately and fairly reflect the transactions and dispositions of assets, (b) provide reasonable assurance that transactions are recorded as necessary to permit preparation of financial statements in accordance with GAAP, (c) provide reasonable assurance that receipts and expenditures are being made only in accordance with appropriate authorization of management and the Board of Directors, and (d) provide reasonable assurance regarding prevention or timely detection of unauthorized acquisition, use or disposition of assets that could have a material effect on the financial statements.
In connection with the preparation of our Annual Report on Form 10-K for the year ended September 30, 2015, our management, under the supervision and with the participation of our Chief Executive Officer and Chief Financial Officer, evaluated the effectiveness of our internal control over financial reporting as of September 30, 2015, and concluded that we did not maintain effective internal control over financial reporting as of September 30, 2015 due to the identification of material weaknesses.
Management identified a number of deficiencies in the design and operating effectiveness of the Company’s internal controls as of September 30, 2015 that represent material weaknesses in our internal control over financial reporting. These deficiencies are the result of management’s failure to design, implement and maintain adequate operational and internal controls and processes to (1) identify complex transactions requiring specialized accounting expertise and other financial reporting requirements, (2) monitor and report the performance of the Grupo Finmart loan portfolio, and (3) identify various accounting errors (including errors in accounting for income taxes, stock-based compensation, restructuring and other less material items).
Remediation Plan
Management is in the process of executing a remediation plan intended to address the material weaknesses described above. These remediation efforts are focused on:
• | Identifying and hiring additional internal resources in both Corporate Accounting and Grupo Finmart; |
• | Improving the organizational structure to provide more direct financial reporting oversight for Grupo Finmart; |
• | Establishing and maintaining appropriate operational and risk assessment processes, as well as transactional controls, at both the Grupo Finmart and EZCORP level in order to (1) ensure engagement and utilization of appropriately qualified U.S. GAAP experts where required and (2) provide appropriate access and visibility to loan performance information; and |
• | Enhancing the overall control environment within both EZCORP and Grupo Finmart. |
During the three months ended March 31, 2016, management engaged additional resources and improved the organizational structure to support the remediation efforts outlined above. Furthermore, we have enhanced our internal policies and processes to address our material weakness related to our management review controls.
Management reports regularly to the Audit Committee regarding the status of the remediation activities. We expect that remediation, including testing of related controls, will be completed by the end of fiscal 2016.
Changes in Internal Control over Financial Reporting
There were no changes in our internal control over financial reporting during the quarter ended March 31, 2016 that have materially affected or are reasonably likely to materially affect our internal control over financial reporting, other than the remediation actions discussed above.
Inherent Limitations on Internal Controls
Notwithstanding the foregoing, management does not expect that our disclosure controls and procedures or our internal control over financial reporting will prevent or detect all errors and all fraud. A control system, no matter how well designed and operated, can provide only reasonable, not absolute, assurance that the objectives of the control system will be met. Limitations inherent in any control system include the following:
• | Judgments in decision-making can be faulty, and control and process breakdowns can occur because of simple errors or mistakes. |
• | Controls can be circumvented by individuals, acting alone or in collusion with others, or by management override. |
• | The design of any system of controls is based in part on certain assumptions about the likelihood of future events, and there can be no assurance that any design will succeed in achieving its stated goals under all potential future conditions. |
73
• | Over time, controls may become inadequate because of changes in conditions or deterioration in the degree of compliance with associated policies or procedures. |
• | The design of a control system must reflect the fact that resources are constrained, and the benefits of controls must be considered relative to their costs. |
Because of the inherent limitations in all control systems, no evaluation of controls can provide absolute assurance that all control issues and instances of fraud, if any, have been detected.
PART II — OTHER INFORMATION
ITEM 1. LEGAL PROCEEDINGS
See Note 11 of Notes to Interim Condensed Consolidated Financial Statements included in "Part I, Item 1 — Financial Statements."
ITEM 1A. RISK FACTORS
Important risk factors that could affect our operations and financial performance, or that could cause results or events to differ from current expectations, are described in "Part I, Item 1A — Risk Factors" of our Annual Report on Form 10-K for the year ended September 30, 2015, as supplemented by the information set forth below. These factors are further supplemented by those discussed in “Part I, Item 3 — Quantitative and Qualitative Disclosures about Market Risk” and "Part II, Item 1 — Legal Proceedings" of this Quarterly Report.
Our financial condition and liquidity could be materially and adversely affected by Grupo Finmart's liquidity needs — As discussed in "Part I, Item 2 — Management's Discussion and Analysis of Financial Condition and Results of Operations — Liquidity and Capital Resources," we expect that, if we maintain our ownership of Grupo Finmart in its current form, that business will require continued financial support from EZCORP, the amount of which will increase over the next several quarters as Grupo Finmart's existing debt obligations begin to amortize. We are currently soliciting proposals for the sale or other disposition of Grupo Finmart. If we are unable to dispose of Grupo Finmart by the end of fiscal 2016, we will need to secure additional financing, restructure existing financing or take other measures to generate liquidity in order for Grupo Finmart to be able to satisfy its outstanding obligations. There can be no assurance that we will be able to obtain additional financing on terms and at rates that will be acceptable to us.
Under the Indenture governing our Cash Convertible Notes, events of default with respect to the Cash Convertible Notes include a default by us or any of our subsidiaries (including Grupo Finmart as long as it is a subsidiary) on more than $25 million of indebtedness for money borrowed if that default (a) results in such indebtedness becoming or being declared due and payable or (b) constitutes a failure to pay principal when due and payable and, in either such case, the acceleration is not rescinded, the failure to pay is not cured or the indebtedness is not repaid or discharged within 30 days. Consequently, any default by Grupo Finmart on its outstanding obligations could result in our Cash Convertible Notes becoming due and payable. We do not currently have sufficient cash resources to repay our Cash Convertible Notes in full, and there can be no assurance that we would be able to generate the needed liquidity. Accordingly, if Grupo Finmart were to default on its outstanding obligations, our consolidated financial position and liquidity could be materially and adversely affected.
As discussed in Notes 15 and 16 of Notes to Interim Condensed Financial Statements included in "Part I, Item 1 — Financial Statements," Grupo Finmart has entered into certain foreign currency forward contracts in connection with the formation of the VIEs and the related transfers of certain loans. EZCORP has guaranteed the future cash outflows of the forward contracts, and those future cash outflows currently total $36.4 million. These cash outflow obligations are support by the income and principal payments generated on the consumer loans in the VIEs.
ITEM 5. OTHER INFORMATION
As previously disclosed, in March 2016, the Compensation Committee approved the long-term incentive awards for fiscal 2016. The approved awards were granted to about 30 employees (including the executive officers) and consist of restricted stock units ("Units") covering approximately 1.5 million shares of our Class A Common Stock. The number of Units awarded to each participant was determined based on the participant's "Participation Value" (generally a multiple of base salary ranging from 60% to 200%) divided by $6.17 (the trading price of the Class A Common Stock as of October 1, 2015, the beginning of fiscal 2016.
The Units are subject to performance-based vesting after a three-year performance period (covering fiscal 2016, 2017 and 2018). The performance objectives are based principally on a target compounded annual EBITDA growth rate of 10% from an
74
adjusted base, as well as long-term debt reduction metrics. In measuring EBITDA growth, the Compensation Committee is permitted to make certain adjustments to exclude extraordinary and nonrecurring events and other items.
Each vested Unit will represent the right to receive one share of Class A Common Stock at the time of vesting (which will be at the end of the three-year performance period).
ITEM 6. EXHIBITS
The following exhibits are filed with, or incorporated by reference into, this report.
Exhibit No. | Description of Exhibit | |
10.1* | Separation Agreement dated April 4, 2016, between EZCORP, Inc. and Jodie Maccarrone, former Chief Strategy Officer and Executive Vice Chair, Grupo Finmart (incorporated by reference to Exhibit 99.1 to the Company’s Current Report on Form 8-K dated April 4, 2016, Commission File No. 0-19424) | |
31.1† | Certification of Stuart I. Grimshaw, Chief Executive Officer, pursuant to Rule 13a-14(a) under the Securities Exchange Act of 1934, as adopted pursuant to Section 302 of the Sarbanes-Oxley Act of 2002 | |
31.2† | Certification of Mark S. Ashby, Chief Financial Officer, pursuant to Rule 13a-14(a) under the Securities Exchange Act of 1934, as adopted pursuant to Section 302 of the Sarbanes-Oxley Act of 2002 | |
32.1†† | Certifications of Stuart I. Grimshaw, Chief Executive Officer, and Mark S. Ashby, Chief Financial Officer, pursuant to 18 U.S.C. Section 1350, as adopted pursuant to Section 906 of the Sarbanes-Oxley Act of 2002 | |
101.INS††† | XBRL Instance Document | |
101.SCH††† | XBRL Taxonomy Extension Schema Document | |
101.CAL††† | XBRL Taxonomy Extension Calculation Linkbase Document | |
101.LAB††† | XBRL Taxonomy Label Linkbase Document | |
101.DEF††† | XBRL Taxonomy Extension Definition Linkbase Document | |
101.PRE††† | XBRL Taxonomy Extension Presentation Linkbase Document | |
* | Identifies Exhibit that consists of or includes a management contract or compensatory plan or arrangement. |
† | Filed herewith. |
†† | Furnished herewith. |
††† | Filed herewith as Exhibit 101 to this report are the following formatted in XBRL (Extensible Business Reporting Language): (i) Condensed Consolidated Balance Sheets as of March 31, 2016, March 31, 2015 and September 30, 2015; (ii) Condensed Consolidated Statements of Operations for the three and six-months ended March 31, 2016 and March 31, 2015; (iii) Condensed Consolidated Statements of Comprehensive Loss for the three and six-months ended March 31, 2016 and March 31, 2015 (iv) Condensed Consolidated Statements of Cash Flows for the six-months ended March 31, 2016 and March 31, 2015; and (v) Notes to Interim Condensed Consolidated Financial Statements. |
75
SIGNATURES
Pursuant to the requirements of the Securities Exchange Act of 1934, the registrant has duly caused this report to be signed on its behalf by the undersigned thereunto duly authorized.
EZCORP, INC. | |||
Date: | May 9, 2016 | /s/ David McGuire | |
David McGuire, Deputy Chief Financial Officer and Chief Accounting Officer (principal accounting officer) | |||
76
EXHIBIT INDEX
Exhibit No. | Description of Exhibit | |
10.1* | Separation Agreement dated April 4, 2016, between EZCORP, Inc. and Jodie Maccarrone, former Chief Strategy Officer and Executive Vice Chair, Grupo Finmart (incorporated by reference to Exhibit 99.1 to the Company’s Current Report on Form 8-K dated April 4, 2016, Commission File No. 0-19424) | |
31.1† | Certification of Stuart I. Grimshaw, Chief Executive Officer, pursuant to Rule 13a-14(a) under the Securities Exchange Act of 1934, as adopted pursuant to Section 302 of the Sarbanes-Oxley Act of 2002 | |
31.2† | Certification of Mark S. Ashby, Chief Financial Officer, pursuant to Rule 13a-14(a) under the Securities Exchange Act of 1934, as adopted pursuant to Section 302 of the Sarbanes-Oxley Act of 2002 | |
32.1†† | Certifications of Stuart I. Grimshaw, Chief Executive Officer, and Mark S. Ashby, Chief Financial Officer, pursuant to 18 U.S.C. Section 1350, as adopted pursuant to Section 906 of the Sarbanes-Oxley Act of 2002 | |
101.INS††† | XBRL Instance Document | |
101.SCH††† | XBRL Taxonomy Extension Schema Document | |
101.CAL††† | XBRL Taxonomy Extension Calculation Linkbase Document | |
101.LAB††† | XBRL Taxonomy Label Linkbase Document | |
101.DEF††† | XBRL Taxonomy Extension Definition Linkbase Document | |
101.PRE††† | XBRL Taxonomy Extension Presentation Linkbase Document | |
* | Identifies Exhibit that consists of or includes a management contract or compensatory plan or arrangement. |
† | Filed herewith. |
†† | Furnished herewith. |
††† | Filed herewith as Exhibit 101 to this report are the following formatted in XBRL (Extensible Business Reporting Language): (i) Condensed Consolidated Balance Sheets as of March 31, 2016, March 31, 2015 and September 30, 2015; (ii) Condensed Consolidated Statements of Operations for the three and six-months ended March 31, 2016 and March 31, 2015; (iii) Condensed Consolidated Statements of Comprehensive Loss for the three and six-months ended March 31, 2016 and March 31, 2015 (iv) Condensed Consolidated Statements of Cash Flows for the six-months ended March 31, 2016 and March 31, 2015; and (v) Notes to Interim Condensed Consolidated Financial Statements. |
77