Attached files
| file | filename |
|---|---|
| EX-99.1 - EXHIBIT 99.1 - CrossAmerica Partners LP | exhibit991capl1q2016earnin.htm |
| 8-K - 8-K - CrossAmerica Partners LP | capl20161qform8-kearningsr.htm |

Investor Update May 2016 1Q 2016 Earnings Call Jeremy Bergeron, President Steve Stellato, Chief Accounting Officer

Investor Update May 2016 Safe Harbor Statements Statements contained in this presentation that state the Partnership’s or management’s expectations or predictions of the future are forward-looking statements. The words “believe,” “expect,” “should,” “intends,” “estimates,” “target” and other similar expressions identify forward-looking statements. It is important to note that actual results could differ materially from those projected in such forward-looking statements. For more information concerning factors that could cause actual results to differ from those expressed or forecasted, see CrossAmerica's Forms 10-Q or Form 10-K filed with the Securities and Exchange Commission and available on CrossAmerica's website at www.crossamericapartners.com. If any of these factors materialize, or if our underlying assumptions prove to be incorrect, actual results may vary significantly from what we projected. Any forward-looking statement you see or hear during this presentation reflects our current views as of the date of this presentation with respect to future events. We assume no obligation to publicly update or revise these forward-looking statements for any reason, whether as a result of new information, future events, or otherwise. 2

Investor Update May 2016 Partnership Overview • Leading motor fuel wholesale distributor, convenience store lessor and c-store operator – Distributes annually over 1 billion gallons – Annual gross rental income of approximately $80 million – Operates 90+ c-stores(1) – 17.5% equity interest in CST Brands’ wholesale fuels business, approximately 1.9 billion gallons of annual fuel supply • Over 1,180 fueling locations(1) – 577 Lessee Dealers – 390 Independent Dealers – 97 Company Operated Sites – 66 Commission Agents – 50+ Sub-jobbers, commercial accounts, etc. • Equity market capitalization of $806 million and enterprise value of $1.24 billion(1) (1) As of March 31, 2016 3 Owned/controlled sites States with marketing presence

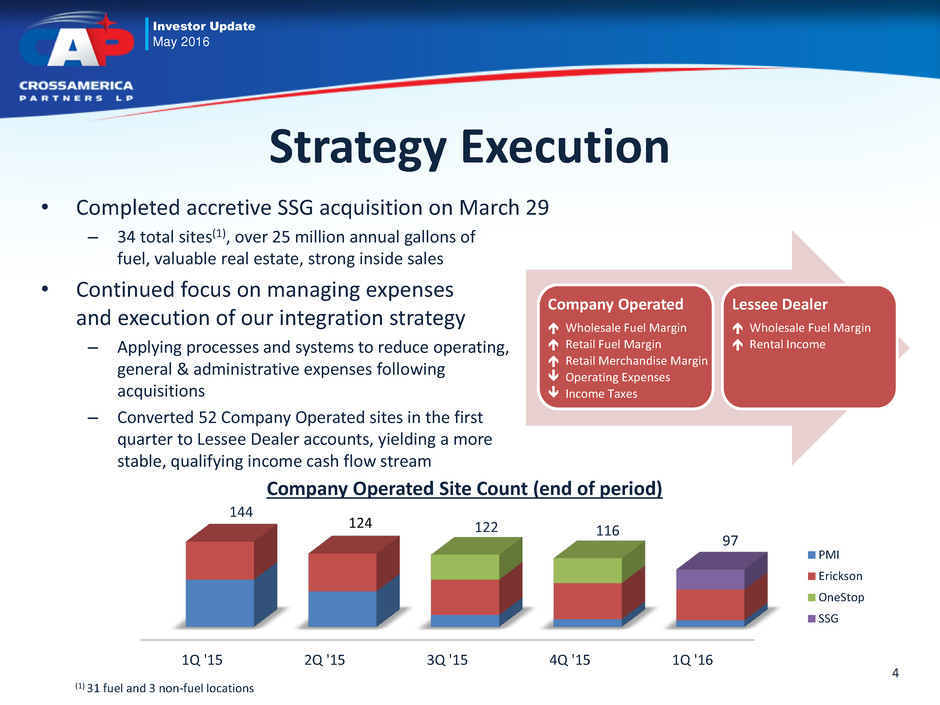
Investor Update May 2016 Strategy Execution • Completed accretive SSG acquisition on March 29 – 34 total sites(1), over 25 million annual gallons of fuel, valuable real estate, strong inside sales • Continued focus on managing expenses and execution of our integration strategy – Applying processes and systems to reduce operating, general & administrative expenses following acquisitions – Converted 52 Company Operated sites in the first quarter to Lessee Dealer accounts, yielding a more stable, qualifying income cash flow stream 4 1Q '15 2Q '15 3Q '15 4Q '15 1Q '16 144 122 116 97 124 Company Operated Site Count (end of period) PMI Erickson OneStop SSG (1) 31 fuel and 3 non-fuel locations Company Operated Wholesale Fuel Margin Retail Fuel Margin Retail Merchandise Margin Operating Expenses Income Taxes Lessee Dealer Wholesale Fuel Margin Rental Income

Investor Update May 2016 - 0.20 0.40 0.60 0.80 1.00 1.20 1.40 1.60 Q1 2014 Q2 2014 Q3 2014 Q4 2014 Q1 2015 Q2 2015 Q3 2015 Q4 2015 Q1 2016 Coverage Ratio (on paid basis) Quarterly Coverage Ratio Targeted 12 Month Coverage Ratio, 1.1x Current Trailing 12 Month Coverage Ratio, 1.08x Strength Despite Crude Price Headwinds $- $20 $40 $60 $80 $100 $120 $- $5,000 $10,000 $15,000 $20,000 $25,000 $30,000 Q1 2014 Q2 2014 Q3 2014 Q4 2014 Q1 2015 Q2 2015 Q3 2015 Q4 2015 Q1 2016 Cash Flow Performance Distributable Cash Flow(1) (in thousands, left axis) Avg. WTI Crude Price (per barrel, right axis) 5 (1) See the earnings press release filed by CrossAmerica Partners LP on May 6, 2016 for (i) a reconciliation of EBITDA, Adjusted EBITDA and Distributable Cash Flow (or “DCF”) to net income and (ii) the definitions of EBITDA, Adjusted EBITDA and DCF. is ri le Fl (1) (in thousands, left axis)

Investor Update May 2016 1Q 2016 Results Summary (in thousands, except for per unit amounts) KEY METRICS Three Months ended Mar. 31, 2016 2015 % Change Gross Profit $37,190 $37,727 (1%) Adjusted EBITDA(1) $22,215 $15,583 43% Distributable Cash Flow(1) $17,289 $10,095 71% Weighted Avg. Diluted Units 33,177 24,583 35% DCF per LP Unit $0.5211 $0.4107 27% Distribution Paid per LP Unit $0.5925 $0.5425 9% Distribution Coverage 0.88x 0.76x 16% 6 (1) See the earnings press release filed by CrossAmerica Partners LP on May 6, 2016 for (i) a reconciliation of EBITDA, Adjusted EBITDA and Distributable Cash Flow (or “DCF”) to net income and (ii) the definitions of EBITDA, Adjusted EBITDA and DCF.

Investor Update May 2016 1Q 2016 Wholesale Segment Results (in thousands, except for number of sites and per gallon amounts) WHOLESALE SEGMENT Three Months ended Mar. 31, 2016 2015 % Change Total Motor Fuel Sites (period avg.) 1,088 1,033 5% Total Volume of Gallons Distributed 236,162 233,812 1% Fuel Margin per Gallon $0.050 $0.056 (11%) Rental & Other Gross Profit $14,129 $10,502 35% Operating Expenses $5,864 $7,130 (18%) Segment Adjusted EBITDA(1) $24,041 $17,602 37% 7 • Significant Wholesale Segment changes between periods – Acquired 107 fuel supply locations, increasing sites and gallons distributed – Divested of PMI non-core fuels transportation, heating oil and commercial fuels business, decreasing gallons and operating expenses – Acquired 29 New-To-Industry real estate locations from CST, increasing rent – Dealerized 125 company operated locations to lessee dealer accounts, increasing rent – Approximately 30% decline in wholesale gasoline prices, decreasing fuel margin (1) See the earnings press release filed by CrossAmerica Partners LP on May 6, 2016 for (i) a reconciliation of EBITDA, Adjusted EBITDA and Distributable Cash Flow (or “DCF”) to net income and (ii) the definitions of EBITDA, Adjusted EBITDA and DCF.

Investor Update May 2016 1Q 2016 Retail Segment Results (in thousands, except for number of sites, per gallon, and per day amounts) 8 • Significant Retail Segment changes between periods – Acquired 78 company operated locations, increasing sites and gallons distributed – Dealerized 125 company operated locations to lessee dealer accounts, decreasing gallons distributed, merchandise sales, and operating expenses – Varying mix of stores in the periods because of acquisitions and dealerization, which impacts all areas RETAIL SEGMENT 3 Months ended Mar. 31 2016 2015 % Change Site Count (period avg.) 173 191 (9%) Operating Expenses $9,547 $10,210 (7%) Segment Adjusted EBITDA(1) $1,761 $4,751 (63%) COMPANY OPERATED STATISTICS 3 Months ended Mar. 31 2016 2015 % Change Site Count (period avg.) 107 118 (9%) Motor fuel sales (gallons per site per day) 2,413 2,664 (9%) Fuel Margin per Gallon, net $0.097 $0.142 (32%) Merchandise Sales (per site per day) $3,141 $2,770 13% Merchandise Gross Profit Percentage, net 25.3% 29.6% (430 bps) (1) See the earnings press release filed by CrossAmerica Partners LP on May 6, 2016 for (i) a reconciliation of EBITDA, Adjusted EBITDA and Distributable Cash Flow (or “DCF”) to net income and (ii) the definitions of EBITDA, Adjusted EBITDA and DCF.

Investor Update May 2016 1Q15 vs 1Q16 Adjusted EBITDA Performance (in thousands) $22,215 $15,583 $7,616 ($1,467) $1,504 ($1,021) Acquisitions(2) Impact of Supplier Terms Discounts Q1 2015 Adjusted EBITDA(1) Q1 2016 Adjusted EBITDA(1) Net, Misc.(3) Net Effect of Integration and Base Business 9 (1) See the earnings press release filed by CrossAmerica Partners LP on May 6, 2016 for (i) a reconciliation of EBITDA, Adjusted EBITDA and Distributable Cash Flow (or “DCF”) to net income and (ii) the definitions of EBITDA, Adjusted EBITDA and DCF. (2) Acquisitions include third party acquisitions and CST asset drops conducted since 1/1/15 (3) Net, Misc. includes increased Incentive Distribution Right distributions, Dealer-Tank-Wagon pricing and other miscellaneous items

Investor Update May 2016 4Q15 vs 1Q16 Adjusted EBITDA Performance (in thousands) $22,215 $24,708 ($1,479) ($454) ($885) $325 Acquisitions(2) Impact of Supplier Terms Discounts Q4 2015 Adjusted EBITDA(1) Q1 2016 Adjusted EBITDA(1) Net, Misc.(3) Base Business 10 Declines are reflective of seasonality (1) See the earnings press release filed by CrossAmerica Partners LP on May 6, 2016 for (i) a reconciliation of EBITDA, Adjusted EBITDA and Distributable Cash Flow (or “DCF”) to net income and (ii) the definitions of EBITDA, Adjusted EBITDA and DCF. (2) Acquisitions include third party acquisitions and CST asset drops conducted since 1/1/15 (3) Net, Misc. includes increased Incentive Distribution Right distributions, Dealer-Tank-Wagon pricing and other miscellaneous items

Investor Update May 2016 Executing with Measured Growth • Declared distribution attributable to first quarter of $0.5975 per unit – 0.5 cent per unit increase over fourth quarter 2015 – Expect to increase per unit distribution by 5%-7% for 2016 over 2015 – Continue to target a long-term distribution coverage ratio of at least 1.1x • 2016 Distributable Cash Flow(1) growth expected to come from selective, accretive acquisitions, strong business performance and expense reduction associated with integration of recently completed transactions – Maintaining a strong Balance Sheet with a leverage ratio well within our credit facility covenants – Real estate assets remain a viable source of capital to fund accretive growth – Assets are well positioned as we head into our seasonably stronger periods of operations 11 $0.4500 $0.4750 $0.5000 $0.5250 $0.5500 $0.5750 $0.6000 $0.6250 Q1 2014 Q2 2014 Q3 2014 Q4 2014 Q1 2015 Q2 2015 Q3 2015 Q4 2015 Q1 2016 Distributions per Unit (on declared basis) (1) See the earnings press release filed by CrossAmerica Partners LP on May 6, 2016 for (i) a reconciliation of EBITDA, Adjusted EBITDA and Distributable Cash Flow (or “DCF”) to net income and (ii) the definitions of EBITDA, Adjusted EBITDA and DCF.
