Attached files
| file | filename |
|---|---|
| EX-99.1 - PRESS RELEASE AND EARNINGS RELEASE ATTACHMENTS - ATLANTIC CITY ELECTRIC CO | d51816dex991.htm |
| 8-K - FORM 8-K - ATLANTIC CITY ELECTRIC CO | d51816d8k.htm |
 Earnings Conference Call 1 st Quarter 2016 May 6, 2016 Exhibit 99.2 |
 2 Q1 2016 Earnings Release Slides Cautionary Statements Regarding Forward-Looking Information
This presentation contains certain forward-looking statements
within the meaning of the Private Securities
Litigation Reform Act of 1995, that are subject to risks and uncertainties. The factors that could cause actual results to differ materially from the
forward-looking statements made by Exelon Corporation,
Exelon Generation Company, LLC, Commonwealth
Edison Company, PECO Energy Company, Baltimore Gas and Electric Company, Pepco Holdings LLC (PHI), Potomac Electric Power Company,
Delmarva Power & Light Company, and Atlantic City Electric
Company (Registrants) include those factors
discussed herein, as well as the items discussed in (1) Exelon’s 2015 Annual Report on Form 10-K in (a) ITEM 1A. Risk Factors, (b) ITEM 7.
Management’s Discussion and Analysis of Financial Condition
and Results of Operations and (c) ITEM 8.
Financial Statements and Supplementary Data: Note 23; (2) PHI’s 2015 Annual Report on Form 10-K in (a) ITEM 1A. Risk Factors, (b) ITEM 7.
Management’s Discussion and Analysis of Financial Condition
and Results of Operations and (c) ITEM 8.
Financial Statements and Supplementary Data: Note 16; and (3) other factors discussed in filings with the SEC by the Registrants. Readers are
cautioned not to place undue reliance on these
forward-looking statements, which apply only
as of the date of this presentation. None of the Registrants undertakes any obligation to publicly release any revision to its forward-looking statements to reflect
events or circumstances after the date of this
presentation. |
 3 Q1 2016 Earnings Release Slides Combined Company at a Glance |
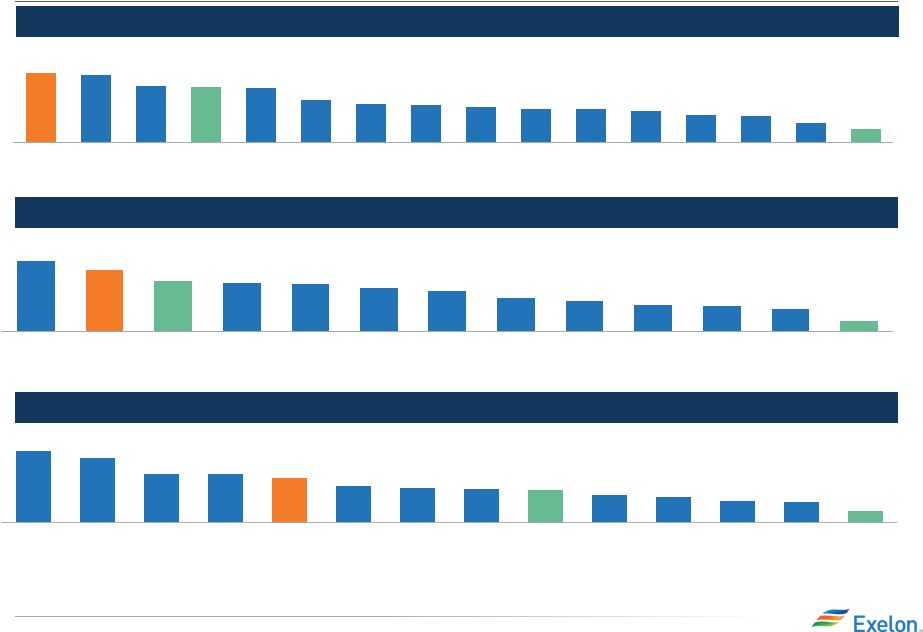 4 Q1 2016 Earnings Release Slides Exelon Utilities are an Industry Leader 8.1 14.0 14.9 17.5 18.6 21.6 22.3 23.3 24.3 29.7 32.6 44.0 48.5 32.7 Legacy PHI PPL FE ETR D Legacy EXC XEL EIX ED Combined EXC PGE AEP SO DUK Total Utility Rate Base ($B) (1) Total Capital Expenditures 2016-2018 ($B) (1) 4.1 8.3 9.6 9.9 11.5 12.3 15.0 16.1 17.7 17.9 18.9 23.0 26.3 Combined EXC (2) DUK Legacy PHI XEL ETR PPL PEG EIX AEP D PGE SO Legacy EXC US Utility Customers (millions) 2.0 2.8 3.8 4.0 4.5 4.8 4.8 5.0 5.3 5.5 6.0 7.9 8.0 8.2 9.7 10.0 Legacy PHI ETR D PEG SO NEE ED EIX PGE Combined EXC AEP XEL FE DUK Legacy EXC SRE Source: Company Filings (1) Includes utility and generation (2) $23B includes $15.6B of utility capital expenditures and $7.4B of generation capital expenditures
|
 5 Q1 2016 Earnings Release Slides Exelon Generation is an Industry Leader Retail Load Served (TWhs) (2) Carbon Intensity (lb/MWh) (1) 54.4 60.8 68.8 88.6 93.9 96.5 99.4 103.0 129.4 153.1 175.7 180.1 195.1 243.4 PEG DYN XEL PPL/TLN D FE NRG CPN ETR AEP NEE SO EXC (3) DUK Total Generation Output (TWh) (1) 16 18 19 19 20 24 33 38 41 41 53 64 67 124 139 Talen ConEd Solutions Gexa Energy MidAmerican Energy EDF Energy Services Dynegy Just Energy Champion Energy Services Noble Solutions TXU Energy GDF Suez First Energy Solutions NRG Energy Direct Energy Constellation (1) Includes regulated and non-regulated generation. Source: Benchmarking Air Emissions, July 2015; http://mjbradley.com/sites/default/files/Benchmarking-Air-Emissions-2015.pdf
(2) Source: DNV GL Retail Landscape April
2016 (3) Excludes EDF’s equity ownership share
of the CENG Joint Venture 1,878
1,752
1,686
1,552
1,507
1,390
1,194
1,126
815
779
594
564
555
200
PPL/TLN
FE
SO
DYN
AEP
NRG
XEL
DUK
CPN
D
ETR
PEG
NEE
EXC
(3) |
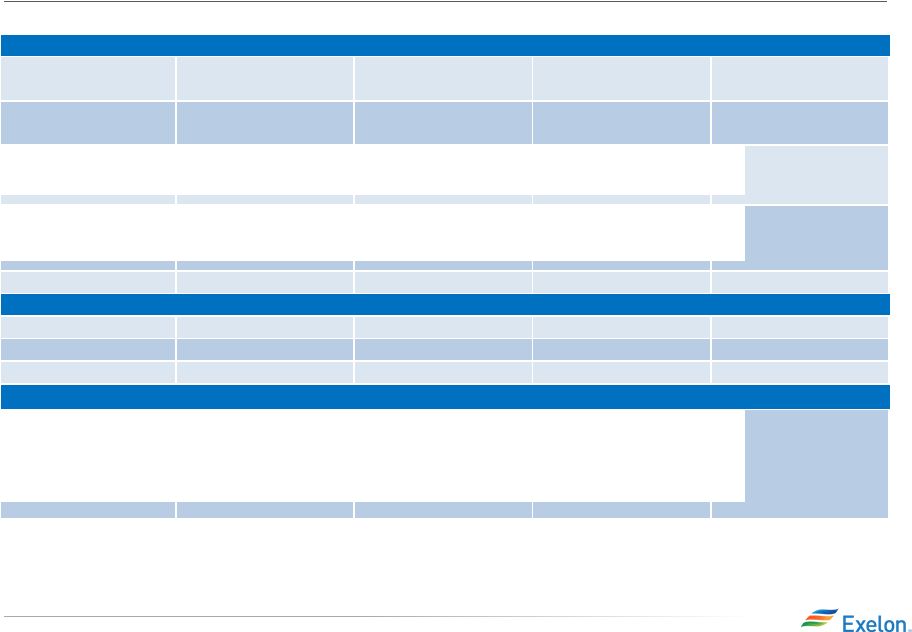
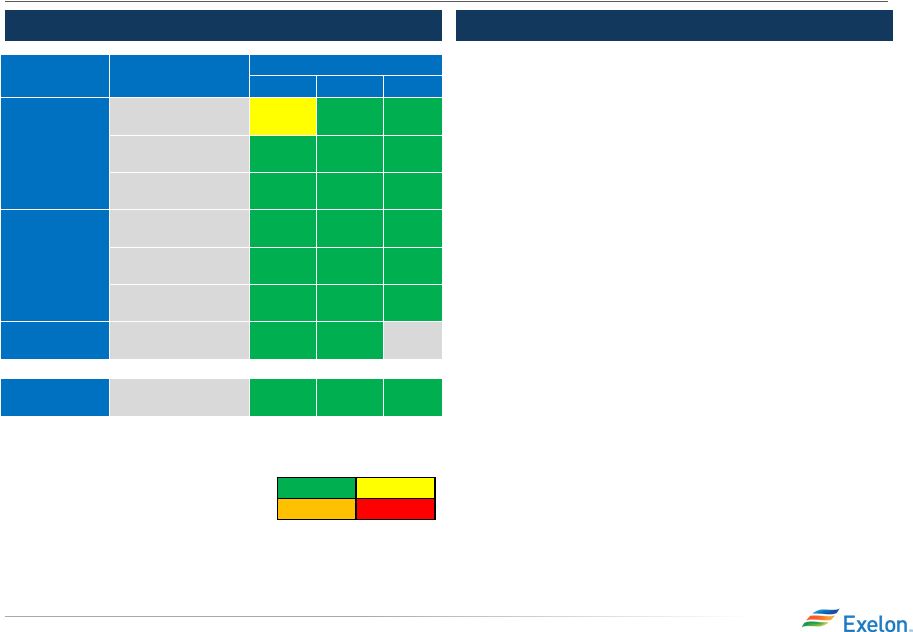 6 Q1 2016 Earnings Release Slides Operations Metric 2015 YE BGE PECO ComEd Electric Operations OSHA Recordable Rate 2.5 Beta SAIFI (Outage Frequency) 2.5 Beta CAIDI (Outage Duration) Customer Operations Customer Satisfaction Service Level % of Calls Answered in <30 sec Abandon Rate Gas Operations Percent of Calls Responded to in <1 Hour No Gas Operations
Overall Rank
Electric Utility Panel of 24
Utilities
3
rd
2
nd
3
rd
Best in Class Operations
Q1 Q2 Q3 Q4 Exelon Utilities has identified and transferred best practices at
each of its utilities to improve operating performance in areas
such as:
• System Performance • Emergency Preparedness • Corrective and Preventive Maintenance Legacy Exelon Utilities Operational Metrics ExGen Operational Metrics • Continued best in class performance across our Nuclear fleet: o Q1 Nuclear Capacity Factor: 95.8% o Q1 average refueling outage duration of 24 days versus industry average refueling outage duration of 36 days • Strong performance across our Fossil and Renewable fleet: o Q1 Renewables energy capture: 96.2% o Q1 Power dispatch match: 93.5% o No employee OSHA or DART recordable events in Q1 |
 Early Retirement of Clinton and Quad Cities We will shut down Clinton Power Station on June 1, 2017 and Quad Cities
Generating Station on June 1, 2018 if Illinois does not pass
adequate legislation by May 31, 2016 and if Quad
Cities does not clear the 19/20 PJM capacity
auction in May Impact on Illinois of Plant
Closures (1)
•
The gross impact of shutting down
Clinton and Quad Cities would be:
•
$1.2 billion annually in lost economic
activity in Illinois
•
4,200 jobs lost, many of which are
highly skilled, good paying jobs
•
According to independent analyses by
PJM and MISO, there would be a
significant increase in electricity prices
for Illinois residents and businesses
•
Economic damages associated with an
incremental increase in the release of
carbon dioxide emissions would cost
Illinois consumers nearly $10 billion over
10 years
Nuclear Plant Economics Deteriorating
•
Illinois legislation aimed at leveling the
playing field for zero carbon resources
has failed to advance in the past two
legislative sessions
•
PJM power prices hit 15 year record low
in March
•
Illinois forward energy prices have
declined by roughly 10% in the last year
•
From 2009 to 2015, Quad Cities and
Clinton have sustained more than $800
million in cash flow losses on a pre-tax
basis
(2)
(1)
Source: January 5, 2015 Response to the IL General
Assembly Concerning House Resolution 1146 prepared by Illinois Commerce Commission, Illinois Power Agency, Illinois Environmental Protection Agency, and Illinois Department of Commerce and Economic Opportunity
(2)
Revenues include realized energy and capacity revenue excluding
any hedges; costs include all site expenses (including taxes other than income taxes), DOE spent fuel fees prior to their suspension in mid-2014, charged and allocated overhead, fuel capex, and non-fuel capex. Losses only reflect the
extent to which revenues fell short of cash costs and do not reflect the absence of expected investor return on investment 7 Q1 2016 Earnings Release Slides |
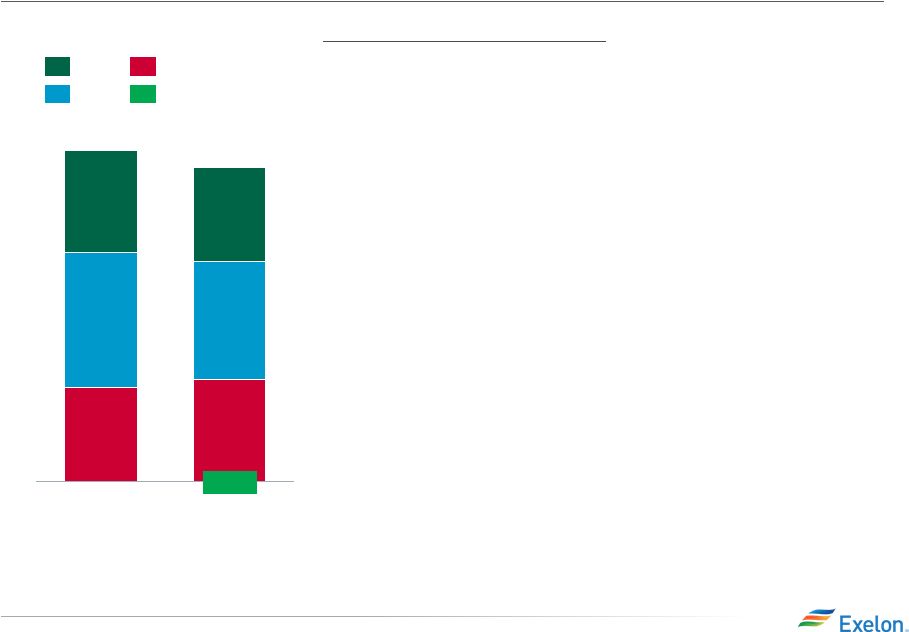
 Q1 2016 Financial Results ExGen Q1 2016 $0.68 $(0.02) $0.12 $0.14 HoldCo ComEd PECO PHI BGE $0.00 $0.11 $0.34 Adjusted Operating EPS Results (1,2) • Delivered adjusted (non-GAAP) operating earnings in Q1 of $0.68/share near the top of our guidance range of $0.60- $0.70/share • Utilities Lower bad debt expense Unfavorable weather Higher storm costs • ExGen Lower cost to serve load Strong performance at Constellation Lower O&M primarily timing within the year Expect Q2 2016 Adjusted Operating Earnings of $0.50 - $0.60 per share $0.34 8 Q1 2016 Earnings Release Slides (1) Refer to the Earnings Release Attachments for additional details and to the Appendix for a reconciliation of adjusted
(non-GAAP) operating EPS to GAAP EPS (2) Amounts may not add due to
rounding |
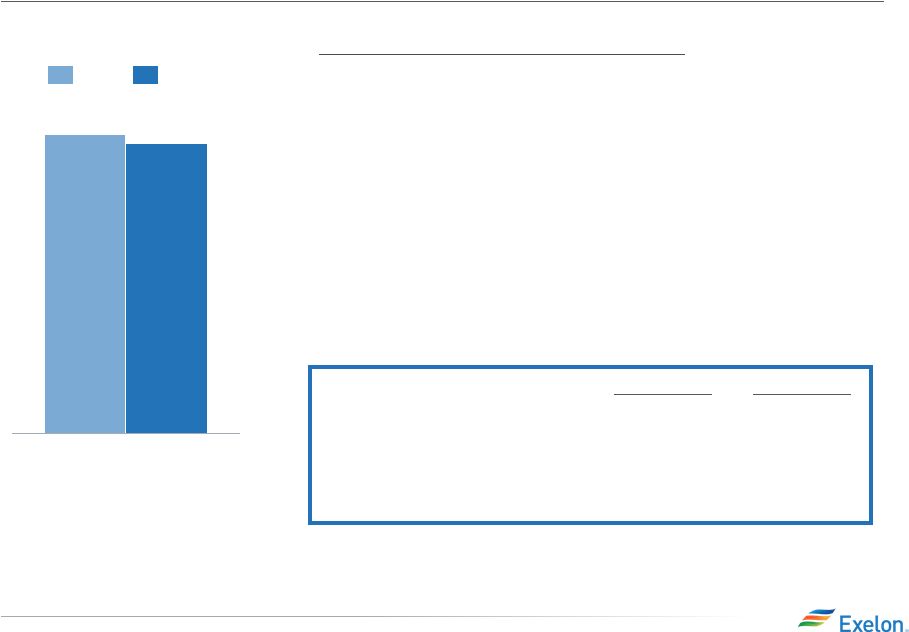
 HoldCo ExGen ComEd PECO BGE $2.40 - $2.70 (1) $(0.05) $1.25 - $1.35 $0.50 - $0.60 $0.40 - $0.50 $0.25 - $0.35 2016 Adjusted Operating Earnings Guidance Confirming full-year guidance range of $2.40 - $2.70/share (2,3) Key Changes • Average outstanding share count of 926M vs. 890M from Q4 standalone guidance • Interest on debt issued for PHI transaction captured at HoldCo • Includes PHI contribution to earnings for remainder of year $(0.10) – $(0.20) $2.40 - $2.70 (2,3) PHI BGE HoldCo ComEd ExGen PECO $1.20 - $1.30 $0.50 - $0.60 $0.40 - $0.50 $0.10 - $0.20 $0.25 - $0.35 2016 Standalone Guidance 2016 Combined Guidance 9 Q1 2016 Earnings Release Slides (1) 2016 standalone earnings guidance was based on expected average outstanding shares of 890M and assumed that equity and
debt issued for Pepco Holdings acquisition was unwound in 2016. Earnings guidance for OpCos may not add up to consolidated EPS guidance. Refer to the Appendix for a
reconciliation of adjusted (non-GAAP) operating EPS guidance to GAAP EPS. (2) 2016 combined earnings guidance is based on expected average outstanding shares of 926M. Earnings guidance for OpCos
may not add up to consolidated EPS guidance. (3) ComEd ROE based on 30 Year average Treasury yield of 2.67% as of 3/31/16. 25 basis point move in 30 Year Treasury
Rate equates to +/-$0.01 impact to EPS. |
 Reaffirming Legacy Exelon Utilities Net Income Outlook (1) Numbers rounded to nearest $25M (2) Does not include PHI net income and represents adjusted (non-GAAP) operating earnings. Refer to slide 41 for a
list of adjustments from GAAP EPS to adjusted (non-GAAP) operating earnings. Exelon Utilities Net Income ($M) (1,2) $1,400 $1,300 $1,200 $1,100 $0 2018 $1,400 2017 $1,325 2016 $1,250 $1,250 $1,175 $1,100 Legacy Exelon Utilities projected average earnings growth is still in the 7-9% range per year
from 2015-2018
10
Q1
2016
Earnings Release
Slides |
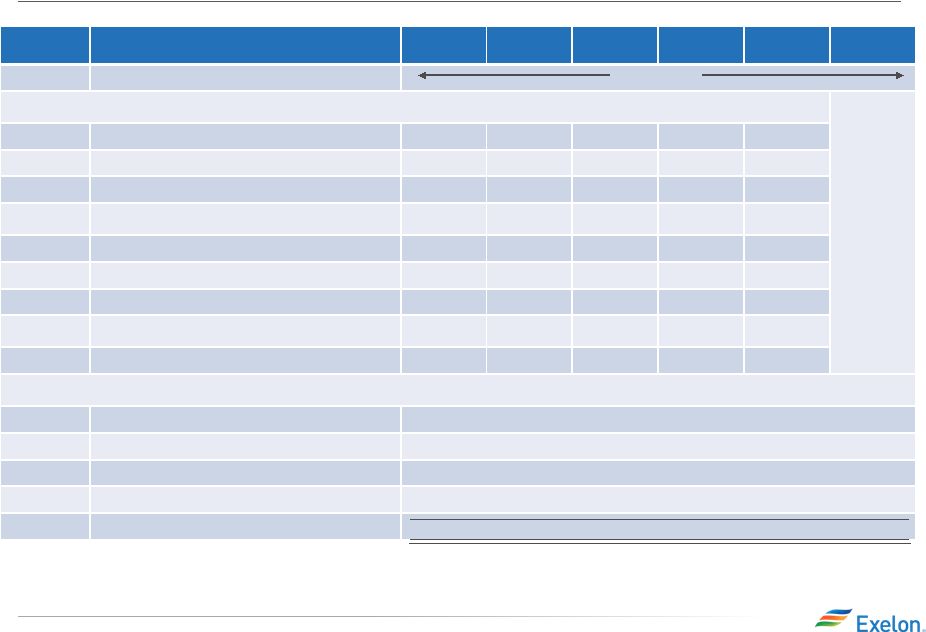
 Q4 2015 Q1 2016 Q2 2016 Q3 2016 BGE Electric and Gas Distribution Rates ACE Electric Distribution Rates ComEd Electric Distribution Formula Rate Q4 2016 Pepco Electric Distribution Rates - DC Delmarva Electric and Gas Distribution Rates - DE Delmarva Electric Distribution Rates - MD Pepco Electric Distribution Rates - MD MD Rate Case Filed November 6 Final Order Expected June NJ Rate Case Filed March 22 Q1 2017 IL Formula Rate Case Filed April 13 Final Order Expected December MD Rate Case Filed April 19 Final Order Expected December DC Rate Case Filing Planned Q2/Q3 DE Rate Case Filing Planned Final Order Expected MD Rate Case Filing Planned Final Order Expected Exelon Utilities Distribution Rate Case Schedule 11 Q1 2016 Earnings Release Slides Final Order Expected Q1/Q2 |
 12 Q1 2016 Earnings Release Slides Exelon Generation: Gross Margin Update • Executed $200M of Power New Business and $100M of Non-Power New Business in Q1
• Behind ratable hedging position reflects the fundamental upside we see in power prices
• Generation ~28-31% open in 2017 • Power position ~5-8% behind ratable, considering cross-commodity hedges
Recent Developments
Gross Margin Category ($M)
(1)
2016
2017
2018
2016
2017
2018
Open Gross Margin
(3)
(including South, West, Canada hedged gross
margin)
$4,450
$5,350
$5,800
$(750)
$(450)
$(350)
Mark-to-Market of Hedges
(3,4)
$2,650
$1,150
$400
$950
$350
$150
Power New Business / To Go
$250
$750
$1,000
$(200)
$(50)
-
Non-Power Margins Executed
$350
$150
$100
$100
-
-
Non-Power New Business / To Go
$100
$300
$400
$(100)
-
-
Total Gross Margin
(2)
$7,800
$7,700
$7,700
-
$(150)
$(200)
March 31, 2016
Change from Dec. 31, 2015
Gross margin categories rounded to nearest $50M
Total Gross Margin (Non-GAAP) is defined as operating revenues less purchased power and
fuel expense, excluding revenue related to decommissioning,
gross receipts tax, Exelon Nuclear Partners,
operating services agreement with Fort Calhoun and variable interest entities. Total Gross Margin is also net of direct cost of sales for certain Constellation
businesses. Excludes Pepco Energy Services. See
Slide 26 for a Non-GAAP to GAAP reconciliation of Total Gross Margin. Excludes EDF’s equity ownership share of the CENG Joint Venture Mark-to-Market of Hedges assumes mid-point of hedge percentages (1) (2) (3) (4) |
 13 Q1 2016 Earnings Release Slides Incremental Combined Company Tax Impacts (1) Financial Developments Since Q4 2015 • ExGen earnings are lower as increased cash tax benefits reduce the Domestic Production Activities Deduction (DPAD) in 2018 but should normalize in 2019 • PHI increases cash flow by $700M-$850M for 2017-19 due to bonus depreciation and legacy NOLs • Consolidated tax rate increases by as much as 200 bps through 2018 due to lower DPAD, but is expected to normalize to ~32% in 2019 (1) Tax impacts are incremental to the standalone bonus depreciation impacts disclosed on the Q4 2015 earnings call for
earnings in 2016: ($0.09), 2017: ($0.11), and 2018: ($0.06); and for cash in 2016: $625M, 2017: $675M, and 2018: $600M (2) ComEd ROE based on 30 Year average Treasury yield of 2.67% as of 3/31/16
ComEd ROE Sensitivity to Interest Rates
(2)
• ComEd allowed ROEs are calculated at the 30- Year Treasury + 580 bps with every 25 bps move in the 30-Year impacting EPS by +/- $0.01 2017 2018 2019 EPS $(0.00) - $(0.02) $(0.06) - $(0.08) $(0.00) - $(0.01) Cash Flow $50M-$100M $200M-$300M $400M-$500M Consolidated Tax Rate 33% 34% 32% Cash Tax Rate 5% 5% 10% 2017 2018 2019 ComEd EPS - 30 Year Treasury Rate +25 basis points $0.01 $0.01 $0.01 -25 basis points $(0.01) $(0.01) $(0.01) |
 14 Q1 2016 Earnings Release Slides Delivering Value to Shareholders Through a Defined Capital
Allocation Policy
• Our strong balance sheet underpins our capital allocation
policy •
Capital decisions are made to maximize value to our customers and shareholders • We are harvesting free cash flow from Exelon Generation
to: –
First,
invest in utilities where we can earn an appropriate return, – Invest in contracted assets where we can meet return thresholds, and/or – Return capital to shareholders by retiring debt, repurchasing our
shares, or increasing our dividend
• We are committed to maintaining an attractive dividend (1) , increasing the dividend by 2.5% annually through 2018 (1) Quarterly dividends are subject to declaration by the board of directors |
 15 Q1 2016 Earnings Release Slides Quarter over Quarter Disclosures |
 16 Q1 2016 Earnings Release Slides Exelon Utilities Adjusted Operating EPS Contribution (1) Key Drivers – 1Q16 (2) vs. 1Q15 : BGE (-0.01): • Increased storm costs: ($0.01) PECO (-0.02): • Unfavorable weather (RNF): $(0.04) • Increased electric distribution rates: $0.02 ComEd (+0.01): • Unfavorable weather (3) : $(0.01) • Increased distribution and transmission earnings due to
increased capital investment
(3)
: $0.02
PHI
(+0.00):
• PHI actual results from the period of March 24, 2016 to March
31, 2016 were not a significant driver: $(0.00)
1Q 2016
$0.00
$0.37 $0.12 $0.11 $0.14 $0.11 1Q 2015 $0.39
$0.16
$0.12
PHI
ComEd
BGE
PECO
Numbers may not add due to rounding. (1)
Refer to the Earnings Release Attachments for additional details
and to the Appendix for a reconciliation of adjusted (non-GAAP) operating EPS to GAAP EPS.
(2) There is a $(0.02) share differential impact spread across the utilities in Q1 2016. (3)
Due to the distribution formula rate, changes in ComEd’s
earnings are driven primarily by changes in 30-year U.S. Treasury rates (inclusive of ROE), rate base and capital structure in addition to weather, load and changes in customer mix. |
 17 Q1 2016 Earnings Release Slides ExGen Adjusted Operating EPS Contribution (1) $0.34 Q1 $0.35 2016 2015 Numbers may not add due to rounding (1) Refer to the Earnings Release Attachments for additional details and to the Appendix for a reconciliation of adjusted
(non-GAAP) operating EPS to GAAP EPS (excludes
Salem) Q1
2015 Actual
Q1
2016
Actual
Planned Refueling Outage
Days
89
70
Non-refueling Outage Days
32
10
Nuclear Capacity Factor
92.7%
95.8%
Key Drivers –
Q1 2016 vs. Q1 2015
ExGen
(-0.01)
• Unfavorable RNF primarily due to lower realized energy prices in
the Midwest, New York, and New England regions, partially
offset by nuclear refueling outage timing, fewer
non-refueling outage days, and increased
capacity pricing: $(0.02) •
Higher depreciation costs primarily due to increased nuclear
decommissioning amortization and ongoing capital
expenditures: $(0.02)
• Other: $0.03 |
 18 Q1 2016 Earnings Release Slides Exelon Generation Disclosures March 31, 2016 |
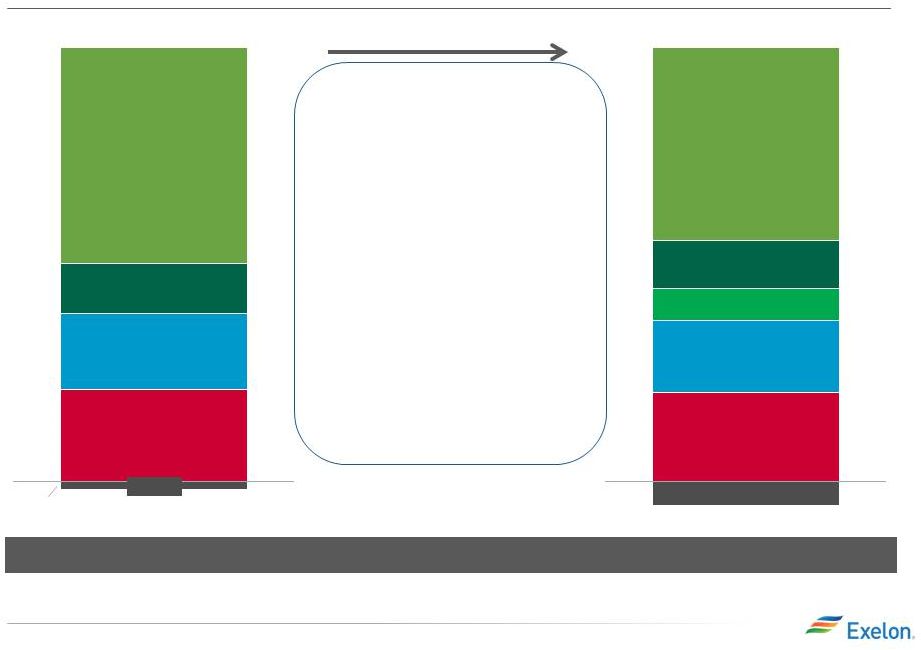
 Portfolio Management Strategy Protect Balance Sheet Ensure Earnings Stability Create Value Strategic Policy Alignment •Aligns hedging program with financial policies and financial outlook •Establish minimum hedge targets to meet financial objectives of the company (dividend, credit rating) •Hedge enough commodity risk to meet future cash requirements under a stress scenario Three-Year Ratable Hedging •Ensure stability in near-term cash flows and earnings •Disciplined approach to hedging •Tenor aligns with customer preferences and market liquidity •Multiple channels to market that allow us to maximize margins •Large open position in outer years to benefit from price upside Bull / Bear Program •Ability to exercise fundamental market views to create value within the ratable framework •Modified timing of hedges versus purely ratable •Cross-commodity hedging (heat rate positions, options, etc.) •Delivery locations, regional and zonal spread relationships Exercising Market Views Purely ratable Actual hedge % Market views on timing, product allocation, and regional spreads reflected in actual hedge % High End of Profit Low End of Profit % Hedged Open Generation with LT Contracts Portfolio Management & Optimization Portfolio Management Over Time Align Hedging & Financials Establishing Minimum Hedge Targets Credit Rating Credit Rating Capital & Operating Expenditure Capital & Operating Expenditure Dividend Dividend Capital Structure Capital Structure 19 Q1 2016 Earnings Release Slides |
 20 Q1 2016 Earnings Release Slides Components of Gross Margin Categories Open Gross Margin •Generation Gross Margin at current market prices, including capacity and ancillary revenues, nuclear fuel amortization and fossils fuels expense •Exploration and Production (4) •Power Purchase Agreement (PPA) Costs and Revenues •Provided at a consolidated level for all regions (includes hedged gross margin for South, West and Canada (1) ) MtM of Hedges (2) •Mark-to-Market (MtM) of power, capacity and ancillary hedges, including cross commodity, retail and wholesale load transactions •Provided directly at a consolidated level for five major regions. Provided indirectly for each of the five major regions via Effective Realized Energy Price (EREP), reference price, hedge %, expected generation “Power” New Business •Retail, Wholesale planned electric sales •Portfolio Management new business •Mid marketing new business “Non-Power” Executed •Retail, Wholesale executed gas sales •Energy Efficiency (4) •BGE Home (4) •Distributed Solar “Non-Power” New Business •Retail, Wholesale planned gas sales •Energy Efficiency (4) •BGE Home (4) •Distributed Solar •Portfolio Management / origination fuels new business •Proprietary trading (3) Margins move from new business to MtM of hedges over the course of the year as sales are executed (5) Margins move from “Non power new business” to
“Non power executed” over the course of the
year Gross margin linked to power production and
sales Gross margin from
other business activities
(1) Hedged gross margins for South, West & Canada regions
will be included with Open Gross Margin, and no expected generation, hedge %, EREP or reference prices provided for this region (2) MtM of hedges provided directly for the five larger regions; MtM of hedges is not provided directly at the regional level but can be easily estimated using EREP, reference price and hedged MWh (3) Proprietary trading gross margins will generally remain within “Non Power” New Business category and only move to “Non Power” Executed category upon management discretion (4) Gross margin for these businesses are net of direct “cost of sales”
(5) Margins for South, West & Canada regions and
optimization of fuel and PPA activities captured in Open Gross Margin |
 21 Q1 2016 Earnings Release Slides ExGen Disclosures (1) Gross margin categories rounded to nearest $50M
(2)
Total Gross Margin (Non-GAAP) is defined as operating
revenues less purchased power and fuel expense,
excluding revenue related to decommissioning, gross receipts tax, Exelon Nuclear Partners, operating services agreement with Fort Calhoun and variable
interest entities. Total Gross Margin is also net of direct cost
of sales for certain Constellation businesses.
Excludes Pepco Energy Services. See Slide 26 for a Non-GAAP to GAAP reconciliation of Total Gross Margin. (3) Excludes EDF’s equity ownership share of the CENG Joint Venture
(4)
Mark-to-Market of Hedges assumes mid-point of hedge
percentages (5)
Based on March 31, 2016 market conditions
Gross Margin Category ($M)
(1)
2016
2017
2018
Open Gross Margin
(including South, West & Canada hedged GM)
(3)
$4,450
$5,350
$5,800
Mark-to-Market of Hedges
(3,4)
$2,650
$1,150
$400
Power New Business / To Go
$250
$750
$1,000
Non-Power Margins Executed
$350
$150
$100
Non-Power New Business / To Go
$100
$300
$400
Total Gross Margin
(2)
$7,800
$7,700
$7,700
Reference Prices
(5)
2016
2017
2018
Henry Hub Natural Gas ($/MMbtu)
$2.19
$2.77
$2.87
Midwest: NiHub ATC prices ($/MWh)
$24.00
$27.10
$27.26
Mid-Atlantic: PJM-W ATC prices ($/MWh)
$29.31
$33.59
$32.52
ERCOT-N ATC Spark Spread ($/MWh)
HSC Gas, 7.2HR, $2.50 VOM
$4.57
$4.28
$4.39
New York: NY Zone A ($/MWh)
$26.25
$33.23
$32.66
New England: Mass Hub ATC Spark Spread($/MWh)
ALQN Gas, 7.5HR, $0.50 VOM
$6.65
$8.65
$9.28 |
 22 Q1 2016 Earnings Release Slides ExGen Disclosures Generation and Hedges 2016 2017 2018 Exp. Gen (GWh) (1) 200,100 205,400 206,600 Midwest 97,700 96,300 96,700 Mid-Atlantic (2) 63,300 61,300 60,600 ERCOT 17,200 26,000 30,800 New York (2) 9,300 9,200 9,100 New England 12,600 12,600 9,400 % of Expected Generation Hedged (3) 96%-99% 69%-72% 37%-40% Midwest 92%-95% 65%-68% 31%-34% Mid-Atlantic (2) 105%-108% 77%-80% 45%-48% ERCOT 95%-98% 73%-76% 39%-42% New York (2) 91%-94% 64%-67% 52%-55% New England 79%-82% 53%-56% 24%-27% Effective Realized Energy Price ($/MWh) (4) Midwest $34.00 $33.00 $31.50 Mid-Atlantic (2) $45.50 $45.00 $41.00 ERCOT (5) $11.50 $7.50 $4.00 New York (2) $61.00 $50.50 $42.50 New England (5) $27.50 $18.00 $9.50 (1) Expected generation is the volume of energy that best represents our commodity position in energy markets from owned
or contracted for capacity based upon a simulated dispatch model that makes assumptions regarding future market conditions, which are calibrated to market quotes for power, fuel, load
following products, and options. Expected generation assumes 12 refueling outages in 2016, 15 in 2017, and 14 in 2018 at Exelon-operated nuclear plants, and Salem. Expected
generation assumes capacity factors of 94.1%, 93.4% and 93.7% in 2016, 2017 and 2018 respectively at Exelon-operated nuclear plants, at ownership. These estimates of expected generation in
2017 and 2018 do not represent guidance or a forecast of future results as Exelon has not completed its planning or optimization processes for those years. (2) Excludes EDF’s equity
ownership share of CENG Joint Venture. (3) Percent of expected generation hedged is the amount of equivalent sales divided by expected generation. Includes all hedging products,
such as wholesale and retail sales of power, options and swaps. (4) Effective realized energy price is representative of an all-in hedged price, on a per MWh basis, at which expected
generation has been hedged. It is developed by considering the energy revenues and costs associated with our hedges and by considering the fossil fuel that has been purchased to lock in
margin. It excludes uranium costs and RPM capacity revenue, but includes the mark-to-market value of capacity contracted at prices other than RPM clearing prices including our
load obligations. It can be compared with the reference prices used to calculate open gross margin in order to determine the mark-to-market value of Exelon Generation's energy hedges.
(5) Spark spreads shown for ERCOT and New England. |
 23 Q1 2016 Earnings Release Slides ExGen Hedged Gross Margin Sensitivities Gross Margin Sensitivities (With Existing Hedges) (1) 2016 2017 2018 Henry Hub Natural Gas ($/Mmbtu) + $1/Mmbtu $20 $270 $570 - $1/Mmbtu $60 $(300) $(580) NiHub ATC Energy Price + $5/MWh $35 $185 $350 - $5/MWh $(30) $(180) $(345) PJM-W ATC Energy Price + $5/MWh $(15) $65 $160 - $5/MWh $20 $(80) $(165) NYPP Zone A ATC Energy Price + $5/MWh - $15 $20 - $5/MWh - $(15) $(20) Nuclear Capacity Factor +/- 1% +/- $25 +/- $35 +/- $35 (1) Based on March 31, 2016 market conditions and hedged position; Gas price sensitivities are based on an assumed
gas-power relationship derived from an internal model that is updated periodically; Power prices sensitivities are derived by adjusting the power price assumption while keeping all other
prices inputs constant; Due to correlation of the various assumptions, the hedged gross margin impact calculated by aggregating individual sensitivities may not be equal to the hedged gross
margin impact calculated when correlations between the various assumptions are also considered; Sensitivities based on commodity exposure which includes open generation and all
committed transactions; Excludes EDF’s equity share of CENG Joint Venture
|
 24 Q1 2016 Earnings Release Slides ExGen Hedged Gross Margin Upside/Risk 5,000 5,500 6,000 6,500 7,000 7,500 8,000 8,500 9,000 9,500 10,000 10,500 11,000 2016 2017 2018 $9,150 $6,550 $7,950 $7,650 $8,350 $7,100 (1) Represents an approximate range of expected gross margin, taking into account hedges in place, between the 5th and 95th
percent confidence levels assuming all unhedged supply is sold into the spot market; Approximate gross margin ranges are based upon an internal simulation model and are subject to
change based upon market inputs, future transactions and potential modeling changes; These ranges of approximate gross margin in 2017 and 2018 do not represent earnings guidance or a
forecast of future results as Exelon has not completed its planning or optimization processes for those years; The price distributions that generate this range are calibrated to
market quotes for power, fuel, load following products, and options as of March 31, 2016
(2)
Gross Margin Upside/Risk based on commodity exposure which
includes open generation and all committed transactions (3)
Gross Margin (Non-GAAP) is defined as operating revenues
less purchased power and fuel expense, excluding revenue related to decommissioning, gross receipts tax, Exelon Nuclear Partners, operating services agreement with Fort Calhoun and variable interest entities. Total Gross Margin is also net of
direct cost of sales for certain Constellation businesses. Excludes Pepco Energy Services. See Slide 26 for a Non-GAAP to GAAP reconciliation of Total Gross Margin. Excludes EDF’s equity ownership share of the
CENG Joint Venture. |
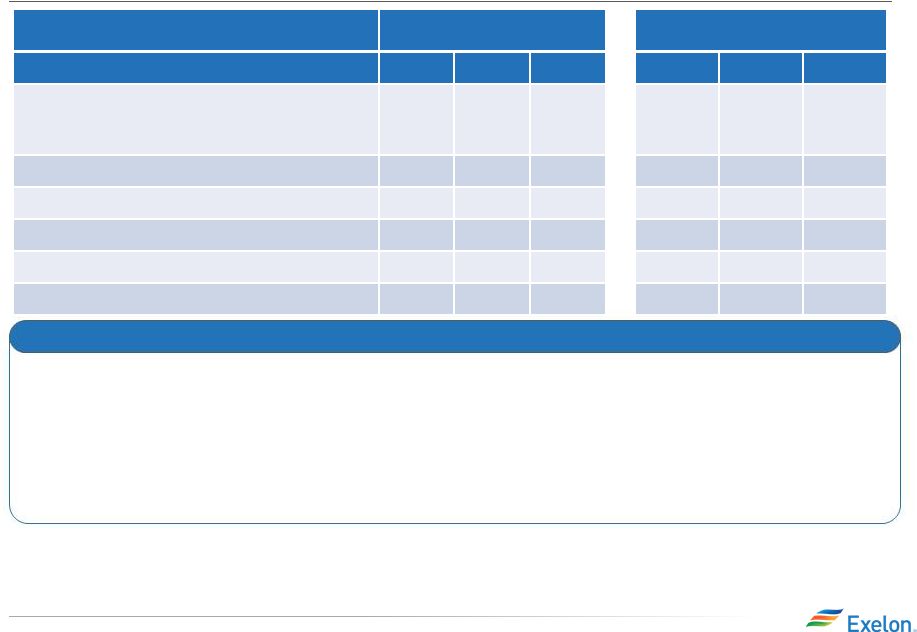
 25 Q1 2016 Earnings Release Slides Row Item Midwest Mid-Atlantic ERCOT New York New England South, West & Canada (A) Start with fleet-wide open gross margin (B) Expected Generation (TWh) 96.3 61.3 26.0 9.2 12.6 (C) Hedge % (assuming mid-point of range) 66.5% 78.5% 74.5% 65.5% 54.5% (D=B*C) Hedged Volume (TWh) 64.0 48.1 19.4 6.0 6.9 (E) Effective Realized Energy Price ($/MWh) $33.00 $45.00 $7.50 $50.50 $18.00 (F) Reference Price ($/MWh) $27.10 $33.59 $4.28 $33.23 $8.65 (G=E-F) Difference ($/MWh) $5.90 $11.41 $3.22 $17.27 $9.35 (H=D*G) Mark-to-market value of hedges ($ million)
(1)
$380
$550
$60
$105
$65
(I=A+H)
Hedged Gross Margin ($ million)
(J)
Power New Business / To Go ($ million)
(K)
Non-Power Margins Executed ($ million)
(L)
Non-Power New Business / To Go ($ million)
(N=I+J+K+L)
Total Gross Margin
(2)
$150
$300
$7,700 million
$5.35 billion
$6,500
$750
Illustrative Example of Modeling Exelon
Generation 2017 Gross Margin (1) Mark-to-market rounded to the nearest $5 million (2) Total Gross Margin (Non-GAAP) is defined as operating revenues less purchased power and fuel expense, excluding
revenue related to decommissioning, gross receipts tax, Exelon Nuclear Partners operating services agreement with Fort Calhoun and variable interest entities. Total Gross Margin is also net of
direct cost of sales for certain Constellation businesses. Excludes Pepco Energy Services. See Slide 26 for a Non-GAAP to GAAP reconciliation of Total Gross Margin. |
 Additional ExGen Modeling Data Total Gross Margin Reconciliation (in $M) 2016 2017 2018 Revenue Net of Purchased Power and Fuel Expense (2)(3) $8,425 $8,325 $8,325 Other Revenues (4) $(325) $(325) $(325) Direct cost of sales incurred to generate revenues for certain
Constellation businesses
(5)
$(300)
$(300)
$(300)
Total Gross Margin (Non-GAAP, as shown on slide
11) $7,800
$7,700
$7,700
Key ExGen
Modeling Inputs (in $M)
2016
Other Revenues (excluding Gross Receipts Tax)
(4)
$200
O&M
(7)
$(4,475)
Taxes Other Than Income (TOTI)
(8)
$(350)
Depreciation & Amortization
(9)
$(1,075)
Interest Expense
$(375)
Effective Tax Rate
34.0%
(1)
All amounts rounded to the nearest $25M. Excludes Pepco Energy Services. (2) Revenue net of purchased power and fuel expense (RNF), a non-GAAP measure, is calculated as the GAAP measure of
operating revenue less the GAAP measure of purchased power and fuel expense. ExGen does not forecast the GAAP components of RNF separately. RNF also includes the RNF of our
proportionate ownership share of CENG. (3) Excludes the mark-to-market impact of economic hedging activities due to the volatility and unpredictability of
the future changes to power prices. (4) Other revenues reflects revenues from operating services agreement with Fort Calhoun, variable interest entities, funds
collected through revenues for decommissioning the former PECO nuclear plants through regulated rates and gross receipts tax revenues. (5) Reflects the cost of sales and depreciation expense of certain Constellation businesses of Generation. Excludes Pepco Energy Services. (6) ExGen amounts for O&M, TOTI, Depreciation & Amortization; excludes EDF’s equity ownership share of the CENG
Joint Venture. (7) ExGen adjusted O&M excludes direct cost of sales for certain Constellation business, P&L neutral decommissioning
costs and the impact from O&M related to variable interest entities. Refer to the Appendix for a reconciliation of adjusted (non-GAAP) O&M to GAAP O&M (8) TOTI excludes gross receipts tax of $125M (9) Depreciation & Amortization excludes the cost of sales impact of ExGen’s non-power businesses of $25M 26 Q1 2016 Earnings Release Slides (1) (1)(6) |
           27 Q1 2016 Earnings Release Slides Illinois Nuclear Plant Details Capacity 1,069 MW Capacity 1,403 MW Generation Output (2) 8,700 GWh Generation Output (2) 11,700 GWh Start of Operations 1987 Start of Operations 1973 License Expiration 2026 License Expiration 2032 Refueling Cycle 12 month Refueling Cycle (per unit) 24 month Commited to Run Through May 31, 2017 Commited to Run Through May 31, 2018 Employees ~700 Employees ~800 Clinton Quad Cities (1) (1) Capacity and generation output reflect proportionate ownership share
(2)
2015 actuals |
 28 Q1 2016 Earnings Release Slides Additional Disclosures |
 29 Q1 2016 Earnings Release Slides Exelon Utilities Overview Operating Statistics Commonwealth Edison Potomac Electric Power Customers: Service Territory: Peak Load: 2015 Rate Base: 3,800,000 11,400 sq. miles 23,753 MW $10.6 bn Customers: Service Territory: Peak Load: 2015 Rate Base: 842,000 640 sq. miles 7,023 MW $3.9 bn PECO Energy Atlantic City Electric Customers: Service Territory: Peak Load: 2015 Rate Base: 2,100,000 2,100 sq. miles 8,983 MW $6.0 bn Customers: Service Territory: Peak Load: 2015 Rate Base: 547,000 2,700 sq. miles 3,009 MW $1.8 bn Baltimore Gas and Electric Delmarva Power & Light Customers: Service Territory: Peak Load: 2015 Rate Base: 1,900,000 2,300 sq. miles 7,236 MW $5.0 bn Customers: Service Territory: Peak Load: 2015 Rate Base: 645,000 5,000 sq. miles 4,288 MW $2.4 bn Combined Service Territory Potomac Electric Power Service Territory Atlantic City Electric Service Territory Delmarva Power & Light Service Territory Baltimore Gas and Electric Service Territory PECO Energy Service Territory ComEd Service Territory IL Chicago DE MD PA NJ VA Philadelphia Baltimore Dover Wilmington Trenton Washington, DC |
 2015 Earned vs. Allowed ROE at PHI Utilities ACE - NJ DPL - DE - Gas 9.75%* DPL - MD 9.81%* DPL - DE - Electric Pepco - DC Pepco - MD 2015 Estimated Earned ROE 2015 Allowed ROE Significant Opportunity for Earned ROE Improvement at PHI Utilities
* ROE for purposes of calculating AFUDC and regulatory
asset carrying costs. 30
Q1
2016
Earnings Release
Slides
4.79%
7.00%
6.98%
4.77%
7.36%
6.62%
9.75%
9.70%
9.40%
9.62%
0
1
2
3
4
5
6
7
8
9
10 |
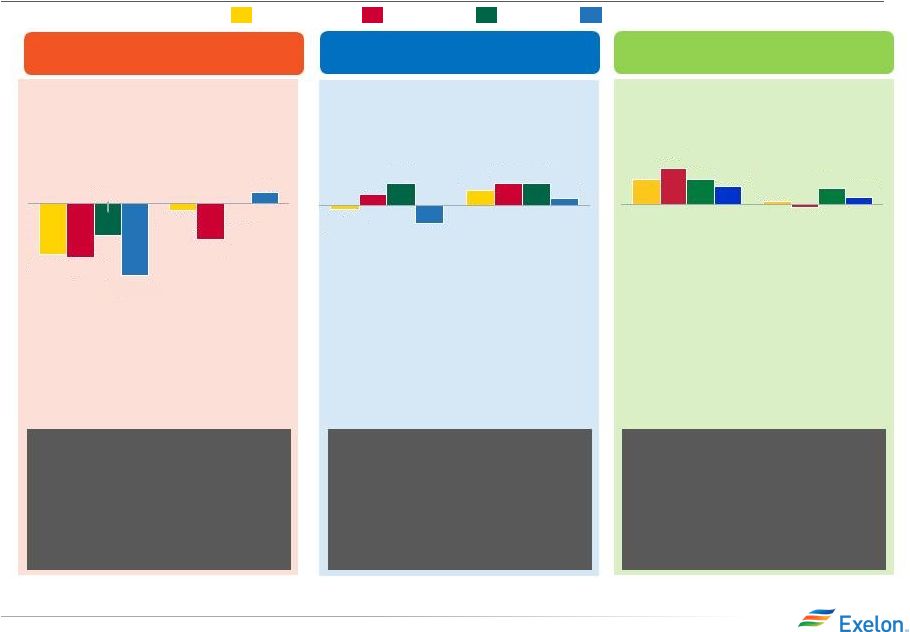 31 Q1 2016 Earnings Release Slides BGE Exelon Utilities Load PECO Large C&I Small C&I Residential All Customers ComEd 2016E 2015 2016 load is driven by impacts of energy efficiency partially offset by slowly improving economy Chicago GMP 1.5% Chicago Unemployment 6.3% 2016 load growth is driven by the impacts of energy efficiency and a weaker economic outlook , partially offset by moderate customer growth Notes: Data is weather normalized and not adjusted for leap year. Source of economic outlook data is IHS (March
2016). Assumes 2016 GDP of 2.3% and U.S. unemployment of 5.0%. ComEd has the ROE collar as part of the distribution formula rate and BGE is decoupled which mitigates the load risk. QTD and YTD actual data can be found in earnings release tables. BGE amounts have been adjusted for prior quarter true-ups.
2016 load growth is driven by
slowly improving economic
conditions coupled with solid
residential customer growth,
partially offset by energy
efficiency
Philadelphia GMP
2.1%
Philadelphia
Unemployment
4.5%
2016E
2015
2015 2016E Baltimore GMP 1.1% Baltimore Unemployment 5.0% (0.2%) (1.4%) (1.0%) (1.5%) (0.9%) 0.3% (2.0%) 0.0% 0.4% (0.1%) 0.6% 0.3% 0.6% 0.6% 0.2% (0.5%) 0.1% 0.7% -0.1% 1.0% 0.4% 0.7% 0.2% 0.5% |
 32 Q1 2016 Earnings Release Slides Pepco Exelon Utilities Load (cont’d) Delmarva C&I Residential All Customers ACE 2016E 2015 2016E 2015 2016E 2015 2016 load is driven by the impacts of energy efficiency and distributed energy partially offset by improving residential and commercial customer growth. ACE GMP 0.3% ACE Unemployment 7.3% DPL GMP 2.2% DPL Unemployment 4.8% Pepco GMP 2.2% Pepco Unemployment 5.3% (2.2%) (0.4%) (2.6%) 2.1% (1.9%) (2.5%) (0.3%) 0.0% (0.9%) 2.2% 0.2% (1.6%) (0.7%) 0.2% (3.3%) 6.7% 0.6% (2.7%) 2016 load is driven by the impacts of energy efficiency and distributed energy partially offset by improved employment and residential, commercial & industrial customer growth. 2016 load is driven by the impacts of energy efficiency and distributed energy partially offset by improved commercial usage and residential customer growth. Notes: Data is weather normalized using 20-year historical average and not adjusted for leap year. Starting with
2Q16, PHI will be moving to 30-year historical average for weather normalization. Source of economic outlook data is IHS (March 2016). Assumes 2016 GDP of 2.3% and U.S.
unemployment rate of 5.0%. Pepco and DPL MD are decoupled which mitigates the load risk. QTD and YTD actual data can be found in earnings release tables. ACE includes Atlantic City, Vineland
and Ocean City MSAs (Metropolitan Statistical Area). DPL MSA includes Wilmington Division, Dover MSA and Salisbury MSA. Pepco MSA includes the city of Washington DC and Silver
Spring/Frederick Division. |
    33 Q1 2016 Earnings Release Slides PHI Jurisdiction Comparison Rate Cases District of Columbia Maryland Delaware New Jersey Partially Forecasted Test Year Yes (1) Yes Yes Yes Required to update test year to actual No Yes No Yes Timing for Rate Implementation No statute; target to complete cases within 9 months of filing Statute - 7 months; rates automatically go into effect subject to refund Statute - 7 months; company files request to implement rates, subject to refund Statute - 9 months; company files request to implement rates, subject to refund (2) Time Restrictions on Initiating Subsequent Rate Filings No No No No Staff Party to Case No Yes Yes Yes Commissions Full Time/Part Time Full-Time Full-Time Part-Time Full-Time Appointed/Elected Appointed Appointed Appointed Appointed Length of Term 4 years 5 years 5 years 6 years Commissioners (3) Name (Term Expiration) Betty Ann Kane (2018) Kevin Hughes (2018) Dallas Winslow (2020) Richard S. Mroz (2021) Joanne Doddy Fort (2016) Harold Williams (2017) Joann Conaway (2020) Diane Solomon (2018) Willie L. Phillips (2018) Anne Hoskins (2016) Harold Gray (2020) Joseph L. Fiordaliso (2019) Jeannette M. Mills (2019) Kim Drexler (2020) Mary-Anna Holden (2017) Michael T. Richard (2020) Manubhai Karia (2020) Upendra J. Chivukula (2019) (1) The District of Columbia PSC allows rates to be developed using a partially forecasted test period. The Company is
required to update the test period to actual within 180 days of the completion of the rate proceeding
(2)
The statutory deadline for NJBPU decisions has not been
successfully enforced by a utility; fully litigated cases can take 12 months or more for decision
(3)
Chairperson denoted in bold |
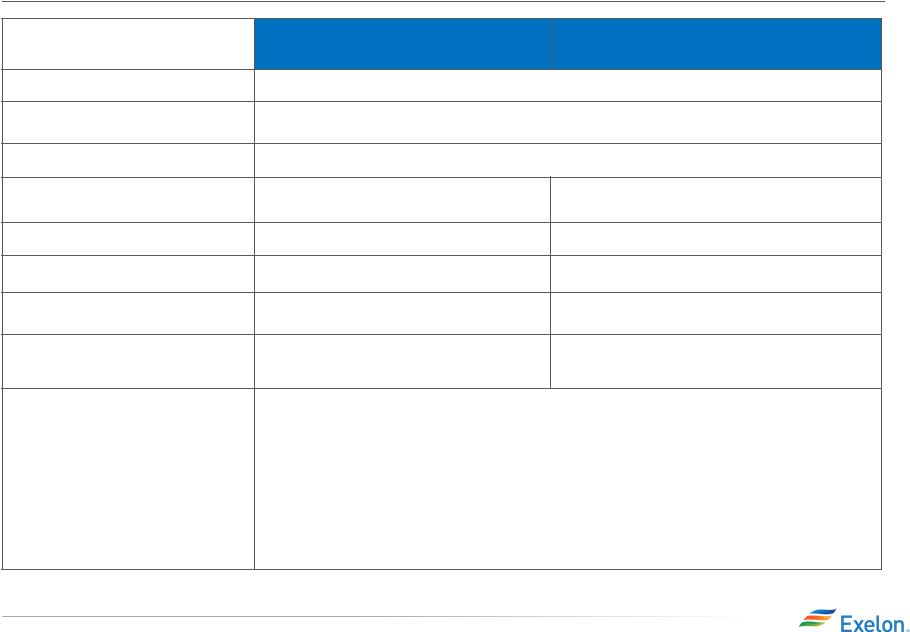 34 Q1 2016 Earnings Release Slides Electric Gas Docket # 9406 Test Year December 2014- November 2015 Common Equity Ratio (1) 53.7% Requested ROE 10.60% 10.50% Requested Rate of Return 7.95% 7.90% Rate Base (adjusted) $3.0B $1.2B Revenue Requirement Increase (1) $117.6M $79.1M Proposed Distribution Increase as % of overall bill ~3% ~9% Notes • 11/06/15 BGE filed application with the MDPSC seeking increases in electric & gas distribution
base rates; request was subsequently revised in Q1 to reflect
impact of additional actual data •
$141M or ~72% of the total $197M distribution rate increase is
for recovery of Smart Grid
investment
• Requested incremental conduit fees of $31M be recovered through a rider
• 210 Day Proceeding • June 2016 - PSC order expected • New rates are in effect shortly after the final order (1) Based on the 12 months ended 11/30/2015. BGE Electric and Gas Distribution Rate Case |
 35 Q1 2016 Earnings Release Slides ComEd April 2016 Distribution Formula Rate Docket # 16-0259 Filing Year 2015 Calendar Year Actual Costs and 2016 Projected Net Plant Additions are used to set the rates for calendar year 2017. Rates currently in effect (docket 15-0287) for calendar year 2016 were based on 2014 actual costs and 2015
projected net plant additions
Reconciliation Year
Reconciles
Revenue
Requirement
reflected
in
rates
during
2015
to
2015
Actual
Costs
Incurred.
Revenue
requirement
for 2015 is based on docket 14-0312 (2013 actual costs and
2014 projected net plant additions) approved in December 2014. Common Equity Ratio ~ 46% for both the filing and reconciliation year ROE 8.64% for the filing year (2015 30-yr Treasury Yield of 2.84% + 580 basis point risk premium) and 8.59% for the reconciliation year (2015 30-yr Treasury Yield of 2.79% + 580 basis point risk premium – 5 basis points performance metrics penalty). For 2016 and 2017, the actual allowed ROE reflected in net income will ultimately be based on the
average of the 30-year Treasury Yield during
the respective years plus 580 basis point spread, absent any metric penalties Requested Rate of Return ~ 7% for both the filing and reconciliation years Rate Base $8,830 million– Filing year (represents projected year-end rate base using 2015 actual plus 2016 projected capital
additions). 2016 and 2017 earnings will reflect 2016 and
2017 year-end rate base respectively. $7,780
million - Reconciliation year (represents
year-end rate base for 2015) Revenue
Requirement Increase
$138M increase ($1M decrease due to the 2015 reconciliation and collar adjustment offset by a $139M increase related
to the filing year). The 2015 reconciliation impact on
net income was recorded in 2015 as a regulatory asset. Timeline • 04/13/16 Filing Date • 240 Day Proceeding The 2016 distribution formula rate filing established the net revenue requirement used to set the rates that will take
effect in January 2017 after the Illinois Commerce
Commission's (ICC’s) review. There are two components to the annual distribution formula rate filing: • Filing Year: Based on 2015 costs and 2016 projected plant additions.
• Annual Reconciliation: For 2015, this amount reconciles the revenue requirement reflected in rates in effect during 2015
to the actual costs for that year. The annual
reconciliation impacts cash flow in 2017 but the earnings impact has been recorded in 2015 as a regulatory asset. Given the retroactive ratemaking provision in the Energy Infrastructure Modernization Act (EIMA) legislation, ComEd net
income during the year will be based on actual
costs with a regulatory asset/liability recorded to reflect any under/over recovery reflected in rates. Revenue Requirement in rate filings impacts cash flow. |
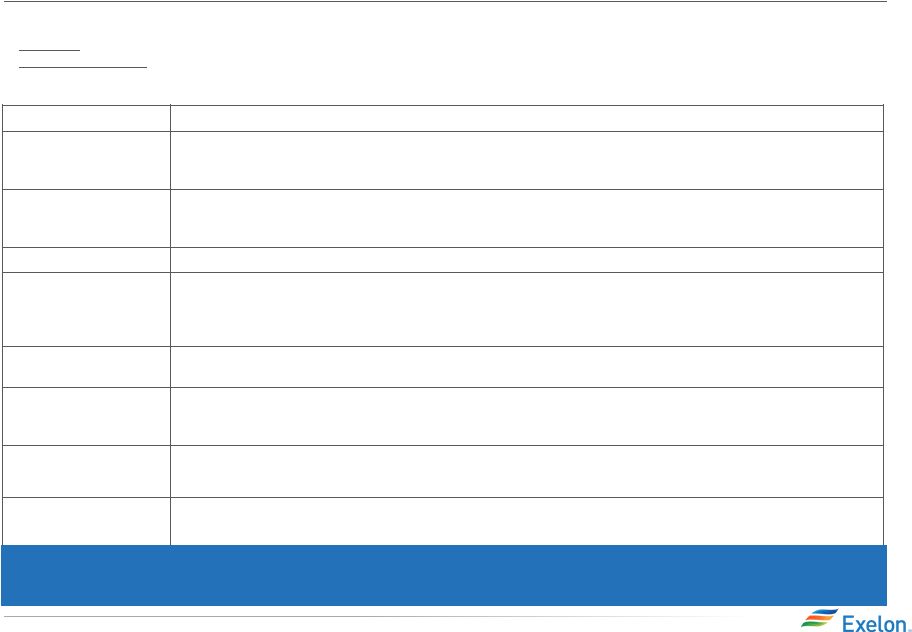
 36 Q1 2016 Earnings Release Slides ACE Electric Distribution Rate Case Docket # ER16030252 Test Year 2015 Calendar Year Test Period Partially Forecasted Test Period (9 months actual & 3 months forecasted)
Requested
Common Equity Ratio
49.5%
Requested Rate of Return
ROE: 10.60%; ROR:
8.06%
Proposed Rate Base
$1.4B
Requested
Revenue Requirement Increase
$84.4M
Residential Total Bill % Increase
6.3%
Notes
• 3/22/16 ACE filed application with the NJBPU seeking increase in electric
distribution base rates
• 12 month forward looking reliability and other plant additions from January 2016
through December 2016 ($15.2M of revenue) included in revenue
requirement request
• PowerAhead Program to fund accelerated investments in grid resiliency,
incremental to the five year capital plan (not included in
revenue requirement request): Capital $176
million (Distribution Line Hardening $108 million; Storm Response $35 million; and Other Programs $33 million) • 9 month statutory deadline for NJBPU decisions has not been successfully enforced
by a utility; fully litigated cases can take 12 months or more
for decision •
NJBPU order expected first half of 2017
|
 37 Q1 2016 Earnings Release Slides Pepco MD Electric Distribution Rate Case Docket # 9418 Test Year 2015 Calendar Year Test Period Partially Forecasted Test Period (9 months actual & 3 months forecasted)
Requested
Common Equity Ratio
49.6%
Requested Rate of Return
ROE: 10.60%; ROR:
8.01%
Proposed Rate Base
$1.8B
Requested
Revenue Requirement Increase
$126.8M
Residential Total Bill % Increase
10.4%
Notes
• 4/19/16 Pepco MD filed application with the MDPSC seeking increase in electric distribution base rates • Size of ask is driven by 2 years of capital investment, recovery of AMI
investments and new depreciation rates.
• 12 month forward looking reliability and other plant additions from January
2016 through December 2016 ($20.7M of revenue); included in
revenue requirement request
• Extension of the Grid Resiliency Program to fund accelerated investments in
grid resiliency, incremental to the capital plan (not included
in revenue requirement request)
• Capital $31.6 million (Feeder Work $24.0 million and Reclosing
Devices $7.6 million) in 2017-2018
• 7 Month Proceeding • Q42016 - PSC order expected • New rates are in effect shortly after the final order |
 38 Q1 2016 Earnings Release Slides Appendix Reconciliation of Non-GAAP Measures |
 39 Q1 2016 Earnings Release Slides 1Q 2015 YTD GAAP EPS Reconciliation Three Months Ended March 31, 2015 ExGen ComEd PECO BGE Other Exelon 2015 Adjusted (non-GAAP) Operating Earnings (Loss) Per Share
$0.35
$0.11
$0.16
$0.12
$(0.03)
$0.71
Mark-to-market impact of economic hedging
activities (0.11)
-
-
-
-
(0.11)
Unrealized gains related to NDT fund investments
0.03
-
-
-
-
0.03
Merger and integration costs
(0.01)
-
-
-
(0.01)
(0.02)
Mark-to-market impact of PHI merger related interest
swaps -
-
-
-
(0.06)
(0.06)
Amortization of commodity contract intangibles
0.03
-
-
-
-
0.03
Midwest Generation bankruptcy recoveries
0.01
-
-
-
-
0.01
CENG non-controlling interest
(0.01)
-
-
-
-
(0.01)
1Q 2015 GAAP Earnings Per Share
$0.51
$0.11
$0.16
$0.12
($0.10)
$0.80
NOTE: All amounts shown are per Exelon share and represent
contributions to Exelon's EPS. Amounts may not add due to rounding. |
 40 Q1 2016 Earnings Release Slides 1Q 2016 YTD GAAP EPS Reconciliation (continued) Three Months Ended March 31, 2016 ExGen ComEd PECO BGE PHI Other Exelon 2016 Adjusted (non-GAAP) Operating Earnings (Loss) Per
Share
$0.34
$0.12
$0.14
$0.11
$0.00
$(0.02)
$0.68
Mark-to-market impact of economic hedging
activities 0.07
-
-
-
-
-
0.07
Unrealized gains related to NDT fund investments
0.03
-
-
-
-
-
0.03
Amortization of commodity contract intangibles
0.01
-
-
-
-
-
0.01
Merger and integration costs
(0.01)
0.01
-
-
(0.04)
(0.05)
(0.08)
Merger commitments
-
-
-
-
(0.30)
(0.12)
(0.42)
Long-lived asset impairment
(0.07)
-
-
-
-
-
(0.07)
Reassessment of state deferred income taxes
(0.01)
-
-
-
-
0.01
-
Cost management program
(0.01)
-
-
-
-
-
(0.02)
CENG non-controlling interest
(0.01)
-
-
-
-
-
(0.01)
1Q 2016 GAAP Earnings (Loss) Per Share
$0.34
$0.13
$0.14
$0.11
$(0.34)
$(0.18)
$0.19
NOTE: All amounts shown are per Exelon share and represent
contributions to Exelon's EPS. Amounts may not add due to rounding. |
 41 Q1 2016 Earnings Release Slides GAAP to Operating Adjustments • Exelon’s Q1 2016 adjusted (non-GAAP) operating earnings excludes the earnings effects of the
following: –
Mark-to-market adjustments from economic hedging
activities –
Unrealized gains and losses from NDT fund investments to the
extent not offset by contractual accounting as
described in the notes to the consolidated financial statements – Non-cash amortization of intangible assets, net, related to commodity contracts recorded at fair value at
the
date
of
acquisition
of
Integrys
in
2014
–
Certain costs incurred associated with PHI
acquisition –
Merger commitments related to settlement of PHI
acquisition –
Impairment of certain upstream assets
–
Non-cash
impact
of
the
remeasurement
of
state
deferred
income
taxes,
primarily
as
a
result
of
PHI
acquisition
–
Costs incurred related to cost management
initiatives –
Generation’s non-controlling interest related to CENG
exclusion items –
Other unusual items |