Attached files
| file | filename |
|---|---|
| EX-32.A - SECTION 906 CEO CERTIFICATIONS - WINDSTREAM HOLDINGS, INC. | a10qexhibit32a1q16.htm |
| EX-32.B - SECTION 906 CFO CERTIFICATIONS - WINDSTREAM HOLDINGS, INC. | a10qexhibit32b1q16.htm |
| EX-31.A - SECTION 302 CEO CERTIFICATIONS - WINDSTREAM HOLDINGS, INC. | a10qexhibit31a1q16.htm |
| EX-31.B - SECTION 302 CFO CERTIFICATIONS - WINDSTREAM HOLDINGS, INC. | a10qexhibit31b1q16.htm |
UNITED STATES
SECURITIES AND EXCHANGE COMMISSION
Washington, D. C. 20549
FORM 10-Q
x | QUARTERLY REPORT PURSUANT TO SECTION 13 OR 15(d) OF THE SECURITIES EXCHANGE ACT OF 1934 |
For the quarterly period ended March 31, 2016
or
¨ | TRANSITION REPORT PURSUANT TO SECTION 13 OR 15(d) OF THE SECURITIES EXCHANGE ACT OF 1934 |

Exact name of registrant as specified in its charter | State or other jurisdiction of incorporation or organization | Commission File Number | I.R.S. Employer Identification No. | |||
Windstream Holdings, Inc. | Delaware | 001-32422 | 46-2847717 | |||
Windstream Services, LLC | Delaware | 001-36093 | 20-0792300 | |||
4001 Rodney Parham Road | ||||
Little Rock, Arkansas | 72212 | |||
(Address of principal executive offices) | (Zip Code) | |||
(501) 748-7000 | ||||
(Registrants’ telephone number, including area code) | ||||
Indicate by check mark whether the registrant (1) has filed all reports required to be filed by Section 13 or 15(d) of the Securities Exchange Act of 1934 during the preceding 12 months (or for such shorter period that the registrant was required to file such reports), and (2) has been subject to such filing requirements for the past 90 days.
Windstream Holdings, Inc. | ý YES ¨ NO | |||
Windstream Services, LLC | ý YES ¨ NO | |||
Indicate by check mark whether the registrant has submitted electronically and posted on its corporate Web site, if any, every Interactive Data File required to be submitted and posted pursuant to Rule 405 of Regulation S-T (§232.405 of this chapter) during the preceding 12 months (or for such shorter period that the registrant was required to submit and post such files).
Windstream Holdings, Inc. | ý YES ¨ NO | |||
Windstream Services, LLC | ý YES ¨ NO | |||
Indicate by check mark whether the registrant is a large accelerated filer, an accelerated filer, a non-accelerated filer, or a smaller reporting company. See definition of “large accelerated filer”, “accelerated filer” and “smaller reporting company” in Rule 12b-2 of the Exchange Act. (Check one):
Windstream Holdings, Inc. | Large accelerated filer ý | Accelerated filer ¨ | ||
Non-accelerated filer ¨ | Smaller reporting company ¨ | |||
Windstream Services, LLC | Large accelerated filer ¨ | Accelerated filer ¨ | ||
Non-accelerated filer ý | Smaller reporting company ¨ | |||
Indicate by check mark whether the registrant is a shell company (as defined by Rule 12b-2 of the Exchange Act).
Windstream Holdings, Inc. | ¨ YES ý NO | |||
Windstream Services, LLC | ¨ YES ý NO | |||
As of April 29, 2016, 96,310,037 shares of common stock of Windstream Holdings, Inc.were outstanding. Windstream Holdings, Inc. holds a 100 percent interest in Windstream Services, LLC.
This Form 10-Q is a combined quarterly report being filed separately by two registrants: Windstream Holdings, Inc. and Windstream Services, LLC. Windstream Services, LLC is a direct, wholly-owned subsidiary of Windstream Holdings, Inc. Accordingly, Windstream Services, LLC meets the conditions set forth in general instruction H(1)(a) and (b) of Form 10-Q and is therefore filing this form with the reduced disclosure format. Unless the context indicates otherwise, the use of the terms “Windstream,” “we,” “us” or “our” shall refer to Windstream Holdings, Inc. and its subsidiaries, including Windstream Services, LLC, and the term “Windstream Services” shall refer to Windstream Services, LLC and its subsidiaries.
The Exhibit Index is located on page 68. | ||
WINDSTREAM HOLDINGS, INC.
WINDSTREAM SERVICES, LLC
FORM 10-Q
TABLE OF CONTENTS
Page No. | ||
Item 1. | ||
Item 2. | ||
Item 3. | ||
Item 4. | ||
Item 1. | ||
Item 1A. | ||
Item 2. | ||
Item 3. | Defaults Upon Senior Securities | * |
Item 4. | Mine Safety Disclosures | * |
Item 5. | Other Information | * |
Item 6. | ||
_____________
* | No reportable information under this item. |
1
WINDSTREAM HOLDINGS, INC.
WINDSTREAM SERVICES, LLC
FORM 10-Q
PART I - FINANCIAL INFORMATION
Item 1. Financial Statements
WINDSTREAM HOLDINGS, INC.
CONSOLIDATED STATEMENTS OF OPERATIONS (UNAUDITED)
Three Months Ended March 31, | ||||||||||||
(Millions, except per share amounts) | 2016 | 2015 | ||||||||||
Revenues and sales: | ||||||||||||
Service revenues | $ | 1,340.6 | $ | 1,381.8 | ||||||||
Product sales | 32.8 | 36.8 | ||||||||||
Total revenues and sales | 1,373.4 | 1,418.6 | ||||||||||
Costs and expenses: | ||||||||||||
Cost of services (exclusive of depreciation and amortization included below) | 668.8 | 680.0 | ||||||||||
Cost of products sold | 28.9 | 31.9 | ||||||||||
Selling, general and administrative | 203.8 | 225.0 | ||||||||||
Depreciation and amortization | 304.8 | 340.7 | ||||||||||
Merger and integration costs | 5.0 | 14.1 | ||||||||||
Restructuring charges | 4.4 | 7.0 | ||||||||||
Total costs and expenses | 1,215.7 | 1,298.7 | ||||||||||
Operating income | 157.7 | 119.9 | ||||||||||
Dividend income on CS&L common stock | 17.6 | — | ||||||||||
Other expense, net | (1.2 | ) | (1.2 | ) | ||||||||
Net loss on early extinguishment of debt | (35.4 | ) | — | |||||||||
Other-than-temporary impairment loss on investment in CS&L common stock | (181.9 | ) | — | |||||||||
Interest expense | (219.7 | ) | (141.1 | ) | ||||||||
Loss before income taxes | (262.9 | ) | (22.4 | ) | ||||||||
Income tax benefit | (31.0 | ) | (27.7 | ) | ||||||||
Net (loss) income | $ | (231.9 | ) | $ | 5.3 | |||||||
Basic and diluted (loss) earnings per share: | ||||||||||||
Net (loss) income | ($2.52 | ) | $.05 | |||||||||
See the accompanying notes to the unaudited interim consolidated financial statements.
2
WINDSTREAM HOLDINGS, INC.
CONSOLIDATED STATEMENTS OF COMPREHENSIVE INCOME (UNAUDITED)
Three Months Ended March 31, | ||||||||||||
(Millions) | 2016 | 2015 | ||||||||||
Net (loss) income | $ | (231.9 | ) | $ | 5.3 | |||||||
Other comprehensive income (loss): | ||||||||||||
Available-for-sale securities: | ||||||||||||
Unrealized holding gain arising during the period | 104.6 | — | ||||||||||
Other-than-temporary impairment loss recognized in the period | 181.9 | — | ||||||||||
Change in available-for-sale securities | 286.5 | — | ||||||||||
Interest rate swaps: | ||||||||||||
Unrealized loss on designated interest rate swaps | (8.3 | ) | (8.6 | ) | ||||||||
Amortization of unrealized losses on de-designated interest rate swaps | 1.2 | 3.4 | ||||||||||
Income tax benefit | 2.7 | 2.0 | ||||||||||
Change in interest rate swaps | (4.4 | ) | (3.2 | ) | ||||||||
Postretirement and pension plans: | ||||||||||||
Plan curtailment | (5.5 | ) | — | |||||||||
Amounts included in net periodic benefit cost: | ||||||||||||
Amortization of net actuarial loss | 0.1 | 0.2 | ||||||||||
Amortization of prior service credits | (0.5 | ) | (1.3 | ) | ||||||||
Income tax benefit | 2.3 | 0.2 | ||||||||||
Change in postretirement and pension plans | (3.6 | ) | (0.9 | ) | ||||||||
Other comprehensive income (loss) | 278.5 | (4.1 | ) | |||||||||
Comprehensive income | $ | 46.6 | $ | 1.2 | ||||||||
See the accompanying notes to the unaudited interim consolidated financial statements.
3
WINDSTREAM HOLDINGS, INC.
CONSOLIDATED BALANCE SHEETS (UNAUDITED)
(Millions, except par value) | March 31, 2016 | December 31, 2015 | ||||||
Assets | ||||||||
Current Assets: | ||||||||
Cash and cash equivalents | $ | 74.6 | $ | 31.3 | ||||
Accounts receivable (less allowance for doubtful | ||||||||
accounts of $30.6 and $33.1, respectively) | 636.1 | 643.9 | ||||||
Inventories | 79.4 | 79.5 | ||||||
Prepaid expenses and other | 149.9 | 120.6 | ||||||
Total current assets | 940.0 | 875.3 | ||||||
Goodwill | 4,213.6 | 4,213.6 | ||||||
Other intangibles, net | 1,457.2 | 1,504.7 | ||||||
Net property, plant and equipment | 5,255.7 | 5,279.8 | ||||||
Investment in CS&L common stock | 653.8 | 549.2 | ||||||
Other assets | 90.9 | 95.5 | ||||||
Total Assets | $ | 12,611.2 | $ | 12,518.1 | ||||
Liabilities and Shareholders’ Equity | ||||||||
Current Liabilities: | ||||||||
Current maturities of long-term debt | $ | 11.9 | $ | 5.9 | ||||
Current portion of long-term lease obligations | 156.6 | 152.7 | ||||||
Accounts payable | 323.6 | 430.1 | ||||||
Advance payments and customer deposits | 193.9 | 193.9 | ||||||
Accrued taxes | 71.6 | 84.1 | ||||||
Accrued interest | 118.1 | 78.4 | ||||||
Other current liabilities | 273.9 | 322.0 | ||||||
Total current liabilities | 1,149.6 | 1,267.1 | ||||||
Long-term debt | 5,433.1 | 5,164.6 | ||||||
Long-term lease obligations | 4,959.8 | 5,000.4 | ||||||
Deferred income taxes | 254.9 | 287.4 | ||||||
Other liabilities | 476.1 | 492.2 | ||||||
Total liabilities | 12,273.5 | 12,211.7 | ||||||
Commitments and Contingencies (See Note 13) | ||||||||
Shareholders’ Equity: | ||||||||
Common stock, $.0001 par value, 166.7 shares authorized, | ||||||||
96.3 and 96.7 shares issued and outstanding, respectively | — | — | ||||||
Additional paid-in capital | 587.6 | 602.9 | ||||||
Accumulated other comprehensive loss | (5.9 | ) | (284.4 | ) | ||||
Accumulated deficit | (244.0 | ) | (12.1 | ) | ||||
Total shareholders’ equity | 337.7 | 306.4 | ||||||
Total Liabilities and Shareholders’ Equity | $ | 12,611.2 | $ | 12,518.1 | ||||
See the accompanying notes to the unaudited interim consolidated financial statements.
4
WINDSTREAM HOLDINGS, INC.
CONSOLIDATED STATEMENTS OF CASH FLOWS (UNAUDITED)
Three Months Ended March 31, | ||||||||
(Millions) | 2016 | 2015 | ||||||
Cash Flows from Operating Activities: | ||||||||
Net (loss) income | $ | (231.9 | ) | $ | 5.3 | |||
Adjustments to reconcile net (loss) income to net cash provided from operations: | ||||||||
Depreciation and amortization | 304.8 | 340.7 | ||||||
Provision for doubtful accounts | 9.7 | 10.3 | ||||||
Share-based compensation expense | 13.7 | 14.8 | ||||||
Deferred income taxes | (27.5 | ) | (33.8 | ) | ||||
Other-than-temporary impairment loss on investment in CS&L common stock | 181.9 | — | ||||||
Noncash portion of net loss on early extinguishment of debt | (7.4 | ) | — | |||||
Amortization of unrealized losses on de-designated interest rate swaps | 1.2 | 3.4 | ||||||
Plan curtailment | (5.5 | ) | — | |||||
Other, net | (15.3 | ) | 6.9 | |||||
Changes in operating assets and liabilities, net | ||||||||
Accounts receivable | (2.0 | ) | (33.3 | ) | ||||
Prepaid income taxes | (5.8 | ) | 7.8 | |||||
Prepaid expenses and other | (6.0 | ) | (24.8 | ) | ||||
Accounts payable | (100.2 | ) | (64.2 | ) | ||||
Accrued interest | 39.8 | 67.4 | ||||||
Accrued taxes | (12.5 | ) | (10.9 | ) | ||||
Other current liabilities | 4.2 | (43.2 | ) | |||||
Other liabilities | (10.0 | ) | (2.6 | ) | ||||
Other, net | (4.0 | ) | — | |||||
Net cash provided from operating activities | 127.2 | 243.8 | ||||||
Cash Flows from Investing Activities: | ||||||||
Additions to property, plant and equipment | (263.8 | ) | (189.3 | ) | ||||
Proceeds from the sale of property | 6.2 | — | ||||||
Grant funds received for broadband stimulus projects | — | 7.4 | ||||||
Network expansion funded by Connect America Fund - Phase I | — | (8.3 | ) | |||||
Change in restricted cash | — | (0.4 | ) | |||||
Other, net | — | (2.1 | ) | |||||
Net cash used in investing activities | (257.6 | ) | (192.7 | ) | ||||
Cash Flows from Financing Activities: | ||||||||
Dividends paid to shareholders | (14.9 | ) | (151.5 | ) | ||||
Repayments of debt and swaps | (985.3 | ) | (325.4 | ) | ||||
Proceeds of debt issuance | 1,278.0 | 490.0 | ||||||
Debt issuance costs | (10.7 | ) | — | |||||
Stock repurchases | (28.9 | ) | — | |||||
Payments under long-term lease obligations | (36.8 | ) | — | |||||
Payments under capital lease obligations | (19.8 | ) | (11.2 | ) | ||||
Other, net | (7.9 | ) | (6.8 | ) | ||||
Net cash provided from (used in) financing activities | 173.7 | (4.9 | ) | |||||
Increase in cash and cash equivalents | 43.3 | 46.2 | ||||||
Cash and Cash Equivalents: | ||||||||
Beginning of period | 31.3 | 27.8 | ||||||
End of period | $ | 74.6 | $ | 74.0 | ||||
Supplemental Cash Flow Disclosures: | ||||||||
Interest paid | $ | 178.6 | $ | 74.7 | ||||
Income taxes paid (refunded), net | $ | 6.5 | $ | (1.2 | ) | |||
See the accompanying notes to the unaudited interim consolidated financial statements.
5
WINDSTREAM HOLDINGS, INC.
CONSOLIDATED STATEMENT OF SHAREHOLDERS’ EQUITY (UNAUDITED)
(Millions, except per share amounts) | Common Stock and Additional Paid-In Capital | Accumulated Other Comprehensive Loss | Accumulated Deficit | Total | ||||||||||||
Balance at December 31, 2015 | $ | 602.9 | $ | (284.4 | ) | $ | (12.1 | ) | $ | 306.4 | ||||||
Net loss | — | — | (231.9 | ) | (231.9 | ) | ||||||||||
Other comprehensive income (loss), net of tax: | ||||||||||||||||
Change in available-for-sale securities | — | 286.5 | — | 286.5 | ||||||||||||
Change in postretirement and pension plans | — | (3.6 | ) | — | (3.6 | ) | ||||||||||
Amortization of unrealized losses on de-designated interest rate swaps | — | 0.7 | — | 0.7 | ||||||||||||
Change in designated interest rate swaps | — | (5.1 | ) | — | (5.1 | ) | ||||||||||
Comprehensive income (loss) | — | 278.5 | (231.9 | ) | 46.6 | |||||||||||
Share-based compensation expense (See Note 6) | 6.6 | — | — | 6.6 | ||||||||||||
Stock options exercised | 0.4 | — | — | 0.4 | ||||||||||||
Stock issued for management incentive compensation plans (See Note 6) | 5.5 | — | — | 5.5 | ||||||||||||
Stock issued to employee savings plan (See Note 5) | 24.0 | — | — | 24.0 | ||||||||||||
Stock repurchases | (28.9 | ) | — | — | (28.9 | ) | ||||||||||
Taxes withheld on vested restricted stock and other | (8.3 | ) | — | — | (8.3 | ) | ||||||||||
Dividends of $.15 per share declared to shareholders | (14.6 | ) | — | — | (14.6 | ) | ||||||||||
Balance at March 31, 2016 | $ | 587.6 | $ | (5.9 | ) | $ | (244.0 | ) | $ | 337.7 | ||||||
See the accompanying notes to the unaudited interim consolidated financial statements.
6
WINDSTREAM SERVICES, LLC
CONSOLIDATED STATEMENTS OF OPERATIONS (UNAUDITED)
Three Months Ended March 31, | ||||||||||||
(Millions) | 2016 | 2015 | ||||||||||
Revenues and sales: | ||||||||||||
Service revenues | $ | 1,340.6 | $ | 1,381.8 | ||||||||
Product sales | 32.8 | 36.8 | ||||||||||
Total revenues and sales | 1,373.4 | 1,418.6 | ||||||||||
Costs and expenses: | ||||||||||||
Cost of services (exclusive of depreciation and amortization included below) | 668.8 | 680.0 | ||||||||||
Cost of products sold | 28.9 | 31.9 | ||||||||||
Selling, general and administrative | 203.3 | 224.4 | ||||||||||
Depreciation and amortization | 304.8 | 340.7 | ||||||||||
Merger and integration costs | 5.0 | 14.1 | ||||||||||
Restructuring charges | 4.4 | 7.0 | ||||||||||
Total costs and expenses | 1,215.2 | 1,298.1 | ||||||||||
Operating income | 158.2 | 120.5 | ||||||||||
Dividend income on CS&L common stock | 17.6 | — | ||||||||||
Other expense, net | (1.2 | ) | (1.2 | ) | ||||||||
Net loss on early extinguishment of debt | (35.4 | ) | — | |||||||||
Other-than-temporary impairment loss on investment in CS&L common stock | (181.9 | ) | — | |||||||||
Interest expense | (219.7 | ) | (141.1 | ) | ||||||||
Loss before income taxes | (262.4 | ) | (21.8 | ) | ||||||||
Income tax benefit | (30.8 | ) | (27.4 | ) | ||||||||
Net (loss) income | $ | (231.6 | ) | $ | 5.6 | |||||||
See the accompanying notes to the unaudited interim consolidated financial statements.
7
WINDSTREAM SERVICES, LLC
CONSOLIDATED STATEMENTS OF COMPREHENSIVE INCOME (UNAUDITED)
Three Months Ended March 31, | ||||||||||||
(Millions) | 2016 | 2015 | ||||||||||
Net (loss) income | $ | (231.6 | ) | $ | 5.6 | |||||||
Other comprehensive income (loss): | ||||||||||||
Available-for-sale securities: | ||||||||||||
Unrealized holding gain arising during the period | 104.6 | — | ||||||||||
Other-than-temporary impairment loss recognized in the period | 181.9 | — | ||||||||||
Change in available-for-sale securities | 286.5 | — | ||||||||||
Interest rate swaps: | ||||||||||||
Unrealized loss on designated interest rate swaps | (8.3 | ) | (8.6 | ) | ||||||||
Amortization of unrealized losses on de-designated interest rate swaps | 1.2 | 3.4 | ||||||||||
Income tax benefit | 2.7 | 2.0 | ||||||||||
Change in interest rate swaps | (4.4 | ) | (3.2 | ) | ||||||||
Postretirement and pension plans: | ||||||||||||
Plan curtailment | (5.5 | ) | — | |||||||||
Amounts included in net periodic benefit cost: | ||||||||||||
Amortization of net actuarial loss | 0.1 | 0.2 | ||||||||||
Amortization of prior service credits | (0.5 | ) | (1.3 | ) | ||||||||
Income tax benefit | 2.3 | 0.2 | ||||||||||
Change in postretirement and pension plans | (3.6 | ) | (0.9 | ) | ||||||||
Other comprehensive income (loss) | 278.5 | (4.1 | ) | |||||||||
Comprehensive income | $ | 46.9 | $ | 1.5 | ||||||||
See the accompanying notes to the unaudited interim consolidated financial statements.
8
WINDSTREAM SERVICES, LLC
CONSOLIDATED BALANCE SHEETS (UNAUDITED)
(Millions, except number of shares) | March 31, 2016 | December 31, 2015 | ||||||
Assets | ||||||||
Current Assets: | ||||||||
Cash and cash equivalents | $ | 74.6 | $ | 31.3 | ||||
Accounts receivable (less allowance for doubtful | ||||||||
accounts of $30.6 and $33.1, respectively) | 636.1 | 643.9 | ||||||
Inventories | 79.4 | 79.5 | ||||||
Prepaid expenses and other | 149.9 | 120.6 | ||||||
Total current assets | 940.0 | 875.3 | ||||||
Goodwill | 4,213.6 | 4,213.6 | ||||||
Other intangibles, net | 1,457.2 | 1,504.7 | ||||||
Net property, plant and equipment | 5,255.7 | 5,279.8 | ||||||
Investment in CS&L common stock | 653.8 | 549.2 | ||||||
Other assets | 90.9 | 95.5 | ||||||
Total Assets | $ | 12,611.2 | $ | 12,518.1 | ||||
Liabilities and Member Equity | ||||||||
Current Liabilities: | ||||||||
Current maturities of long-term debt | $ | 11.9 | $ | 5.9 | ||||
Current portion of long-term lease obligations | 156.6 | 152.7 | ||||||
Accounts payable | 323.6 | 430.1 | ||||||
Advance payments and customer deposits | 193.9 | 193.9 | ||||||
Payable to Windstream Holdings, Inc. | 14.9 | 15.1 | ||||||
Accrued taxes | 71.6 | 84.1 | ||||||
Accrued interest | 118.1 | 78.4 | ||||||
Other current liabilities | 259.0 | 306.9 | ||||||
Total current liabilities | 1,149.6 | 1,267.1 | ||||||
Long-term debt | 5,433.1 | 5,164.6 | ||||||
Long-term lease obligations | 4,959.8 | 5,000.4 | ||||||
Deferred income taxes | 254.9 | 287.4 | ||||||
Other liabilities | 476.1 | 492.2 | ||||||
Total liabilities | 12,273.5 | 12,211.7 | ||||||
Commitments and Contingencies (See Note 13) | ||||||||
Member Equity: | ||||||||
Additional paid-in capital | 584.7 | 600.3 | ||||||
Accumulated other comprehensive loss | (5.9 | ) | (284.4 | ) | ||||
Accumulated deficit | (241.1 | ) | (9.5 | ) | ||||
Total member equity | 337.7 | 306.4 | ||||||
Total Liabilities and Member Equity | $ | 12,611.2 | $ | 12,518.1 | ||||
See the accompanying notes to the unaudited interim consolidated financial statements.
9
WINDSTREAM SERVICES, LLC
CONSOLIDATED STATEMENTS OF CASH FLOWS (UNAUDITED)
Three Months Ended March 31, | ||||||||
(Millions) | 2016 | 2015 | ||||||
Cash Flows from Operating Activities: | ||||||||
Net (loss) income | $ | (231.6 | ) | $ | 5.6 | |||
Adjustments to reconcile net (loss) income to net cash provided from operations: | ||||||||
Depreciation and amortization | 304.8 | 340.7 | ||||||
Provision for doubtful accounts | 9.7 | 10.3 | ||||||
Share-based compensation expense | 13.7 | 14.8 | ||||||
Deferred income taxes | (27.5 | ) | (33.8 | ) | ||||
Other-than-temporary impairment loss on investment in CS&L common stock | 181.9 | — | ||||||
Noncash portion of net loss on early extinguishment of debt | (7.4 | ) | — | |||||
Amortization of unrealized losses on de-designated interest rate swaps | 1.2 | 3.4 | ||||||
Plan curtailment | (5.5 | ) | — | |||||
Other, net | (15.3 | ) | 6.9 | |||||
Changes in operating assets and liabilities, net | ||||||||
Accounts receivable | (2.0 | ) | (33.3 | ) | ||||
Prepaid income taxes | (5.8 | ) | 7.8 | |||||
Prepaid expenses and other | (6.0 | ) | (24.8 | ) | ||||
Accounts payable | (100.2 | ) | (64.2 | ) | ||||
Accrued interest | 39.8 | 67.4 | ||||||
Accrued taxes | (12.5 | ) | (10.9 | ) | ||||
Other current liabilities | 4.2 | (43.2 | ) | |||||
Other liabilities | (10.0 | ) | (2.6 | ) | ||||
Other, net | (4.0 | ) | — | |||||
Net cash provided from operating activities | 127.5 | 244.1 | ||||||
Cash Flows from Investing Activities: | ||||||||
Additions to property, plant and equipment | (263.8 | ) | (189.3 | ) | ||||
Proceeds from the sale of property | 6.2 | — | ||||||
Grant funds received for broadband stimulus projects | — | 7.4 | ||||||
Network expansion funded by Connect America Fund - Phase I | — | (8.3 | ) | |||||
Change in restricted cash | — | (0.4 | ) | |||||
Other, net | — | (2.1 | ) | |||||
Net cash used in investing activities | (257.6 | ) | (192.7 | ) | ||||
Cash Flows from Financing Activities: | ||||||||
Distributions to Windstream Holdings, Inc. | (44.1 | ) | (151.8 | ) | ||||
Repayments of debt and swaps | (985.3 | ) | (325.4 | ) | ||||
Proceeds of debt issuance | 1,278.0 | 490.0 | ||||||
Debt issuance costs | (10.7 | ) | — | |||||
Payments under long-term lease obligations | (36.8 | ) | — | |||||
Payments under capital lease obligations | (19.8 | ) | (11.2 | ) | ||||
Other, net | (7.9 | ) | (6.8 | ) | ||||
Net cash provided from (used in) financing activities | 173.4 | (5.2 | ) | |||||
Increase in cash and cash equivalents | 43.3 | 46.2 | ||||||
Cash and Cash Equivalents: | ||||||||
Beginning of period | 31.3 | 27.8 | ||||||
End of period | $ | 74.6 | $ | 74.0 | ||||
Supplemental Cash Flow Disclosures: | ||||||||
Interest paid | $ | 178.6 | $ | 74.7 | ||||
Income taxes paid (refunded), net | $ | 6.5 | $ | (1.2 | ) | |||
See the accompanying notes to the unaudited interim consolidated financial statements.
10
WINDSTREAM SERVICES, LLC
CONSOLIDATED STATEMENT OF MEMBER EQUITY (UNAUDITED)
(Millions) | Additional Paid-In Capital | Accumulated Other Comprehensive Loss | Accumulated Deficit | Total | ||||||||||||
Balance at December 31, 2015 | $ | 600.3 | $ | (284.4 | ) | $ | (9.5 | ) | $ | 306.4 | ||||||
Net loss | — | — | (231.6 | ) | (231.6 | ) | ||||||||||
Other comprehensive income (loss), net of tax: | ||||||||||||||||
Change in available-for-sale securities | — | 286.5 | — | 286.5 | ||||||||||||
Change in postretirement and pension plans | — | (3.6 | ) | — | (3.6 | ) | ||||||||||
Amortization of unrealized losses on de-designated interest rate swaps | — | 0.7 | — | 0.7 | ||||||||||||
Change in designated interest rate swaps | — | (5.1 | ) | — | (5.1 | ) | ||||||||||
Comprehensive income (loss) | — | 278.5 | (231.6 | ) | 46.9 | |||||||||||
Share-based compensation expense (See Note 6) | 6.6 | — | — | 6.6 | ||||||||||||
Stock options exercised | 0.4 | — | — | 0.4 | ||||||||||||
Stock issued for management incentive compensation plans (See Note 6) | 5.5 | — | — | 5.5 | ||||||||||||
Stock issued to employee savings plan (See Note 5) | 24.0 | — | — | 24.0 | ||||||||||||
Taxes withheld on vested restricted stock and other | (8.3 | ) | — | — | (8.3 | ) | ||||||||||
Distributions payable to Windstream Holdings, Inc. | (43.8 | ) | — | — | (43.8 | ) | ||||||||||
Balance at March 31, 2016 | $ | 584.7 | $ | (5.9 | ) | $ | (241.1 | ) | $ | 337.7 | ||||||
See the accompanying notes to the unaudited interim consolidated financial statements.
11
NOTES TO UNAUDITED INTERIM CONSOLIDATED FINANCIAL STATEMENTS
1. Preparation of Interim Financial Statements:
In these consolidated financial statements, unless the context requires otherwise, the use of the terms “Windstream,” “we,” “us” or “our” shall refer to Windstream Holdings, Inc. and its subsidiaries, including Windstream Services, LLC, and the term “Windstream Services” shall refer to Windstream Services, LLC and its subsidiaries.
Organizational Structure –Windstream Holdings, Inc. (“Windstream Holdings”) is a publicly traded holding company and the parent of Windstream Services, LLC (“Windstream Services”). Windstream Holdings common stock trades on the NASDAQ Global Select Market (“NASDAQ”) under the ticker symbol “WIN”. Windstream Holdings owns a 100 percent interest in Windstream Services. Windstream Services and its guarantor subsidiaries are the sole obligors of all outstanding debt obligations and, as a result also file periodic reports with the Securities and Exchange Commission (“SEC”). Windstream Holdings is not a guarantor of nor subject to the restrictive covenants included in any of Windstream Services’ debt agreements. The Windstream Holdings board of directors and officers oversee both companies.
Description of Business – We are a leading provider of advanced network communications and technology solutions for consumers, businesses, enterprise organizations and carrier partners across the United States. We offer bundled services, including broadband, security solutions, voice and digital television to consumers. We also provide data, cloud solutions, unified communications and managed services to business and enterprise clients. We supply core transport solutions on a local and long-haul fiber-optic network spanning approximately 125,000 miles.
Enterprise service revenues include revenues from integrated voice and data services, advanced data, traditional voice and long-distance services provided to enterprise customers. Consumer service revenues are generated from the provisioning of high-speed Internet, voice and video services to consumers. Small business service revenues include revenues from integrated voice and data services, advanced data and traditional voice and long-distance services provided to small business customers. Carrier revenues include revenues from other carriers for special access circuits and fiber connections as well as voice and data services sold on a wholesale basis. Regulatory revenues include switched access revenues, federal and state Universal Service Fund (“USF”) revenues and amounts received from Connect America Fund - Phase II. Other service revenues include USF surcharge revenues, other miscellaneous services and consumer revenues generated in markets where we lease the connection to the customer premise.
Basis of Presentation – The accompanying unaudited consolidated financial statements have been prepared based upon SEC rules that permit reduced disclosure for interim periods. Certain information and footnote disclosures have been condensed or omitted in accordance with those rules and regulations. The accompanying consolidated balance sheet as of December 31, 2015, was derived from audited financial statements, but does not include all disclosures required by accounting principles generally accepted in the United States. In our opinion, these financial statements reflect all adjustments that are necessary for a fair presentation of results of operations and financial condition for the interim periods shown including normal recurring accruals and other items. The results for the interim periods are not necessarily indicative of results for the full year. For a more complete discussion of significant accounting policies and certain other information, this report should be read in conjunction with the consolidated financial statements and accompanying notes included in our Annual Report on Form 10-K for the year ended December 31, 2015, which was filed with the SEC on February 25, 2016.
Windstream Holdings and its domestic subsidiaries, including Windstream Services, file a consolidated federal income tax return. As such, Windstream Services and its subsidiaries are not separate taxable entities for federal and certain state income tax purposes. In instances when Windstream Services does not file a separate return, income taxes as presented within the accompanying consolidated financial statements attribute current and deferred income taxes of Windstream Holdings to Windstream Services and its subsidiaries in a manner that is systematic, rational and consistent with the asset and liability method. Income tax provisions presented for Windstream Services and its subsidiaries are prepared under the “separate return method.” The separate return method represents a hypothetical computation assuming that the reported revenue and expenses of Windstream Services and its subsidiaries were incurred by separate taxable entities.
The preparation of financial statements, in accordance with accounting principles generally accepted in the United States (“U.S. GAAP”), requires management to make estimates and assumptions that affect the reported amounts of assets, liabilities, revenues and expenses and disclosure of contingent assets and liabilities. The estimates and assumptions used in the accompanying consolidated financial statements are based upon management’s evaluation of the relevant facts and circumstances as of the date of the consolidated financial statements. Actual results may differ from the estimates and assumptions used in preparing the accompanying consolidated financial statements, and such differences could be material.
12
NOTES TO UNAUDITED INTERIM CONSOLIDATED FINANCIAL STATEMENTS
____
1. Preparation of Interim Financial Statements, Continued:
There are no significant differences between the consolidated results of operations, financial condition, and cash flows of Windstream Holdings and those of Windstream Services other than for certain expenses incurred directly by Windstream Holdings principally consisting of audit, legal and board of director fees, NASDAQ listing fees, other shareholder-related costs, income taxes, common stock activity, and payables from Windstream Services to Windstream Holdings. Earnings per share data has not been presented for Windstream Services, because that entity has not issued publicly held common stock as defined in accordance with U.S. GAAP. Unless otherwise indicated, the note disclosures included herein pertain to both Windstream Holdings and Windstream Services.
Certain prior year amounts have been reclassified to conform to the current year financial statement presentation. These changes and reclassifications did not impact net (loss) income or comprehensive income.
Recently Issued Authoritative Guidance
Revenue Recognition – In May 2014, the Financial Accounting Standards Board (“FASB”) issued Accounting Standards Update (“ASU”) No. 2014-09, Revenue from Contracts with Customers. The standard outlines a single comprehensive revenue recognition model for entities to follow in accounting for revenue from contracts with customers and supersedes most current revenue recognition guidance, including industry-specific guidance. The core principle of the revenue model is that an entity should recognize revenue for the transfer of promised goods or services to customers in an amount that reflects the consideration to which the entity expects to be entitled to receive for those goods or services. ASU 2014-09 also includes new accounting principles related to the deferral and amortization of contract acquisition and fulfillment costs. ASU 2014-09 may be adopted by applying the provisions of the new standard on a retrospective basis to all periods presented in the financial statements or on a modified retrospective basis which would result in the recognition of a cumulative effect adjustment in the year of adoption. When issued, ASU 2014-09 was to be effective for annual periods beginning after December 15, 2016 and interim periods within those annual periods. Early adoption was not permitted.
In July 2015, the FASB deferred the effective date of ASU 2014-09 by one year to December 15, 2017 for annual reporting periods beginning after that date, or January 1, 2018, for calendar companies like Windstream. Entities are permitted to early adopt the standard, but not before the original effective date of December 15, 2016. We are in the process of determining the method of adoption and assessing the impact the new standard will have on our consolidated financial statements. We expect to adopt this standard effective January 1, 2018.
In March 2016, FASB issued ASU 2016-08, Revenue from Contracts with Customers (Topic 606): Principal versus Agent Considerations (Reporting Revenue Gross versus Net). The amendments are intended to improve the operability and understandability of the implementation guidance on principal versus agent considerations. The effective date for this ASU is the same as the effective date for ASU 2014-09. In conjunction with our assessment of ASU 2014-09, we are currently evaluating the impacts of this new guidance.
Fair Value Measurement Disclosures – In May 2015, the FASB issued ASU No. 2015-07, Disclosures for Investments in Certain Entities That Calculate Net Asset Value Per Share (or Its Equivalent), which amends certain fair value measurement disclosures. The standard removes the requirement to categorize within the fair value hierarchy investments for which fair value is measured using the net asset value per share practical expedient and also removes certain related disclosure requirements. ASU 2015-07 is effective retrospectively for fiscal years, and interim periods within those years, beginning after December 31, 2015, with early adoption permitted.
Pension Plan Investment Disclosures – In July 2015, the FASB issued ASU No. 2015-12, Plan Accounting: Defined Benefit Pension Plans (Topic 960), Defined Contribution Plans (Topic 962), Health and Welfare Benefit Plans (Topic 965). This standard eliminates the requirement to measure the fair value of fully benefit-responsive investment contracts and provide the related fair value disclosures. Under the new guidance, fully benefit-responsive investment contracts will be measured and disclosed only at contract value. The standard also eliminates certain disclosure requirements related to an employee benefit plan’s investments presented in the plan’s standalone financial statements. ASU 2015-12 is effective retrospectively for fiscal years beginning after December 31, 2015, with early adoption permitted. Adoption of ASU 2015-07 and 2015-12 will impact certain annual disclosures related to our qualified pension plan assets, but otherwise is not expected to have a material impact on our consolidated financial statements.
13
NOTES TO UNAUDITED INTERIM CONSOLIDATED FINANCIAL STATEMENTS
____
1. Preparation of Interim Financial Statements, Continued:
Valuation of Inventory – In July 2015, the FASB issued ASU No. 2015-11, Simplifying the Measurement of Inventory. The updated guidance requires that an entity should measure inventory valued using a first-in, first-out or average cost method at the lower of cost and net realizable value. Net realizable value is defined as the estimated selling price in the ordinary course of business, less reasonably predictable costs of completion, disposal, and transportation. ASU 2015-11 should be applied on a prospective basis and is effective for fiscal years, and interim periods within those years, beginning after December 15, 2016, with early adoption permitted. We are currently assessing the timing of adoption of ASU 2015-11, however, we do not expect it to have a material impact to our consolidated results of operations, financial position or cash flows.
Leases – In February 2016, the FASB issued ASU 2016-02, Leases, which will require that virtually all lease arrangements that do not meet the criteria of a short-term lease be presented on the lessee’s balance sheet by recording a right-of-use asset and a lease liability equal to the present value of the related future lease payments. The income statement impacts of the leases will depend on the nature of the leasing arrangement and will be similar to existing accounting for operating and capital leases. The new standard does not substantially change the accounting for lessors. The new standard will also require additional disclosures regarding an entity’s leasing arrangements and will be effective for the first interim reporting period within annual periods beginning after December 15, 2018, although early adoption is permitted. Lessees and lessors will be required to apply the new standard at the beginning of the earliest period presented in the financial statements in which they first apply the new guidance, using a modified retrospective transition method. We are currently assessing the timing of adoption and the impact the new standard will have on our consolidated financial statements.
Derivatives and Hedging – In March 2016, the FASB issued ASU 2016-05, Derivatives and Hedging (Topic 815): Effect of Derivative Contract Novations on Existing Hedge Accounting Relationships (a consensus of the Emerging Issues Task Force). ASU 2016-05 clarifies that a change in the counterparty to a derivative instrument that has been designated as the hedging instrument does not, in and of itself, require de-designation of that hedging relationship provided that all other hedge accounting criteria continue to be met. ASU 2016-05 is effective for fiscal years beginning after December 15, 2016, and interim periods within those fiscal years. Early adoption is permitted. We do not expect that the adoption of ASU 2016-05 will have a material impact on our consolidated financial statements.
Employee Share-Based Payment Accounting – In March 2016, the FASB issued ASU 2016-09, Improvements to Employee Share-Based Payment Accounting, which simplifies several aspects of the accounting for employee share-based payment transactions, including the accounting for income taxes, forfeitures, and statutory tax withholding requirements, as well as classification in the statement of cash flows. Under the new guidance all excess tax benefits and tax deficiencies, including tax benefits of dividends on share-based payment awards, should be recognized as income tax expense or benefit in the income statement, eliminating the notion of the APIC pool. The excess tax benefits will be classified as operating activities along with other income tax cash flows rather than financing activities in the statement of cash flows. The tax effects of exercised or vested awards should be treated as discrete items in the reporting period in which they occur. ASU 2016-19 also allows entities to elect to either estimate the total number of awards that are expected to vest or account for forfeitures when they occur. Additionally, ASU 2016-09 clarifies that cash payments to tax authorities in connection with shares withheld to meet statutory tax withholding requirements should be presented as a financing activity in the statement of cash flows. ASU 2016-09 is effective for annual reporting periods beginning after December 15, 2016, including interim periods within those annual reporting periods. Early adoption is permitted. We are currently assessing the timing of adoption and the impact the new standard will have on our consolidated financial statements.
14
NOTES TO UNAUDITED INTERIM CONSOLIDATED FINANCIAL STATEMENTS
____
2. Long-term Debt:
Windstream Holdings has no debt obligations. All debt, including the senior secured credit facility described below, have been incurred by Windstream Services and its subsidiaries. Windstream Holdings is neither a guarantor of nor subject to the restrictive covenants imposed by such debt.
Long-term debt was as follows at:
(Millions) | March 31, 2016 | December 31, 2015 | ||||||
Issued by Windstream Services: | ||||||||
Senior secured credit facility, Tranche B5 – variable rates, due August 8, 2019 | $ | 576.7 | $ | 578.2 | ||||
Senior secured credit facility, Tranche B6 – variable rates, due March 29, 2021 (a) | 600.0 | — | ||||||
Senior secured credit facility, Revolving line of credit – variable rates, due April 24, 2020 | 588.0 | 300.0 | ||||||
Debentures and notes, without collateral: | ||||||||
2017 Notes – 7.875%, due November 1, 2017 | 369.5 | 904.1 | ||||||
2020 Notes – 7.750%, due October 15, 2020 | 700.0 | 700.0 | ||||||
2021 Notes – 7.750%, due October 1, 2021 | 887.3 | 920.4 | ||||||
2022 Notes – 7.500%, due June 1, 2022 | 468.9 | 485.9 | ||||||
2023 Notes – 7.500%, due April 1, 2023 | 529.5 | 540.1 | ||||||
2023 Notes – 6.375%, due August 1, 2023 | 700.0 | 700.0 | ||||||
Issued by subsidiaries of Windstream Services: | ||||||||
Windstream Holdings of the Midwest, Inc. – 6.75%, due April 1, 2028 | 100.0 | 100.0 | ||||||
(Discount) premium on long-term debt, net (b) | (8.7 | ) | 4.6 | |||||
Unamortized debt issuance costs (b) | (66.2 | ) | (62.8 | ) | ||||
5,445.0 | 5,170.5 | |||||||
Less current maturities | (11.9 | ) | (5.9 | ) | ||||
Total long-term debt | $ | 5,433.1 | $ | 5,164.6 | ||||
(a) | If the maturity of the revolving line of credit is not extended prior to April 24, 2020, the maturity date of the Tranche B6 term loan will be April 24, 2020; provided further, if the 2020 Notes have not been repaid or refinanced prior to July 15, 2020 with indebtedness having a maturity date no earlier than March 29, 2021, the maturity date of the Tranche B6 term loan will be July 15, 2020. |
(b) | The net (discount) premium balance and unamortized debt issuance costs are amortized using the interest method over the life of the related debt instrument. |
Senior Secured Credit Facility - On March 29, 2016, Windstream Services executed an incremental amendment to its existing senior secured credit facility to provide for the issuance of an aggregate principal amount $600.0 million term loan under Tranche B6 due March 29, 2021, the proceeds of which were used to repurchase $441.1 million of outstanding 7.875 percent notes due November 1, 2017 (the “2017 Notes”) pursuant to a tender offer and to repay other debt obligations of Windstream Services along with related fees and expenses. The Tranche B6 term loan was issued at a discount of $15.0 million. Debt issuance costs associated with the Tranche B6 borrowings were $10.7 million which were capitalized and will be amortized over the life of the term loan.
On April 24, 2015, Windstream Services had amended its existing senior secured credit facility which includes a revolving line of credit in an aggregate principal amount of $1,250.0 million and Tranche B5 term loan. The amended credit facility provides that Windstream Services may seek to obtain incremental revolving or term loans in an unlimited amount subject to maintaining a maximum secured leverage ratio and other customary conditions, including obtaining commitments and pro forma compliance with financial maintenance covenants consisting of a maximum debt to consolidated earnings before interest, taxes, depreciation and amortization (“EBITDA”) ratio and a minimum interest coverage ratio. In addition, Windstream Services may request extensions of the maturity date under any of its existing revolving or term loan facilities.
15
NOTES TO UNAUDITED INTERIM CONSOLIDATED FINANCIAL STATEMENTS
____
2. Long-term Debt, Continued:
Interest rates applicable to the Tranche B5 term loan are, at Windstream Services’ option, equal to either a base rate plus a margin of 1.75 percent per annum or London Interbank Offered Rate (“LIBOR”) plus a margin of 2.75 percent per annum. LIBOR and the base rate for the Tranche B5 term loan shall at no time be less than 0.75 percent and 1.75 percent, respectively. Interest rates applicable to the Tranche B6 are, at Windstream Services’ option, equal to either a base rate plus a margin of 4.00 percent per annum or LIBOR plus a margin of 5.00 percent per annum. LIBOR and the base rate for the Tranche B6 term loan shall at no time be less than 0.75 percent and 4.00 percent, respectively. Tranche B5 and B6 term loans made under the credit facility are subject to quarterly amortization payments in an aggregate amount equal to 0.25 percent of the initial principal amount of such term loans, with the remaining balance payable on August 8, 2019 and March 29, 2021, respectively. The senior secured credit facility is guaranteed, jointly and severally, by certain of Windstream Services’ wholly owned subsidiaries.
Revolving line of credit - As a result of the April 24, 2015 amendment to the credit facility, the maturity date of the revolving line of credit was extended to April 24, 2020. Windstream Services may obtain revolving loans and may issue up to $30.0 million of letters of credit, which upon issuance reduce the amount available for other extensions of credit. Accordingly, the total amount outstanding under the letters of credit and the indebtedness incurred under the revolving line of credit may not exceed $1,250.0 million. Borrowings under the revolving line of credit may be used for permitted acquisitions, working capital and other general corporate purposes of Windstream Services and its subsidiaries. Windstream Services will pay a commitment fee on the unused portion of the commitments under the revolving credit facility that will range from 0.40 percent to 0.50 percent per annum, depending on the debt to consolidated EBITDA ratio of Windstream Services and its subsidiaries. Revolving loans made under the credit facility are not subject to interim amortization and such loans are not required to be repaid prior to April 24, 2020, other than to the extent the outstanding borrowings exceed the aggregate commitments under the revolving credit facility. Interest rates applicable to loans under the revolving line of credit are, at Windstream Services’ option, equal to either a base rate plus a margin ranging from 0.25 percent to 1.00 percent per annum or LIBOR plus a margin ranging from 1.25 percent to 2.00 percent per annum, based on the debt to consolidated EBITDA ratio of Windstream Services and its subsidiaries.
During the first three months of 2016, Windstream Services borrowed $693.0 million under the revolving line of credit in its senior secured credit facility and repaid $405.0 million of these borrowings through March 31, 2016. Considering letters of credit of $23.1 million, the amount available for borrowing under the revolving line of credit was $638.9 million at March 31, 2016.
During the first three months of 2016, the variable interest rate on the revolving line of credit ranged from 2.25 percent to 4.50 percent, and the weighted average rate on amounts outstanding was 2.52 percent during the period. Comparatively, the variable interest rate ranged from 2.41 percent to 4.50 percent during the first three months of 2015, with a weighted average rate on amounts outstanding during the period of 2.52 percent.
Debentures and Notes Repaid in 2016
Partial Repurchase of Senior Notes - Pursuant to a debt repurchase program authorized by Windstream Services’ board of directors, during the first quarter of 2016, Windstream Services repurchased in the open market $154.2 million aggregate principal amount of its senior unsecured notes consisting of the following:
• | $93.5 million aggregate principal amount of 7.875 percent senior unsecured notes due November 1, 2017, (the “2017 Notes”) at a repurchase price of $97.8 million, including accrued and unpaid interest; |
• | $33.1 million aggregate principal amount of 7.750 percent senior unsecured notes due October 1, 2021, (the “2021 Notes”), at a repurchase price of $26.0 million, including accrued and unpaid interest; |
• | $17.0 million aggregate principal amount of 7.500 percent senior unsecured notes due June 1, 2022, (the “2022 Notes”), at a repurchase price of $13.1 million, including accrued and unpaid interest; and |
• | $10.6 million aggregate principal amount of 7.500 percent senior unsecured notes due April 1, 2023, (the “2023 Notes”) at a repurchase price of $8.0 million, including accrued and unpaid interest. |
At the time of repurchase, there was $9.4 million in unamortized net discount and debt issuance costs related to the repurchased notes. The repurchases were funded utilizing available borrowings under the amended revolving line of credit.
16
NOTES TO UNAUDITED INTERIM CONSOLIDATED FINANCIAL STATEMENTS
____
2. Long-term Debt, Continued:
Tender Offer for 2017 Notes - On March 29, 2016, Windstream Services repurchased $441.1 million aggregate principal amount of the 2017 Notes for total consideration of $477.5 million, plus accrued interest, pursuant to a cash tender offer announced on March 14, 2016. Under the tender offer, Windstream Services paid total consideration of $1,082.50 per $1,000 principal amount of the 2017 Notes, which included a $30 early tender payment, plus accrued and unpaid interest. Windstream Services had accepted for payment the maximum principal amount of 2017 Notes contemplated under the tender offer, and as a result, no additional notes were repurchased under the tender offer which expired on April 11, 2016.
Net Loss on Early Extinguishment of Debt
The net loss on early extinguishment of debt was as follows for the three month period ended March 31, 2016:
(Millions) | ||||||||
Partial repurchases of 2017 Notes: | ||||||||
Premium on repurchases | $ | (40.6 | ) | |||||
Third-party fees for repurchases | (2.2 | ) | ||||||
Unamortized net discount on original issuance | (2.0 | ) | ||||||
Unamortized debt issuance costs on original issuance | (3.7 | ) | ||||||
Loss on early extinguishment from partial repurchases of 2017 Notes | (48.5 | ) | ||||||
Partial repurchases of 2021, 2022 and 2023 Notes: | ||||||||
Discount on repurchases | 13.6 | |||||||
Unamortized net premium on original issuance | 0.3 | |||||||
Unamortized debt issuance costs on original issuance | (0.8 | ) | ||||||
Gain on early extinguishment from partial repurchases of 2021, 2022 and 2023 Notes | 13.1 | |||||||
Net loss on early extinguishment of debt | $ | (35.4 | ) | |||||
Windstream Services repurchased a portion of its 2017 Notes during the first quarter of 2016. The partial repurchase was accounted for as an extinguishment, and accordingly, Windstream Services recognized a pre-tax loss of $(48.5) million.
Windstream Services repurchased in the open market certain of its senior unsecured notes representing an aggregate principal amount of $154.2 million. The partial repurchase was accounted for under the extinguishment method of accounting, and as a result, Windstream Services recognized a pretax gain of $13.1 million.
Maturities for long-term debt outstanding as of March 31, 2016, excluding $(8.7) million of unamortized net discount and $66.2 million of unamortized debt issuance costs, were as follows:
Twelve month period ended: | (Millions) | ||
March 31, 2017 | $ | 11.9 | |
March 31, 2018 | 381.4 | ||
March 31, 2019 | 11.9 | ||
March 31, 2020 | 565.0 | ||
March 31, 2021 | 1,864.0 | ||
Thereafter | 2,685.7 | ||
Total | $ | 5,519.9 | |
17
NOTES TO UNAUDITED INTERIM CONSOLIDATED FINANCIAL STATEMENTS
____
2. Long-term Debt, Continued:
Interest Expense
Interest expense was as follows for the three month periods ended March 31:
(Millions) | 2016 | 2015 | |||||||||||
Interest expense - long-term debt | $ | 91.5 | $ | 133.6 | |||||||||
Interest expense - long-term lease obligations: | |||||||||||||
Telecommunications network assets | 126.9 | — | |||||||||||
Real estate contributed to pension plan | 1.5 | 1.7 | |||||||||||
Impact of interest rate swaps | 2.8 | 6.6 | |||||||||||
Interest on capital leases and other | 0.6 | 0.7 | |||||||||||
Less capitalized interest expense | (3.6 | ) | (1.5 | ) | |||||||||
Total interest expense | $ | 219.7 | $ | 141.1 | |||||||||
Debt Compliance
The terms of Windstream Services’ credit facility and indentures include customary covenants that, among other things, require maintenance of certain financial ratios and restrict Windstream Services’ ability to incur additional indebtedness. These financial ratios include a maximum leverage ratio of 4.5 to 1.0 and a minimum interest coverage ratio of 2.75 to 1.0. In addition, the covenants include restrictions on dividend and certain other types of payments. As of March 31, 2016, Windstream Services was in compliance with all of these covenants.
In addition, certain of Windstream Services’ debt agreements contain various covenants and restrictions specific to the subsidiary that is the legal counterparty to the agreement. Under Windstream Services’ long-term debt agreements, acceleration of principal payments would occur upon payment default, violation of debt covenants not cured within 30 days, a change in control including a person or group obtaining 50 percent or more ownership interest in Windstream Services, or breach of certain other conditions set forth in the borrowing agreements. Windstream Services and its subsidiaries were in compliance with these covenants as of March 31, 2016.
3. Derivatives:
Windstream Services enters into interest rate swap agreements to mitigate the interest rate risk inherent in its variable rate senior secured credit facility. Derivative instruments are accounted for in accordance with authoritative guidance for recognition, measurement and disclosures about derivative instruments and hedging activities, including when a derivative or other financial instrument can be designated as a hedge. This guidance requires recognition of all derivative instruments at fair value, and accounting for the changes in fair value depends on whether the derivative has been designated as, qualifies as and is effective as a hedge. Changes in fair value of the effective portions of cash flow hedges are recorded as a component of other comprehensive income (loss) in the current period. Any ineffective portion of the hedges is recognized in earnings in the current period.
As of March 31, 2016 and December 31, 2015, Windstream Services was party to three pay fixed, receive variable interest rate swap agreements to serve as cash flow hedges of the interest rate risk inherent in its senior secured credit facility. The swaps have a notional value of $675.0 million and are scheduled to mature on October 17, 2019. The average fixed interest rate paid is 3.604 percent and includes a component which serves to settle the liability existing on Windstream Services swaps at the time of the transaction. The variable rate received resets on the seventeenth day of each month to the one-month London Interbank Offered Rate (“LIBOR”). The swaps are hedging probable variable cash flows which extend up to one year beyond the maturity of certain components of Windstream Services’ variable rate debt. Consistent with past practice, Windstream Services expects to extend or otherwise replace these components of its debt with variable rate debt. The swaps are off-market swaps, meaning they contain an embedded financing element, which the swap counterparties recover through an incremental charge in the fixed rate over what would be charged for an at-market swap. As such, a portion of the cash payment on the swaps represents the rate that Windstream Services would pay on a hypothetical at-market interest rate swap and is recognized in interest expense. The remaining portion represents the repayment of the embedded financing element and reduces the initial swap liability.
18
NOTES TO UNAUDITED INTERIM CONSOLIDATED FINANCIAL STATEMENTS
____
3. Derivatives, Continued:
As a result of refinancing transactions completed in 2013 and April 2015, Windstream Services de-designated certain interest rate swaps and froze the accumulated net gains and losses in accumulated other comprehensive loss related to these swaps. The frozen balance is amortized from accumulated other comprehensive loss to interest expense over the remaining life of the original swaps. All derivative instruments are recognized at fair value in the accompanying consolidated balance sheets as either assets or liabilities, depending on the rights or obligations under the related contracts.
Set forth below is information related to interest rate swap agreements:
(Millions, except for percentages) | March 31, 2016 | December 31, 2015 | ||||||
Designated portion, measured at fair value: | ||||||||
Other current liabilities | $ | 18.5 | $ | 18.3 | ||||
Other non-current liabilities | $ | 38.6 | $ | 33.4 | ||||
Accumulated other comprehensive loss | $ | (9.2 | ) | $ | (0.9 | ) | ||
De-designated portion, unamortized value: | ||||||||
Accumulated other comprehensive income (loss) | $ | 0.9 | $ | (0.2 | ) | |||
Weighted average fixed rate paid | 2.96 | % | 2.99 | % | ||||
Variable rate received | 0.44 | % | 0.35 | % | ||||
Derivatives are assessed for effectiveness each quarter and any ineffectiveness is recognized in other expense, net in our consolidated statements of operations. Ineffectiveness recognized on the cash flow hedges was $(0.5) million and $(2.3) million for the three month periods ended March 31, 2016 and 2015, respectively.
All or a portion of the change in fair value of Windstream Services’ interest rate swap agreements recorded in accumulated other comprehensive loss may be recognized in earnings in certain situations. If Windstream Services extinguishes all of its variable rate debt, or a portion of its variable rate debt such that the variable rate interest received on the swaps exceeds the variable rate interest paid on its debt, all or a portion of the change in fair value of the swaps may be recognized in earnings. In addition, the change in fair value of the swaps may be recognized in earnings if Windstream Services determines it is no longer probable that it will have future variable rate cash flows to hedge against or if a swap agreement is terminated prior to maturity. Windstream Services has assessed the counterparty risk and determined that no substantial risk of default exists as of March 31, 2016. Each counterparty is a bank with a current credit rating at or above A, as determined by Moody’s Investors Service, Standard & Poor’s Corporation and Fitch Ratings.
Windstream Services expects to recognize losses of $(7.0) million, net of taxes, in interest expense in the next twelve months related to the unamortized value of the de-designated portion of interest rate swap agreements and the interest settlements for the three remaining interest swap agreements at March 31, 2016. Payments on the swaps are presented in the financing activities section of the accompanying consolidated statements of cash flows due to the embedded financing element discussed above.
Changes in the value of these derivative instruments were as follows for the three month periods ended March 31:
(Millions) | 2016 | 2015 | ||||||
Changes in fair value of effective portion, net of tax (a) | $ | (5.1 | ) | $ | (5.2 | ) | ||
Amortization of unrealized losses on de-designated interest rate swaps, net of tax (a) | $ | 0.7 | $ | 2.0 | ||||
(a) | Included as a component of other comprehensive income (loss) and will be reclassified into earnings as the hedged transaction affects earnings. |
The agreements with each of the derivative counterparties contain cross-default provisions, whereby if Windstream Services were to default on certain indebtedness, it could also be declared in default on its derivative obligations and may be required to net settle any outstanding derivative liability positions with its counterparties at the swap termination value of $61.7 million including accrued interest and excluding the credit valuation adjustment to measure non-performance risk. In addition, certain of the agreements with the counterparties contain provisions where if a specified event or condition, such as a merger, occurs that materially changes Windstream Services’ creditworthiness in an adverse manner, Windstream Services may be required to fully collateralize its derivative obligations. At March 31, 2016, Windstream Services had not posted any collateral related to its interest rate swap agreements.
19
NOTES TO UNAUDITED INTERIM CONSOLIDATED FINANCIAL STATEMENTS
____
3. Derivatives, Continued:
Balance Sheet Offsetting
Windstream Services is party to master netting arrangements, which are designed to reduce credit risk by permitting net settlement of transactions with counterparties. For financial statement presentation purposes, Windstream Services does not offset assets and liabilities under these arrangements.
The following table presents the liabilities subject to an enforceable master netting arrangement as of March 31, 2016 and December 31, 2015. As of March 31, 2016 and December 31, 2015, all swap agreements with counterparties were in a liability position and, accordingly, there were no assets to be recognized in the accompanying consolidated balance sheets as of those dates.
Information pertaining to derivative liabilities was as follows:
Gross Amounts Not Offset in the Consolidated Balance Sheets | |||||||||||||||||||
(Millions) | Gross Amount of Recognized Liabilities | Net Amount of Liabilities Presented in the Consolidated Balance Sheets | Financial Instruments | Cash Collateral Received | Net Amount | ||||||||||||||
March 31, 2016: | |||||||||||||||||||
Interest rate swaps | $ | 57.1 | $ | 57.1 | $ | — | $ | — | $ | 57.1 | |||||||||
December 31, 2015: | |||||||||||||||||||
Interest rate swaps | $ | 51.7 | $ | 51.7 | $ | — | $ | — | $ | 51.7 | |||||||||
4. Fair Value Measurements:
Fair value of financial and non-financial assets and liabilities is defined as an exit price, representing the amount that would be received to sell an asset or transfer a liability in an orderly transaction between market participants. Authoritative guidance defines the following three tier hierarchy for assessing the inputs used in fair value measurements:
Level 1 – Quoted prices in active markets for identical assets or liabilities
Level 2 – Observable inputs other than quoted prices in active markets for identical assets or liabilities
Level 3 – Unobservable inputs
The highest priority is given to unadjusted quoted prices in active markets for identical assets or liabilities (level 1 measurement) and the lowest priority is given to unobservable inputs (level 3 measurement). Assets and liabilities are classified in their entirety based on the lowest level of input that is significant to the fair value measurement. Our assessment of the significance of a particular input to the fair value measurement requires judgment and may affect the valuation of fair value assets and liabilities and their placement within the fair value hierarchy levels.
Our non-financial assets and liabilities, including property, plant and equipment, goodwill, intangible assets and asset retirement obligations, are measured at fair value on a non-recurring basis. No event occurred during the three month period ended March 31, 2016 requiring these non-financial assets and liabilities to be subsequently recognized at fair value. Our financial instruments consist primarily of cash and cash equivalents, accounts receivable, investment in CS&L common stock, accounts payable, long-term debt and interest rate swaps. The carrying amount of cash, accounts receivable and accounts payable was estimated by management to approximate fair value due to the relatively short period of time to maturity for those instruments. Cash equivalents, investment in CS&L common stock, long-term debt and interest rate swaps are measured at fair value on a recurring basis. Cash equivalents were not significant as of March 31, 2016 or December 31, 2015.
20
NOTES TO UNAUDITED INTERIM CONSOLIDATED FINANCIAL STATEMENTS
____
4. Fair Value Measurements, Continued:
The fair values of the investment in CS&L common stock, interest rate swaps and long-term debt were determined using the following inputs at:
(Millions) | March 31, 2016 | December 31, 2015 | ||||||
Recorded at Fair Value in the Financial Statements: | ||||||||
Investment in CS&L common stock - Level 1 | $ | 653.8 | $ | 549.2 | ||||
Derivatives - Interest rate swap liabilities - Level 2 | $ | 57.1 | $ | 51.7 | ||||
Not Recorded at Fair Value in the Financial Statements: (a) | ||||||||
Long-term debt, including current maturities - Level 2 | $ | 4,797.5 | $ | 4,452.7 | ||||
(a) | Recognized at carrying value of $5,511.2 million and $5,233.3 million in long-term debt, including current maturities, and excluding unamortized debt issuance costs, in the accompanying consolidated balance sheets as of March 31, 2016 and December 31, 2015, respectively. |
The fair value of CS&L common stock is based on the quoted market price of the shares on the last day of the reporting period. The CS&L common stock trades on NASDAQ.
The fair values of interest rate swaps are determined based on the present value of expected future cash flows using observable, quoted LIBOR swap rates for the full term of the swaps and also incorporate credit valuation adjustments to appropriately reflect both Windstream Services’ own non-performance risk and non-performance risk of the respective counterparties. As of March 31, 2016 and December 31, 2015, the fair values of the interest rate swaps were reduced by $3.7 million and $2.9 million, respectively, to reflect non-performance risk.
In calculating the fair value of Windstream Services’ long-term debt, the fair value of the debentures and notes was calculated based on quoted market prices of the specific issuances in an active market when available. The fair value of the other debt obligations was estimated based on appropriate market interest rates applied to the debt instruments. In calculating the fair value of the Windstream Holdings of the Midwest, Inc. notes, an appropriate market price of similar instruments in an active market considering credit quality, nonperformance risk and maturity of the instrument was used.
We do not have any assets or liabilities measured for purposes of the fair value hierarchy at fair value using significant unobservable inputs (Level 3). We recognize transfers between levels of the fair value hierarchy as of the end of the reporting period. There were no transfers within the fair value hierarchy during the three month period ended March 31, 2016.
5. Employee Benefit Plans and Postretirement Benefits:
We maintain a non-contributory qualified defined benefit pension plan. Future benefit accruals for all eligible nonbargaining employees covered by the pension plan have ceased. We also maintain supplemental executive retirement plans that provide unfunded, non-qualified supplemental retirement benefits to a select group of management employees. Additionally, we provide postretirement healthcare and life insurance benefits for eligible employees. Employees share in, and we fund, the costs of these plans as benefits are paid.
The components of pension benefit income (including provision for executive retirement agreements) were as follows for the three month periods ended March 31:
(Millions) | 2016 | 2015 | ||||||||||
Benefits earned during the period | $ | 2.2 | $ | 2.4 | ||||||||
Interest cost on benefit obligation | 13.8 | 13.4 | ||||||||||
Amortization of prior service credit | (0.1 | ) | — | |||||||||
Expected return on plan assets | (16.2 | ) | (17.6 | ) | ||||||||
Net periodic benefit income | $ | (0.3 | ) | $ | (1.8 | ) | ||||||
21
NOTES TO UNAUDITED INTERIM CONSOLIDATED FINANCIAL STATEMENTS
____
5. Employee Benefit Plans and Postretirement Benefits, Continued:
The components of postretirement benefits income were as follows for the three month periods ended March 31:
(Millions) | 2016 | 2015 | ||||||||||
Interest cost on benefit obligation | $ | 0.3 | $ | 0.3 | ||||||||
Amortization of net actuarial loss | 0.1 | 0.2 | ||||||||||
Amortization of prior service credit | (0.4 | ) | (1.3 | ) | ||||||||
Plan curtailment | (5.5 | ) | — | |||||||||
Net periodic benefit income | $ | (5.5 | ) | $ | (0.8 | ) | ||||||
During the first quarter of 2016, we made changes to our postretirement medical plan, eliminating medical and prescription drug subsidies primarily for certain active participants effective March 14, 2016. As a result, we remeasured the plan and recognized curtailment gains totaling $5.5 million, which was recognized in cost of services and selling, general and administrative expenses, with the offsetting effect recorded as a reduction in accumulated other comprehensive loss.
We contributed $0.5 million to the postretirement plan during the three month period ended March 31, 2016, and expect to contribute an additional $1.6 million for postretirement benefits throughout the remainder of 2016, excluding amounts that will be funded by participant contributions to the plan. In 2016, we expect to make in cash employer contributions for pension benefits of $1.0 million to the qualified pension plan to meet our 2016 funding requirements and $0.9 million necessary to fund the expected benefit payments of our unfunded supplemental executive retirement pension plans to avoid certain benefit restrictions. The amount and timing of future contributions to our qualified pension plan are based on a myriad of factors including investment performance, changes in future discount rates and changes in the demographics of the population participating in the plan.
We also sponsor an employee savings plan under section 401(k) of the Internal Revenue Code, which covers substantially all salaried employees and certain bargaining unit employees. Windstream matches on an annual basis up to a maximum of 4.0 percent of employee pre-tax contributions to the plan for employees contributing up to 5.0 percent of their eligible pre-tax compensation. We recorded expenses of $6.5 million in the three month period ended March 31, 2016, as compared to $5.6 million for the same period in 2015 related to our matching contribution under the employee savings plan, which was included in cost of services and selling, general and administrative expenses in our consolidated statements of operations. Expense related to our 2016 matching contribution expected to be made in Windstream Holdings common stock is included in share-based compensation expense in the accompanying consolidated statements of cash flow. Additionally, we contributed 3.2 million shares of our common stock to the plan for the 2015 annual matching contribution during the three month period ended March 31, 2016. At the time of our contribution, the shares had a fair value of approximately $24.0 million as determined by the plan trustee. During 2015, we contributed 2.7 million shares of our common stock to the plan for the 2014 annual matching contribution. At the time of this contribution, the shares had a fair value of approximately $21.6 million as determined by the plan trustee.
6. Share-Based Compensation Plans:
Under the Amended and Restated 2006 Equity Incentive Plan (the “Incentive Plan”), we may issue a maximum of 24.3 million equity stock awards in the form of restricted stock, restricted stock units, stock appreciation rights or stock options. As of March 31, 2016, the Incentive Plan had remaining capacity of approximately 5.9 million awards. As of March 31, 2016, we had additional remaining capacity of approximately 0.1 million awards from a similar equity incentive plan assumed in a prior acquisition.
Our Board of Directors approves grants of restricted stock and restricted stock units to officers, executives, non-employee directors and certain management employees. These grants include the standard annual grants to these employee and director groups as a key component of their annual incentive compensation plan and one-time grants may include time-based and performance-based awards. Time-based awards generally vest over a service period of two or three years. Each recipient of the performance-based restricted stock units may vest in a number of shares from zero to 150.0 percent of their award based on attainment of certain operating targets, some of which are indexed to the performance of Standard & Poor’s 500 Stock Index, over a three-year period. The 2016 operating targets for these performance based restricted stock units were approved by the Board of Directors in February 2016. The standard annual grants to employees and directors were made in the first quarter of 2016.
22
NOTES TO UNAUDITED INTERIM CONSOLIDATED FINANCIAL STATEMENTS
____
6. Share-Based Compensation Plans, Continued:
The vesting periods and grant date fair value for restricted stock and restricted stock units issued was as follows for the three month period ended March 31, 2016:
(Number of shares in thousands, dollars in millions) | ||||
Vest ratably over a three-year service period | 1,293.3 | |||
Vest two years from date of grant, service based | 53.2 | |||
Vest contingently at the end of a three-year performance period | 1,293.3 | |||
Vest one year from date of grant, service based - granted to non-employee directors | 106.0 | |||
Total granted | 2,745.8 | |||
Grant date fair value | $ | 14.8 | ||
Restricted stock and restricted stock unit activity for the three month period ended March 31, 2016 was as follows:
(Thousands) Underlying Number of Shares | Per Share Weighted Average Fair Value | ||||||
Non-vested at December 31, 2015 | 3,553.1 | $ | 15.29 | ||||
Granted | 2,745.8 | $ | 5.38 | ||||
Vested | (1,128.9 | ) | $ | 18.38 | |||
Forfeited | (85.1 | ) | $ | 15.24 | |||
Non-vested at March 31, 2016 | 5,084.9 | $ | 9.42 | ||||
At March 31, 2016, unrecognized compensation expense totaled $37.8 million and is expected to be recognized over the weighted average vesting period of 1.6 years. Unrecognized compensation expense is included in additional paid-in capital in the accompanying consolidated balance sheets and statements of shareholders’ and member equity. Share-based compensation expense for restricted stock and restricted stock units was $6.6 million for the three month period ended March 31, 2016, as compared to $5.0 million for the same period in 2015.
In addition to including amounts related to restricted stock and restricted units, share-based compensation expense presented in the accompanying consolidated statements of cash flow also includes amounts related to certain executive and management incentive compensation plans and the matching contribution to the employee savings plan for which payments to eligible participants are expected to be made in Windstream Holdings common stock. A summary of share-based compensation expense was as follows for the three month periods ended March 31:
(Millions) | 2016 | 2015 | ||||||||||
Restricted stock and restricted units | $ | 6.6 | $ | 5.0 | ||||||||
Employee savings plan (See Note 5) | 6.5 | 5.6 | ||||||||||
Executive and management incentive compensation plans | 0.6 | 4.2 | ||||||||||
Share-based compensation expense | $ | 13.7 | $ | 14.8 | ||||||||
23
NOTES TO UNAUDITED INTERIM CONSOLIDATED FINANCIAL STATEMENTS
____
7. Merger, Integration and Restructuring Charges:
We incur costs to complete a merger or acquisition and integrate its operations into our business, which are presented as merger and integration expense in our consolidated results of operations. These costs include transaction costs, such as accounting, legal and broker fees; severance and related costs; IT and network conversion; rebranding; and consulting fees. We also incurred investment banking fees, legal, accounting and other consulting fees related to the spin-off of certain network and real estate assets into an independent, publicly traded real estate investment trust (“REIT”). During the fourth quarter of 2015, we began a network optimization project designed to consolidate traffic onto network facilities operated by us and reduce the usage of other carriers’ networks, including service areas acquired in the acquisition of PAETEC Holding, Corp. (“PAETEC”). In undertaking this initiative, which we expect to complete during 2016, we incurred costs to migrate traffic to lower cost circuits and to terminate existing contracts prior to their expiration. Costs related to the network optimization project and the REIT spin-off primarily account for the merger and integration costs incurred for the periods presented.
Restructuring charges are primarily incurred as a result of evaluations of our operating structure. Among other things, these evaluations explore opportunities to provide greater flexibility in managing and financing existing and future strategic operations, for task automation and the balancing of our workforce based on the current needs of our customers. Severance, lease exit costs and other related charges are included in restructuring charges.
During the first quarter of 2016, we incurred severance and other employee-related costs totaling $4.3 million related to the completion of several small workforce reductions. Restructuring charges in the first quarter of 2015 principally consist of $3.3 million of severance and other employee-related costs incurred in connection with completing several small workforce reductions and $3.1 million related to a special shareholder meeting held on February 20, 2015 to approve a one-for-six reverse stock split of Windstream Holdings’ common stock and the conversion of Windstream Corporation to Windstream Services.
The following is a summary of the merger, integration and restructuring charges recorded for the three month periods ended March 31:
(Millions) | 2016 | 2015 | ||||||||||
Merger and integration costs: | ||||||||||||
Information technology conversion costs | $ | — | $ | 3.5 | ||||||||
Costs related to REIT spin-off | — | 10.5 | ||||||||||
Network optimization and conversion costs | 4.2 | — | ||||||||||
Consulting and other costs | 0.8 | 0.1 | ||||||||||
Total merger and integration costs | 5.0 | 14.1 | ||||||||||
Restructuring charges | 4.4 | 7.0 | ||||||||||
Total merger, integration and restructuring charges | $ | 9.4 | $ | 21.1 | ||||||||
After giving consideration to tax benefits on deductible items, merger, integration and restructuring charges decreased net income $5.8 million for the three month period ended March 31, 2016, as compared to $13.0 million for the same period in 2015.
The following is a summary of the activity related to the liabilities associated with merger, integration and restructuring charges at March 31:
(Millions) | 2016 | |||
Balance, beginning of period | $ | 5.1 | ||
Merger, integration and restructuring charges | 9.4 | |||
Cash outlays during the period | (9.2 | ) | ||
Balance, end of period | $ | 5.3 | ||
As of March 31, 2016, unpaid merger, integration and restructuring liabilities consisted of $2.9 million associated with the restructuring initiatives and $2.4 million related to merger and integration activities. Payments of these liabilities will be funded through operating cash flows.
24
NOTES TO UNAUDITED INTERIM CONSOLIDATED FINANCIAL STATEMENTS
____
8. Other-Than-Temporary Impairment Loss on Investment in CS&L Common Stock:
In connection with the spin-off of certain telecommunications network assets, including our fiber and copper networks and other real estate, into an independent, publicly-traded REIT, Communications Sales & Leasing, Inc. (“CS&L”), completed on April 24, 2015, Windstream Services retained a passive ownership interest in approximately 19.6 percent of the common stock of CS&L. We intend to use all of the CS&L shares to retire additional Windstream Services debt within 24 months from the date of the spin-off, subject to market conditions. Shares of CS&L retained by Windstream Services are classified as available-for-sale and recorded at fair value with unrealized gains and losses reported in accumulated other comprehensive loss. No deferred income taxes are recorded with respect to the unrealized gains and losses due to the tax-free qualification of the spin-off.
We recorded an other-than-temporary impairment loss of $(181.9) million for the difference between the fair value of the CS&L common stock as of March 31, 2016 and our cost basis, which had been based on the market value of the shares on the date of spin-off. We recorded the other-than-temporarily impairment due to the duration in which the CS&L shares had traded at a market price below our initial cost basis.
Following the recognition of the other-than-temporary impairment loss, information pertaining to our investment in CS&L common stock at March 31, 2016 was as follows:
(Millions) | Cost | Fair Value | Carrying Value | Unrealized Gain (Loss) |
CS&L common stock | $653.8 | $653.8 | $653.8 | $— |
Subsequent to March 31, 2016, the market price of the CS&L shares has increased such that as of May 4, 2016, the fair value of our investment has increased from $653.8 million to $686.4 million.
9. Accumulated Other Comprehensive Loss:
Accumulated other comprehensive loss balances, net of tax, were as follows:
(Millions) | March 31, 2016 | December 31, 2015 | ||||||
Pension and postretirement plans | $ | (0.8 | ) | $ | 2.8 | |||
Unrealized holding loss on available-for-sale securities | — | (286.5 | ) | |||||
Unrealized holding (losses) gains on interest rate swaps: | ||||||||
Designated portion | (5.7 | ) | (0.6 | ) | ||||
De-designated portion | 0.6 | (0.1 | ) | |||||
Accumulated other comprehensive loss | $ | (5.9 | ) | $ | (284.4 | ) | ||
Changes in accumulated other comprehensive loss balances, net of tax, were as follows:
(Millions) | Unrealized Holding Loss on Available-for-Sale Securities | (Losses) Gains on Interest Rate Swaps | Pension and Postretirement Plans | Total | ||||||||||||
Balance at December 31, 2015 | $ | (286.5 | ) | $ | (0.7 | ) | $ | 2.8 | $ | (284.4 | ) | |||||
Other comprehensive income (loss) before reclassifications | 104.6 | (5.1 | ) | — | 99.5 | |||||||||||
Amounts reclassified from other accumulated comprehensive loss (a) | 181.9 | 0.7 | (3.6 | ) | 179.0 | |||||||||||
Balance at March 31, 2016 | $ | — | $ | (5.1 | ) | $ | (0.8 | ) | $ | (5.9 | ) | |||||
(a) | See separate table below for details about these reclassifications. |
25
NOTES TO UNAUDITED INTERIM CONSOLIDATED FINANCIAL STATEMENTS
____
9. Accumulated Other Comprehensive Loss, Continued:
Reclassifications out of accumulated other comprehensive loss were as follows for the three month periods ended March 31:
(Millions) Amount Reclassified from Accumulated Other Comprehensive Loss | ||||||||||
Details about Accumulated Other Comprehensive Loss Components | Three Months Ended | Affected Line Item in the Consolidated Statements of Operations | ||||||||
2016 | 2015 | |||||||||
Available-for-sale securities: | ||||||||||
Other-than-temporary impairment loss recognized in the period | $ | 181.9 | $ | — | Other-than-temporary impairment loss on investment in CS&L common stock | |||||
Interest rate swaps: | ||||||||||
Amortization of unrealized losses on de-designated interest rate swaps | 1.2 | 3.4 | Interest expense | |||||||
1.2 | 3.4 | Loss before income taxes | ||||||||
(0.5 | ) | (1.4 | ) | Income tax benefit | ||||||
0.7 | 2.0 | Net (loss) income | ||||||||
Pension and postretirement plans: | ||||||||||
Plan curtailment | (5.5 | ) | — | (a) | ||||||
Amortization of net actuarial loss | 0.1 | 0.2 | (a) | |||||||
Amortization of prior service credits | (0.5 | ) | (1.3 | ) | (a) | |||||
(5.9 | ) | (1.1 | ) | Loss before income taxes | ||||||
2.3 | 0.2 | Income tax benefit | ||||||||
(3.6 | ) | (0.9 | ) | Net (loss) income | ||||||
Total reclassifications for the period, net of tax | $ | 179.0 | $ | 1.1 | Net (loss) income | |||||
(a) | These accumulated other comprehensive loss components are included in the computation of net periodic benefit income (see Note 5). |
26
NOTES TO UNAUDITED INTERIM CONSOLIDATED FINANCIAL STATEMENTS
____
10. (Loss) Earnings per Share:
We compute basic (loss) earnings per share by dividing net (loss) income applicable to common shares by the weighted average number of common shares outstanding during each period. Our non-vested restricted shares containing a non-forfeitable right to receive dividends on a one-to-one per share ratio to common shares are considered participating securities, and the impact is included in the computation of (loss) earnings per share pursuant to the two-class method. Calculations of (loss) earnings per share under the two-class method exclude from the numerator any dividends paid or owed on participating securities and any undistributed earnings considered to be attributable to participating securities. The related participating securities are similarly excluded from the denominator.
Diluted (loss) earnings per share are computed by dividing net (loss) income applicable to common shares by the weighted average number of common shares adjusted to include the effect of potentially dilutive securities. Potentially dilutive securities include incremental shares issuable upon exercise of outstanding stock options and warrants. Diluted (loss) earnings per share exclude all potentially dilutive securities if their effect is anti-dilutive.
We also issue performance-based restricted stock units as part of our share-based compensation plan. Certain of these restricted stock units contain a forfeitable right to receive dividends. Because dividends attributable to these shares are forfeited if the vesting provisions are not met, they are considered non-participating restricted shares and are not dilutive under the two-class method until the performance conditions have been satisfied. As of March 31, 2016, the performance conditions for the outstanding restricted stock units have not yet been satisfied. Options and warrants granted in conjunction with past acquisitions are included in the computation of dilutive earnings per share using the treasury stock method.
A reconciliation of net (loss) income and number of shares used in computing basic and diluted (loss) earnings per share was as follows for the three month periods ended March 31:
(Millions, except per share amounts) | 2016 | 2015 | ||||||||||
Basic and diluted (loss) earnings per share: | ||||||||||||
Numerator: | ||||||||||||
Net (loss) income | $ | (231.9 | ) | $ | 5.3 | |||||||
Income allocable to participating securities | (0.5 | ) | (0.7 | ) | ||||||||
Net (loss) income attributable to common shares | $ | (232.4 | ) | $ | 4.6 | |||||||
Denominator: | ||||||||||||
Basic and diluted shares outstanding | ||||||||||||
Weighted average shares outstanding | 96.4 | 100.8 | ||||||||||
Weighted average participating securities | (4.2 | ) | (0.9 | ) | ||||||||
Weighted average basic and diluted shares outstanding | 92.2 | 99.9 | ||||||||||
Basic and diluted (loss) earnings per share: | ||||||||||||
Net (loss) income | ($2.52 | ) | $.05 | |||||||||
Options to purchase shares of stock issuable under stock-based compensation plans that were excluded from the computation of diluted shares outstanding because the exercise prices were greater than the average market price of our common stock and, therefore, the effect would be anti-dilutive, totaled 0.5 million shares for both the three month period ended March 31, 2016 and 2015, respectively.
27
NOTES TO UNAUDITED INTERIM CONSOLIDATED FINANCIAL STATEMENTS
____
11. Segment Information:
Our business unit organizational structure is focused on our core customer relationships, and as a result, we operate and report the following four customer-based segments:
• | Consumer and Small Business - ILEC - We manage as one business our residential and small business customers who reside in markets in which we are the incumbent local exchange carrier (“ILEC”) due to the similarities with respect to service offerings, marketing strategies and customer service delivery. Products and services offered to these customers include traditional local and long-distance voice services and high-speed Internet services, which are delivered primarily over network facilities operated by us. We offer consumer video services primarily through a relationship with Dish Network LLC and we also own and operate cable television franchises in some of our service areas. During 2015, we launched Kinetic, a complete video entertainment offering in our Lincoln, Nebraska and Lexington, Kentucky markets, and we launched this service in Sugar Land, Texas in April 2016. We expect to roll out this new service to additional markets during the next few years. |
Residential customers can bundle voice, high-speed Internet and video services, to provide one convenient billing solution and receive bundle discounts. Small Business - ILEC services offer a wide range of advanced Internet, voice, and web conferencing products. These services are equipped to deliver high-speed Internet with competitive speeds, value added services to enhance business productivity and options to bundle services for a global business solution to meet our small business customer needs.
• | Carrier - Our carrier operations consist of providing products and services to other communications services providers, including special access services, which provide network access and transport services to end users, and fiber-to-tower connections to support backhaul services to wireless carriers. We also offer on a wholesale basis voice and data transport services to other communications providers, including the resale of our services and the sale of unbundled network elements, which allow wholesale customers to provide voice and data services to their customers through the use of our network or in combination with their own networks. |
• | Enterprise - Our enterprise operations consist of our business customer relationships that generate $1,500 or more in revenue per month. Products and services offered to these customers include integrated voice and data services, which deliver voice and broadband services over a single Internet connection, multi-site networking services which provide a fast and private connection between business locations, as well as a variety of other data services, including cloud computing and collocation and managed services as an alternative to traditional information technology infrastructure. |
• | Small Business - CLEC - These operations consist of our business customer relationships that generate less than $1,500 in revenue per month and are located in services areas in which we are a competitive local exchange carrier (“CLEC”) and provide services over network facilities primarily leased from other carriers. Products and services provided to these customers include integrated voice and data services, advanced data and traditional voice and long-distance services, as well as value added services including online backup, managed web design and web hosting, and various e-mail services. |
We evaluate performance of the segments based on segment income, which is computed as segment revenues and sales less segment operating expenses. As further discussed below, certain operating revenues and expenses are not assigned to our segments.
Segment revenues are based upon each customer’s classification to an individual segment and include all services provided to that customer. Certain operating revenues are derived from activities that are centrally-managed by us and, accordingly, these revenues are not included in any of our four segments presented below. These other operating revenues include revenue from federal and state universal service funds, CAF Phase II support, and funds received from federal access recovery mechanisms. We also generate other service revenues from providing switched access services, which include usage-based revenues from long-distance companies and other carriers for access to our network to complete long-distance calls, as well as reciprocal compensation received from wireless and other local connecting carriers for the use of network facilities. Other operating revenues also include certain surcharges assessed to our customers, including billings for our required contributions to federal and state USF programs. Revenues attributable to disposed businesses are not assigned to the segments and are also included in other service revenues for all periods prior to the dates of disposal. For the periods presented, the disposed operations consist of the sold data center and directory publishing businesses completed in December and April of 2015, respectively, as well as, the consumer CLEC business transferred to CS&L in connection with the REIT spin-off.
28
NOTES TO UNAUDITED INTERIM CONSOLIDATED FINANCIAL STATEMENTS
____
11. Segment Information, Continued:
Segment expenses include specific expenses incurred as a direct result of providing services and products to segment customers; selling, general and administrative expenses that are directly associated with specific segment customers or activities; and certain allocated expenses which include network expenses, facilities expenses and other expenses, such as vehicle and real estate-related expenses. We do not assign depreciation and amortization expense, merger and integration costs, restructuring charges, stock-based compensation and pension costs to our segments, because these expenses are centrally managed and are not monitored by or reported to the chief operating decision maker (“CODM”) by segment. Similarly, certain centrally-managed administrative functions, such as accounting and finance, information technology, legal and human resources, are not assigned to our segments. Interest expense and net loss on early extinguishment of debt have also been excluded from segment operating results because we manage our financing activities on a total company basis and have not assigned any long-term debt obligations to the segments. Other expense, net, other-than-temporary impairment of our investment in CS&L common stock, and income tax benefit are not monitored as a part of our segment operations and, therefore, these items also have been excluded from our segment operating results.
Asset information by segment is not monitored or reported to the CODM and therefore has not been presented. All of our customers are located in the United States and we do not have any single customer that provides more than 10 percent of our total consolidated revenues and sales.
The following table summarizes our segment results for the three month periods ended March 31:
(Millions) | 2016 | 2015 | ||||||||||
Consumer and Small Business - ILEC: | ||||||||||||
Revenues and sales | $ | 397.2 | $ | 402.8 | ||||||||
Costs and expenses | 169.1 | 163.2 | ||||||||||
Segment income | 228.1 | 239.6 | ||||||||||
Carrier: | ||||||||||||
Revenues | 163.2 | 176.3 | ||||||||||
Costs and expenses | 45.5 | 46.1 | ||||||||||
Segment income | 117.7 | 130.2 | ||||||||||
Enterprise: | ||||||||||||
Revenues and sales | 513.1 | 503.3 | ||||||||||
Costs and expenses | 442.6 | 451.4 | ||||||||||
Segment income | 70.5 | 51.9 | ||||||||||
Small Business - CLEC: | ||||||||||||
Revenues | 128.7 | 146.6 | ||||||||||
Costs and expenses | 87.4 | 98.0 | ||||||||||
Segment income | 41.3 | 48.6 | ||||||||||
Total segment revenues and sales | 1,202.2 | 1,229.0 | ||||||||||
Total segment costs and expenses | 744.6 | 758.7 | ||||||||||
Total segment income | $ | 457.6 | $ | 470.3 | ||||||||
The following table reconciles total segment revenue and sales to total consolidated revenue and sales for the three month periods ended March 31:
(Millions) | 2016 | 2015 | ||||||||||
Total segment revenues and sales | $ | 1,202.2 | $ | 1,229.0 | ||||||||
Regulatory and other operating revenues and sales | 171.2 | 150.9 | ||||||||||
Revenue and sales related to disposed businesses | — | 38.7 | ||||||||||
Total consolidated revenues and sales | $ | 1,373.4 | $ | 1,418.6 | ||||||||
29
NOTES TO UNAUDITED INTERIM CONSOLIDATED FINANCIAL STATEMENTS
____
11. Segment Information, Continued:
The following table reconciles segment income to consolidated net (loss) income for the three month periods ended March 31:
(Millions) | 2016 | 2015 | ||||||||||
Total segment income | $ | 457.6 | $ | 470.3 | ||||||||
Revenues and sales related to disposed businesses | — | 38.7 | ||||||||||
Regulatory and other operating revenues and sales | 171.2 | 150.9 | ||||||||||
Depreciation and amortization | (304.8 | ) | (340.7 | ) | ||||||||
Other unassigned operating expenses | (166.3 | ) | (173.7 | ) | ||||||||
Operating expenses related to disposed businesses | — | (25.6 | ) | |||||||||
Dividend income on CS&L common stock | 17.6 | — | ||||||||||
Other expense, net | (1.2 | ) | (1.2 | ) | ||||||||
Net loss on early extinguishment of debt | (35.4 | ) | — | |||||||||
Other-than-temporary impairment loss on investment in CS&L common stock | (181.9 | ) | — | |||||||||
Interest expense | (219.7 | ) | (141.1 | ) | ||||||||
Income tax benefit | 31.0 | 27.7 | ||||||||||
Net (loss) income | $ | (231.9 | ) | $ | 5.3 | |||||||
12. Supplemental Guarantor Information:
Debentures and notes, without collateral, issued by Windstream Services, LLC
In connection with the issuance of the 7.875 percent senior notes due November 1, 2017, the 7.750 percent senior notes due October 15, 2020, the 7.750 percent senior notes due October 1, 2021, the 7.500 percent senior notes due June 1, 2022, the 7.500 percent senior notes due April 1, 2023 and the 6.375 percent senior notes due August 1, 2023 (“the guaranteed notes”), certain of Windstream Services’ wholly-owned subsidiaries (the “Guarantors”), provide guarantees of those debentures. These guarantees are full and unconditional, subject to certain customary release provisions, as well as joint and several. All personal property assets and related operations of the Guarantors are pledged as collateral on the senior secured credit facility of Windstream Services. Certain Guarantors may be subject to restrictions on their ability to distribute earnings to Windstream Services. The remaining subsidiaries of Windstream Services (the “Non-Guarantors”) are not guarantors of the guaranteed notes. Windstream Holdings is not a guarantor of any Windstream Services debt instruments.
The following information presents condensed consolidating and combined statements of comprehensive income for the three month periods ended March 31, 2016 and 2015, condensed consolidating balance sheets as of March 31, 2016 and December 31, 2015, and condensed consolidating and combined statements of cash flows for the three month periods ended March 31, 2016 and 2015 of Windstream Services, the Guarantors and the Non-Guarantors. Investments consist of investments in net assets of subsidiaries held by Windstream Services and other subsidiaries, and have been presented using the equity method of accounting.
30
NOTES TO UNAUDITED INTERIM CONSOLIDATED FINANCIAL STATEMENTS
____
12. Supplemental Guarantor Information, Continued:
Condensed Consolidating Statement of Comprehensive Income (Loss) (Unaudited) | ||||||||||||||||||||
Three Months Ended March 31, 2016 | ||||||||||||||||||||
(Millions) | Windstream Services | Guarantors | Non- Guarantors | Eliminations | Consolidated | |||||||||||||||
Revenues and sales: | ||||||||||||||||||||
Service revenues | $ | — | $ | 253.6 | $ | 1,093.2 | $ | (6.2 | ) | $ | 1,340.6 | |||||||||
Product sales | — | 28.6 | 4.2 | — | 32.8 | |||||||||||||||
Total revenues and sales | — | 282.2 | 1,097.4 | (6.2 | ) | 1,373.4 | ||||||||||||||
Costs and expenses: | ||||||||||||||||||||
Cost of services | — | 99.3 | 575.1 | (5.6 | ) | 668.8 | ||||||||||||||
Cost of products sold | — | 25.9 | 3.0 | — | 28.9 | |||||||||||||||
Selling, general and administrative | — | 38.4 | 165.5 | (0.6 | ) | 203.3 | ||||||||||||||
Depreciation and amortization | 3.8 | 74.1 | 226.9 | — | 304.8 | |||||||||||||||
Merger and integration costs | — | — | 5.0 | — | 5.0 | |||||||||||||||
Restructuring charges | — | 0.8 | 3.6 | — | 4.4 | |||||||||||||||
Total costs and expenses | 3.8 | 238.5 | 979.1 | (6.2 | ) | 1,215.2 | ||||||||||||||
Operating (loss) income | (3.8 | ) | 43.7 | 118.3 | — | 158.2 | ||||||||||||||
Earnings (losses) from consolidated subsidiaries | 5.4 | (23.2 | ) | (7.4 | ) | 25.2 | — | |||||||||||||
Dividend income on CS&L common stock | 17.6 | — | — | — | 17.6 | |||||||||||||||
Other expense, net | — | — | (1.2 | ) | — | (1.2 | ) | |||||||||||||
Net loss on early extinguishment of debt | (35.4 | ) | — | — | — | (35.4 | ) | |||||||||||||
Other-than-temporary impairment loss on investment in CS&L common stock | (181.9 | ) | — | — | — | (181.9 | ) | |||||||||||||
Intercompany interest income (expense) | 24.8 | (10.0 | ) | (14.8 | ) | — | — | |||||||||||||
Interest expense | (92.6 | ) | (37.4 | ) | (89.7 | ) | — | (219.7 | ) | |||||||||||
(Loss) income before income taxes | (265.9 | ) | (26.9 | ) | 5.2 | 25.2 | (262.4 | ) | ||||||||||||
Income tax (benefit) expense | (34.3 | ) | (1.4 | ) | 4.9 | — | (30.8 | ) | ||||||||||||
Net (loss) income | $ | (231.6 | ) | $ | (25.5 | ) | $ | 0.3 | $ | 25.2 | $ | (231.6 | ) | |||||||
Comprehensive income (loss) | $ | 46.9 | $ | (25.5 | ) | $ | 0.3 | $ | 25.2 | $ | 46.9 | |||||||||
31
NOTES TO UNAUDITED INTERIM CONSOLIDATED FINANCIAL STATEMENTS
____
12. Supplemental Guarantor Information, Continued:
Condensed Consolidating Statement of Comprehensive Income (Loss) (Unaudited) | ||||||||||||||||||||
Three Months Ended March 31, 2015 | ||||||||||||||||||||
(Millions) | Windstream Services | Guarantors | Non- Guarantors | Eliminations | Consolidated | |||||||||||||||
Revenues and sales: | ||||||||||||||||||||
Service revenues | $ | — | $ | 283.6 | $ | 1,105.1 | $ | (6.9 | ) | $ | 1,381.8 | |||||||||
Product sales | — | 32.2 | 4.6 | — | 36.8 | |||||||||||||||
Total revenues and sales | — | 315.8 | 1,109.7 | (6.9 | ) | 1,418.6 | ||||||||||||||
Costs and expenses: | ||||||||||||||||||||
Cost of services | — | 114.6 | 571.2 | (5.8 | ) | 680.0 | ||||||||||||||
Cost of products sold | — | 27.7 | 4.2 | — | 31.9 | |||||||||||||||
Selling, general and administrative | — | 39.4 | 186.1 | (1.1 | ) | 224.4 | ||||||||||||||
Depreciation and amortization | 4.9 | 83.6 | 252.2 | — | 340.7 | |||||||||||||||
Merger and integration costs | — | — | 14.1 | — | 14.1 | |||||||||||||||
Restructuring charges | — | 1.6 | 5.4 | — | 7.0 | |||||||||||||||
Total costs and expenses | 4.9 | 266.9 | 1,033.2 | (6.9 | ) | 1,298.1 | ||||||||||||||
Operating (loss) income | (4.9 | ) | 48.9 | 76.5 | — | 120.5 | ||||||||||||||
Earnings (losses) from consolidated subsidiaries | 46.5 | (23.9 | ) | 0.1 | (22.7 | ) | — | |||||||||||||
Other (expense) income, net | (1.4 | ) | 0.1 | 0.1 | — | (1.2 | ) | |||||||||||||
Intercompany interest income (expense) | 32.4 | (13.1 | ) | (19.3 | ) | — | — | |||||||||||||
Interest expense | (128.9 | ) | (11.1 | ) | (1.1 | ) | — | (141.1 | ) | |||||||||||
(Loss) income before income taxes | (56.3 | ) | 0.9 | 56.3 | (22.7 | ) | (21.8 | ) | ||||||||||||
Income tax (benefit) expense | (61.9 | ) | 9.5 | 25.0 | — | (27.4 | ) | |||||||||||||
Net income (loss) | $ | 5.6 | $ | (8.6 | ) | $ | 31.3 | $ | (22.7 | ) | $ | 5.6 | ||||||||
Comprehensive income (loss) | $ | 1.5 | $ | (8.6 | ) | $ | 31.3 | $ | (22.7 | ) | $ | 1.5 | ||||||||
32
NOTES TO UNAUDITED INTERIM CONSOLIDATED FINANCIAL STATEMENTS
____
12. Supplemental Guarantor Information, Continued:
Condensed Consolidating Balance Sheet (Unaudited) | ||||||||||||||||||||
As of March 31, 2016 | ||||||||||||||||||||
(Millions) | Windstream Services | Guarantors | Non- Guarantors | Eliminations | Consolidated | |||||||||||||||
Assets | ||||||||||||||||||||
Current Assets: | ||||||||||||||||||||
Cash and cash equivalents | $ | 23.7 | $ | 0.7 | $ | 50.2 | $ | — | $ | 74.6 | ||||||||||
Accounts receivable, net | — | 212.9 | 423.2 | — | 636.1 | |||||||||||||||
Notes receivable - affiliate | — | 4.8 | — | (4.8 | ) | — | ||||||||||||||
Affiliates receivable, net | — | 692.4 | 2,025.1 | (2,717.5 | ) | — | ||||||||||||||
Inventories | — | 67.8 | 11.6 | — | 79.4 | |||||||||||||||
Prepaid expenses and other | 29.2 | 36.4 | 84.3 | — | 149.9 | |||||||||||||||
Total current assets | 52.9 | 1,015.0 | 2,594.4 | (2,722.3 | ) | 940.0 | ||||||||||||||
Investments in consolidated subsidiaries | 6,481.5 | 340.3 | 249.2 | (7,071.0 | ) | — | ||||||||||||||
Notes receivable - affiliate | — | 313.2 | — | (313.2 | ) | — | ||||||||||||||
Goodwill | 1,636.7 | 1,343.0 | 1,233.9 | — | 4,213.6 | |||||||||||||||
Other intangibles, net | 543.9 | 276.3 | 637.0 | — | 1,457.2 | |||||||||||||||
Net property, plant and equipment | 8.0 | 1,229.3 | 4,018.4 | — | 5,255.7 | |||||||||||||||
Investment in CS&L common stock | 653.8 | — | — | — | 653.8 | |||||||||||||||
Deferred income taxes | — | 310.3 | 215.0 | (525.3 | ) | — | ||||||||||||||
Other assets | 12.8 | 55.4 | 22.7 | — | 90.9 | |||||||||||||||
Total Assets | $ | 9,389.6 | $ | 4,882.8 | $ | 8,970.6 | $ | (10,631.8 | ) | $ | 12,611.2 | |||||||||
Liabilities and Equity | ||||||||||||||||||||
Current Liabilities: | ||||||||||||||||||||
Current maturities of long-term debt | $ | 11.9 | $ | — | $ | — | $ | — | $ | 11.9 | ||||||||||
Current portion of long-term lease obligations | — | 46.0 | 110.6 | — | 156.6 | |||||||||||||||
Accounts payable | — | 74.6 | 249.0 | — | 323.6 | |||||||||||||||
Affiliates payable, net | 2,732.4 | — | — | (2,717.5 | ) | 14.9 | ||||||||||||||
Notes payable - affiliate | — | — | 4.8 | (4.8 | ) | — | ||||||||||||||
Advance payments and customer deposits | — | 28.4 | 165.5 | — | 193.9 | |||||||||||||||
Accrued taxes | 0.6 | 15.6 | 55.4 | — | 71.6 | |||||||||||||||
Accrued interest | 113.4 | 3.4 | 1.3 | — | 118.1 | |||||||||||||||
Other current liabilities | 26.8 | 38.0 | 194.2 | — | 259.0 | |||||||||||||||
Total current liabilities | 2,885.1 | 206.0 | 780.8 | (2,722.3 | ) | 1,149.6 | ||||||||||||||
Long-term debt | 5,333.6 | 99.5 | — | — | 5,433.1 | |||||||||||||||
Long-term lease obligations | — | 1,442.8 | 3,517.0 | — | 4,959.8 | |||||||||||||||
Notes payable - affiliate | — | — | 313.2 | (313.2 | ) | — | ||||||||||||||
Deferred income taxes | 780.2 | — | — | (525.3 | ) | 254.9 | ||||||||||||||
Other liabilities | 53.0 | 23.2 | 399.9 | — | 476.1 | |||||||||||||||
Total liabilities | 9,051.9 | 1,771.5 | 5,010.9 | (3,560.8 | ) | 12,273.5 | ||||||||||||||
Commitments and Contingencies (See Note 13) | ||||||||||||||||||||
Equity: | ||||||||||||||||||||
Common stock | — | 39.4 | 81.9 | (121.3 | ) | — | ||||||||||||||
Additional paid-in capital | 584.7 | 3,128.2 | 848.0 | (3,976.2 | ) | 584.7 | ||||||||||||||
Accumulated other comprehensive loss | (5.9 | ) | — | (0.8 | ) | 0.8 | (5.9 | ) | ||||||||||||
(Accumulated deficit) retained earnings | (241.1 | ) | (56.3 | ) | 3,030.6 | (2,974.3 | ) | (241.1 | ) | |||||||||||
Total equity | 337.7 | 3,111.3 | 3,959.7 | (7,071.0 | ) | 337.7 | ||||||||||||||
Total Liabilities and Equity | $ | 9,389.6 | $ | 4,882.8 | $ | 8,970.6 | $ | (10,631.8 | ) | $ | 12,611.2 | |||||||||
33
NOTES TO UNAUDITED INTERIM CONSOLIDATED FINANCIAL STATEMENTS
____
12. Supplemental Guarantor Information, Continued:
Condensed Consolidating Balance Sheet (Unaudited) | ||||||||||||||||||||
As of December 31, 2015 | ||||||||||||||||||||
(Millions) | Windstream Services | Guarantors | Non- Guarantors | Eliminations | Consolidated | |||||||||||||||
Assets | ||||||||||||||||||||
Current Assets: | ||||||||||||||||||||
Cash and cash equivalents | $ | — | $ | 1.1 | $ | 33.5 | $ | (3.3 | ) | $ | 31.3 | |||||||||
Accounts receivable, net | — | 218.6 | 425.3 | — | 643.9 | |||||||||||||||
Notes receivable - affiliate | — | 4.8 | — | (4.8 | ) | — | ||||||||||||||
Affiliates receivable, net | — | 619.1 | 2,435.4 | (3,054.5 | ) | — | ||||||||||||||
Inventories | — | 69.1 | 10.4 | — | 79.5 | |||||||||||||||
Prepaid expenses and other | 321.8 | 32.4 | 64.6 | (298.2 | ) | 120.6 | ||||||||||||||
Total current assets | 321.8 | 945.1 | 2,969.2 | (3,360.8 | ) | 875.3 | ||||||||||||||
Investments in consolidated subsidiaries | 6,332.3 | 320.4 | 242.7 | (6,895.4 | ) | — | ||||||||||||||
Notes receivable - affiliate | — | 314.1 | — | (314.1 | ) | — | ||||||||||||||
Goodwill | 1,636.7 | 1,343.0 | 1,233.9 | — | 4,213.6 | |||||||||||||||
Other intangibles, net | 554.3 | 282.8 | 667.6 | — | 1,504.7 | |||||||||||||||
Net property, plant and equipment | 8.4 | 1,241.3 | 4,030.1 | — | 5,279.8 | |||||||||||||||
Investment in CS&L common stock | 549.2 | — | — | — | 549.2 | |||||||||||||||
Deferred income taxes | — | 301.2 | 215.3 | (516.5 | ) | — | ||||||||||||||
Other assets | 14.2 | 56.3 | 25.0 | — | 95.5 | |||||||||||||||
Total Assets | $ | 9,416.9 | $ | 4,804.2 | $ | 9,383.8 | $ | (11,086.8 | ) | $ | 12,518.1 | |||||||||
Liabilities and Equity | ||||||||||||||||||||
Current Liabilities: | ||||||||||||||||||||
Current maturities of long-term debt | $ | 5.9 | $ | — | $ | — | $ | — | $ | 5.9 | ||||||||||
Current portion of long-term lease obligations | — | 44.4 | 108.3 | — | 152.7 | |||||||||||||||
Accounts payable | — | 92.9 | 337.2 | — | 430.1 | |||||||||||||||
Affiliates payable, net | 3,069.6 | — | — | (3,054.5 | ) | 15.1 | ||||||||||||||
Notes payable - affiliate | — | — | 4.8 | (4.8 | ) | — | ||||||||||||||
Advance payments and customer deposits | — | 26.3 | 167.6 | — | 193.9 | |||||||||||||||
Accrued taxes | 0.3 | 11.9 | 370.1 | (298.2 | ) | 84.1 | ||||||||||||||
Accrued interest | 75.3 | 1.9 | 1.2 | — | 78.4 | |||||||||||||||
Other current liabilities | 42.6 | 47.5 | 216.8 | — | 306.9 | |||||||||||||||
Total current liabilities | 3,193.7 | 224.9 | 1,206.0 | (3,357.5 | ) | 1,267.1 | ||||||||||||||
Long-term debt | 5,065.1 | 99.5 | — | — | 5,164.6 | |||||||||||||||
Long-term lease obligations | — | 1,455.2 | 3,545.2 | — | 5,000.4 | |||||||||||||||
Notes payable - affiliate | — | — | 314.1 | (314.1 | ) | — | ||||||||||||||
Deferred income taxes | 803.9 | — | — | (516.5 | ) | 287.4 | ||||||||||||||
Other liabilities | 47.8 | 25.1 | 419.3 | — | 492.2 | |||||||||||||||
Total liabilities | 9,110.5 | 1,804.7 | 5,484.6 | (4,188.1 | ) | 12,211.7 | ||||||||||||||
Commitments and Contingencies (See Note 13) | ||||||||||||||||||||
Equity: | ||||||||||||||||||||
Common stock | — | 39.4 | 81.9 | (121.3 | ) | — | ||||||||||||||
Additional paid-in capital | 600.3 | 3,128.2 | 848.0 | (3,976.2 | ) | 600.3 | ||||||||||||||
Accumulated other comprehensive (loss) income | (284.4 | ) | — | 2.8 | (2.8 | ) | (284.4 | ) | ||||||||||||
(Accumulated deficit) retained earnings | (9.5 | ) | (168.1 | ) | 2,966.5 | (2,798.4 | ) | (9.5 | ) | |||||||||||
Total equity | 306.4 | 2,999.5 | 3,899.2 | (6,898.7 | ) | 306.4 | ||||||||||||||
Total Liabilities and Equity | $ | 9,416.9 | $ | 4,804.2 | $ | 9,383.8 | $ | (11,086.8 | ) | $ | 12,518.1 | |||||||||
34
NOTES TO UNAUDITED INTERIM CONSOLIDATED FINANCIAL STATEMENTS
____
12. Supplemental Guarantor Information, Continued:
Condensed Consolidating Statement of Cash Flows (Unaudited) | ||||||||||||||||||||
Three Months Ended March 31, 2016 | ||||||||||||||||||||
(Millions) | Windstream Services | Guarantors | Non- Guarantors | Eliminations | Consolidated | |||||||||||||||
Cash Flows from Operating Activities: | ||||||||||||||||||||
Net cash provided from (used in) operating activities | $ | 235.8 | $ | 60.9 | $ | (169.2 | ) | $ | — | $ | 127.5 | |||||||||
Cash Flows from Investing Activities: | ||||||||||||||||||||
Additions to property, plant and equipment | (0.2 | ) | (57.2 | ) | (206.4 | ) | — | (263.8 | ) | |||||||||||
Proceeds from sale of property | — | 1.0 | 5.2 | — | 6.2 | |||||||||||||||
Net cash used in investing activities | (0.2 | ) | (56.2 | ) | (201.2 | ) | — | (257.6 | ) | |||||||||||
Cash Flows from Financing Activities: | ||||||||||||||||||||
Distributions to Windstream Holdings, Inc. | (44.1 | ) | — | — | — | (44.1 | ) | |||||||||||||
Repayments of debt and swaps | (985.3 | ) | — | — | — | (985.3 | ) | |||||||||||||
Proceeds of debt issuance | 1,278.0 | — | — | — | 1,278.0 | |||||||||||||||
Debt issuance costs | (10.7 | ) | — | — | — | (10.7 | ) | |||||||||||||
Intercompany transactions, net | (441.9 | ) | 4.8 | 433.8 | 3.3 | — | ||||||||||||||
Payments under long-term lease obligations | — | (10.8 | ) | (26.0 | ) | — | (36.8 | ) | ||||||||||||
Payments under capital lease obligations | — | — | (19.8 | ) | — | (19.8 | ) | |||||||||||||
Other, net | (7.9 | ) | 0.9 | (0.9 | ) | — | (7.9 | ) | ||||||||||||
Net cash (used in) provided from financing activities | (211.9 | ) | (5.1 | ) | 387.1 | 3.3 | 173.4 | |||||||||||||
Increase (decrease) in cash and cash equivalents | 23.7 | (0.4 | ) | 16.7 | 3.3 | 43.3 | ||||||||||||||
Cash and Cash Equivalents: | ||||||||||||||||||||
Beginning of period | — | 1.1 | 33.5 | (3.3 | ) | 31.3 | ||||||||||||||
End of period | $ | 23.7 | $ | 0.7 | $ | 50.2 | $ | — | $ | 74.6 | ||||||||||
35
NOTES TO UNAUDITED INTERIM CONSOLIDATED FINANCIAL STATEMENTS
____
12. Supplemental Guarantor Information, Continued:
Condensed Consolidating Statement of Cash Flows (Unaudited) | ||||||||||||||||||||
Three Months Ended March 31, 2015 | ||||||||||||||||||||
(Millions) | Windstream Services | Guarantors | Non- Guarantors | Eliminations | Consolidated | |||||||||||||||
Cash Flows from Operating Activities: | ||||||||||||||||||||
Net cash provided from (used in) operating activities | $ | 64.7 | $ | (49.6 | ) | $ | 229.0 | $ | — | $ | 244.1 | |||||||||
Cash Flows from Investing Activities: | ||||||||||||||||||||
Additions to property, plant and equipment | (0.3 | ) | (30.6 | ) | (158.4 | ) | — | (189.3 | ) | |||||||||||
Grant funds received for broadband stimulus projects | 7.4 | — | — | — | 7.4 | |||||||||||||||
Network expansion funded by Connect America Fund - Phase I | — | (1.4 | ) | (6.9 | ) | — | (8.3 | ) | ||||||||||||
Changes in restricted cash | (0.4 | ) | — | — | — | (0.4 | ) | |||||||||||||
Other, net | (4.1 | ) | 0.1 | 1.9 | — | (2.1 | ) | |||||||||||||
Net cash provided from (used in) investing activities | 2.6 | (31.9 | ) | (163.4 | ) | — | (192.7 | ) | ||||||||||||
Cash Flows from Financing Activities: | ||||||||||||||||||||
Distributions to Windstream Holdings, Inc. | (151.8 | ) | — | — | — | (151.8 | ) | |||||||||||||
Repayments of debt and swaps | (325.4 | ) | — | — | — | (325.4 | ) | |||||||||||||
Proceeds of debt issuance | 490.0 | — | — | — | 490.0 | |||||||||||||||
Intercompany transactions, net | (56.6 | ) | 83.0 | (52.4 | ) | 26.0 | — | |||||||||||||
Payments under capital lease obligations | — | (4.2 | ) | (7.0 | ) | — | (11.2 | ) | ||||||||||||
Other, net | (6.8 | ) | 0.9 | (0.9 | ) | — | (6.8 | ) | ||||||||||||
Net cash (used in) provided from financing activities | (50.6 | ) | 79.7 | (60.3 | ) | 26.0 | (5.2 | ) | ||||||||||||
Increase (decrease) in cash and cash equivalents | 16.7 | (1.8 | ) | 5.3 | 26.0 | 46.2 | ||||||||||||||
Cash and Cash Equivalents: | ||||||||||||||||||||
Beginning of period | — | 3.8 | 50.0 | (26.0 | ) | 27.8 | ||||||||||||||
End of period | $ | 16.7 | $ | 2.0 | $ | 55.3 | $ | — | $ | 74.0 | ||||||||||
36
NOTES TO UNAUDITED INTERIM CONSOLIDATED FINANCIAL STATEMENTS
____
13. Commitments and Contingencies:
On February 9, 2015, a putative stockholder filed a Shareholder Class Action Complaint in the Delaware Court of Chancery (the “Court”), captioned Doppelt v. Windstream Holdings, Inc., et al., C.A. No. 10629-VCN, against the Company and its Board of Directors. This complaint was accompanied by a motion for a preliminary injunction seeking to enjoin the spin-off. The Court, ruling from the bench on February 19, 2015 - the day before a special meeting of stockholders was scheduled to vote on a reverse stock split and amended governing documents (the “Proposals”) - denied plaintiff’s motion for a preliminary injunction, reasoning that much of the information sought by plaintiff had been disclosed in public filings available on the United States Securities and Exchange Commission’s website, the Windstream Holdings’ board of directors was in no way conflicted, and while approval of the Proposals would facilitate the spin-off, approval was not necessary to effect the spin-off. On March 16, 2015, plaintiff, joined by a second putative Windstream stockholder, filed an Amended Shareholder Class Action Complaint alleging breaches of fiduciary duty by the Company and its Board concerning Windstream’s disclosures and seeking to rescind the spin-off and unspecified monetary damages. On February 5, 2016, the Court granted in part and denied in part defendants’ motion to dismiss the amended complaint. The Court dismissed Windstream, and plaintiffs’ demand to rescind the spin-off, but otherwise denied the motion.
In addition, numerous copyright holders represented by RightsCorp have asserted that our customers have utilized our services to allegedly illegally download and share alleged copyrighted material via peer-to-peer or “filesharing” programs. These holders maintain that Windstream is responsible for alleged infringement because after notification, Windstream did not shut off service to customers alleged to be repeat infringers, and, further, that Windstream may not claim safe harbor pursuant to the Digital Millennium Copyright Act of 1998.
We believe that we have valid defenses to both the lawsuit and the alleged infringement claim, and we plan to vigorously defend the pursuit of both matters. While the ultimate resolution of the matters is not currently predictable, if there are adverse rulings against Windstream in either of these two matters, either ruling could constitute a material adverse outcome on the future consolidated results of our income, cash flows, or financial condition.
We are party to various legal proceedings, including certain lawsuits claiming infringement of patents relating to various aspects of our business. In certain of the patent matters, other industry participants are also parties, and we may have claims of indemnification against vendors/suppliers. The ultimate resolution of these legal proceedings cannot be determined at this time. However, based on current circumstances, management does not believe such proceedings, individually or in the aggregate, will have a material adverse effect on the future consolidated results of our income, cash flows or financial condition.
Finally, management is currently not aware of any environmental matters, individually or in the aggregate, that would have a material adverse effect on our consolidated financial condition or results of our operations.
14. Subsequent Event:
During April 2016, Windstream Services repurchased in the open market for $93.4 million in cash, including accrued and unpaid interest, $116.7 million aggregate principal amount of its senior unsecured notes, consisting of $49.9 million of its 2021 Notes, $18.3 million of its 2022 Notes, and $48.5 million of its 2023 Notes.
37
WINDSTREAM HOLDINGS, INC.
WINDSTREAM SERVICES, LLC
FORM 10-Q
PART I - FINANCIAL INFORMATION
Item 2. Management’s Discussion and Analysis of Financial Condition and Results of Operations
Unless the context indicates otherwise, the terms “Windstream,” “we,” “us” or “our” refer to Windstream Holdings, Inc. and its subsidiaries, including Windstream Services, LLC, and the term “Windstream Services” refers to Windstream Services, LLC and its subsidiaries.
The following sections provide an overview of our results of operations and highlight key trends and uncertainties in our business. Certain statements constitute forward-looking statements. See “Forward-Looking Statements” at the end of this discussion for additional factors relating to such statements, and see “Risk Factors” in Item 1A of Part I of our Annual Report on Form 10-K for the year ended December 31, 2015, filed with the Securities and Exchange Commission (“SEC”) on February 25, 2016, for a discussion of certain risk factors applicable to our business, financial condition and results of operations.
ORGANIZATIONAL STRUCTURE
Windstream Holdings, Inc. (“Windstream Holdings”) is a publicly traded holding company and the parent of Windstream Services, LLC (“Windstream Services”). Windstream Holdings common stock trades on the Nasdaq Global Select Market (“NASDAQ”) under the ticker symbol “WIN”. Windstream Holdings owns a 100 percent interest in Windstream Services. Windstream Services and its guarantor subsidiaries are the sole obligors of all outstanding debt obligations and, as a result, also file periodic reports with the SEC. Windstream Holdings is not a guarantor of nor subject to the restrictive covenants included in any of Windstream Services’ debt agreements. The Windstream Holdings board of directors and officers oversee both companies.
There are no significant differences between the consolidated results of operations, financial condition, and cash flows of Windstream Holdings and those of Windstream Services other than for certain expenses directly incurred by Windstream Holdings principally consisting of audit, legal and board of director fees, NASDAQ listing fees, other shareholder-related costs, income taxes, common stock activity, and payables from Windstream Services to Windstream Holdings. For the three month periods ended March 31, 2016 and 2015, the amount of pretax expenses directly incurred by Windstream Holdings were approximately $0.5 million and $0.6 million, respectively, or $0.3 million on an after-tax basis for both periods presented. Unless otherwise indicated, the following discussion of our business strategy, trends and results of operations pertain to both Windstream Holdings and Windstream Services.
OVERVIEW
We are a leading provider of advanced network communications and technology solutions for consumers, businesses, enterprise organizations and carrier partners across the United States. We provide data, cloud solutions, unified communications and managed services to small business and enterprise clients. We also offer bundled services, including broadband, security solutions, voice and digital television to consumers. We supply core transport solutions on a local and long-haul fiber-optic network spanning approximately 125,000 miles, the sixth largest fiber network in the nation.
Our vision is to provide a best-in-class customer experience through a world-class network. Our “network first” strategy entails leveraging our existing infrastructure and investing in the latest technologies to create significant value for both our customers and our shareholders. Our business unit organizational structure is focused on our four core customer groups: Consumer and Small Business - ILEC, Carrier, Enterprise, and Small Business - CLEC, as further defined below. This organizational structure aligns all aspects of the customer relationship (sales, service delivery, and customer service) to improve accountability to the customer and sharpen our operational focus.
We differentiate our business customers between enterprise and small business primarily based on the monthly recurring revenue generated from the customer with enterprise customers comprising those relationships that generate $1,500 or more in monthly recurring revenue and small business customers comprising those relationships that generate less than $1,500 per month. Our small business customer base is further disaggregated between those customers located in service areas in which we are the incumbent local exchange carrier (“ILEC”) and provide services over network facilities operated by us and those customers located in service areas in which we are a competitive local exchange carrier (“CLEC”) and provide services over network facilities primarily leased from other carriers. Under our organizational structure, we combined our Consumer and Small Business - ILEC operations due to similarities between these customers with respect to service offerings, marketing strategies and customer service delivery, as both of these businesses are focused on broadband revenue growth driven by our continued investment in our broadband network.
38
We have a focused operational strategy for each business segment with the overall objective to improve our consolidated operational and financial results and reach our goal of stabilizing and growing adjusted OIBDA, which is defined as operating income plus depreciation and amortization, adjusted to exclude the impact of restructuring charges, pension expense and share-based compensation.
Our operational strategy for each of our business segments are as follows:
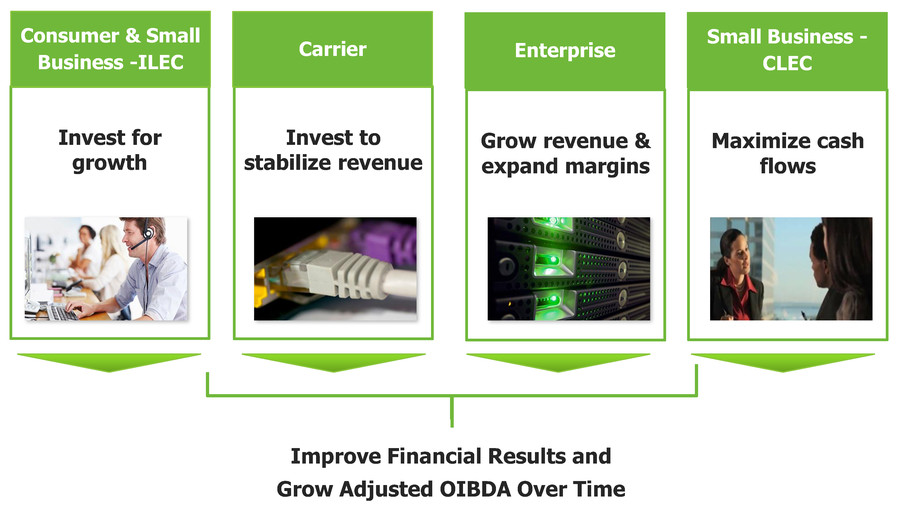
See “Segment Operating Results” for further discussion of our business segments.
EXECUTIVE SUMMARY
Our operational focus for 2016 is on enhancing our high-speed capabilities, increasing the profitability of our enterprise business, expanding our carrier network, and effectively managing our costs. During the first quarter of 2016, we achieved the following related to these initiatives:
• | Grew our Enterprise contribution margin by approximately $19 million or 36 percent, compared to the same period in 2015. Maintained stable contribution margins in our other businesses through strong expense management. |
• | Consolidated operating income increased by approximately $38 million or 32 percent. |
• | Continued our commitment to invest in innovative technologies that address our customers’ current and future needs by launching 1-Gigabit Internet service in four market areas including Lincoln, Nebraska; Lexington, Kentucky; Sugar Land, Texas and several areas surrounding Charlotte, North Carolina. We also launched Kinetic, our next-generation television service, in Sugar Land, Texas. |
• | Issued $600.0 million in a new secured term loan and repurchased in the open market $154.2 million of long-term debt and repurchased $441.1 million of long-term debt due in 2017, significantly improving our debt maturity profile. Through the monetization of our retained ownership interest in CS&L, we are positioned to retire additional long-term debt. |
• | Returned value to our shareholders through the payment of our quarterly dividend and completion of our $75 million share repurchase program, which resulted in the retirement of approximately 12.6 million shares. |
39
Our consolidated operating results for the three month period ended March 31, 2016 were favorably impacted by additional subsidy revenues received from the Connect America Fund (“CAF”) Phase II, growth in enterprise revenues, reflecting increased demand for data and integrated services, lower depreciation and amortization expense, and dividend income earned on Windstream’s retained 19.6 percent ownership interest in Communications Sales & Leasing, Inc. (“CS&L”). Conversely, operating results for the three month period of 2016 were adversely impacted by additional interest expense attributable to the long-term lease obligation under the master lease agreement with CS&L, net loss incurred on the early extinguishment of long-term debt and an other-than-temporary impairment loss on our investment in CS&L common stock. Reductions in small business, carrier and switched access revenues due to customer losses from business closures and competition, declining demand for copper-based circuits to towers and the adverse effects of intercarrier compensation reform, respectively, also impacted our operating results in the three month period of 2016, when compared to the same period of 2015. Year-over-year comparisons of revenues and expenses also reflect the disposal of certain businesses completed in 2015, as further discussed below.
CONSOLIDATED RESULTS OF OPERATIONS
The following table reflects the consolidated operating results of Windstream Holdings for the three months ended March 31:
Increase (Decrease) | |||||||||||||||||||
(Millions) | 2016 | 2015 | Amount | % | |||||||||||||||
Revenues and sales: | |||||||||||||||||||
Service revenues | $ | 1,340.6 | $ | 1,381.8 | $ | (41.2 | ) | (3 | ) | ||||||||||
Product sales | 32.8 | 36.8 | (4.0 | ) | (11 | ) | |||||||||||||
Total revenues and sales | 1,373.4 | 1,418.6 | (45.2 | ) | (3 | ) | |||||||||||||
Costs and expenses: | |||||||||||||||||||
Cost of services (a) | 668.8 | 680.0 | (11.2 | ) | (2 | ) | |||||||||||||
Cost of products sold | 28.9 | 31.9 | (3.0 | ) | (9 | ) | |||||||||||||
Selling, general and administrative | 203.8 | 225.0 | (21.2 | ) | (9 | ) | |||||||||||||
Depreciation and amortization | 304.8 | 340.7 | (35.9 | ) | (11 | ) | |||||||||||||
Merger and integration costs | 5.0 | 14.1 | (9.1 | ) | (65 | ) | |||||||||||||
Restructuring charges | 4.4 | 7.0 | (2.6 | ) | (37 | ) | |||||||||||||
Total costs and expenses | 1,215.7 | 1,298.7 | (83.0 | ) | (6 | ) | |||||||||||||
Operating income | 157.7 | 119.9 | 37.8 | 32 | |||||||||||||||
Dividend income on CS&L common stock | 17.6 | — | 17.6 | * | |||||||||||||||
Other income, net | (1.2 | ) | (1.2 | ) | — | * | |||||||||||||
Net loss on early extinguishment of debt | (35.4 | ) | — | (35.4 | ) | * | |||||||||||||
Other-than-temporary impairment loss on investment in CS&L common stock (b) | (181.9 | ) | — | (181.9 | ) | * | |||||||||||||
Interest expense | (219.7 | ) | (141.1 | ) | (78.6 | ) | 56 | ||||||||||||
Loss before income taxes | (262.9 | ) | (22.4 | ) | (240.5 | ) | * | ||||||||||||
Income tax benefit | (31.0 | ) | (27.7 | ) | (3.3 | ) | 12 | ||||||||||||
Net (loss) income | $ | (231.9 | ) | $ | 5.3 | $ | (237.2 | ) | * | ||||||||||
* Not meaningful
(a) | Excludes depreciation and amortization included below. |
(b) | See Note 8 for further discussion of this impairment loss. |
A detailed discussion and analysis of our consolidated operating results is presented below.
40
The following table presents the primary drivers of the changes in service revenues for the three months ended March 31, 2016 compared to the same period a year ago:
Increase (Decrease) | |||||||||||
(Millions) | Amount | % | |||||||||
Increase in Enterprise revenues (a) | $ | 15.7 | |||||||||
Decrease in Consumer and Small Business - ILEC revenues (b) | (4.9 | ) | |||||||||
Decrease in Carrier revenues (c) | (13.1 | ) | |||||||||
Decrease in Small Business - CLEC revenues (d) | (17.9 | ) | |||||||||
Net decrease in segment service revenues | (20.2 | ) | |||||||||
Increase in regulatory and other revenues (e) | 17.7 | ||||||||||
Decrease attributable to disposed businesses (f) | (38.7 | ) | |||||||||
Net decrease in service revenues | $ | (41.2 | ) | (3 | ) | ||||||
(a) | Increase was primarily due to the continued demand for advanced data services partially offset by a decrease in traditional voice and long-distance revenues due to lower usage and the adverse effects of competition. |
(b) | The decrease was primarily in Small Business - ILEC revenues and was attributable to lower usage for voice and long- distance services and the decline in customers due to the impacts of competition. |
(c) | Decrease was primarily due to declining demand for dedicated copper-based circuits, as carriers continue to migrate traffic to fiber-based connections. |
(d) | Decrease was primarily due to a decline in the number of customers served as a result of business closures and competition. |
(e) | Regulatory revenues include switched access revenues, federal and state Universal Service Fund (“USF”) revenues, CAF Phase II support, and funds received from the access recovery mechanism (“ARM”). Switched access revenues include usage sensitive revenues from long-distance companies and other carriers for access to our network in connection with the completion of long-distance calls, as well as reciprocal compensation received from wireless and other local connecting carriers for the use of our network facilities. USF revenues are government subsidies designed to partially offset the cost of providing wireline services in high-cost areas. CAF Phase II funding is administered by the FCC for the purpose of expanding and supporting broadband service in rural areas and effectively replaces frozen USF support in those states in which we elected to receive the CAF Phase II funding. The ARM is additional federal universal service support available to help mitigate revenue losses from intercarrier compensation reform not covered by the access recovery charge (“ARC”). See Regulatory Matters for further discussion. |
Other service revenues include USF surcharge revenues, revenues from other miscellaneous services, wholesale reseller revenues generated from the master services agreement with CS&L, and consumer revenues generated in markets where we lease the connection to the customer premise.
The increase in regulatory and other revenues was primarily due to the CAF Phase II incremental funding received to enhance broadband services in our more rural markets partially offset by reductions in switched access revenues and ARM support due to the impacts of intercarrier compensation reform.
(f) | Represents revenues attributable to the data center and directory publishing businesses sold in December and April of 2015, respectively, as well as the consumer CLEC business transferred to CS&L in connection with the spin-off completed on April 24, 2015. |
See “Segment Operating Results” for a further discussion of changes in Enterprise, Consumer and Small Business - ILEC, Carrier, and Small Business - CLEC revenues.
41
Product Sales
Product sales consist of sales of various types of communications equipment to our customers. We also sell network equipment to contractors on a wholesale basis. Enterprise product sales includes high-end data and communications equipment which facilitate the delivery of advanced data and voice services to our enterprise customers. Consumer product sales include high-speed Internet modems, home networking equipment, computers and phones. Sales of high-speed Internet modems to consumers have declined as a result of our implementation of a modem rental program.
The following table presents the primary drivers of the changes in product sales for the three months ended March 31, 2016 compared to the same period a year ago:
Increase (Decrease) | |||||||||||
(Millions) | Amount | % | |||||||||
Increase in contractor sales | $ | 2.6 | |||||||||
Decrease in consumer product sales | (0.7 | ) | |||||||||
Decrease in enterprise product sales | (5.9 | ) | |||||||||
Net decrease in product sales | $ | (4.0 | ) | (11 | ) | ||||||
Cost of Services
Cost of services expense primarily consists of charges incurred for network operations, interconnection, bad debt and business taxes. Network operations charges include salaries and wages, materials, contractor costs, IT support and costs to lease certain network facilities. Interconnection consists of charges incurred to access the public switched network and transport traffic to the Internet, including charges paid to other carriers for access points where we do not own the primary network infrastructure. Other expense consists of third-party costs for ancillary voice and data services, business and financial services, bad debt and business taxes.
The following table presents the primary drivers of the changes in cost of services for the three months ended March 31, 2016 compared to the same period a year ago:
Increase (Decrease) | |||||||||||
(Millions) | Amount | % | |||||||||
Increase in interconnection expense (a) | $ | 8.6 | |||||||||
Increase in network operations (b) | 7.1 | ||||||||||
Increase in federal USF expenses (c) | 3.2 | ||||||||||
Decrease in other expense | (0.2 | ) | |||||||||
Decrease in postretirement and pension (d) | (2.4 | ) | |||||||||
Decrease in medical insurance (e) | (6.4 | ) | |||||||||
Decrease attributable to disposed businesses | (21.1 | ) | |||||||||
Net decrease in cost of services | $ | (11.2 | ) | (2 | ) | ||||||
(a) | Increase in interconnection expense was attributable to increased purchases of circuits due to the growth in data customers, as well as higher capacity circuits to service existing customers and increase the transport capacity of our network. |
(b) | Increase in network operations was primarily due to engineering, contract labor and overtime costs incurred to deploy premium high-speed Internet service to our customers. |
(c) | Increase in federal USF contributions was driven by an increase in the USF contribution factor for the three month period ended March 31, 2016, compared to the same period a year ago. |
(d) | Decrease in postretirement and pension expense primarily resulted from a curtailment gain recognized during the three month period ended March 31, 2016 related to the elimination of medical and prescription subsidies for certain active employees. See Note 5 for additional information. |
42
(e) | Decrease in medical insurance was primarily due to a reduction in healthcare benefit costs driven primarily by fewer employees and plan design changes. |
Cost of Products Sold
Cost of products sold represents the cost of equipment sales to customers. The changes in cost of products sold were generally consistent with the changes in product sales.
The following table presents the primary drivers of the changes in cost of products sold for the three months ended March 31, 2016 compared to the same period a year ago:
Increase (Decrease) | |||||||||||
(Millions) | Amount | % | |||||||||
Increase in sales to contractors | $ | 2.7 | |||||||||
Decrease in product sales to consumers | (0.9 | ) | |||||||||
Decrease in product sales to enterprise customers | (4.8 | ) | |||||||||
Net decrease in cost of products sold | $ | (3.0 | ) | (9 | ) | ||||||
Selling, General and Administrative (“SG&A”)
SG&A expenses result from sales and marketing efforts, advertising, IT support, costs associated with corporate and other support functions and professional fees. These expenses include salaries, wages and employee benefits not directly associated with the provisioning of services.
The following table presents the primary drivers of the changes in SG&A expenses for the three months ended March 31, 2016 compared to the same period a year ago:
Increase (Decrease) | |||||||||||
(Millions) | Amount | % | |||||||||
Decrease in postretirement and pension | $ | (0.9 | ) | ||||||||
Decrease in sales and marketing expenses | (2.2 | ) | |||||||||
Decrease attributable to disposed businesses | (4.4 | ) | |||||||||
Decrease in salaries and other benefits (a) | (5.0 | ) | |||||||||
Decrease in other costs | (8.7 | ) | |||||||||
Net decrease in SG&A | $ | (21.2 | ) | (9 | ) | ||||||
(a) | Decrease was primarily due to reduced headcount in our Enterprise segment to increase operating efficiency and restructure our sales and customer service workforce to improve the overall customer experience. |
Depreciation and Amortization Expense
Depreciation and amortization expense includes the depreciation of property, plant and equipment and the amortization of intangible assets.
The following table presents the primary drivers of the changes in depreciation and amortization expense for the three months ended March 31, 2016 compared to the same period a year ago:
Increase (Decrease) | |||||||||||
(Millions) | Amount | % | |||||||||
Decrease in amortization expense (a) | $ | (7.0 | ) | ||||||||
Decrease attributable to disposed businesses | (11.3 | ) | |||||||||
Decrease in depreciation expense (b) | (17.6 | ) | |||||||||
Net decrease in depreciation and amortization expense | $ | (35.9 | ) | (11 | ) | ||||||
43
(a) | Decrease in amortization expense reflected the use of the sum-of-the-years-digits method for customer lists. The effect of using an accelerated amortization method results in an incremental decline in expense each period as the intangible assets amortize. |
(b) | Decrease in depreciation expense was primarily due to the effects of fully depreciating at the end of 2015 a large number of assets acquired in conjunction with acquisitions we completed during late 2010 and 2011. |
Merger, Integration and Restructuring Costs
We incur costs to complete a merger or acquisition and integrate its operations into our business, which are presented as merger and integration expense in our consolidated results of operations. These costs include transaction costs, such as accounting, legal and broker fees; severance and related costs; IT and network conversion; rebranding; and consulting fees. We also incurred investment banking fees, legal, accounting and other consulting fees related to the spin-off of certain network and real estate assets into an independent, publicly traded real estate investment trust (“REIT”). During the fourth quarter of 2015, we began a network optimization project designed to consolidate traffic onto network facilities operated by us and reduce the usage of other carriers’ networks, including service areas acquired in the acquisition of PAETEC Holding, Corp. (“PAETEC”). In undertaking this initiative, which we expect to complete during 2016, we incurred costs to migrate traffic to lower cost circuits and to terminate existing contracts prior to their expiration. Costs related to the network optimization project and the REIT spin-off primarily account for the merger and integration costs incurred for the periods presented.
Restructuring charges are primarily incurred as a result of evaluations of our operating structure. Among other things, these evaluations explore opportunities to provide greater flexibility in managing and financing existing and future strategic operations, for task automation and the balancing of our workforce based on the current needs of our customers. Severance, lease exit costs and other related charges are included in restructuring charges.
During the first quarter of 2016, we incurred severance and other employee-related costs totaling $4.3 million related to the completion of several small workforce reductions. Restructuring charges in the first quarter of 2015 principally consist of $3.3 million of severance and other employee-related costs incurred in connection with completing several small workforce reductions and $3.1 million related to a special shareholder meeting held on February 20, 2015 to approve a one-for-six reverse stock split of Windstream Holdings’ common stock and the conversion of Windstream Corporation to Windstream Services.
Set forth below is a summary of merger, integration and restructuring costs for the three month periods ended March 31:
(Millions) | 2016 | 2015 | ||||||||||
Merger and integration costs: | ||||||||||||
Information technology conversion costs (a) | $ | — | $ | 3.5 | ||||||||
Costs related to REIT spin-off | — | 10.5 | ||||||||||
Network optimization and conversion costs | 4.2 | — | ||||||||||
Consulting and other costs | 0.8 | 0.1 | ||||||||||
Total merger and integration costs | 5.0 | 14.1 | ||||||||||
Restructuring charges | 4.4 | 7.0 | ||||||||||
Total merger, integration and restructuring costs | $ | 9.4 | $ | 21.1 | ||||||||
(a) | Information technology conversion costs incurred primarily consisted of redundant IT platform integrations designed to improve processes and drive efficiencies. |
Summary of Liability Activity Related to Both Merger and Integration Costs and Restructuring Charges
As of March 31, 2016, we had unpaid merger, integration and restructuring liabilities totaling $5.3 million, which consisted of $2.9 million associated with restructuring initiatives and $2.4 million related to merger and integration activities, which are included in other current liabilities in the accompanying consolidated balance sheet. Payments of these liabilities will be funded through operating cash flows (see Note 7).
44
Operating Income
Operating income increased $37.8 million, or 32 percent, during the three month period ended March 31, 2016, as compared to the same period in 2015. The increase was primarily due to growth in Enterprise revenues, reflecting increased demand for data and integrated services, additional CAF Phase II subsidy revenues and lower depreciation and amortization expense. These changes were partially offset by reductions in small business, carrier and switched access revenues due to customer losses from business closures and competition, declining demand for copper-based circuits to towers and the adverse effects of intercarrier compensation reform, respectively.
Net Loss on Early Extinguishment of Debt
The net loss on early extinguishment of debt was as follows for the three month period ended March 31:
(Millions) | 2016 | |||||||
Loss on early extinguishment from partial repurchases of 2017 Notes | $ | (48.5 | ) | |||||
Gain on early extinguishment from partial repurchases of 2021, 2022 and 2023 Notes | 13.1 | |||||||
Net loss on early extinguishment of debt | $ | (35.4 | ) | |||||
Windstream Services repurchased a portion of its 2017 Notes during the first quarter of 2016. The partial repurchase was accounted for as an extinguishment, and accordingly, Windstream Services recognized a pre-tax loss of $(48.5) million.
Windstream Services repurchased in the open market certain of its senior unsecured notes representing an aggregate principal amount of $154.2 million. The partial repurchase was accounted for under the extinguishment method of accounting, and as a result, Windstream Services recognized a pretax gain of $13.1 million.
Interest Expense
Set forth below is a summary of interest expense for the three month periods ended March 31:
(Millions) | 2016 | 2015 | ||||||||||
Senior secured credit facility, Tranche A | $ | — | $ | 4.3 | ||||||||
Senior secured credit facility, Tranche B | 6.0 | 17.5 | ||||||||||
Senior secured credit facility, revolving line of credit | 4.7 | 6.0 | ||||||||||
Senior unsecured notes | 79.1 | 94.5 | ||||||||||
Notes issued by subsidiaries | 1.7 | 11.3 | ||||||||||
Interest expense - long-term lease obligations: | ||||||||||||
Telecommunications network assets | 126.9 | — | ||||||||||
Real estate contributed to pension plan | 1.5 | 1.7 | ||||||||||
Impacts of interest rate swaps | 2.8 | 6.6 | ||||||||||
Interest on capital leases and other | 0.6 | 0.7 | ||||||||||
Less capitalized interest expense | (3.6 | ) | (1.5 | ) | ||||||||
Total interest expense | $ | 219.7 | $ | 141.1 | ||||||||
Interest expense increased $78.6 million, or 56 percent, for the three month period ended March 31, 2016, as compared to the same period in 2015. The increase in 2016 was primarily due to the additional interest associated with the long-term lease obligation under the master lease with CS&L. The increase was partially offset by reduced interest costs due to the retirement of amounts outstanding under Tranches A3, A4 and B4 of Windstream Services’ senior secured credit facility through the completion of the debt-for-debt exchange in conjunction with the REIT spin-off and the pay-off of the remaining balance of Tranche B4 and, to a lesser extent, the redemption of the 2018 Notes and PAETEC 2018 notes using a portion of the $1.035 billion cash payment received from CS&L in the REIT spin-off.
45
Income Taxes
During the first quarter of 2016, we recognized an income tax benefit of $31.0 million, as compared to an income tax benefit of $27.7 million for the same period in 2015. The income tax benefit recorded in the first quarter of 2016 reflected the loss before taxes offset by discrete tax expense of $69.6 million for a nondeductible impairment charge related to our investment in CS&L. Our effective tax rate was 11.8 percent for the three month period ended March 31, 2016 as compared to 123.7 percent in the same period in 2015. The effective rate for the three month period ended March 31, 2016 was impacted by the effect of the discrete item discussed above. Comparatively, the effective rate for the three month period ended March 31, 2015 was primarily driven by discrete income tax benefits of $22.4 million to adjust our deferred taxes for the effects of the reorganization of certain of our subsidiaries, including Windstream Services, to limited liability companies completed during the first quarter of 2015. These discrete income tax benefits were solely related to 2015 and had no impact to our 2016 income tax expense.
For 2016, our annualized effective income tax rate is expected to range between 38.0 percent and 39.0 percent, excluding one-time discrete items. Changes in our relative profitability, as well as recent and proposed changes to federal and state tax laws may cause the rate to change from historical rates. In determining our quarterly provision for income taxes, we use an estimated annual effective tax rate, which is based on our expected annual income, statutory rates and tax planning opportunities. Significant or unusual items are separately recognized in the quarter in which they occur.
SEGMENT OPERATING RESULTS
Our business unit organizational structure is focused on our core customer relationships, and as a result, we operate and report the following four customer-based segments:
Consumer and Small Business - ILEC - We manage as one business our residential and small business customers who reside in markets in which we are the ILEC due to the similarities with respect to service offerings, marketing strategies and customer service delivery. Products and services offered to these customers include traditional local and long-distance voice services and high-speed Internet services, which are delivered primarily over network facilities operated by us. We offer consumer video services primarily through a relationship with Dish Network LLC and we also own and operate cable television franchises in some of our service areas. We have launched Kinetic, a complete video entertainment offering in our Lincoln, Nebraska, Lexington, Kentucky and Sugar Land, Texas markets. We expect to roll out this new service to additional markets during the next few years. Residential customers can bundle voice, high-speed Internet and video services, to provide one convenient billing solution and receive bundle discounts. Small Business - ILEC services offer a wide range of advanced Internet, voice, and web conferencing products. These services are equipped to deliver high-speed Internet with competitive speeds, value added services to enhance business productivity and options to bundle services for a global business solution to meet our small business customer needs.
Carrier - Our Carrier operations consist of providing products and services to other communications services providers, including special access services, which provide network access and transport services to end users, and fiber-to-tower connections to support backhaul services to wireless carriers. We also offer on a wholesale basis voice and data transport services to other communications providers, including the resale of our services and the sale of unbundled network elements, which allow wholesale customers to provide voice and data services to their customers through the use of our network or in combination with their own networks.
Enterprise - Our enterprise operations consist of our business customer relationships that generate $1,500 or more in revenue per month. Products and services offered to these customers include integrated voice and data services, which deliver voice and broadband services over a single Internet connection, multi-site networking services which provide a fast and private connection between business locations, as well as a variety of other data services, including cloud computing and collocation and managed services as an alternative to traditional information technology infrastructure.
Small Business - CLEC - These operations consist of our business customer relationships that generate less than $1,500 in revenue per month and are located in service areas in which we are a CLEC and provide services over network facilities primarily leased from other carriers. Products and services provided to our Small Business - CLEC customers include integrated voice and data services, advanced data and traditional voice and long-distance services as well as value added services including online backup, managed web design and web hosting, and various e-mail services.
46
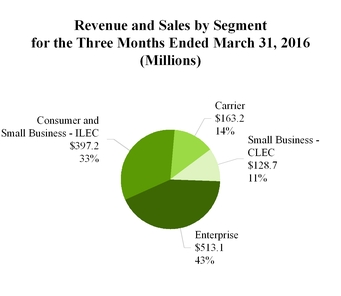
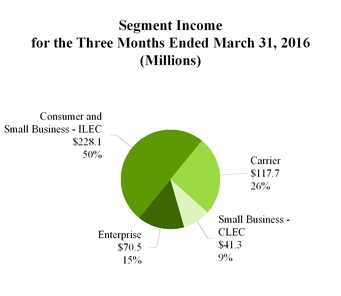
Our segment operating results presented below are based on how we assess operating performance and internally report financial information. We evaluate performance of the segments based on segment income, which is computed as segment revenues and sales less segment operating expenses. Segment revenues are based upon each customer’s classification to an individual segment and include all services provided to that customer. Certain operating revenues are derived from activities that are centrally-managed by us and, accordingly, these revenues are not included in the operating results of segments. These other operating revenues include revenue from federal and state universal service funds, CAF Phase II support, and funds received from federal access recovery mechanisms. We also generate other service revenues from providing switched access services, which include usage-based revenues from long-distance companies and other carriers for access to our network to complete long-distance calls, as well as reciprocal compensation received from wireless and other local connecting carriers for the use of network facilities. Other operating revenues also include certain surcharges assessed to our customers, including billings for our required contributions to federal and state USF programs. Revenues attributable to the sold data center and directory publishing businesses, as well as the consumer CLEC business transferred to CS&L are not assigned to the segments and are also included in other service revenues for all periods prior to the dates of disposal.
Segment expenses include specific expenses incurred as a direct result of providing services and products to segment customers; selling, general and administrative expenses that are directly associated with specific segment customers or activities; and certain allocated expenses which include network expenses, facilities expenses and other expenses, such as vehicle and real estate-related expenses. We do not assign depreciation and amortization expense, merger and integration costs, restructuring charges, stock-based compensation and pension costs to our segments, because these expenses are centrally managed and are not monitored by or reported to the chief operating decision maker by segment. Similarly, certain centrally-managed administrative functions, such as accounting and finance, information technology, legal and human resources, are not assigned to our segments. Interest expense and net loss on early extinguishment of debt have also been excluded from segment operating results because we manage our financing activities on a total company basis and have not assigned any long-term debt obligations to the segments. Other expense, net, other-than-temporary impairment of our investment in CS&L common stock, and income tax benefit are not monitored as a part of our segment operations and, therefore, these items have been excluded from our segment operating results.
See Note 11 to the consolidated financial statements for a reconciliation of total segment revenues and sales to consolidated revenues and sales and segment income to consolidated net (loss) income.
47
CONSUMER AND SMALL BUSINESS - ILEC SEGMENT
As of March 31, 2016, the Consumer and Small Business - ILEC segment includes approximately 1.6 million residential and small business customers. This segment generated $397 million in revenue and $228 million in segment income, or contribution margin, during the first quarter of 2016.
Strategy Within Consumer and Small Business - ILEC, we are focused on expanding and enhancing our broadband capabilities to generate solid and sustainable cash flows. We expect to grow revenue by continuing to increase broadband speeds and capacity throughout our territories. Project Excel, which began in late 2015, accelerates our plans to upgrade and modernize our broadband network by year-end 2016. This program upgrades our fiber-fed infrastructure with Very high-bit-rate Digital Subscriber Line Generation 2 (“VDSL2”) electronics to enable faster broadband speeds and enhances our backhaul capabilities to address future capacity demands and improve network reliability. Upon completion of Project Excel, 25 megabits per second (“Mbps”) speeds will be available to 54 percent of our broadband footprint and 50 Mbps speeds to 30 percent; which are very competitive offerings in our rural markets. These network upgrades will provide a great customer experience and, we believe will drive higher revenue per customer per month and allow us to increase market share. |  | ||
As previously discussed, we launched 1-Gigabit Internet service in four market areas to deliver faster speeds to more of our customer base. Additionally, CAF Phase II funding will support and expand our broadband capabilities to an additional 470,000 locations.
We expect increases in real-time streaming video and traditional Internet usage to drive demand for faster broadband speeds and generate increased revenues as customers upgrade their services. We also sell value-added Internet services, such as security and online back-up, to leverage our broadband capabilities.
Consumer and Small Business - ILEC Segment Results of Operations
The following table reflects the Consumer and Small Business - ILEC segment results of operations for the three months ended March 31:
Increase (Decrease) | |||||||||||||||||||
(Millions) | 2016 | 2015 | Amount | % | |||||||||||||||
Revenues and sales: | |||||||||||||||||||
Service revenues: | |||||||||||||||||||
High-speed Internet bundles (a) | $ | 261.1 | $ | 255.8 | $ | 5.3 | 2 | ||||||||||||
Voice-only (b) | 39.0 | 44.2 | (5.2 | ) | (12 | ) | |||||||||||||
Voice and miscellaneous | 11.6 | 12.2 | (0.6 | ) | (5 | ) | |||||||||||||
Total consumer | 311.7 | 312.2 | (0.5 | ) | — | ||||||||||||||
Small business - ILEC (c) | 85.1 | 89.5 | (4.4 | ) | (5 | ) | |||||||||||||
Total service revenues | 396.8 | 401.7 | (4.9 | ) | (1 | ) | |||||||||||||
Product sales | 0.4 | 1.1 | (0.7 | ) | (64 | ) | |||||||||||||
Total revenues and sales | 397.2 | 402.8 | (5.6 | ) | (1 | ) | |||||||||||||
Cost and expenses (d) | 169.1 | 163.2 | 5.9 | 4 | |||||||||||||||
Segment income | $ | 228.1 | $ | 239.6 | $ | (11.5 | ) | (5 | ) | ||||||||||
48
(a) | Increase in high-speed Internet bundle revenues was primarily due to the continued migration of customers to higher speeds, targeted price increases, and implementation of a modem rental program during 2015, partially offset by declines in high-speed Internet customers. Demand for faster broadband speeds are expected to favorably impact consumer high-speed Internet revenues, offsetting some of the decline in consumer voice revenues. |
(b) | Decrease in voice-only revenues was primarily attributable to the decline in households served due to the impacts of competition, partially offset by the effects of targeted price increases. |
(c) | Decrease was primarily attributable to lower usage for voice and long-distance services and the decline in customers due to the impacts of competition. |
(d) | The increase was primarily attributable to costs incurred to meet the FCC’s deadline of March 31, 2016 for broadband deployment to two-thirds of our required locations under CAF Phase I - Round 2. |
The following table reflects the Consumer and Small Business - ILEC segment operating metrics as of March 31:
Increase (Decrease) | ||||||||||||||||
(Thousands) | 2016 | 2015 | Amount | % | ||||||||||||
Consumer Operating Metrics: | ||||||||||||||||
Households served (a) | 1,430.7 | 1,516.5 | (85.8 | ) | (6 | ) | ||||||||||
High-speed Internet customers (b) | 1,092.0 | 1,132.4 | (40.4 | ) | (4 | ) | ||||||||||
Digital television customers (c) | 350.1 | 378.8 | (28.7 | ) | (8 | ) | ||||||||||
Small Business - ILEC customers (d) | 144.3 | 155.9 | (11.6 | ) | (7 | ) | ||||||||||
(a) | The decrease in the number of consumer households served was primarily attributable to the effects of competition from wireless carriers, cable companies and other providers using emerging technologies. For the three month period ended March 31, 2016, consumer households served decreased by 15,100 compared to a decrease of 12,200 for the same period in 2015. |
(b) | The decrease in consumer high-speed Internet customers was primarily due to the effects of competition from other service providers and increased penetration in the marketplace, as the number of households without high-speed Internet service continues to shrink. As of March 31, 2016, we provided high-speed Internet service to approximately 76 percent of our primary residential lines in service and approximately 77 percent of our total voice lines had high-speed Internet competition, primarily from cable service providers. For the three month period ended March 31, 2016, consumer high-speed Internet customers decreased by 3,100 compared to an increase of 800 for the same period in 2015. |
(c) | For the three month period ended March 31, 2016, digital television customers decreased by 9,200 compared to a decrease of 6,500 for the same period in 2015. |
(d) | The decrease in small business customers was primarily due to business closures and competition from cable companies. For the three month period ended March 31, 2016, small business customers decreased by 2,500 compared to a decrease of 4,300 for the same period in 2015. |
We expect the number of consumer households, consumer high-speed Internet customers, and small business customers in our ILEC footprint to continue to be impacted by the effects of competition.
49
CARRIER SEGMENT
The Carrier segment leverages our nationwide network to provide 100 Gbps bandwidth and transport services to wholesale partners, including telecom companies, content providers, and cable and other network operators. The carrier business unit produced $163 million in revenue and $118 million in contribution margin for the first quarter of 2016.
Strategy Our Carrier strategy is focused on expanding our network in strategic, high-traffic locations to drive new sales opportunities through the connection of our long-haul network to carrier hotels, international landing stations and data centers. We currently operate the sixth largest fiber network in the nation with approximately 125,000 route miles of fiber. Our fiber network links common interconnection points in tier one locations to our tier two and three markets, enabling our customers to reach their end users through unique and diverse routes. We have made significant investments in our network adding route miles and new access points. With further expansion of our fiber transport network through capital investment, we will enhance our ability to provide high bandwidth connectivity. We have also expanded our sales team to target high growth areas including content, international and cable television providers. | 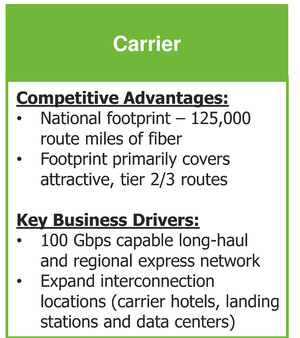 | ||
We believe that we are well positioned to stabilize our Carrier business through investment in our network, offering advanced products and solutions, targeting carrier and wholesale customers and controlling costs through our disciplined approach to capital and expense management.
Carrier Segment Results of Operations
The following table reflects the Carrier segment results of operations for the three months ended March 31, 2016:
Increase (Decrease) | |||||||||||||||||||
(Millions) | 2016 | 2015 | Amount | % | |||||||||||||||
Revenues: | |||||||||||||||||||
Core carrier (a) (c) | $ | 130.8 | $ | 138.4 | $ | (7.6 | ) | (5 | ) | ||||||||||
Wholesale (b) | 19.7 | 19.7 | — | — | |||||||||||||||
Total core carrier and wholesale | 150.5 | 158.1 | (7.6 | ) | (5 | ) | |||||||||||||
Wireless TDM (c) | 12.7 | 18.2 | (5.5 | ) | (30 | ) | |||||||||||||
Total revenues | 163.2 | 176.3 | (13.1 | ) | (7 | ) | |||||||||||||
Cost and expenses | 45.5 | 46.1 | (0.6 | ) | (1 | ) | |||||||||||||
Segment income | $ | 117.7 | $ | 130.2 | $ | (12.5 | ) | (10 | ) | ||||||||||
(a) | Core carrier revenues primarily include revenues from other carriers for special access circuits and fiber connections. |
(b) | Wholesale revenues represent voice and data services sold to other carriers on a wholesale basis. |
(c) | The decrease in these revenues was attributable to declines in special access charges for dedicated copper-based circuits as carriers migrate to fiber-based networks. We expect these revenues to be adversely impacted as carriers continue to migrate traffic to fiber-based connections. |
50
ENTERPRISE SEGMENT
Our Enterprise segment provides advanced communications services to enterprise customers. During the first quarter of 2016, the Enterprise segment generated $513 million in revenue and $71 million in contribution margin.
Strategy The strategy for our Enterprise business is centered on growing revenue and increasing profitability. As one of the Country’s largest network providers, our nationwide presence and broad portfolio of customized solutions provide enterprise customers with a unique service model. We target enterprise customers generating between $5,000 to $100,000 in monthly revenue. This competitive differentiation combined with an agile sales and service model has enabled us to increase market share and grow revenue. We believe we can drive meaningful improvements in our Enterprise margins by focusing on profitable growth, increasing sales on our own network facilities to reduce third party network access costs and improving of efficiency with system and process enhancements. We made progress on this goal in 2016 by increasing margins from 10% in the first quarter of 2015 to 14% in the first quarter of 2016 and we expect to make further improvements over the next 3 years. | 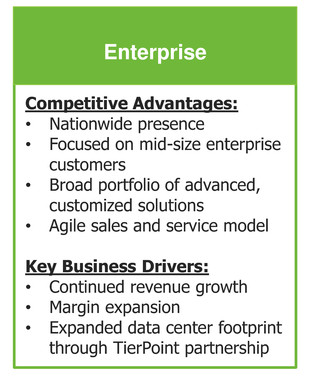 | ||
To grow profitability, we are focused on selling the right products to the right customers by principally targeting mid-size customers, simplifying product offerings and managing profit margins at a customer account level. We expect to improve operating efficiencies and enhance the customer experience by further integrating our internal processes in sales, service delivery, customer care and repair. In addition, we continue to follow an aggressive expense management and capital efficient strategy to drive reductions in network access costs, create on-network sales opportunities and improve our competitiveness in the market place.
Enterprise Service Revenues
The following table reflects the Enterprise segment results of operations for the three months ended March 31, 2016:
Increase (Decrease) | |||||||||||||||||||
(Millions) | 2016 | 2015 | Amount | % | |||||||||||||||
Revenues and sales: | |||||||||||||||||||
Service revenues: | |||||||||||||||||||
Voice and long distance (a) | $ | 148.1 | $ | 152.0 | $ | (3.9 | ) | (3 | ) | ||||||||||
Data and integrated services (b) | 317.3 | 298.7 | 18.6 | 6 | |||||||||||||||
Miscellaneous | 26.0 | 25.0 | 1.0 | 4 | |||||||||||||||
Total service revenues | 491.4 | 475.7 | 15.7 | 3 | |||||||||||||||
Product sales | 21.7 | 27.6 | (5.9 | ) | (21 | ) | |||||||||||||
Total revenues and sales | 513.1 | 503.3 | 9.8 | 2 | |||||||||||||||
Cost and expenses (c) | 442.6 | 451.4 | (8.8 | ) | (2 | ) | |||||||||||||
Segment income | $ | 70.5 | $ | 51.9 | $ | 18.6 | 36 | ||||||||||||
(a) | Decrease in traditional voice and long-distance service revenues was primarily attributable to lower usage, adverse effects of competition and the migration of existing customers to integrated services and bundled offerings. |
(b) | Increase in data and integrated services revenues was primarily due to continued demand for advanced data services and customer migration to our integrated voice and data services. |
(c) | Decrease was primarily related to reductions in headcount to increase operating efficiency and restructure our sales and customer service workforce to improve the overall customer experience, partially offset by an increase in customer access costs directly related to the growth in enterprise data and integrated services revenues. |
51
The following table reflects the Enterprise segment operating metrics as of March 31:
Increase (Decrease) | |||||||||||||||
(Thousands) | 2016 | 2015 | Amount | % | |||||||||||
Enterprise customers | 26.4 | 26.2 | 0.2 | 1 | |||||||||||
Enterprise customers represent those customer relationships that generate $1,500 or more in revenue per month. Our enterprise customer base has remained relatively unchanged during 2016. For the three month period ended March 31, 2016, Enterprise customers increased by 100 compared to a decrease of 100 for the same period in 2015.
SMALL BUSINESS - CLEC SEGMENT
Our Small Business - CLEC segment consists of small business customers residing outside of our ILEC footprint. During the first quarter of 2016, this segment generated revenue of $129 million and contribution margin of $41 million. Our Small Business - CLEC strategy is focused on retaining our most profitable customers, selling incremental services and locations to existing customers, targeting new sales in select markets, and managing customer-level profit margins to moderate revenue and contribution margin declines and maximize profitability. Operational efficiency and a highly disciplined sales and support model are cornerstones of our Small Business - CLEC strategy that should enable us to maximize cash flows generated from this business. Products and services provided to our Small Business - CLEC customers include integrated voice and data services, advanced data and traditional voice and long-distance services. We also offer on-line back-up, remote IT, managed web design, web hosting and various email services to small business customers in our CLEC footprint. |  | ||
Similar to our Small Business - ILEC operations, we experience competition from cable television companies and other communications carriers in areas served by our Small Business - CLEC segment.
Small Business - CLEC Service Revenues
The following table reflects the Small Business - CLEC segment results of operations for the three months ended March 31, 2016:
Increase (Decrease) | |||||||||||||||||||
(Millions) | 2016 | 2015 | Amount | % | |||||||||||||||
Service revenues (a) | $ | 128.7 | $ | 146.6 | $ | (17.9 | ) | (12 | ) | ||||||||||
Cost and expenses (b) | 87.4 | 98.0 | (10.6 | ) | (11 | ) | |||||||||||||
Segment income | $ | 41.3 | $ | 48.6 | $ | (7.3 | ) | (15 | ) | ||||||||||
(a) | The decrease was primarily due to the decline in customers discussed below, partially offset by targeted price increases. For 2016, we are focused on customer retention and selling incremental services to existing customers to enhance profitable revenue opportunities. |
(b) | The decrease was primarily due to a decrease in network access costs directly related to the decline in customers. |
52
The following table reflects the Small Business - CLEC segment operating metrics as of March 31:
Increase (Decrease) | ||||||||||||||||
(Thousands) | 2016 | 2015 | Amount | % | ||||||||||||
Small Business - CLEC Customers | 86.4 | 107.3 | (20.9 | ) | (19 | ) | ||||||||||
The decrease in small business customers was primarily due to business closures and competition from cable companies. For the three month period ended March 31, 2016, small business customers decreased by 4,800 compared to a decrease of 200 for the same period in 2015.
Regulatory Matters
We are subject to regulatory oversight by the FCC for particular interstate matters and state public utility commissions (“PUCs”) for certain intrastate matters. We are also subject to various federal and state statutes that direct such regulations. We actively monitor and participate in proceedings at the FCC and PUCs and engage federal and state legislatures on matters of importance to us.
From time to time federal and state legislation is introduced dealing with various matters that could affect our business. Most proposed legislation of this type never becomes law. Accordingly, it is difficult to predict what kind of legislation, if any, may be introduced and ultimately become law.
Federal Regulation and Legislation
Intercarrier Compensation and USF Reform
In November 2011, the FCC released an order (“the Order”) that established a framework for reform of the intercarrier compensation system and the federal USF. The Order included two primary provisions:
• | the elimination of terminating switched access rates and other per-minute terminating charges between service providers by 2018, through annual reductions in the rates, mitigated in some cases by two recovery mechanisms; and |
• | the provision of USF support for voice and broadband services. |
In reforming the USF, the Order established the CAF, which included a short-term (“CAF Phase I”) and a longer-term (“CAF Phase II”) framework. CAF Phase I provides for continued legacy USF funding frozen at 2011 levels as well as the opportunity for incremental broadband funding to a number of unserved and underserved locations. In Round 2 of CAF Phase 1 incremental support, we were authorized to receive an additional $86.7 million in support for upgrades and new deployments of broadband service. Of the total amount of $86.7 million made available to us, we received $60.7 million in December 2013 and the remaining $26.0 million in the first quarter of 2014. Pursuant to commitments we made while the FCC was considering the rules for Round 2, we will match, on at least a dollar-for-dollar basis, the total amount of Round 2 funding received. In July 2016, we will report to the FCC our compliance with its March 2016 deadline for broadband deployment to two-thirds of our required locations for Round 2, and we expect to meet our match commitment for the program. The portion of capital expenditures funded by us are included in our capital expenditure totals for each period presented in the accompanying consolidated statements of cash flow.
In August 2015, Windstream accepted CAF Phase II support offers for 17 of its 18 states where it is an incumbent provider, totaling $175.0 million in annual funding compared to our previous annual funding of approximately $100.0 million. Support was retroactive to the beginning of 2015 and will continue for six additional years. Windstream will be obligated to offer broadband service at 10/1 Mbps or better to approximately 400,000 eligible locations in high-cost areas in those 17 states. Windstream declined the statewide offer in just one state, New Mexico, where Windstream’s projected cost to comply with FCC deployment requirements greatly exceeded the funding offer. We will still be eligible to participate in a competitive bidding process for CAF Phase II support in New Mexico, along with other interested eligible competitors; however, the rules for the competitive bidding process are still under consideration by the FCC, and have not yet been finalized. In an order released in December 2014, the FCC stated that it expected to be prepared to conduct the competitive bidding process in 2016. We will continue to receive annual USF funding in New Mexico frozen at 2011 levels until the implementation of CAF Phase II competitive bidding is complete.
53
As a result, we expect to receive CAF Phase II and frozen USF support as follows:
(Millions) | 2016 | 2017 | 2018 | 2019 and Thereafter | Total | ||||||||||
CAF Phase II support | $ | 174.9 | $ | 174.9 | $ | 174.9 | $ | 524.7 | $ | 1,049.4 | |||||
Transitional Frozen USF support | 12.6 | 7.7 | 2.8 | — | 23.1 | ||||||||||
New Mexico Frozen USF support | 4.6 | 2.3 | — | — | 6.9 | ||||||||||
Total | $ | 192.1 | $ | 184.9 | $ | 177.7 | $ | 524.7 | $ | 1,079.4 | |||||
The above payouts include transitional support through mid-2018 in the six states in which the CAF Phase II support allocated to and elected by us is less than the amount we received in legacy USF high-cost support. These amounts also assume that we will deploy to 100 percent of the required locations in each state. On December 31, 2015, we elected the flexibility to deploy to at least 95 percent but less than 100 percent in five of the states in which we accepted CAF Phase II support. We will be able to decide how much, if any, of the flexibility we use. If we avail ourselves of all of the flexibility, however, we would have to return a total of approximately $50.0 million by 2021. We expect the incremental CAF Phase II receipts to be sufficient to cover the program’s capital obligations and to provide significant opportunities for Windstream to enhance broadband services in our more rural markets.
As part of the Order’s reform of intercarrier compensation, the FCC established two recovery mechanisms that mitigate the revenue reductions resulting from the reduction and ultimate elimination of terminating access rates. First, the FCC established the ARC, a fee which may be assessed to some of our retail customers. Second, the ARM is a form of additional federal universal service support designed to allow carriers to recover some of the revenue reductions that cannot be recovered through assessment of the ARC. Carriers are required to use ARM support to build and operate broadband networks in areas substantially unserved by an unsubsidized competitor offering fixed voice and broadband service. Our ARM support is expected to decrease incrementally from $52.3 million in 2014 to an estimated $12.3 million in 2017, with a portion of the decrease offset by future increases in ARC revenues. Absent a change by the FCC to its current rules, the ARM will phase out annually in one-third increments, beginning in July 2017, and will be eliminated completely as of July 2019.
Set forth below is a summary of intercarrier compensation revenue and federal USF and CAF Phase II support included in regulatory revenues within the consolidated statements of operations for the three month periods ended March 31 :
(Millions) | 2016 | 2015 | ||||||||||
Intercarrier compensation revenue | $ | 35.9 | $ | 46.1 | ||||||||
Federal universal service and CAF Phase II support | $ | 48.5 | $ | 25.1 | ||||||||
IntraMTA Switched Access Litigation
Several of our companies are defendants in approximately 25 lawsuits filed by Verizon and Sprint long-distance companies alleging that our companies may not bill them switched access charges for calls between wireline and wireless devices that originate and terminate within the same Major Trading Area. The complaints seek historical relief in the form of refunds and prospective relief concerning future billings. There are approximately 50 other such lawsuits against hundreds of defendants. All of the suits have been consolidated in a single federal district court, which dismissed the claims on November 17, 2015. In March 2016, the plaintiffs were denied permission from the district court to appeal the dismissal of their claims, which was required in this instance given certain procedural issues. The suits are continuing with respect to Verizon and Sprint’s state claims, as well as for defendants’ counterclaims (including those of Windstream) for return of all withholdings. The subject matter of the suits is also the topic of a pending petition for declaratory ruling before the FCC, to which the lawsuits may be referred. The outcome of the disputes is currently not predictable, given the uncertainty concerning the ultimate venue of the disputes and the amount of traffic being disputed.
Last-Mile Access
Windstream is actively engaged in policy advocacy in various FCC proceedings that address the rates, terms and conditions for access to the “last mile” facilities we need to serve retail business data service (i.e., special access) customers through our competitive companies. In 2015, we incurred approximately $1.4 billion in interconnection expense and most of that was attributable to last-mile access. For the vast majority of our customers, last mile facilities, the wires (“loops”) to a customer location from a central office, are not economic for Windstream to duplicate through its own investment and are not available from providers other than the incumbent carrier. Therefore, we often lease those connections from incumbent carriers as one of two distinct product types: either unbundled network elements (“UNEs”), which by law are not available in all areas but are subject to strict regulatory
54
standards, or business data service inputs, widely available from incumbents but subject to more flexible regulatory standards. One such FCC proceeding addressing business data services involves a comprehensive review of business data service rules, begun in 2012 with an FCC order finding that the rules the FCC has had in place since 1999 were not working as intended. Another has been an FCC Wireline Competition Bureau investigation, commenced in October 2015, into whether the volume and term commitments and associated fees and penalties contained in specified incumbent special access pricing plans are anti-competitive, comport with applicable law or impede the forthcoming technology transition. While this investigation now is largely closed, the FCC’s consideration of appropriate regulation of rates, terms, and conditions is on-going, and we are not able to predict what the ultimate impact will be of the FCC’s determinations on these issues.
State Regulation and Legislation
We recognize revenue from the receipt of state universal service funding in a limited number of states in which we operate. For the three month period ended March 31, 2016, we recognized $24.1 million, in state USF revenue, which included approximately $13.3 million, from the Texas USF. These payments are intended to provide support, apart from the federal USF receipts, for the high cost of operating in certain rural markets.
There are two high-cost programs of the Texas USF, one for large companies and another for small companies. In the three month period ended March 31, 2016, we received $11.7 million from the large company program and $1.6 million from the small company program.The purpose of the Texas USF is to assist telecommunications carriers with providing basic local telecommunications services at reasonable rates to customers in high cost rural areas and to qualifying low-income and disabled customers. By order of the Texas PUC, the Texas USF distributes support to eligible carriers serving areas identified as high cost, on a per-line basis. Texas USF support payments are based on the number of actual lines in service and therefore are subject to reductions when customers discontinue service or migrate to a competitive carrier. All service providers of telecommunications services in Texas contribute to the Texas USF through the payment of a monthly surcharge collected from their customers.
In 2013, the Texas Legislature passed a law that requires set reductions to providers’ state USF support over a period of years beginning in 2017 unless providers can demonstrate a “financial need” for continued support. On December 1, 2014, the Texas PUC adopted a financial needs test that allows providers to petition for continued support under a two-step process that takes into consideration the level of competition and the provider’s expenses. On December 28, 2015, we filed a petition for our Texas affiliate’s large company support. On March 24, 2016, Windstream and the PUC staff jointly filed a settlement agreement stating that our petition satisfies the test necessary to continue support for all but two of our 177 exchanges in Texas. The agreement, which would preserve over $42 million of support, was preliminarily approved by the Commissioners at an Open Meeting on May 4, 2016. We expect a final order in approximately the next month. We also may file petitions next year for continuation of small company support.
In New Mexico, where we have historically received $8.4 million in annual support, the Public Regulation Commission (“PRC”) adopted modified USF rules in November 2014 that resulted in a reduction in annual support to $6.9 million in 2015. We filed an appeal of those rules with the New Mexico Supreme Court in 2015 and in March 2016, the Court granted our appeal and remanded the matter to the PRC for further consideration. During the pendency of the appeal, the PRC adopted additional rule modifications that resulted in continued albeit more moderate reductions. We filed an appeal of the modified rules with the New Mexico Supreme Court in March 2016. In light of the Court remand and the pendency of the most recent appeal, it is difficult at this time to predict the financial impact.
In Nebraska, where we received $5.3 million from the state high cost fund in 2015, the Public Service Commission (“PSC”) announced reforms during the third quarter of 2015, for price-cap carriers that will freeze 2016 support at 2015 levels - with 50 percent allocated to ongoing operations and 50 percent allocated to broadband projects that must be pre-approved by the PSC. In November 2015, the PSC announced that it planned to reconsider the allocations, but in the interim, support will continue to flow based on the reforms, subject to true-ups if there is a change in the allocation amounts. It is difficult to predict the impact, if any, that might result from the reconsideration proceeding.
Universal service reform is also possible in several other states including Oklahoma, Pennsylvania, and South Carolina. Annually, we receive $3.4 million annually from the Oklahoma fund, $13.3 million from the Pennsylvania fund, and $2.0 million from the South Carolina fund. We cannot estimate at this time the financial impact that would result from changes, if any, to these other state funds.
55
FINANCIAL CONDITION, LIQUIDITY AND CAPITAL RESOURCES
Liquidity and Capital Resources
We rely largely on operating cash flows and long-term debt to provide for our liquidity requirements. We expect cash flows from operations will be sufficient to fund our ongoing working capital requirements, planned capital expenditures, scheduled debt principal and interest payments, lease payments due under the master lease agreement with CS&L, and dividend payments. We also have access to capital markets and available borrowing capacity under our revolving credit agreement. As previously discussed, we are positioned to retire additional long-term debt through the monetization of our retained 19.6 percent ownership interest in CS&L, which we expect to complete within 24 months from the date of the spin-off, subject to market conditions. Based on CS&L’s announced dividend practice to pay a quarterly dividend of $.60 per share, we expect to earn dividend income of approximately $17.6 million in each quarter that we continue to hold the CS&L common stock.
From time to time, we may seek transactions to optimize our capital structure, including entering into transactions to exchange debt for shares of CS&L common stock, repurchase or redeem our outstanding indebtedness (including by means of open market purchases, privately negotiated repurchases, tender offers and/or redemptions pursuant to the debt’s terms), or seek to refinance our outstanding debt or may otherwise seek transactions to reduce interest expense. Our ability to consummate any such transaction will depend on prevailing market conditions, our liquidity requirements, contractual restrictions and other factors. Any of these transactions could impact our financial results. We cannot assure you if or when we will consummate any such transactions or the terms of any such transaction.
We have evaluated and we continue to evaluate possible acquisition and disposition transactions on an on-going basis. At any time we may be engaged in discussions or negotiations with respect to possible acquisitions and/or dispositions. We cannot assure you if or when we will consummate any such transaction or the terms of any such transaction.
Our cash position increased by $43.3 million to $74.6 million at March 31, 2016, from $31.3 million at December 31, 2015, as compared to an increase of $46.2 million during the same period in 2015. Cash inflows in the three month period of 2016 were primarily from operating activities and incremental debt proceeds. These inflows were partially offset by cash outflows for capital expenditures, repayments of debt, and repurchases of our common stock.
Historical Cash Flows
The following table summarizes our cash flow activities for the three month periods ended March 31:
(Millions) | 2016 | 2015 | ||||||
Cash flows provided from (used in): | ||||||||
Operating activities | $ | 127.2 | $ | 243.8 | ||||
Investing activities | (257.6 | ) | (192.7 | ) | ||||
Financing activities | 173.7 | (4.9 | ) | |||||
Increase in cash and cash equivalents | $ | 43.3 | $ | 46.2 | ||||
Cash Flows - Operating Activities
Cash provided from operations is our primary source of funds. Cash flows from operating activities decreased by $116.6 million in the three month period ended March 31, 2016, as compared to the same period in 2015. The decrease was primarily attributable to additional interest expense of $126.9 million attributable to the master lease agreement with CS&L, decreases in small business, carrier and switched access revenues and changes in working capital mostly driven by timing differences in the payment of vendor invoices.
56
We are currently utilizing net operating loss carryforwards (“NOLs”) and other income tax initiatives to lower our cash income tax obligations during 2016. As a result, we expect cash income tax payments to be less than $20.0 million in 2016.
Windstream Holdings’ board of directors adopted a shareholder rights plan designed to protect our NOLs from the effect of limitations imposed by federal and state tax rules following an ownership change. This plan was designed to deter an ownership change (as defined in IRC Section 382) from occurring, and therefore protect our ability to utilize our federal and state net operating loss carry forwards in the future. The plan is not meant to be an anti-takeover measure and our board of directors has established a procedure to consider requests to exempt the acquisition of Windstream Holdings common stock from the rights plan, if such acquisition would not limit or impair the availability of our NOLs.
Cash Flows - Investing Activities
Cash used in investing activities primarily includes investments in our network to upgrade and expand our service offerings as well as spending on strategic initiatives. Cash used in investing activities increased $64.9 million in the three month period ended March 31, 2016, as compared to the same period in 2015, primarily due to increased capital expenditures, further discussed below.
Capital expenditures were $263.8 million for the three month period ended March 31, 2016 compared to $189.3 million for the same period in 2015, an increase of $74.5 million. During the first three months of 2016, the majority of our capital spend was directed toward fiber expansion and consumer broadband upgrades of our network. Capital expenditures for the first quarter of 2016 also include $33.7 million of incremental spend related to Project Excel, a capital program begun in late 2015 that accelerates our plans to upgrade our broadband network by the end of 2016 funded by a portion of the proceeds from the sale of the data center business.
Excluding approximately $200.0 million in capital expenditures related to Project Excel, we expect total 2016 capital expenditures to range between $800.0 million to $850.0 million.
Cash Flows - Financing Activities
Cash provided from financing activities was a net inflow of $173.7 million for the three month period ended March 31, 2016 compared to a net use of $4.9 million for the same period in 2015. The change was primarily attributable to the additional borrowings under the senior secured credit facility.
Proceeds from new issuances of long-term debt during the first three months of 2016 were $1,278.0 million which consisted of new borrowings of $600.0 million under Tranche B6 of Windstream Services’ senior secured credit facility, which were issued at a discount, the proceeds of which were used to repurchase the 2017 Notes and other Windstream Services’ debt obligations, and the incurrence of new borrowings of $693.0 million under the revolving line of credit. Proceeds from new issuances of long-term debt were $490.0 million during the first quarter of 2015 and consisted solely of new borrowings under the revolving line of credit.
Debt repayments for the three months ended March 31, 2016 totaled $985.3 million and primarily consisted of cash outlays totaling $573.8 million in connection with the repurchase of $441.1 million of aggregate principal amount 7.875 percent notes due November 1, 2017 (the “2017 Notes”) under a cash tender offer and open market repurchases of $154.2 million of aggregate principal amount of senior unsecured notes. During the first quarter of 2016, Windstream Services also repaid $405.0 million of borrowings under its revolving line of credit. Comparatively, debt repayments for the three month period of 2015 principally consisted of the repayment of $295.0 million of borrowings under the revolving line of credit.
During the first three months of 2016, dividends paid to shareholders were $14.9 million, which was a decrease of $136.6 million, as compared to the same period in 2015, reflecting the decline in our quarterly dividend rate following the REIT spin-off. On May 4, 2016, we declared a cash dividend of $.15 per share on our common stock which is payable on July 15, 2016, to shareholders of record on June 30, 2016.
Our dividend practice can be changed at any time at the discretion of our board of directors, and is subject to the restricted payment capacity under Windstream Services’ debt covenants as further discussed below. Accordingly, we cannot assure you we will continue paying dividends at the current quarterly rate of $.15 per share. See “Risk Factors” in Item 1A of Part I of our Annual Report on Form 10-K for the year ended December 31, 2015, for additional information concerning our dividend practice.
57
Debt and Dividend Capacity
Windstream Holdings has no debt obligations. All of our debt, including the facility described below, has been incurred by our subsidiaries (primarily Windstream Services). Windstream Holdings is neither a guarantor of nor subject to the restrictive covenants imposed by such debt.
As of March 31, 2016, we had $5,445.0 million in long-term debt outstanding, including current maturities (see Note 2). As of March 31, 2016, the amount available for borrowing under Windstream Services’ revolving line of credit was $638.9 million.
As a result of the debt-for-debt exchange, completion of the long-term debt tender offers, and other repayments, Windstream Services decreased its long-term debt outstanding by approximately $3.5 billion. As of the spin-off date, Windstream retained a passive ownership interest of approximately 19.6 percent of the common stock of CS&L. Windstream intends to use all of its shares of CS&L to retire additional Windstream Services debt within 24 months from the date of the spin-off, subject to market conditions. In conjunction with the spin-off, Windstream Services amended its senior secured credit facility to extend the maturity of its revolving credit facility to April 24, 2020. Otherwise, the borrowing capacity under the amended revolving credit agreement was unchanged and provides for borrowings up to an aggregate principal amount of $1,250.0 million.
As of March 31, 2016, Windstream Services had approximately $596.1 million of restricted payment capacity as governed by its senior secured credit facility. Following the completion of the spin-off and amendment of the credit facility on April 24, 2015, Windstream Services’ credit agreement was amended to (i) reset the restricted payment capacity to $750 million and (ii) among other things, exclude the master lease payment as a future restricted payment. The restricted payment capacity may limit the amount of dividends Windstream Services may distribute to Windstream Holdings to fund future dividend payments to Windstream Holdings’ shareholders. Under terms of the credit facility, payments required under the master lease are deducted from OIBDA. Windstream Services builds additional capacity through cash generated from operations while dividend distributions to Windstream Holdings, and other certain restricted investments reduce the available restricted payments capacity. Windstream Services will continue to consider free cash flow accretive initiatives.
Debt Covenants and Amendments
The terms of the credit facility and indentures issued by Windstream Services include customary covenants that, among other things, require Windstream Services to maintain certain financial ratios and restrict its ability to incur additional indebtedness. These financial ratios include a maximum leverage ratio of 4.5 to 1.0 and a minimum interest coverage ratio of 2.75 to 1.0. In addition, the covenants include restrictions on dividend and certain other types of payments.
Certain of Windstream Services’ debt agreements contain various covenants and restrictions specific to the subsidiary that is the legal counterparty to the agreement. Under its long-term debt agreements, acceleration of principal payments would occur upon payment default, violation of debt covenants not cured within 30 days, a change in control including a person or group obtaining 50 percent or more of Windstream Services’ outstanding voting stock, or breach of certain other conditions set forth in the borrowing agreements. At March 31, 2016, Windstream Services was in compliance with all debt covenants and restrictions.
58
Windstream Services’ senior secured credit facility and its indentures include maintenance covenants derived from certain financial measures that are not calculated in accordance with accounting principles generally accepted in the United States (“non-GAAP financial measures”). These non-GAAP financial measures are presented below for the sole purpose of demonstrating our compliance with Windstream Services’ debt covenants and were calculated as follows at March 31, 2016:
(Millions, except ratios) | |||
Gross leverage ratio: | |||
Long term debt including current maturities | $ | 5,445.0 | |
Capital leases, including current maturities | 41.4 | ||
Total long term debt and capital leases | $ | 5,486.4 | |
Operating income, last twelve months | $ | 549.1 | |
Depreciation and amortization, last twelve months | 1,330.6 | ||
Other expense adjustments required by the credit facility and indentures (a) | (468.0 | ) | |
Adjusted earnings before interest, taxes, depreciation and amortization (“Adjusted EBITDA”) | $ | 1,411.7 | |
Leverage ratio (b) | 3.89 | ||
Maximum gross leverage ratio allowed | 4.50 | ||
Interest coverage ratio: | |||
Adjusted EBITDA | $ | 1,411.7 | |
Interest expense, last twelve months | $ | 891.8 | |
Adjustments required by the credit facility and indentures (c) | (509.8 | ) | |
Adjusted interest expense | $ | 382.0 | |
Interest coverage ratio (d) | 3.70 | ||
Minimum interest coverage ratio allowed | 2.75 | ||
(a) | Adjustments required by the credit facility and indentures primarily consist of the inclusion of the annual cash rental payment due under the master lease agreement with CS&L and the exclusion of pension and share-based compensation expense, non-recurring merger, integration and restructuring charges. |
(b) | The gross leverage ratio is computed by dividing total debt by adjusted EBITDA. |
(c) | Adjustments required by the credit facility and indentures primarily consist of the inclusion of capitalized interest and amortization of the discount on long-term debt, net of premiums, and the exclusion of the interest expense attributable to the long-term lease obligation under the master lease agreement with CS&L. |
(d) | The interest coverage ratio is computed by dividing adjusted EBITDA by adjusted interest expense. |
Credit Ratings
As of March 31, 2016, Moody’s Investors Service, Standard & Poor’s (“S&P”) Corporation and Fitch Ratings had granted the following senior secured, senior unsecured and corporate credit ratings:
Description | Moody’s | S&P | Fitch | |||
Senior secured credit rating (a) | B1 | BB | BB+ | |||
Senior unsecured credit rating (a) | B2 | B+ | BB- | |||
Corporate credit rating (b) | B1 | B+ | BB- | |||
Outlook (b) | Stable | Stable | Stable | |||
(a) | Ratings assigned to Windstream Services. |
(b) | Corporate credit rating and outlook assigned to Windstream Services for Moody’s and Fitch, while S&P assigns corporate credit rating and outlook to Windstream Holdings, Inc. |
59
Factors that could affect our short and long-term credit ratings would include, but are not limited to, a material decline in our operating results, increased debt levels relative to operating cash flows resulting from future acquisitions, increased capital expenditure requirements, or changes to our dividend policy. If our credit ratings were to be downgraded, we might incur higher interest costs on future borrowings, and our access to the public capital markets could be adversely affected.
Our exposure to interest risk is further discussed in the Market Risk section below. A downgrade in our current short or long-term credit ratings would not accelerate scheduled principal payments of our existing long-term debt.
Off-Balance Sheet Arrangements
We do not use securitization of trade receivables, affiliation with special purpose entities, variable interest entities or synthetic leases to finance our operations. Additionally, we have not entered into any arrangement requiring us to guarantee payment of third party debt or to fund losses of an unconsolidated special purpose entity.
Contractual Obligations and Commitments
As a result of the issuance of $600.0 million in a new secured term loan and the repurchases of $595.3 million of long-term debt completed in the first quarter of 2016, Windstream Services’ long-term debt obligations changed from December 31, 2015. The table below presents Windstream Services’ long-term debt obligations as of March 31, 2016 reflecting these changes:
Obligations by Period | ||||||||||||||||||||
(Millions) | Less than 1 Year | 1 - 3 Years | 3 - 5 Years | More than 5 years | Total | |||||||||||||||
Long-term debt, including current maturities (a) | $ | 11.9 | $ | 393.3 | $ | 2,429.0 | $ | 2,685.7 | $ | 5,519.9 | ||||||||||
Interest payments on long-term debt obligations (b) | 349.5 | 669.6 | 592.9 | 383.0 | 1,995.0 | |||||||||||||||
Total | $ | 361.4 | $ | 1,062.9 | $ | 3,021.9 | $ | 3,068.7 | $ | 7,514.9 | ||||||||||
(a) | Excludes $(8.7) million of unamortized discounts (net of premiums) and $66.2 million of unamortized debt issuance costs included in long-term debt at March 31, 2016. |
(b) | Variable rates on Tranche B5 and B6 of the senior secured credit facility are calculated in relation to LIBOR, which was 0.44 percent at March 31, 2016. |
Except for the amounts presented above, there have been no significant changes in our other contractual obligations and commitments since December 31, 2015, as set forth in our Annual Report on Form 10-K.
Reconciliation of Non-GAAP Financial Measures
From time to time, we will reference certain non-GAAP measures in our filings. Management’s purpose for including these measures is to provide investors with measures of performance that management uses in evaluating the performance of the business. These non-GAAP measures should not be considered in isolation or as a substitute for measures of financial performance reported under GAAP. Following is a reconciliation of non-GAAP financial measures to the most closely related financial measure reported under GAAP referenced in this filing.
Operating income before depreciation and amortization to GAAP operating income:
Three Months Ended March 31, | ||||||||||||||||
(Millions) | 2016 | 2015 | % | |||||||||||||
Operating income | $ | 157.7 | $ | 119.9 | ||||||||||||
Depreciation and amortization | 304.8 | 340.7 | ||||||||||||||
OIBDA (a) | $ | 462.5 | $ | 460.6 | — | |||||||||||
(a) | OIBDA is defined as operating income plus depreciation and amortization expense. We believe this measure provides investors with insight into the true earnings capacity of providing telecommunications services to our customers. |
60
Critical Accounting Policies and Estimates
Our consolidated financial statements are prepared in accordance with accounting principles generally accepted in the United States. In Management’s Discussion and Analysis of Financial Condition and Results of Operations for the year ended December 31, 2015, in our Annual Report on Form 10-K, we identified the critical accounting policies which affect our more significant estimates and assumptions used in preparing our consolidated financial statements. These critical accounting policies include evaluating the collectability of trade receivables, calculating depreciation and amortization expense, assessing goodwill for impairment, accounting for pension benefits, determining the fair values of derivative instruments, and accounting for deferred income taxes and related tax contingencies. There were no material changes to these critical accounting policies during the three month period ended March 31, 2016.
Recently Issued Authoritative Guidance
The following authoritative guidance, together with our evaluation of the related impact to the consolidated financial statements, is more fully described in Note 1.
• | Revenue Recognition |
• | Fair Value Measurement Disclosures |
• | Pension Plan Investment Disclosures |
• | Valuation of Inventory |
• | Leases |
• | Derivatives and Hedging |
• | Employee Share-Based Payment Accounting |
Forward-Looking Statements
This Management’s Discussion and Analysis of Financial Condition and Results of Operations includes, and future filings on Form 10-K, Form 10-Q and Form 8-K and future oral and written statements by us and our management may include, certain forward-looking statements. We claim the protection of the safe-harbor for forward-looking statements contained in the Private Securities Litigation Reform Act of 1995 for this Quarterly Report on Form 10-Q. Forward looking statements are subject to uncertainties that could cause actual future events and results to differ materially from those expressed in the forward-looking statements. Forward-looking statements include, but are not limited to, statements about our expectation to return a portion of our cash flow to shareholders through our dividend, expectations regarding our “network first” strategy to improve financial performance and increase market share, expectations regarding revenue trends and improving margins in our business segments, growth in adjusted OIBDA, the amount that Windstream Services may reduce its debt by disposing of its equity stake in CS&L and its ability to improve its debt profile and reduce interest, expected levels of support from universal service funds or other government programs, expected rates of loss of consumer households served or inter-carrier compensation, expected increases in high-speed Internet and business data connections, including increasing availability of higher Internet speeds, expectations regarding expanding IPTV and 1 Gbps services to more locations and expanding our carrier network, our expected ability to fund operations, expected required contributions to our pension plan, the completion and benefits from network investments related to the Connect America Fund to fund the deployment of broadband services and forecasted capital expenditure amounts related to these investments, anticipated benefits of Project Excel, anticipated capital expenditures and certain debt maturities from cash flows from operations, and expected effective federal income tax rates. These and other forward-looking statements are based on estimates, projections, beliefs, and assumptions that we believe are reasonable but are not guarantees of future events and results. Actual future events and our results may differ materially from those expressed in these forward-looking statements as a result of a number of important factors.
Factors that could cause actual results to differ materially from those contemplated in our forward looking statements include, among others:
• | further adverse changes in economic conditions in the markets served by us; |
• | the extent, timing and overall effects of competition in the communications business; |
61
• | our election to accept state-wide offers under the FCC’s Connect America Fund, Phase 2, and the impact of such election on our future receipt of federal universal service funds and capital expenditures; |
• | the impact of new, emerging or competing technologies; |
• | for certain operations where we lease facilities from other carriers, adverse effects on the availability, quality of service, price of facilities and services provided by other carriers on which our services depend; |
• | unfavorable rulings by state public service commissions in proceedings regarding universal service funds, inter-carrier compensation or other matters that could reduce revenues or increase expenses; |
• | material changes in the communications industry that could adversely affect vendor relationships with equipment and network suppliers and customer relationships with wholesale customers; |
• | changes to our current dividend practice which is subject to our capital allocation policy and may be changed at any time at the discretion of our board of directors; |
• | our ability to make rent payments under the master lease to CS&L, which may be affected by results of operations, changes in our cash requirements, cash tax payment obligations, or overall financial position; |
• | unanticipated increases or other changes in our future cash requirements, whether caused by unanticipated increases in capital expenditures, increases in pension funding requirements, or otherwise; |
• | the availability and cost of financing in the corporate debt markets; |
• | the potential for adverse changes in the ratings given to our debt securities by nationally accredited ratings organizations; |
• | earnings on pension plan investments significantly below our expected long term rate of return for plan assets or a significant change in the discount rate or other actuarial assumptions; |
• | unfavorable results of litigation or intellectual property infringement claims asserted against us; |
• | the risks associated with non-compliance by us with regulations or statutes applicable to government programs under which we receive material amounts of end user revenue and government subsidies, or non-compliance by us, our partners, or our subcontractors with any terms of our government contracts; |
• | the effects of federal and state legislation, and rules and regulations governing the communications industry; |
• | continued loss of consumer households served and consumer high-speed Internet customers; |
• | the impact of equipment failure, natural disasters or terrorist acts; |
• | the effects of work stoppages by our employees or employees of other communications companies on whom we rely for service; and |
• | those additional factors under “Risk Factors” in Item 1A of Part I of our Annual Report on Form 10-K for the year ended December 31, 2015, and in subsequent filings with the Securities and Exchange Commission at www.sec.gov. |
In addition to these factors, actual future performance, outcomes and results may differ materially because of more general factors including, among others, general industry and market conditions and growth rates, economic conditions, and governmental and public policy changes.
We undertake no obligation to update or revise any forward-looking statements, whether as a result of new information, future events or otherwise. The foregoing review of factors that could cause our actual results to differ materially from those contemplated in the forward-looking statements should be considered in connection with information regarding risks and uncertainties that may affect our future results included in this Management’s Discussion and Analysis of Financial Condition and Results of Operations and in our other filings with the Securities and Exchange Commission at www.sec.gov.
62
WINDSTREAM HOLDINGS, INC.
WINDSTREAM SERVICES, LLC
FORM 10-Q
PART I - FINANCIAL INFORMATION
Item 3. Quantitative and Qualitative Disclosures About Market Risk
Market risk is comprised of three elements: interest rate risk, equity risk and foreign currency risk. Following the completion of the spin-off of certain network and real estate assets, we have exposure to market risk from changes in interest rates and from changes in marketable equity security prices. Because we do not operate in foreign countries denominated in foreign currencies, we are not exposed to foreign currency risk. We have estimated our market risk using sensitivity analysis. The results of the sensitivity analysis are further discussed below. Actual results may differ from our estimates.
Interest Rate Risk
We are exposed to market risk through changes in interest rates, primarily as it relates to the variable interest rates we are charged under Windstream Services’ senior secured credit facility. Under our current policy, Windstream Services enters into interest rate swap agreements to obtain a targeted mixture of variable and fixed interest rate debt such that the portion of debt subject to variable rates does not exceed 25 percent of our total debt outstanding. In connection with the spin-off, Windstream Services terminated seven of its ten interest rate swaps.
We have established policies and procedures for risk assessment and the approval, reporting and monitoring of interest rate swap activity. We do not enter into interest rate swap agreements, or other derivative financial instruments, for trading or speculative purposes. Management periodically reviews our exposure to interest rate fluctuations and implements strategies to manage the exposure.
As of March 31, 2016, Windstream Services has entered into three pay fixed, receive variable interest rate swap agreements designated as cash flow hedges of the benchmark LIBOR interest rate risk created by the variable cash flows paid on Windstream Services’ senior secured credit facility. The interest rate swaps mature on October 17, 2019. The hedging relationships are expected to be highly effective in mitigating cash flow risks resulting from changes in interest rates. For additional information regarding our interest rate swap agreements, see Note 3 to the consolidated financial statements.
As of March 31, 2016 and 2015, the unhedged portion of Windstream Services’ variable rate senior secured credit facility was $1,089.7 million, and $1,648.3 million, or approximately 19.8 percent and 18.7 percent of Windstream Services’ total outstanding long-term debt excluding unamortized debt issuance costs, respectively. For variable rate debt instruments, market risk is defined as the potential change in earnings resulting from a hypothetical adverse change in interest rates. A hypothetical increase of 100.0 basis points in variable interest rates would have reduced annual pre-tax earnings by approximately $10.9 million and $16.5 million for the three month periods ended March 31, 2016 and 2015, respectively. Actual results may differ from this estimate.
Equity Risk
In connection with the REIT spin-off, we retained a passive ownership interest in approximately 19.6 percent of the common stock of CS&L. This investment has been classified as an available-for-sale security recorded at fair value, which was $653.8 million at March 31, 2016. As further discussed in Note 8 to the unaudited consolidated financial statements, we recorded an other-than-temporary impairment loss of $(181.9) million on our investment in CS&L common stock as of March 31, 2016.The fair value of the CS&L common stock is based on the quoted market price of the shares on the last day of the reporting period. Our investment in CS&L common stock has exposure to price risk, which is defined as the potential loss in fair value due to a hypothetical 10 percent adverse change in the quoted market price of the shares. A hypothetical 10 percent decrease in CS&L’s common stock price would have resulted in a decrease in the recorded value of our investment of approximately $65.4 million at March 31, 2016.
63
WINDSTREAM HOLDINGS, INC.
WINDSTREAM SERVICES, LLC
FORM 10-Q
PART I - FINANCIAL INFORMATION
Item 4. Controls and Procedures
(a) | Evaluation of disclosure controls and procedures. |
The term “disclosure controls and procedures” (defined in Exchange Act Rule 13a-15(e)) refers to the controls and other procedures that are designed to ensure that information required to be disclosed by us in the reports that we file or submit under the Securities Exchange Act of 1934 (the “Exchange Act”) is recorded, processed, summarized and reported within the time periods specified in the SEC’s rules and forms. Disclosure controls and procedures include, without limitation, controls and procedures designed to ensure that information required to be disclosed by us in the reports that we file or submit under the Exchange Act is accumulated and communicated to our management, including our principal executive and principal financial officers, or persons performing similar functions, as appropriate to allow timely decisions regarding required disclosure. Our management, with the participation of the Chief Executive Officer and Chief Financial Officer, has evaluated the effectiveness of the Windstream Holdings’ and Windstream Services’ disclosure controls and procedures as of the end of the period covered by these quarterly reports (the “Evaluation Date”). Based on that evaluation, our Chief Executive Officer and Chief Financial Officer have concluded that, as of the Evaluation Date, such disclosure controls and procedures were effective.
(b) | Changes in internal control over financial reporting. |
The term “internal control over financial reporting” (defined in Exchange Act Rule 13a-15(f)) refers to the process designed by, or under the supervision of, our principal executive and principal financial officers, or persons performing similar functions, and effected by our board of directors, management and other personnel, to provide reasonable assurance regarding the reliability of financial reporting and the preparation of financial statements for external purposes in accordance with generally accepted accounting principles and includes those policies and procedures that:
1. | Pertain to the maintenance of records that in reasonable detail accurately and fairly reflect the transactions and dispositions of our assets; |
2. | Provide reasonable assurance that transactions are recorded as necessary to permit preparation of financial statements in accordance with generally accepted accounting principles, and that our receipts and expenditures are being made only in accordance with authorizations of our management and directors; and |
3. | Provide reasonable assurance regarding prevention or timely detection of unauthorized acquisition, use or disposition of our assets that could have a material effect on the financial statements. |
Our management, with the participation of the Chief Executive Officer and Chief Financial Officer, has evaluated any changes in Windstream Holdings’ and Windstream Services’ internal control over financial reporting that occurred during the period covered by these quarterly reports, and they have concluded that there were no changes to our internal control over financial reporting that have materially affected, or are reasonably likely to materially affect, our internal control over financial reporting.
64
WINDSTREAM HOLDINGS, INC.
WINDSTREAM SERVICES, LLC
FORM 10-Q
PART II - OTHER INFORMATION
Item 1. Legal Proceedings
On February 9, 2015, a putative stockholder filed a Shareholder Class Action Complaint in the Delaware Court of Chancery (the “Court”), captioned Doppelt v. Windstream Holdings, Inc., et al., C.A. No. 10629-VCN, against the Company and its Board of Directors. This complaint was accompanied by a motion for a preliminary injunction seeking to enjoin the spin-off. The Court, ruling from the bench on February 19, 2015 - the day before a special meeting of stockholders was scheduled to vote on a reverse stock split and amended governing documents (the “Proposals”) - denied plaintiff’s motion for a preliminary injunction, reasoning that much of the information sought by plaintiff had been disclosed in public filings available on the United States Securities and Exchange Commission’s website, the Windstream Holdings’ board of directors was in no way conflicted, and while approval of the Proposals would facilitate the spin-off, approval was not necessary to effect the spin-off. On March 16, 2015, plaintiff, joined by a second putative Windstream stockholder, filed an Amended Shareholder Class Action Complaint alleging breaches of fiduciary duty by the Company and its Board concerning Windstream’s disclosures and seeking to rescind the spin-off and unspecified monetary damages. On February 5, 2016, the Court granted in part and denied in part defendants’ motion to dismiss the amended complaint. The Court dismissed Windstream, and plaintiffs’ demand to rescind the spin-off, but otherwise denied the motion.
In addition, numerous copyright holders represented by RightsCorp have asserted that our customers have utilized our services to allegedly illegally download and share alleged copyrighted material via peer-to-peer or “filesharing” programs. These holders maintain that Windstream is responsible for alleged infringement because after notification, Windstream did not shut off service to customers alleged to be repeat infringers, and, further, that Windstream may not claim safe harbor pursuant to the Digital Millennium Copyright Act of 1998.
We believe that we have valid defenses to both the lawsuit and the alleged infringement claim, and we plan to vigorously defend the pursuit of both matters. While the ultimate resolution of the matters is not currently predictable, if there are adverse rulings against Windstream in either of these two matters, either ruling could constitute a material adverse outcome on the future consolidated results of our income, cash flows, or financial condition.
We are party to various legal proceedings, including certain lawsuits claiming infringement of patents relating to various aspects of our business. In certain of the patent matters, other industry participants are also parties, and we may have claims of indemnification against vendors/suppliers. The ultimate resolution of these legal proceedings cannot be determined at this time. However, based on current circumstances, management does not believe such proceedings, individually or in the aggregate, will have a material adverse effect on the future consolidated results of our income, cash flows or financial condition.
Finally, management is currently not aware of any environmental matters, individually or in the aggregate, that would have a material adverse effect on our consolidated financial condition or results of our operations.
Item 1A. Risk Factors
There have been no material changes to the risk factors affecting our businesses that were discussed in “Risk Factors” in Item 1A of Part I of our Annual Report on Form 10-K for the year ended December 31, 2015, filed with the SEC on February 25, 2016.
65
Item 2. Unregistered Sales of Equity Securities and Use of Proceeds
On August 5, 2015, our board of directors authorized a stock repurchase program of up to $75.0 million which was completed in February 2016. Under the repurchase plan, we repurchased shares, from time to time, on the open market. Information associated with this plan is included in the following table:
Period | Total Number of Shares Purchased (1) | Average Price Paid per Share | Total Number of Share Purchase as Part of Publicly Announced Plans | Maximum Dollar Value that May Yet Be Purchased Under the Plan (Millions) | ||||||||
January 1 - 31, 2016 | 2,837,925 | $ | 5.59 | 2,837,925 | $13.0 | |||||||
February 1 - 29, 2016 | 2,327,944 | 5.59 | 2,327,944 | $— | ||||||||
March 1 - 31, 2016 | — | — | — | $— | ||||||||
Total | 5,165,869 | $ | 5.59 | 5,165,869 | ||||||||
(1) | Excludes 356,404 shares at and average price of $7.19 per share that were not part of our publicly announced share repurchase program. These shares represent shares which were withheld for tax payments due upon the vesting of employee restricted stock awards, and do not reduce the dollar value that may yet be purchased under our publicly announced share repurchase program. We intend to continue to satisfy statutory minimum tax withholding obligations in connection with the vesting of outstanding restricted stock through the withholding of shares. |
Item 6. Exhibits
See the exhibits specified on the Index of Exhibits located at Page 68.
66
SIGNATURE
Pursuant to the requirements of the Securities Exchange Act of 1934, this registrants have duly caused this report to be signed on its behalf the undersigned, thereunto duly authorized.
WINDSTREAM HOLDINGS, INC. | WINDSTREAM SERVICES, LLC | |
(Registrant) | (Registrant) | |
/s/ Robert E. Gunderman | /s/ Robert E. Gunderman | |
Robert E. Gunderman Chief Financial Officer (Principal Financial Officer) | Robert E. Gunderman Chief Financial Officer (Principal Financial Officer) | |
May 5, 2016 | May 5, 2016 | |
67
WINDSTREAM HOLDINGS, INC. WINDSTREAM SERVICES, LLC FORM 10-Q INDEX OF EXHIBITS | |||
Form 10-Q Exhibit No. | Description of Exhibits | ||
10.34 | Tranche B-6 Incremental Amendment dated as of March 29, 2016, to the Sixth Amended and Restated Credit Agreement originally dated as of July 17, 2006, as amended and restated as of April 24, 2015, by and among Windstream Services, LLC, the lenders party thereto, JPMorgan Chase Bank, N.A., as administrative agent and collateral agent and the other agents party thereto (incorporated herein by reference to Exhibit 10.1 to Windstream Holdings, Inc.’s Form 8-K dated March 30, 2016). | * | |
31(a) | Certifications of Chief Executive Officer pursuant to Section 302 of the Sarbanes-Oxley Act of 2002. | (a) | |
31(b) | Certifications of Chief Financial Officer pursuant to Section 302 of the Sarbanes-Oxley Act of 2002. | (a) | |
32(a) | Certifications of Chief Executive Officer pursuant to 18 U.S.C. Section 1350, as adopted pursuant to Section 906 of the Sarbanes-Oxley Act of 2002. | (a) | |
32(b) | Certifications of Chief Financial Officer pursuant to 18 U.S.C. Section 1350, as adopted pursuant to Section 906 of the Sarbanes-Oxley Act of 2002. | (a) | |
101.INS | XBRL Instance Document | (a) | |
101.SCH | XBRL Taxonomy Extension Schema Document | (a) | |
101.CAL | XBRL Taxonomy Extension Calculation Linkbase Document | (a) | |
101.DEF | XBRL Taxonomy Extension Definition Linkbase Document | (a) | |
101.LAB | XBRL Taxonomy Extension Label Linkbase Document | (a) | |
101.PRE | XBRL Taxonomy Extension Presentation Linkbase Document | (a) | |
* | Incorporated herein by reference as indicated. |
(a) | Filed herewith. |
68