Attached files
| file | filename |
|---|---|
| 8-K - FORM 8-K - Square, Inc. | d177788d8k.htm |

Exhibit 99.1
SIGNED & NUMBERED
MELBOURNE, AUSTRALIA
Q1 2016 Shareholder Letter
SQUARE.COM/INVESTORS
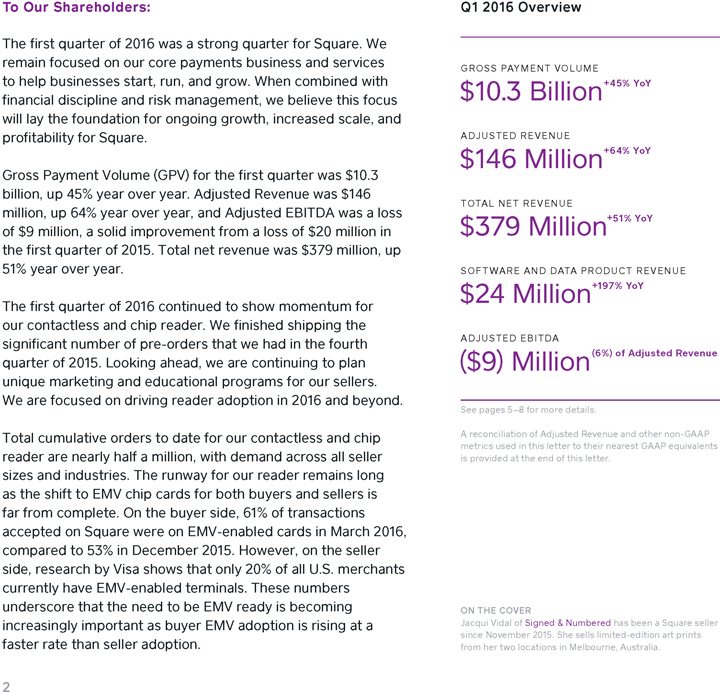
To Our Shareholders:
The first quarter of 2016 was a strong quarter for Square. We remain focused on our core payments business and services to help businesses start, run, and grow. When combined with financial discipline and risk management, we believe this focus will lay the foundation for ongoing growth, increased scale, and profitability for Square.
Gross Payment Volume (GPV) for the first quarter was $10.3 billion, up 45% year over year. Adjusted Revenue was $146 million, up 64% year over year, and Adjusted EBITDA was a loss of $9 million, a solid improvement from a loss of $20 million in the first quarter of 2015. Total net revenue was $379 million, up 51% year over year.
The first quarter of 2016 continued to show momentum for our contactless and chip reader. We finished shipping the significant number of pre-orders that we had in the fourth quarter of 2015. Looking ahead, we are continuing to plan unique marketing and educational programs for our sellers. We are focused on driving reader adoption in 2016 and beyond.
Total cumulative orders to date for our contactless and chip reader are nearly half a million, with demand across all seller sizes and industries. The runway for our reader remains long as the shift to EMV chip cards for both buyers and sellers is far from complete. On the buyer side, 61% of transactions accepted on Square were on EMV-enabled cards in March 2016, compared to 53% in December 2015. However, on the seller side, research by Visa shows that only 20% of all U.S. merchants currently have EMV-enabled terminals. These numbers underscore that the need to be EMV ready is becoming increasingly important as buyer EMV adoption is rising at a faster rate than seller adoption.
Q1 2016 Overview
GROSS PAYMENT VOLUME
$10.3 Billion+45% YoY
ADJUSTED REVENUE
$146 Million+64% YoY
TOTAL NET REVENUE
$379 Million+51% YoY
SOFTWARE AND DATA PRODUCT REVENUE
$24 Million+197% YoY
ADJUSTED EBITDA
($9) Million(6%) of Adjusted Revenue
See pages 5–8 for more details.
A reconciliation of Adjusted Revenue and other non-GAAP metrics used in this letter to their nearest GAAP equivalents is provided at the end of this letter.
ON THE COVER
Jacqui Vidal of Signed & Numbered has been a Square seller since November 2015. She sells limited-edition art prints from her two locations in Melbourne, Australia.
| 2 |
|
We have expanded our distribution channels and promoted our contactless and chip reader through unique partnerships. Sellers can now buy the reader on Amazon and in Apple, Staples, Best Buy, and Target stores around the United States. Additionally, we are collaborating with Discover on a program to invite select sellers to receive a free reader, and to educate buyers on the benefits of paying with their phones. In April, we served as the exclusive point of sale (POS) for the Coachella Valley Music and Arts Festival, the premier music and arts festival in North America, which is attended by hundreds of thousands of people annually. Contactless payments at the festival accounted for over 10% of card transactions, compared to a U.S. industry rate of less than 1% (based on data from eMarketer and Euromonitor). This demonstrates how the speed and simplicity of our reader can change buyer behavior.
In March, we launched Build with Square, a developer platform (APIs) that helps sellers of all kinds join the Square ecosystem, customize their business solutions, and run every part of their business in one place. Sellers can now use Square to process online payments on their own self-hosted website. This gives them the ability to track, manage, and grow both their online and offline businesses in a single dashboard. Build with Square also enables sellers to customize any iOS point of sale to process payments with Square. New sellers can now use Square hardware to take swiped, dipped, or tapped payments; manage their inventory; take advantage of sales reporting and analytics; and access Square services such as Square Capital and Square Payroll. Build with Square extends our App Marketplace, in which we’ve seen over 135,000 seller integrations as of the first quarter of 2016.
We also made progress further building our business internationally. We introduced the Square chip-and-PIN reader in Australia, our fourth market (joining the United States,
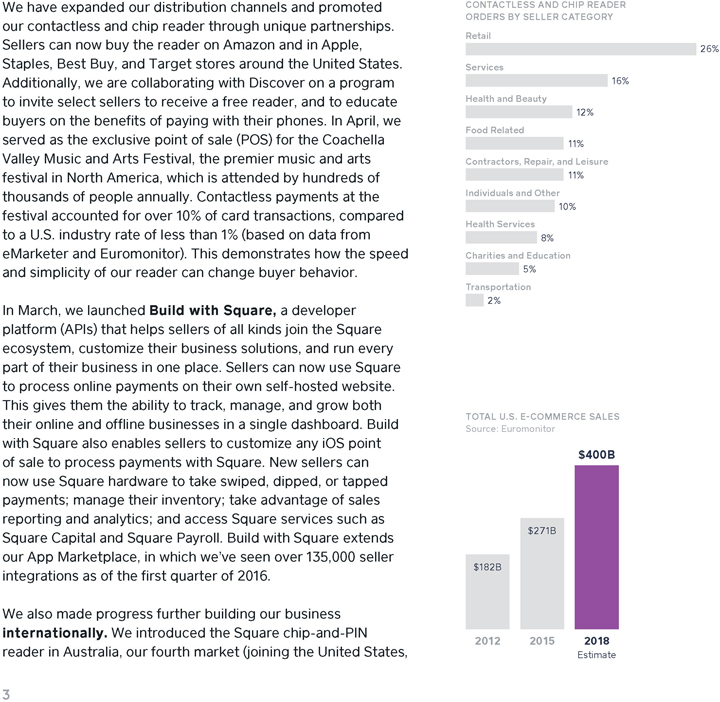
CONTACTLESS AND CHIP READER ORDERS BY SELLER CATEGORY Retail
26%
Services
16%
Health and Beauty
12%
Food Related
11%
Contractors, Repair, and Leisure
11%
Individuals and Other
10%
Health Services
8%
Charities and Education
5%
Transportation
2%
TOTAL U.S. E-COMMERCE SALES
Source: Euromonitor
$400B
$271B
$182B
2012 2015 2018
Estimate
| 3 |
|
Canada, and Japan). Our reader is the most affordable mobile payment card reader in Australia, using the technology sellers already have in their pockets or on their countertops. It was an exciting moment for us to enter a market so committed to innovation and with such an entrepreneurial small-business community. Additionally, we launched Build with Square in Canada. Just as with Build with Square in the United States, we are now able to help sellers in this market take advantage of the Square ecosystem, and run every part of their business in one place.
We achieved some key milestones that will help us better service larger sellers. We created additional seller support channels and made significant progress developing hardware solutions aimed at this larger seller type. We launched Square Communities, an online network where all sellers can connect and help one another by contributing and curating valuable and actionable content. Jack’s Bar-B-Que in Nashville, Tennessee, is an example of a Square seller maximizing the value of our ecosystem. When Jack’s Bar-B-Que came to Square, it switched its POS system overnight to more effectively manage previous pain points such as crashing systems, menu changes, data visibility, and employee onboarding. In addition to payments processing, Jack’s Bar-B-Que uses multiple products and services, such as Employee Management and Customer Engagement, to manage its three restaurant locations and mobile catering business.
We extended $153 million in Square Capital through more than 23,000 advances and loans in the first quarter. The amount of capital extended has tripled year over year. Sequential growth was 4% largely due to the delayed signing of two new investors, which was a result of more challenging credit market conditions. The two new investors signed at the end of April and have recently begun to ramp funding. We believe this
| 4 |
|
speaks to the consistent performance of the Square Capital product and continued low default rates of approximately 4%. From a product standpoint, we are transitioning Square Capital from cash advances to loans that provide sellers with increased flexibility. In addition, we believe that the transition to a loan product further increases our ability to attract new Square Capital investors.
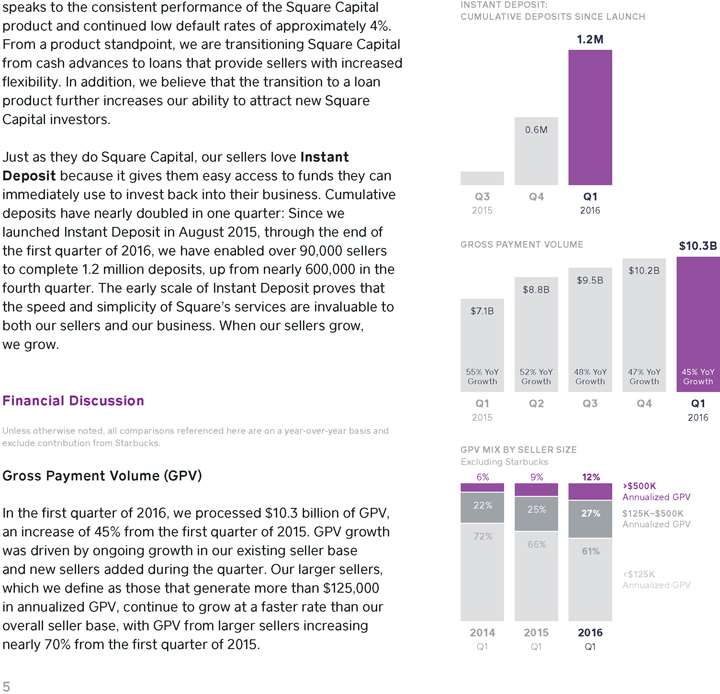
Just as they do Square Capital, our sellers love Instant Deposit because it gives them easy access to funds they can immediately use to invest back into their business. Cumulative deposits have nearly doubled in one quarter: Since we launched Instant Deposit in August 2015, through the end of the first quarter of 2016, we have enabled over 90,000 sellers to complete 1.2 million deposits, up from nearly 600,000 in the fourth quarter. The early scale of Instant Deposit proves that the speed and simplicity of Square’s services are invaluable to both our sellers and our business. When our sellers grow, we grow.
Financial Discussion
Unless otherwise noted, all comparisons referenced here are on a year-over-year basis and exclude contribution from Starbucks.
Gross Payment Volume (GPV)
In the first quarter of 2016, we processed $10.3 billion of GPV, an increase of 45% from the first quarter of 2015. GPV growth was driven by ongoing growth in our existing seller base and new sellers added during the quarter. Our larger sellers, which we define as those that generate more than $125,000 in annualized GPV, continue to grow at a faster rate than our overall seller base, with GPV from larger sellers increasing nearly 70% from the first quarter of 2015.
INSTANT DEPOSIT:
CUMULATIVE DEPOSITS SINCE LAUNCH
1.2M
0.6M
Q3 Q4 Q1
2015 2016
GROSS PAYMENT VOLUME $10.3B
$9.5B $10.2B
$8.8B
$7.1B
55% YoY 52% YoY 48% YoY 47% YoY 45% YoY Growth Growth Growth Growth Growth
Q1 Q2 Q3 Q4 Q1
2015 2016
GPV MIX BY SELLER SIZE
Excluding Starbucks
6% 9% 12% >$500K
Annualized GPV
22% 25%
27% $125K–$500K
Annualized GPV
72%
66%
61%
<$125K
Annualized GPV
2014 2015 2016
Q1 Q1 Q1
| 5 |
|
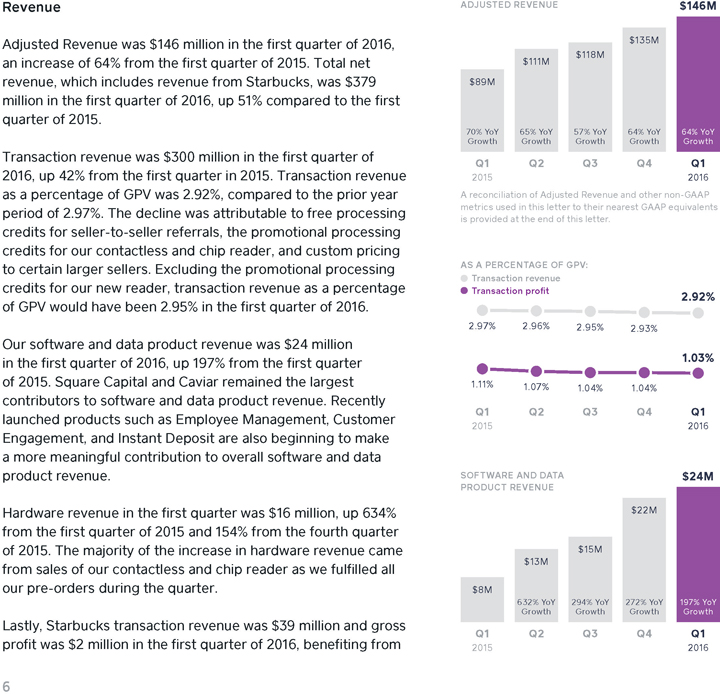
Revenue
Adjusted Revenue was $146 million in the first quarter of 2016, an increase of 64% from the first quarter of 2015. Total net revenue, which includes revenue from Starbucks, was $379 million in the first quarter of 2016, up 51% compared to the first quarter of 2015.
Transaction revenue was $300 million in the first quarter of 2016, up 42% from the first quarter in 2015. Transaction revenue as a percentage of GPV was 2.92%, compared to the prior year period of 2.97%. The decline was attributable to free processing credits for seller-to-seller referrals, the promotional processing credits for our contactless and chip reader, and custom pricing to certain larger sellers. Excluding the promotional processing credits for our new reader, transaction revenue as a percentage of GPV would have been 2.95% in the first quarter of 2016.
Our software and data product revenue was $24 million in the first quarter of 2016, up 197% from the first quarter of 2015. Square Capital and Caviar remained the largest contributors to software and data product revenue. Recently launched products such as Employee Management, Customer Engagement, and Instant Deposit are also beginning to make a more meaningful contribution to overall software and data product revenue.
Hardware revenue in the first quarter was $16 million, up 634% from the first quarter of 2015 and 154% from the fourth quarter of 2015. The majority of the increase in hardware revenue came from sales of our contactless and chip reader as we fulfilled all our pre-orders during the quarter.
Lastly, Starbucks transaction revenue was $39 million and gross profit was $2 million in the first quarter of 2016, benefiting from
ADJUSTED REVENUE $146M
$135M $118M $111M $89M
70% YoY 65% YoY 57% YoY 64% YoY 64% YoY Growth Growth Growth Growth Growth
Q1 Q2 Q3 Q4 Q1
2015 2016
A reconciliation of Adjusted Revenue and other non-GAAP metrics used in this letter to their nearest GAAP equivalents is provided at the end of this letter.
AS A PERCENTAGE OF GPV: Transaction revenue
Transaction profit 2.92%
2.97% 2.96% 2.95% 2.93%
1.03%
1.11% 1.07% 1.04% 1.04%
Q1 Q2 Q3 Q4 Q1
2015 2016
SOFTWARE AND DATA $24M PRODUCT REVENUE
$22M
$15M $13M
$8M
632% YoY 294% YoY 272% YoY 197% YoY Growth Growth Growth Growth
Q1 Q2 Q3 Q4 Q1
2015 2016
| 6 |
|
the renegotiated Starbucks processing rates. As a reminder, our payment processing agreement with Starbucks expires in the third quarter of 2016.
Operating Expenses/Earnings
Operating expenses were $207 million in the first quarter of 2016, up 72% from the first quarter of 2015. Excluding share-based compensation expense and a non-recurring litigation accrual, operating expenses were up 18%.
Product development expenses were $65 million in the first quarter of 2016, up 63% from the first quarter of 2015, primarily reflecting growth in personnel costs, including share-based compensation, as well as tooling costs associated with the development of our next-generation hardware products. Sales and marketing expenses were $38 million in the first quarter, up 6%, reflecting growth in personnel costs and costs related to our Square Cash peer-to-peer transfer service, offset in part by reduced spending across certain paid marketing channels. General and administrative expenses were $96 million in the first quarter of 2016, up 242% from the first quarter of 2015, due in part to growth in personnel and professional fees across the customer support, risk operations, legal, compliance, and finance teams that will allow us to scale our operations as a public company. We also accrued $50 million in general and administrative expenses in the first quarter of 2016 in connection with the Morley litigation. We recently signed a binding term sheet with the plaintiffs stipulating the material terms of a settlement.
Transaction and advance losses were $8 million in the first quarter of 2016, a significant improvement compared to $16 million in the first quarter of 2015 and $13 million in the fourth quarter of 2015. Transaction losses for payment processing as
| 7 |
|
a percentage of GPV reached an all-time low and was below our 0.1% historical average.
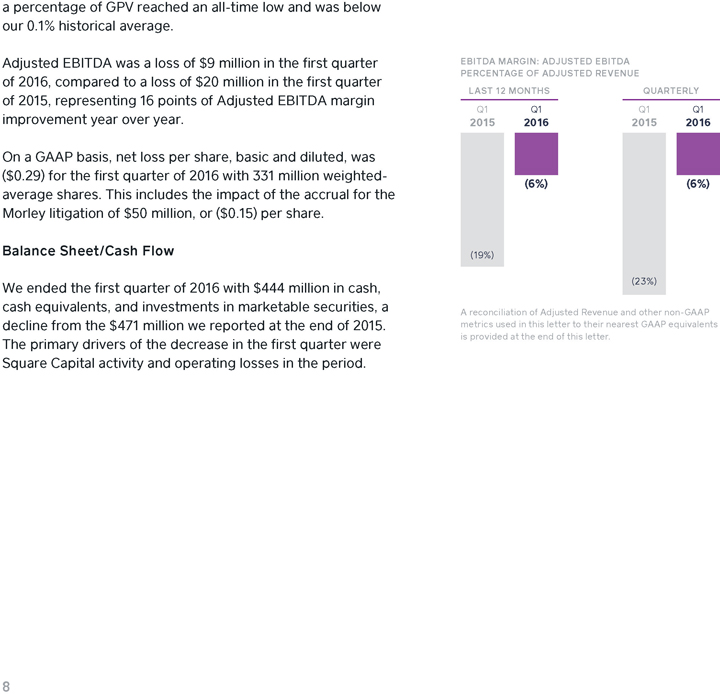
Adjusted EBITDA was a loss of $9 million in the first quarter of 2016, compared to a loss of $20 million in the first quarter of 2015, representing 16 points of Adjusted EBITDA margin improvement year over year.
On a GAAP basis, net loss per share, basic and diluted, was
($0.29) for the first quarter of 2016 with 331 million weighted-average shares. This includes the impact of the accrual for the Morley litigation of $50 million, or ($0.15) per share.
Balance Sheet/Cash Flow
We ended the first quarter of 2016 with $444 million in cash, cash equivalents, and investments in marketable securities, a decline from the $471 million we reported at the end of 2015. The primary drivers of the decrease in the first quarter were Square Capital activity and operating losses in the period.
EBITDA MARGIN: ADJUSTED EBITDA PERCENTAGE OF ADJUSTED REVENUE
LAST 12 MONTHS QUARTERLY
Q1 Q1 Q1 Q1
2015 2016 2015 2016
(6%) (6%)
(19%)
(23%)
A reconciliation of Adjusted Revenue and other non-GAAP metrics used in this letter to their nearest GAAP equivalents is provided at the end of this letter.
| 8 |
|
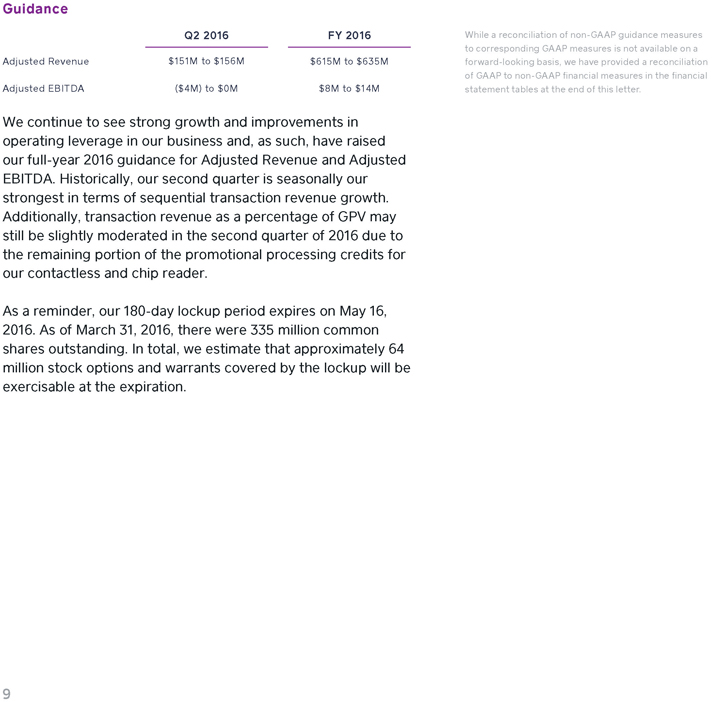
Guidance
Q2 2016 FY 2016
Adjusted Revenue $151M to $156M $615M to $635M
Adjusted EBITDA ($4M) to $0M $8M to $14M
We continue to see strong growth and improvements in operating leverage in our business and, as such, have raised our full-year 2016 guidance for Adjusted Revenue and Adjusted EBITDA. Historically, our second quarter is seasonally our strongest in terms of sequential transaction revenue growth. Additionally, transaction revenue as a percentage of GPV may still be slightly moderated in the second quarter of 2016 due to the remaining portion of the promotional processing credits for our contactless and chip reader.
As a reminder, our 180-day lockup period expires on May 16, 2016. As of March 31, 2016, there were 335 million common shares outstanding. In total, we estimate that approximately 64 million stock options and warrants covered by the lockup will be exercisable at the expiration.
While a reconciliation of non-GAAP guidance measures to corresponding GAAP measures is not available on a forward-looking basis, we have provided a reconciliation of GAAP to non-GAAP financial measures in the financial statement tables at the end of this letter.
9
Earnings Webcast
Square (NYSE:SQ) will host a conference call and earnings webcast at 2:00 p.m. Pacific time/5:00 p.m. Eastern time today, May 5, 2016, to discuss these financial results. The domestic dial-in for the call is (877) 656-8333 and the international dial-in is (704) 753-0403. The Conference ID is 78088335. To listen to a live audio webcast, please visit Square’s Investor Relations website at square.com/investors. A replay will be available on the same website following the call.
We will release financial results for the second quarter of 2016 on August 3, 2016, after the market closes, and will also host a conference call and earnings webcast at 2:00 p.m. Pacific time/5:00 p.m. Eastern time on the same day to discuss these financial results.
Jack Dorsey Sarah Friar
CEO CFO
MEDIA CONTACT
press@squareup.com
INVESTOR RELATIONS CONTACT
ir@squareup.com
10

“Square has given us an opportunity to be on top of our game on a day-to-day, real-time basis.
“My son and I can drive up to one of our restaurants and we already know they’re having a good day. The old way, we’d look at parking lot, but now, we’re looking at Square Dashboard.”
JACK CAWTHON
JACK’S BAR-B-QUE
NASHVILLE, TENNESSEE
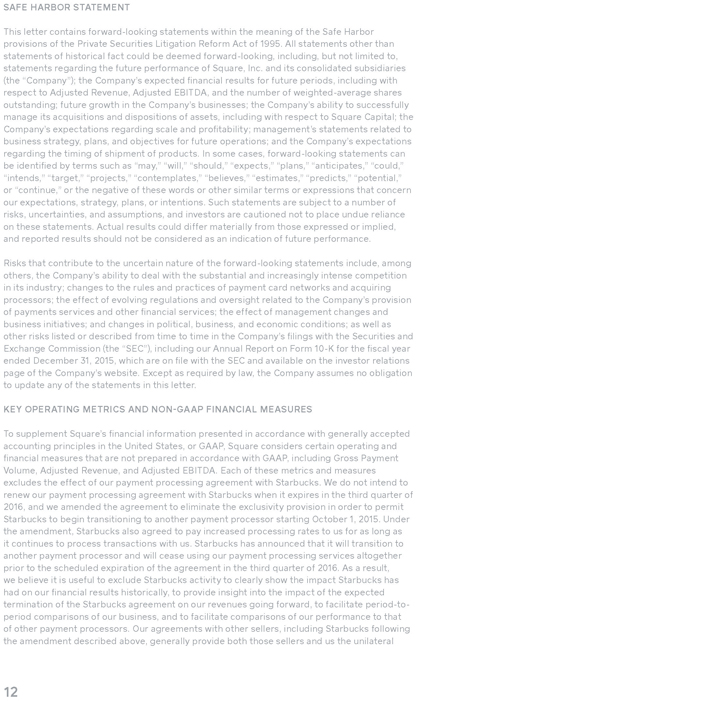
SAFE HARBOR STATEMENT
This letter contains forward-looking statements within the meaning of the Safe Harbor provisions of the Private Securities Litigation Reform Act of 1995. All statements other than statements of historical fact could be deemed forward-looking, including, but not limited to, statements regarding the future performance of Square, Inc. and its consolidated subsidiaries (the “Company”); the Company’s expected financial results for future periods, including with respect to Adjusted Revenue, Adjusted EBITDA, and the number of weighted-average shares outstanding; future growth in the Company’s businesses; the Company’s ability to successfully manage its acquisitions and dispositions of assets, including with respect to Square Capital; the Company’s expectations regarding scale and profitability; management’s statements related to business strategy, plans, and objectives for future operations; and the Company’s expectations regarding the timing of shipment of products. In some cases, forward-looking statements can be identified by terms such as “may,” “will,” “should,” “expects,” “plans,” “anticipates,” “could,” “intends,” “target,” “projects,” “contemplates,” “believes,” “estimates,” “predicts,” “potential,” or “continue,” or the negative of these words or other similar terms or expressions that concern our expectations, strategy, plans, or intentions. Such statements are subject to a number of risks, uncertainties, and assumptions, and investors are cautioned not to place undue reliance on these statements. Actual results could differ materially from those expressed or implied, and reported results should not be considered as an indication of future performance.
Risks that contribute to the uncertain nature of the forward-looking statements include, among others, the Company’s ability to deal with the substantial and increasingly intense competition in its industry; changes to the rules and practices of payment card networks and acquiring processors; the effect of evolving regulations and oversight related to the Company’s provision of payments services and other financial services; the effect of management changes and business initiatives; and changes in political, business, and economic conditions; as well as other risks listed or described from time to time in the Company’s filings with the Securities and Exchange Commission (the “SEC”), including our Annual Report on Form 10-K for the fiscal year ended December 31, 2015, which are on file with the SEC and available on the investor relations page of the Company’s website. Except as required by law, the Company assumes no obligation to update any of the statements in this letter.
KEY OPERATING METRICS AND NON-GAAP FINANCIAL MEASURES
To supplement Square’s financial information presented in accordance with generally accepted accounting principles in the United States, or GAAP, Square considers certain operating and financial measures that are not prepared in accordance with GAAP, including Gross Payment Volume, Adjusted Revenue, and Adjusted EBITDA. Each of these metrics and measures excludes the effect of our payment processing agreement with Starbucks. We do not intend to renew our payment processing agreement with Starbucks when it expires in the third quarter of 2016, and we amended the agreement to eliminate the exclusivity provision in order to permit Starbucks to begin transitioning to another payment processor starting October 1, 2015. Under the amendment, Starbucks also agreed to pay increased processing rates to us for as long as it continues to process transactions with us. Starbucks has announced that it will transition to another payment processor and will cease using our payment processing services altogether prior to the scheduled expiration of the agreement in the third quarter of 2016. As a result, we believe it is useful to exclude Starbucks activity to clearly show the impact Starbucks has had on our financial results historically, to provide insight into the impact of the expected termination of the Starbucks agreement on our revenues going forward, to facilitate period-to-period comparisons of our business, and to facilitate comparisons of our performance to that of other payment processors. Our agreements with other sellers, including Starbucks following the amendment described above, generally provide both those sellers and us the unilateral
12

right to terminate such agreements at any time, without fine or penalty. Furthermore, we generally do not enter into long-term contractual agreements with sellers.
We define Gross Payment Volume (GPV) as the total dollar amount of all card payments processed by sellers using Square, net of refunds. GPV excludes card payments processed for Starbucks. Additionally, GPV excludes activity related to our Square Cash peer-to-peer payments service.
Adjusted Revenue is a non-GAAP financial measure that we define as our total net revenue less transaction costs, adjusted to eliminate the effect of activity under our payment processing agreement with Starbucks. As described above, Starbucks has announced that it will transition to another payment processor and will cease using our payment processing services altogether, and we believe that providing Adjusted Revenue metrics that exclude the impact of our agreement with Starbucks is useful to investors. We believe it is useful to exclude transaction costs from Adjusted Revenue as this is a primary metric used by management to measure our business performance, and it affords greater comparability to other payment processing companies. Adjusted Revenue has limitations as a financial measure, should be considered as supplemental in nature, and is not meant as a substitute for the related financial information prepared in accordance with GAAP.
Adjusted EBITDA is a non-GAAP financial measure that represents our net loss, adjusted to eliminate the effect of Starbucks transaction revenue, Starbucks transaction costs, and the litigation accrual described above under “Financial Discussion,” before interest income and expense, provision or benefit for income taxes, depreciation, amortization, share-based compensation expense, other income and expense, the gain or loss on the sale of property and equipment, and impairment of intangible assets. We have included Adjusted EBITDA because it is a key measure used by our management to evaluate our operating performance, generate future operating plans, and make strategic decisions, including those relating to operating expenses and the allocation of internal resources. Accordingly, we believe that Adjusted EBITDA provides useful information to investors and others in understanding and evaluating our operating results in the same manner as our management and board of directors. In addition, it provides a useful measure for period-to-period comparisons of our business, as it removes the effect of certain non-cash items and certain variable charges. Adjusted EBITDA has limitations as a financial measure, should be considered as supplemental in nature, and is not meant as a substitute for the related financial information prepared in accordance with GAAP.
13
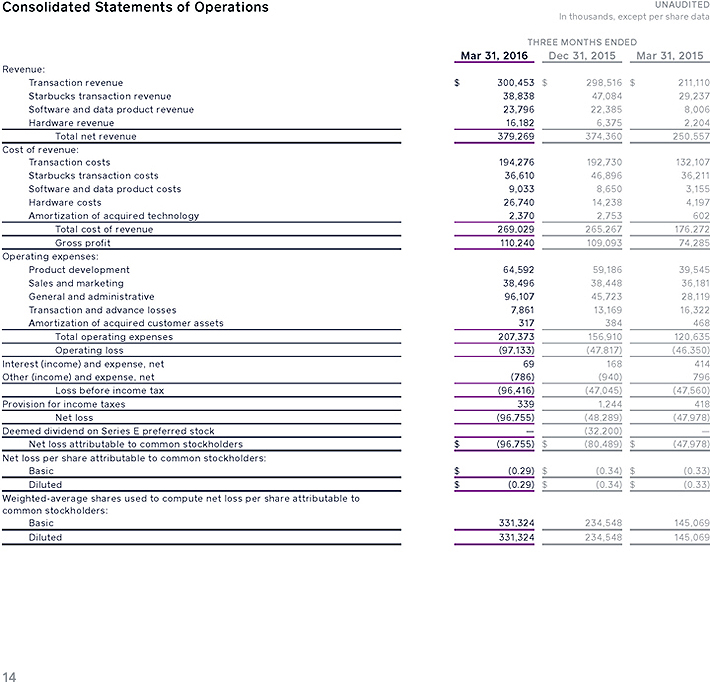
Consolidated Statements of Operations
UNAUDITED
In thousands, except per share data
THREE MONTHS ENDED
Mar 31, 2016 Dec 31, 2015 Mar 31, 2015
Revenue:
Transaction revenue $ 300,453 $ 298,516 $ 211,110
Starbucks transaction revenue 38,838 47,084 29,237
Software and data product revenue 23,796 22,385 8,006
Hardware revenue 16,182 6,375 2,204
Total net revenue 379,269 374,360 250,557
Cost of revenue:
Transaction costs 194,276 192,730 132,107
Starbucks transaction costs 36,610 46,896 36,211
Software and data product costs 9,033 8,650 3,155
Hardware costs 26,740 14,238 4,197
Amortization of acquired technology 2,370 2,753 602
Total cost of revenue 269,029 265,267 176,272
Gross profit 110,240 109,093 74,285
Operating expenses:
Product development 64,592 59,186 39,545
Sales and marketing 38,496 38,448 36,181
General and administrative 96,107 45,723 28,119
Transaction and advance losses 7,861 13,169 16,322
Amortization of acquired customer assets 317 384 468
Total operating expenses 207,373 156,910 120,635
Operating loss(97,133)(47,817)(46,350)
Interest (income) and expense, net 69 168 414
Other (income) and expense, net(786)(940) 796
Loss before income tax(96,416)(47,045)(47,560)
Provision for income taxes 339 1,244 418
Net loss(96,755)(48,289)(47,978)
Deemed dividend on Series E preferred stock —(32,200) —
Net loss attributable to common stockholders $(96,755) $(80,489) $(47,978)
Net loss per share attributable to common stockholders:
Basic $(0.29) $(0.34) $(0.33)
Diluted $(0.29) $(0.34) $(0.33)
Weighted-average shares used to compute net loss per share attributable to
common stockholders:
Basic 331,324 234,548 145,069
Diluted 331,324 234,548 145,069
14
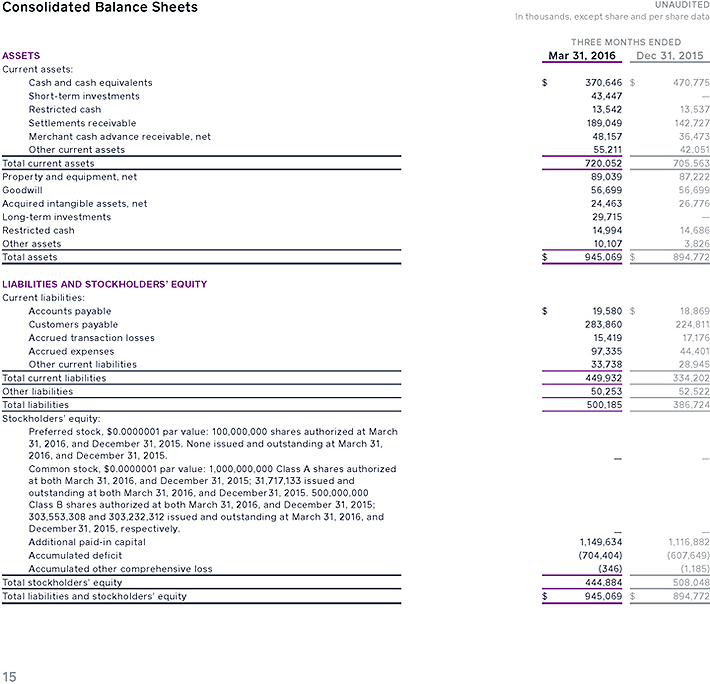
Consolidated Balance Sheets
UNAUDITED
In thousands, except share and per share data
THREE MONTHS ENDED
ASSETS Mar 31, 2016 Dec 31, 2015
Current assets:
Cash and cash equivalents $ 370,646 $ 470,775 Short-term investments 43,447 —Restricted cash 13,542 13,537 Settlements receivable 189,049 142,727 Merchant cash advance receivable, net 48,157 36,473 Other current assets 55,211 42,051 Total current assets 720,052 705,563 Property and equipment, net 89,039 87,222 Goodwill 56,699 56,699 Acquired intangible assets, net 24,463 26,776 Long-term investments 29,715 —Restricted cash 14,994 14,686 Other assets 10,107 3,826 Total assets $ 945,069 $ 894,772
LIABILITIES AND STOCKHOLDERS’ EQUITY
Current liabilities:
Accounts payable $ 19,580 $ 18,869 Customers payable 283,860 224,811 Accrued transaction losses 15,419 17,176 Accrued expenses 97,335 44,401 Other current liabilities 33,738 28,945 Total current liabilities 449,932 334,202 Other liabilities 50,253 52,522 Total liabilities 500,185 386,724 Stockholders’ equity: Preferred stock, $0.0000001 par value: 100,000,000 shares authorized at March 31, 2016, and December 31, 2015. None issued and outstanding at March 31, 2016, and December 31, 2015. — —Common stock, $0.0000001 par value: 1,000,000,000 Class A shares authorized at both March 31, 2016, and December 31, 2015; 31,717,133 issued and outstanding at both March 31, 2016, and December 31, 2015. 500,000,000 Class B shares authorized at both March 31, 2016, and December 31, 2015; 303,553,308 and 303,232,312 issued and outstanding at March 31, 2016, and December 31, 2015, respectively. — —Additional paid-in capital 1,149,634 1,116,882 Accumulated deficit (704,404) (607,649) Accumulated other comprehensive loss (346) (1,185) Total stockholders’ equity 444,884 508,048 Total liabilities and stockholders’ equity $ 945,069 $ 894,772
15
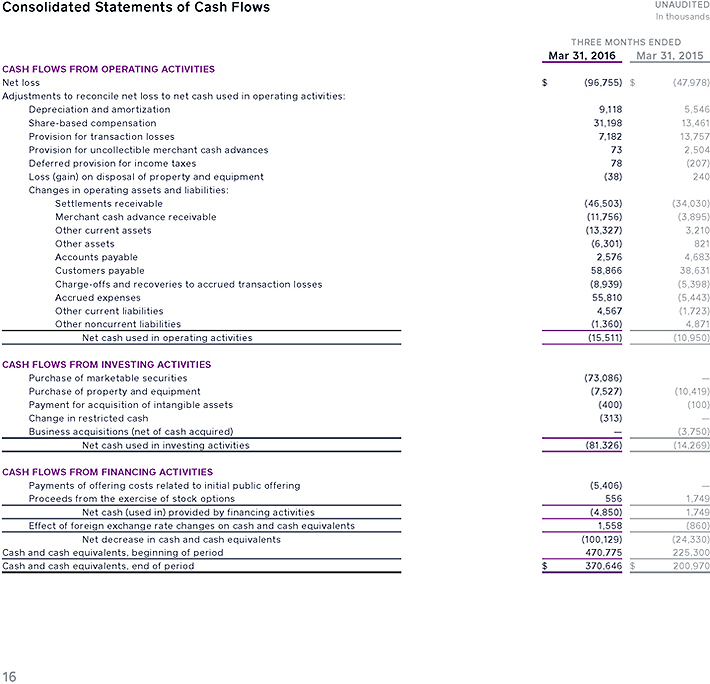
Consolidated Statements of Cash Flows
UNAUDITED
In thousands
THREE MONTHS ENDED
Mar 31, 2016 Mar 31, 2015
CASH FLOWS FROM OPERATING ACTIVITIES
Net loss $(96,755) $(47,978)
Adjustments to reconcile net loss to net cash used in operating activities:
Depreciation and amortization 9,118 5,546
Share-based compensation 31,198 13,461
Provision for transaction losses 7,182 13,757
Provision for uncollectible merchant cash advances 73 2,504
Deferred provision for income taxes 78(207)
Loss (gain) on disposal of property and equipment(38) 240
Changes in operating assets and liabilities:
Settlements receivable(46,503)(34,030)
Merchant cash advance receivable(11,756)(3,895)
Other current assets(13,327) 3,210
Other assets(6,301) 821
Accounts payable 2,576 4,683
Customers payable 58,866 38,631
Charge-offs and recoveries to accrued transaction losses(8,939)(5,398)
Accrued expenses 55,810(5,443)
Other current liabilities 4,567(1,723)
Other noncurrent liabilities(1,360) 4,871
Net cash used in operating activities(15,511)(10,950)
CASH FLOWS FROM INVESTING ACTIVITIES
Purchase of marketable securities(73,086) —
Purchase of property and equipment(7,527)(10,419)
Payment for acquisition of intangible assets(400)(100)
Change in restricted cash(313) —
Business acquisitions (net of cash acquired) —(3,750)
Net cash used in investing activities(81,326)(14,269)
CASH FLOWS FROM FINANCING ACTIVITIES
Payments of offering costs related to initial public offering(5,406) —
Proceeds from the exercise of stock options 556 1,749
Net cash (used in) provided by financing activities(4,850) 1,749
Effect of foreign exchange rate changes on cash and cash equivalents 1,558(860)
Net decrease in cash and cash equivalents(100,129)(24,330)
Cash and cash equivalents, beginning of period 470,775 225,300
Cash and cash equivalents, end of period $ 370,646 $ 200,970
16
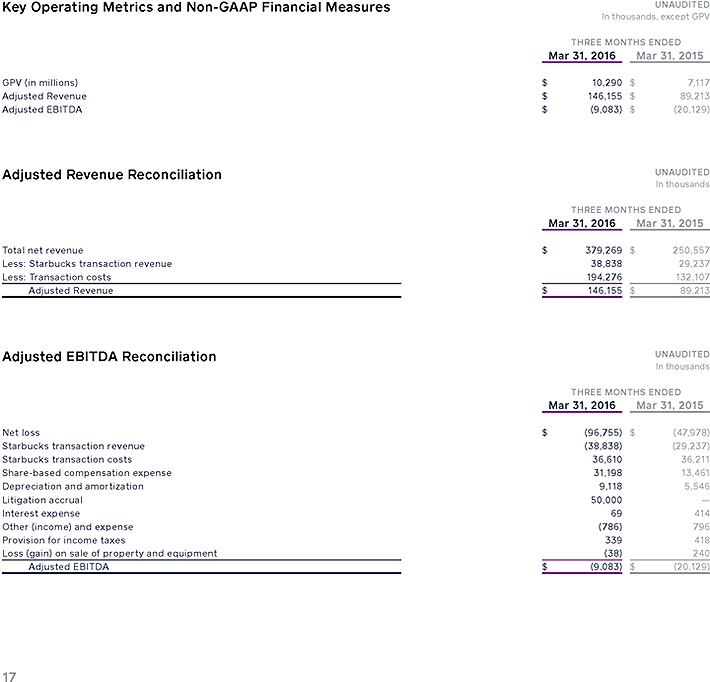
Key Operating Metrics and Non-GAAP Financial Measures
UNAUDITED
In thousands, except GPV
THREE MONTHS ENDED
Mar 31, 2016 Mar 31, 2015
GPV (in millions) $ 10,290 $ 7,117
Adjusted Revenue $ 146,155 $ 89,213
Adjusted EBITDA $(9,083) $(20,129)
Adjusted Revenue Reconciliation UNAUDITED
In thousands
THREE MONTHS ENDED
Mar 31, 2016 Mar 31, 2015
Total net revenue $ 379,269 $ 250,557
Less: Starbucks transaction revenue 38,838 29,237
Less: Transaction costs 194,276 132,107
Adjusted Revenue $ 146,155 $ 89,213
Adjusted EBITDA Reconciliation UNAUDITED
In thousands
THREE MONTHS ENDED
Mar 31, 2016 Mar 31, 2015
Net loss $(96,755) $(47,978)
Starbucks transaction revenue(38,838)(29,237)
Starbucks transaction costs 36,610 36,211
Share-based compensation expense 31,198 13,461
Depreciation and amortization 9,118 5,546
Litigation accrual 50,000 —
Interest expense 69 414
Other (income) and expense(786) 796
Provision for income taxes 339 418
Loss (gain) on sale of property and equipment(38) 240
Adjusted EBITDA $(9,083) $(20,129)
17
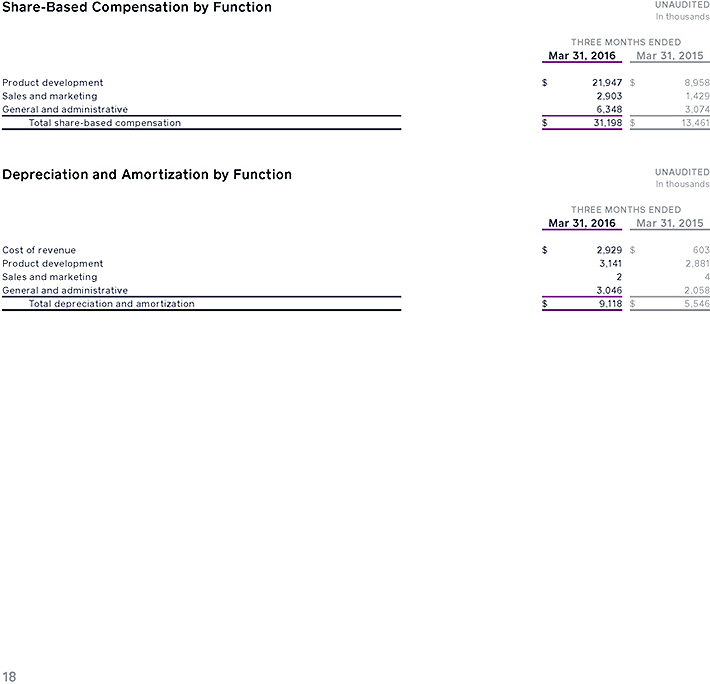
Share-Based Compensation by Function UNAUDITED
In thousands
THREE MONTHS ENDED
Mar 31, 2016 Mar 31, 2015
Product development $ 21,947 $ 8,958
Sales and marketing 2,903 1,429
General and administrative 6,348 3,074
Total share-based compensation $ 31,198 $ 13,461
Depreciation and Amortization by Function UNAUDITED
In thousands
THREE MONTHS ENDED
Mar 31, 2016 Mar 31, 2015
Cost of revenue $ 2,929 $ 603
Product development 3,141 2,881
Sales and marketing 2 4
General and administrative 3,046 2,058
Total depreciation and amortization $ 9,118 $ 5,546
18