Attached files
| file | filename |
|---|---|
| 8-K - 8-K - AMERICA FIRST MULTIFAMILY INVESTORS, L.P. | atax-8k_20160503.htm |
Q1 2016 Investor Presentation May 3, 2016
SAFE HARBOR This presentation may contain projections or other forward-looking statements regarding future events or our future financial performance or estimates regarding third parties. These statements are only estimates or predictions and reflect our current beliefs and expectations. Actual events or results may differ materially from those contained in the estimates, projections or forward-looking statements. It is routine for internal projections and expectations to change as the quarter progresses, and therefore it should be clearly understood that the internal projections and beliefs upon which we base our expectations may change prior to the end of the quarter. Although these expectations may change, we will not necessarily inform you if they do. Our policy is to provide expectations not more than once per quarter, and not to update that information until the next quarter. Some of the factors that could cause actual results to differ materially from the forward-looking statements contained herein include, without limitation, (i) our operating results may fluctuate, are difficult to predict and could fall below expectations, (ii) our transactions business is dependent on third party participants, whose lack of performance could adversely affect our results of operations, (iii) our ongoing investment in new businesses and new products, services, and technologies is inherently risky, and could disrupt our ongoing business and/or fail to generate the results we are expecting, (iv) we may be unable to develop solutions that generate revenue from advertising and other services delivered to mobile phones and wireless devices, (v) our businesses could be negatively affected by changes in Internet search engine algorithms, (vi) intense competition in our markets may adversely affect revenue and results of operations, (vii) we may be subject to legal liability associated with providing online services or content, (viii) fraudulent or unlawful activities on our marketplace could harm our business and consumer confidence in our marketplace, (ix) we are subject to payments-related risks, (x) we cannot assure you that our publications will be profitable, and (xi) other factors detailed in documents we file from time to time with the Securities and Exchange Commission. Forward-looking statements in this release are made pursuant to the safe harbor provisions contained in the Private Securities Litigation Reform Act of 1995. This presentation includes certain "Non-GAAP financial information" and a reconciliation of GAAP net income to CAD (non-GAAP) can be found at the end of this presentation.
BASIS FOR PRESENTATION All financial information in our Annual Report on Form 10-K and Quarterly Report on Form 10-Q presented on the basis of Generally Accepted Accounting Principles in the United States of America (“GAAP”) is that of the Partnership and Variable Interest Entities (“VIEs”) on a consolidated basis. In this presentation, we discuss the Partnership on a stand alone basis without consolidation of the VIEs. Management utilizes a calculation of Cash Available for Distribution (“CAD”) as a means to determine the Partnership’s ability to make distributions to shareholders. The Company believes that CAD provides relevant information about its operations and is necessary along with net income (loss) for understanding its operating results. There is no generally accepted methodology for computing CAD, and the Company’s computation of CAD may not be comparable to CAD reported by other companies. Although the Company considers CAD to be a useful measure of its operating performance, CAD should not be considered as an alternative to net income or net cash flows from operating activities which are calculated in accordance with GAAP. Please see our Annual Report on Form 10-K and Quarterly Report on Form 10-Q for further information. A reconciliation of amounts shown in this presentation to our consolidated GAAP financial statements are included in our Forms 10-K and 10-Q and set forth in the Appendix to this presentation.
Agenda Safe Harbor & Basis For Presentation Craig Allen (Chief Financial Officer) COMPANY OVERIEW & EXECUTION OF STRATEGY - 1ST QUARTER 2016 Chad Daffer (Chief Executive Officer) HIGHLIGHTS OF 1ST QUARTER 2016 FINANCIAL RESULTS Craig Allen CLOSING REMARKS Chad Daffer Q & A
COMPANY OVERVIEW & EXECUTION OF STRATEGY - FIRST QUARTER 2016 Chad Daffer Chief Executive Officer
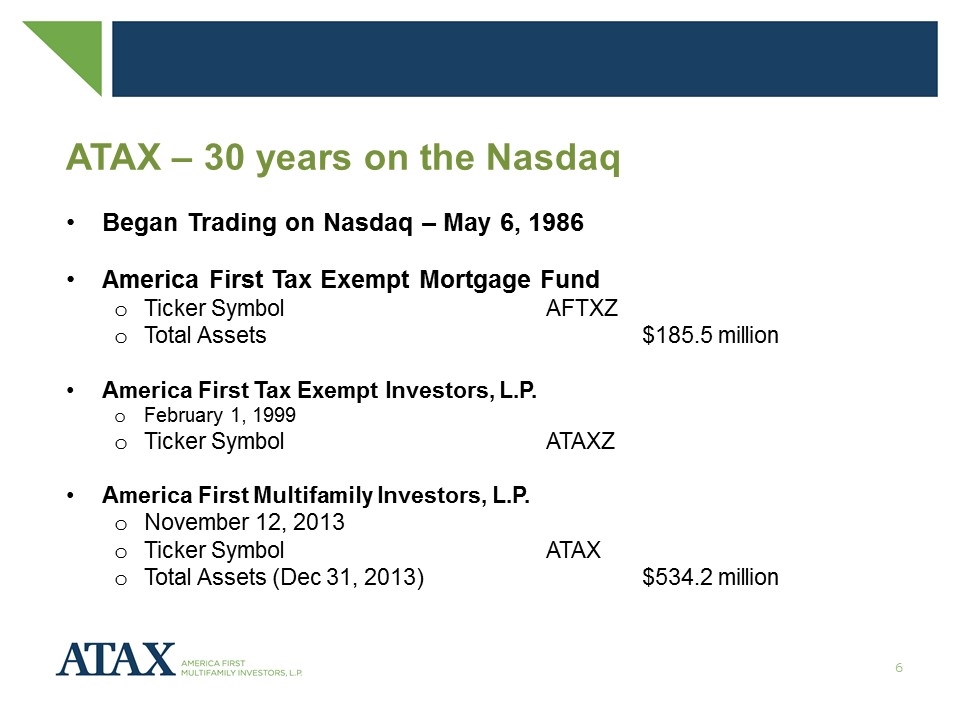
ATAX – 30 years on the Nasdaq Began Trading on Nasdaq – May 6, 1986 America First Tax Exempt Mortgage Fund Ticker Symbol AFTXZ Total Assets$185.5 million America First Tax Exempt Investors, L.P. February 1, 1999 Ticker Symbol ATAXZ America First Multifamily Investors, L.P. November 12, 2013 Ticker Symbol ATAX Total Assets (Dec 31, 2013)$534.2 million
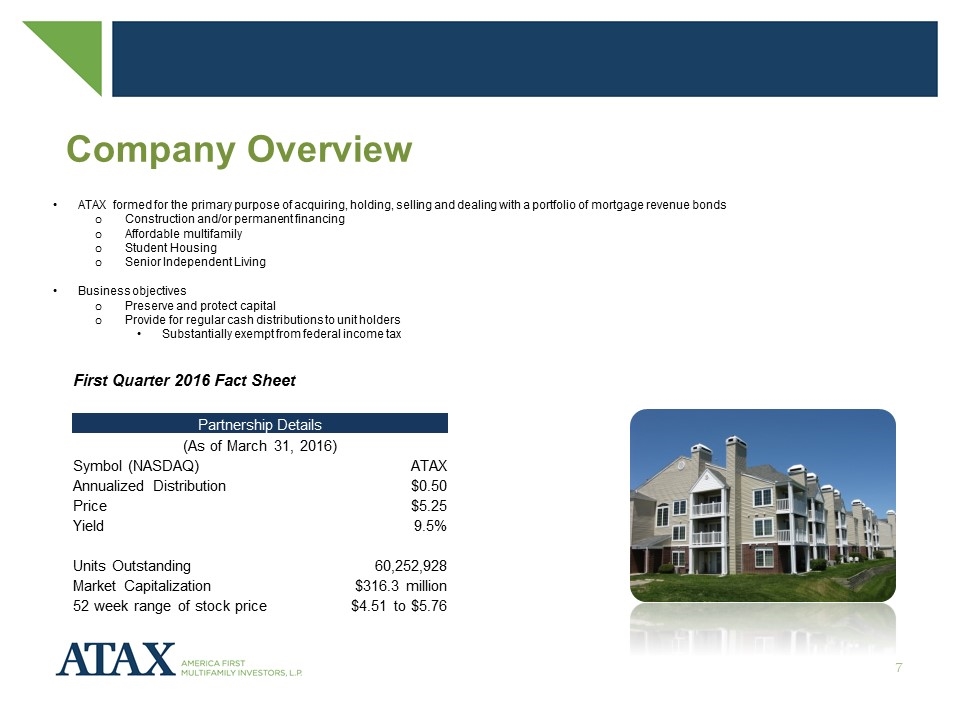
Company Overview ATAX formed for the primary purpose of acquiring, holding, selling and dealing with a portfolio of mortgage revenue bonds Construction and/or permanent financing Affordable multifamily Student Housing Senior Independent Living Business objectives Preserve and protect capital Provide for regular cash distributions to unit holders Substantially exempt from federal income tax First Quarter 2016 Fact Sheet Partnership Details (As of March 31, 2016) Symbol (NASDAQ) ATAX Annualized Distribution $0.50 Price $5.25 Yield 9.5% Units Outstanding 60,252,928 Market Capitalization $316.3 million 52 week range of stock price $4.51 to $5.76
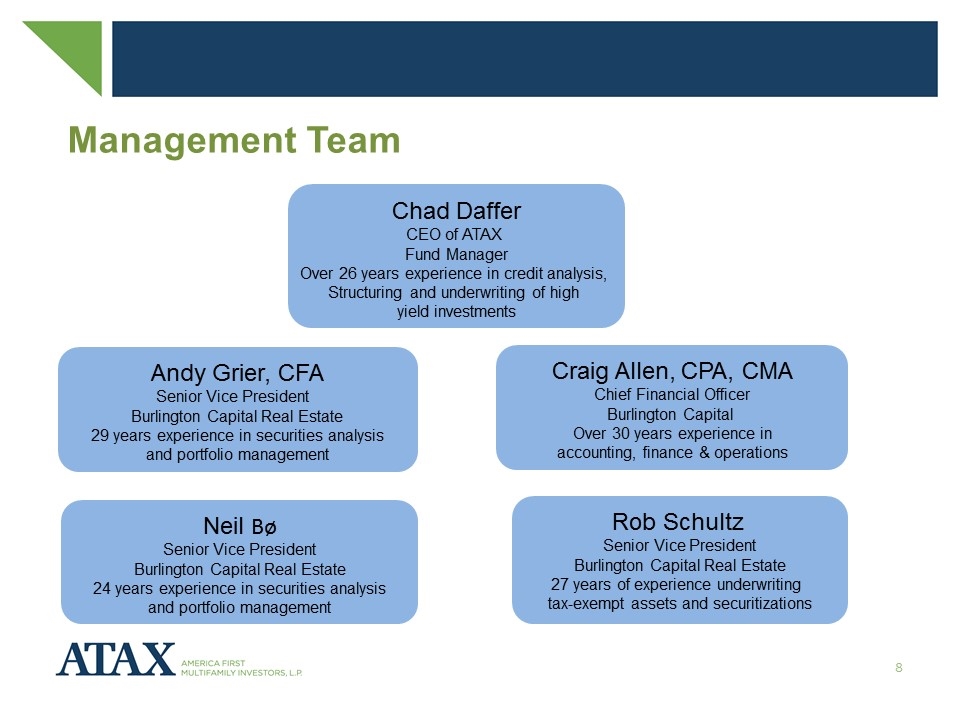
Chad Daffer CEO of ATAX Fund Manager Over 26 years experience in credit analysis, Structuring and underwriting of high yield investments Andy Grier, CFA Senior Vice President Burlington Capital Real Estate 29 years experience in securities analysis and portfolio management Neil Bø Senior Vice President Burlington Capital Real Estate 24 years experience in securities analysis and portfolio management Rob Schultz Senior Vice President Burlington Capital Real Estate 27 years of experience underwriting tax-exempt assets and securitizations Craig Allen, CPA, CMA Chief Financial Officer Burlington Capital Over 30 years experience in accounting, finance & operations Management Team
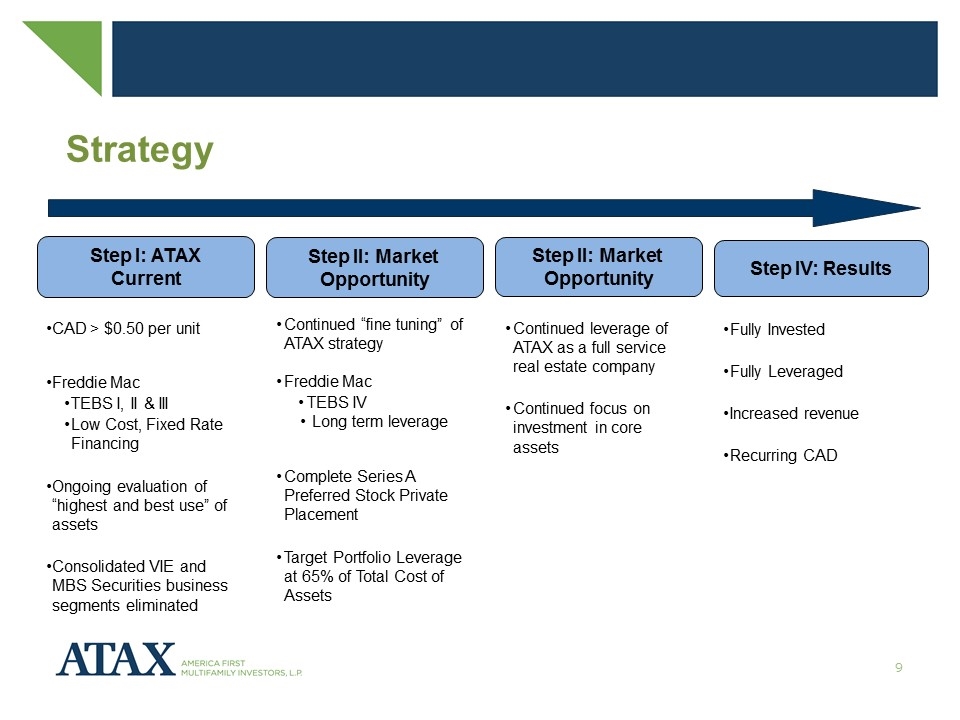
Strategy Step II: Market Opportunity Step II: Market Opportunity Step IV: Results CAD > $0.50 per unit Freddie Mac TEBS I, II & III Low Cost, Fixed Rate Financing Ongoing evaluation of “highest and best use” of assets Consolidated VIE and MBS Securities business segments eliminated Continued leverage of ATAX as a full service real estate company Continued focus on investment in core assets Continued “fine tuning” of ATAX strategy Freddie Mac TEBS IV Long term leverage Complete Series A Preferred Stock Private Placement Target Portfolio Leverage at 65% of Total Cost of Assets Fully Invested Fully Leveraged Increased revenue Recurring CAD Step I: ATAX Current
Execution of Strategy – 1st Quarter 2016 Series A Preferred Units Issued Significant liquidity event Private Placement Maximum to be issued - $100 million $10 million Non-cumulative, non-voting & non-convertible Benefits of Issuance Non-dilutive to common BUC holders Low cost of capital Attract new investors to ATAX Reinvestment in core assets Enhancement to CAD
Execution of Strategy – 1st Quarter 2016 Series A Preferred Units Issued (cont.) Use of proceeds Acquire multifamily housing revenue bonds Issued by state and local housing authorities Construction and/or permanent financing Fixed rate, long-term first mortgage multifamily housing revenue bonds
Execution of Strategy – 1st Quarter 2016 Investment to provide equity $9.6 million investment Used to build a 288 unit multifamily residential property Corpus Christi, TX Aligns with ATAX’s investment strategy Contributes to growth in CAD Leverage ATAX’s “full service” platform Design Construction monitoring Financing Mezzanine and long term Property management
Execution of Strategy – 1st Quarter 2016 Analyze “highest and best use” of assets MF Properties Asset review completed Restructure vs. Sale
HIGHLIGHTS OF FIRST QUARTER 2016 FINANCIAL RESULTS Craig Allen Chief Financial Officer
Significant Transactions – 1st Quarter 2016 Mortgage Revenue Bond Activity $11.5 million purchase $9.5 million sale Sold three MBS securities $15.1 million MBS Securities segment eliminated Terminated MBS Tender Option Bond (“TOB”) Derivate Hedging $11.0 million Paid in full, and collapsed, TOB financing with Deutsche Bank $20.3 million
Significant Transactions – 1st Quarter 2016 Expanded unsecured line of credit facility Increased access to liquidity for core assets Enhanced operating liquidity Paid in full, and closed, $5 million operating LOC
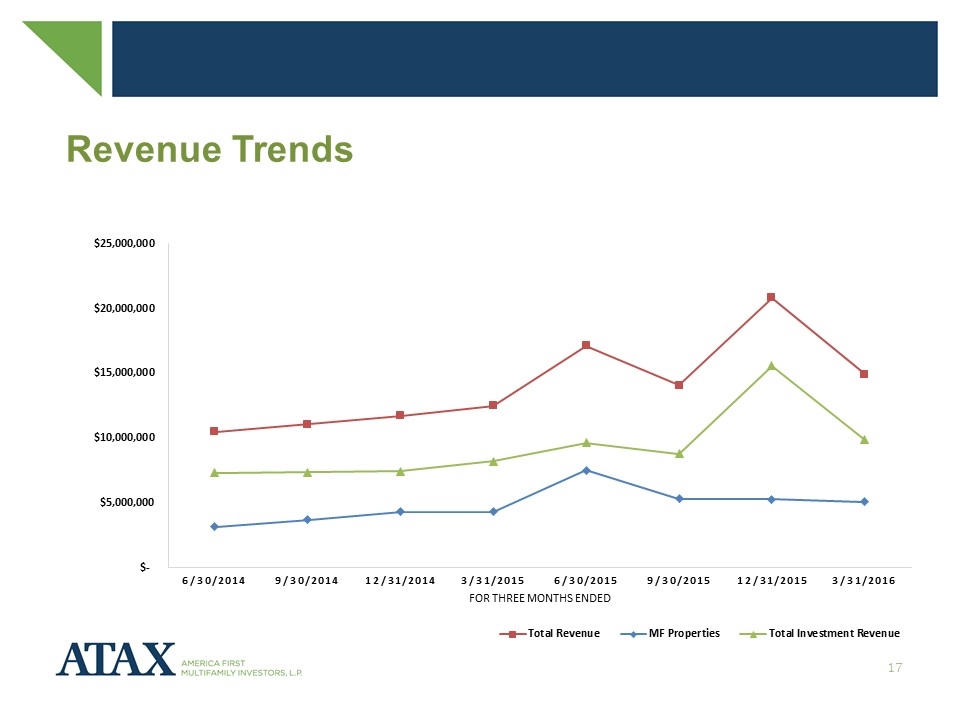
Revenue Trends
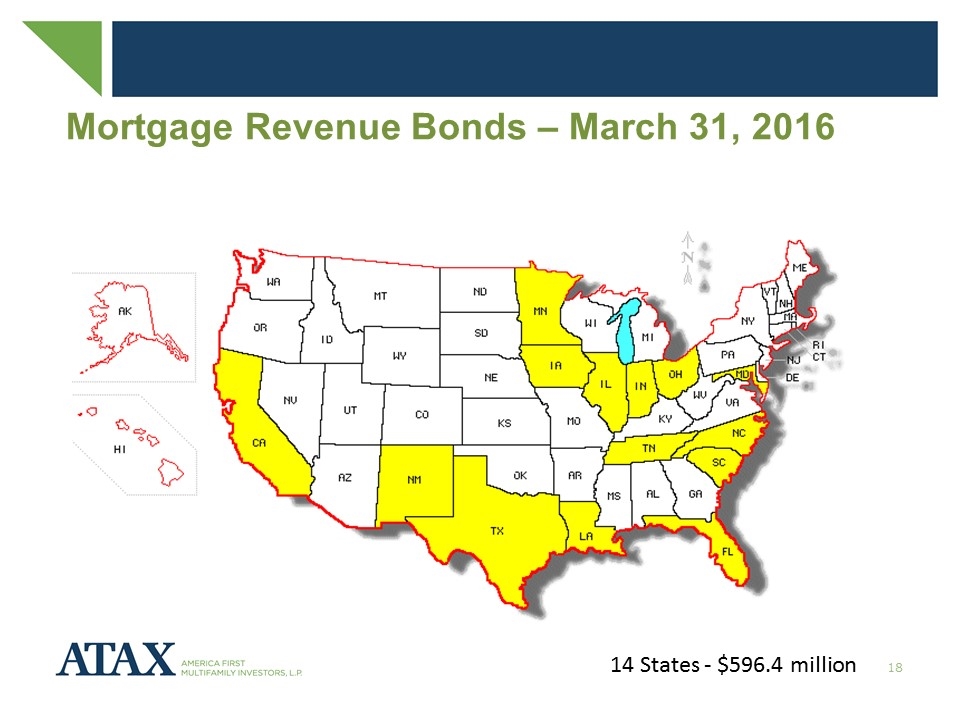
Mortgage Revenue Bonds – March 31, 2016 14 States - $596.4 million
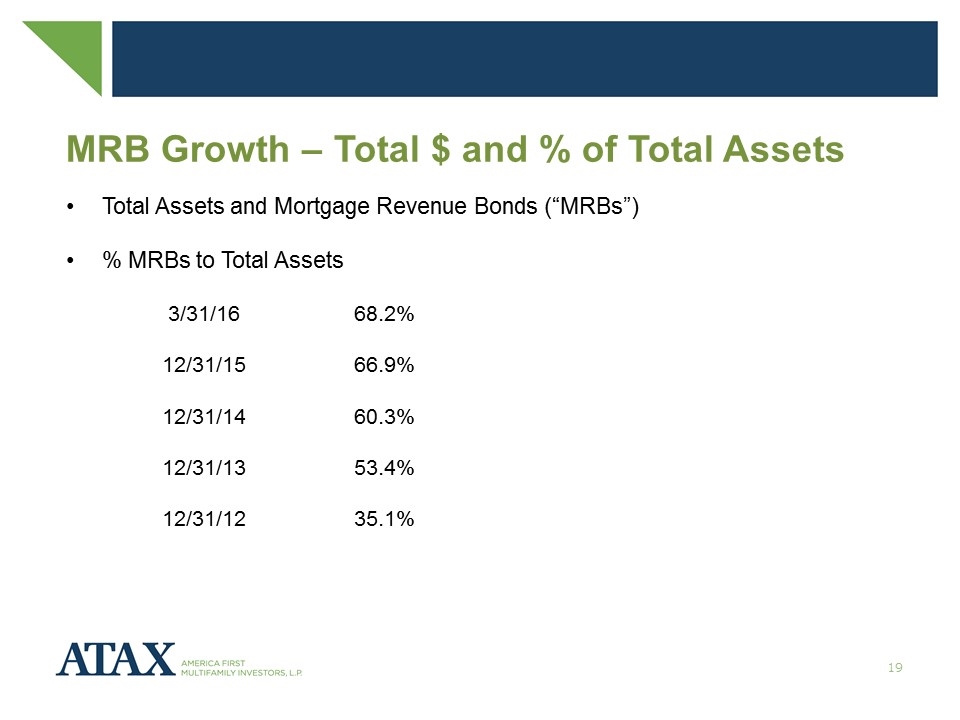
MRB Growth – Total $ and % of Total Assets Total Assets and Mortgage Revenue Bonds (“MRBs”) % MRBs to Total Assets 3/31/1668.2% 12/31/1566.9% 12/31/1460.3% 12/31/1353.4% 12/31/1235.1%
Cash Available for Distribution (“CAD”) 11.1% increase in CAD $0.10 per unit Q1 2016 $0.09 per unitQ2 2015 Positive effects realized Enhanced availability of low-cost financing TEBS III financing facility Fully invested and fully levered Mortgage revenue bond portfolio $596.4 million March 31, 2016 $507.9 millionMarch 31, 2015
CLOSING REMARKS Chad Daffer
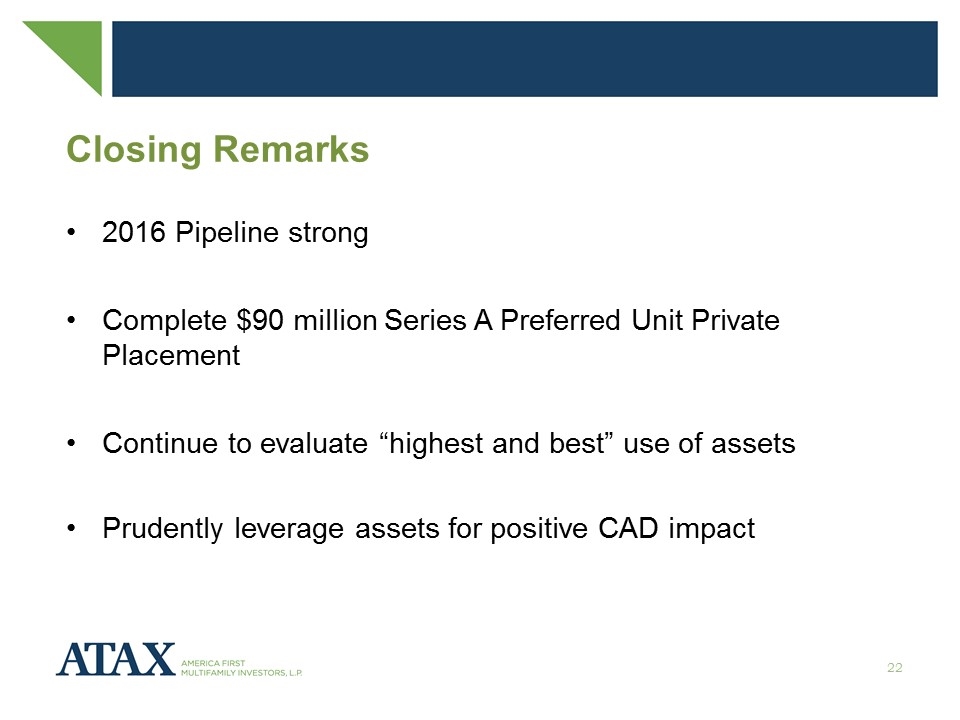
Closing Remarks 2016 Pipeline strong Complete $90 million Series A Preferred Unit Private Placement Continue to evaluate “highest and best” use of assets Prudently leverage assets for positive CAD impact
Q & A
APPENDIX
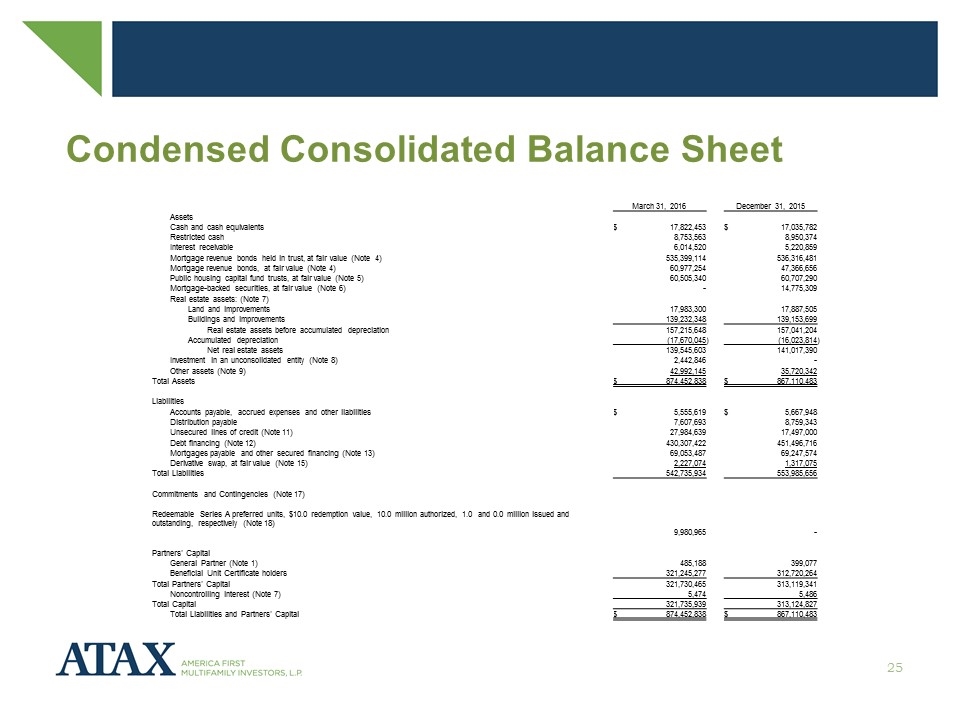
Condensed Consolidated Balance Sheet March 31, 2016 December 31, 2015 Assets Cash and cash equivalents $ 17,822,453 $ 17,035,782 Restricted cash 8,753,563 8,950,374 Interest receivable 6,014,520 5,220,859 Mortgage revenue bonds held in trust, at fair value (Note 4) 535,399,114 536,316,481 Mortgage revenue bonds, at fair value (Note 4) 60,977,254 47,366,656 Public housing capital fund trusts, at fair value (Note 5) 60,505,340 60,707,290 Mortgage-backed securities, at fair value (Note 6) - 14,775,309 Real estate assets: (Note 7) Land and improvements 17,983,300 17,887,505 Buildings and improvements 139,232,348 139,153,699 Real estate assets before accumulated depreciation 157,215,648 157,041,204 Accumulated depreciation (17,670,045 ) (16,023,814 ) Net real estate assets 139,545,603 141,017,390 Investment in an unconsolidated entity (Note 8) 2,442,846 - Other assets (Note 9) 42,992,145 35,720,342 Total Assets $ 874,452,838 $ 867,110,483 Liabilities Accounts payable, accrued expenses and other liabilities $ 5,555,619 $ 5,667,948 Distribution payable 7,607,693 8,759,343 Unsecured lines of credit (Note 11) 27,984,639 17,497,000 Debt financing (Note 12) 430,307,422 451,496,716 Mortgages payable and other secured financing (Note 13) 69,053,487 69,247,574 Derivative swap, at fair value (Note 15) 2,227,074 1,317,075 Total Liabilities 542,735,934 553,985,656 Commitments and Contingencies (Note 17) Redeemable Series A preferred units, $10.0 redemption value, 10.0 million authorized, 1.0 and 0.0 million issued and outstanding, respectively (Note 18) 9,980,965 - Partnersʼ Capital General Partner (Note 1) 485,188 399,077 Beneficial Unit Certificate holders 321,245,277 312,720,264 Total Partnersʼ Capital 321,730,465 313,119,341 Noncontrolling interest (Note 7) 5,474 5,486 Total Capital 321,735,939 313,124,827 Total Liabilities and Partnersʼ Capital $ 874,452,838 $ 867,110,483
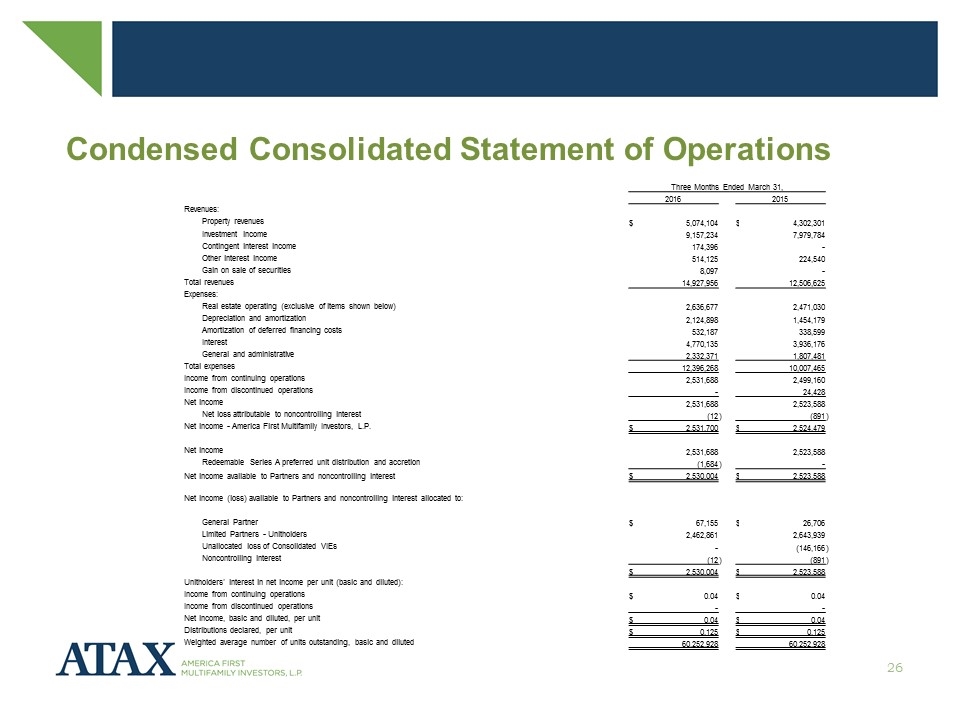
Condensed Consolidated Statement of Operations Three Months Ended March 31, 2016 2015 Revenues: Property revenues $ 5,074,104 $ 4,302,301 Investment income 9,157,234 7,979,784 Contingent interest income 174,396 - Other interest income 514,125 224,540 Gain on sale of securities 8,097 - Total revenues 14,927,956 12,506,625 Expenses: Real estate operating (exclusive of items shown below) 2,636,677 2,471,030 Depreciation and amortization 2,124,898 1,454,179 Amortization of deferred financing costs 532,187 338,599 Interest 4,770,135 3,936,176 General and administrative 2,332,371 1,807,481 Total expenses 12,396,268 10,007,465 Income from continuing operations 2,531,688 2,499,160 Income from discontinued operations - 24,428 Net income 2,531,688 2,523,588 Net loss attributable to noncontrolling interest (12 ) (891 ) Net income - America First Multifamily Investors, L.P. $ 2,531,700 $ 2,524,479 Net income 2,531,688 2,523,588 Redeemable Series A preferred unit distribution and accretion (1,684 ) - Net income available to Partners and noncontrolling interest $ 2,530,004 $ 2,523,588 Net income (loss) available to Partners and noncontrolling interest allocated to: General Partner $ 67,155 $ 26,706 Limited Partners - Unitholders 2,462,861 2,643,939 Unallocated loss of Consolidated VIEs - (146,166 ) Noncontrolling interest (12 ) (891 ) $ 2,530,004 $ 2,523,588 Unitholdersʼ interest in net income per unit (basic and diluted): Income from continuing operations $ 0.04 $ 0.04 Income from discontinued operations - - Net income, basic and diluted, per unit $ 0.04 $ 0.04 Distributions declared, per unit $ 0.125 $ 0.125 Weighted average number of units outstanding, basic and diluted 60,252,928 60,252,928
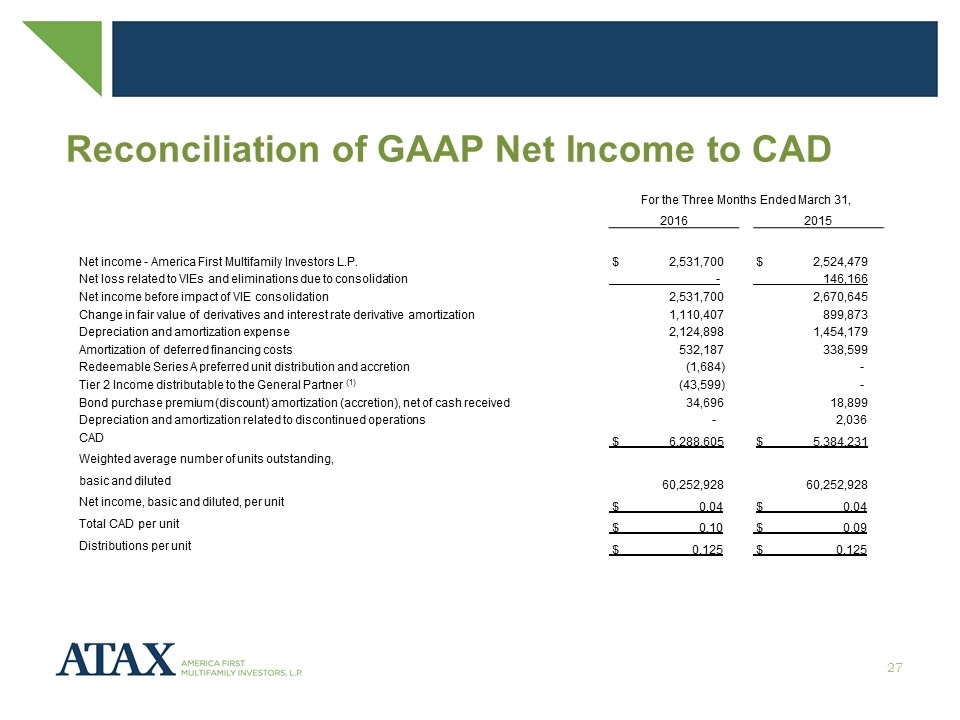
Reconciliation of GAAP Net Income to CAD For the Three Months Ended March 31, 2016 2015 Net income - America First Multifamily Investors L.P. $ 2,531,700 $ 2,524,479 Net loss related to VIEs and eliminations due to consolidation - 146,166 Net income before impact of VIE consolidation 2,531,700 2,670,645 Change in fair value of derivatives and interest rate derivative amortization 1,110,407 899,873 Depreciation and amortization expense 2,124,898 1,454,179 Amortization of deferred financing costs 532,187 338,599 Redeemable Series A preferred unit distribution and accretion (1,684) - Tier 2 Income distributable to the General Partner (1) (43,599) - Bond purchase premium (discount) amortization (accretion), net of cash received 34,696 18,899 Depreciation and amortization related to discontinued operations - 2,036 CAD $ 6,288,605 $ 5,384,231 Weighted average number of units outstanding, basic and diluted 60,252,928 60,252,928 Net income, basic and diluted, per unit $ 0.04 $ 0.04 Total CAD per unit $ 0.10 $ 0.09 Distributions per unit $ 0.125 $ 0.125
