Attached files
| file | filename |
|---|---|
| EX-99.1 - EXHIBIT 99.1 - BEACON ROOFING SUPPLY INC | v438612_ex99-1.htm |
| 8-K - 8-K - BEACON ROOFING SUPPLY INC | v438612_8k.htm |
Exhibit 99.2

2016 Second Quarter Earnings Call May 2, 2016 www.BeaconRoofingSupply.com 2016 Second Quarter Earnings Call May 2 , 2016

2016 Second Quarter Earnings Call May 2, 2016 www.BeaconRoofingSupply.com Highlights □ Record second quarter sales of $823.5 million, nearly double prior year ( 99.3% growth) □ Organic growth of 27.7% in existing markets (31.4% growth in residential roofing) □ Gross margin improvement of 40 basis points to 23.8% of sales □ Adjusted EPS of $0.03 (GAAP EPS of ($0.10)) vs. ($0.20) in prior year □ Second quarter adjusted EBITDA grew to $36.9 million from ($3.6) million in prior year □ RSG integration and synergy realization on track □ Record first half sales of $1.8 billion vs. $1.0 billion in prior year (78.4% growth) □ Completed seven acquisitions year to date in Fiscal 2016 1

2016 Second Quarter Earnings Call May 2, 2016 www.BeaconRoofingSupply.com 19.8% of Sales RSG Integration Update □ Branch Consolidation activities almost complete □ ERP system conversion complete □ Successfully migrating RSG branches to Beacon operating structure □ Minimal loss of revenue post consolidation □ Synergy realization is on target to expectations □ Notable improvement in RSG gross margins vs. prior year under Beacon supply chain contracts 2

2016 Second Quarter Earnings Call May 2, 2016 www.BeaconRoofingSupply.com ($ in Millions) Actual % of Actual % of Actual % of Actual % of Mar-16 Net Sales Mar-15 Net Sales Mar-16 Net Sales Mar-15 Net Sales Net sales $823.5 $413.2 $1,800.0 $1,009.2 Cost of products sold 627.8 76.2% 316.4 76.6% 1,371.1 76.2% 774.9 76.8% Gross profit 195.8 23.8% 96.8 23.4% 429.0 23.8% 234.3 23.2% Operating expenses 180.7 21.9% 111.0 26.9% 361.3 20.1% 224.7 22.3% Income from operations 15.0 1.8% (14.2) (3.4)% 67.6 3.8% 9.6 1.0% interest expense, financing costs and other 11.8 1.4% 2.5 0.6% 24.3 1.3% 5.2 0.5% Income before provision for income taxes 3.2 0.4% (16.7) (4.0)% 43.3 2.4% 4.4 0.4% Provision for income taxes (1.6) (0.2)% 6.9 1.7% (17.0) (0.9)% (1.3) (0.1)% Net Income $1.7 0.2% ($9.8) (2.4)% $26.4 1.5% $3.1 0.3% EPS Adjusted $0.03 ($0.20) $0.44 $0.06 Three Months Ended Six Months Ended Consolidated Adjusted - Statements of Income * The second quarter 2016 Consolidated Statements of Operations includes $5.5 million of non-recurring charges, $5.7 million of additional amortization for acquired intangibles, and $1.2 million of interest expense, financing costs and other for the recognition of certain costs related to the RSG acquisition. For the six months ended March 31, 2016 Consolidated Statements of Operations includes $25.5 million of non-recurring charges, $11.4 million of additional amortization for acquired intangibles, and $5.0 million of interest expense, financing costs and other for the recognition of certain costs related to the RSG acquisition Management believes the Adjusted Net Income for second quarter 2016 and 6 months ended March 31, 2016 provides a meaningful comparison to prior periods operating results as it adjusts for the impact of the RSG Acquisition. 3
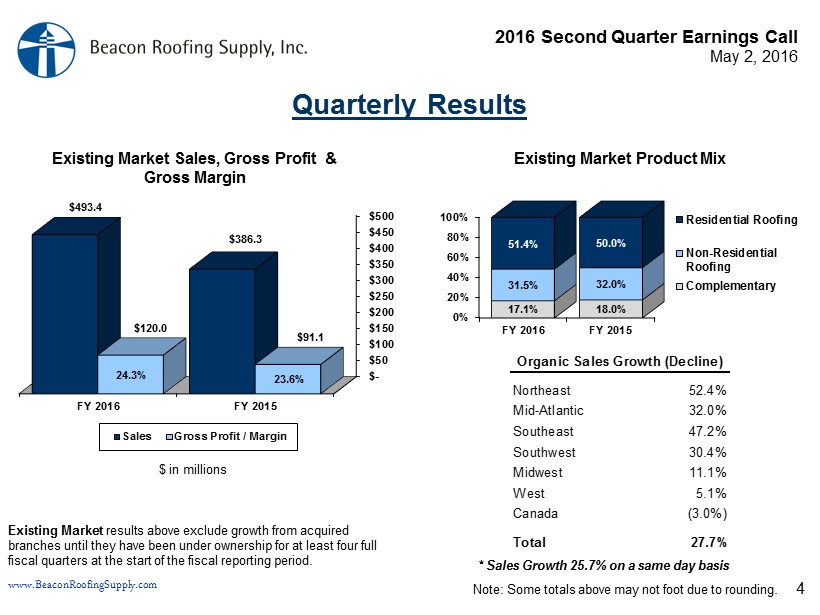
2016 Second Quarter Earnings Call May 2, 2016 www.BeaconRoofingSupply.com 0% 20% 40% 60% 80% 100% FY 2016 FY 2015 17.1% 18.0% 31.5% 32.0% 51.4% 50.0% Residential Roofing Non-Residential Roofing Complementary $- $50 $100 $150 $200 $250 $300 $350 $400 $450 $500 FY 2016 FY 2015 $493.4 $386.3 $120.0 $91.1 Sales Gross Profit / Margin Quarterly Results Existing Market Product Mix Northeast 52.4% Mid-Atlantic 32.0% Southeast 47.2% Southwest 30.4% Midwest 11.1% West 5.1% Canada (3.0%) Total 27.7% Organic Sales Growth (Decline) $ in millions 23.6% Existing Market Sales, Gross Profit & Gross Margin 24.3% Note: Some totals above may not foot due to rounding. Existing Market results above exclude growth from acquired branches until they have been under ownership for at least four full fiscal quarters at the start of the fiscal reporting period. * Sales Growth 25.7% on a same day basis 4
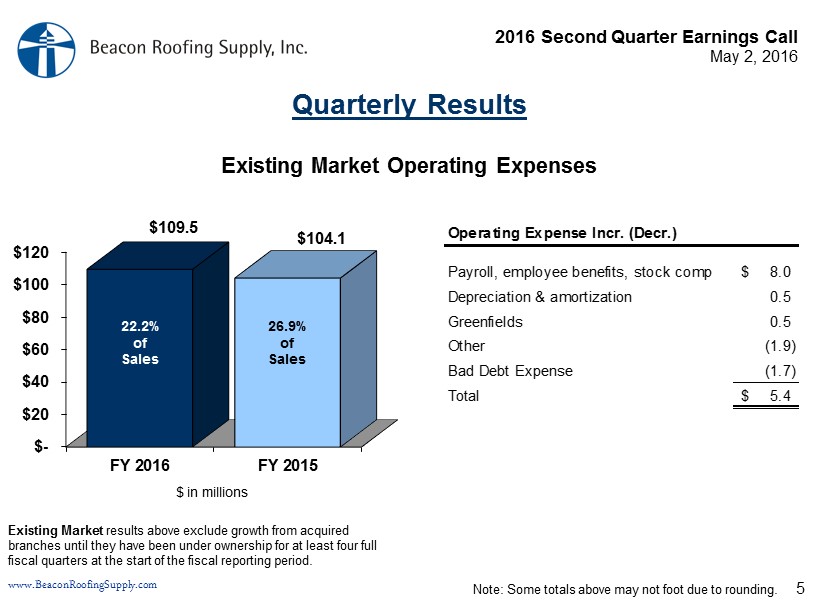
2016 Second Quarter Earnings Call May 2, 2016 www.BeaconRoofingSupply.com $- $20 $40 $60 $80 $100 $120 FY 2016 FY 2015 $109.5 $104.1 $ in millions 22.2% of Sales 26.9% of Sales Existing Market Operating Expenses Quarterly Results Note: Some totals above may not foot due to rounding. Existing Market results above exclude growth from acquired branches until they have been under ownership for at least four full fiscal quarters at the start of the fiscal reporting period. Payroll, employee benefits, stock comp 8.0$ Depreciation & amortization 0.5 Greenfields 0.5 Other (1.9) Bad Debt Expense (1.7) Total 5.4$ Operating Expense Incr. (Decr.) 5

2016 Second Quarter Earnings Call May 2, 2016 www.BeaconRoofingSupply.com ($, in millions) Q2 2016 YTD 2016 P&L Line Item Integration Costs $5.5 $19.6 Misc. SG&A $5.5 $15.3 Op Ex Stock Comp. Expense $0.0 $4.3 Op Ex Transaction Costs $1.2 $10.8 Misc. SG&A $0.0 $5.0 Op Ex Interest Expense $1.2 $5.0 Other (income / expense) (Gain) / Loss on Assets $0.0 $0.8 Op Ex Incremental Amortization $5.7 $11.4 Op Ex Total $12.4 $41.9 RSG acquisition costs reflected on a pre - tax basis Totals may not foot due to rounding RSG Non - Recurring Acquisition Costs 6
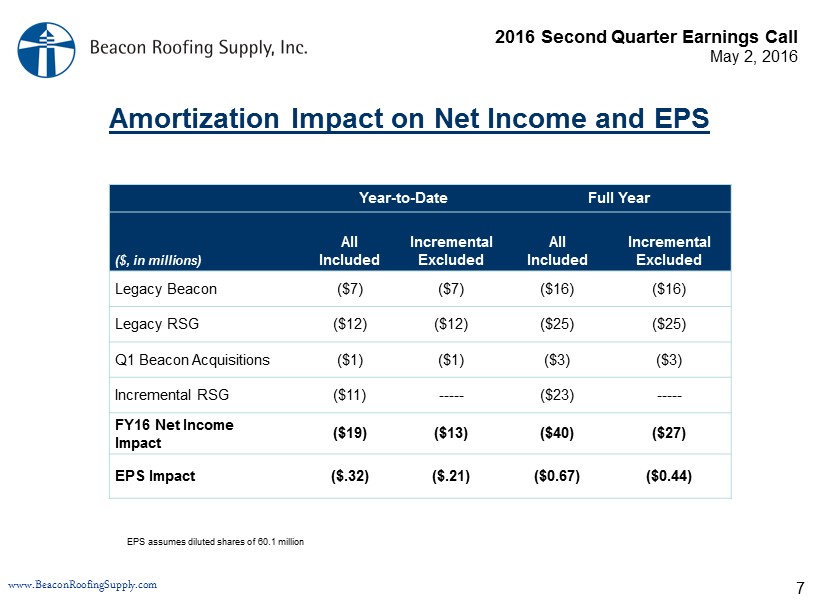
2016 Second Quarter Earnings Call May 2, 2016 www.BeaconRoofingSupply.com Year - to - Date Full Year ($, in millions) All Included Incremental Excluded All Included Incremental Excluded Legacy Beacon ($7) ($7) ($16) ($16) Legacy RSG ($12) ($12) ($25) ($25) Q1 Beacon Acquisitions ($1) ($1) ($3) ($3) Incremental RSG ($11) ----- ($23) ----- FY16 Net Income Impact ($19) ($13) ($40) ($27) EPS Impact ($.32) ($.21) ($0.67) ($0.44) EPS assumes diluted shares of 60.1 million Amortization Impact on Net Income and EPS 7

2016 Second Quarter Earnings Call May 2, 2016 www.BeaconRoofingSupply.com $- $20 $40 $60 $80 $100 FY 2015 FY 2016 $80.7 $62.5 $ in millions Cash Flow From Operations YTD Results Note: Some totals above may not foot due to rounding. CF from Ops. $79.3 $59.4 Non - Cash & WC Adj. $1.4 $3.1 Net Income FY 2016 FY 2015 8

2016 Second Quarter Earnings Call May 2, 2016 www.BeaconRoofingSupply.com 19.8% of Sales Net Debt Leverage Ratio 4.3x 4.2x 3.6x 2.0x 10/1/2015 PF 12/31/2015 3/31/2016 FY18 Goal Net Debt leverage calculation = Total debt net of cash / Trailing 4 quarter Proforma EBITDA □ YTD cash available for debt pay down approximately $150 million, YTD funded $100 million in acquisitions, netting approximately $50 million in debt pay down 9

2016 Second Quarter Earnings Call May 2, 2016 www.BeaconRoofingSupply.com 0% 20% 40% 60% 80% 100% FY 2016 FY 2015 16.8% 17.5% 33.7% 34.7% 49.5% 47.8% Residential Roofing Non-Residential Roofing Complementary $- $200 $400 $600 $800 $1,000 $1,200 FY 2016 FY 2015 $1,108.4 $937.3 $271.7 $219.3 Sales Gross Profit / Margin Year - to - Date Results Existing Market Product Mix Northeast 26.3% Mid-Atlantic 17.5% Southeast 34.4% Southwest 24.9% Midwest 4.4% West 22.2% Canada (1.7%) Total 18.3% Organic Sales Growth (Decline) $ in millions 23.4% Existing Market Sales, Gross Profit & Gross Margin 24.5% Note: Some totals above may not foot due to rounding. Existing Market results above exclude growth from acquired branches until they have been under ownership for at least four full fiscal quarters at the start of the fiscal reporting period. * Sales Growth 17.3% on a same day basis 10

2016 Second Quarter Earnings Call May 2, 2016 www.BeaconRoofingSupply.com $- $50 $100 $150 $200 $250 FY 2016 FY 2015 $219.3 $208.8 $ in millions 19.8% of Sales 22.3% of Sales Existing Market Operating Expenses Year - to - Date Results Note: Some totals above may not foot due to rounding. Existing Market results above exclude growth from acquired branches until they have been under ownership for at least four full fiscal quarters at the start of the fiscal reporting period. Payroll, employee benefits, stock comp 11.4$ Greenfields 2.2 Bad debt expense 0.5 Other (2.0) Selling expenses (1.3) Depreciation & amortization (0.3) Total 10.5$ Operating Expense Incr. (Decr.) 11
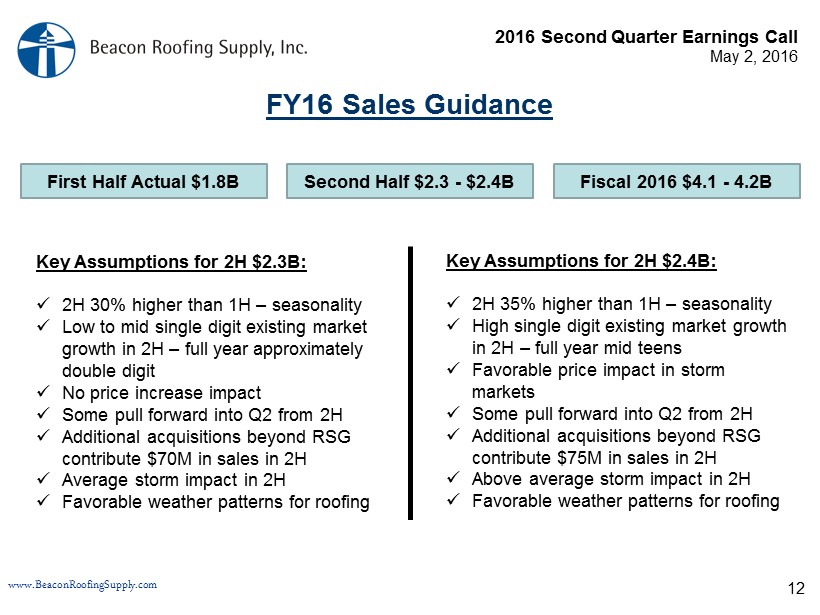
2016 Second Quarter Earnings Call May 2, 2016 www.BeaconRoofingSupply.com 19.8% of Sales FY16 Sales Guidance 12 First Half Actual $1.8B Second Half $2.3 - $2.4B Fiscal 2016 $4.1 - 4.2B Key Assumptions for 2H $2.3B: x 2H 30% higher than 1H – seasonality x Low to mid single digit existing market growth in 2H – full year approximately double digit x No price increase impact x Some pull forward into Q2 from 2H x Additional acquisitions beyond RSG contribute $70M in sales in 2H x Average storm impact in 2H x Favorable weather patterns for roofing Key Assumptions for 2H $2.4B: x 2H 35% higher than 1H – seasonality x High single digit existing market growth in 2H – full year mid teens x Favorable price impact in storm markets x Some pull forward into Q2 from 2H x Additional acquisitions beyond RSG contribute $75M in sales in 2H x Above average storm impact in 2H x Favorable weather patterns for roofing
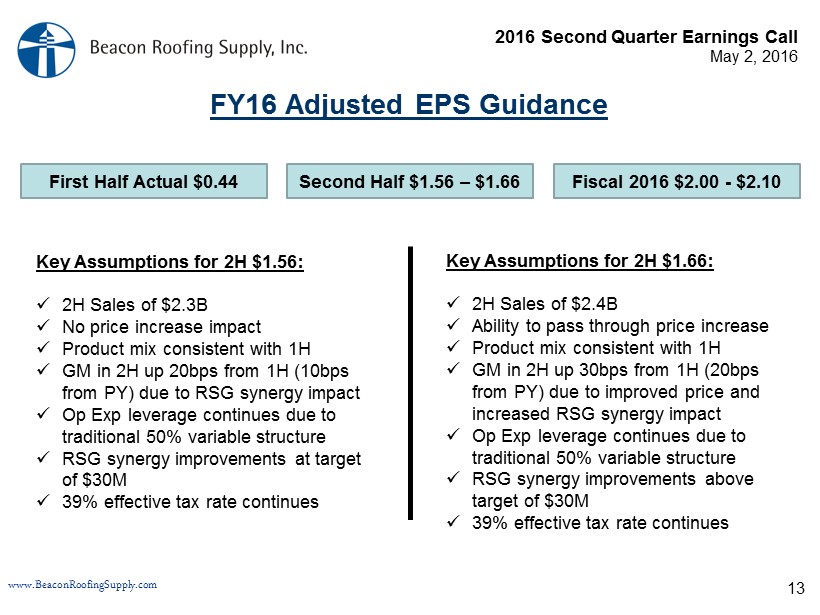
2016 Second Quarter Earnings Call May 2, 2016 www.BeaconRoofingSupply.com 19.8% of Sales FY16 Adjusted EPS Guidance 13 First Half Actual $0.44 Second Half $1.56 – $1.66 Fiscal 2016 $2.00 - $2.10 Key Assumptions for 2H $1.56: x 2H Sales of $2.3B x No price increase impact x Product mix consistent with 1H x GM in 2H up 20bps from 1H (10bps from PY) due to RSG synergy impact x Op Exp leverage continues due to traditional 50% variable structure x RSG synergy improvements at target of $30M x 39% effective tax rate continues Key Assumptions for 2H $1.66: x 2H Sales of $ 2.4B x Ability to pass through price increase x Product mix consistent with 1H x GM in 2H up 30bps from 1H (20bps from PY) due to improved price and increased RSG synergy impact x Op Exp leverage continues due to traditional 50% variable structure x RSG synergy improvements above target of $30M x 39% effective tax rate continues