Attached files
| file | filename |
|---|---|
| EX-31.1 - EXHIBIT 31.1 - Orchids Paper Products CO /DE | ex31-1.htm |
| EX-32.1 - EXHIBIT 32.1 - Orchids Paper Products CO /DE | ex32-1.htm |
| EX-31.2 - EXHIBIT 31.2 - Orchids Paper Products CO /DE | ex31-2.htm |
| EX-32.2 - EXHIBIT 32.2 - Orchids Paper Products CO /DE | ex32-2.htm |
UNITED STATES
SECURITIES AND EXCHANGE COMMISSION
Washington, DC 20549
FORM 10-Q
|
|
☒ |
QUARTERLY REPORT PURSUANT TO SECTION 13 OR 15(d) OF THE SECURITIES EXCHANGE ACT OF 1934 |
For the quarterly period ended March 31, 2016
OR
|
|
☐ |
TRANSITION REPORT PURSUANT TO SECTION 13 OR 15(d) OF THE SECURITIES EXCHANGE ACT OF 1934 |
Commission File Number 001-32563
Orchids Paper Products Company
(Exact name of Registrant as Specified in its Charter)
|
Delaware |
23-2956944 |
|
(State or Other Jurisdiction of |
(I.R.S. Employer |
|
Incorporation or Organization) |
Identification No.) |
4826 Hunt Street
Pryor, Oklahoma 74361
(Address of Principal Executive Offices and Zip Code)
(918) 825-0616
(Registrant’s Telephone Number, Including Area Code)
Indicate by check mark whether the registrant (1) has filed all reports required to be filed by Section 13 or 15(d) of the Securities Exchange Act of 1934 during the preceding 12 months (or for such shorter period that the registrant was required to file such reports), and (2) has been subject to such filing requirement for the past 90 days. Yes ☒ No ☐
Indicate by check mark whether the registrant has submitted electronically and posted on its corporate Web site, if any, every Interactive Data File required to be submitted and posted pursuant to Rule 405 of Regulation S-T during the preceding 12 months. Yes ☒ No ☐
Indicate by check mark whether the registrant is a large accelerated filer, an accelerated filer, a non-accelerated filer or a smaller reporting company. See the definitions of “large accelerated filer”, “accelerated filer” and “smaller reporting company” in Rule 12b-2 of the Exchange Act. (Check one):
|
Large accelerated filer ☐ |
Accelerated filer ☒ |
|
|
|
|
Non-accelerated filer ☐ |
Smaller reporting company ☐ |
Indicate by check mark whether the registrant is a shell company (as defined in Rule 12b-2 of the Exchange Act). Yes ☐ No ☒
Number of shares outstanding of the issuer’s Common Stock, par value $.001 per share, as of April 29, 2016: 10,276,141 shares.
ORCHIDS PAPER PRODUCTS COMPANY AND SUBSIDIARIES
TABLE OF CONTENTS
QUARTERLY REPORT ON FORM 10-Q
FOR THE THREE MONTHS ENDED MARCH 31, 2016
|
|
|
Page |
|
|
PART I. FINANCIAL INFORMATION |
|
|
|
|
|
|
ITEM 1. |
Financial Statements |
3 |
|
|
|
|
|
|
Consolidated Balance Sheets as of March 31, 2016 (Unaudited) and December 31, 2015 |
3 |
|
|
|
|
|
|
Consolidated Statements of Income for the three months ended March 31, 2016 and 2015 (Unaudited) |
4 |
|
|
|
|
|
|
Consolidated Statements of Cash Flows for the three months ended March 31, 2016 and 2015 (Unaudited) |
5 |
|
|
|
|
|
|
Notes to Unaudited Consolidated Interim Financial Statements |
6 |
|
|
|
|
|
ITEM 2. |
Management’s Discussion and Analysis of Financial Condition and Results of Operations |
17 |
|
|
|
|
|
ITEM 3. |
Quantitative and Qualitative Disclosures about Market Risk |
30 |
|
|
|
|
|
ITEM 4. |
Controls and Procedures |
30 |
|
|
|
|
|
|
PART II. OTHER INFORMATION |
|
|
|
|
|
|
ITEM 1. |
Legal Proceedings |
30 |
|
|
|
|
|
ITEM 1A. |
Risk Factors |
30 |
|
|
|
|
|
ITEM 2. |
Unregistered Sales of Equity Securities and Use of Proceeds |
31 |
|
|
|
|
|
ITEM 3. |
Defaults Upon Senior Securities |
31 |
|
|
|
|
|
ITEM 4. |
Mine Safety Disclosures |
31 |
|
|
|
|
|
ITEM 5. |
Other Information |
31 |
|
|
|
|
|
ITEM 6. |
Exhibits |
31 |
|
|
|
|
|
|
Signatures |
32 |
PART I. FINANCIAL INFORMATION
ITEM 1. Financial Statements
ORCHIDS PAPER PRODUCTS COMPANY AND SUBSIDIARIES
CONSOLIDATED BALANCE SHEETS
(Dollars in thousands, except share data)
|
March 31, |
December 31, |
|||||||
|
2016 |
2015 |
|||||||
|
(Unaudited) |
||||||||
|
ASSETS |
||||||||
|
Current assets: |
||||||||
|
Cash |
$ | 8,039 | $ | 4,361 | ||||
|
Accounts receivable, net of allowance of $155 in 2016 and 2015 |
11,723 | 10,509 | ||||||
|
Receivables from related party |
1,572 | 1,325 | ||||||
|
Inventories, net |
13,785 | 13,501 | ||||||
|
Income taxes receivable |
5,628 | 5,628 | ||||||
|
Prepaid expenses |
1,521 | 1,136 | ||||||
|
Other current assets |
2,517 | 1,853 | ||||||
|
Total current assets |
44,785 | 38,313 | ||||||
|
Property, plant and equipment |
256,600 | 232,925 | ||||||
|
Accumulated depreciation |
(62,185 | ) | (59,547 | ) | ||||
|
Net property, plant and equipment |
194,415 | 173,378 | ||||||
|
Restricted cash |
7,215 | 12,005 | ||||||
|
VAT receivable |
1,761 | 1,751 | ||||||
|
Intangible assets, net of accumulated amortization of $2,637 in 2016 and $2,260 in 2015 |
15,353 | 15,730 | ||||||
|
Goodwill |
7,560 | 7,560 | ||||||
|
Total assets |
$ | 271,089 | $ | 248,737 | ||||
|
LIABILITIES AND STOCKHOLDERS' EQUITY |
||||||||
|
Current liabilities: |
||||||||
|
Accounts payable |
$ | 7,299 | $ | 7,211 | ||||
|
Accounts payable to related party |
2,824 | 3,887 | ||||||
|
Accrued liabilities |
7,895 | 3,880 | ||||||
|
Current portion of long-term debt |
4,214 | 3,882 | ||||||
|
Total current liabilities |
22,232 | 18,860 | ||||||
|
Long-term debt, less current portion |
87,292 | 70,357 | ||||||
|
Other long-term liabilities |
5,116 | 5,098 | ||||||
|
Deferred income taxes |
20,619 | 20,639 | ||||||
|
Stockholders' equity: |
||||||||
|
Common stock, $.001 par value, 25,000,000 shares authorized, 10,275,141 and 10,268,891 shares issued and outstanding in 2016 and 2015, respectively |
10 | 10 | ||||||
|
Additional paid-in capital |
98,068 | 97,834 | ||||||
|
Retained earnings |
37,752 | 35,939 | ||||||
|
Total stockholders' equity |
135,830 | 133,783 | ||||||
|
Total liabilities and stockholders' equity |
$ | 271,089 | $ | 248,737 | ||||
See notes to unaudited consolidated interim financial statements.
ORCHIDS PAPER PRODUCTS COMPANY AND SUBSIDIARIES
CONSOLIDATED STATEMENTS OF INCOME
(Dollars in thousands, except share and per share data)
|
Three Months Ended March 31, |
||||||||
|
2016 |
2015 |
|||||||
|
(unaudited) |
(unaudited) |
|||||||
|
Net sales |
$ | 47,743 | $ | 37,415 | ||||
|
Cost of sales |
36,362 | 32,629 | ||||||
|
Gross profit |
11,381 | 4,786 | ||||||
|
Selling, general and administrative expenses |
2,722 | 2,497 | ||||||
|
Intangibles amortization |
377 | 377 | ||||||
|
Operating income |
8,282 | 1,912 | ||||||
|
Interest expense |
263 | 214 | ||||||
|
Other (income) expense, net |
(201 | ) | (186 | ) | ||||
|
Income before income taxes |
8,220 | 1,884 | ||||||
|
Provision for (benefit from) income taxes: |
||||||||
|
Current |
2,832 | 808 | ||||||
|
Deferred |
(21 | ) | (160 | ) | ||||
| 2,811 | 648 | |||||||
|
Net income |
$ | 5,409 | $ | 1,236 | ||||
|
Net income per common share: |
||||||||
|
Basic |
$ | 0.53 | $ | 0.14 | ||||
|
Diluted |
$ | 0.52 | $ | 0.14 | ||||
|
Shares used in calculating net income per common share: |
||||||||
|
Basic |
10,272,155 | 8,755,116 | ||||||
|
Diluted |
10,343,086 | 8,823,976 | ||||||
|
Dividends per share |
$ | 0.35 | $ | 0.35 | ||||
See notes to unaudited consolidated interim financial statements.
ORCHIDS PAPER PRODUCTS COMPANY AND SUBSIDIARIES
CONSOLIDATED STATEMENTS OF CASH FLOWS
(Dollars in thousands)
|
Three Months |
Three Months |
|||||||
|
Ended |
Ended |
|||||||
|
March 31, |
March 31, |
|||||||
|
2016 |
2015 |
|||||||
|
(unaudited) |
(unaudited) |
|||||||
| Cash Flows From Operating Activities | ||||||||
|
Net income |
$ | 5,409 | $ | 1,236 | ||||
|
Adjustments to reconcile net income to net cash provided by operating activities: |
||||||||
|
Depreciation and amortization |
3,091 | 2,476 | ||||||
|
Deferred income taxes |
(21 | ) | (160 | ) | ||||
|
Stock compensation expense |
149 | 267 | ||||||
|
Changes in cash due to changes in operating assets and liabilities: |
||||||||
|
Accounts receivable |
(1,461 | ) | 1,015 | |||||
|
Inventories |
(284 | ) | (1,541 | ) | ||||
|
Prepaid expenses |
(385 | ) | 327 | |||||
|
Other current assets |
(674 | ) | 233 | |||||
|
Accounts payable |
(975 | ) | 826 | |||||
|
Accrued liabilities |
4,014 | 872 | ||||||
|
Net cash provided by operating activities |
8,863 | 5,551 | ||||||
|
Cash Flows From Investing Activities |
||||||||
|
Purchases of property, plant and equipment |
(25,575 | ) | (10,943 | ) | ||||
|
Decrease in restricted cash |
4,790 | - | ||||||
|
Net cash used in investing activities |
(20,785 | ) | (10,943 | ) | ||||
|
Cash Flows From Financing Activities |
||||||||
|
Proceeds from economic incentive |
1,900 | - | ||||||
|
Principal payments on long-term debt |
(675 | ) | (675 | ) | ||||
|
Decrease in bank overdrafts |
- | (1,706 | ) | |||||
|
Net borrowings on revolving credit lines |
17,987 | 13,073 | ||||||
|
Dividends paid to stockholders |
(3,596 | ) | (3,066 | ) | ||||
|
Proceeds from the exercise of stock options |
49 | 22 | ||||||
|
Excess tax benefit of stock options exercised |
36 | 1 | ||||||
|
Deferred debt issuance costs |
(101 | ) | (4 | ) | ||||
|
Net cash provided by financing activities |
15,600 | 7,645 | ||||||
|
Net increase in cash |
$ | 3,678 | $ | 2,253 | ||||
|
Cash, beginning |
4,361 | 1,021 | ||||||
|
Cash, ending |
$ | 8,039 | $ | 3,274 | ||||
|
Supplemental Disclosure: |
||||||||
|
Interest paid |
$ | 386 | $ | 101 | ||||
|
Income taxes paid |
$ | - | $ | - | ||||
|
Tax benefits realized from stock options exercised |
$ | 43 | $ | 4 | ||||
See notes to unaudited consolidated interim financial statements.
ORCHIDS PAPER PRODUCTS COMPANY AND SUBSIDIARIES
NOTES TO UNAUDITED CONSOLIDATED INTERIM FINANCIAL STATEMENTS
Note 1 — Basis of Presentation
Orchids Paper Products Company and its subsidiaries (collectively, “Orchids” or the “Company”) produce bulk tissue paper, known as parent rolls, and convert parent rolls into finished products, including paper towels, bathroom tissue and paper napkins. The Company predominately sells its products for use in the “at home” market under private labels to a customer base consisting primarily of dollar stores, discount retailers and grocery stores that offer limited alternatives across a wide range of products, and, to a lesser extent, the “away from home” market. The Company has owned and operated its manufacturing facility in Pryor, Oklahoma since 1998. On June 3, 2014, the Company completed the acquisition of certain assets from Fabrica de Papel San Francisco, S.A. de C.V. (“Fabrica”) pursuant to an Asset Purchase Agreement (see Note 2). In connection with the acquisition of these assets, the Company formed three wholly-owned subsidiaries: Orchids Mexico DE Holdings, LLC, Orchids Mexico DE Member, LLC, and OPP Acquisition Mexico, S. de R.L. de C.V (“Orchids Mexico”). In April 2015, the Company announced the construction of a new manufacturing facility in Barnwell, South Carolina. In conjunction with this project, the Company established a wholly-owned subsidiary: Orchids Paper Products Company of South Carolina. Furthermore, in connection with a New Market Tax Credit (“NMTC”) transaction in December 2015 (see Note 12), the Company created Orchids Lessor SC, LLC, another wholly-owned subsidiary. The accompanying consolidated financial statements include the accounts of Orchids and these wholly-owned subsidiaries. All significant intercompany transactions and balances have been eliminated in consolidation.
The Company’s common stock trades on the NYSE MKT under the ticker symbol “TIS.”
The accompanying financial statements have been prepared without an audit, pursuant to the rules and regulations of the Securities and Exchange Commission (“SEC”). Certain information and footnote disclosures normally included in annual financial statements prepared in accordance with accounting principles generally accepted (“GAAP”) in the United States have been condensed or omitted pursuant to the rules and regulations. However, the Company believes that the disclosures made are adequate to make the information presented not misleading when read in conjunction with the audited financial statements and the notes in the Company’s Annual Report on Form 10-K for the fiscal year ended December 31, 2015, filed with the SEC on March 7, 2016. Management believes that the financial statements contain all adjustments necessary for a fair presentation of the results for the interim periods presented. All adjustments were of a normal, recurring nature. The results of operations for the interim period are not necessarily indicative of the results for the entire fiscal year.
Certain prior period amounts in the accompanying financial statements have been reclassified to conform to the current period presentation (see Note 14). These reclassifications did not affect previously reported amounts of net income.
Note 2 — Fabrica Transaction
On May 5, 2014, Orchids Paper Products Company and its wholly owned subsidiary, Orchids Mexico, entered into an asset purchase agreement (“APA”) with Fabrica to acquire certain assets and 100% of the U.S. business of Fabrica. On June 3, 2014, the Company closed on the transaction set forth in the APA, and in connection therewith, entered into a supply agreement (“Supply Agreement”) and a lease agreement (“Equipment Lease Agreement”) (collectively, the “Fabrica Transaction”).
Related Party Transactions
The Company entered into the following transactions with Fabrica during the three-month periods ended March 31:
|
Three months ended March 31, |
||||||||
|
2016 |
2015 |
|||||||
|
(in thousands) |
||||||||
|
Products purchased under the Supply Agreement |
$ | 9,005 | $ | 9,419 | ||||
|
Amounts billed to Fabrica under the Equipment Lease Agreement |
$ | 521 | $ | 685 | ||||
|
Parent rolls purchased by Fabrica |
$ | 867 | $ | - | ||||
Goodwill
There were no changes to the $7.6 million goodwill recognized from the Fabrica Transaction during the three-month periods ended March 31, 2016 and 2015. No goodwill impairment has been recorded as of March 31, 2016.
ORCHIDS PAPER PRODUCTS COMPANY AND SUBSIDIARIES
NOTES TO UNAUDITED CONSOLIDATED INTERIM FINANCIAL STATEMENTS (continued)
Note 3 — Fair Value Measurements
The Company does not report any assets or liabilities at fair value in the financial statements. However, the fair value of the Company’s long-term debt is estimated by management to approximate the carrying value (before deducting unamortized debt issuance costs) of $92,893,000 and $75,581,000 at March 31, 2016 and December 31, 2015, respectively. Management’s estimates are based on periodic comparisons of the characteristics of the Company’s obligations, including floating interest rates, credit rating, maturity and collateral, to current market conditions as stated by an independent third-party financial institution. Such valuation inputs are considered a Level 2 measurement in the fair value valuation hierarchy.
Note 4 — Commitments and Contingencies
The Company may be involved from time to time in litigation arising from the normal course of business. In management’s opinion, as of the date of this report, the Company is not engaged in legal proceedings which individually or in the aggregate are expected to have a materially adverse effect on the Company’s results of operations or financial condition.
In October 2008, the Company entered into a contract to purchase 334,000 MMBTU per year of natural gas. This contract has been extended through December 2016. In September 2014, the Company entered into a similar contract with a different vendor for natural gas requirements in 2017. Commitments remaining under these contracts are as follows:
|
Period |
MMBTUs |
Price per MMBTU |
Management fee per MMBTU |
|||||||||
|
April 2016 - June 2016 |
93,600 | $ | 4.17 | $ | 0.07 | |||||||
|
July 2016 - September 2016 |
92,300 | $ | 4.26 | $ | 0.07 | |||||||
|
October 2016 - December 2016 |
91,900 | $ | 4.42 | $ | 0.07 | |||||||
|
January 2017 - December 2017 |
467,505 | $ | 4.06 | $ | - | |||||||
Purchases under the gas contract were $0.4 million for each of the three-months periods ended March 31, 2016 and 2015, respectively. If the Company is unable to purchase the contracted amounts and the market price at that time is less than the contracted price, the Company would be obligated under the terms of the agreement to reimburse an amount equal to the difference between the contracted amount and the amount actually purchased, multiplied by the difference between the contract price and a price designated in the contract (approximates spot price).
In the second quarter of 2015, the Company began construction on an integrated paper converting facility in Barnwell, South Carolina, which has a total estimated cost of $136.0 million. As of March 31, 2016, obligations under these purchase orders totaled $39.6 million.
ORCHIDS PAPER PRODUCTS COMPANY AND SUBSIDIARIES
NOTES TO UNAUDITED CONSOLIDATED INTERIM FINANCIAL STATEMENTS (continued)
Note 5 — Inventories
Inventories at March 31, 2016 and December 31, 2015 were as follows:
|
March 31, |
December 31, |
|||||||
|
2016 |
2015 |
|||||||
|
(in thousands) |
||||||||
|
Raw materials |
$ | 4,724 | $ | 4,467 | ||||
|
Bulk paper rolls |
1,960 | 3,789 | ||||||
|
Converted finished goods |
7,266 | 5,386 | ||||||
|
Inventory valuation reserve |
(165 | ) | (141 | ) | ||||
| $ | 13,785 | $ | 13,501 | |||||
Note 6 — Property, Plant and Equipment
Property, plant and equipment at March 31, 2016 and December 31, 2015 was:
|
March 31, |
December 31, |
|||||||
|
2016 |
2015 |
|||||||
|
(in thousands) |
||||||||
|
Land |
$ | 1,316 | $ | 1,316 | ||||
|
Buildings and improvements |
24,321 | 24,321 | ||||||
|
Machinery and equipment |
142,068 | 141,811 | ||||||
|
Vehicles |
1,796 | 1,796 | ||||||
|
Nondepreciable machinery and equipment (parts and spares) |
10,813 | 10,250 | ||||||
|
Construction-in-process |
76,286 | 53,431 | ||||||
| $ | 256,600 | $ | 232,925 | |||||
In January 2016, the Company received $1.9 million of proceeds from an economic incentive related to the construction of the South Carolina facility. While there currently are no US GAAP pronouncements relating to the accounting treatment of government grants, the Company recorded these proceeds as a reduction in the property, plant and equipment related to this project in accordance with non-authoritative guidance issued by the American Institute of Certified Public Accountants, which recommended that grants related to developing property be recognized over the useful lives of the assets by recognizing receipt as the related asset is depreciated.
ORCHIDS PAPER PRODUCTS COMPANY AND SUBSIDIARIES
NOTES TO UNAUDITED CONSOLIDATED INTERIM FINANCIAL STATEMENTS (continued)
Note 7 — Long-Term Debt and Revolving Line of Credit
In June 2015, the Company entered into the Second Amended and Restated Credit Agreement (the “Credit Agreement”), with U.S. Bank National Association (“U.S. Bank”) consisting of the following:
|
|
● |
a $25.0 million revolving credit line due June 2020; |
|
|
● |
a $47.3 million Term Loan with a 5-year term due June 2020 and payable in quarterly installments of $675,000 through June 2016 and $1.0 million per quarter thereafter; |
|
|
● |
a $115.0 million delayed draw term loan with a 2-year draw period due June 2020 and payable in quarterly installments beginning in September 2017 of 1.5% of the June 30, 2017 outstanding balance; and |
|
|
● |
an accordion feature allowing the revolving credit line and/or delayed draw commitment under the Credit Agreement to be increased by up to $50.0 million at any time on or before the expiration date of the Credit Agreement. |
In December 2015, in connection with the NMTC transaction (see Note 12), the maximum borrowing capacity under the delayed draw term loan was reduced from $115.0 million to $99.6 million.
Under the terms of the Credit Agreement, amounts outstanding will bear interest at a variable rate of LIBOR plus a specified margin, or the base rate plus a specified margin, at the Company’s option. The specified margin is based on the Company’s quarterly Leverage Ratio, as defined in the Credit Agreement. The following table outlines the specified margins and the commitment fees payable under the Credit Agreement:
|
LIBOR |
Base |
Commitment |
||||||||||
|
Leverage Ratio |
Margin |
Margin |
Fee |
|||||||||
|
Less than 1.00 |
1.25 | % | 0.00 | % | 0.15 | % | ||||||
|
Greater than or equal to 1.00 but less than 2.00 |
1.50 | % | 0.00 | % | 0.20 | % | ||||||
|
Greater than or equal to 2.00 but less than 3.00 |
1.75 | % | 0.00 | % | 0.25 | % | ||||||
|
Greater than or equal to 3.00 but less than 3.50 |
2.25 | % | 0.00 | % | 0.30 | % | ||||||
|
Greater than or equal to 3.50 |
2.50 | % | 0.25 | % | 0.35 | % | ||||||
The Company’s leverage ratio at March 31, 2016 was approximately 2.37. The Company’s weighted-average interest rate was 2.33% at March 31, 2016.
Additionally, in connection with the NMTC transaction discussed in Note 12, the Company entered into an $11.1 million term loan with U.S. Bank. This loan bears interest at a fixed rate of 4.4% and matures on December 29, 2022. The loan requires quarterly payments of principal and interest of approximately $255,000, beginning on March 29, 2016, with a balloon payment due on the maturity date.
ORCHIDS PAPER PRODUCTS COMPANY AND SUBSIDIARIES
NOTES TO UNAUDITED CONSOLIDATED INTERIM FINANCIAL STATEMENTS (continued)
Note 7 — Long-Term Debt and Revolving Line of Credit (continued)
Long-term debt at March 31, 2016 and December 31, 2015 consists of:
|
March 31, |
December 31, |
|||||||
|
2016 |
2015 |
|||||||
|
(in thousands) |
||||||||
|
Revolving line of credit, maturing on June 25, 2020 |
$ | 10,000 | $ | - | ||||
|
Delayed draw term loan, maturing on June 25, 2020 |
26,509 | 18,522 | ||||||
|
Term Loan, maturing on June 25, 2020, due in quarterly installments of $675,000 for the first year and $1,000,000 thereafter, excluding interest paid separately |
45,275 | 45,950 | ||||||
|
Term Loan, maturing on December 29, 2022, due in quarterly installments of $255,006, including interest |
11,109 | 11,109 | ||||||
|
Less: unamortized debt issuance costs |
(1,387 | ) | (1,342 | ) | ||||
| $ | 91,506 | $ | 74,239 | |||||
|
Less current portion |
4,214 | 3,882 | ||||||
| $ | 87,292 | $ | 70,357 | |||||
Unamortized debt issuance costs consist of:
|
March 31, |
December 31, |
|||||||
|
2016 |
2015 |
|||||||
|
(in thousands) |
||||||||
|
Revolving line of credit |
$ | 269 | $ | 285 | ||||
|
Delayed draw term loan |
325 | 344 | ||||||
|
Term Loan, maturing on June 25, 2020 |
172 | 182 | ||||||
|
Term Loan, maturing on December 29, 2022 |
621 | 531 | ||||||
| $ | 1,387 | $ | 1,342 | |||||
The amount available under the revolving credit line may be reduced in the event that the Company’s borrowing base, which is based upon qualified receivables and qualified inventory, is less than $25 million.
Obligations under the Credit Agreement and the NMTC loan are secured by substantially all of the Company’s assets. The Credit Agreement contains representations and warranties, and affirmative and negative covenants customary for financings of this type, including, but not limited to, limitations on additional borrowings, additional investments and asset sales. The financial covenants, which are tested as of the end of each fiscal quarter, require the Company to maintain the following specific ratios: fixed charge coverage (minimum of 1.20 to 1.0) and leverage (maximum of 4.00 to 1.0 through June 2017; maximum of 3.75 to 1.0 on September 30, 2017; maximum of 3.50 to 1.0 on December 31, 2017, and thereafter). The Company was in compliance with these financial covenants at March 31, 2016.
Note 8 — Income Taxes
As of March 31, 2016, our annual estimated effective income tax rate is 34.2%. The annual estimated effective tax rate for 2016 differs from the statutory rate due primarily to U.S. manufacturing tax credits and deductions and foreign income taxes. Our actual effective income tax rate was 34.4% for the three-month period ended March 31, 2015.
During the first quarter of 2016, we elected to early adopt ASU 2015-17, “Income Taxes: Balance Sheet Classification of Deferred Taxes” (“ASU 2015-17”) on a retrospective basis. ASU 2015-17 requires that deferred tax liabilities and assets be classified as noncurrent in a classified statement of financial position. As such, we reclassified $1.3 million of current deferred tax assets to noncurrent (netted within noncurrent liabilities) on the consolidated balance sheets as of March 31, 2016 and December 31, 2015. The adoption of ASU 2015-17 did not affect our consolidated statements of income.
ORCHIDS PAPER PRODUCTS COMPANY AND SUBSIDIARIES
NOTES TO UNAUDITED CONSOLIDATED INTERIM FINANCIAL STATEMENTS (continued)
Note 9 — Earnings per Share
During the first quarter of 2013, the Company granted restricted stock to certain employees. These awards include a nonforfeitable right to receive dividends and therefore are considered to participate in undistributed earnings with common shareholders. Therefore, the Company calculates basic and diluted earnings per common share using the two-class method, under which net earnings are allocated to each class of common stock and participating security. The computation of basic and diluted net income per common share for the three-month periods ended March 31, 2016 and 2015 is as follows:
|
Three Months Ended March 31, |
||||||||
|
2016 |
2015 |
|||||||
|
Net income - ($ thousands) |
$ | 5,409 | $ | 1,236 | ||||
|
Less: distributed earnings allocable to participating securities |
- | (1 | ) | |||||
|
Less: undistributed earnings allocable to participating securities |
- | 1 | ||||||
|
Distributed and undistributed earnings allocable to common shareholders |
$ | 5,409 | $ | 1,236 | ||||
|
Weighted average shares outstanding |
10,272,155 | 8,755,116 | ||||||
|
Effect of stock options |
70,931 | 68,860 | ||||||
|
Weighted average shares outstanding - assuming dilution |
10,343,086 | 8,823,976 | ||||||
|
Net income per common share: |
||||||||
|
Basic |
$ | 0.53 | $ | 0.14 | ||||
|
Diluted |
$ | 0.52 | $ | 0.14 | ||||
|
Stock options not considered above because they were anti-dilutive |
598,000 | 560,000 | ||||||
Note 10 — Stock Incentives
In April 2014, the Orchids Paper Products Company 2014 Stock Incentive Plan (the “2014 Plan”) was approved. The 2014 Plan replaced the Orchids Paper Products Company 2005 Stock Incentive Plan (the “2005 Plan”) and provides for the granting of stock options and other stock based awards to employees and Board members selected by the Board’s Compensation Committee. A total of 400,000 shares may be issued pursuant to the 2014 Plan. As of March 31, 2016, there were 219,300 shares available for issuance under the 2014 Plan.
Stock Options with Time-Based Vesting Conditions
The grant date fair value of the following option grants was estimated using the Black-Scholes option valuation model. Option valuation models require the input of highly subjective assumptions including the expected stock price volatility. The following table details the options granted to certain members of the Board of Directors and management that were valued using the Black-Scholes valuation model and the assumptions used in the valuation model for those grants during the three months ended March 31, 2016. There were no options with time-based vesting conditions granted during the three months ended March 31, 2015.
|
Grant |
Number |
Exercise |
Grant Date |
Risk-Free |
Estimated |
Dividend |
Expected |
|||||||||||||||||||||
|
Date |
of Shares |
Price |
Fair Value |
Interest Rate |
Volatility |
Yield |
Life (years) |
|||||||||||||||||||||
|
January-16 |
5,000 | $ | 27.77 | $ | 6.56 | 2.00 | % | 40 | % | 5.04 | % | 5 | ||||||||||||||||
The Company expenses the cost of these options granted over the vesting period of the option based on the grant-date fair value of the award.
Stock Options with Market-Based Vesting Conditions
There were no options with market-based vesting conditions granted during the three-month periods ended March 31, 2016 or 2015. During the three months ended March 31, 2016, 900 options with market-based vesting conditions were forfeited when an employee left the Company.
The Company expenses the cost of these options granted over the implicit, or derived, service period of the option based on the grant-date fair value of the award.
ORCHIDS PAPER PRODUCTS COMPANY AND SUBSIDIARIES
NOTES TO UNAUDITED CONSOLIDATED INTERIM FINANCIAL STATEMENTS (continued)
Note 10 — Stock Incentives (continued)
Options Issued Outside of the 2014 Plan
There were no stock options granted outside of the 2014 Plan during the three-month periods ended March 31, 2016 or 2015.
Total Option Expense
The Company recognized the following expenses related to all options granted under the 2005 Plan, the 2014 Plan and outside of the 2014 Plan:
|
Three Months Ended March 31, |
||||||||
|
2016 |
2015 |
|||||||
|
Time-Based Vesting Options |
$ | 32,000 | $ | 1,000 | ||||
|
Market-Based Vesting Options |
113,000 | 254,000 | ||||||
|
Total compensation expense related to stock options |
$ | 145,000 | $ | 255,000 | ||||
Future Expected Market-Based Stock Option Expense
The grant of options that vest based on a market condition have had a material effect and will have a lesser effect on the Company’s results of operations in 2016. Based on the derived service periods of the options, the Company expects to expense the compensation cost related to these options as shown in the following table. However, if the market condition is achieved for any tranche of these options prior to the end of the derived service period, all remaining expense related to that tranche would be recognized in the period in which the market condition is achieved.
|
2016 |
2016 |
2017 |
||||||||||||||||||||||
|
Q1 |
Q2 |
Q3 |
Q4 |
Total |
Total |
|||||||||||||||||||
|
(in thousands) |
||||||||||||||||||||||||
|
Tranche 1 |
$ | - | $ | - | $ | - | $ | - | $ | - | $ | - | ||||||||||||
|
Tranche 2 |
6 | 7 | 5 | - | 18 | - | ||||||||||||||||||
|
Tranche 3 |
60 | 4 | 4 | 3 | 71 | 3 | ||||||||||||||||||
|
Tranche 4 |
47 | 46 | 42 | 2 | 137 | 5 | ||||||||||||||||||
|
Total expense |
$ | 113 | $ | 57 | $ | 51 | $ | 5 | $ | 226 | $ | 8 | ||||||||||||
Restricted Stock
In February 2013, the Company granted 16,000 shares of restricted stock to certain employees under the 2005 Plan. These awards were valued at the arithmetic mean of the high and low market price of the Company’s stock on the grant date, which was $21.695 per share, and vest ratably over a three year period beginning on the first anniversary of the grant date. The second third of unforfeited shares, or 2,333 shares, vested in February 2015 and the final third of unforfeited shares, or 2,000 shares, vested in February 2016. The Company expenses the cost of restricted stock granted over the vesting period of the shares based on the grant-date fair value of the award. The Company recognized expense of $4,000 and $13,000 for the three-month periods ended March 31, 2016 and 2015, respectively, related to shares of restricted stock granted.
ORCHIDS PAPER PRODUCTS COMPANY AND SUBSIDIARIES
NOTES TO UNAUDITED CONSOLIDATED INTERIM FINANCIAL STATEMENTS (continued)
Note 11 — Major Customers and Concentration of Credit Risk
The Company sells its paper products in the form of parent rolls and converted products. Revenues from converted product sales and parent roll sales in the three months ended March 31, 2016 and 2015 were:
|
Three Months Ended March 31, |
||||||||
|
2016 |
2015 |
|||||||
|
(in thousands) |
||||||||
|
Converted product net sales |
$ | 45,252 | $ | 37,415 | ||||
|
Parent roll net sales |
2,491 | - | ||||||
|
Net sales |
$ | 47,743 | $ | 37,415 | ||||
Credit risk for the Company in the three months ended March 31, 2016 and 2015 was concentrated in the following customers who each comprised more than 10% of the Company’s total net sales:
|
Three Months Ended March 31, |
||||||||
|
2016 |
2015 |
|||||||
|
Converted product customer 1 |
38 | % | 38 | % | ||||
|
Converted product customer 2 |
11 | % | 10 | % | ||||
|
Converted product customer 3 |
* | 10 | % | |||||
|
Converted product customer 4 |
12 | % | 16 | % | ||||
|
Total percent of net sales |
61 | % | 74 | % | ||||
*Customer did not account for more than 10% of sales during the period indicated
No additional customers accounted for more than 10% of sales during the three-month periods ended March 31, 2016 and 2015.
At March 31, 2016 and December 31, 2015, the significant customers accounted for the following amounts of the Company’s accounts receivable (in thousands):
|
March 31, |
December 31, |
|||||||||||||||
|
2016 |
2015 |
|||||||||||||||
|
Converted product customer 1 |
$ | 4,642 | 38 | % | $ | 3,434 | 32 | % | ||||||||
|
Converted product customer 2 |
891 | 7 | % | 931 | 9 | % | ||||||||||
|
Converted product customer 3 |
* | * | ||||||||||||||
|
Converted product customer 4 |
804 | 7 | % | 2,071 | 19 | % | ||||||||||
|
Total of accounts receivable |
$ | 6,337 | 52 | % | $ | 6,436 | 60 | % | ||||||||
*Customer did not account for more than 10% of sales during the period indicated
At March 31, 2016 and December 31, 2015, no additional customers accounted for more than 10% of the Company’s accounts receivable.
ORCHIDS PAPER PRODUCTS COMPANY AND SUBSIDIARIES
NOTES TO UNAUDITED CONSOLIDATED INTERIM FINANCIAL STATEMENTS (continued)
Note 12 — New Market Tax Credit
In December 2015, the Company received approximately $5.1 million in net proceeds from financing agreements related to capital expenditures at its Barnwell, South Carolina facility. This financing arrangement was structured with a third party financial institution (the “NMTC Investor”) associated with U.S. Bank, an investment fund, and two community development entities (the “CDEs”) majority owned by the investment fund. This transaction was designed to qualify under the federal New Market Tax Credit (“NMTC”) program, pursuant to Section 45D of the Internal Revenue Code of 1986, as amended. Through this transaction, the Company has secured low interest financing and the potential for future debt forgiveness related to the South Carolina facility. Upon closing of the NMTC transaction, the Company provided an aggregate of approximately $11.1 million, which was borrowed from U.S. Bank, to the investment fund, in the form of a loan receivable, with a term of 25 years, bearing an interest rate of 1.0% per annum. This $11.1 million in proceeds plus $5.1 million of net capital from the NMTC Investor were contributed to and used by the CDEs to make loans in the aggregate of $16.2 million to a subsidiary of the Company, Orchids Lessor SC, LLC (“Orchids Lessor”). These loans bear interest at a fixed rate of 1.275%. Orchids Lessor is using the loan proceeds to partially fund $18.0 million of the Company’s capital assets associated with the Barnwell facility. These capital assets will serve as collateral to the financing arrangement. This transaction also includes a put/call feature whereby, at the end of a seven-year compliance period, we may be obligated or entitled to repurchase the NMTC Investor’s interest in the investment fund. The value attributable to the put price is nominal. Consequently, if exercised, the put could result in the forgiveness of the NMTC Investor’s interest in the investment fund, and result in a net non-operating gain of up to $5.1 million. The call price will be valued at the net present value of the cash flows of the lease inherent in the transaction.
The NMTC Investor is subject to 100% recapture of the New Market Tax Credits it receives for a period of seven years as provided in the Internal Revenue Code and applicable U.S. Treasury regulations. The Company is required to be in compliance with various regulations and contractual provisions that apply to the New Market Tax Credit arrangement. Noncompliance with applicable requirements could result in the NMTC Investor’s projected tax benefits not being realized and, therefore, require the Company to indemnify the NMTC Investor for any loss or recapture of New Market Tax Credits related to the financing until such time as the recapture provisions have expired under the applicable statute of limitations. The Company does not anticipate any credit recapture will be required in connection with this financing arrangement.
At March 31, 2016 and December 31, 2015, the NMTC Investor’s interest of $5.1 million is recorded in other long-term liabilities on the consolidated balance sheet, while the $11.1 million borrowed from U.S. Bank to loan to the investment fund is recorded in long-term debt, net of the current portion. Unspent proceeds from the arrangement of approximately $7.2 million and $12.0 million at March 31, 2016 and December 31, 2015, respectively, are obligated for funding the specified capital assets at the Barnwell facility and are included in restricted cash.
Note 13 – ODFA Pooled Financing
In September 2014, the Company entered into an agreement with the Oklahoma Development Finance Authority (“ODFA”) whereby the ODFA agreed to provide the Company up to $3.5 million to fund a portion of the cost of a new paper production line before September 1, 2020. The agreement provides for the Oklahoma state withholding payroll taxes withheld by the Company from its employees to be placed into the Community Economic Development Pooled Finance Revolving Fund – Orchids Paper Products (“Revolving Fund”). Each year on September 1, beginning in 2015 and ending in 2020, the ODFA will return these state withholding taxes in the Revolving Fund to the Company, up to an amount totaling $3.5 million. These amounts are recognized as a note receivable in other current assets in the consolidated balance sheet and in other income in the consolidated statements of income as they are withheld from employees.
As of March 31, 2016 and December 31, 2015, the Company had a note receivable of $525,000 and $328,000, respectively, related to amounts due under the ODFA pooled financing agreement. The Company recognized $197,000 and $185,000 of other income in the consolidated statement of income for the three-month periods ended March 31, 2016 and 2015, respectively, related to this agreement.
ORCHIDS PAPER PRODUCTS COMPANY AND SUBSIDIARIES
NOTES TO UNAUDITED CONSOLIDATED INTERIM FINANCIAL STATEMENTS (continued)
Note 14 — New and Recently Adopted Accounting Pronouncements
In April 2015, the FASB issued Accounting Standards Update 2015-03, “Interest – Imputation of Interest: Simplifying the Presentation of Debt Issuance Costs” (“ASU 2015-03”). ASU 2015-03 requires that debt issuance costs related to a recognized debt liability be presented in the balance sheet as a direct deduction from the carrying amount of that debt liability, consistent with debt discounts. In August 2015, the FASB issued Accounting Standards Update 2015-15, “Interest – Imputation of Interest: Presentation and Subsequent Measurement of Debt Issuance Costs Associated with Line-of-Credit Arrangements” (“ASU 2015-15). ASU 2015-15 states that since ASU 2015-03 does not address presentation or subsequent measurement of debt issuance costs related to line-of-credit arrangements, the SEC staff will not object to an entity deferring and presenting debt issuance costs as an asset and subsequently amortizing the deferred debt issuance costs ratably over the term of the line-of-credit arrangement, regardless of whether there are any outstanding borrowings on the line-of-credit arrangement. ASU 2015-03 became effective for the Company on January 1, 2016. As such, we reclassified $1.4 million and $1.3 million of unamortized debt issuance costs, including costs associated with our revolving lines of credit, as of March 31, 2016 and December 31, 2015, respectively, to offset long-term debt in the consolidated balance sheets. Adoption of ASU 2015-03 and ASU 2015-15 did not affect our consolidated statements of income.
In April 2015, the FASB issued Accounting Standards Update 2015-05, “Intangibles – Goodwill and Other – Internal-Use Software – Customer’s Accounting for Fees Paid in a Cloud Computing Arrangement” (“ASU 2015-05”). ASU 2015-05 provides guidance to customers about whether a cloud computing arrangement includes a software license. If a cloud computing arrangement includes a software license, then the customer should account for the software license element of the arrangement consistent with the acquisition of other software licenses. If a cloud computing arrangement does not include a software license, the customer should account for the arrangement as a service contract. The guidance does not change the accounting for a customer’s service contracts. ASU 2015-05 became effective for the Company on January 1, 2016. Adoption of ASU 2015-05 did not have a material effect on our consolidated financial statements.
In November 2015, the FASB issued Accounting Standards Update 2015-17, “Income Taxes: Balance Sheet Classification of Deferred Taxes” (“ASU 2015-17”). ASU 2015-17 requires that deferred tax liabilities and assets be classified as noncurrent in a classified statement of financial position. ASU 2015-17 is effective for public companies for annual and interim periods beginning after December 15, 2016. During the first quarter of 2016, we elected to early adopt ASU 2015-17 on a retrospective basis. As such, we reclassified $1.3 million of current deferred tax assets to noncurrent (netted within noncurrent liabilities) on the consolidated balance sheets as of March 31, 2016 and December 31, 2015. The adoption of ASU 2015-17 did not affect our consolidated statements of income.
In May 2014, the FASB issued Accounting Standards Update 2014-09, “Revenue from Contracts with Customers” (“ASU 2014-09”). ASU 2014-09 clarifies the principles for recognizing revenue and develops a common revenue standard under U.S. GAAP under which an entity should recognize revenue to depict the transfer of promised goods or services to customers in an amount that reflects the consideration to which the entity expects to be entitled in exchange for those goods or services. Due to the issuance of Accounting Standards Update 2015-14, “Revenue from Contracts with Customers – Deferral of the Effective Date” (“ASU 2015-14), in July 2015, the effective date of ASU 2014-09 was deferred for one year and becomes effective for the Company for interim and annual periods beginning on or after December 15, 2017. In March 2016, the FASB issued Accounting Standards Update 2016-08, “Revenue from Contracts with Customers: Principal versus Agent Considerations” (“ASU 2016-08”). ASU 2016-08 clarifies implementation guidance on principal versus agent considerations in ASU 2014-09. Management is currently assessing the impact ASU 2014-09 and ASU 2016-08 will have on the Company, but it is not expected to have a material effect on the Company’s financial position, results of operations or cash flows.
In July 2015, the FASB issued Accounting Standards Update 2015-11, “Inventory – Simplifying the Measurement of Inventory” (“ASU 2015-11”). ASU 2015-11 requires inventory measured using all methods other than the last-in, first-out (LIFO) or retail methods to be measured at the lower of cost or net realizable value. Net realizable value is defined as the estimated selling price in the ordinary course of business less reasonably predictable costs of completion, disposal and transportation. ASU 2015-11 is effective for public companies for annual and interim periods beginning after December 15, 2016. Management is currently assessing the impact ASU 2015-11 will have, if any, on the Company’s financial position, results of operations and cash flows.
ORCHIDS PAPER PRODUCTS COMPANY AND SUBSIDIARIES
NOTES TO UNAUDITED CONSOLIDATED INTERIM FINANCIAL STATEMENTS (continued)
Note 14 — New and Recently Adopted Accounting Pronouncements (continued)
In January 2016, the FASB issued Accounting Standards Update 2016-01, “Financial Instruments – Overall: Recognition and Measurement of Financial Assets and Financial Liabilities” (“ASU 2016-01”). ASU 2016-01 addresses certain aspects of recognition, measurement, presentation and disclosure of financial instruments, specifically equity investments and financial instruments measured at amortized cost. ASU 2016-01 is effective for public companies for annual and interim periods beginning after December 15, 2017. Management is currently assessing the impact ASU 2016-01 will have, if any, on the Company’s financial position, results of operations and cash flows.
In February 2016, the FASB issued Accounting Standards Update 2016-02, “Leases” (“ASU 2016-02”). ASU 2016-02 requires lessees to recognize lease assets and lease liabilities on the balance sheet but did not make significant changes to the effects of lessee accounting on the income statement or statement of cash flows. ASU 2016-02 is effective for public companies for annual and interim periods beginning after December 15, 2018. Management is currently assessing the impact ASU 2016-02 will have on the Company’s financial position.
In March 2016, the FASB issued Accounting Standards Update 2016-09, “Compensation – Stock Compensation: Improvements to Employee Share-Based Payment Accounting” (“ASU 2016-09”). ASU 2016-09 requires, among other things, that excess tax benefits and tax deficiencies be recognized as income tax expense or benefit in the income statement rather than as additional paid-in capital, changes the classification of excess tax benefits from a financing activity to an operating activity in the statement of cash flows, and allows forfeitures to be accounted for when they occur rather than estimated. ASU 2016-09 is effective for public companies for interim and annual periods beginning after December 15, 2016. Management is currently assessing the impact ASU 2016-09 will have on the Company’s financial position, results of operations and cash flows.
Note 15 — Subsequent Event
On April 20, 2016, the Board of Directors authorized a quarterly cash dividend of $0.35 per outstanding share of the Company’s common stock. The Company expects to pay this dividend on May 16, 2016 to stockholders of record at the close of business on May 2, 2016.
ITEM 2. Management’s Discussion and Analysis of Financial Condition and Results of Operations
Forward-Looking Information
The following Management’s Discussion and Analysis of Financial Condition and Results of Operations contains forward-looking statements. These statements relate to, among other things:
|
|
● |
our business strategy; |
|
|
● |
the market opportunity for our products, including expected demand for our products; |
|
|
● |
our estimates regarding our capital requirements; and |
|
|
● |
any of our other plans, objectives, and intentions contained in this report that are not historical facts. |
These statements relate to future events or future financial performance, and involve known and unknown risks, uncertainties and other factors that may cause our actual results, levels of activity, performance or achievements to be materially different from any future results, levels of activity, performance or achievements expressed or implied by such forward-looking statements. In some cases, you can identify forward-looking statements by terminology such as “may,” “will,” “should,” “could,” “would,” “target,” “expects,” “plans,” “intends,” “anticipates,” “believes,” “estimates,” “predicts,” “potential” or “continue” or the negative of such terms or other comparable terminology, or by discussion of strategy that may involve risks and uncertainties. Although we believe that the expectations reflected in the forward-looking statements are reasonable, we cannot guarantee future results, levels of activity, performance or achievements. The forward-looking statements contained in this Form 10-Q reflect our views and assumptions only as of the date hereof. You should not place undue reliance on forward-looking statements. We caution you that these forward-looking statements are only predictions, which are subject to risks and uncertainties that could cause actual results to differ materially from those in the forward-looking statements.
Some factors that could materially affect our actual results are detailed under the caption “Risk Factors” in our Annual Report on Form 10-K for the fiscal year ended December 31, 2015, as filed with the SEC on March 7, 2016, and include but are not limited to the following items:
|
|
● |
failure to complete the construction of our South Carolina facility on schedule or at all; |
|
|
● |
intense competition in our markets and aggressive pricing by our competitors could force us to decrease our prices and reduce our profitability; |
|
|
● |
a substantial percentage of our converted product revenues are attributable to a small number of customers who may decrease or cease purchases at any time; |
|
|
● |
disruption in our supply or increase in the cost of fiber; |
|
|
● |
Fabrica’s failure to execute under the Supply Agreement; |
|
|
● |
the additional indebtedness incurred to finance the construction of our South Carolina facility; |
|
|
● |
new competitors entering the market and increased competition in our region; |
|
|
● |
changes in our retail trade customers’ policies and increased dependence on key retailers in developed markets; |
|
|
● |
excess supply in the market may reduce our prices; |
|
|
● |
the availability of, and prices for, energy; |
|
|
● |
failure to purchase the contracted quantity of natural gas may result in financial exposure; |
|
|
● |
our exposure to variable interest rates; |
|
|
● |
the loss of key personnel; |
|
|
● |
labor interruption; |
|
|
● |
natural disaster or other disruption to our facilities; |
|
|
● |
ability to finance the capital requirements of our business; and |
|
|
● |
other factors discussed from time to time in our filings with the SEC. |
If any of these risks or uncertainties materialize, or if our underlying assumptions prove to be incorrect, actual results may vary significantly from what we projected. Any forward-looking statement you read in the following Management’s Discussion and Analysis of Financial Condition and Results of Operations reflects our current views with respect to future events and is subject to the risks listed above and other risks, uncertainties, and assumptions relating to our operations, results of operations, growth strategy, and liquidity. We assume no obligation to publicly update or revise these forward-looking statements for any reason, whether as a result of new information, future events, or otherwise.
Overview of the Business
We are a customer focused, national supplier of high quality consumer tissue products. We produce bulk tissue paper, known as parent rolls, and convert parent rolls into finished products, including paper towels, bathroom tissue and paper napkins. We sell any parent rolls not required by our converting operation to other converters. Our integrated manufacturing facilities have flexible production capabilities, which allow us to produce high quality tissue products with short production times across all quality tiers for customers in our target regions. We predominately sell our products under private labels to our core customer base in the “at home” market, which consists primarily of dollar stores, discount retailers and grocery stores that offer limited alternatives across a wide range of products. Our focus to date has been the dollar stores (which are also referred to as discount retailers) and the broader discount retail market because of their overall market growth, consistent order patterns and low number of stock keeping units (“SKUs”). The “at home” tissue market consists of several quality levels, including a value tier, premium tier and ultra-premium tier. To a lesser extent, we service customers in the “away from home” market. Our core customer base in the “away from home” market consists of companies in the janitorial market and food service market. Most of the products we sell in the “away from home” market are included in the value tier.
Our strategy is to capitalize on positive market trends by leveraging our industry experience, customer relationships and low cost, strategic operating footprint to drive growth and profitability for the business. Since our inception, we have strategically expanded capacity in both paper manufacturing and finished product converting to meet market demand and customers’ quality requirements. Our facilities have been designed to have the flexibility to produce and convert parent rolls across different product tiers and to use both virgin and recycled fibers to maximize quality and to control costs. We own an integrated facility in Pryor, Oklahoma which has the capacity to supply 74,000 tons of parent rolls per year primarily to service the central United States. This brings our paper manufacturing capacity at this facility in line with our paper production capacity in Oklahoma. Since 2006, we have consistently invested to modernize the paper making and converting equipment at this location and provide the flexibility discussed above. Furthermore, over the past several years, we have invested approximately $39 million at this facility for a new paper machine and a new converting line. The new paper machine commenced operations in March 2015. The new paper machine improved our margins by reducing our manufacturing cost and has provided us additional parent roll capacity. Our new converting line commenced operations in June 2015 and has increased our capacity to 83,000 tons of converting capacity in our Pryor facility. In June 2014, we expanded our geographic presence to service the United States West Coast through a strategic transaction with Fabrica de Papel San Francisco, S.A. de C.V. (“Fabrica”), one of the largest tissue manufacturers by capacity in Mexico. The Fabrica Transaction provided us access to its U.S. customers, which we believe will allow us to further penetrate the region, and the supply agreement (“Supply Agreement”) we entered into with Fabrica has provided access to up to 19,800 tons of product each year (up to 27,500 tons in the first two years of the agreement).
As part of our strategy to be a national supplier of high quality consumer tissue products, we are also constructing a world-class integrated tissue operation in Barnwell, South Carolina. We believe that this new facility will allow us to better serve our existing customers in the Southeast United States, while also enabling us to penetrate new customers in this region. The facility is designed to provide highly flexible, cost competitive production across all quality tiers with paper making capacity of between 35,000 and 40,000 tons per year and converting capacity of between 30,000 and 32,000 tons per year. The first converting line became operational late in the first quarter of 2016 and the second converting line is expected to be operational by the end of the second quarter of 2016. The paper machine will utilize a highly versatile process capable of producing ultra-premium tier products, and is expected to be operational in the first quarter of 2017. We estimate the total costs of the project to be approximately $136 million, which is being financed through a combination of bank debt, proceeds from our 2015 follow-on stock offering, proceeds from our New Market Tax Credit transaction and cash from operations.
Our strategy is to sell all of the parent rolls we manufacture as converted products, which generally carry higher margins than non-converted parent rolls. However, any parent rolls we can produce in excess of converting production requirements are sold into the market. We adjust our paper making production based on our internal converting needs for parent rolls in our Oklahoma and South Carolina facilities and the open market demand for parent rolls. The capacity obtained under the previously described Fabrica Transaction will be sold in converted product form and we do not plan to sell any excess capacity arising from this transaction in parent roll form. Parent rolls are a commodity product and thus are subject to market pricing. We plan to continue to sell any excess parent roll capacity on the open market as long as market pricing is profitable. When converting production requirements exceed paper mill capacity, we will purchase parent rolls in the open market to meet those converting requirements.
We supply both large national and regional customers, with a focus on high growth regions of the United States. We focus our sales efforts on areas within approximately 500 miles of either our manufacturing facility in Oklahoma or Fabrica’s manufacturing facility in Mexicali, Mexico, as we believe this radius maximizes our freight cost advantage. Because we are one of the few integrated tissue paper manufacturers in the areas around both our Oklahoma facility and Fabrica’s Mexicali facilities, we believe we typically have lower freight costs to our customers’ distribution centers located in our target regions. Our target region around our Oklahoma facility includes Texas, Oklahoma, Kansas, Missouri and Arkansas. The Fabrica Transaction has allowed us to more effectively service customers that are located on the West Coast by directly shipping them products that are produced in Mexico under the Supply Agreement. As a result, we have expanded our target region to include California, Nevada, Arizona, New Mexico and Utah. Our manufacturing facility in Barnwell, South Carolina is intended to help us meet the growing demand in the Southeast United States. Demand for tissue in the “at home” tissue market has historically been closely correlated to population growth and, as such, performs well in a variety of economic conditions. Our expanded target region has typically experienced strong population growth for the past fourteen years relative to the national average, and these trends are expected to continue.
Our products are sold primarily under our customers’ private labels and, to a lesser extent, under our brand names such as Colortex®, My Size®, Velvet®, Big Mopper®, Linen Soft®, Soft & Fluffy®, and Tackle®. The Fabrica Transaction gave us the exclusive right to sell products under Fabrica’s brand names into the United States, including under the names Virtue®, Truly Green®, Golden Gate Paper® and Big Quality®. All of our converted product net sales are derived through truck load purchase orders from our customers. Parent roll net sales are derived from purchase orders that generally cover a one-month time period. We do not have supply contracts with any of our customers, which is normal practice within our industry. Because our products are a daily consumable item, the order stream from our customer base is fairly consistent with limited seasonal fluctuations. However, we typically experience some mild seasonal softness in the first and fourth quarters of each year, primarily due to the effects of winter weather on consumers’ buying habits and occasional effects of holidays on shipping schedules. Changes in the national economy, in general, do not materially affect the market for our converted products due to their non-discretionary nature and high degree of household penetration.
Our profitability depends on several key factors, including but not limited to:
|
|
● |
the volume of converted product sales; |
|
|
● |
the cost of fiber used in producing paper; |
|
|
● |
the market price of our products; |
|
|
● |
the efficiency of operations in both our paper mill and converting facility; and |
|
|
● |
the cost of energy. |
The private label market of the tissue industry is highly competitive, and many discount retail customers are extremely price sensitive. As a result, it is difficult to affect price increases. We expect these competitive conditions to continue.
Our Strategy
Our goal is to be a customer focused national supplier of high quality consumer tissue products. We believe we will achieve this goal by:
|
|
● |
strengthening and expanding our customer base through cooperative and innovative product development and superior customer service; |
|
|
● |
focusing on higher growth geographic regions and private label channels; |
|
|
● |
maintaining flexible, low cost integrated facilities able to produce a broad product spectrum; |
|
|
● |
expanding our manufacturing footprint via the Fabrica Transaction and our expansion in South Carolina; and |
|
|
● |
employing a disciplined capital strategy by focusing on growing free cash flow and targeting high return capital projects. |
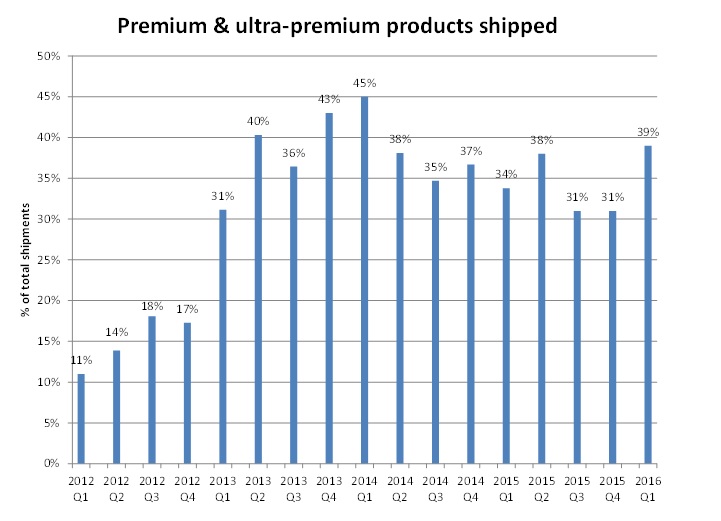
Part of our strategy is to increase our volume of premium and ultra-premium tier products shipped to customers, as these products typically have a higher gross margin than value tier products. The following graph shows shipments of our premium tier and ultra-premium tier products as a percentage of total cases shipped. Shipments of premium tier and ultra-premium tier products as a percentage of total cases shipped decreased following the Fabrica Transaction in June 2014 as a majority of the products shipped under the Supply Agreement are considered value tier products.
Comparative Three-Month Periods Ended March 31, 2016 and 2015
Net Sales
|
Three Months Ended March 31, |
||||||||
|
2016 |
2015 |
|||||||
|
(in thousands, except tons) |
||||||||
|
Converted product net sales |
$ | 45,252 | $ | 37,415 | ||||
|
Parent roll net sales |
2,491 | - | ||||||
|
Net sales |
$ | 47,743 | $ | 37,415 | ||||
|
Converted product tons shipped |
23,408 | 18,837 | ||||||
|
Parent roll tons shipped |
2,791 | - | ||||||
|
Total tons shipped |
26,199 | 18,837 | ||||||
Net sales in the quarter ended March 31, 2016 increased $10.3 million, or 28%, from $37.4 million in 2015 to $47.7 million in 2016. Net sales figures represent the gross selling price, including freight, less discounts and pricing allowances. The increase in net sales is due to a $7.8 million increase in the sales of converted products and a $2.5 million increase in the net sales of parent rolls.
Net sales of converted product increased $7.8 million, or 21%, from $37.4 million in 2015 to $45.3 million in 2016. The increase in converted product net sales is primarily due to a 24% increase in tonnage shipped, which was partially offset by a 3% decrease in net selling price per ton. Converted product tons shipped increased due to higher shipment volumes from both our Pryor location and under the Supply Agreement. Net selling price per ton decreased due to the mix of products sold.
Net sales of parent rolls were $2.5 million in 2016. There were no parent rolls sold in 2015, as we demolished two old paper machines in the fourth quarter of 2014 to build a new paper machine, which did not start up until late in the first quarter of 2015. This resulted in having no excess parent rolls available for sale in 2015.
Cost of Sales
|
Three Months Ended March 31, |
||||||||
|
2016 |
2015 |
|||||||
|
(in thousands, except gross profit margin %) |
||||||||
|
Cost of goods sold |
$ | 33,725 | $ | 30,541 | ||||
|
Depreciation |
2,637 | 2,088 | ||||||
|
Cost of sales |
$ | 36,362 | $ | 32,629 | ||||
|
Gross profit |
$ | 11,381 | $ | 4,786 | ||||
|
Gross profit margin % |
23.8 | % | 12.8 | % | ||||
The major components of cost of sales are the cost of internally produced paper, raw materials, direct labor and benefits, freight costs of products shipped to customers, insurance, repairs and maintenance, energy, utilities, depreciation and the cost of converted products purchased under the Supply Agreement with Fabrica.
Cost of sales increased $3.7 million, or 11%, to $36.4 million, compared to $32.6 million in the same period of 2015, due primarily to increased sales and higher depreciation expense. As a percentage of net sales, cost of sales decreased to 76.2% in the 2016 quarter from 87.2% in the 2015 quarter.
Gross Profit
Gross profit in the quarter ended March 31, 2016 increased $6.6 million, or 138%, to $11.4 million compared to $4.8 million in the same period last year. Gross profit as a percentage of net sales in the 2016 quarter was 23.8% compared to 12.8% in the 2015 quarter. The gross profit increase as a percent of net sales was primarily the result of lower unit production costs in our Oklahoma paper making and converting production operations, higher gross margins under the Supply Agreement and lower fiber costs. Per unit paper production and converting production costs in Oklahoma decreased in 2016 primarily due to a 53% and a 24% increase in production in our paper mill and our converting operation, respectively. These improvements in paper production costs are primarily due to the previously discussed paper machine project. Improvements in converting production costs are primarily due to increased operating rates across all production lines and the addition of a new converting line in the second quarter of 2015, which resulted in increased absorption of fixed and semi-variable costs. A strong U.S. dollar exchange rate with the Mexican peso, coupled with SKU optimization and price increases in the “away from home” business improved the margins under the Supply Agreement in the three months ended March 31, 2016 compared with the same quarter of 2015. Furthermore, average fiber prices across our fiber basket were lower in the first quarter of 2016 compared to the same period in 2015, resulting in an approximate $800,000 increase in gross profit.
Selling, General and Administrative Expenses
|
Three Months Ended March 31, |
||||||||
|
2016 |
2015 |
|||||||
| (in thousands, except SG&A as a % of net sales) | ||||||||
|
Commission expense |
$ | 353 | $ | 329 | ||||
|
Other S,G&A expenses |
2,369 | 2,168 | ||||||
|
Selling, General & Adm exp |
$ | 2,722 | $ | 2,497 | ||||
|
SG&A as a % of net sales |
5.7 | % | 6.7 | % | ||||
Selling, general and administrative expenses include salaries, commissions to brokers and other miscellaneous expenses. Selling, general and administrative expenses increased $225,000, or 9%, in the quarter ended March 31, 2016 as compared to the same period in 2015 primarily due to higher professional fees, higher artwork and design fees, and increased commissions due to higher sales volumes. As a percentage of net sales, selling, general and administrative expenses decreased to 5.7% in the first quarter of 2016 compared to 6.7% in the same period of 2015.
Amortization of Intangibles
The Company recognized $377,000 of amortization expense related to the intangible assets acquired in the Fabrica Transaction during the quarters ended March 31, 2016 and 2015, respectively.
Operating Income
As a result of the foregoing factors, operating income for the quarter ended March 31, 2016, was $8.3 million compared to operating income of $1.9 million for the same period of 2015.
Interest Expense and Other Income
|
Three Months Ended March 31, |
||||||||
|
2016 |
2015 |
|||||||
|
(in thousands) |
||||||||
|
Interest expense |
$ | 263 | $ | 214 | ||||
|
Other (income) expense, net |
$ | (201 | ) | $ | (186 | ) | ||
|
Income before income taxes |
$ | 8,220 | $ | 1,884 | ||||
Interest expense includes interest on all debt and amortization of deferred debt issuance costs. Interest expense for the first quarter of 2016 totaled $263,000 compared to interest expense of $214,000 in the same period in 2015. Interest expense for 2016 excludes $134,000 of interest capitalized on significant projects during the quarter. The higher level of total interest in 2016 resulted from higher debt balances due primarily to additional debt incurred in conjunction with additional borrowings to finance capital expenditures.
Other (income) expense for the three months ended March 31, 2016 and 2015 includes $197,000 and $185,000, respectively, of income related to the Company’s pooled financing agreement with the Oklahoma Development Financing Authority (ODFA).
Income Before Income Taxes
As a result of the foregoing factors, income before income taxes increased $6.3 million to $8.2 million in the quarter ended March 31, 2016, compared to $1.9 million in the same period in 2015.
Income Tax Provision
As of March 31, 2016, our annual estimated effective tax rate for the full year is estimated to be 34.2%. The annual estimated effective tax rate for 2016 differs from the statutory rate primarily due to U.S. manufacturing tax credits and deductions and foreign income taxes. The actual effective tax rate for the quarter ended March 31, 2015 was 34.4%. The annual estimated effective tax rate for 2015 differs from the statutory rate due primarily to U. S. manufacturing tax credits and deductions and foreign income taxes.
Liquidity and Capital Resources
Liquidity refers to the liquid financial assets available to fund our business operations and pay for near-term obligations. These liquid financial assets consist of cash as well as unused borrowing capacity under our credit facility. Our cash requirements have historically been satisfied through a combination of cash flows from operations and debt and equity financings. We expect this trend to continue.
Currently, the most significant event effecting liquidity and capital needs is the construction of our integrated converting facility in Barnwell, South Carolina, which has a total estimated cost of $136 million. In April 2015, we issued and sold 1,500,000 shares at $23.00 per share in an underwritten public offering resulting in aggregate net proceeds to us of approximately $32.2 million, after giving effect to the underwriting discount and estimated expenses. We have been using and intend to continue to use the net proceeds from the offering, together with new bank financing and cash on hand, to construct the Barnwell facility, consisting of a new facility to house a new paper machine and converting equipment to convert the parent rolls into finished product and to provide warehouse space for finished product and raw materials. In June 2015, we entered into an agreement with US Bank National Association (“US Bank”) which: (i) combined our existing $20 million revolving line of credit designated for the purchase and construction of a paper machine and converting line in Pryor, Oklahoma and $27.3 million currently outstanding under our existing term loan into a $47.3 million term loan due in 2020; (ii) increased our delayed draw term loan facility from $40 million to $115 million; (iii) extended the maturity of the delayed draw facility from August 2015 to June 2020; and (iv) added a $50 million accordion feature. Proceeds from the delayed draw term loan must be used solely to finance the acquisition and construction of buildings and equipment at our Barnwell facility. Advances under the facility bear interest at variable rates. The term loan is payable in quarterly installments of $675,000 through June 2016 and $1 million per quarter thereafter, while borrowings against the delayed draw term loan facility are payable in quarterly installments of 1.5% of the June 30, 2017 outstanding balance beginning in September 2017.
In December 2015, we entered into a NMTC transaction, which provided $16.2 million of loan proceeds, which will be used to finance capital expenditures associated with our South Carolina facility. This transaction allowed the Company to fix the interest on $11.1 million of its long-term debt for seven years and includes the potential for future debt forgiveness of approximately $5.1 million in seven years. In connection with this transaction, the maximum borrowing capacity under our delayed draw facility was reduced from $115 million to $99.6 million.
During the three months ended March 31 2016, cash increased $3.7 million, to $8.0 million at March 31, 2016, compared to $4.4 million at December 31, 2015. During the 2016 period, we incurred $25.6 million of capital expenditures, removed restrictions on $4.8 million of cash, received $1.9 million of proceeds from economic incentives related to the construction of our South Carolina facility, received $18.0 million of borrowings under our revolving credit lines (including our delayed draw loan), and paid $3.6 million in dividends to stockholders.
As of March 31, 2016, total debt outstanding was $92.9 million. Cash as of March 31, 2016, totaled $8.0 million, resulting in a net debt level of $84.9 million. This compares to $75.6 million in total debt and cash of $4.4 million as of December 31, 2015, resulting in a net debt level of $71.2 million. We had $10.0 million and $26.5 million outstanding under our $25.0 million revolving line of credit and our $99.6 million delayed draw term loan, respectively, as of March 31, 2016.
The following table summarizes key cash flow information for the three-month periods ended March 31, 2016 and 2015:
|
Three Months Ended March 31, |
||||||||
|
2016 |
2015 |
|||||||
|
(in thousands) |
||||||||
|
Cash flows provided by (used in): |
||||||||
|
Operating activities |
$ | 8,863 | $ | 5,551 | ||||
|
Investing activities |
$ | (20,785 | ) | $ | (10,943 | ) | ||
|
Financing activities |
$ | 15,600 | $ | 7,645 | ||||
Cash flows provided by operating activities was $8.9 million in the three-month period ended March 31, 2016, which primarily resulted from earnings before non-cash charges, including depreciation and amortization, and an increase in accrued liabilities, which were partially offset by increases in accounts receivable and a decrease in accounts payable. The increase in accrued liabilities is primarily due to increased income taxes payable due to higher taxable income and increased accrued sales promotions due to increased sales. The increase in accounts receivable is primarily related to the timing of sales and related cash receipts. The decrease in accounts payable is primarily related to the timing of purchases and cash payments.
Cash flows used in investing activities in the first three months of 2016 included $25.6 million of expenditures on capital projects during the period, partially offset by the release of $4.8 million of restricted cash to finance capital expenditures associated with our South Carolina facility.
Cash flows provided by financing activities was $15.6 million in the three-month period ended March 31, 2016, primarily due to $18.0 million of borrowings under our credit facility and $1.9 million of proceeds from economic incentives associated with our South Carolina facility, which were partially offset by $3.6 million of cash dividends paid to stockholders. While we expect to continue to declare quarterly dividends, the payment of future dividends is at the discretion of the Board of Directors and the timing and amount of any future dividends will depend upon many factors, including our financial condition, earnings, cash requirements of our business, legal requirements, regulatory constraints, industry practice and other factors that the Board deems relevant. Our credit agreement contains an indirect restriction on the amount of cash dividends we pay in that the amount of dividends paid is included in the calculation of our fixed charge coverage ratio.
Cash flows provided by operating activities was $5.6 million in the three-month period ended March 31, 2015, which primarily resulted from earnings before non-cash charges, a decrease in accounts receivable, and increases in accounts payable and accrued liabilities, which were partially offset by an increase in inventories. The decrease in accounts receivable and increases in accounts payable and accrued liabilities are primarily related to the timing of cash receipts, purchases and cash payments, while the increase in inventories is primarily due to anticipated sales volumes for the remainder of 2015.
Cash flows used in investing activities was $10.9 million in the first three months of 2015 as a result of $10.9 million in expenditures on capital projects.
Cash flows provided by financing activities was $7.6 million in the three-month period ended March 31, 2015, primarily as a result of $13.1 million of borrowings under our line of credit, which was partially offset by a $1.7 million decrease in bank overdrafts, $675,000 of debt payments, and $3.1 million of cash dividends paid to stockholders.
Critical Accounting Policies and Estimates
The preparation of our financial statements and related disclosures in conformity with accounting principles generally accepted in the United States of America requires management to make estimates and judgments that affect our reported amounts of assets and liabilities, revenues and expenses, and related disclosures of contingent assets and liabilities. On an on-going basis, we evaluate our estimates and assumptions based upon historical experience and various other factors and circumstances. Management believes that our estimates and assumptions are reasonable under the circumstances; however, actual results may vary from these estimates and assumptions under different future circumstances. We have identified the following critical accounting policies that affect the more significant judgments and estimates used in the preparation of our financial statements:
Accounts Receivable. Accounts receivable consist of amounts due to us from normal business activities. Our management must make estimates of accounts receivable that will not be collected. We perform ongoing credit evaluations of our customers and adjust credit limits based upon payment history and the customer’s creditworthiness as determined by our review of their current credit information. We continuously monitor collections and payments from our customers and maintain a provision for estimated losses based on historical experience and specific customer collection issues that we have identified. Trade receivables are written-off when all reasonable collection efforts have been exhausted, including, but not limited to, external third-party collection efforts and litigation. While such credit losses have historically been within management’s expectations and the provisions established, there can be no assurance that we will continue to experience the same credit loss rates as in the past. During the first quarter of 2016 and 2015, no accounts receivable were written off against the allowance for doubtful accounts, nor was the provision for bad debts increased or decreased based on sales levels, historical experience and an evaluation of the quality of existing accounts receivable, resulting in no change to the allowance.
Inventory. Our inventory consists of converted finished goods, bulk paper rolls and raw materials and is stated at the lower of cost or market based on standard cost, specific identification, or FIFO (first-in, first-out). Standard costs approximate actual costs on a FIFO basis. Material, labor and factory overhead necessary to produce the inventories are included in the standard cost. Our management regularly reviews inventory quantities on hand and records a provision for excess and obsolete inventory based on the age of the inventory and forecasts of product demand. A significant decrease in demand could result in an increase in the amount of excess inventory quantities on hand. During the first three months of 2016, the inventory allowance was increased $24,000 based on a specific review of estimated slow moving or obsolete inventory items. No amounts were written off against the allowance, resulting in a net increase in the allowance of $24,000. During the first three months of 2015, the inventory allowance was increased $200,000 based on a specific review of estimated slow moving or obsolete inventory items and was decreased $106,000 due to actual write-offs of obsolete inventory items, resulting in a net increase in the allowance of $94,000.
Property, Plant and Equipment. Significant capital expenditures are required to establish and maintain paper mills and converting facilities. Our property, plant and equipment consists of land, buildings and improvements, machinery and equipment, vehicles, parts and spares and construction-in-process, which are stated at cost, net of accumulated depreciation. Depreciation of property, plant and equipment is calculated using the straight-line method over the estimated useful lives of the assets. Our management regularly reviews estimated useful lives to determine whether any changes are necessary to reflect the related assets’ actual productive lives. The lives of our property, plant and equipment currently range from 2.5 to 40 years.
Stock-based Compensation. U.S. GAAP requires equity-classified, share-based payments to employees, including grants of employee stock options, to be valued at fair value on the date of grant and to be expensed over the applicable vesting period. We recognize this expense on a straight-line basis over the options’ expected terms. We issue stock options that vest over a specified period (time-based vesting) and stock options that vest when the price of the Company’s common stock reaches a certain price (market-based vesting). We also issue restricted stock.
We granted options to purchase 5,000 shares of our common stock in the first three months of 2016. There were no options granted in the first three months of 2015. We recorded stock-based compensation expense of $145,000 and $255,000 during the three-month periods ended March 31, 2016 and 2015, respectively, in connection with the option grants. In February 2013, we granted 16,000 shares of restricted stock. We recorded stock-based compensation expense of $4,000 and $13,000 during the three–month periods ended March 31, 2016 and 2015, respectively, in connection with the restricted stock grants. Grants of restricted stock are valued using the closing market price of our common stock on the date of grant.
We estimate the grant date fair value of time-based stock option awards using the Black-Scholes option valuation model, which requires assumptions involving an estimate of the fair value of the underlying common stock on the date of grant, the expected term of the options, volatility, discount rate and dividend yield. Separate values were determined for options having exercise prices ranging from $5.18 to $30.09. For options valued using the Black-Scholes option valuation model, we calculated expected option terms based on the “simplified” method for “plain vanilla” options, due to the Company’s limited exercise information. The “simplified method” calculates the expected term as the average of the vesting term and the original contractual term of the options. We calculated volatility using the daily volatilities of our common stock since our Initial Public Offering (“IPO”), while the discount rate was estimated using the interest rate for a treasury note with the same contractual term as the options granted. Dividend yield is estimated at our current dividend rate, with adjustments for any known future changes in the rate.
We have engaged a valuation specialist to estimate the grant date fair value of market-based stock option awards. Separate values were determined for options having exercises prices ranging from $25.24 to $31.125. The specialist utilizes a Monte Carlo valuation method to estimate the grant date fair value of the options granted in order to simulate a range of our possible future stock prices. Significant assumptions to the Monte Carlo method include the expected life of the option, volatility and dividend yield. The expected life of the option is based on the average of the service period and the contractual term of the option, using the “simplified” method for “plain vanilla” options. Volatility is calculated based on a mix of historical and implied volatility during the expected life of the options. Historical volatility is considered since our IPO and implied volatility is based on the publicly traded options of a three company peer group within the paper industry. Dividend yield is estimated based on our average historical dividend yield and our current dividend yield as of the grant date. The Monte Carlo analysis is performed under a risk-neutral premise, under which price drift is modeled using treasury note yields matching the expected life of the options.
Under U.S. GAAP, we expense the compensation cost related to the marked-based stock option awards on a straight-line basis over the derived service periods of the options as calculated under the Monte Carlo valuation method. However, if the market condition is achieved for any tranche of these options prior to the end of the derived service period, all remaining expense related to that tranche would be recognized in the period in which the market condition is achieved. Additionally, if the service period is met but the share price target required for the options to become exercisable is never achieved, no compensation cost may be reversed. As such, we may recognize expense for options that never become exercisable.
In addition, we are required to develop an estimate of the number of share-based awards that will be forfeited due to employee turnover. The guidance on stock compensation requires forfeitures to be estimated at the time of grant and revised, if necessary, in subsequent periods if actual forfeitures differ from those estimates in order to derive our best estimate of awards ultimately expected to vest. We estimate forfeitures based on historical experience related to our own stock-based awards granted. We anticipate that these estimates will be revised, if necessary, in subsequent periods if actual forfeitures differ from those estimates.
Intangible Assets and Goodwill. We allocate the cost of business acquisitions to the assets acquired and liabilities assumed based on their estimated fair values at the date of acquisition (commonly referred to as the purchase price allocation). As part of the purchase price allocations for our business acquisitions, identifiable intangible assets are recognized as assets apart from goodwill if they arise from contractual or other legal rights, or if they are capable of being separated or divided from the acquired business and sold, transferred, licensed, rented or exchanged. We have engaged a valuation specialist to estimate the fair value of our purchase price and the related intangible assets acquired.
In June 2014, we acquired certain assets and the U.S. business of Fabrica. Due to these transactions, we separately recognized the fair values of a combined Supply and Lease Agreement, trademarks, a non-compete agreement and customer relationships. The fair value of these assets was determined using an income approach, as follows: Supply and Lease Agreement - discounted cash flows method, trademarks — “relief from royalty” method, non-compete agreement - “with and without” method, and customer relationships - excess earnings method. An income approach requires estimates of future income. Under the discounted cash flow method, we utilized assumptions related to the term of the agreements, the net benefit from the agreements and any changes in that benefit over the term of the agreement, future tax rates and discount rates. Under the relief from royalty method, we estimated the useful lives of the trademarks, future revenues associated with the trademarks, a royalty rate and a discount rate. The with and without method requires assumptions related to the probability of competition in the absence of the non-compete agreement, the loss of future revenues due to competition and discount rates. Under the excess earnings method, we must estimate future revenues, including growth and attrition rates, income tax rates, a rate of return on assets, and discount rates. Future revenues and estimated benefits from the agreements are based on management’s knowledge of the industry, customers, operations and the agreements. Tax rates are based on current effective tax rates. The royalty rate is based on analysis of current royalty rates for corporate and product trademarks for similar products and evaluation of factors such as alternative trademarks available, legal defensibility, remaining useful life, licensing power, net revenue margin, market share, barriers to entry, capital requirements and customers’ bargaining power. The discount rate used to determine the present value of future cash flows was based on the weighted average cost of capital method.
The value assigned to goodwill equals the amount of the purchase price of the business acquired in excess of the sum of the amounts assigned to identifiable acquired assets, both tangible and intangible, less liabilities assumed. At March 31, 2016, we had goodwill of $7.6 million and identifiable intangible assets, net of accumulated amortization, of $15.4 million.
Intangible assets are amortized over their respective estimated useful lives ranging from two to twenty years. The useful life of an intangible asset is the period over which the asset is expected to contribute directly or indirectly to our future cash flows rather than the period of time that it would take us to internally develop an intangible asset that would provide similar benefits. The estimate of the useful lives of our intangible asset is based on an analysis of all pertinent factors, in particular:
|
|
● |
the expected use of the asset by the entity; |
|
|
● |
the expected useful life of another asset or group of assets to which the useful life of the intangible asset may relate; |
|
|
● |
any legal, regulatory or contractual provisions that may limit the useful life; |
|
|
● |
any legal, regulatory, or contractual provisions that enable renewal or extension of the asset’s legal or contractual life without substantial cost (provided there is evidence to support renewal or extension and renewal or extension can be accomplished without material modifications of the existing terms and conditions); |
|
|
● |
the effects of obsolescence, demand, competition and other economic factors (such as the stability of the industry, known technological advances, legislative action that results in an uncertain or changing regulatory environment, and expected changes in distribution channels); and |
|
|
● |
the level of regular maintenance expenditures (but not enhancements) required to obtain the expected future cash flows from the asset (for example, a material level of required maintenance in relation to the carrying amount of the asset may suggest a limited useful life). |
If no legal, regulatory, contractual, competitive, economic, or other factors limit the useful life of an intangible asset, the useful life of the asset is considered to be indefinite. The term indefinite does not mean infinite. An intangible asset with a finite useful life is amortized over that useful life; an intangible asset with an indefinite useful life is not amortized. We have no intangible assets with indefinite useful lives. Under U.S. GAAP, goodwill is not amortized.
Impairment of Goodwill and Other Long-Lived Assets. We review long-lived assets such as property, plant and equipment, intangible assets and goodwill for impairment whenever events or changes in circumstances indicate that the carrying amount of these assets may not be recoverable, and also review goodwill annually. U.S. GAAP requires that goodwill be tested, at a minimum, annually for each reporting unit. The first step in testing goodwill to assess qualitative factors to determine whether it is more likely than not that goodwill is impaired as a basis for determining whether it is necessary to perform the quantitative impairment test. If the first step indicates a quantitative test must be performed, the second step is to identify any potential impairment by comparing the carrying value of the reporting unit to its fair value. If a potential impairment is identified, the third step is to measure the impairment loss by comparing the implied fair value of goodwill with the carrying value of goodwill of the reporting unit. Alternatively, the Company may bypass the qualitative assessment in any period and proceed directly to performing the second step.
The Company performed its initial goodwill impairment test on October 1, 2015 by performing the first step, a qualitative impairment test, to determine whether it was more likely than not that goodwill was impaired. Goodwill is tested at a level of reporting referred to as the “reporting unit”. The Company has two reporting units, which are defined as the “at home” business and the “away from home” business. Based on this qualitative test, we determined it was more likely than not that the fair value of the Company’s reporting units were greater than their carrying amounts; as such, we determined that performing the second and third steps of the impairment test were not necessary and that goodwill was not impaired. In performing this qualitative assessment, we considered factors including, but not limited to, the following:
|
|
● |
Macroeconomic conditions, including general economic conditions, limitations on accessing capital, and other developments in equity and credit markets; |
|
|
● |
Industry and market considerations, including any deterioration in the environment in which we operate, an increased competitive environment, a decline in market-dependent multiples or metrics, a change in the market for our products or services, and regulatory or political developments; |
|
|
● |
Cost factors such as increases in raw materials, labor, exchange rates or other costs that have a negative effect on earnings and cash flows; |
|
|
● |
Overall financial performance, including negative or declining cash flows or a decline in actual or planned revenue or earnings compared with actual and projected results of relevant prior periods; |
|
|
● |
Other relevant entity-specific events, such as changes in management, key personnel, strategy, customers, or litigation; and |
|
|
● |
Whether a sustained, material decrease in share price had occurred. |
Subsequent to October 1, 2015 we did not note any additional qualitative factors that would indicate that the Company’s goodwill was impaired.
New Accounting Pronouncements
Refer to the discussion of recently adopted/issued accounting pronouncements under Part I, Notes to Unaudited Interim Financial Statements Note 14 — New and Recently Adopted Accounting Pronouncements.
Non-GAAP Discussion
In addition to our GAAP results, we also consider non-GAAP measures of our performance for a number of purposes. The three non-GAAP financial measures used within this report are: (1) EBITDA, (2) Adjusted EBITDA and (3) Net Debt.
EBITDA and Adjusted EBITDA
We use EBITDA and Adjusted EBITDA as a supplemental measure of our performance that is not required by, or presented in accordance with GAAP. EBITDA and Adjusted EBITDA should not be considered as an alternative to net income, operating income or any other performance measure derived in accordance with GAAP, or as an alternative to cash flows from operating activities or a measure of our liquidity.
EBITDA represents net income before net interest expense, income tax expense, depreciation and amortization. Amortization of deferred debt issuance costs is included in net interest expense. Adjusted EBITDA represents EBITDA before non-cash stock compensation expense. We believe EBITDA and Adjusted EBITDA facilitate operating performance comparisons from period to period and company to company by eliminating potential differences caused by variations in capital structures (affecting relative interest expense), tax positions (such as the impact on periods or companies of changes in effective tax rates or net operating losses), the age and book depreciation of facilities and equipment (affecting relative depreciation expense), and non-cash compensation and valuation (affecting stock compensation expense).
EBITDA and Adjusted EBITDA have limitations as an analytical tool, and you should not consider them in isolation, or as a substitute for any of our results as reported under GAAP. Some of these limitations are:
|
|
● |
they do not reflect our cash expenditures for capital assets; |
|
|
● |
they do not reflect changes in, or cash requirements for, our working capital requirements; |
|
|
● |
they do not reflect cash requirements for cash dividend payments; |
|
|
● |
they do not reflect the interest expense, or the cash requirements necessary to service interest or principal payments on our indebtedness; |
|
|
● |
although depreciation and amortization are non-cash charges, the assets being depreciated and amortized will often have to be replaced in the future, and EBITDA and Adjusted EBITDA do not reflect cash requirements for such replacements; and |
|
|
● |
other companies, including other companies in our industry, may calculate these measures differently than we do, limiting their usefulness as a comparative measure. |
Because of these limitations, EBITDA and Adjusted EBITDA should not be considered as a measure of discretionary cash available to us to invest in the growth of our business or to reduce our indebtedness. We compensate for these limitations by relying primarily on our GAAP results and using EBITDA and Adjusted EBITDA on a supplemental basis.
The following table reconciles EBITDA and Adjusted EBITDA to net income for the three months ended March 31, 2016 and 2015:
|
Three Months Ended March 31, |
||||||||
|
2016 |
2015 |
|||||||
|
(in thousands, except % of net sales) |
||||||||
|
Net income |
$ | 5,409 | $ | 1,236 | ||||
|
Plus: Interest expense, net |
263 | 214 | ||||||
|
Plus: Income tax expense |
2,811 | 648 | ||||||
|
Plus: Depreciation |
2,637 | 2,088 | ||||||
|
Plus: Intangibles amortization |
377 | 377 | ||||||
|
EBITDA |
$ | 11,497 | $ | 4,563 | ||||
|
% of net sales |
24.1 | % | 12.2 | % | ||||
|
Plus: Stock compensation expense |
149 | 267 | ||||||
|
Adjusted EBITDA |
$ | 11,646 | $ | 4,830 | ||||
|
% of net sales |
24.4 | % | 12.9 | % | ||||
Adjusted EBITDA increased $6.8 million, or 141%, to $11.6 million in the quarter ended March 31, 2016, compared to $4.8 million in the same period in 2015. Adjusted EBITDA as a percent of net sales increased to 24.4% in the first quarter of 2016 from 12.9% in the first quarter of 2015. EBITDA increased $6.9 million, or 152%, to $11.5 million in the quarter ended March 31, 2016, compared to $4.6 million in the same period in 2015. EBITDA as a percent of net sales increased to 24.1% in the first quarter of 2016 from 12.2% in the first quarter of 2015. The foregoing factors discussed in the net sales, cost of sales and selling, general and administrative expenses sections are the reasons for the increase.
Net Debt
We use Net Debt as a supplemental measure of our leverage that is not required by, or presented in accordance with, GAAP. Net Debt should not be considered as an alternative to total debt, total liabilities or any other performance measure derived in accordance with GAAP. Net Debt represents total debt reduced by cash and short-term investments. We use this figure as a means to evaluate our ability to repay our indebtedness and to measure the risk of our financial structure.
Net Debt represents the amount that Cash is less than total Debt (excluding deferred debt issuance costs) of the Company. The amounts included in the Net Debt calculation are derived from amounts included in the historical Balance Sheets. We have reported Net Debt because we regularly review Net Debt as a measure of the Company’s leverage. However, the Net Debt measure presented in this document may not be comparable to similarly titled measures reported by other companies due to differences in the components of the calculation.
Net Debt increased from $71.2 million on December 31, 2015, to $84.9 million on March 31, 2016, primarily as a result of an increase in long-term debt due to additional borrowings for capital expenditures, which was partially offset by an increase in cash primarily due to cash flows from operations in the first quarter of 2016.
The following table presents Net Debt as of March 31, 2016, and December 31, 2015:
|
As of |
||||||||
|
March 31, |
December 31, |
|||||||
|
2016 |
2015 |
|||||||
|
(in thousands) |
||||||||
|
Current portion long-term debt |
$ | 4,214 | $ | 3,882 | ||||
|
Long-term debt |
87,292 | 70,357 | ||||||
|
Total debt |
91,506 | 74,239 | ||||||
|
Plus: Deferred Debt Issuance Costs |
1,387 | 1,342 | ||||||
|
Total Cash Required to Settle Debt |
92,893 | 75,581 | ||||||
|
Less: Cash |
(8,039 | ) | (4,361 | ) | ||||
|
Net debt |
$ | 84,854 | $ | 71,220 | ||||
ITEM 3. Quantitative and Qualitative Disclosures about Market Risk
There has been no material change in the information provided in response to Item 7A of the Company’s Form 10-K for the year ended December 31, 2015.
ITEM 4. Controls and Procedures
Our management, under the supervision and with the participation of our chief executive officer and our chief financial officer, has evaluated the effectiveness of our disclosure controls and procedures (as defined in Rule 13a-15(e) under the Securities Exchange Act of 1934, as amended), as of the end of the period covered by this Quarterly Report on Form 10-Q. Any controls and procedures, no matter how well designed and operated, can provide only reasonable assurance of achieving the desired control objectives. Based on such evaluation, our chief executive officer and our chief financial officer have concluded that our disclosure controls and procedures were effective at a reasonable assurance level as of March 31, 2016.
There were no significant changes in the Company’s internal control over financial reporting (as defined in Rule 13a-15(f) under the Exchange Act) during the quarter ended March 31, 2016, that have materially affected, or are reasonably likely to materially affect, our internal control over financial reporting.
PART II. OTHER INFORMATION
ITEM 1. Legal Proceedings
In management’s opinion, as of the date of this report, the Company is not engaged in legal proceedings which individually or in the aggregate are expected to have a materially adverse effect on the Company’s results of operations or financial condition.
ITEM 1A. Risk Factors
We operate in a changing environment that involves numerous known and unknown risks and uncertainties that could materially affect our operations. Factors that could materially affect our actual results, levels of activity, performance or achievements include, but are not limited to, those detailed below, those under the caption “Risk Factors” in our Annual Report on Form 10-K for the fiscal year ended December 31, 2015, as filed with the SEC on March 7, 2016, and those in our subsequent filings with the SEC. Such risks, uncertainties and other factors may cause our actual results, performances and achievements to be materially different from those expressed or implied by our forward-looking statements. If any of these risks or events occur, our business, financial condition or results of operations may be adversely affected.
|
ITEM 2. |
Unregistered Sales of Equity Securities and Use of Proceeds |
(a) Unregistered Sales of Equity Securities
None.
(b) Initial Public Offering and Use of Proceeds from the Sale of Registered Securities
None.
(c) Repurchases of Equity Securities
We do not have any programs to repurchase shares of our common stock and no such repurchases were made during the three months ended March 31, 2016.
|
ITEM 3. |
Defaults Upon Senior Securities |
None.
|
ITEM 4. |
Mine Safety Disclosures |
Not applicable.
|
ITEM 5. |
Other Information |
None.
|
ITEM 6. |
Exhibits |
See the Exhibit Index following the signature page to this Form 10-Q, which Exhibit Index is hereby incorporated by reference herein.
SIGNATURES
Pursuant to the requirements of the Securities Exchange Act of 1934, the registrant has duly caused this report to be signed on its behalf by the undersigned thereunto duly authorized.
|
ORCHIDS PAPER PRODUCTS COMPANY |
|
|
|
|
|
|
|
Date: April 29, 2016 |
By: |
/s/ Keith R. Schroeder |
|
|
|
Keith R. Schroeder |
|
|
|
Chief Financial Officer |
|
|
|
(On behalf of the registrant and as Chief Accounting Officer) |
Exhibit Index
|
Exhibit |
|
Description |
|
|
|
|
|
3.1 |
|
Amended and Restated Certificate of Incorporation of the Registrant dated May 17, 2013, incorporated by reference to Exhibit 3.1 to the Registrant’s Form 10-Q (SEC Accession No. 0001104659-13-058279) filed with the SEC on July 31, 2013. |
|
|
|
|
|
3.2 |
|
Amended and Restated Bylaws of the Registrant amended May 17, 2013, incorporated by reference to Exhibit 3.2 to the Registrant’s Form 10-Q (SEC Accession No. 0001104659-13-058279) filed with the SEC on July 31, 2013. |
|
|
|
|
|
31.1 |
|
Certification of Chief Executive Officer Pursuant to Section 302. |
|
|
|
|
|
31.2 |
|
Certification of Chief Financial Officer Pursuant to Section 302. |
|
|
|
|
|
32.1 |
|
Certification of Chief Executive Officer Pursuant to Section 906. |
|
|
|
|
|
32.2 |
|
Certification of Chief Financial Officer Pursuant to Section 906. |
|
|
|
|
|
101 |
|
The following financial information from Orchids Paper Products Company’s Quarterly Report on Form 10-Q for the quarterly period ended March 31, 2016, formatted in XBRL (eXtensible Business Reporting Language): (i) Consolidated Statements of Income for the three months ended March 31, 2016 and 2015, (ii) Consolidated Balance Sheets as of March 31, 2016 and December 31, 2015, (iii) Consolidated Statements of Cash Flows for the three months ended March 31, 2016 and 2015, and (iv) Notes to Consolidated Unaudited Interim Financial Statements. |
33