Attached files
| file | filename |
|---|---|
| 8-K - 8-K - JONES LANG LASALLE INC | q12016earningrelease-form8k.htm |
| EX-99.1 - EXHIBIT 99.1 - JONES LANG LASALLE INC | exhibit991firstquarter2016.htm |

Supplemental Information Earnings Call First-Quarter 2016

Gross Absorption Actual Forecast Leasing (in square meters) Q1 2016 v. Q1 2015 FY 2016 v. FY 2015 Americas -10% flat to 5% EMEA 14% -5% Asia Pacific 7% 10 to 15% Total -1% flat to 5% Market Volumes Actual Forecast Capital Markets(1) Q1 2016 v. Q1 2015 FY 2016 v. FY 2015 USD USD Americas -16% flat to -5% EMEA -15% -10% Asia Pacific -5% -5 to -10% Total -14% -5% Investment volumes moderate from record Q1 2015; FY 2016 forecast revised to 5 percent down from $704 billion in 2015 JLL Research market volume & outlook Leasing volumes flat; FY 2016 forecast revised to flat to 5 percent up from 41 million square meters in 2015 (1) Market volume data excludes multi-family assets. Source: JLL Research, April 2016 2

Multi-Regional Lenovo Americas Texas Medical Center Pasadena Towers, Los Angeles Time Warner CareFirst, Inc, Maryland GlaxoSmithKline Entegris Headquarters, Massachusetts Alecta Portfolio, U.S. & UK EMEA Ellipse Tower, Brussels Commerzbank, Hamburg Catinvest Retail Portfolio, France SAP, Germany Echo Prime Properties, CEE Gateway, Dublin Hotel Villa Magna, Spain Asia Pacific Tabcorp, Australia Shanghai Electric Power, Shanghai CapitalOne, Philippines China Ping An Insurance, Hong Kong World Square Shopping Centre, Sydney Ctrip, Guangzhou 46 - 48 Cochrane Street, Hong Kong Selected business wins and expansions 3

Rental Values Capital Values + 10-20% Madrid, Stockholm + 5-10% Tokyo, Sydney, Dubai*, Boston, Chicago, San Francisco,Los Angeles, Madrid, Hong Kong, Shanghai, Stockholm Brussels, Tokyo, Shanghai, Dubai*, Boston, Chicago, Los Angeles, San Francisco, Moscow + 0-5% London*, Frankfurt, Seoul, Paris*, New York*, Toronto,Washington DC, Beijing, Milan, Brussels, Moscow Sydney, London*, Hong Kong, Milan, Paris*, Seoul, New York*, Toronto, Washington DC, Beijing, Frankfurt - 0-5% Mumbai, Mexico City Mumbai, Mexico City - 5-10% Sao Paulo Sao Paulo - 10-20% Singapore Singapore Prime offices projected changes in values, 2016 4 NOTES: *New York – Midtown, London – West End, Paris - CBD, Dubai - DIFC. Nominal rates in local currency. Source: JLL Research, April 2016

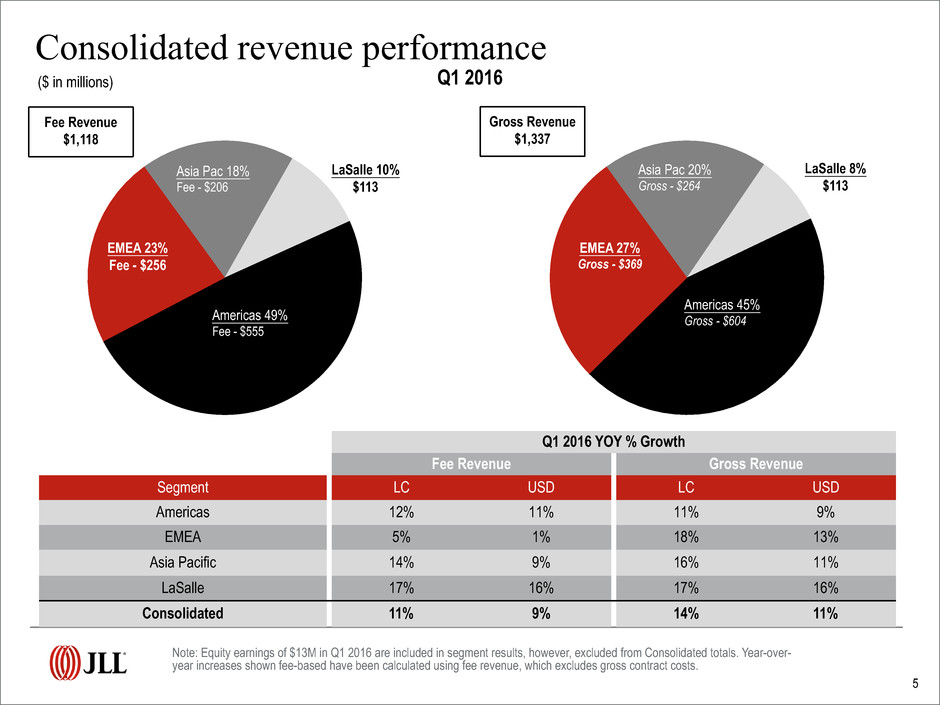
Note: Equity earnings of $13M in Q1 2016 are included in segment results, however, excluded from Consolidated totals. Year-over- year increases shown fee-based have been calculated using fee revenue, which excludes gross contract costs. Gross Revenue $1,337 LaSalle 8% $113 EMEA 27% Gross - $369 Q1 2016 Consolidated revenue performance ($ in millions) Americas 45% Gross - $604 Asia Pac 20% Gross - $264 5 Q1 2016 YOY % Growth Fee Revenue Gross Revenue Segment LC USD LC USD Americas 12% 11% 11% 9% EMEA 5% 1% 18% 13% Asia Pacific 14% 9% 16% 11% LaSalle 17% 16% 17% 16% Consolidated 11% 9% 14% 11% EMEA 23% Fee - $256 Americas 49% Fee - $555 LaSalle 10% $113 Asia Pac 18% Fee - $206 Fee Revenue $1,118

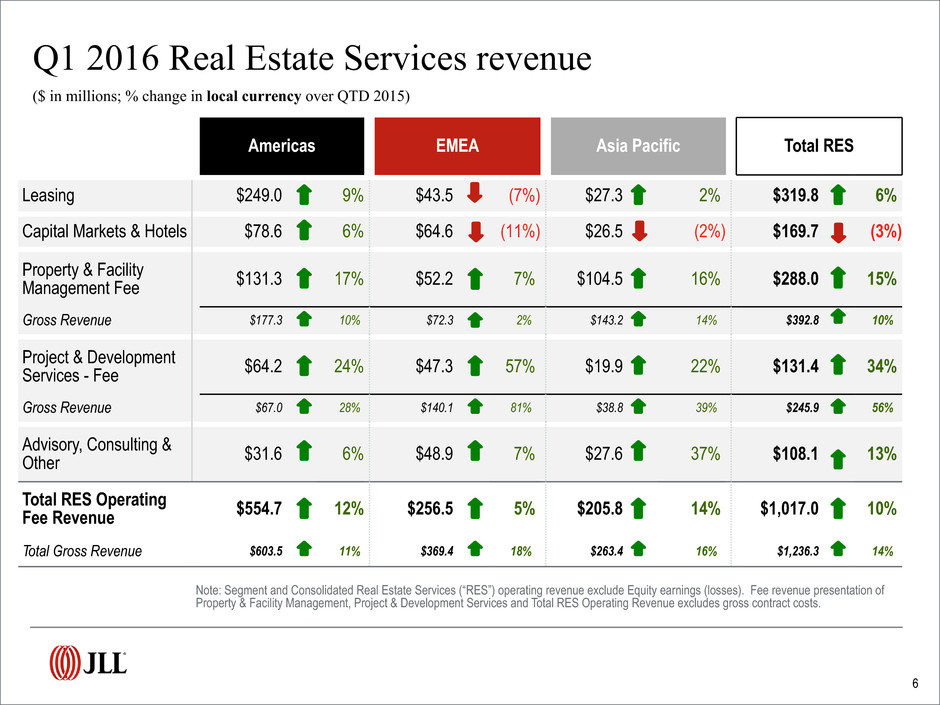
Note: Segment and Consolidated Real Estate Services (“RES”) operating revenue exclude Equity earnings (losses). Fee revenue presentation of Property & Facility Management, Project & Development Services and Total RES Operating Revenue excludes gross contract costs. Q1 2016 Real Estate Services revenue ($ in millions; % change in local currency over QTD 2015) Americas EMEA Asia Pacific Total RES Leasing $249.0 9% $43.5 (7%) $27.3 2% $319.8 6% Capital Markets & Hotels $78.6 6% $64.6 (11%) $26.5 (2%) $169.7 (3%) Property & Facility Management Fee $131.3 17% $52.2 7% $104.5 16% $288.0 15% Gross Revenue $177.3 10% $72.3 2% $143.2 14% $392.8 10% Project & Development Services - Fee $64.2 24% $47.3 57% $19.9 22% $131.4 34% Gross Revenue $67.0 28% $140.1 81% $38.8 39% $245.9 56% Advisory, Consulting & Other $31.6 6% $48.9 7% $27.6 37% $108.1 13% Total RES Operating Fee Revenue $554.7 12% $256.5 5% $205.8 14% $1,017.0 10% Total Gross Revenue $603.5 11% $369.4 18% $263.4 16% $1,236.3 14% 6

• Successful capital raising with $1.9 billion for the quarter • Assets Under Management reach a record high of $58 billion, up from $56 billion at year end; reflects net foreign currency reduction of $0.5 billion • Equity earnings of $12.7M, primarily from valuation increases • Notable transaction fees from successful listing of LaSalle Logiport REIT Separate Accounts $33.1 Commingled Funds $11.7 Public Securities $13.5 Q1 Highlights Q1 2016 AUM = $58 Billion ($ in billions) Note: AUM data reported on a one-quarter lag. Public Securities $13.5 Continental Europe $3.9 7 U.K. $18.5 North America $15.5Asia Pacific $6.9

Highlights • Investment-grade ratings; Baa2 (Positive) / BBB+ (Stable) ◦ Moody's outlook revised up to Positive in December 2015 ◦ Two S&P rating increases to BBB+ since December 2014 • Q1 2016 net interest expense $9M reflects higher average borrowings related to continued investments and acquisitions Net Debt $ millions Q1 2016 Dec 2015 Q1 2015 Cash and Cash Equivalents $ 240 $ 217 $ 198 Short Term Borrowings 24 49 21 Credit Facility ($2B capacity)(4) 800 255 335 Net Bank Debt $ 584 $ 87 $ 158 Long Term Senior Notes(4) 275 275 275 Deferred Business Acquisition Obligations 113 98 113 Total Net Debt $ 972 $ 460 $ 546 Investment-grade balance sheet 8 (1) Includes payments made at close plus guaranteed deferred payments and earn outs paid during the period for transactions closed in prior periods (2) Capital contributions are offset by distributions, and includes amounts attributable to consolidated investments if we have an equity interest. (3) Excludes investments in joint venture entities, capitalized leases and tenant improvement allowances that are required to be consolidated under U.S. GAAP (4) Principal balances shown exclude debt issuance costs of $17M, $18M, and $21M for Q1 2016, December 2015, and Q1 2015, respectively. Cash Spend 2016 2015$ in millions M&A(1) $78 $4 (Including Deferred) Co-investment(2) 47 5 Capital Expenditures(3) 36 19 Total Spend $161 $28

Appendix 9

Prime Offices Capital Value Clock, Q1 2015 v Q1 2016 Based on notional capital values for Grade A space in CBD or equivalent. US positions relate to the overall market Source: JLL Research, April 2016 Americas EMEA Asia Pacific The JLL Property Clocks SM 10

Prime Offices Rental Clock, Q1 2015 v Q1 2016 Based on rents for Grade A space in CBD or equivalent. US positions relate to the overall market Source: JLL Research, April 2016 Americas EMEA Asia Pacific The JLL Property Clocks SM 11

Refer to page 15 for Reconciliation of GAAP Net Income to Adjusted EBITDA for the three months ended March 31, 2016, for details relative to these Adjusted EBITDA calculations. Segment Adjusted EBITDA is calculated by adding the segment’s depreciation and amortization to its reported operating income, which includes equity earnings and excludes restructuring and acquisition charges. Consolidated Adjusted EBITDA is the sum of the Adjusted EBITDA of the four segments. Adjusted EBITDA performance ($ in millions) 12 Adj. EBITDA Margin, Fee Revenue Q1 Segment 2016 2016 atconstant rates 2015 2014 at constant rates Americas 9.5% 9.3% 10.2% 7.6% EMEA (1.7%) (2.0%) 0.9% —% Asia Pacific 0.9% 0.6% 4.3% 2.5% LaSalle 30.4% 29.7% 29.2% 23.9% Consolidated 7.6% 7.2% 8.7% 6.2% Americas 60.7% $49 Americas EMEA Asia Pac LaSalle 60 50 40 30 20 10 0 -10 $ (M ill io ns ) Americas 60% $53 LaSalle 43% $34Asia Pac 2% $2 EMEA (5)% ($4) Consolidated $85 Q1 2016

Note: Segment and Consolidated Real Estate Services (“RES”) operating revenue exclude Equity earnings (losses). Fee revenue presentation of Property & Facility Management, Project & Development Services and Total RES Operating Revenue excludes gross contract costs. Q1 2016 Real Estate Services revenue ($ in millions; % change in USD over QTD 2015) Americas EMEA Asia Pacific Total RES Leasing $249.0 9% $43.5 -10% $27.3 -3% $319.8 5% Capital Markets & Hotels $78.6 5% $64.6 -14% $26.5 -5% $169.7 -5% Property & Facility Management Fee $131.3 15% $52.2 1% $104.5 11% $288.0 11% Gross Revenue $177.3 7% $72.3 -3% $143.2 9% $392.8 5% Project & Development Services - Fee $64.2 22% $47.3 52% $19.9 15% $131.4 30% Gross Revenue $67.0 25% $140.1 75% $38.8 32% $245.9 51% Advisory, Consulting & Other $31.6 4% $48.9 3% $27.6 31% $108.1 9% Total RES Operating Fee Revenue $554.7 11% $256.5 1% $205.8 9% $1,017.0 8% Total Gross Revenue $603.5 9% $369.4 13% $263.4 11% $1,236.3 11% 13

• Reimbursable vendor, subcontractor and out-of-pocket costs reported as revenue and expense in JLL financial statements have been increasing steadily • Gross accounting requirements increase revenue and costs without corresponding increase to profit • Business managed on a fee revenue basis to focus on margin expansion in the base business Revenue Gross contract costs Fee revenue Operating expenses Gross contract costs Fee-based operating expenses Operating income Restructuring and acquisition charges MSRs - net non-cash activity Amortization of acquisition-related intangibles Adjusted operating income Adjusted operating income margin Fee revenue / expense reconciliation ($ in millions) Note: Consolidated revenue and fee revenue exclude equity earnings (losses). Restructuring and acquisition charges, Mortgage servicing rights (MSRs) - net non-cash activity, and Amortization of acquisition-related intangibles are excluded from adjusted operating income margin. Three Months Ended March 31 2016 2015 $ 1,336.8 $ 1,203.5 (219.3) (174.4) $ 1,117.5 $ 1,029.1 $ 1,307.4 $ 1,150.8 (219.3) (174.4) $ 1,088.1 $ 976.4 $ 29.4 $ 52.7 7.6 0.8 $ 3.3 $ 0.1 $ 4.4 $ 1.8 $ 44.7 $ 55.4 4.0% 5.4% 14

Reconciliation of GAAP Net Income to Adjusted Net Income and Earnings Per Share ($ in millions) GAAP net income attributable to common shareholders Shares (in 000s) GAAP diluted earnings per share GAAP net income attributable to common shareholders Restructuring and acquisition charges, net MSRs - net non-cash activity, net Amortization of acquisition-related intangibles, net Adjusted net income Shares (in 000s) Adjusted diluted earnings per share(1) Three Months Ended March 31 2016 2015 $ 25.7 $ 41.9 45,483 45,374 $ 0.56 $ 0.92 $ 25.7 $ 41.9 5.7 0.6 2.5 0.1 3.3 1.4 $ 37.2 $ 44.0 45,483 45,374 $ 0.82 $ 0.97 15 (1) Calculated on a local currency basis, the results for the first quarter 2016 include a $0.05 favorable impact due to foreign exchange rate fluctuations as compared to a $0.07 unfavorable impact for the first quarter 2015.

Reconciliation of GAAP Net Income to Adjusted EBITDA ($ in millions) GAAP net income Interest expense, net of interest income Provision for income taxes Depreciation and amortization EBITDA Restructuring and acquisition charges MSRs - net non-cash activity Adjusted EBITDA JLL is the brand name, and a registered trademark, of Jones Lang LaSalle Incorporated. Three Months Ended March 31 2016 2015 $ 25.2 $ 43.3 8.9 6.0 8.3 14.7 31.2 24.9 $ 73.6 $ 88.9 7.6 0.8 $ 3.3 $ 0.1 $ 84.5 $ 89.8 16
