Attached files
| file | filename |
|---|---|
| EX-99.1 - EXHIBIT 99.1 - Polaris Inc. | a51325090ex99_1.htm |
| 8-K - POLARIS INDUSTRIES INC. 8-K - Polaris Inc. | a51325090.htm |
Exhibit 99.2
First Quarter 2016 Earnings Results April 21, 2016 POLARIS INDUSTRIES INC.
Except for historical information contained herein, the matters set forth in this document, including but not limited to management’s expectations regarding 2016 sales, shipments, margins, currencies, net income and cash flow, the opportunities for expansion and diversification of the Company’s business and the Company’s guidance on earnings per share are forward-looking statements that involve certain risks and uncertainties that could cause actual results to differ materially from those forward-looking statements. Potential risks and uncertainties include such factors as product offerings, promotional activities and pricing strategies by competitors; manufacturing operation expansion initiatives; acquisition integration costs; warranty expenses; foreign currency exchange rate fluctuations; environmental and product safety regulatory activity; effects of weather; commodity costs; uninsured product liability claims; uncertainty in the retail and wholesale credit markets; performance of affiliate partners; changes in tax policy and overall economic conditions, including inflation, consumer confidence and spending and relationships with dealers and suppliers. Investors are also directed to consider other risks and uncertainties discussed in our 2015 annual report and Form 10-K filed by the Company with the Securities and Exchange Commission. The Company does not undertake any duty to any person to provide updates to its forward-looking statements.The data source for retail sales figures included in this presentation is registration information provided by Polaris dealers in North America and compiled by the Company or Company estimates. The Company must rely on information that its dealers supply concerning retail sales, and other retail sales data sources and this information is subject to revision.Non-GAAP Measure - Constant Currency Reporting. This presentation includes information regarding the Company’s 2016 expectations on a constant currency basis, which is a non-GAAP measure, as well as on a GAAP basis. For purpose of comparison, the results on a constant currency basis uses the respective prior year exchange rates for the comparative period to enhance the visibility of the underlying business trends, excluding the impact of translation arising from foreign currency exchange rate fluctuations. 2 Q1'16 Earnings SAFE HARBOR

Scott W. Wine Chairman & CEO First Quarter 2016 Earnings Results April 21, 2016 POLARIS INDUSTRIES INC. Q1'16 Earnings 3
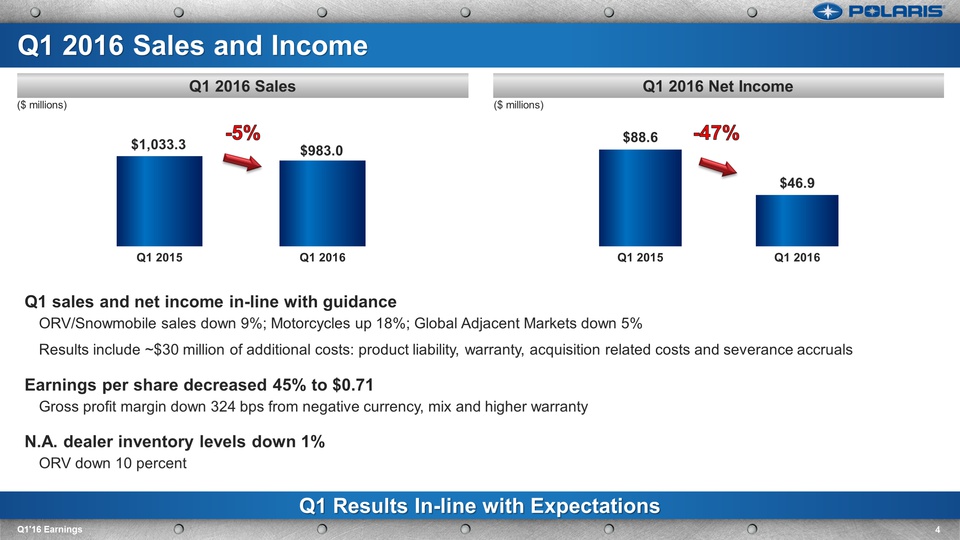
Q1 sales and net income in-line with guidanceORV/Snowmobile sales down 9%; Motorcycles up 18%; Global Adjacent Markets down 5%Results include ~$30 million of additional costs: product liability, warranty, acquisition related costs and severance accrualsEarnings per share decreased 45% to $0.71Gross profit margin down 324 bps from negative currency, mix and higher warrantyN.A. dealer inventory levels down 1%ORV down 10 percent Q1 Results In-line with Expectations Q1 2016 Net Income Q1 2016 Sales 4 Q1'16 Earnings Q1 2016 Sales and Income -5% -47% ($ millions) ($ millions)
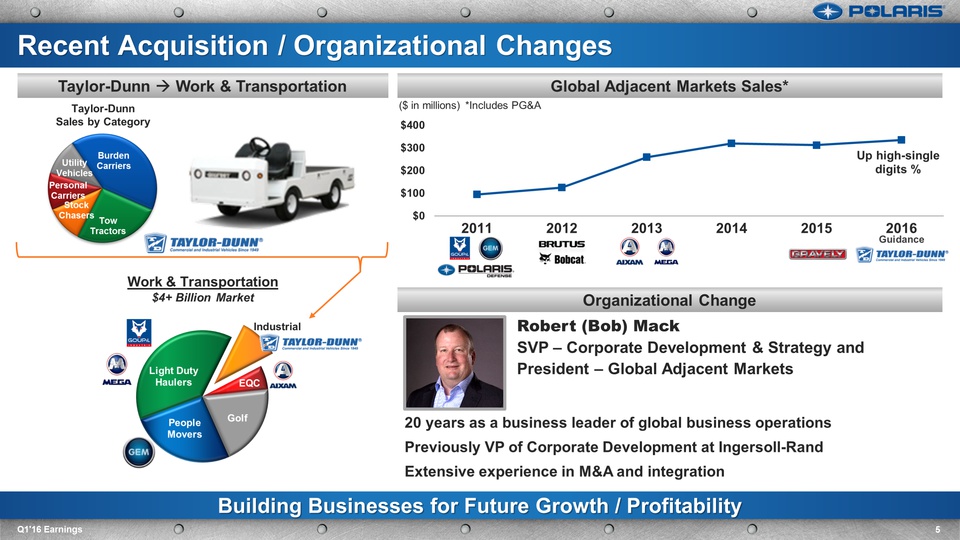
Global Adjacent Markets Sales* Taylor-Dunn Work & Transportation Robert (Bob) MackSVP – Corporate Development & Strategy and President – Global Adjacent Markets20 years as a business leader of global business operationsPreviously VP of Corporate Development at Ingersoll-RandExtensive experience in M&A and integration Building Businesses for Future Growth / Profitability 5 Q1'16 Earnings Recent Acquisition / Organizational Changes Work & Transportation$4+ Billion Market Guidance ($ in millions) Organizational Change Taylor-DunnSales by Category *Includes PG&A
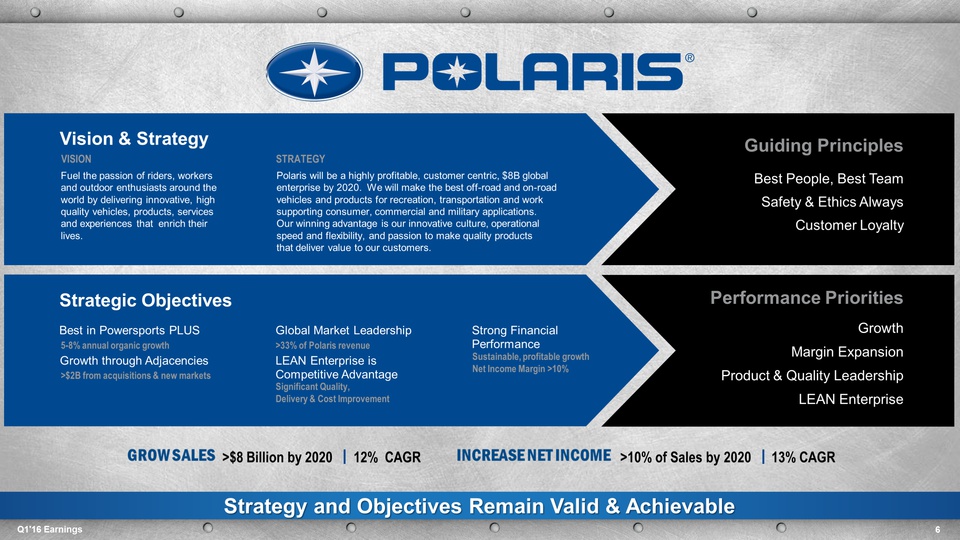
Strategic Objectives Vision & Strategy VISION Fuel the passion of riders, workers and outdoor enthusiasts around the world by delivering innovative, high quality vehicles, products, services and experiences that enrich their lives. STRATEGY Polaris will be a highly profitable, customer centric, $8B global enterprise by 2020. We will make the best off-road and on-road vehicles and products for recreation, transportation and work supporting consumer, commercial and military applications. Our winning advantage is our innovative culture, operational speed and flexibility, and passion to make quality productsthat deliver value to our customers. Best in Powersports PLUS Growth through Adjacencies 5-8% annual organic growth >$2B from acquisitions & new markets Global Market Leadership LEAN Enterprise is Competitive Advantage >33% of Polaris revenue Significant Quality, Delivery & Cost Improvement Strong Financial Performance Sustainable, profitable growthNet Income Margin >10% Guiding Principles Best People, Best Team Safety & Ethics Always Customer Loyalty Performance Priorities Growth Margin Expansion Product & Quality Leadership LEAN Enterprise >$8 Billion by 2020 12% CAGR >10% of Sales by 2020 13% CAGR 6 Q1'16 Earnings Strategy and Objectives Remain Valid & Achievable
Bennett Morgan President & COO First Quarter 2016 Earnings Results April 21, 2016 POLARIS INDUSTRIES INC. Q1'16 Earnings 7
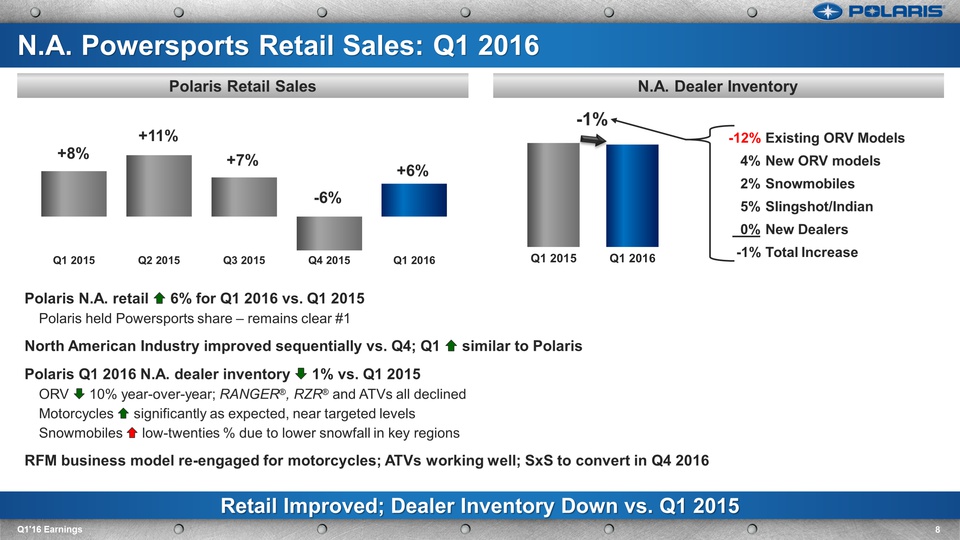
Polaris N.A. retail 6% for Q1 2016 vs. Q1 2015Polaris held Powersports share – remains clear #1North American Industry improved sequentially vs. Q4; Q1 similar to PolarisPolaris Q1 2016 N.A. dealer inventory 1% vs. Q1 2015ORV 10% year-over-year; RANGER®, RZR® and ATVs all declinedMotorcycles significantly as expected, near targeted levelsSnowmobiles low-twenties % due to lower snowfall in key regionsRFM business model re-engaged for motorcycles; ATVs working well; SxS to convert in Q4 2016 Retail Improved; Dealer Inventory Down vs. Q1 2015 N.A. Dealer Inventory Polaris Retail Sales 8 Q1'16 Earnings N.A. Powersports Retail Sales: Q1 2016 -12% Existing ORV Models 4% New ORV models 2% Snowmobiles 5% Slingshot/Indian 0% New Dealers -1% Total Increase -1%
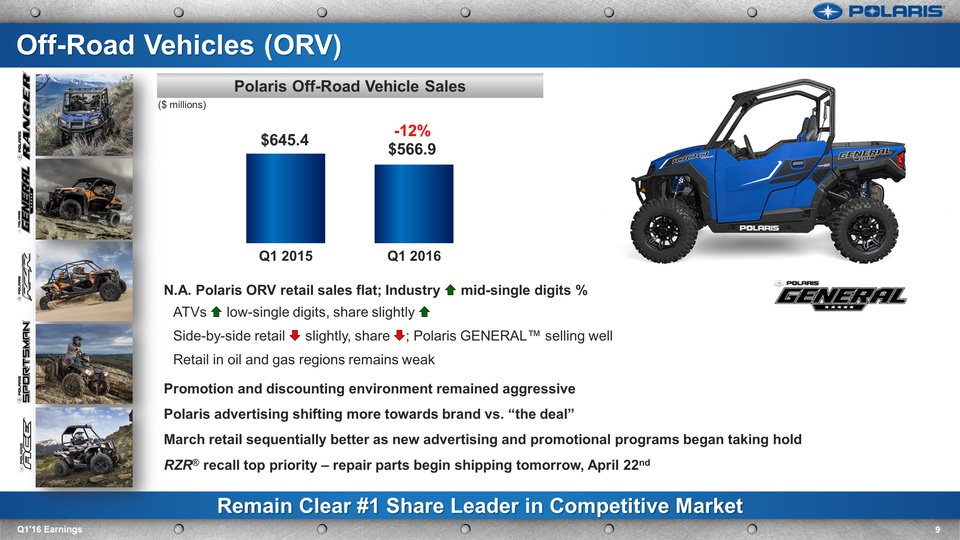
Off-Road Vehicles (ORV) 9 Q1'16 Earnings Polaris Off-Road Vehicle Sales N.A. Polaris ORV retail sales flat; Industry mid-single digits %ATVs low-single digits, share slightly Side-by-side retail slightly, share; Polaris GENERAL™ selling wellRetail in oil and gas regions remains weakPromotion and discounting environment remained aggressivePolaris advertising shifting more towards brand vs. “the deal”March retail sequentially better as new advertising and promotional programs began taking holdRZR® recall top priority – repair parts begin shipping tomorrow, April 22nd Remain Clear #1 Share Leader in Competitive Market ($ millions)
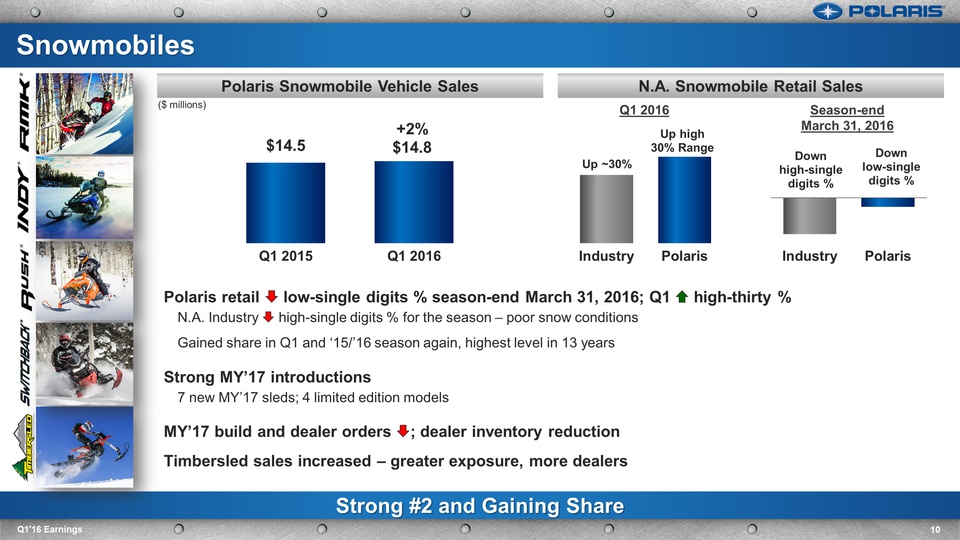
Snowmobiles 10 Q1'16 Earnings N.A. Snowmobile Retail Sales Polaris Snowmobile Vehicle Sales Polaris retail low-single digits % season-end March 31, 2016; Q1 high-thirty %N.A. Industry high-single digits % for the season – poor snow conditionsGained share in Q1 and ‘15/’16 season again, highest level in 13 yearsStrong MY’17 introductions7 new MY’17 sleds; 4 limited edition modelsMY’17 build and dealer orders; dealer inventory reductionTimbersled sales increased – greater exposure, more dealers Strong #2 and Gaining Share Q1 2016 Season-end March 31, 2016 ($ millions)
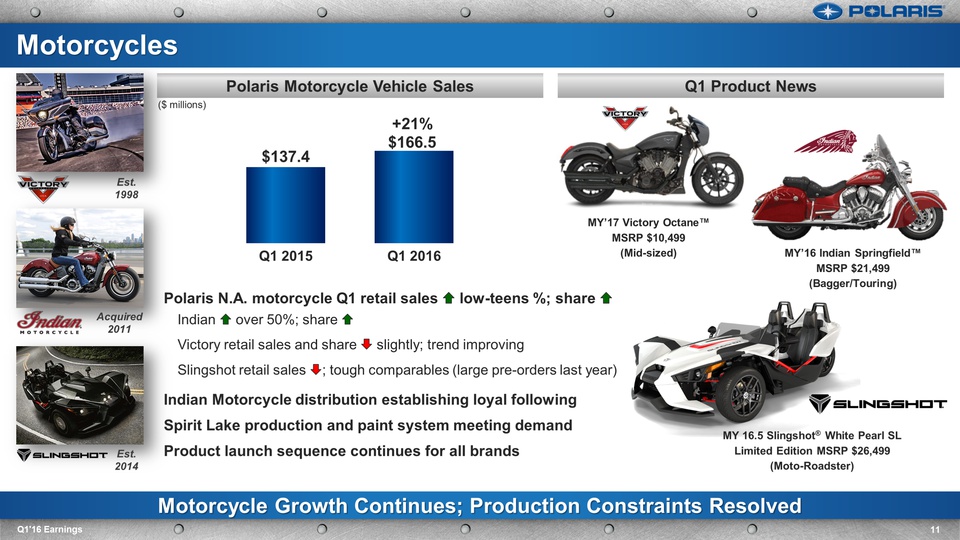
Motorcycles 11 Q1'16 Earnings Q1 Product News Polaris Motorcycle Vehicle Sales Polaris N.A. motorcycle Q1 retail sales low-teens %; share Indian over 50%; share Victory retail sales and share slightly; trend improvingSlingshot retail sales; tough comparables (large pre-orders last year)Indian Motorcycle distribution establishing loyal followingSpirit Lake production and paint system meeting demandProduct launch sequence continues for all brands Motorcycle Growth Continues; Production Constraints Resolved Acquired2011 Est. 2014 Est. 1998 MY’17 Victory Octane™MSRP $10,499(Mid-sized) MY 16.5 Slingshot® White Pearl SLLimited Edition MSRP $26,499(Moto-Roadster) MY’16 Indian Springfield™ MSRP $21,499(Bagger/Touring) ($ millions)
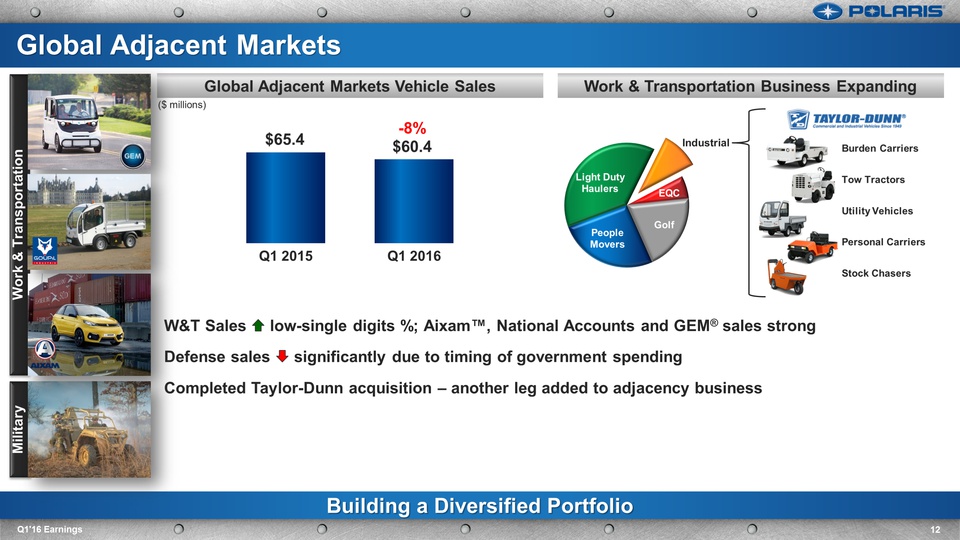
Work & Transportation Military Global Adjacent Markets 12 Q1'16 Earnings Work & Transportation Business Expanding Global Adjacent Markets Vehicle Sales W&T Sales low-single digits %; Aixam™, National Accounts and GEM® sales strongDefense sales significantly due to timing of government spendingCompleted Taylor-Dunn acquisition – another leg added to adjacency business Building a Diversified Portfolio 2014/2015 Season Snowmobile Industry Units ($ millions) Burden CarriersTow TractorsUtility VehiclesPersonal CarriersStock Chasers
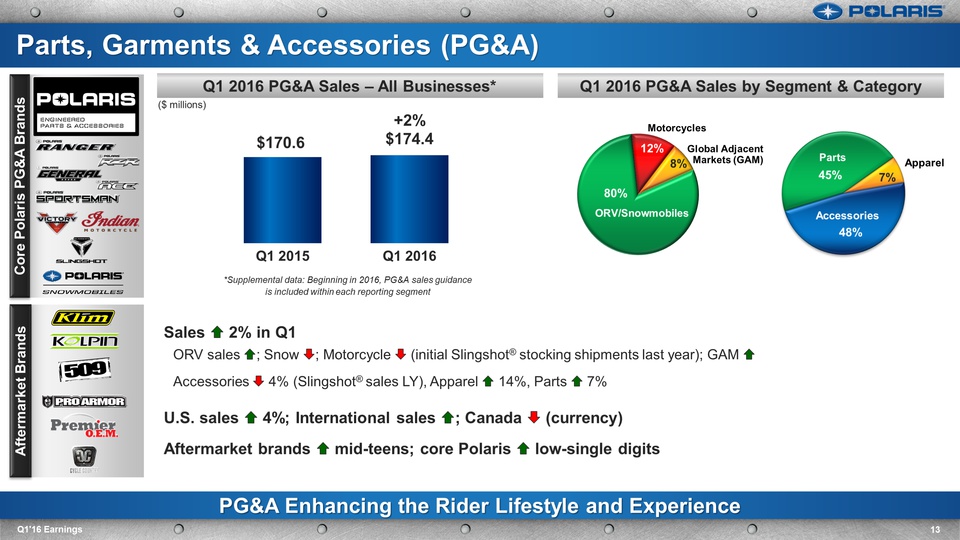
Parts, Garments & Accessories (PG&A) 13 Q1'16 Earnings Q1 2016 PG&A Sales by Segment & Category Q1 2016 PG&A Sales – All Businesses* Sales 2% in Q1ORV sales; Snow; Motorcycle (initial Slingshot® stocking shipments last year); GAM Accessories 4% (Slingshot® sales LY), Apparel 14%, Parts 7%U.S. sales 4%; International sales; Canada (currency)Aftermarket brands mid-teens; core Polaris low-single digits PG&A Enhancing the Rider Lifestyle and Experience Apparel Motorcycles Global Adjacent Markets (GAM) ORV/Snowmobiles Core Polaris PG&A Brands Aftermarket Brands *Supplemental data: Beginning in 2016, PG&A sales guidance is included within each reporting segment Accessories Parts ($ millions) Segments Categories
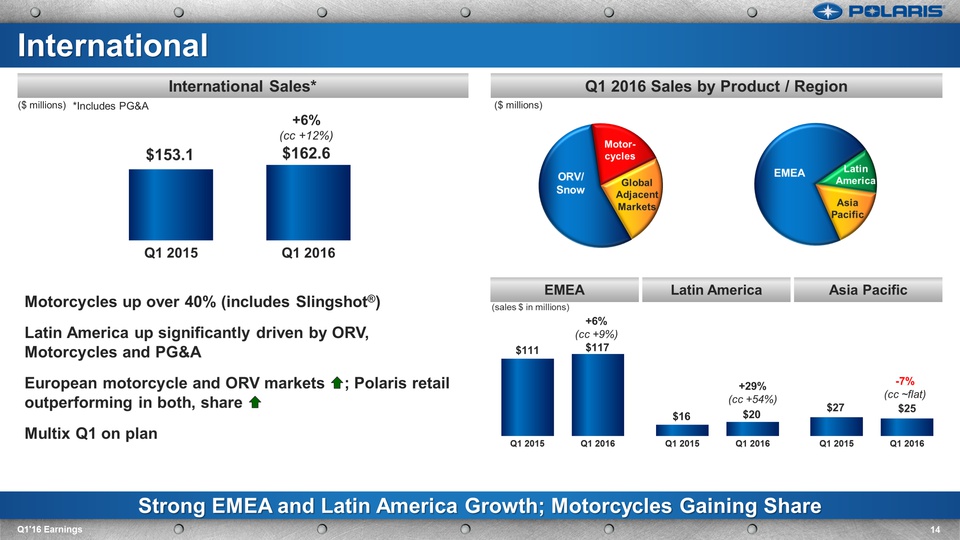
Q1 2016 Sales by Product / Region International Sales* Strong EMEA and Latin America Growth; Motorcycles Gaining Share 14 Q1'16 Earnings International ($ millions) Motorcycles up over 40% (includes Slingshot®)Latin America up significantly driven by ORV, Motorcycles and PG&AEuropean motorcycle and ORV markets; Polaris retail outperforming in both, share Multix Q1 on plan ($ millions) +6% (cc +9%) Motor-cycles Latin America GlobalAdjacentMarkets Asia Pacific ORV/Snow -7% (cc ~flat) +29%(cc +54%) +6% (cc +12%) EMEA Latin America Asia Pacific (sales $ in millions) *Includes PG&A
Ken Pucel EVP Operations, Engineering & Lean First Quarter 2016 Earnings Results April 21, 2016 POLARIS INDUSTRIES INC. Q1'16 Earnings 15
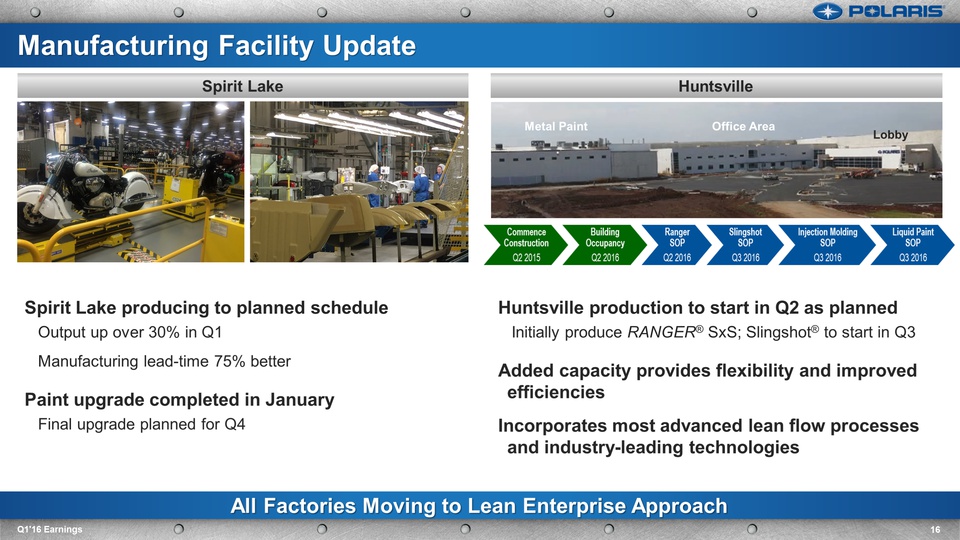
Huntsville Spirit Lake Huntsville production to start in Q2 as plannedInitially produce RANGER® SxS; Slingshot® to start in Q3Added capacity provides flexibility and improved efficienciesIncorporates most advanced lean flow processes and industry-leading technologies All Factories Moving to Lean Enterprise Approach 16 Q1'16 Earnings Manufacturing Facility Update Spirit Lake producing to planned schedule Output up over 30% in Q1 Manufacturing lead-time 75% better Paint upgrade completed in January Final upgrade planned for Q4 Metal Paint Office Area Lobby
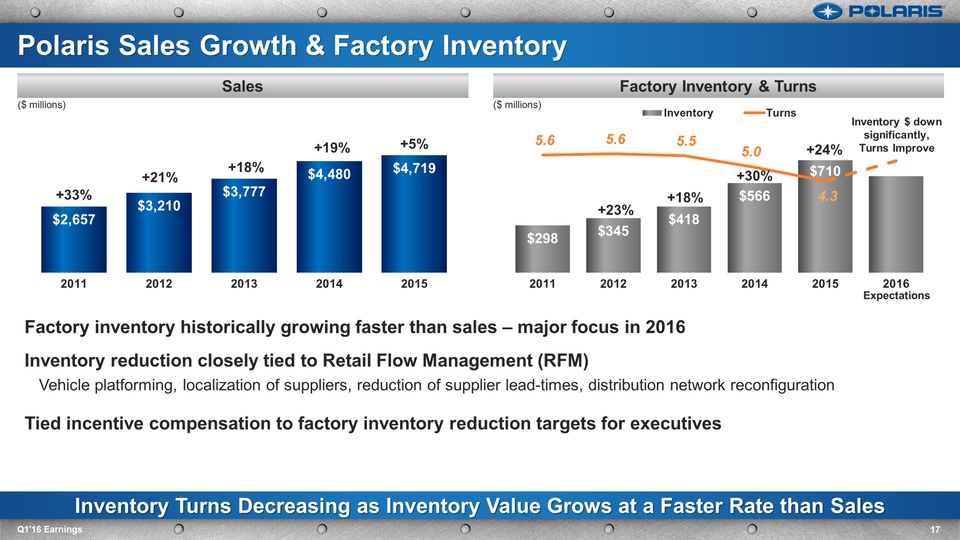
Inventory Turns Decreasing as Inventory Value Grows at a Faster Rate than Sales Factory Inventory & Turns Sales 17 Q1'16 Earnings Polaris Sales Growth & Factory Inventory ($ millions) Factory inventory historically growing faster than sales – major focus in 2016 Inventory reduction closely tied to Retail Flow Management (RFM)Vehicle platforming, localization of suppliers, reduction of supplier lead-times, distribution network reconfiguration Tied incentive compensation to factory inventory reduction targets for executives ($ millions) +23% +18% +30% +24% +33% +21% +18% +19% +5% Inventory $ down significantly, Turns Improve Expectations
Mike Speetzen EVP Finance & CFO First Quarter 2016 Earnings Results April 21, 2016 POLARIS INDUSTRIES INC. Q1'16 Earnings 18
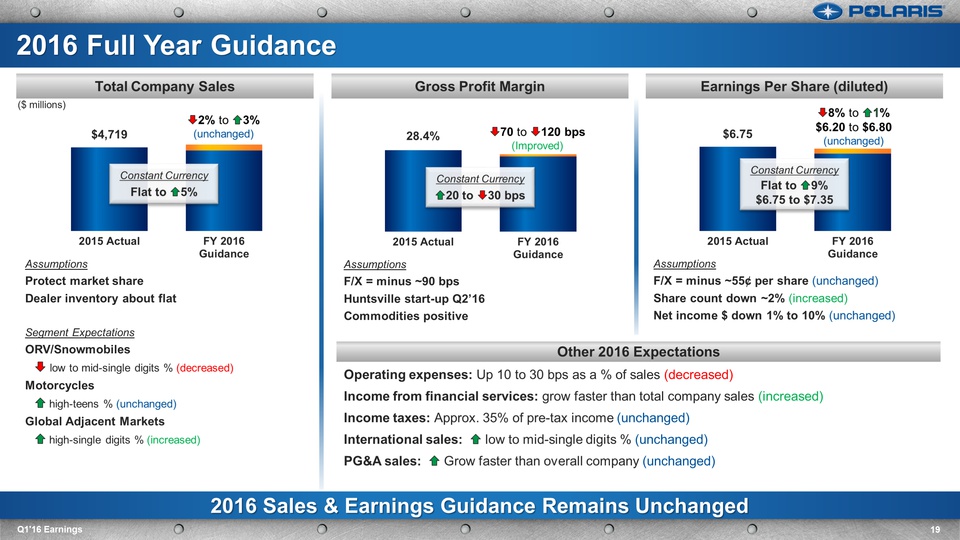
Earnings Per Share (diluted) Gross Profit Margin 19 Q1'16 Earnings Total Company Sales 2016 Sales & Earnings Guidance Remains Unchanged Assumptions Protect market share Dealer inventory about flat Segment Expectations ORV/Snowmobiles low to mid-single digits % (decreased) Motorcycles high-teens % (unchanged) Global Adjacent Markets high-single digits % (increased) Assumptions F/X = minus ~90 bps Huntsville start-up Q2’16 Commodities positive Assumptions F/X = minus ~55¢ per share (unchanged) Share count down ~2% (increased) Net income $ down 1% to 10% (unchanged) 2016 Full Year Guidance 2% to 3%(unchanged) Constant CurrencyFlat to 5% Constant Currency 20 to 30 bps Constant CurrencyFlat to 9% $6.75 to $7.35 8% to 1% $6.20 to $6.80 (unchanged) 70 to 120 bps (Improved) Other 2016 Expectations Operating expenses: Up 10 to 30 bps as a % of sales (decreased) Income from financial services: grow faster than total company sales (increased)Income taxes: Approx. 35% of pre-tax income (unchanged)International sales: low to mid-single digits % (unchanged) PG&A sales: Grow faster than overall company (unchanged) ($ millions)
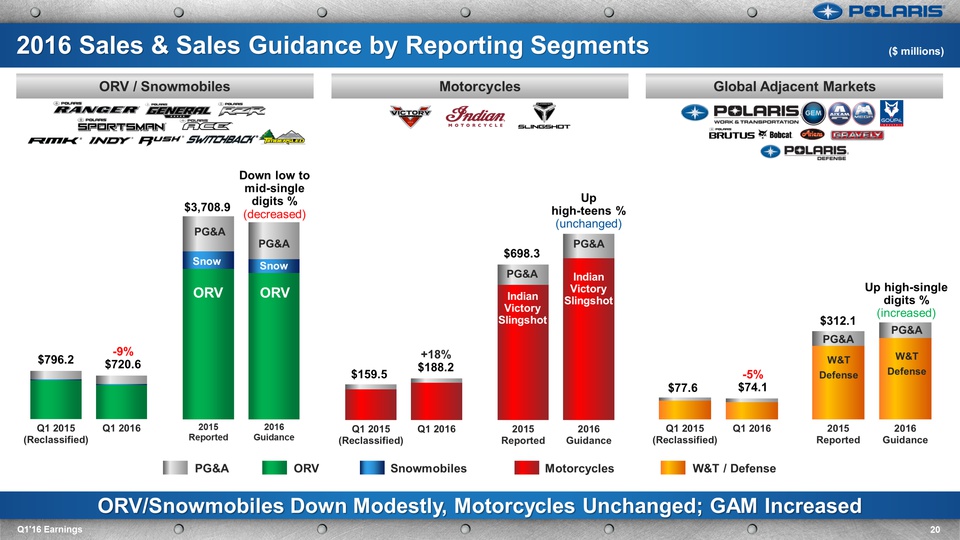
Global Adjacent Markets Motorcycles 20 Q1'16 Earnings ORV / Snowmobiles ORV/Snowmobiles Down Modestly, Motorcycles Unchanged; GAM Increased 2016 Sales & Sales Guidance by Reporting Segments $698.3 Uphigh-teens %(unchanged) Indian Victory Slingshot Indian Victory Slingshot PG&A PG&A PG&A PG&A W&T Defense W&T Defense Up high-single digits % (increased) Down low to mid-single digits % (decreased) ORV ORV PG&A PG&A Snow $3,708.9 $312.1 ($ millions) Snow -9% $720.6 $796.2 +18% $188.2 $159.5 -5% $74.1 $77.6 PG&A ORV Snowmobiles Motorcycles W&T / Defense
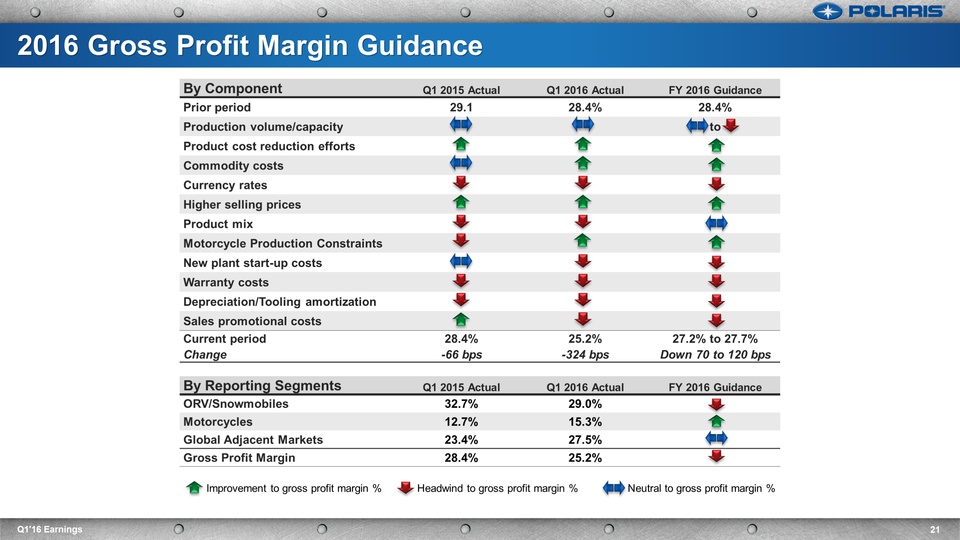
By Component Q1 2015 Actual Q1 2016 Actual FY 2016 Guidance Prior period 29.1 28.4% 28.4% Production volume/capacity to Product cost reduction efforts Commodity costs Currency rates Higher selling prices Product mix Motorcycle Production Constraints New plant start-up costs Warranty costs Depreciation/Tooling amortization Sales promotional costs Current period 28.4% 25.2% 27.2% to 27.7% Change -66 bps -324 bps Down 70 to 120 bps By Reporting Segments Q1 2015 Actual Q1 2016 Actual FY 2016 Guidance ORV/Snowmobiles 32.7% 29.0% Motorcycles 12.7% 15.3% Global Adjacent Markets 23.4% 27.5% Gross Profit Margin 28.4% 25.2% 21 Q1'16 Earnings 2016 Gross Profit Margin Guidance Improvement to gross profit margin % Headwind to gross profit margin % Neutral to gross profit margin %
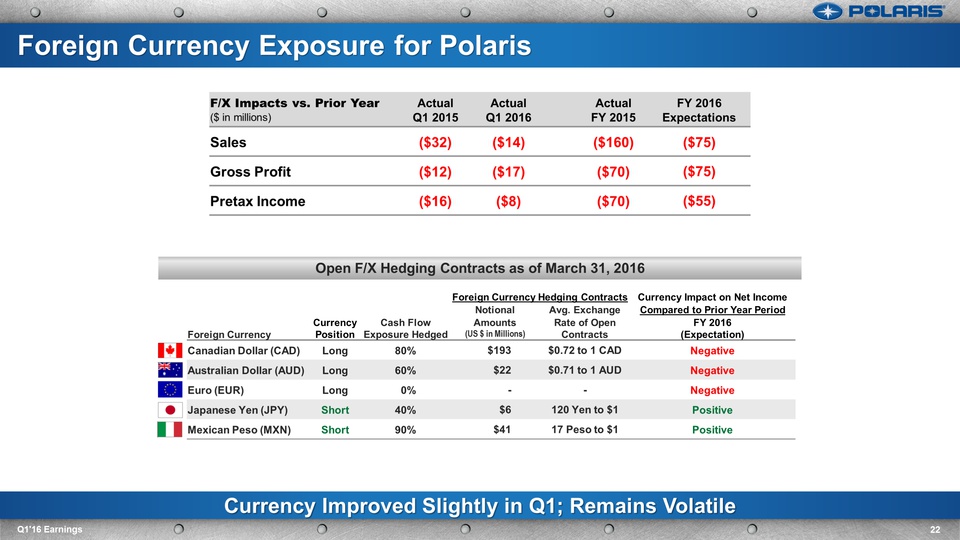
Currency Improved Slightly in Q1; Remains Volatile 22 Q1'16 Earnings Foreign Currency Exposure for Polaris Foreign Currency Hedging Contracts Currency Impact on Net Income Notional Avg. Exchange Compared to Prior Year Period Foreign Currency Currency Position Cash Flow Exposure Hedged Amounts (US $ in Millions) Rate of Open Contracts FY 2016 (Expectation) Canadian Dollar (CAD) Long 80% $193 $0.72 to 1 CAD Negative Australian Dollar (AUD) Long 60% $22 $0.71 to 1 AUD Negative Euro (EUR) Long 0% - - Negative Japanese Yen (JPY) Short 40% $6 120 Yen to $1 Positive Mexican Peso (MXN) Short 90% $41 17 Peso to $1 Positive F/X Impacts vs. Prior Year($ in millions) Actual Q1 2015 Actual Q1 2016 Actual FY 2015 FY 2016 Expectations Sales ($32) ($14) ($160) ($75) Gross Profit ($12) ($17) ($70) ($75) Pretax Income ($16) ($8) ($70) ($55) Open F/X Hedging Contracts as of March 31, 2016
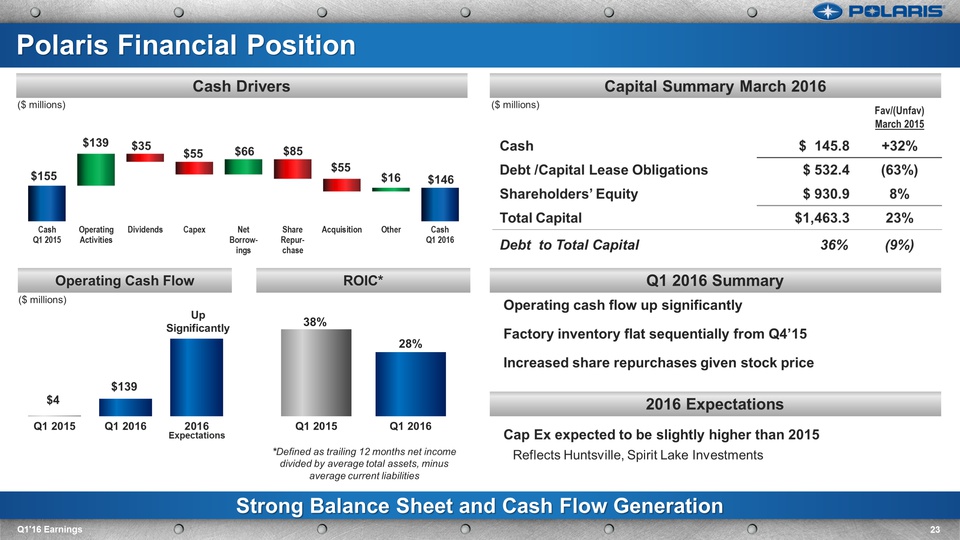
Polaris Financial Position 23 Q1'16 Earnings Capital Summary March 2016 Cash Drivers Fav/(Unfav) March 2015 Cash $ 145.8 +32% Debt /Capital Lease Obligations $ 532.4 (63%) Shareholders’ Equity $ 930.9 8% Total Capital $1,463.3 23% Debt to Total Capital 36% (9%) 2015 Operating cash flow up significantly Factory inventory flat sequentially from Q4’15 Increased share repurchases given stock priceCap Ex expected to be slightly higher than 2015Reflects Huntsville, Spirit Lake Investments Operating Cash Flow Strong Balance Sheet and Cash Flow Generation ROIC* *Defined as trailing 12 months net income divided by average total assets, minus average current liabilities Up Significantly ($ millions) ($ millions) ($ millions) Expectations Q1 2016 Summary 2016 Expectations
Scott W. Wine Chairman & CEO First Quarter 2016 Earnings Results April 21, 2016 POLARIS INDUSTRIES INC. Q1'16 Earnings 24
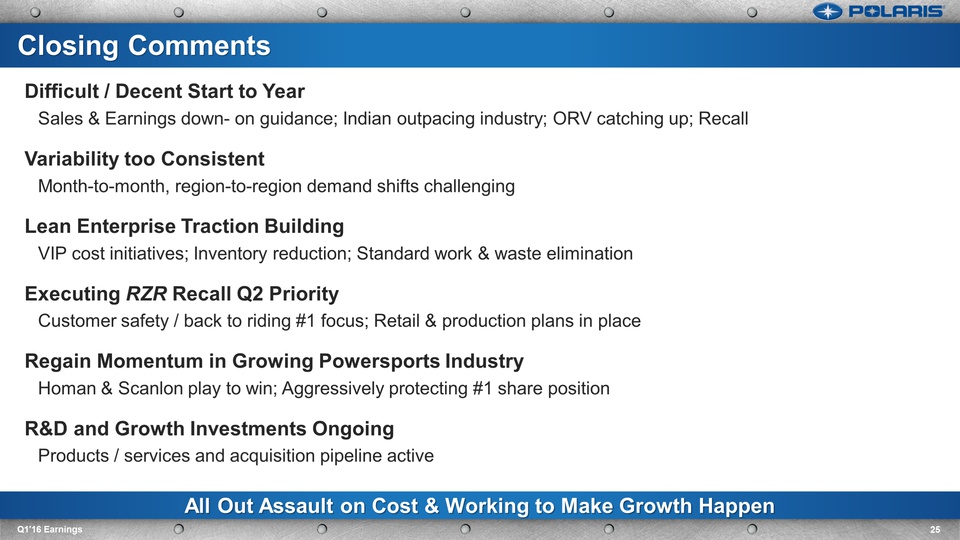
Difficult / Decent Start to YearSales & Earnings down- on guidance; Indian outpacing industry; ORV catching up; RecallVariability too ConsistentMonth-to-month, region-to-region demand shifts challenging Lean Enterprise Traction Building VIP cost initiatives; Inventory reduction; Standard work & waste elimination Executing RZR Recall Q2 PriorityCustomer safety / back to riding #1 focus; Retail & production plans in placeRegain Momentum in Growing Powersports Industry Homan & Scanlon play to win; Aggressively protecting #1 share positionR&D and Growth Investments OngoingProducts / services and acquisition pipeline active All Out Assault on Cost & Working to Make Growth Happen 25 Q1'16 Earnings Closing Comments
Thank You Questions?