Attached files
| file | filename |
|---|---|
| 8-K - FORM 8-K - EQUITY BANCSHARES INC | d176581d8k.htm |
| EX-99.1 - EX-99.1 - EQUITY BANCSHARES INC | d176581dex991.htm |
Q1 Results Presentation April 22, 2016 Exhibit 99.2
Disclaimers This presentation has been prepared by Equity Bancshares, Inc. (“Equity” or “EQBK” or the “Company”) solely for informational purposes based on its own information, as well as information from public sources. This presentation has been prepared to assist interested parties in making their own evaluation of EQBK and does not purport to contain all of the information that may be relevant. In all cases, interested parties should conduct their own investigation and analysis of EQBK and should review the “Risk Factors” in EQBK’s Annual Report on Form 10-K filed with the Securities and Exchange Commission on March 17, 2016 and any updates to those risk factors set forth in EQBK’s subsequent Quarterly Reports on Form 10-Q or Current Reports on Form 8-K. This presentation does not constitute an offer to sell, nor a solicitation of an offer to buy, any securities of EQBK by any person in any jurisdiction in which it is unlawful for such person to make such an offering or solicitation. Neither the Securities and Exchange Commission nor any other regulatory body has approved or disapproved of the securities of EQBK or passed upon the accuracy or adequacy of this presentation. Any representation to the contrary is a criminal offense. Except as otherwise stated, all data in this presentation is presented as of March 31, 2016. The delivery of this presentation shall not, under any circumstances, create any implication that there has been no change in the affairs of the Company after March 31, 2016. Market data used in this presentation has been obtained from independent industry sources and publications as well as from research reports prepared for other purposes. Industry publications and surveys and forecasts generally state that the information contained therein has been obtained from sources believed to be reliable. EQBK has not independently verified the data obtained from these sources. Forward-looking information obtained from these sources is subject to the same qualifications and the additional uncertainties regarding the other forward-looking statements in this presentation. FORWARD LOOKING STATEMENTS From time to time, EQBK may make forward-looking statements that reflect the Company’s views with respect to, among other things, projected growth, future financial performance, and management’s long-term performance goals. Words such as “may,” “should,” “could,” “predict,” “potential,” “believe,” “will likely result,” “expect,” “continue,” “will,” “anticipate,” “seek,” “estimate,” “intend,” “plan,” “projection,” “would” and “outlook,” or the negative version of those words or other comparable words are intended to identify forward-looking statements, but are not the exclusive means of identifying such statements. These forward-looking statements are not historical facts, and are based on current expectations, estimates and projections about the Company’s industry and its business, management’s beliefs and certain assumptions made by management, many of which, by their nature, are inherently uncertain and beyond the Company’s control. Accordingly, you are cautioned that any such forward-looking statements are not guarantees of future performance and are subject to certain risks, uncertainties and assumptions that are difficult to predict. Although the Company believes that the expectations reflected in such forward-looking statements are reasonable as of the date made, actual results may prove to be materially different from the expected results expressed or implied by such forward-looking statements. Any forward-looking statement speaks only as of the date on which it was made, and unless otherwise required by law, the Company does not undertake any obligation to update or review any forward-looking statements, whether as a result of new information, future developments or otherwise. NON-GAAP FINANCIAL MEASURES This presentation contains certain non-GAAP financial measures intended to supplement, not substitute for, comparable GAAP measures. Reconciliations of non-GAAP financial measures to GAAP financial measures are provided at the end of this presentation. Numbers in the presentation may not sum due to rounding.
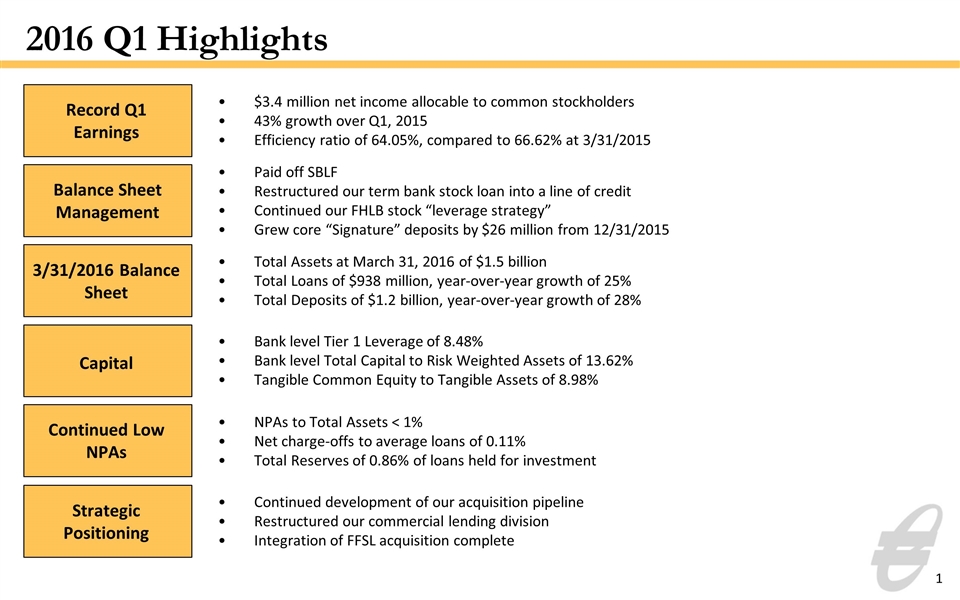
$3.4 million net income allocable to common stockholders 43% growth over Q1, 2015 Efficiency ratio of 64.05%, compared to 66.62% at 3/31/2015 1 Paid off SBLF Restructured our term bank stock loan into a line of credit Continued our FHLB stock “leverage strategy” Grew core “Signature” deposits by $26 million from 12/31/2015 Total Assets at March 31, 2016 of $1.5 billion Total Loans of $938 million, year-over-year growth of 25% Total Deposits of $1.2 billion, year-over-year growth of 28% Bank level Tier 1 Leverage of 8.48% Bank level Total Capital to Risk Weighted Assets of 13.62% Tangible Common Equity to Tangible Assets of 8.98% NPAs to Total Assets < 1% Net charge-offs to average loans of 0.11% Total Reserves of 0.86% of loans held for investment 2016 Q1 Highlights Balance Sheet Management Continued development of our acquisition pipeline Restructured our commercial lending division Integration of FFSL acquisition complete Record Q1 Earnings 3/31/2016 Balance Sheet Capital Continued Low NPAs Strategic Positioning
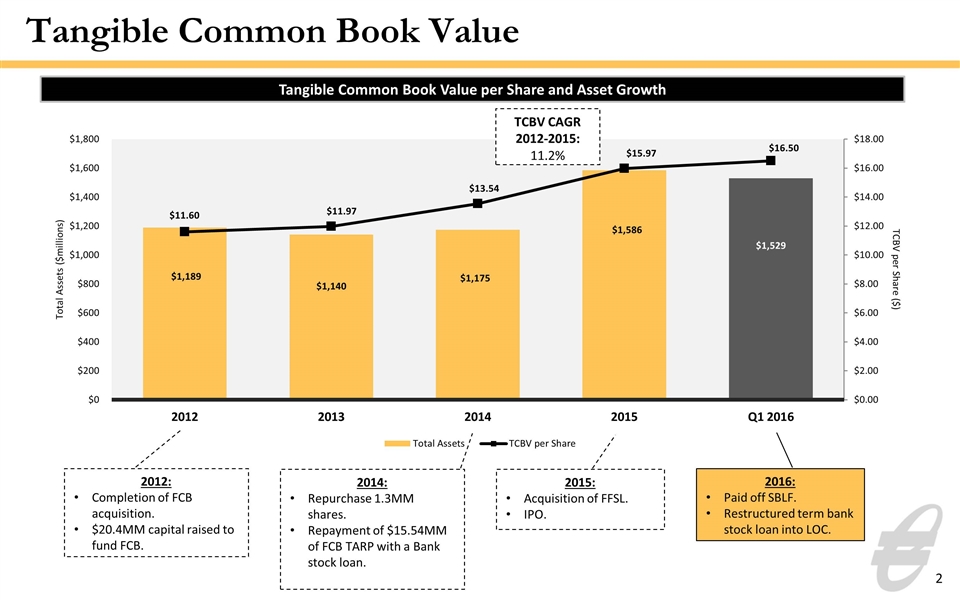
Tangible Common Book Value 2 Tangible Common Book Value per Share and Asset Growth 2012: Completion of FCB acquisition. $20.4MM capital raised to fund FCB. 2014: Repurchase 1.3MM shares. Repayment of $15.54MM of FCB TARP with a Bank stock loan. 2015: Acquisition of FFSL. IPO. TCBV CAGR 2012-2015: 11.2% 2016: Paid off SBLF. Restructured term bank stock loan into LOC.
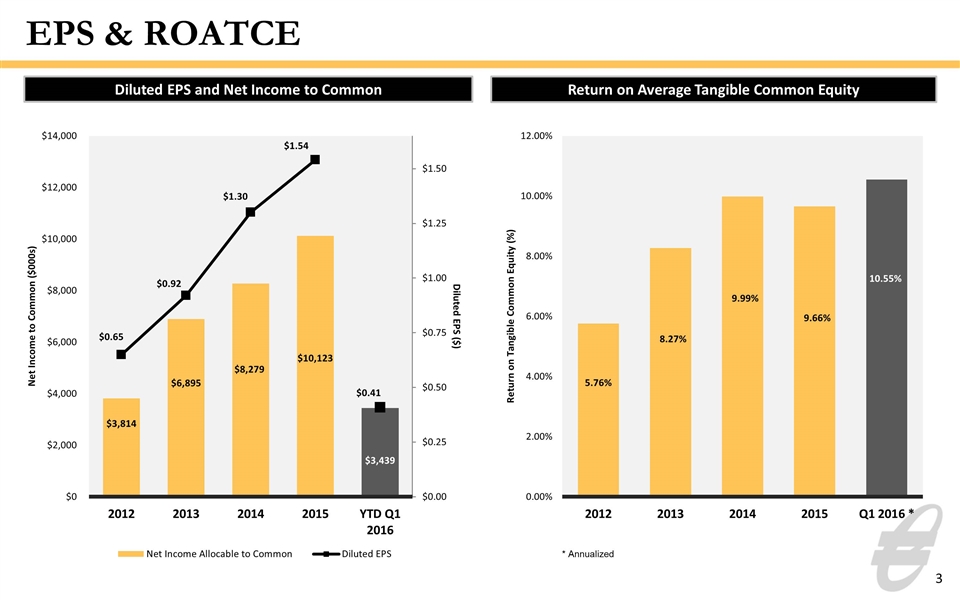
EPS & ROATCE Diluted EPS and Net Income to Common Return on Average Tangible Common Equity 3 * Annualized
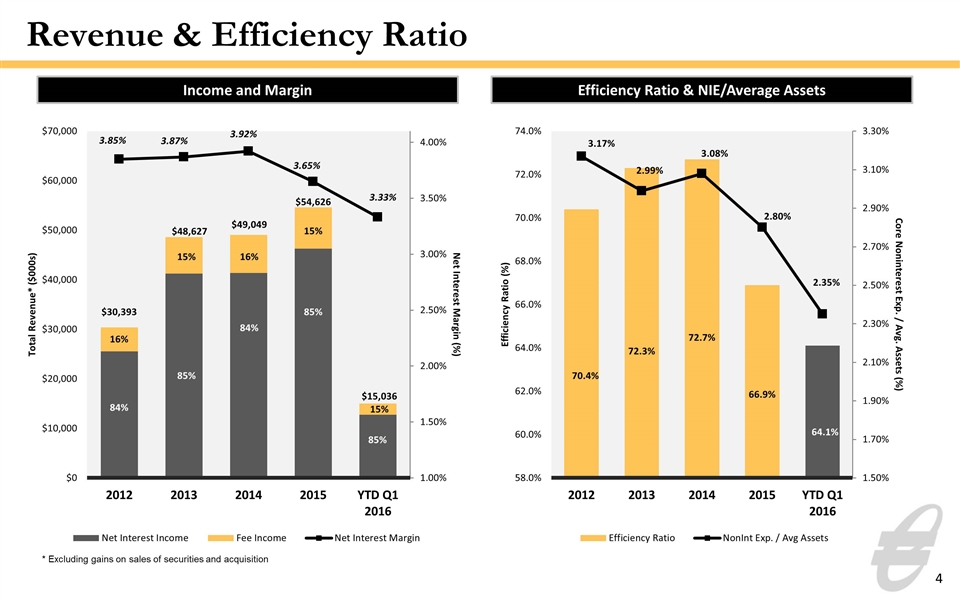
Revenue & Efficiency Ratio Efficiency Ratio & NIE/Average Assets Income and Margin 4 84% 85% 84% 85% 85% 16% 15% 16% 15% 15% $30,393 $48,627 $49,049 $54,626 $15,036 * Excluding gains on sales of securities and acquisition
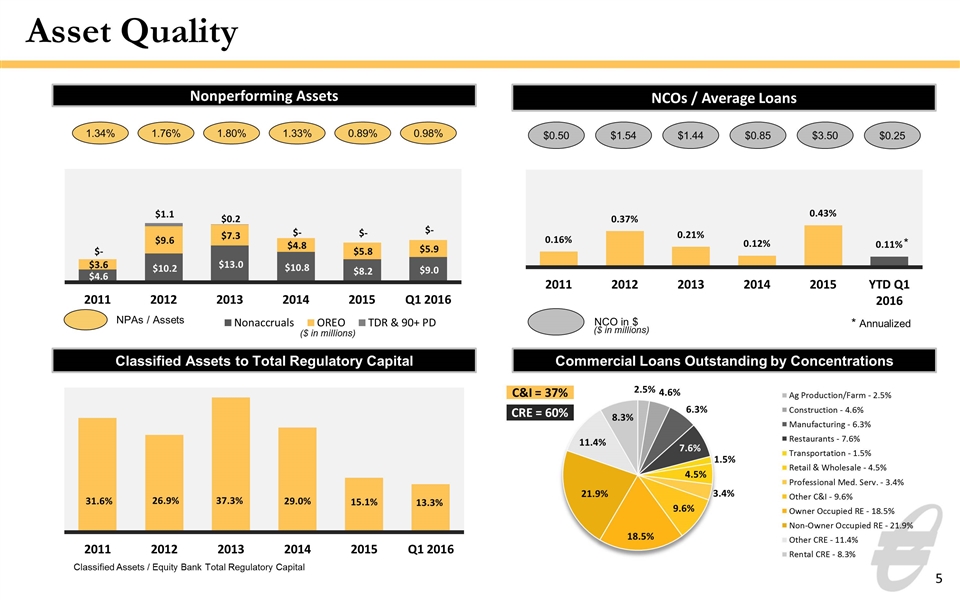
Asset Quality 5 Nonperforming Assets 1.34% 1.76% 1.80% 1.33% NPAs / Assets 0.89% NCOs / Average Loans $0.50 $1.54 $1.44 $0.85 $3.50 NCO in $ ($ in millions) Commercial Loans Outstanding by Concentrations Classified Assets to Total Regulatory Capital CRE = 60% C&I = 37% ($ in millions) Classified Assets / Equity Bank Total Regulatory Capital $0.25 0.98% * * Annualized
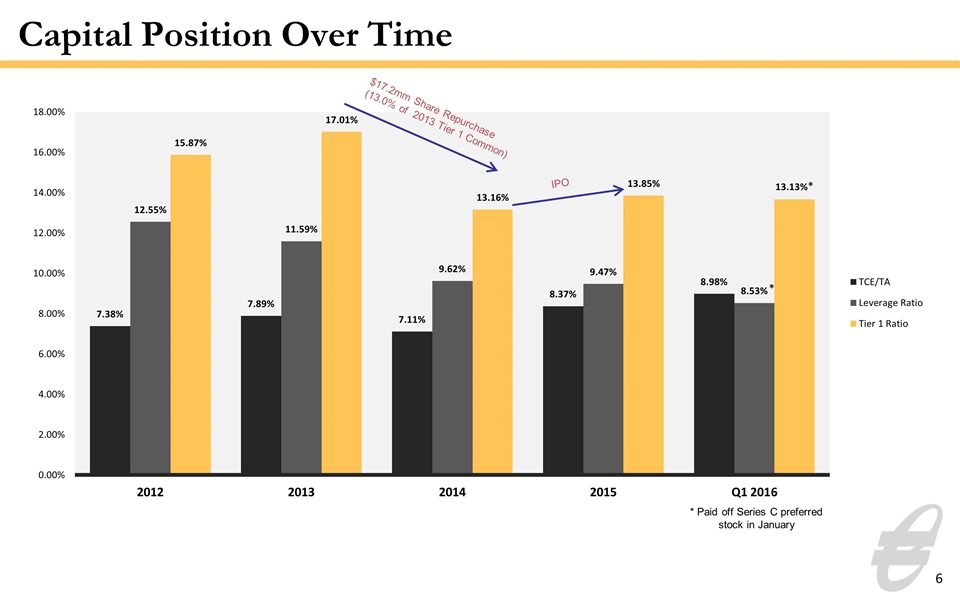
Capital Position Over Time $17.2mm Share Repurchase (13.0% of 2013 Tier 1 Common) 6 IPO * Paid off Series C preferred stock in January
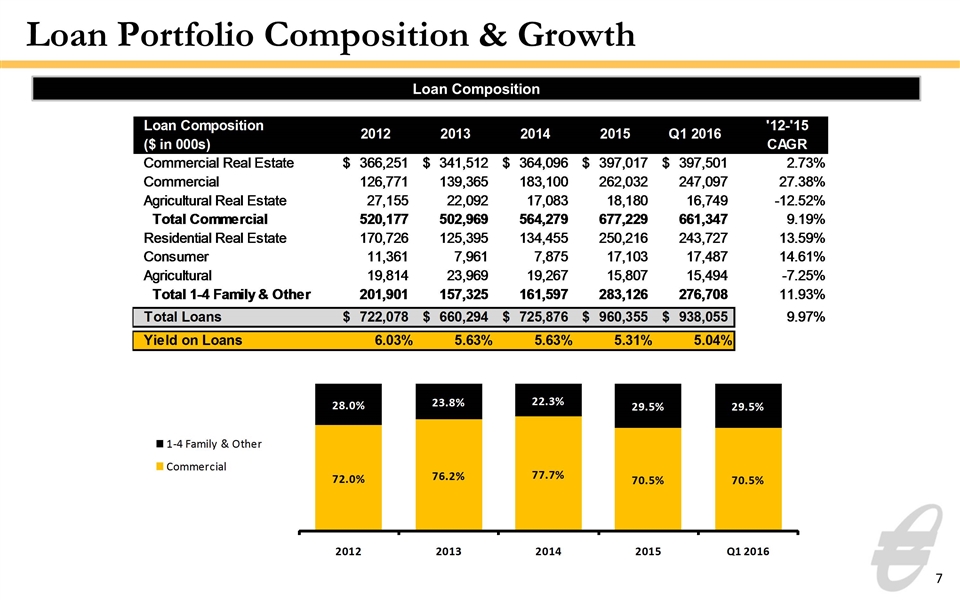
Loan Portfolio Composition & Growth Loan Composition 7 Loan Composition Loan Composition 2012 2013 2014 2015 Q1 2016 '12-'15CAGR ($ in 000s) Commercial Real Estate $,366,251 $,341,512 $,364,096 $,397,017 $,397,501 2.7251446328598883E-2 Commercial ,126,771 ,139,365 ,183,100 ,262,032 ,247,097 0.27382999733306268 Agricultural Real Estate 27,155 22,092 17,083 18,180 16,749 -0.12518808286802907 Total Commercial ,520,177 ,502,969 ,564,279 ,677,229 ,661,347 9.1930005950108029E-2 Residential Real Estate ,170,726 ,125,395 ,134,455 ,250,216 ,243,727 0.13589573957287149 Consumer 11,361 7,961 7,875 17,103 17,487 0.14608961850827096 Agricultural 19,814 23,969 19,267 15,807 15,494 -7.2545886974953344E-2 Total 1-4 Family & Other ,201,901 ,157,325 ,161,597 ,283,126 ,276,708 0.11930152234123081 Total Loans $,722,078 $,660,294 $,725,876 $,960,355 $,938,055 9.9721112781955279E-2 Yield on Loans 6.0299999999999999E-2 5.6300000000000003E-2 5.6300000000000003E-2 5.3100000000000001E-2 5.04E-2 Loan Composition 2012 2013 2014 2015 Q1 2016 Commercial 0.72038893305155394 0.76173492413985289 0.77737657671558225 0.70518610305564089 0.70501942849832899 1-4 Family & Other 0.27961106694844601 0.23826507586014714 0.22262342328441773 0.29481389694435911 0.29498057150167101
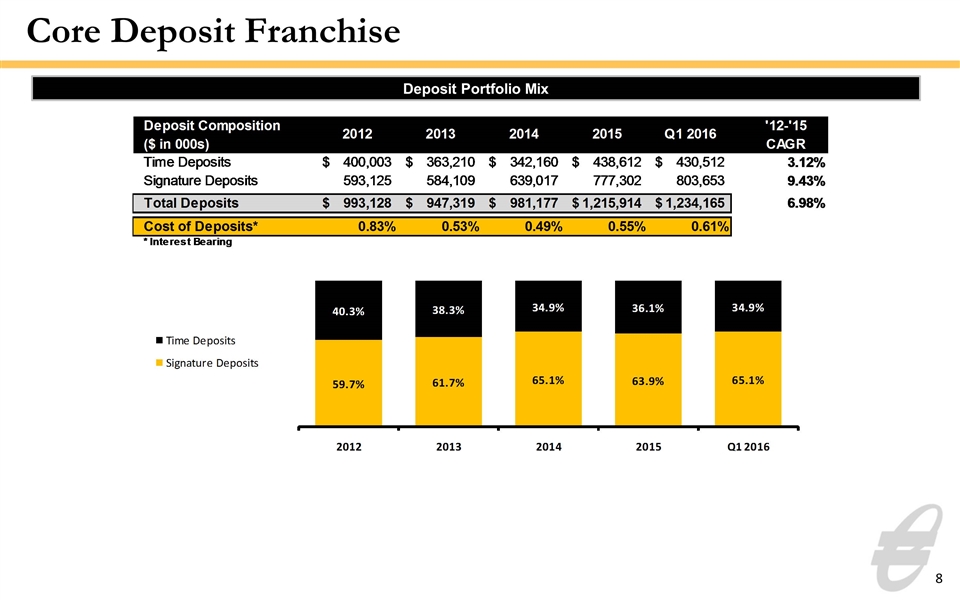
Core Deposit Franchise Deposit Portfolio Mix 8 Deposit Portfolio Mix Deposit Composition 2012 2013 2014 2015 Q1 2016 '12-'15CAGR ($ in 000s) Time Deposits $,400,003 $,363,210 $,342,160 $,438,612 $,430,512 3.1190935923231189E-2 Signature Deposits ,593,125 ,584,109 ,639,017 ,777,302 ,803,653 9.4328857637255847E-2 Total Deposits $,993,128 $,947,319 $,981,177 $1,215,914 $1,234,165 6.9791667339436758E-2 Cost of Deposits* 8.3000000000000001E-3 5.3E-3 4.8999999999999998E-3 5.4999999999999997E-3 6.1000000000000004E-3 * Interest Bearing Deposit Portfolio Mix 2012 2013 2014 2015 Q1 2016 Signature Deposits 0.59722915877913019 0.61659166553188527 0.65127596753694794 0.63927383022154527 0.65117143979937853 Time Deposits 0.40277084122086981 0.38340833446811473 0.348724032463052 0.36072616977845473 0.34882856020062147
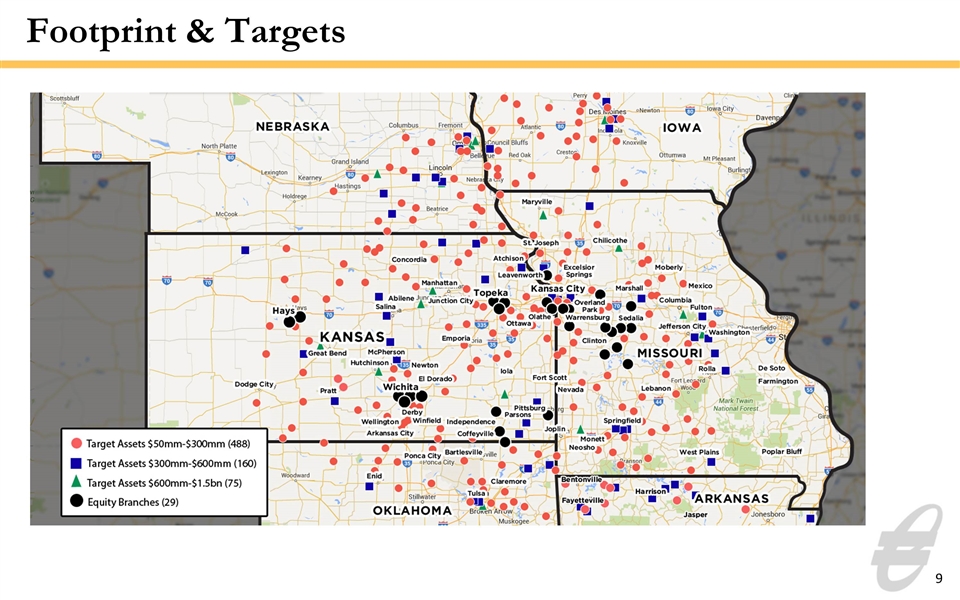
Footprint & Targets 9
Appendix 10
The subsequent tables present non-GAAP reconciliations of the following calculations: Tangible Common Equity (TCE) to Tangible Assets (TA) ratio Tangible Book Value per Common Share Return on average tangible common equity (ROATCE) Efficiency Ratio 11
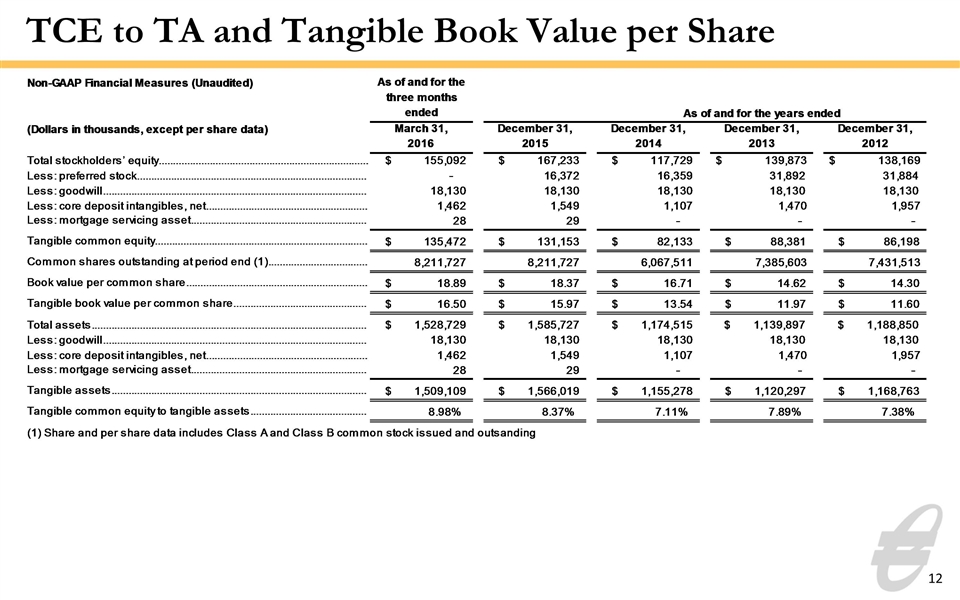
TCE to TA and Tangible Book Value per Share 12 Non-GAAP Financial Measures (Unaudited) As of and for the three months ended As of and for the years ended (Dollars in thousands, except per share data) March 31, 2016 December 31,2015 December 31,2014 December 31,2013 December 31,2012 2011 Total stockholders’ equity $,155,092 $,167,233 $,117,729 $,139,873 $,138,169 $80,816 Less: preferred stock 0 16,372 16,359 31,892 31,884 16,337 Less: goodwill 18,130 18,130 18,130 18,130 18,130 13,147 Less: core deposit intangibles, net 1,462 1,549 1,107 1,470 1,957 773 Less: mortgage servicing asset 28 29 0 0 0 0 Tangible common equity $,135,472 $,131,153 $82,133 $88,381 $86,198 $50,559 Common shares outstanding at period end (1) 8,211,727 8,211,727 6,067,511 7,385,603 7,431,513 4,550,206 Book value per common share $18.886648326229064 $18.371409570727327 $16.707015446696349 $14.620471747533681 $14.301932863469389 $14.170567222670797 Tangible book value per common share $16.497382341132383 $15.971427204046117 $13.536522636712155 $11.966660000544303 $11.598983948490705 $11.111365067867256 Total assets $1,528,729 $1,585,727 $1,174,515 $1,139,897 $1,188,850 $,609,998 Less: goodwill 18,130 18,130 18,130 18,130 18,130 13,147 Less: core deposit intangibles, net 1,462 1,549 1,107 1,470 1,957 773 Less: mortgage servicing asset 28 29 0 0 0 0 Tangible assets $1,509,109 $1,566,019 $1,155,278 $1,120,297 $1,168,763 $,596,078 Tangible common equity to tangible assets 8.976952625688403E-2 8.3749303169374067E-2 7.1093710777838756E-2 7.8890687023173325E-2 7.3751479127932701E-2 8.481943638248686E-2 (1) Share and per share data includes Class A and Class B common stock issued and outsanding Non-GAAP Financial Measures, continued (Unaudited) As of and for the three months ended As of and for the years ended (Dollars in thousands, except per share data) March 31, 2016 December 31,2015 December 31,2014 December 31,2013 December 31,2012 2011 Total average stockholders' equity $,153,929 $,137,936 $,123,174 $,137,913 $,102,032 $75,253 Less: average intangible assets and preferred stock 20,616 31,294 37,917 50,623 33,653 25,148 Average tangible common equity (1) (3) $,133,313 $,106,642 $85,257 $87,290 $68,379 $50,105 Net income allocable to common stockholders (1) 3,439 10,123 8,279 6,895 3,814 1,371 Amortization of core deposit intangible 87 275 363 487 192 182 Less: tax effect of amortization of core deposit intangible (2) -30 -96 -,127 -,166 -65 -62 Adjusted net income allocable to common stockholders $3,496 $10,302 $8,515 $7,216 $3,941 $1,491 Return on average tangible common equity (ROATCE) 0.10547234826937482 9.6603589580090396E-2 9.98744971087418E-2 8.2666972161759653E-2 5.7634653914213428E-2 2.9757509230615709E-2 Non-interest expense $9,689 $38,575 $35,645 $35,137 $22,900 $15,918 Less: merger expenses 0 1,691 0 0 1,519 0 Less: loss on debt extinguishment 58 316 0 0 0 0 Non-interest expense, excluding merger expenses and loss on debt extinguishment $9,631 $36,568 $35,645 $35,137 $21,381 $15,918 Net interest income $12,758 $46,262 $41,361 $41,235 $25,570 $17,890 Non-interest income $2,697 $9,802 $8,674 $7,892 $4,826 $2,252 Less: net gains on sales and settlement of securities 420 756 986 500 3 425 Less: net gain on acquisition 0 682 0 0 0 0 Non-interest income, excluding net gains on sales and settlement of securities and net gain on acquisition $2,277 $8,364 $7,688 $7,392 $4,823 $1,827 Efficiency ratio 0.64057199866977055 0.6694248160216747 0.72672225733450224 0.72258210459209904 0.70348435495015305 0.8073236293553786 ____________________ (1) Share and per share data includes Class A and Class B common stock issued and outsanding (2) Tax rates used in this calculation were 35% for 2015 and 2014 and 34% for 2013, 2012, and 2011 (3) All periods disclosed were calculated using a simple average of tangible common equity
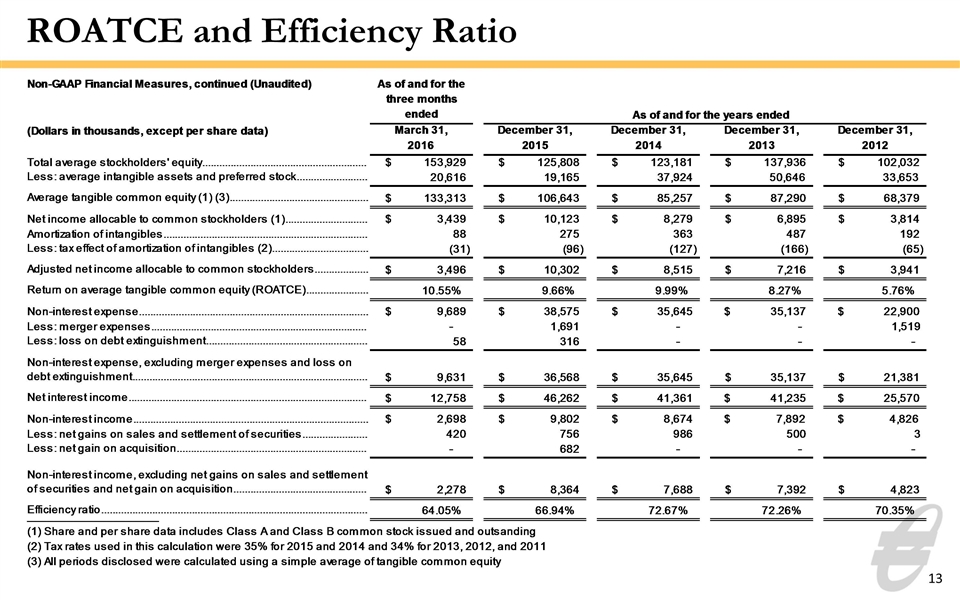
ROATCE and Efficiency Ratio 13 Non-GAAP Financial Measures (Unaudited) Years Ended December 31, (Dollars in thousands, except per share data) 2015 2015 2014 2013 2012 2011 Total stockholders’ equity $,167,232 $,167,232 $,117,729 $,139,873 $,138,169 $80,816 Less: preferred stock 16,372 16,372 16,359 31,892 31,884 16,337 Less: goodwill 18,130 18,130 18,130 18,130 18,130 13,147 Less: core deposit intangibles, net 1,549 1,549 1,107 1,470 1,957 773 Less: mortgage servicing asset 29 29 0 0 0 0 Tangible common equity $,131,152 $,131,152 $82,133 $88,381 $86,198 $50,559 Common shares outstanding at period end (1) 8,211,727 8,211,727 6,067,511 7,385,603 7,431,513 4,550,206 Book value per common share $18.371287793663868 $18.371287793663868 $16.707015446696349 $14.620471747533681 $14.301932863469389 $14.170567222670797 Tangible book value per common share $15.971305426982656 $15.971305426982656 $13.536522636712155 $11.966660000544303 $11.598983948490705 $11.111365067867256 Total assets $1,585,727 $1,585,727 $1,174,515 $1,139,897 $1,188,850 $,609,998 Less: goodwill 18,130 18,130 18,130 18,130 18,130 13,147 Less: core deposit intangibles, net 1,549 1,549 1,107 1,470 1,957 773 Less: mortgage servicing asset 29 29 0 0 0 0 Tangible assets $1,566,019 $1,566,019 $1,155,278 $1,120,297 $1,168,763 $,596,078 Tangible common equity to tangible assets 8.3748664607517537E-2 8.3748664607517537E-2 7.1093710777838756E-2 7.8890687023173325E-2 7.3751479127932701E-2 8.481943638248686E-2 (1) Share and per share data includes Class A and Class B common stock issued and outsanding (2) Tax rates used in this calculation were 35% for 2015 and 2014 and 34% for 2013, 2012, and 2011 (3) All periods disclosed were calculated using a simple average of tangible common equity Non-GAAP Financial Measures, continued (Unaudited) As of and for the three months ended As of and for the years ended (Dollars in thousands, except per share data) March 31, 2016 December 31,2015 December 31,2014 December 31,2013 December 31,2012 2011 Total average stockholders' equity $,153,929 $,125,808 $,123,181 $,137,936 $,102,032 $75,253 Less: average intangible assets and preferred stock 20,616 19,165 37,924 50,646 33,653 25,148 Average tangible common equity (1) (3) $,133,313 $,106,643 $85,257 $87,290 $68,379 $50,105 Net income allocable to common stockholders (1) $3,439 $10,123 $8,279 $6,895 $3,814 1,371 Amortization of intangibles 88 275 363 487 192 182 Less: tax effect of amortization of intangibles (2) -31 -96 -,127 -,166 -65 -62 Adjusted net income allocable to common stockholders $3,496 $10,302 $8,515 $7,216 $3,941 $1,491 Return on average tangible common equity (ROATCE) 0.10547234826937482 9.6602683720450472E-2 9.98744971087418E-2 8.2666972161759653E-2 5.7634653914213428E-2 2.98E-2 Non-interest expense $9,689 $38,575 $35,645 $35,137 $22,900 $15,918 Less: merger expenses 0 1,691 0 0 1,519 - Less: loss on debt extinguishment 58 316 0 0 0 - Non-interest expense, excluding merger expenses and loss on debt extinguishment $9,631 $36,568 $35,645 $35,137 $21,381 $15,918 Net interest income $12,758 $46,262 $41,361 $41,235 $25,570 $17,890 Non-interest income $2,698 $9,802 $8,674 $7,892 $4,826 $2,252 Less: net gains on sales and settlement of securities 420 756 986 500 3 425 Less: net gain on acquisition 0 682 0 0 0 - Non-interest income, excluding net gains on sales and settlement of securities and net gain on acquisition $2,278 $8,364 $7,688 $7,392 $4,823 $1,827 Efficiency ratio 0.64052939611598825 0.6694248160216747 0.72672225733450224 0.72258210459209904 0.70348435495015305 0.80730000000000002 ____________________ (1) Share and per share data includes Class A and Class B common stock issued and outsanding (2) Tax rates used in this calculation were 35% for 2015 and 2014 and 34% for 2013, 2012, and 2011 (3) All periods disclosed were calculated using a simple average of tangible common equity
