Attached files
| file | filename |
|---|---|
| EX-99.3 - TRUEBLUE INVESTOR PRESENTATION - TrueBlue, Inc. | investorroadshowpresenta.htm |
| 8-K - TRUEBLUE FORM 8-K - TrueBlue, Inc. | tbi2016q1pressrelease.htm |
| EX-99.1 - TRUEBLUE Q1 2016 PRESS RELEASE - TrueBlue, Inc. | tbi2016q1pressreleaseexhib.htm |

Q 1 2 0 1 6 E a r n i n g s R e s u l t s

Forward-Looking Statement Certain statements made by us in this presentation that are not historical facts or that relate to future plans, events or performances are forward-looking statements that reflect management’s current outlook for future periods, including statements regarding future financial performance. These forward-looking statements are based upon our current expectations, and our actual results may differ materially from those described or contemplated in the forward–looking statements. Factors that may cause our actual results to differ materially from those contained in the forward-looking statements, include without limitation the following: 1) national and global economic conditions, including the impact of changes in national and global credit markets and other changes that affect our customers; 2) our ability to continue to attract and retain customers and maintain profit margins in the face of new and existing competition; 3) new laws and regulations that could have a materially adverse effect on our operations and financial results; 4) increased costs and collateral requirements in connection with our insurance obligations, including workers’ compensation insurance; 5) our continuing ability to comply with the financial covenants of our credit agreement; 6) our ability to attract and retain qualified employees in key positions or to find temporary and permanent employees with the right skills to fulfill the needs of our customers; 7) our ability to successfully complete and integrate acquisitions that we may make; and 8) other risks described in our most recent filings with the Securities and Exchange Commission. Use of estimates and forecasts: Any references made to fiscal 2016 are based on management guidance issued April 20, 2016, and are included for informational purposes only. We assume no obligation to update or revise any forward-looking statement, whether as a result of new information, future events, or otherwise, except as required by law. Any other reference to future financial estimates are included for informational purposes only and subject to risk factors discussed in our most recent filings with the Securities Exchange Commission. Financial Comparisons All comparisons are to prior year periods unless stated otherwise. Q1 2016 Earnings Results | April 20, 2016 2

Q1 2016 Highlights • Slower pace of organic revenue growth: o Slower growth with large customers o Acceleration with small to mid-sized customers o Continued strength in construction; drop in retail industry growth • Gross margin compression (excluding impact of acquisitions and sales mix): o Shrinking supply of workers driving higher wages o Customers more cost conscious • Recent acquisitions1 performing better than expected • Adjusted EBITDA2 up 9% 3 Q1 2016 Earnings Results | April 20, 2016 1 SIMOS Insourcing Solutions (“SIMOS”) was acquired on December 1, 2015 and is now part of the Staffing Services segment. The Recruitment Process Outsourcing (“RPO”) division of Aon Hewitt was acquired on January 4, 2016 and is now part of PeopleScout (TrueBlue’s RPO business) within the Managed Services Segment. 2 See Appendix for definitions of non-GAAP financial terms.

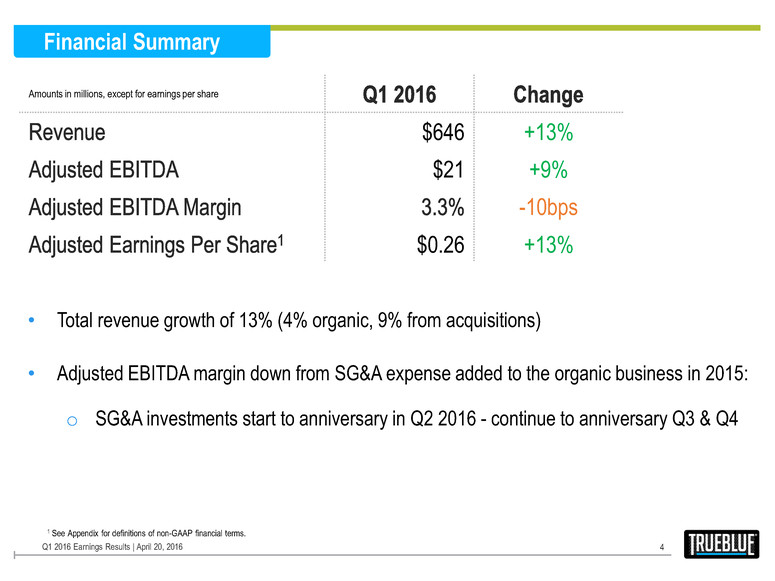
Financial Summary 4 Amounts in millions, except for earnings per share $646 +13% $21 +9% -10bps $0.26 +13% • Total revenue growth of 13% (4% organic, 9% from acquisitions) • Adjusted EBITDA margin down from SG&A expense added to the organic business in 2015: o SG&A investments start to anniversary in Q2 2016 - continue to anniversary Q3 & Q4 Q1 2016 Earnings Results | April 20, 2016 1 See Appendix for definitions of non-GAAP financial terms.

5 Gross Margin and SG&A Bridges 22.6% 23.3% 0.9% 0.3% 0.5% Q1 2015 Acquisitions Revenue Mix Higher Pay / Other Q1 2016 Q1 2016 Earnings Results | April 20, 2016 $112 $131 $9 $10 Q1 2015 Acquisitions Organic Business Q1 2016 SG&A Amounts in millions Gross Margin

Staffing Services Segment1 6 Amounts in millions $602 +10% $20 -20% -120bps • Year-over-year revenue growth of 10% (3% organic) o Step-down in organic revenue growth driven by large customers (flat growth) o Growth of about 10% in small to medium-sized customers and construction o Drop in retail industry growth (flat growth) • SIMOS acquisition meeting expectation • Adjusted EBITDA margin lower due to challenges in passing traditional mark-up on rising wages through to customers and SG&A expense rising faster than revenue Q1 2016 Earnings Results | April 20, 2016 1 Staffing Services includes all contingent labor businesses.

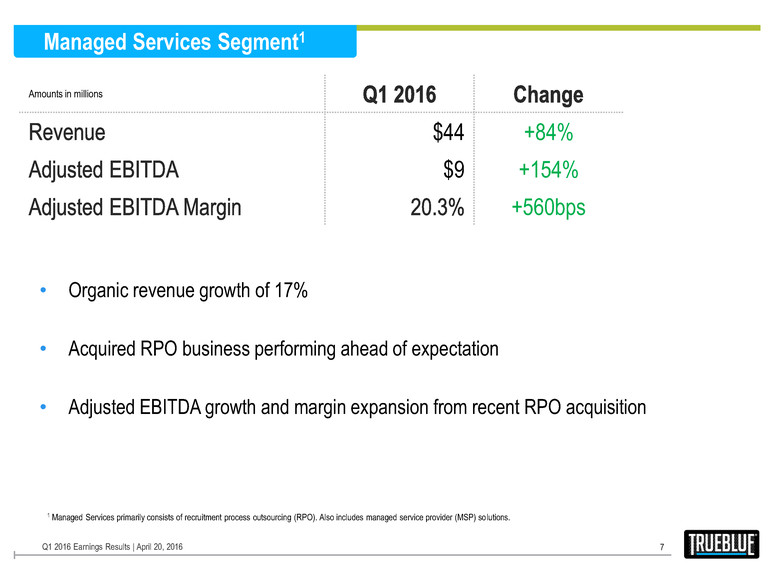
Managed Services Segment1 7 Amounts in millions $44 +84% $9 +154% +560bps • Organic revenue growth of 17% • Acquired RPO business performing ahead of expectation • Adjusted EBITDA growth and margin expansion from recent RPO acquisition Q1 2016 Earnings Results | April 20, 2016 1 Managed Services primarily consists of recruitment process outsourcing (RPO). Also includes managed service provider (MSP) solutions.

30% 31% 23% 2014 2015 Q1 2016 $180 $216 $144 $202 $246 $166 2014 2015 Q1 2016 Cash Net Debt Total Debt Liquidity Debt to Total Capital Amounts in millions Amounts in millions 8 Debt and Liquidity Highlights $101 $77 $93 $21 $30 $22 $123 $107 $115 2014 2015 Q1 2016 Cash Borrowing Availability Q1 2016 Earnings Results | April 20, 2016 Note: Balances as of fiscal period end. Figures on this page may not sum due to rounding.


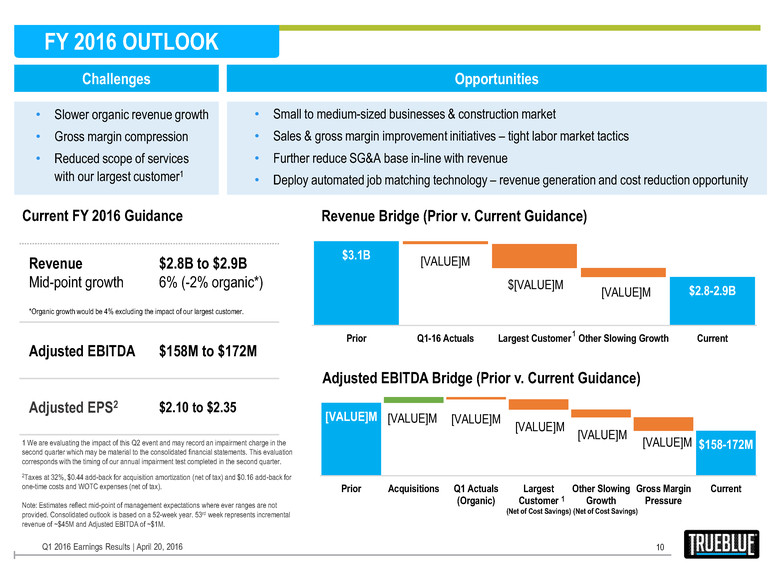
1 We are evaluating the impact of this Q2 event and may record an impairment charge in the second quarter which may be material to the consolidated financial statements. This evaluation corresponds with the timing of our annual impairment test completed in the second quarter. 2Taxes at 32%, $0.44 add-back for acquisition amortization (net of tax) and $0.16 add-back for one-time costs and WOTC expenses (net of tax). Note: Estimates reflect mid-point of management expectations where ever ranges are not provided. Consolidated outlook is based on a 52-week year. 53rd week represents incremental revenue of ~$45M and Adjusted EBITDA of ~$1M. • Small to medium-sized businesses & construction market • Sales & gross margin improvement initiatives – tight labor market tactics • Further reduce SG&A base in-line with revenue • Deploy automated job matching technology – revenue generation and cost reduction opportunity $3.1B $2.8-2.9B [VALUE]M $[VALUE]M [VALUE]M Prior Q1-16 Actuals Largest Customer Other Slowing Growth Current [VALUE]M $158-172M [VALUE]M [VALUE]M [VALUE]M [VALUE]M [VALUE]M Prior Acquisitions Q1 Actuals (Organic) Largest Customer Other Slowing Growth Gross Margin Pressure Current Revenue Mid-point growth $2.8B to $2.9B 6% (-2% organic*) *Organic growth would be 4% excluding the impact of our largest customer. Adjusted EBITDA $158M to $172M Adjusted EPS2 $2.10 to $2.35 FY 2016 OUTLOOK 10 Challenges Opportunities • Slower organic revenue growth • Gross margin compression • Reduced scope of services with our largest customer1 Current FY 2016 Guidance Revenue Bridge (Prior v. Current Guidance) Adjusted EBITDA Bridge (Prior v. Current Guidance) 1 1 (Net of Cost Savings) (Net of Cost Savings) Q1 2016 Earnings Results | April 20, 2016

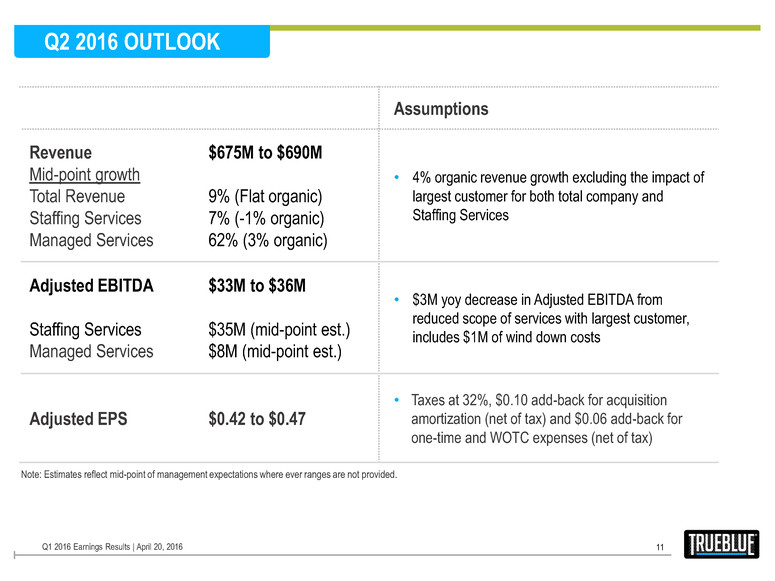
Assumptions Revenue Mid-point growth Total Revenue Staffing Services Managed Services $675M to $690M 9% (Flat organic) 7% (-1% organic) 62% (3% organic) • 4% organic revenue growth excluding the impact of largest customer for both total company and Staffing Services Adjusted EBITDA Staffing Services Managed Services $33M to $36M $35M (mid-point est.) $8M (mid-point est.) • $3M yoy decrease in Adjusted EBITDA from reduced scope of services with largest customer, includes $1M of wind down costs Adjusted EPS $0.42 to $0.47 • Taxes at 32%, $0.10 add-back for acquisition amortization (net of tax) and $0.06 add-back for one-time and WOTC expenses (net of tax) Q2 2016 OUTLOOK 11 Q1 2016 Earnings Results | April 20, 2016 Note: Estimates reflect mid-point of management expectations where ever ranges are not provided.

Key Takeaways Q1 2016 Earnings Results | April 20, 2016 12 Strong secular trends (demographics, talent shortage, etc.) support long-term growth prospects Demonstrated history of achieving above-market growth


EBITDA and Adjusted EBITDA are non-GAAP financial measures. EBITDA excludes interest, taxes, depreciation and amortization from net income. Adjusted EBITDA further excludes from EBITDA non-recurring costs related to acquisition and integration costs as well as Work Opportunity Tax Credit third party processing fees. EBITDA and Adjusted EBITDA are key measures used by management to evaluate performance. EBITDA and Adjusted EBITDA should not be considered measures of financial performance in isolation or as an alternative to Income from operations in the Consolidated Statements of Operations in accordance with GAAP, and may not be comparable to similarly titled measures of other companies. Adjusted net income per diluted share is a non-GAAP financial measure which excludes from net income on a per diluted share basis non-recurring costs related to acquisition and integration costs, net of tax, amortization of intangibles of acquired businesses, net of tax, accretion expense related to acquisition earn-out, net of tax, Work Opportunity Tax Credit third-party processing fees, net of tax, and adjusts income taxes to the expected ongoing effective rate. Adjusted net income per diluted share is a key measure used by management to evaluate performance and communicate comparable results. Adjusted net income per diluted share should not be considered a measure of financial performance in isolation or as an alternative to net income per diluted share in the Consolidated Statements of Operations in accordance with GAAP, and may not be comparable to similarly titled measures of other companies. See “Financials” in the Investors section of our web site at www.trueblue.com for a full reconciliation of non-GAAP financial measures to GAAP financial results. NON-GAAP TERMS AND DEFINITIONS 14 Q1 2016 Earnings Results | April 20, 2016
