Attached files
| file | filename |
|---|---|
| 8-K - 04-20-2016 8-K - TEXAS CAPITAL BANCSHARES INC/TX | a04202016-8k.htm |
| EX-99.1 - EXHIBIT 99.1 EARNINGS RELEASE - TEXAS CAPITAL BANCSHARES INC/TX | a04202016exhibit991.htm |
TCBI Q1 2016 Earnings April 20, 2016
Certain matters discussed within or in connection with these materials may contain “forward-looking statements” as defined in federal securities laws, which are subject to risks and uncertainties and are based on Texas Capital’s current estimates or expectations of future events or future results. These statements are not historical in nature and can generally be identified by such words as “believe,” “expect,” “estimate,” “anticipate,” “plan,” “may,” “will,” “intend” and similar expressions. A number of factors, many of which are beyond our control, could cause actual results to differ materially from future results expressed or implied by such forward-looking statements. These risks and uncertainties include, but are not limited to, the credit quality of our loan portfolio, general economic conditions in the United States and in our markets, including the continued impact on our customers from declines and volatility in oil and gas prices, rates of default or loan losses, volatility in the mortgage industry, the success or failure of our business strategies, future financial performance, future growth and earnings, the appropriateness of our allowance for loan losses and provision for credit losses, the impact of increased regulatory requirements and legislative changes on our business, increased competition, interest rate risk, the success or failure of new lines of business and new product or service offerings and the impact of new technologies. These and other factors that could cause results to differ materially from those described in the forward-looking statements, as well as a discussion of the risks and uncertainties that may affect our business, can be found in our Annual Report on Form 10-K and in other filings we make with the Securities and Exchange Commission. Forward-looking statements speak only as of the date of this presentation. Texas Capital is under no obligation, and expressly disclaims any obligation, to update, alter or revise its forward-looking statements, whether as a result of new information, future events or otherwise. 2
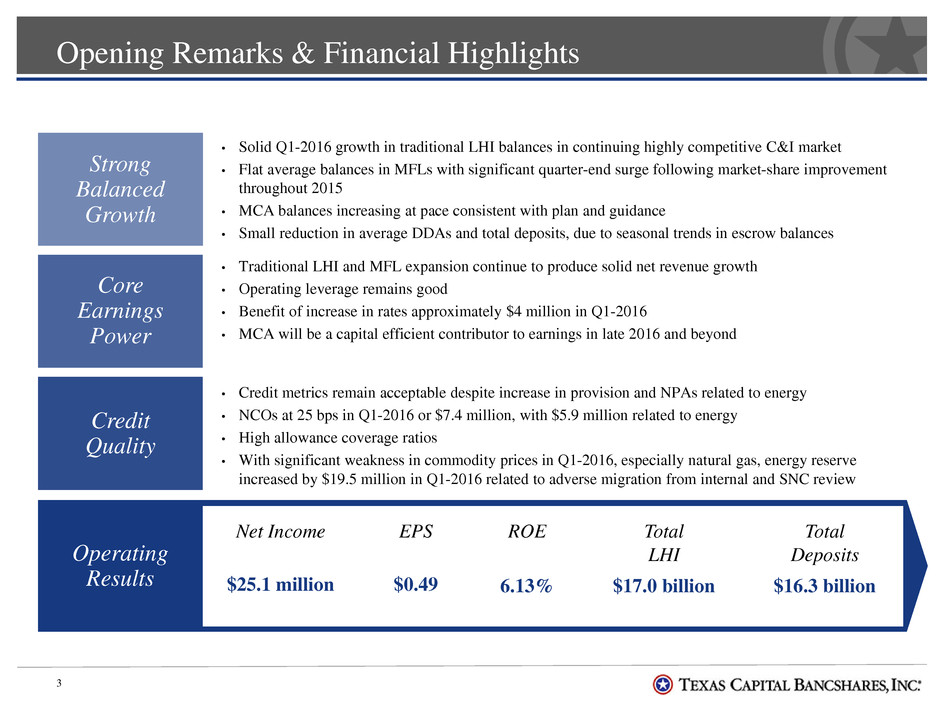
3 Opening Remarks & Financial Highlights Core Earnings Power Strong Balanced Growth Credit Quality • Solid Q1-2016 growth in traditional LHI balances in continuing highly competitive C&I market • Flat average balances in MFLs with significant quarter-end surge following market-share improvement throughout 2015 • MCA balances increasing at pace consistent with plan and guidance • Small reduction in average DDAs and total deposits, due to seasonal trends in escrow balances • Traditional LHI and MFL expansion continue to produce solid net revenue growth • Operating leverage remains good • Benefit of increase in rates approximately $4 million in Q1-2016 • MCA will be a capital efficient contributor to earnings in late 2016 and beyond • Credit metrics remain acceptable despite increase in provision and NPAs related to energy • NCOs at 25 bps in Q1-2016 or $7.4 million, with $5.9 million related to energy • High allowance coverage ratios • With significant weakness in commodity prices in Q1-2016, especially natural gas, energy reserve increased by $19.5 million in Q1-2016 related to adverse migration from internal and SNC review Operating Results Net Income $25.1 million EPS $0.49 ROE CE 6.13% Total LHI $17.0 billion Total Deposits $16.3 billion
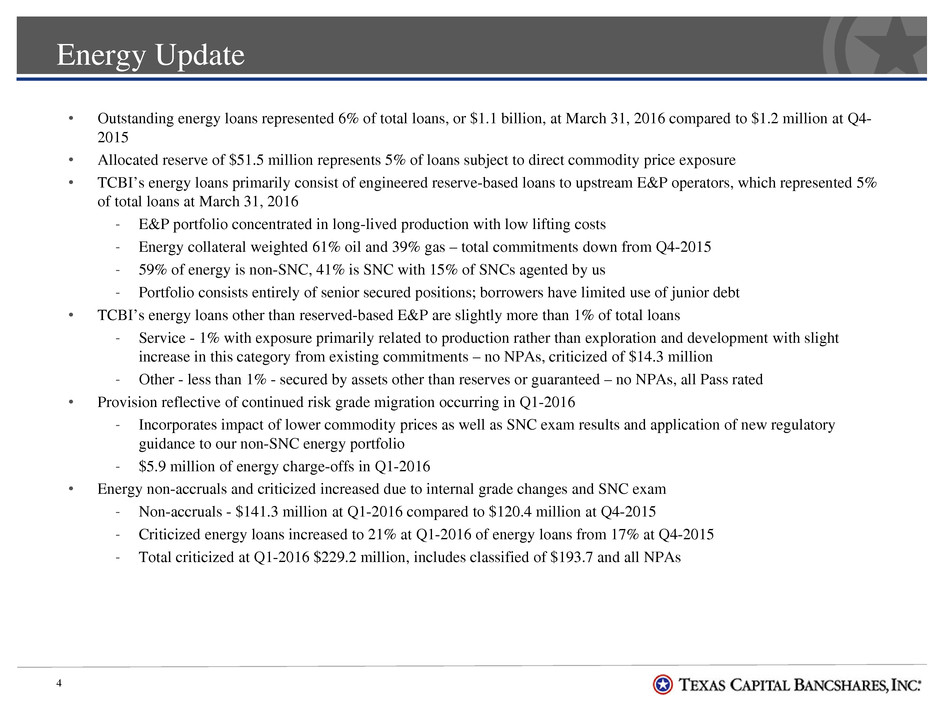
4 Energy Update • Outstanding energy loans represented 6% of total loans, or $1.1 billion, at March 31, 2016 compared to $1.2 million at Q4- 2015 • Allocated reserve of $51.5 million represents 5% of loans subject to direct commodity price exposure • TCBI’s energy loans primarily consist of engineered reserve-based loans to upstream E&P operators, which represented 5% of total loans at March 31, 2016 ‐ E&P portfolio concentrated in long-lived production with low lifting costs ‐ Energy collateral weighted 61% oil and 39% gas – total commitments down from Q4-2015 ‐ 59% of energy is non-SNC, 41% is SNC with 15% of SNCs agented by us ‐ Portfolio consists entirely of senior secured positions; borrowers have limited use of junior debt • TCBI’s energy loans other than reserved-based E&P are slightly more than 1% of total loans ‐ Service - 1% with exposure primarily related to production rather than exploration and development with slight increase in this category from existing commitments – no NPAs, criticized of $14.3 million ‐ Other - less than 1% - secured by assets other than reserves or guaranteed – no NPAs, all Pass rated • Provision reflective of continued risk grade migration occurring in Q1-2016 ‐ Incorporates impact of lower commodity prices as well as SNC exam results and application of new regulatory guidance to our non-SNC energy portfolio ‐ $5.9 million of energy charge-offs in Q1-2016 • Energy non-accruals and criticized increased due to internal grade changes and SNC exam ‐ Non-accruals - $141.3 million at Q1-2016 compared to $120.4 million at Q4-2015 ‐ Criticized energy loans increased to 21% at Q1-2016 of energy loans from 17% at Q4-2015 ‐ Total criticized at Q1-2016 $229.2 million, includes classified of $193.7 and all NPAs
5 Energy Update continued • SNC review ‐ SNC review included over 80% of our energy SNC loans, resulting in downgrade of only 4 credits representing $70.9 million or 16% of energy SNC book and 6% of total energy loans ‐ Increase in NPAs of $38.3 million ‐ No charge-offs in SNC portfolio • Borrowing bases are defined by conservative advances (generally 60% – 65%) of the NPV of expected future cash flows estimated using future prices as one of numerous inputs, including the effects of hedges ‐ Proven, non-producing collateral is given only minimal weighting in borrowing base determinations ‐ For Q1-2016 price deck, we assume Base Case oil and gas pricing of $38.50/bl oil and $2.00/mcf gas. We also sensitize the portfolio at $35.00/bl oil and $1.75/mcf gas ‐ Over time our pricing tracks the forward strip • TCBI has significant control over exposure to unfunded commitments ‐ Borrowing base determinations control obligation to lend in all E&P loans ‐ In substantial majority of portfolio, borrowing base determinations are not limited to semi-annual review ‐ Commitments represent exposure only if borrowing base will support ‐ Commodity price reductions have reduced total exposure over the last year and are likely to do so in coming months as redeterminations are completed ‐ Total of all unfunded commitments – before completion of redeterminations – is less than one-third of current outstanding energy loans ‐ Expect current redeterminations to have a substantial impact on unfunded commitments to all but most creditworthy borrowers ‐ Most important issue is exposure to unfunded commitments that would be criticized at time of any request for advance ‐ After detailed review, including results of SNC exam, unfunded commitments related to loans that are currently criticized are less than $10 million
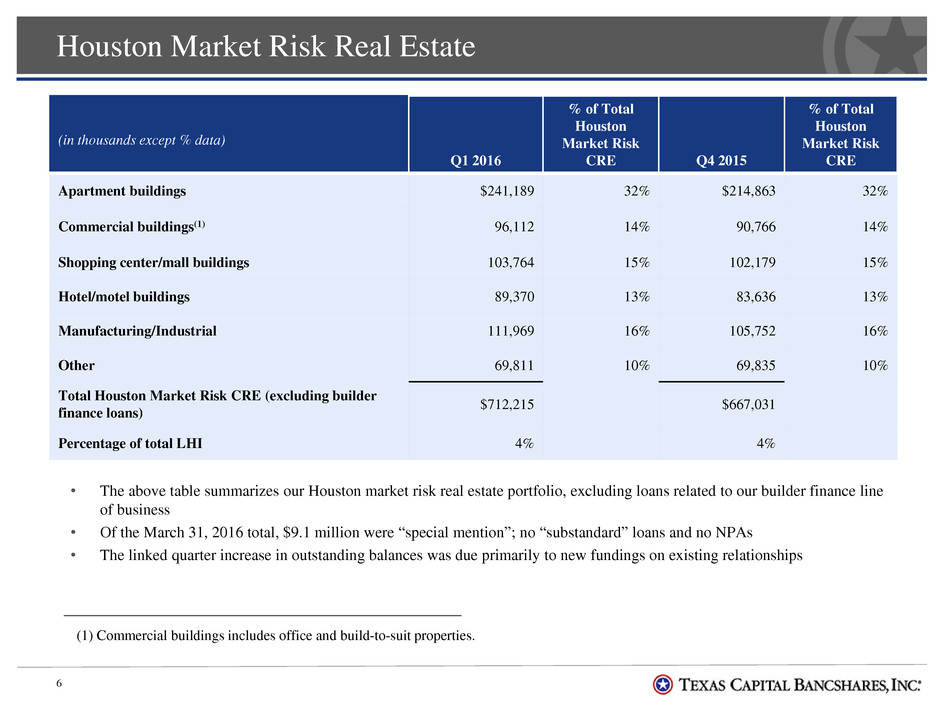
Houston Market Risk Real Estate 6 (in thousands except % data) Q1 2016 % of Total Houston Market Risk CRE Q4 2015 % of Total Houston Market Risk CRE Apartment buildings $241,189 32% $214,863 32% Commercial buildings(1) 96,112 14% 90,766 14% Shopping center/mall buildings 103,764 15% 102,179 15% Hotel/motel buildings 89,370 13% 83,636 13% Manufacturing/Industrial 111,969 16% 105,752 16% Other 69,811 10% 69,835 10% Total Houston Market Risk CRE (excluding builder finance loans) $712,215 $667,031 Percentage of total LHI 4% 4% • The above table summarizes our Houston market risk real estate portfolio, excluding loans related to our builder finance line of business • Of the March 31, 2016 total, $9.1 million were “special mention”; no “substandard” loans and no NPAs • The linked quarter increase in outstanding balances was due primarily to new fundings on existing relationships (1) Commercial buildings includes office and build-to-suit properties.
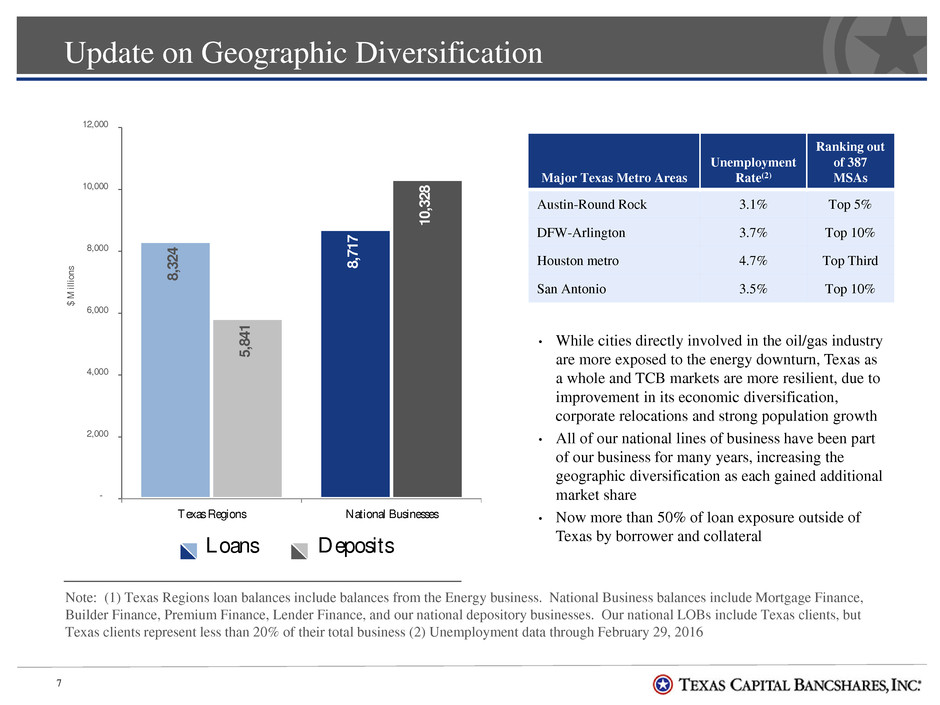
7 Update on Geographic Diversification Note: (1) Texas Regions loan balances include balances from the Energy business. National Business balances include Mortgage Finance, Builder Finance, Premium Finance, Lender Finance, and our national depository businesses. Our national LOBs include Texas clients, but Texas clients represent less than 20% of their total business (2) Unemployment data through February 29, 2016 • While cities directly involved in the oil/gas industry are more exposed to the energy downturn, Texas as a whole and TCB markets are more resilient, due to improvement in its economic diversification, corporate relocations and strong population growth • All of our national lines of business have been part of our business for many years, increasing the geographic diversification as each gained additional market share • Now more than 50% of loan exposure outside of Texas by borrower and collateral Major Texas Metro Areas Unemployment Rate(2) Ranking out of 387 MSAs Austin-Round Rock 3.1% Top 5% DFW-Arlington 3.7% Top 10% Houston metro 4.7% Top Third San Antonio 3.5% Top 10% 8, 32 4 8, 71 7 5, 84 1 10 ,3 28 - 2,000 4,000 6,000 8,000 10,000 12,000 Texas Regions National Businesses $ M ill io ns Loans Deposits
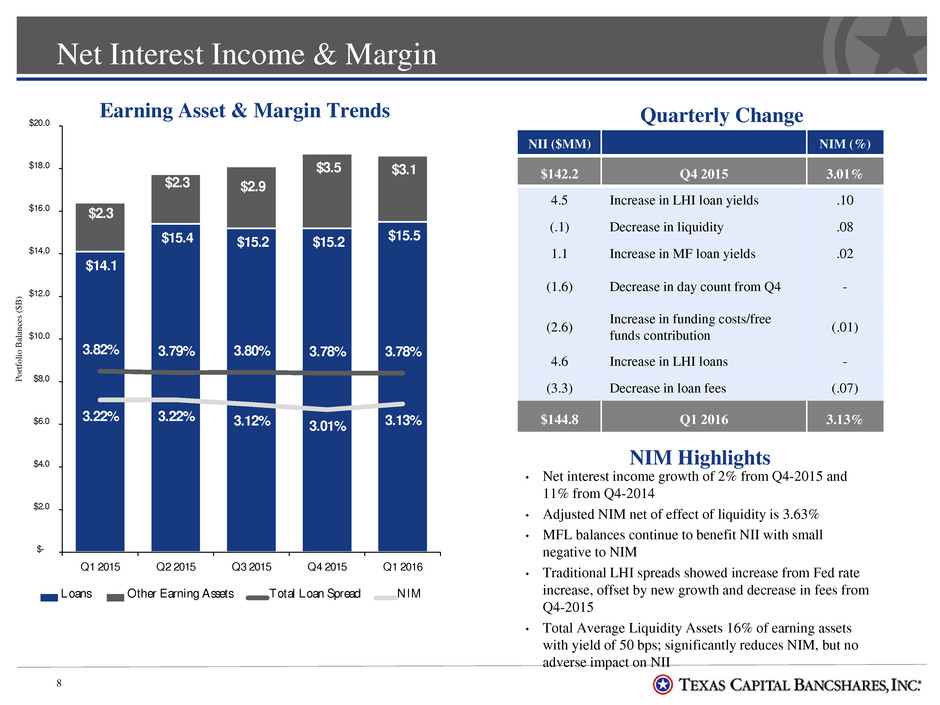
Net Interest Income & Margin 8 • Net interest income growth of 2% from Q4-2015 and 11% from Q4-2014 • Adjusted NIM net of effect of liquidity is 3.63% • MFL balances continue to benefit NII with small negative to NIM • Traditional LHI spreads showed increase from Fed rate increase, offset by new growth and decrease in fees from Q4-2015 • Total Average Liquidity Assets 16% of earning assets with yield of 50 bps; significantly reduces NIM, but no adverse impact on NII Quarterly Change NII ($MM) NIM (%) $142.2 Q4 2015 3.01% 4.5 Increase in LHI loan yields .10 (.1) Decrease in liquidity .08 1.1 Increase in MF loan yields .02 (1.6) Decrease in day count from Q4 - (2.6) Increase in funding costs/free funds contribution (.01) 4.6 Increase in LHI loans - (3.3) Decrease in loan fees (.07) $144.8 Q1 2016 3.13% NIM Highlights Earning Asset & Margin Trends $14.1 $15.4 $15.2 $15.2 $15.5 $2.3 $2.3 $2.9 $3.5 $3.1 3.82% 3.79% 3.80% 3.78% 3.78% 3.22% 3.22% 3.12% 3.01% 3.13% 0.00% 1.00% 2.00% 3.00% 4.00% 5.00% 6.00% 7.00% 8.00% 9.00% $- $2.0 $4.0 $6.0 $8.0 $10.0 $12.0 $14.0 $16.0 $18.0 $20.0 Q1 2015 Q2 2015 Q3 2015 Q4 2015 Q1 2016 P or tf ol io B al an ce s ($ B ) Loans Other Earning Assets Total Loan Spread NIM
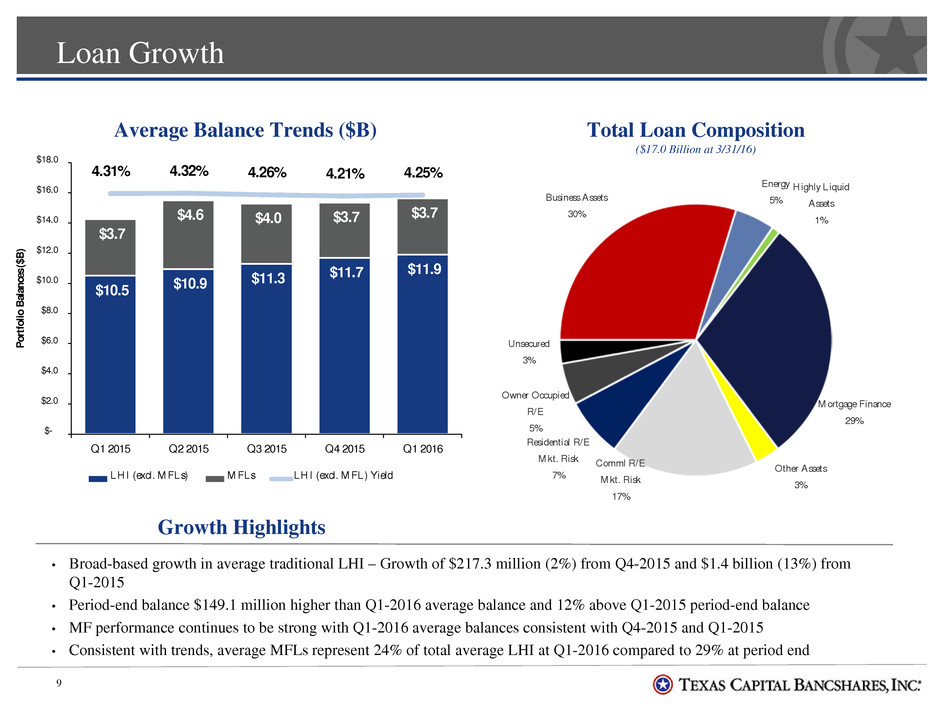
Loan Growth 9 • Broad-based growth in average traditional LHI – Growth of $217.3 million (2%) from Q4-2015 and $1.4 billion (13%) from Q1-2015 • Period-end balance $149.1 million higher than Q1-2016 average balance and 12% above Q1-2015 period-end balance • MF performance continues to be strong with Q1-2016 average balances consistent with Q4-2015 and Q1-2015 • Consistent with trends, average MFLs represent 24% of total average LHI at Q1-2016 compared to 29% at period end Growth Highlights Average Balance Trends ($B) Total Loan Composition ($17.0 Billion at 3/31/16) $10.5 $10.9 $11.3 $11.7 $11.9 $3.7 $4.6 $4.0 $3.7 $3.7 4.31% 4.32% 4.26% 4.21% 4.25% -5.00% -3.00% -1.00% 1.00% 3.00% 5.00% $- $2.0 $4.0 $6.0 $8.0 $10.0 $12.0 $14.0 $16.0 $18.0 Q1 2015 Q2 2015 Q3 2015 Q4 2015 Q1 2016 Po rt fo lio B al an ce s ( $B ) LHI (excl. M FLs) M FLs LHI (excl. M FL) Yield Business Assets 30% Energy 5% Highly L iquid Assets 1% M ortgage Finance 29% Other Assets 3% Comml R/E M kt. Risk 17% Residential R/E M kt. Risk 7% Owner Occupied R/E 5% Unsecured 3%
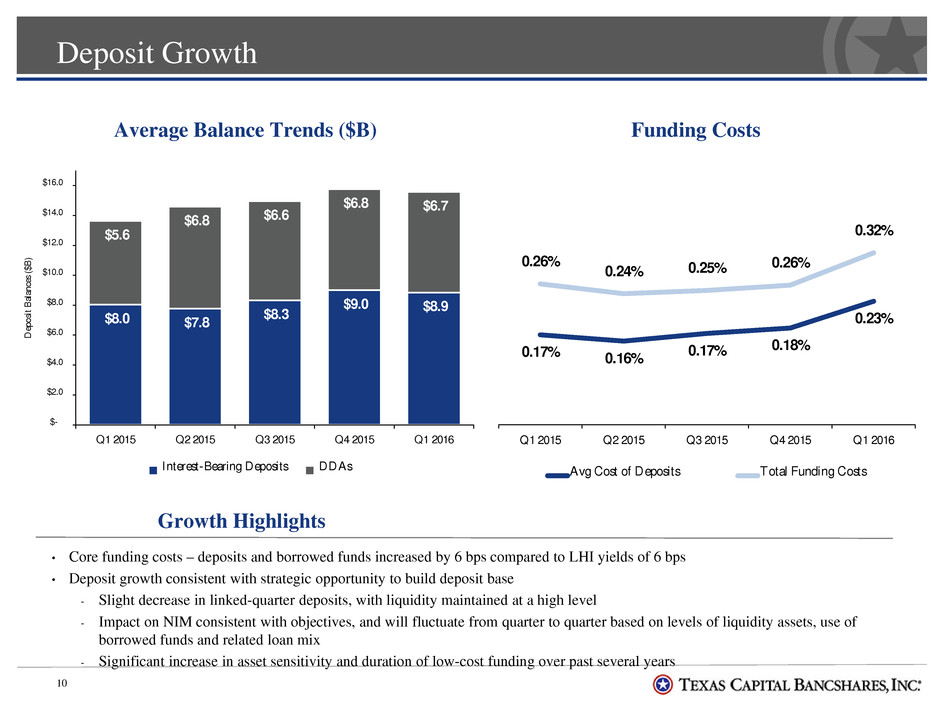
Deposit Growth 10 Average Balance Trends ($B) Funding Costs • Core funding costs – deposits and borrowed funds increased by 6 bps compared to LHI yields of 6 bps • Deposit growth consistent with strategic opportunity to build deposit base ‐ Slight decrease in linked-quarter deposits, with liquidity maintained at a high level ‐ Impact on NIM consistent with objectives, and will fluctuate from quarter to quarter based on levels of liquidity assets, use of borrowed funds and related loan mix ‐ Significant increase in asset sensitivity and duration of low-cost funding over past several years Growth Highlights $8.0 $7.8 $8.3 $9.0 $8.9 $5.6 $6.8 $6.6 $6.8 $6.7 $- $2.0 $4.0 $6.0 $8.0 $10.0 $12.0 $14.0 $16.0 Q1 2015 Q2 2015 Q3 2015 Q4 2015 Q1 2016 D ep os it B al an ce s ( $B ) Interest-Bearing Deposits DDAs 0.17% 0.16% 0.17% 0.18% 0.23% 0.26% 0.24% 0.25% 0.26% 0.32% 0.00% 0.10% 0.20% 0.30% 0.40% 0.50% Q1 2015 Q2 2015 Q3 2015 Q4 2015 Q1 2016 Avg Cost of Deposits Total Funding Costs
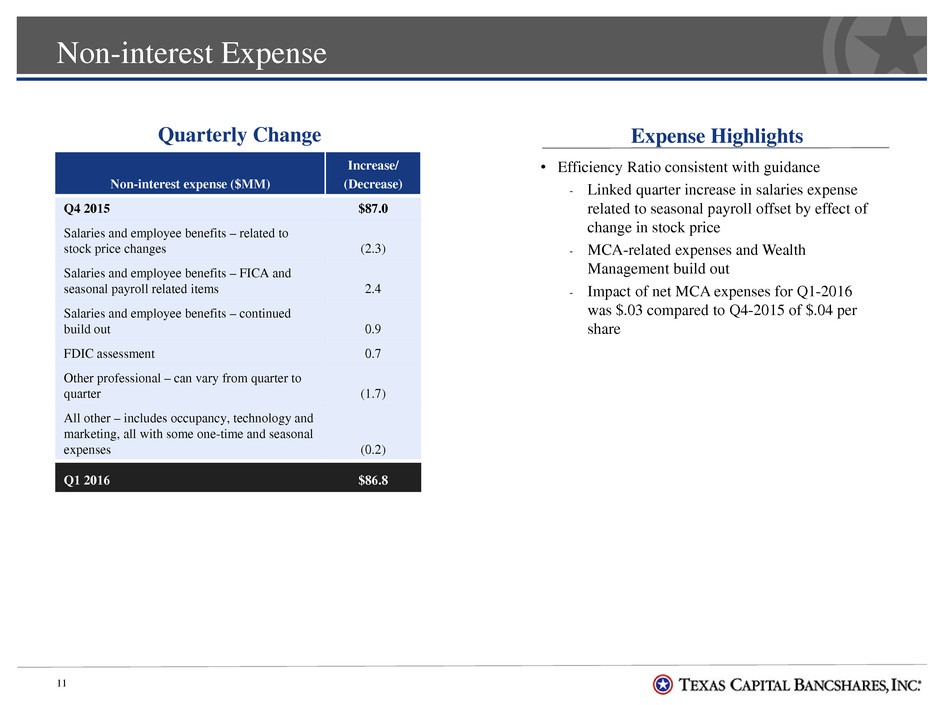
Non-interest Expense 11 • Efficiency Ratio consistent with guidance ‐ Linked quarter increase in salaries expense related to seasonal payroll offset by effect of change in stock price ‐ MCA-related expenses and Wealth Management build out ‐ Impact of net MCA expenses for Q1-2016 was $.03 compared to Q4-2015 of $.04 per share Quarterly Change Expense Highlights Non-interest expense ($MM) Increase/ (Decrease) Q4 2015 $87.0 Salaries and employee benefits – related to stock price changes (2.3) Salaries and employee benefits – FICA and seasonal payroll related items 2.4 Salaries and employee benefits – continued build out 0.9 FDIC assessment 0.7 Other professional – can vary from quarter to quarter (1.7) All other – includes occupancy, technology and marketing, all with some one-time and seasonal expenses (0.2) Q1 2016 $86.8
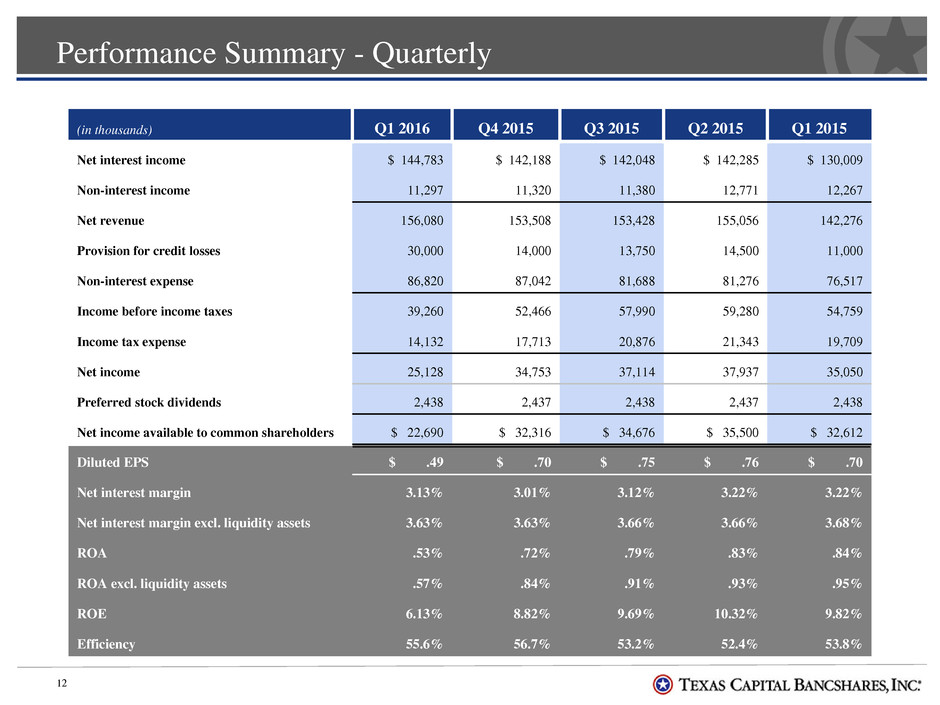
Performance Summary - Quarterly 12 (in thousands) Q1 2016 Q4 2015 Q3 2015 Q2 2015 Q1 2015 Net interest income $ 144,783 $ 142,188 $ 142,048 $ 142,285 $ 130,009 Non-interest income 11,297 11,320 11,380 12,771 12,267 Net revenue 156,080 153,508 153,428 155,056 142,276 Provision for credit losses 30,000 14,000 13,750 14,500 11,000 Non-interest expense 86,820 87,042 81,688 81,276 76,517 Income before income taxes 39,260 52,466 57,990 59,280 54,759 Income tax expense 14,132 17,713 20,876 21,343 19,709 Net income 25,128 34,753 37,114 37,937 35,050 Preferred stock dividends 2,438 2,437 2,438 2,437 2,438 Net income available to common shareholders $ 22,690 $ 32,316 $ 34,676 $ 35,500 $ 32,612 Diluted EPS $ .49 $ .70 $ .75 $ .76 $ .70 Net interest margin 3.13% 3.01% 3.12% 3.22% 3.22% Net interest margin excl. liquidity assets 3.63% 3.63% 3.66% 3.66% 3.68% ROA .53% .72% .79% .83% .84% ROA excl. liquidity assets .57% .84% .91% .93% .95% ROE 6.13% 8.82% 9.69% 10.32% 9.82% Efficiency 55.6% 56.7% 53.2% 52.4% 53.8%
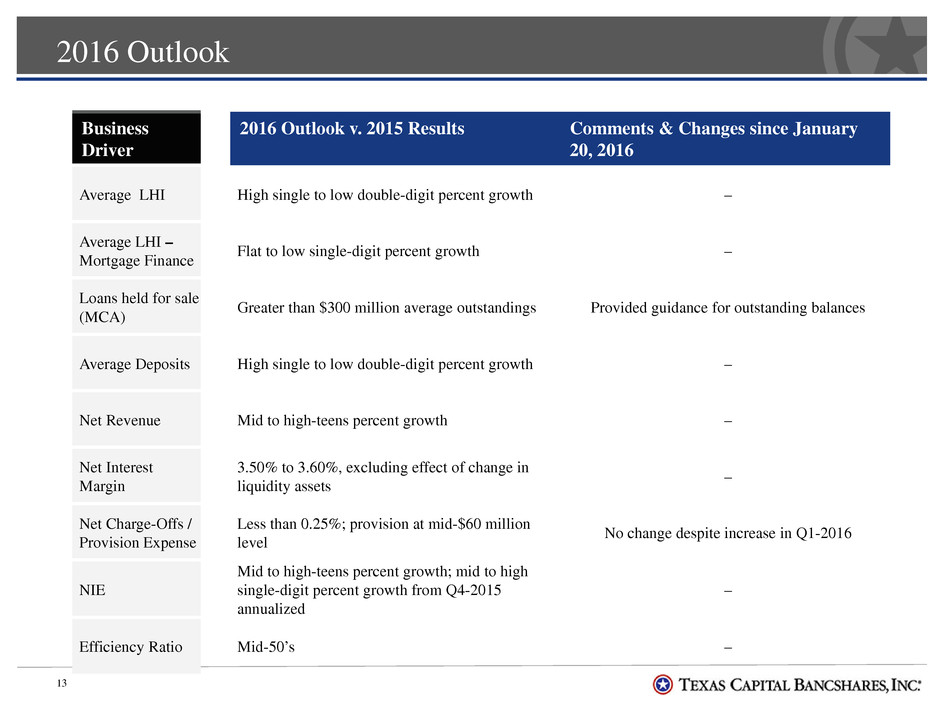
2016 Outlook 13 Business Driver 2016 Outlook v. 2015 Results Comments & Changes since January 20, 2016 Average LHI High single to low double-digit percent growth – Average LHI – Mortgage Finance Flat to low single-digit percent growth – Loans held for sale (MCA) Greater than $300 million average outstandings Provided guidance for outstanding balances Average Deposits High single to low double-digit percent growth – Net Revenue Mid to high-teens percent growth – Net Interest Margin 3.50% to 3.60%, excluding effect of change in liquidity assets – Net Charge-Offs / Provision Expense Less than 0.25%; provision at mid-$60 million level No change despite increase in Q1-2016 NIE Mid to high-teens percent growth; mid to high single-digit percent growth from Q4-2015 annualized – Efficiency Ratio Mid-50’s –
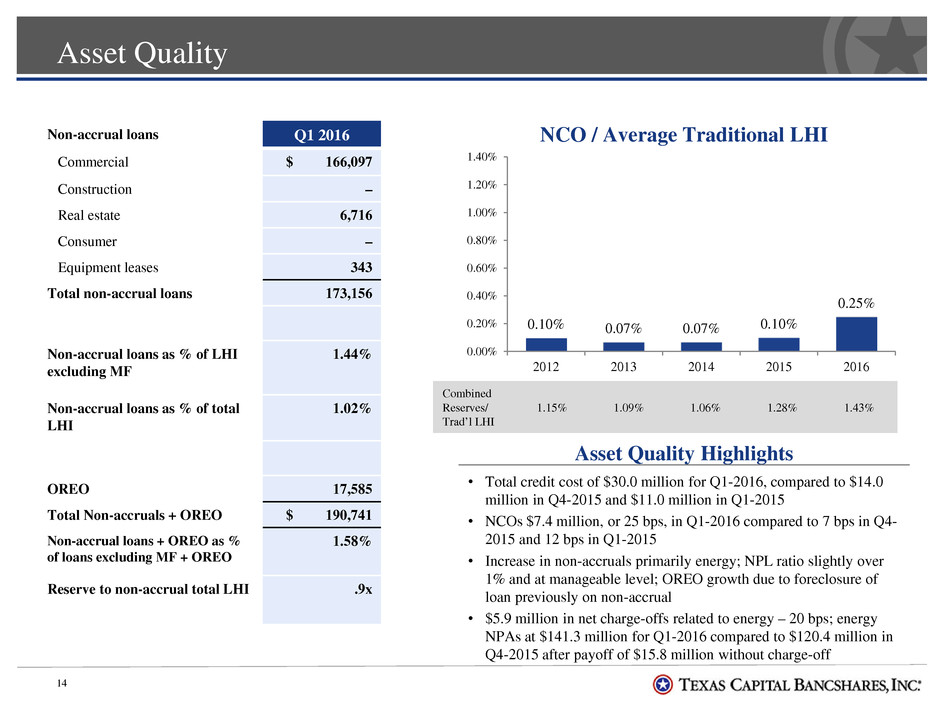
Asset Quality 14 • Total credit cost of $30.0 million for Q1-2016, compared to $14.0 million in Q4-2015 and $11.0 million in Q1-2015 • NCOs $7.4 million, or 25 bps, in Q1-2016 compared to 7 bps in Q4- 2015 and 12 bps in Q1-2015 • Increase in non-accruals primarily energy; NPL ratio slightly over 1% and at manageable level; OREO growth due to foreclosure of loan previously on non-accrual • $5.9 million in net charge-offs related to energy – 20 bps; energy NPAs at $141.3 million for Q1-2016 compared to $120.4 million in Q4-2015 after payoff of $15.8 million without charge-off Asset Quality Highlights Non-accrual loans Q1 2016 Commercial $ 166,097 Construction – Real estate 6,716 Consumer – Equipment leases 343 Total non-accrual loans 173,156 Non-accrual loans as % of LHI excluding MF 1.44% Non-accrual loans as % of total LHI 1.02% OREO 17,585 Total Non-accruals + OREO $ 190,741 Non-accrual loans + OREO as % of loans excluding MF + OREO 1.58% Reserve to non-accrual total LHI .9x 0.10% 0.07% 0.07% 0.10% 0.25% 0.00% 0.20% 0.40% 0.60% 0.80% 1.00% 1.20% 1.40% 2012 2013 2014 2015 2016 NCO / Average Traditional LHI Combined Reserves/ Trad’l LHI 1.15% 1.09% 1.06% 1.28% 1.43%
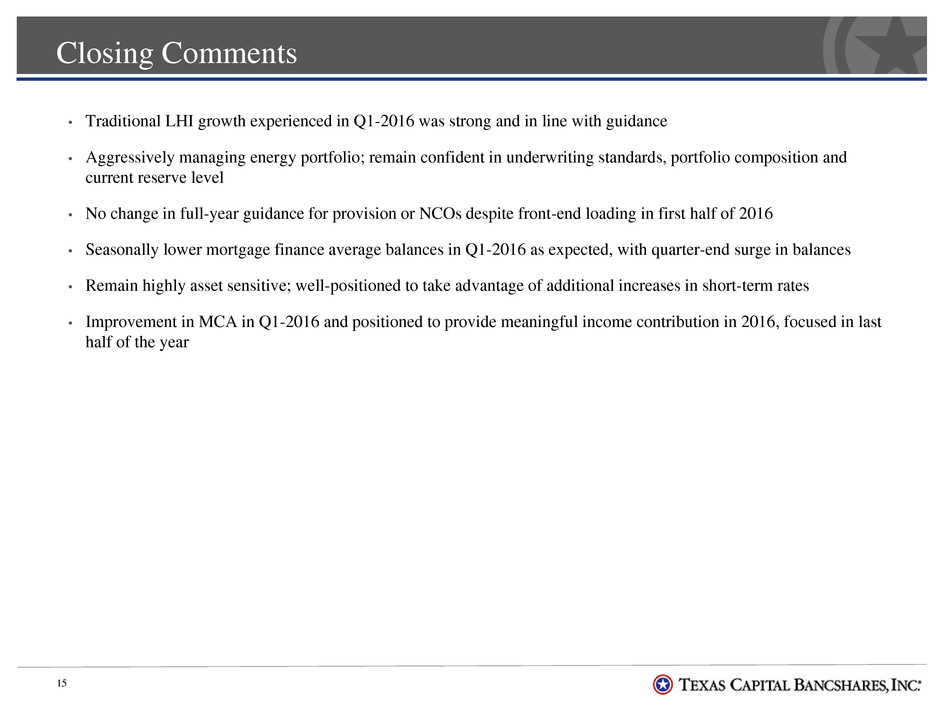
Closing Comments • Traditional LHI growth experienced in Q1-2016 was strong and in line with guidance • Aggressively managing energy portfolio; remain confident in underwriting standards, portfolio composition and current reserve level • No change in full-year guidance for provision or NCOs despite front-end loading in first half of 2016 • Seasonally lower mortgage finance average balances in Q1-2016 as expected, with quarter-end surge in balances • Remain highly asset sensitive; well-positioned to take advantage of additional increases in short-term rates • Improvement in MCA in Q1-2016 and positioned to provide meaningful income contribution in 2016, focused in last half of the year 15
Q&A 16
Appendix 17
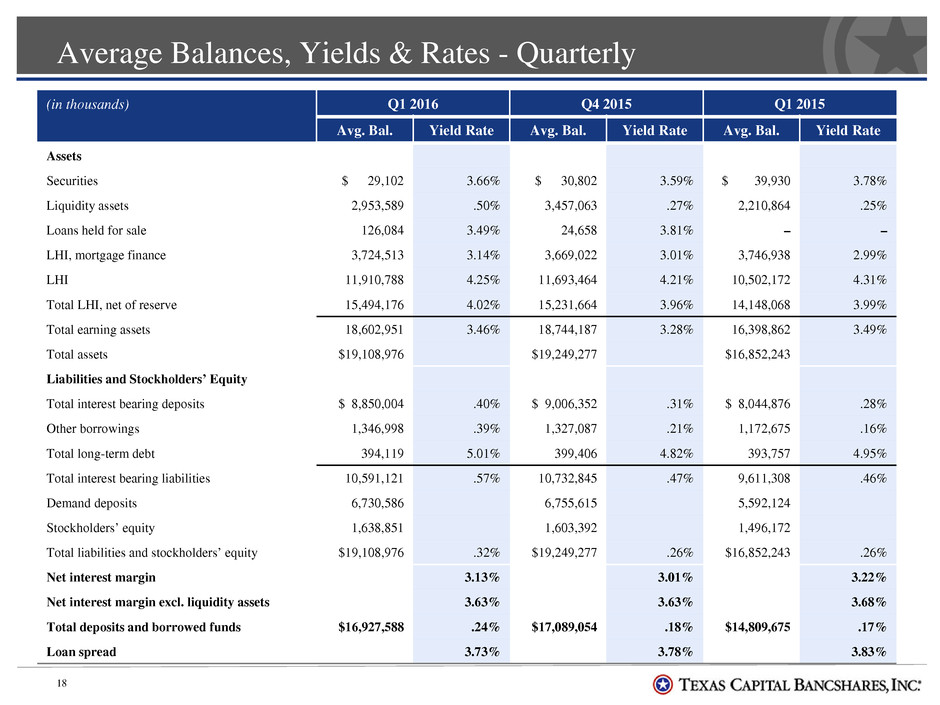
Average Balances, Yields & Rates - Quarterly 18 (in thousands) Q1 2016 Q4 2015 Q1 2015 Avg. Bal. Yield Rate Avg. Bal. Yield Rate Avg. Bal. Yield Rate Assets Securities $ 29,102 3.66% $ 30,802 3.59% $ 39,930 3.78% Liquidity assets 2,953,589 .50% 3,457,063 .27% 2,210,864 .25% Loans held for sale 126,084 3.49% 24,658 3.81% – – LHI, mortgage finance 3,724,513 3.14% 3,669,022 3.01% 3,746,938 2.99% LHI 11,910,788 4.25% 11,693,464 4.21% 10,502,172 4.31% Total LHI, net of reserve 15,494,176 4.02% 15,231,664 3.96% 14,148,068 3.99% Total earning assets 18,602,951 3.46% 18,744,187 3.28% 16,398,862 3.49% Total assets $19,108,976 $19,249,277 $16,852,243 Liabilities and Stockholders’ Equity Total interest bearing deposits $ 8,850,004 .40% $ 9,006,352 .31% $ 8,044,876 .28% Other borrowings 1,346,998 .39% 1,327,087 .21% 1,172,675 .16% Total long-term debt 394,119 5.01% 399,406 4.82% 393,757 4.95% Total interest bearing liabilities 10,591,121 .57% 10,732,845 .47% 9,611,308 .46% Demand deposits 6,730,586 6,755,615 5,592,124 Stockholders’ equity 1,638,851 1,603,392 1,496,172 Total liabilities and stockholders’ equity $19,108,976 .32% $19,249,277 .26% $16,852,243 .26% Net interest margin 3.13% 3.01% 3.22% Net interest margin excl. liquidity assets 3.63% 3.63% 3.68% Total deposits and borrowed funds $16,927,588 .24% $17,089,054 .18% $14,809,675 .17% Loan spread 3.73% 3.78% 3.83%
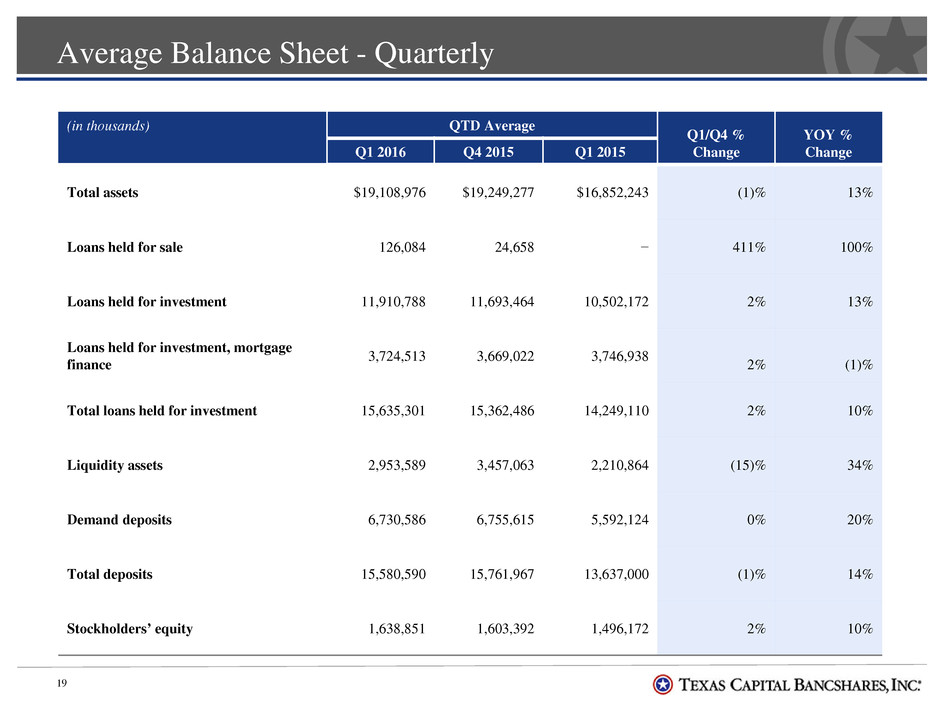
Average Balance Sheet - Quarterly 19 (in thousands) QTD Average Q1/Q4 % Change YOY % Change Q1 2016 Q4 2015 Q1 2015 Total assets $19,108,976 $19,249,277 $16,852,243 (1)% 13% Loans held for sale 126,084 24,658 − 411% 100% Loans held for investment 11,910,788 11,693,464 10,502,172 2% 13% Loans held for investment, mortgage finance 3,724,513 3,669,022 3,746,938 2% (1)% Total loans held for investment 15,635,301 15,362,486 14,249,110 2% 10% Liquidity assets 2,953,589 3,457,063 2,210,864 (15)% 34% Demand deposits 6,730,586 6,755,615 5,592,124 0% 20% Total deposits 15,580,590 15,761,967 13,637,000 (1)% 14% Stockholders’ equity 1,638,851 1,603,392 1,496,172 2% 10%
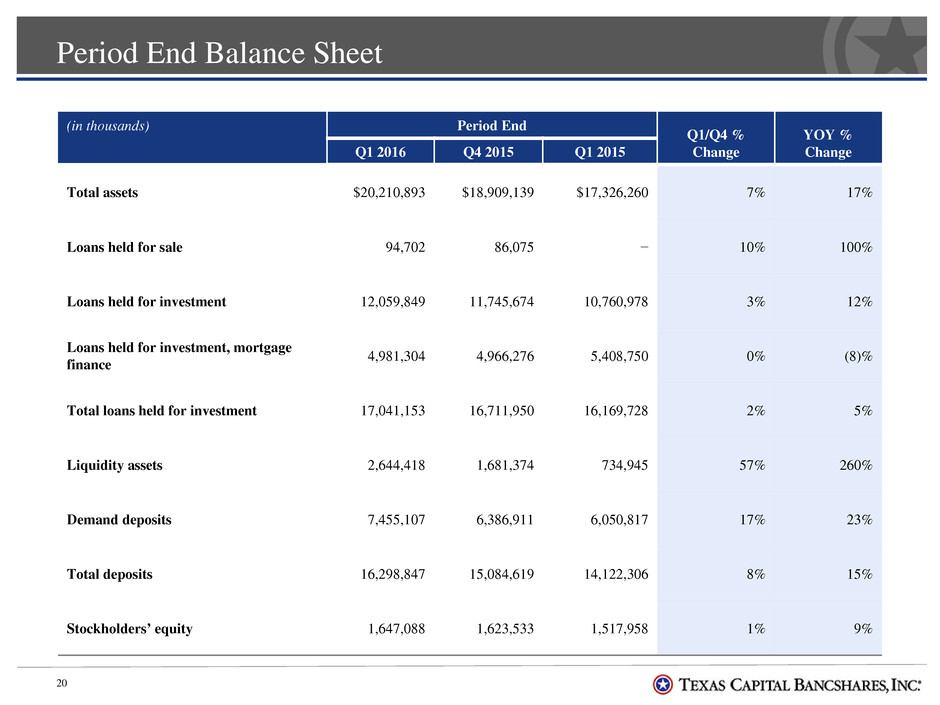
Period End Balance Sheet 20 (in thousands) Period End Q1/Q4 % Change YOY % Change Q1 2016 Q4 2015 Q1 2015 Total assets $20,210,893 $18,909,139 $17,326,260 7% 17% Loans held for sale 94,702 86,075 − 10% 100% Loans held for investment 12,059,849 11,745,674 10,760,978 3% 12% Loans held for investment, mortgage finance 4,981,304 4,966,276 5,408,750 0% (8)% Total loans held for investment 17,041,153 16,711,950 16,169,728 2% 5% Liquidity assets 2,644,418 1,681,374 734,945 57% 260% Demand deposits 7,455,107 6,386,911 6,050,817 17% 23% Total deposits 16,298,847 15,084,619 14,122,306 8% 15% Stockholders’ equity 1,647,088 1,623,533 1,517,958 1% 9%
