Attached files
| file | filename |
|---|---|
| 8-K - 8-K - ARCH RESOURCES, INC. | a16-8522_18k.htm |
Exhibit 99.1
Arch Coal, Inc. DISCLOSURE MATERIALS April 2016

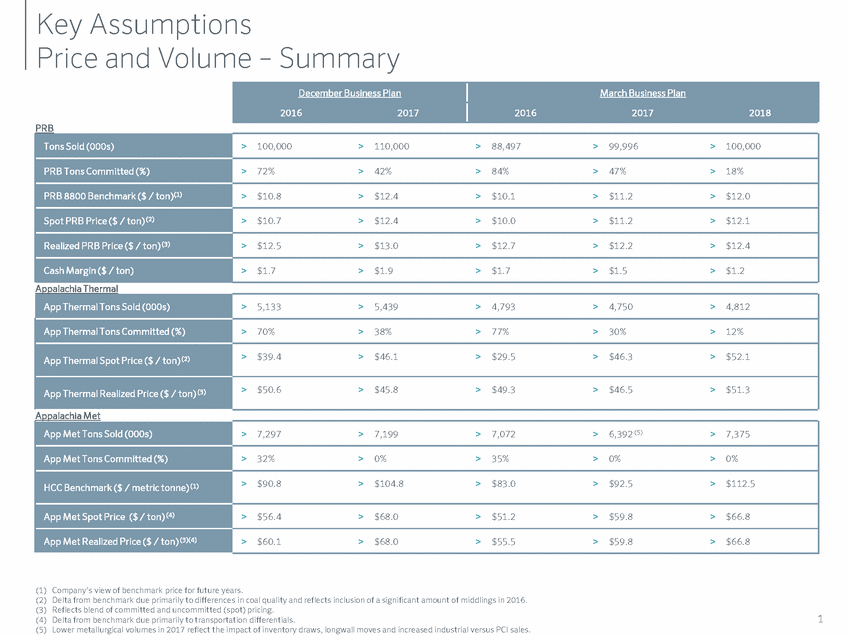
Key Assumptions Price and Volume – Summary (1) Company’s view of benchmark price for future years. (2) Delta from benchmark due primarily to differences in coal quality and reflects inclusion of a significant amount of middlings in 2016. (3) Reflects blend of committed and uncommitted (spot) pricing. (4) Delta from benchmark due primarily to transportation differentials. (5) Lower metallurgical volumes in 2017 reflect the impact of inventory draws, longwall moves and increased industrial versus PCI sales. 1 December Business Plan March Business Plan 2016 2017 2016 2017 2018 PRB Tons Sold (000s) > 100,000 > 110,000 > 88,497 > 99,996 > 100,000 PRB Tons Committed (%) > 72%> 42%> 84%> 47%> 18% PRB 8800 Benchmark ($ / ton)(1) > $10.8 > $12.4 > $10.1 > $11.2 > $12.0 Spot PRB Price ($ / ton) (2) > $10.7 > $12.4 > $10.0 > $11.2 > $12.1 Realized PRB Price ($ / ton) (3) > $12.5 > $13.0 > $12.7 > $12.2 > $12.4 Cash Margin ($ / ton) > $1.7 > $1.9 > $1.7 > $1.5 > $1.2 Appalachia Thermal App Thermal Tons Sold (000s) > 5,133 > 5,439 > 4,793 > 4,750 > 4,812 App Thermal Tons Committed (%) > 70%> 38%> 77%> 30%> 12% App Thermal Spot Price ($ / ton) (2) > $39.4 > $46.1 > $29.5 > $46.3 > $52.1 App Thermal Realized Price ($ / ton) (3) > $50.6 > $45.8 > $49.3 > $46.5 > $51.3 Appalachia Met App Met Tons Sold (000s) > 7,297 > 7,199 > 7,072 > 6,392 (5) > 7,375 App Met Tons Committed (%) > 32%> 0%> 35%> 0%> 0% HCC Benchmark ($ / metric tonne) (1) > $90.8 > $104.8 > $83.0 > $92.5 > $112.5 App Met Spot Price ($ / ton) (4) > $56.4 > $68.0 > $51.2 > $59.8 > $66.8 App Met Realized Price ($ / ton) (3)(4) > $60.1 > $68.0 > $55.5 > $59.8 > $66.8
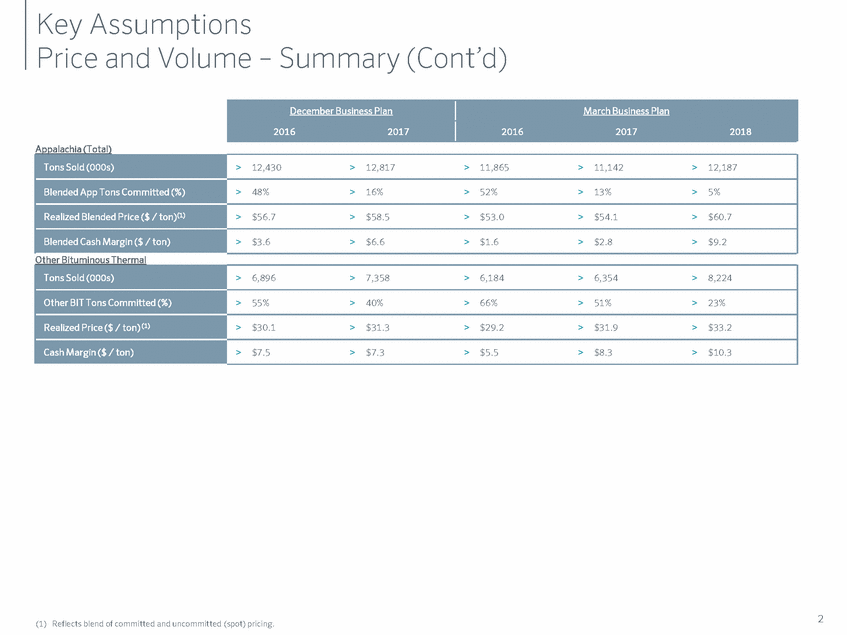
Key Assumptions Price and Volume – Summary (Cont’d) 2 (1) Reflects blend of committed and uncommitted (spot) pricing. December Business Plan March Business Plan 2016 2017 2016 2017 2018 Appalachia (Total) Tons Sold (000s) > 12,430 > 12,817 > 11,865 > 11,142 > 12,187 Blended App Tons Committed (%) > 48%> 16%> 52%> 13%> 5% Realized Blended Price ($ / ton)(1) > $56.7 > $58.5 > $53.0 > $54.1 > $60.7 Blended Cash Margin ($ / ton) > $3.6 > $6.6 > $1.6 > $2.8 > $9.2 Other Bituminous Thermal Tons Sold (000s) > 6,896 > 7,358 > 6,184 > 6,354 > 8,224 Other BIT Tons Committed (%) > 55%> 40%> 66%> 51%> 23% Realized Price ($ / ton) (1) > $30.1 > $31.3 > $29.2 > $31.9 > $33.2 Cash Margin ($ / ton) > $7.5 > $7.3 > $5.5 > $8.3 > $10.3
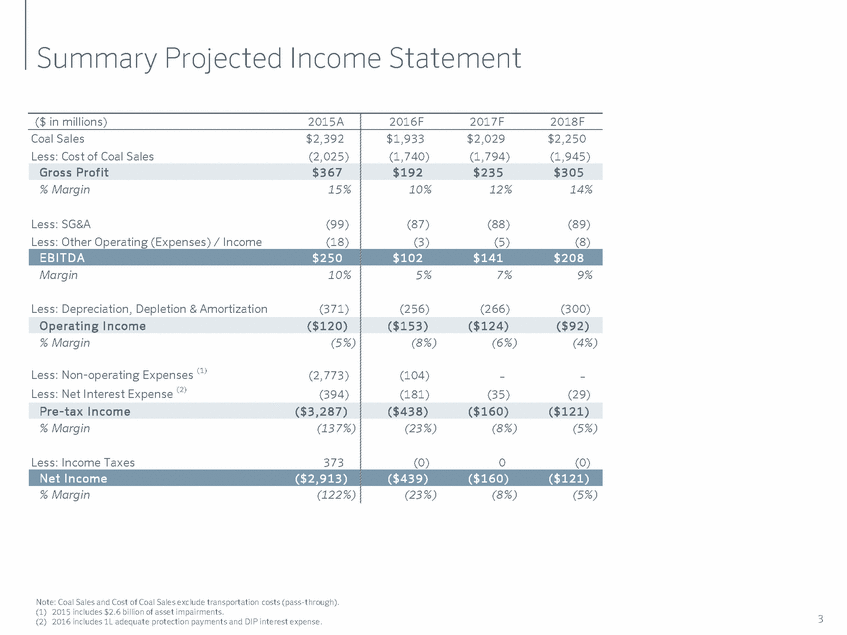
Summary Projected Income Statement ($ in millions) 2015A 2016F 2017F 2018F Coal Sales Less: Cost of Coal Sales $2,392 (2,025) $1,933 (1,740) $2,029 (1,794) $2,250 (1,945) % Margin 15% 10% 12% 14% Less: SG&A Less: Other Operating (Expenses) / Income (99) (18) (87) (3) (88) (5) (89) (8) Margin 10% 5% 7% 9% Less: Depreciation, Depletion & Amortization (371) (256) (266) (300) % Margin (5%) (8%) (6%) (4%) Less: Non-operating Expenses (1) Less: Net Interest Expense (2) (2,773) (394) (104) (181) – (35) – (29) % Margin (137%) (23%) (8%) (5%) Less: Income Taxes 373 (0) 0 (0) % Margin (122%) (23%) (8%) (5%) Note: Coal Sales and Cost of Coal Sales exclude transportation costs (pass-through). (1) 2015 includes $2.6 billion of asset impairments. (2) 2016 includes 1L adequate protection payments and DIP interest expense. 3 Net I n come ($ 2 , 9 1 3 ) ($ 4 3 9 ) ($ 1 6 0 ) ($ 1 2 1 ) Pre-tax I n come ($ 3 , 2 8 7 ) ($ 4 3 8 ) ($ 1 6 0 ) ($ 1 2 1 ) Op eratin g I n come ($ 1 2 0 ) ($ 1 5 3 ) ($ 1 2 4 ) ($ 9 2 ) EBI T DA$250$102$141$208 Gros s Prof it$367$192$235$305
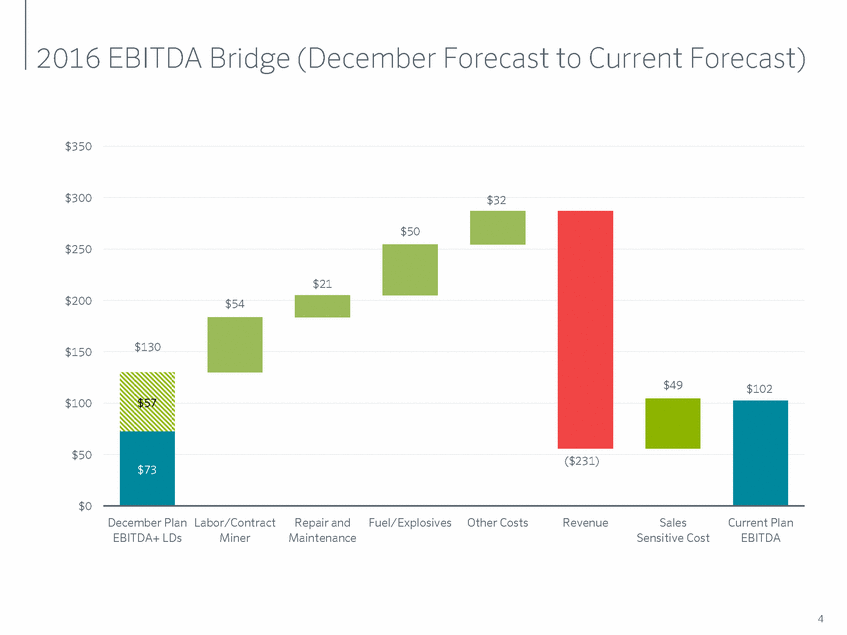
2016 EBITDA Bridge (December Forecast to Current Forecast) $350 $300 $32 $250 $200 $150 $57 $100 $50 $0 December Plan EBITDA+ LDs Labor/Contract Miner Repair andFuel/Explosives Maintenance Other Costs Revenue Sales Sensitive Cost Current Plan EBITDA 4 $50 $21 $54 $130 $49 $102 $73 ($231)
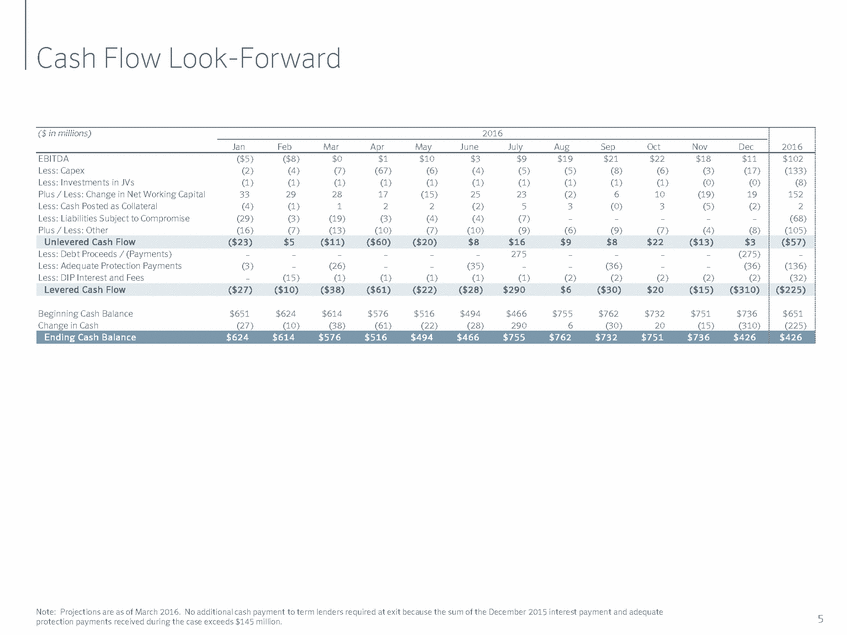
Cash Flow Look-Forward ($ in millions) 2016 Jan Feb Mar Apr May June July Aug Sep Oct Nov Dec 2016 EBITDA Less: Capex Less: Investments in JVs Plus / Less: Change in Net Working Capital Less: Cash Posted as Collateral Less: Liabilities Subject to Compromise Plus / Less: Other ($5) (2) (1) 33 (4) (29) (16) ($8) (4) (1) 29 (1) (3) (7) $0 (7) (1) 28 1 (19) (13) $1 (67) (1) 17 2 (3) (10) $10 (6) (1) (15) 2 (4) (7) $3 (4) (1) 25 (2) (4) (10) $9 (5) (1) 23 5 (7) (9) $19 (5) (1) (2) 3 – (6) $21 (8) (1) 6 (0) – (9) $22 (6) (1) 10 3 – (7) $18 (3) (0) (19) (5) – (4) $11 (17) (0) 19 (2) – (8) $102 (133) (8) 152 2 (68) (105) Less: Debt Proceeds / (Payments) Less: Adequate Protection Payments Less: DIP Interest and Fees 275 – (1) (275) (36) (2) – (3) – – – (15) – (26) (1) – – (1) – – (1) – (35) (1) – – (2) – (36) (2) – – (2) – – (2) – (136) (32) Beginning Cash Balance Change in Cash $651 (27) $624 (10) $614 (38) $576 (61) $516 (22) $494 (28) $466 290 $755 6 $762 (30) $732 20 $751 (15) $736 (310) $651 (225) Note: Projections are as of March 2016. No additional cash payment to term lenders required at exit because the sum of the December 2015 interest payment and adequate protection payments received during the case exceeds $145 million. 5 En d in g Cas h Balan ce$624$614$576$516$494$466$755$762$732$751$736$426$426 Lev ered Cas h Flow($ 2 7 ) ($ 1 0 ) ($ 3 8 ) ($ 6 1 ) ($ 2 2 ) ($ 2 8 ) $290 $6 ($ 3 0 ) $20 ($ 1 5 ) ($ 3 1 0 ) ($ 2 2 5 ) U n lev ered Cas h Flow($ 2 3 ) $5 ($ 1 1 ) ($ 6 0 ) ($ 2 0 ) $8 $16 $9 $8 $22 ($ 1 3 ) $3 ($ 5 7 )
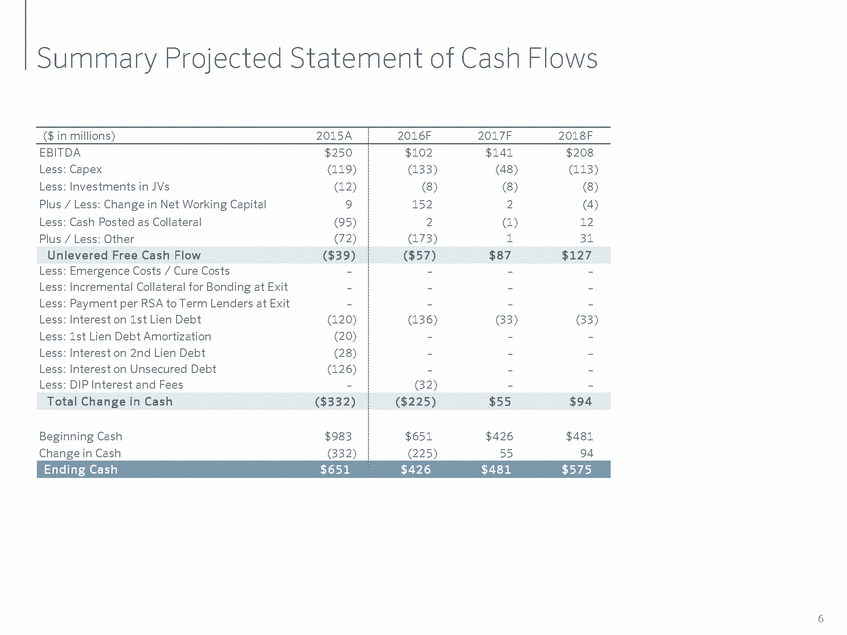
Summary Projected Statement of Cash Flows ($ in millions) 2015A 2016F 2017F 2018F EBITDA Less: Capex Less: Investments in JVs Plus / Less: Change in Net Working Capital Less: Cash Posted as Collateral Plus / Less: Other $250 (119) (12) 9 (95) (72) $102 (133) (8) 152 2 (173) $141 (48) (8) 2 (1) 1 $208 (113) (8) (4) 12 31 Less: Emergence Costs / Cure Costs Less: Incremental Collateral for Bonding at Exit Less: Payment per RSA to Term Lenders at Exit Less: Interest on 1st Lien Debt Less: 1st Lien Debt Amortization Less: Interest on 2nd Lien Debt Less: Interest on Unsecured Debt Less: DIP Interest and Fees – – – (120) (20) (28) (126) – – – – (136) – – – (32) – – – (33) – – – – – – – (33) – – – – Beginning Cash Change in Cash $983 (332) $651 (225) $426 55 $481 94 6 En d in g Cas h$651$426$481$575 T otal Ch an ge in Cas h($ 3 3 2 )($ 2 2 5 )$55$94 U n lev ered Free Cas h Flow($ 3 9 )($ 5 7 )$87$127
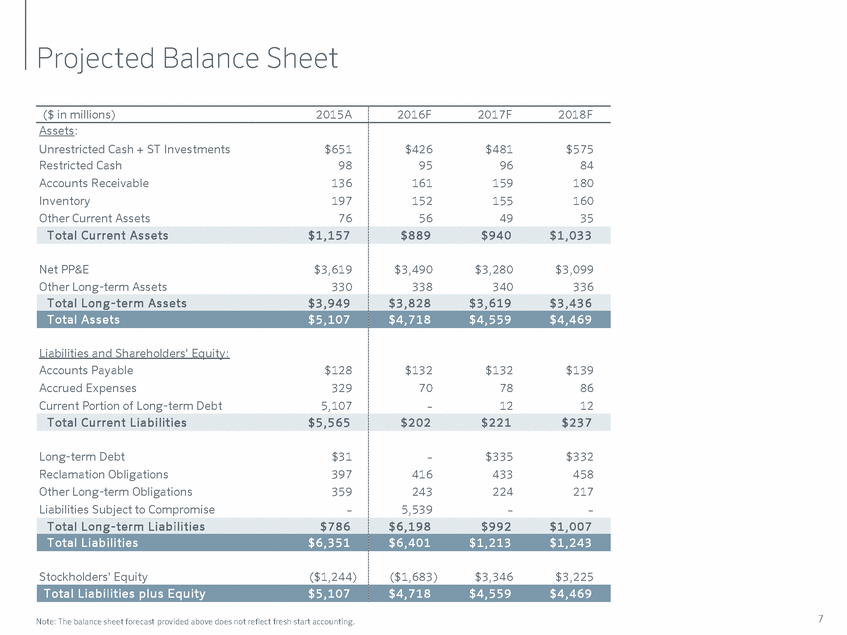
Projected Balance Sheet ($ in millions) 2015A 2016F 2017F 2018F Assets: Unrestricted Cash + ST Investments Restricted Cash Accounts Receivable Inventory Other Current Assets $651 98 136 197 76 $426 95 161 152 56 $481 96 159 155 49 $575 84 180 160 35 Net PP&E Other Long-term Assets $3,619 330 $3,490 338 $3,280 340 $3,099 336 Liabilities and Shareholders' Equity: Accounts Payable Accrued Expenses Current Portion of Long-term Debt $128 329 5,107 $132 70 – $132 78 12 $139 86 12 Long-term Debt Reclamation Obligations Other Long-term Obligations Liabilities Subject to Compromise $31 397 359 – $335 433 224 – $332 458 217 – – 416 243 5,539 Stockholders' Equity ($1,244) ($1,683) $3,346 $3,225 7 Note: The balance sheet forecast provided above does not reflect fresh start accounting. T otal Liab ilities p lu s Eq u ity$5,107$4,718$4,559$4,469 T otal Lon g-term Liab ilities$786$6,198$992$1,007 T otal Liab ilities$6,351$6,401$1,213$1,243 T otal Cu rren t Liab ilities$5,565$202$221$237 T otal Lon g-term As s ets$3,949$3,828$3,619$3,436 T otal As s ets$5,107$4,718$4,559$4,469 T otal Cu rren t As s ets$1,157$889$940$1,033
