Attached files
| file | filename |
|---|---|
| EX-99.1 - EX-99.1 - Howmet Aerospace Inc. | d180649dex991.htm |
| 8-K - FORM 8-K - Howmet Aerospace Inc. | d180649d8k.htm |
 [Alcoa logo] [Alcoa logo] 1 April 11, 2016 1 st Quarter Earnings Conference [Alcoa logo] Exhibit 99.2 |
 [Alcoa logo] Important Information 2 Forward–Looking Statements This presentation contains statements that relate to future events and expectations and as such constitute forward-looking statements
within the meaning of the Private Securities Litigation Reform
Act of 1995. Forward-looking statements include those containing such words as “anticipates,” “believes,” “could,” “estimates,” “expects,” “forecasts,” “goal,”
“intends,” “may,” “outlook,”
“plans,” “projects,” “seeks,” “sees,” “should,” “targets,” “will,” “would,” or other words of similar meaning.
All statements that reflect Alcoa’s expectations, assumptions
or projections about the future, other than statements of
historical fact, are forward-looking statements, including, without limitation, forecasts concerning global demand growth for aluminum, supply/demand balances, and growth of the aerospace, automotive, and other end markets; statements regarding targeted financial
results or operating performance; statements about Alcoa’s
strategies, outlook, business and financial prospects; and statements regarding the separation transaction, including the future performance of Value-Add Company and Upstream Company if the separation is completed, the expected benefits of the separation, and the expected
timing of
the Form 10 filing and the completion of the
separation. Forward-looking statements are not guarantees of future
performance and are subject to risks, uncertainties, and changes in circumstances that are difficult to predict. Although Alcoa believes that the expectations reflected in any forward-looking statements are based on reasonable assumptions, it can
give no assurance that these expectations will be attained and it
is possible that actual results may differ materially from those indicated by these forward-looking statements due to a variety of risks and uncertainties. Such risks and uncertainties include, but are not limited to: (a) uncertainties as to the timing of the separation and whether it will be completed; (b)
the possibility that various closing conditions for the
separation may not be satisfied; (c) failure of the separation to qualify for
the expected tax treatment; (d) the possibility that any
third-party consents required in connection with the
separation will not be received; (e) the impact of the separation on the
businesses of Alcoa; (f) the risk that the businesses will not be separated successfully or such separation may be more difficult, time-consuming or costly than expected, which could result in additional demands on Alcoa’s resources, systems,
procedures and controls, disruption of its ongoing business and
diversion of management’s attention from other business concerns; (g) material adverse changes in aluminum industry conditions, including global supply and demand conditions and fluctuations in London Metal Exchange-based prices and premiums, as applicable, for primary aluminum, alumina, and other products,
and fluctuations in indexed-based and spot prices for
alumina;; (h) deterioration in global economic and financial market conditions generally; (i) unfavorable changes in the markets served by Alcoa; (j) the impact of changes in foreign currency exchange rates on costs and results; (k) increases in energy costs; (l) the inability to achieve the level of revenue growth,
cash generation, cost savings, improvement in profitability and
margins, fiscal discipline, or strengthening of competitiveness and operations (including executing on the business improvement plans, moving the Upstream alumina and aluminum businesses down on the industry cost curves, and increasing revenues and improving margins in the Value-Add
businesses) anticipated from restructuring programs and
productivity improvement, cash sustainability, technology
advancements (including, without limitation, advanced aluminum alloys, Alcoa Micromill, and other materials and processes), and other initiatives; (m) Alcoa’s inability to realize expected benefits, in each case as planned and by targeted
completion dates, from acquisitions, divestitures, facility
closures, curtailments, or expansions, or international joint
ventures; (n) political, economic, and regulatory risks in the countries in which Alcoa operates or sells products; (o) the outcome of contingencies, including legal proceedings, government or regulatory investigations, and environmental remediation; (p) the impact of
cyber attacks and potential information technology or data
security breaches; (q) the potential failure to retain key employees while the separation transaction is pending or after it is completed; (r) the risk that increased debt levels, deterioration in debt protection metrics, contraction in liquidity, or other factors could adversely affect the targeted credit ratings
for Value-Add Company or Upstream Company; and (s) the other
risk factors discussed in Alcoa’s Form 10-K for the year ended December 31, 2015, and other reports filed with the U.S. Securities and Exchange Commission (SEC). Alcoa disclaims
any obligation to update publicly any forward-looking statements, whether
in response to new information, future events or otherwise, except as required by applicable law. Market projections are subject to the risks discussed above and other risks in the market.
[Alcoa logo] |
 [Alcoa logo] Important Information (continued) 3 Non-GAAP Financial Measures Some of the information included in this presentation is derived from Alcoa’s consolidated financial information but is not
presented in Alcoa’s financial statements prepared in
accordance with accounting principles generally accepted in the United States of America (GAAP). Certain of these data are considered “non-GAAP financial measures” under SEC rules. These non-GAAP financial measures supplement our GAAP disclosures and should not be considered
an alternative to the GAAP measure. Reconciliations to the
most directly comparable GAAP financial measures and management’s rationale for the use of the non-GAAP financial measures can be found in the Appendix to this presentation. Alcoa has not provided a reconciliation of any forward-looking non-GAAP financial measures to the most directly comparable GAAP financial measures, due primarily to variability and difficulty in making accurate forecasts and projections, as not all of the
information necessary for a quantitative reconciliation is
available to Alcoa without unreasonable effort. Any reference to historical EBITDA means adjusted EBITDA, for which we have provided calculations and reconciliations in the Appendix. |
 [Alcoa logo] [Alcoa logo] Klaus Kleinfeld Chairman and Chief Executive Officer 4 April 11, 2016 [Alcoa logo] |
 [Alcoa logo] Separation on Track 1Q 2016 Overview 5 Delivering Solid Performance, Strong Productivity – Separation on Track Arconic Segments (Value-Add) Revenue $3.3B down 2.2% YoY: 6.7% revenue
increase predominantly related to acquisitions, offset by 8.3%
decline from metal and foreign exchange and 0.6% revenue decline from divested or closed operations ATOI of $269M, up 8% YoY, adj. EBITDA $537M, up 7% YoY, Record adjusted EBITDA margin 16.4% Global Rolled Products: $68m ATOI, up 26% YoY and adjusted EBITDA per metric ton $374, up 8% YoY due to strong cost control; automotive sheet shipment growth up 38% YoY Engineered Products and Solutions: Record Q1 Revenue of $1.4B; Record 1Q ATOI of $162M, up 4% YoY Transportation and Construction Solutions: $39M ATOI, up 3% YoY, Record 1Q adjusted EBITDA margin of 14.9% Supply Agreement for 3D-printed titanium fuselage and engine pylon parts to Airbus Multi-year ~$1B contract for advanced Industrial Gas Turbine (IGT) components, Alcoa’s largest IGT contract to date Agreement to sell RTI Remmele Medical business for $102m
Achieved $179 million in Productivity savings, on target to deliver $650 million in 2016 Global Rolled Products, Transportation and Construction Solutions on track to meet three-year 2016 targets; New goals set for EPS to better reflect aerospace market conditions and Firth Rixson performance
New Alcoa Segments (Upstream) 3 rd Party Revenue of $1.7B down 32.2% YoY: 4.5% revenue increase from organic growth more than offset by 26.1% revenue decline due to lower pricing and foreign exchange impacts and 10.6% revenue decline predominantly related to
curtailed or closed operations
Total Revenue of $2.1B, ATOI of $22 million, and adj. EBITDA of $185M
Profitable Alumina and Primary Metals segments despite 19% price decline in API, and flat aluminum pricing, sequentially; YoY declines of 40% and 26%, respectively
Signed new Third-Party Bauxite Contracts valued at over $350
million over the next two years Ma’aden-Alcoa joint venture
refinery continued to ramp-up, now at 80% of nameplate capacity
Pt. Comfort, Texas refinery on track to be
fully curtailed by end of second quarter; closed Warrick smelter in Indiana Achieved $175 million in productivity
savings, on target to deliver $550 million in 2016 Sold stake in Dampier to Bunbury Natural Gas Pipeline in Western
Australia (WA) for $154m.
Gas supply secured for three WA alumina
refineries On
track to meet 2016 Cost Curve Goals: 21 st percentile in Alumina and 38 th percentile in Primary Metals Launched New Value-Add
Brand “Arconic”
& Refreshed New Alcoa
Brand Form 10
to be filed in first half 2016 See appendix for EBITDA reconciliations and adjusted EBITDA margin of 21.0%; Aerospace sales up 14%YoY |
 [Alcoa logo] William Oplinger Executive Vice President and Chief Financial Officer 6 April 11, 2016 |
 [Alcoa logo] Income Statement Summary $ Millions, except aluminum prices and per-share amounts 1Q15 4Q15 1Q16 Prior Year Change Sequential Change Realized Aluminum Price ($/MT) $2,420 $1,799 $1,793 ($627) ($6) Revenue $5,819 $5,245 $4,947 ($872) ($298) Cost of Goods Sold $4,443 $4,404 $4,041 ($402) ($363) COGS % Revenue 76.4% 84.0% 81.7% 5.3 % pts. (2.3 % pts.) Selling, General Administrative, Other $232 $262 $260 $28 ($2) SGA % Revenue 4.0% 5.0% 5.3% 1.3 % pts. 0.3 % pts. Other (Income) Expenses, Net ($12) $29 $34 $46 $5 Restructuring and Other Charges $177 $735 $93 ($84) ($642) Effective Tax Rate 47.0% (6.1%) 73.2% 26.2 % pts. 79.3 % pts. EBITDA $1,089 $519 $603 ($486) $84 Net Income (Loss) $195 ($701) $16 ($179) $717 Net Income (Loss) per Diluted Share $0.14 ($0.55) $0.00 ($0.14) $0.55 Income excl. Special Items $363 $65 $108 ($255) $43 Income per Diluted Share excl. Special Items $0.28 $0.04 $0.07 ($0.21) $0.03 See appendix for EBITDA and Adjusted Income reconciliations 7 |
 [Alcoa logo] Special Items See appendix for Adjusted Income reconciliation
$ Millions, except per-share amounts
1Q15 4Q15 1Q16 Income Statement Classification Segment Net Income (Loss) $195 ($701) $16 Net Income (Loss) per Diluted Share $0.14 ($0.55) $0.00 Restructuring-Related ($158) ($287) ($63) Restructuring and Other Charges/COGS Corporate/All Tax Items ($4) ($189) ($12) Income Taxes Corporate Portfolio Transaction Costs ($7) ($12) ($17) SG&A Corporate Mark-to-Market Energy Contracts $1 ($5) - Other Expenses, Net Corporate Italian Energy Matter - ($201) - Restructuring and Other Charges Corporate Q4’15 Overhead Reduction Program - ($47) - Restructuring and Other Charges/COGS Corporate Goodwill Impairment - ($25) - Impairment of Goodwill Corporate Special Items ($168) ($766) ($92) Net Income excl. Special Items $363 $65 $108 Net Income per Diluted Share excl. Special Items $0.28 $0.04 $0.07 8 |
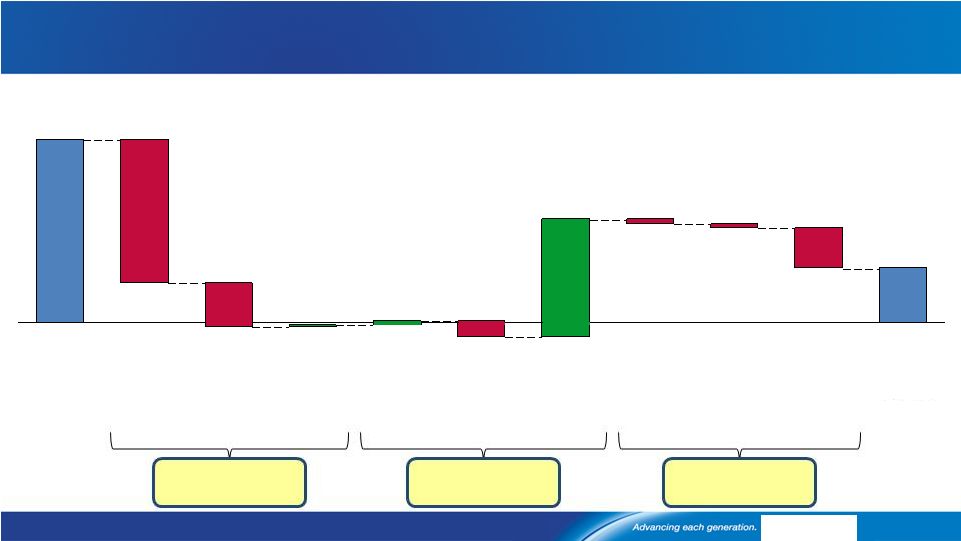 [Alcoa logo] Net Income excluding Special Items ($ Millions) Adjusted Earnings Down on Lower LME, API and Regional Premiums Market -$366 Performance +$208 Cost Headwinds -$97 Note: Metal Price = LME + Regional Premium; Regional Premium previously reported in Price/Mix category
See appendix for Adjusted Income reconciliation
$108 $363 -$32 Volume $8 Currency $4 API -$87 Metal Price -$283 1Q 15 -$9 Productivity Price / Mix $232 -$8 1Q 16 Raw Materials Cost Increases / Other -$80 Energy 9 |
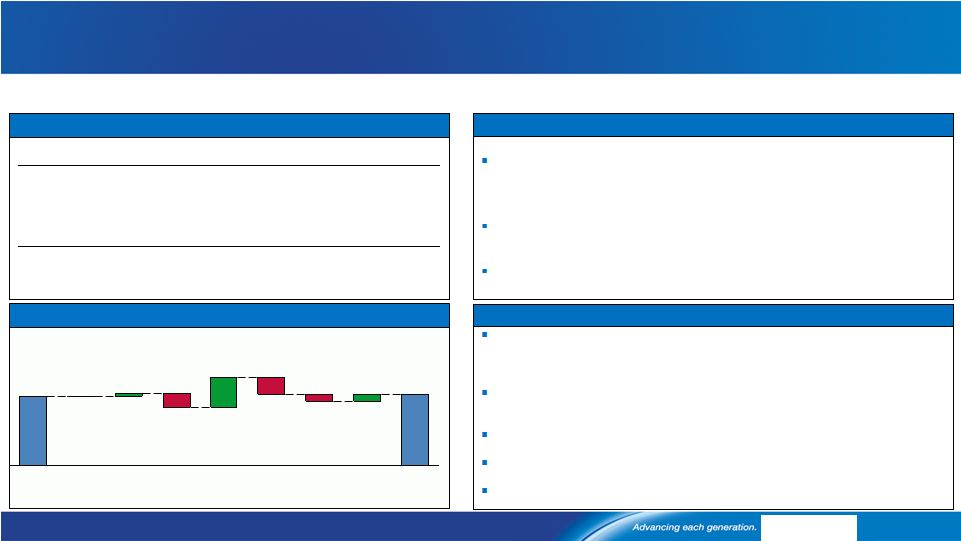
 [Alcoa logo] 1Q 15 1 4Q 15 1Q 16 3 rd Party Revenue ($ Millions) 1,621 1,422 1,397 3 rd Party Conversion Revenue ($ Millions) 757 732 737 ATOI ($ Millions) 54 52 68 EBITDA/MT ($) 347 312 374 1Q16 Actual and 2Q16 Outlook – Global Rolled Products GRP: Productivity and Auto Uplift Offset Headwinds EBITDA/MT up 12% YoY excluding impact to secure alternative metal supply
at Warrick
Auto sheet shipments up 38% year-over-year Volume and pricing pressure from packaging,
Lower demand from Aero
due to inventory overhang and significantly
reduced N.A. heavy duty truck build rates Continued investments of $5M in Growth projects including Micromill
TM R&D, Saudi JV and throughput/capacity increases
at key plants Strong productivity
more than offset cost increases
Auto sheet shipments expected to
be up ~35% as Tennessee Auto
ramp-up accelerates Continued pricing pressure from packaging Lower demand from
Aero due to new model transition and
reduced N.A. heavy duty truck build rates expected to continue ATOI is expected to be up 5-7% excluding $15M impact to secure alternative metal supply at Warrick, and current currency rates
2 nd Quarter Year-over-Year Outlook 1 st Quarter Business Highlights 1 st Quarter ATOI Results $ Millions 1 st Quarter ATOI Performance Bridge -$6 -$2 -$2 -$4 -$5 -$2 1Q16 Warrick Cold Metal Plan (CMP) Cost Incr./ Other Prod- uctivity Price / Mix Volume Currency 1Q15 Growth Projects 1. 1Q15 amounts have been revised to remove impact of metal price lag 2. EBITDA/MT include impact from Warrick metal
supply. Without that impact, EBITDA/MT is $390. See appendix for additional information
and EBITDA reconciliation. 10
$68 $35 $54 2 |
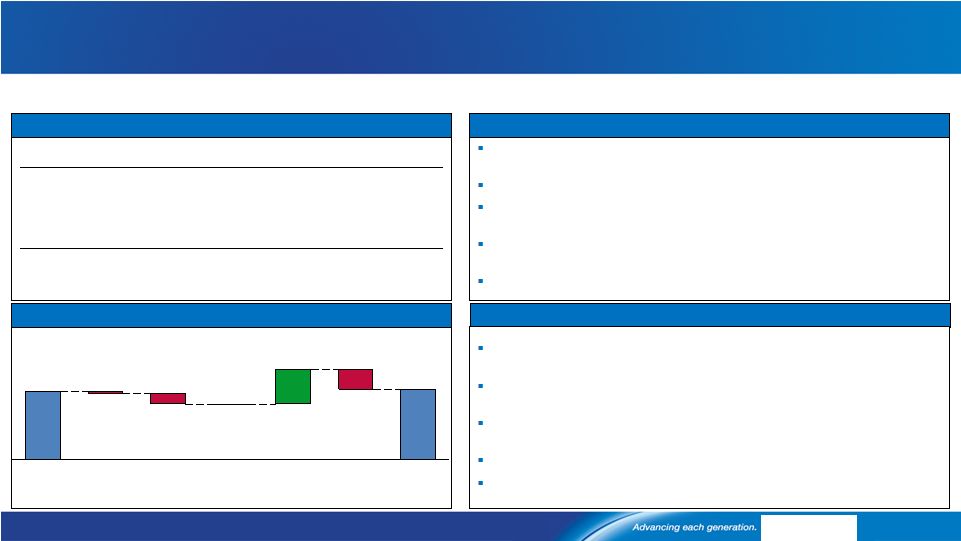
 [Alcoa logo] 1Q 15 4Q 15 1Q 16 3 Party Revenue ($ Millions) 1,257 1,409 1,449 ATOI ($ Millions) 156 123 162 EBITDA Margin 22.4% 17.3% 21.0% 1 Quarter ATOI Performance Bridge 1Q16 Actual and 2Q16 Outlook – Engineered Products and Solutions Aerospace market remains strong despite slower ramp up of next generation platforms due to simultaneous launches of new
technologies and
inventory overhangs at OEMs Oil & Gas, European Industrial Gas Turbine, North America Commercial Transportation markets increasingly softer
Pricing pressure across all markets, except
IGT Share gains through innovation
and productivity continue
ATOI is expected to be up 5% to 10%
year-over
-year
1 Quarter ATOI Results 1 Quarter Business Highlights Price / Mix -$30 1Q16 Growth Projects Volume Currency -$15 ATEP Cost Increases -$39 Productivity 1Q15 EPS: Strong Productivity and Benefits From Acquisitions Revenue growth of 15% year-over-year driven by acquisitions,
partially offset by pricing pressure, inventory
overhang in Aero
OEMs, and softening
markets Alcoa Titanium and Engineered Products (ATEP) ATOI of +$17M; EBITDA margin at 18.7%, above 1Q’15 of 14.1%
Year-over-year improvement driven by productivity and
ATEP 1
1Q15 amounts have been revised to remove impact of metal price lag; see appendix for
additional information & EBITDA reconciliation.
2 ATEP: created from RTI acquisition. 3 EBITDA margin excludes impact of $4.7 million of transaction costs 11 2 3 1 rd st st st nd 3 2 Quarter Year-over-Year Outlook $66 $6 $1 $162 $156 $17 $ Millions |
 [Alcoa logo] $ Millions 1Q 15 4Q 15 1Q 16 3 Party Revenue ($ Millions) 471 444 429 ATOI ($ Millions) 38 40 39 EBITDA Margin 13.4% 14.6% 14.9% 2 Quarter Year-over-Year Outlook 1 Quarter ATOI Performance Bridge 1Q16 Actual and 2Q16 Outlook – Transportation and Construction Solutions TCS: Strong Productivity Offsets Market Headwinds Improving N.A. Non-Residential Construction with sustained levels in
Europe N.A. Heavy Duty Truck build rates continue to decline, slightly offset
by improvement in Europe
Brazil’s current economic environment continues to negatively impact business results Robust productivity gains
throughout the business ATOI
is expected to be flat year-over-year at current currencies Revenue down 9% year-over-year; attributable to
N.A. Heavy Duty Truck
and relatively weak Brazilian
markets Record Q1 EBITDA margin of 14.9%
N.A. Non-Residential Construction remains solid; softness continues in Europe N.A. Heavy Duty Truck build rates continue to decline; Europe continues to improve; bright spots in Asia Pacific Strong Productivity actions offset cost increases and revenue decline
1 Quarter ATOI Results 1 Quarter Business Highlights 1. 1Q15 amounts have been revised to remove impact of metal price lag See appendix for additional information and EBITDA reconciliation. $19 $0 $39 $38 1Q16 Productivity -$11 Price / Mix Cost Increases Volume -$6 Currency -$1 1Q15 12 st st st nd rd 1 |
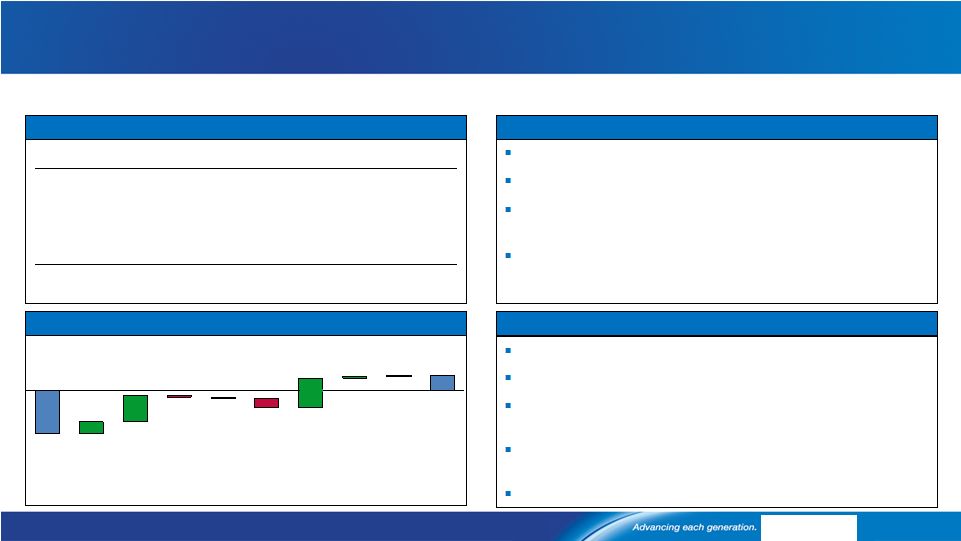
 [Alcoa logo] Alumina: Pricing Headwinds Continue to Impact Earnings 1Q16 Actual and 2Q16 Outlook – Alumina API pricing down 19% sequentially, 40% year over year Announced curtailments drive
production down ~530
KMT Continued
productivity gains through strong cost control
Saudi Arabia refinery continues to
ramp-up,
now at 80% of name plate capacity
Production expected to be flat sequentially
~85% of 3 party shipments on API or spot pricing for 2016 API pricing follows 30-day
lag; LME pricing
follows 60-day lag Continue
expanding 3 party bauxite sales
and benefit from accelerated productivity program ATOI to be up $15M excluding pricing
and currency impacts 1Q 15
4Q 15 1Q 16 Production (kmt) 3,933 3,856 3,330 3 Party Shipments (kmt) 2,538 2,713 2,168 3 Party Revenue ($ Millions) 887 732 545 3 Party Price ($/MT) 344 267 249 ATOI ($ Millions) 221 98 8 1 Quarter ATOI Results 1 Quarter Business Highlights 2 Quarter Sequential Outlook $ Millions 1 Quarter ATOI Performance Bridge Cost Increases / Other $14 Energy Price / Mix -$8 Currency $1 $8 Volume -$6 API -$93 Prod- uctivity $0 LME 1Q16 $8 -$6 4Q15 $98 13 st st st rd rd rd rd rd nd |
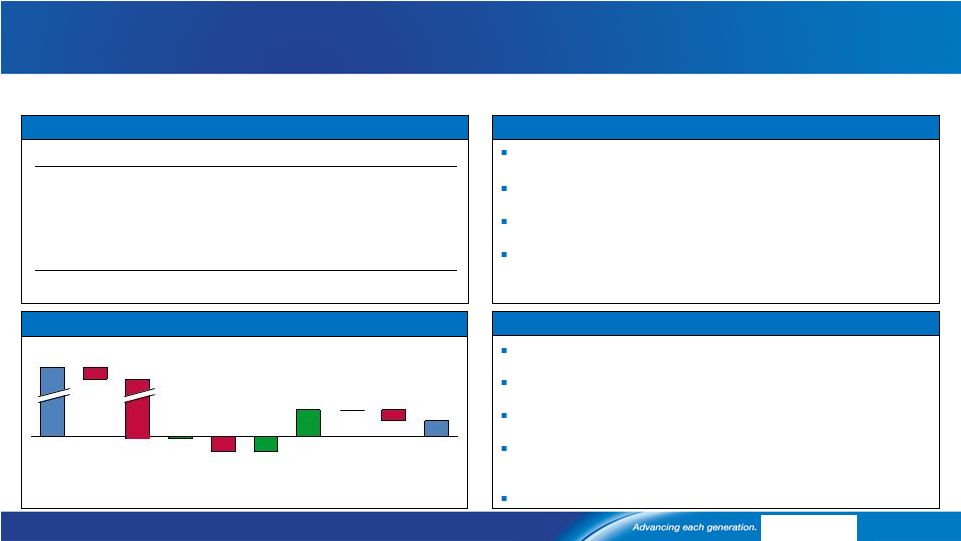
 [Alcoa logo] Primary Metals: Profitable Despite Difficult Pricing Environment $ Millions 1Q16 Actual and 2Q16 Outlook – Primary Metals -$9 -$1 -$2 $14 -$40 $1 $2 1Q16 Cost Incr. / Other Energy Currency API $25 Metal prices $11 4Q15 Price /Mix $27 Prod- uctivity Volume Realized price flat sequentially Announcement and execution of Warrick closure Lower alumina, raw materials, and productivity drive positive
ATOI for the quarter
Energy sales continue to decline, offset by seasonal
low prices in Spain
Announced curtailments drive production down ~50
KMT Pricing to follow a
15-day lag to LME
Lower prices for energy sales in Brazil and U.S. hit ATOI by $18M Accelerated productivity program and raw material pricing
more than offset energy headwinds ATOI to be up $10M excluding impact of pricing and currency
1Q 15 4Q 15 1Q 16 Production (kmt) 711 699 655 3 Party Shipments (kmt) 589 644 575 3 Party Revenue ($ Millions) 1,572 1,236 1,123 3 Party Price ($/MT) 2,420 1,799 1,793 ATOI ($ Millions) 187 (40) 14 1 Quarter ATOI Results 1 Quarter Business Highlights 1 Quarter ATOI Performance Bridge 2 Quarter Sequential Outlook 1 Metal Price = LME + Regional Premium; Regional Premium previously reported in Price/Mix category
14 rd rd rd st st st nd 1 |
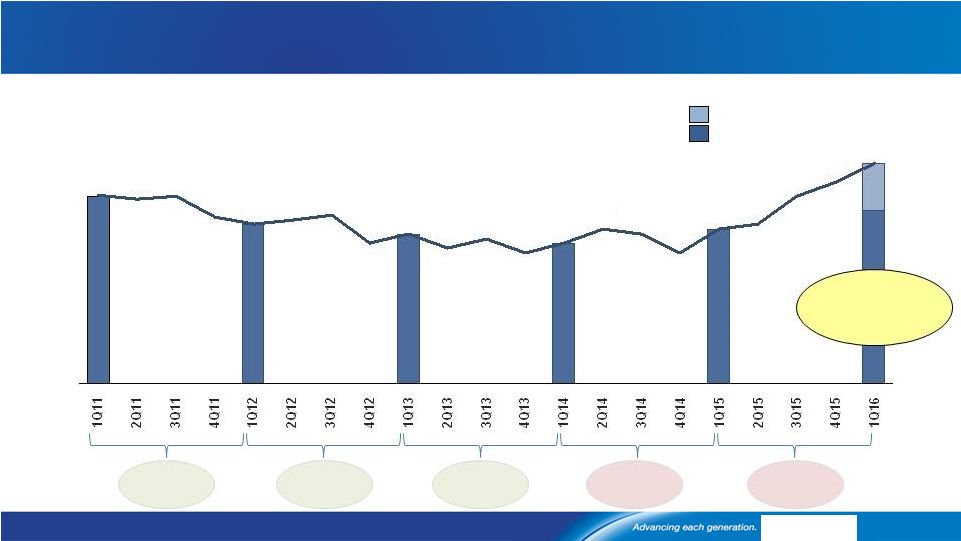 [Alcoa logo] 2 days lower Base Business DWC +4 days Year-over-Year, Acquisitions Add 10 days Average Days Working Capital since First Quarter 2011 6 days lower See appendix for days working capital reconciliation 2 days lower 14 days higher Acquisitions (10 days) Alcoa ex-Acquisitions (37 days) 37 4 days higher YoY from organic business 3 days higher 33 15 47 43 40 34 33 28 32 33 30 28 31 29 32 30 36 35 34 36 40 40 40 |
 [Alcoa logo] ($ Millions) 1Q15 4Q15 1Q16 Net Income (Loss) before Noncontrolling Interests $255 ($765) $11 Depreciation, Depletion and Amortization $321 $321 $309 Change in Working Capital ($595) $571 ($469) Pension Expense in Excess of Contributions $37 $13 $13 Other Adjustments ($193) $725 ($294) Cash from Operations ($175) $865 ($430) Dividends to Shareholders ($54) ($74) ($57) Change in Debt $24 ($122) - Net (Distributions)/Contributions from Noncontrolling Interests ($29) ($32) ($50) Other Financing Activities $33 ($2) - Cash from Financing Activities ($26) ($230) ($107) Capital Expenditures ($247) ($398) ($251) Acquisitions/Divestitures/Asset Sales ($212) - $222 Other Investing Activities ($6) ($59) $28 Cash from Investing Activities ($465) ($457) ($1) Free Cash Flow ($422) $467 ($681) Cash on Hand $1,191 $1,919 $1,384 Seasonal Working Capital Increase Drives FCF to ($681) Million 1Q15, 4Q15 and 1Q16 Cash Flow See appendix for Free Cash Flow reconciliation 16 |
 [Alcoa logo] 1Q16 Asset Sale Announcements Over $700 Million to be Generated by Announced Asset Sales DBNG Pipeline Remmele Company Owned Life Insurance Sell all of Alcoa of Australia’s 20% minority interest in the Australia Dampier to Bunbury Natural
Gas Pipeline
Western Australia’s principal gas transmission pipeline
and is the only pipeline connecting the gas reserves in the north to Perth customers ~$150M Cash Proceeds ~$100M ~$500M Q2 2016 A $70M contract manufacturer of medical devices,
including minimally invasive surgical tools, spinal,
drug infusion and dental implants, vascular
components, and urology instruments
Acquired in 2015 as part of RTI
transaction Q2 2016 Q1 & Q2 2016 Redemption of company-owned life insurance A portion sold in 1Q ($234M), with a second portion in 2Q Total Cash Proceeds ~$750M Closing 1 Alcoa of Australia is owned 60% by Alcoa Inc. and 40% by Alumina Limited. 1 Represents full year 2015 Pro forma revenue 17 1 2 |
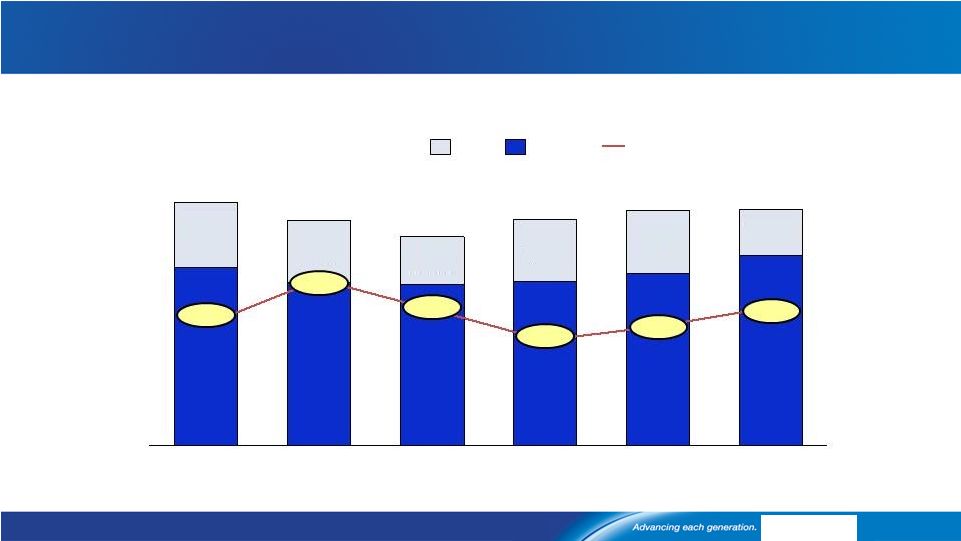 [Alcoa logo] 1Q16 9,069 7,685 2015 9,052 7,133 2014 8,787 6,910 2013 8,246 6,809 2012 8,744 6,883 2011 9,273 7,334 ($ Millions) Net Debt Cash Debt-to-LTM EBITDA 2.47 2.84 4.16 LTM = last twelve months; See appendix for Net Debt and LTM EBITDA reconciliations. Note: Debt amounts for 2011 – 2015 have been updated to reflect the adoption of FASB guidance (effective January 1, 2016) requiring presentation of debt issuance costs as a reduction to debt rather than as a
noncurrent asset. Debt, Net Debt, and Debt-to-LTM
EBITDA Cash on hand at $1.4 Billion
2.79 3.24 3.28 18 1,939 1,861 1,437 1,877 1,919 1,384 |
 [Alcoa logo] China 1.0 0.9 China 0.4 0.9 0.8 6.5% 4.0% 1.5% -0.3% 7.0% 7.0% 4.0% 3.0% -0.4% -0.5% 2016 Aluminum Demand growth at 5% while supply only grows at 2% Primary aluminum demand and supply by region 2016 Primary Aluminum Demand & YoY Growth (Mt) 2016 Primary Aluminum Supply & YoY Growth (Mt) -12.0% 1.5% 3.0% 2.0% 0.0% 25.0% 0.0% 8.0% 0.0% 0.0% 59.7 Mt 58.7 Mt Russia Brazil Other 1 MENA SE Asia India North Asia Europe North America Russia Brazil Other 1 MENA SE Asia India North Asia Europe North America ROW +3% China +6.5% Global +5% Global +2% ROW +1.5% China +3% Source: Alcoa analysis, CRU, Wood Mackenzie, IAI, CNIA, NBS, Aladdiny; figures rounded;
1 Other includes Africa, E. Europe, Latin America ex Brazil, Oceania, Other Asia 19 30.8 7.0 6.8 4.2 2.4 2.3 2.2 2.2 31.7 4.0 4.0 2.7 5.6 4.9 3.7 |
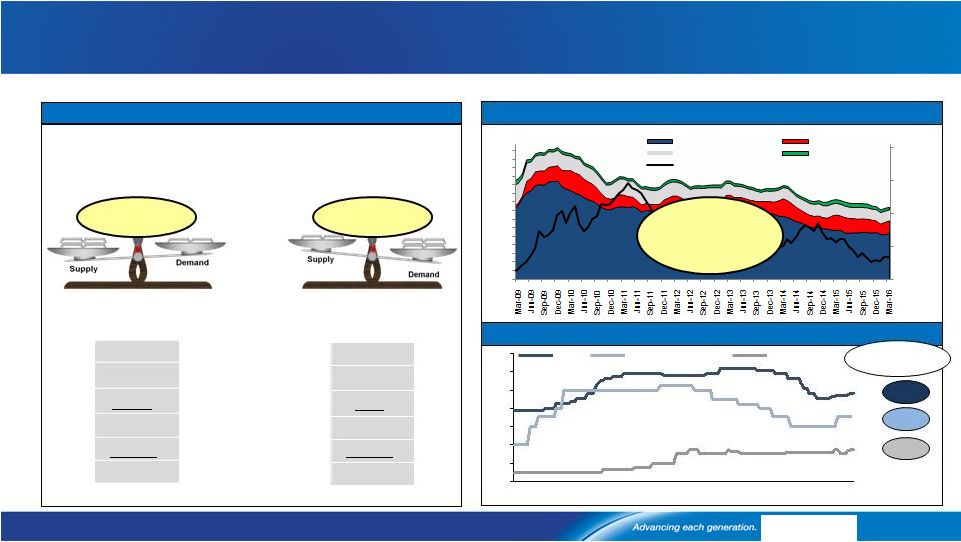 [Alcoa logo] Aluminum Deficit Continues; Projected at 1.1Mmt Source: Alcoa analysis, CRU, Wood Mackenzie, IAI, CNIA, NBS, Aladdiny, Bloomberg
Aluminum fundamentals overview
Premiums have started to stabilize ($/t)
220 200 180 160 140 120 100 80 03/31/16 150 01/01/16 10/01/15 USA Japan Europe (Duty Paid) Changes since Oct./Nov. Lows +$30 +$25 Global Inventories at 59 days; -5 days YoY Continue to see global deficit in 2016 2016E Aluminum Balance (kmt) China Rest of World Surplus 930 Deficit (1,980) Prod. at Beginning Run Rate Prod. to be Added/Restarted Prod. to be Closed/Curtailed Total Supply Demand Net Balance +$19 Global Inventories down 45% from 2009 Peak of 108 days 20 $1,200 $1,700 $2,200 $2,700 $3,200 0 7 14 21 28 35 42 49 56 63 70 77 84 91 98 105 Financed Stocks China Incl SRB Producer Japan Port LME Cash 176 115 China 30,700 3,400 (2,390) 31,710 (30,780) 930 Rest of World 26,620 760 (410) 26,970 (28,950) (1,980) |
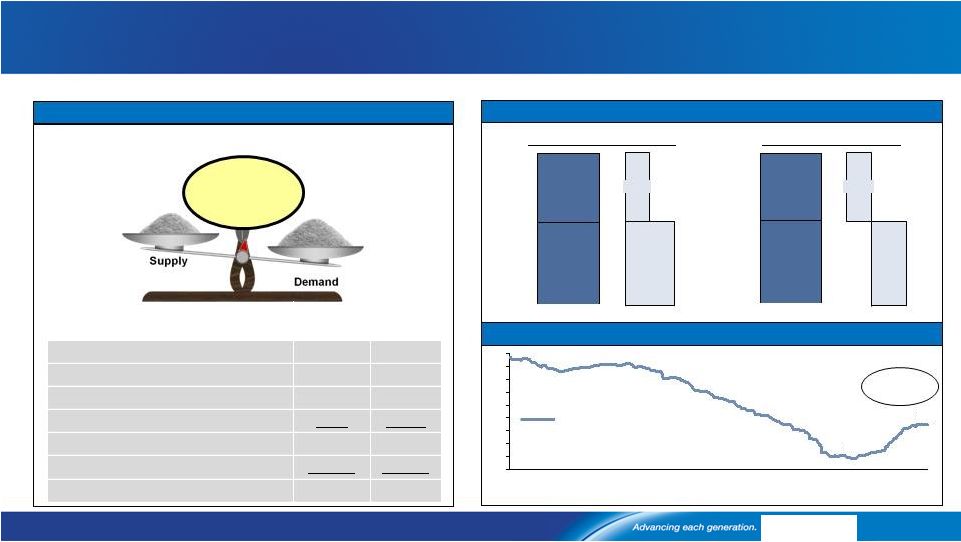 [Alcoa logo] 280 300 320 340 360 240 260 200 180 220 Mar 2016 Jan 2016 Jul 2015 Jan 2015 Alumina Deficit at 1.4Mmt; Refining Curtailments Support Price Source: Alcoa analysis, CRU, Wood Mackenzie, IAI, CNIA, NBS, Aladdiny, Bloomberg
*Alumina price = FOB WA price
Alumina fundamentals overview
Demand growth at 4% while supply only grows at 1% in 2016
Price has started to recover ($/t)
Alumina Price* +$52 vs. Jan. Lows China Rest of World 2016 Prod. at Beginning Run Rate 57,500 56,740 2016 Prod. to be Added/Restarted 4,370 1,410 2016 Prod. to be Closed/Curtailed (3,790) (3,020) Imports/(Exports) – Full Year 4,360 (4,360) Total Supply 62,440 50,770 Demand (62,300) (52,330) Net Balance 140 (1,560) Continue to see large deficit for 2016 2016E Alumina Balance (kmt) ROW China 52.3 62.3 5.6% 2.7% 50.8 China 62.4 ROW -3.2% 4.5% Demand & YoY Growth (Mt) Supply & YoY Growth (Mt) 114.6 Mt 113.2 Mt 21 Deficit (1,420) 249 197 |
 [Alcoa logo] Klaus Kleinfeld Chairman and Chief Executive Officer 22 April 11, 2016 |
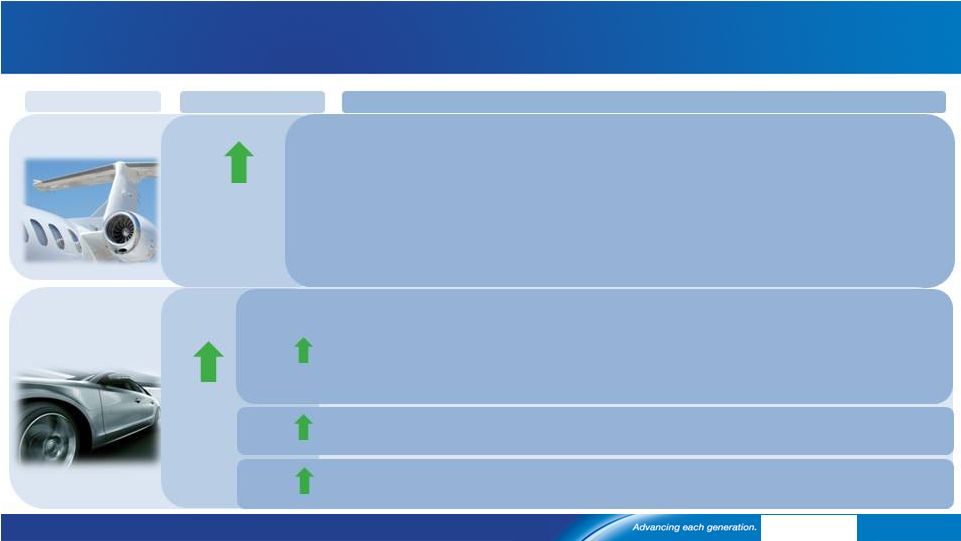 [Alcoa logo] Aerospace Growth at Lower Pace; Continued Growth in Automotive End Market 2016 Growth Global and Regional Commentary Source: Alcoa analysis 1) International Air Transport Association 2016 Expectations 2) IHS (Jul 2015)
Alcoa End Markets: Current Assessment of 2016 vs. 2015
Aerospace 6% to 8% Global sales growth Automotive E.U. 1% to 4% China 2% to 5% N.A. 1% to 5% • Market Transition given unprecedented level of New Model Introductions • Lower Orders for Legacy models + Careful Ramp-Up of new models due to simultaneous launch of new technologies (body + engine) and supply chain changes
• Large Commercial Aircraft Deliveries +9% • Strong Commercial Jet Order Book of ~14,600 planes : >9 Years Production at 2015 delivery rates ; ~23,800 engines on firm order • Solid Airline Fundamentals 1 : -’16FC +6.9% Passenger
(’15:
+6.7%);
+2.8% Cargo (’15: 1.7%);
- Record Airline Profitability expected ($36B); - Global trend in tact: +Middle Class AND +Urbanization • Cancellations (2015 LCA) Below 5-Year Average and <2% of Gross Order Book • Production Up: +7.4%YTDFeb’16 (2.88M vehicles) • Strong Sales: U.S. sales +3.1%YTDMar ‘16; Light Truck penetration at 57.9% of market • Sustained demand:
Vehicles 12+ years old continue to grow and will increase 15% by 2020 2 • Stable Inventory: 65 days (industry target is 60-65 days) • Average transaction price up 2% (Mar’16 vs. Mar’15) driven by continued strength in Light Truck; ratio of incentives to transaction price
relatively flat • Rising Production: +1.9%YTDFeb ‘16, West up +4.3%YTD(89%
share) , offsets East, down -14.0%YTD (11% share) • Strong Registrations: +10.1%YTDFeb’16;
Exports to increase 6.9% in 2016 (+1.9% in
2015) •
Recovering Production:
+3.9%YTD Feb’16 and -1.2%YoY(Feb’16 vs. Feb’15) • Sales +4.1%YTDFeb’15 and -1.3%YoY (Feb’16 vs. Feb’15) driven by tax incentives and light truck demand • Growth propelled by increasing middle class, exports,
and evolving emissions policies 23 1% to 4% Global production growth |
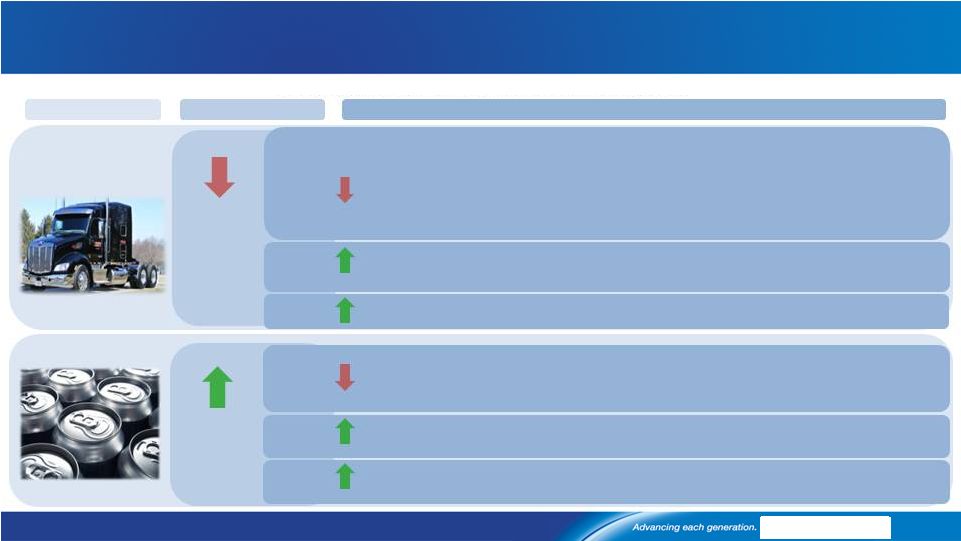 [Alcoa logo] HDT – N.A.: Further Decline, Strength in Europe; Packaging Stable End Market 2016 Growth Global and Regional Commentary Alcoa End Markets: Current Assessment of 2016 vs. 2015 Source: Alcoa analysis. HDT = Heavy Duty Truck. Packaging: 2016 Projections Packaging 1% to 3% Global sales growth N.A. -1% to 0% E.U. 1% to 2% China 5% to 8% • Demand decline: Weakness (-1% to -2%) in Carbonated
Soft Drinks (CSD) • Moderate growth in Beer Segment
(+1% to +2%) to partially offset CSD
• Growth led by modest growth (1% to 2%) in Western Europe,
partially offset by downward pressure in Eastern Europe
(primarily declines in Russia) •
Growth led by aluminum can penetration from glass in beer segment Heavy Duty Truck and Trailer N.A. -23% to -27% E.U. 1% to 5% China 1% to 4% • Declining Production: Down 19.0% YTD Feb’16 at 40.4k vs. 49.9k trucks • Weak Freight Growth: Freight tonmiles up 0.2% YTD Feb ’16 • Weak Orders: Down 42.0% YoY (Feb’16 vs. Feb‘15) • Climbing Inventory: Up 15.6% YoY (Feb’16 vs. Feb‘15) at 66.8k [10-year average 47.4k] • Falling Orderbook: At 131.0k, down 30.9% YoY (Feb’16 vs. Feb‘15), and down 1.9% month- over-month. This still remains above its 10-year historical avg. of
101k • Strength in WEU: Production up 20.0% YoY (Feb’16 vs. Feb’15) and up 20.9% YTD Feb ’16; • Registrations up 21.8% YTD Feb ’16, despite
Orders down 2.7% YTD Feb ’16 • Decline in EEU: Production down 8.6% YTD (Feb ‘16) from Russia and Turkey weakness • Strong Sales: Up 26.8% YoY (Feb’16 vs. Feb‘15) , and up 6.3% YTD Feb ’16 • Production Turning: Down 1.3% YoY (Feb’16 vs. Feb‘15) , and down 7.3% YTD Feb ’16 24 -4% to 0% Global production decline |
 [Alcoa logo] Commercial B&C and Global Airfoil Market Continue to Grow 25 End Market 2016 Growth Global and Regional Commentary Source: Alcoa analysis; B&C = Building and construction.
Alcoa End Markets: Current Assessment of 2016 vs. 2015
Industrial Gas Turbines 2% to 4% Global airfoil market growth • Market moving towards higher value-add product as customers develop new, high efficiency turbines with
advanced technology •
New heavy duty gas turbine units ordered +12% in 2015 (globally) • U.S. (60 Hz) gas-fired generation +18.5% in 2015 driving strong demand for
spares and component upgrades
on existing turbines •
2015 OECD electricity demand up 0.7% y/y but still 0.6% below 2008 levels
Building and Construction N.A. 4% to 6% E.U. 0% to -2% China 3% to 5% 4% to 6% Global sales growth • Non-Residential Contracts Awarded: +4.7% in Feb. (mean of 12-month rolling average)
• Architectural Billings Index Relatively Steady: In 2015, it averaged 51.6, with only Aug.’15 registering below 50 at 48.8. In Feb.’16 it was 50.3, up from 49.6 in Jan.’16
• Housing Starts up +10.6% in 2015 (vs. 2014); starts grew +5.2% in Feb’16 (vs. Jan 16) • Flat to slight decline as E.U.
economies continue to stabilize, outlook varies by country • Continued moderation of growth in
2016 from 5% in 2015 and 8% in 2014 |
 [Alcoa logo] Future Arconic: GRP and TCS on 3-Year Target; EPS New 2016 Goal 26 1Q16 Arconic Performance and 2016 Goals GRP TCS EPS 3 rd Party Revenue 2 ($B) EBITDA (%, $/MT) 1Q 2016
Highlights •
Revenue $1,397M; auto shipments up 38% • Strong productivity; $374 1 EBITDA/MT • Portfolio: Strength in auto Improving Mix
• Revenue at $429M • Strong productivity; Record 1 st quarter EBITDA Margin 14.9% • Portfolio: BCS improving; LA extrusions weak 2Q 2016 Outlook • ATOI up 5-7% YoY
excluding $15M impact to secure
alternative metal supply at Warrick
• ATOI flat
YoY • ATOI up 5-10% YoY
2016 Goal • Record 1 st quarter revenue $1,449M • Strong productivity; EBITDA Margin
21.0% • Portfolio: ATEP ahead; FR progressing 1) EBITDA/MT includes impact from Warrick cold metal program. Without that impact, EBITDA/MT is $390 2) 3-Yr Target Revenue
adjusted for FX/LME: GRP $(0.9)M; TCS $(0.2)M 3) Does not
include impact of announced sale of Remmele Medical Business 4) Excludes Warrick CMP impact. See appendix for EBITDA reconciliations 6.0-6.2 7.2 2.1 2.0-2.2 6.0-6.2 6.1 ~23% ~15% $344/MT 4 $344/MT ~15% 3-Yr Target 2016 Goal 3-Yr Target 2016 Goal 3-Yr Target 2016 Goal 3 21-22% |
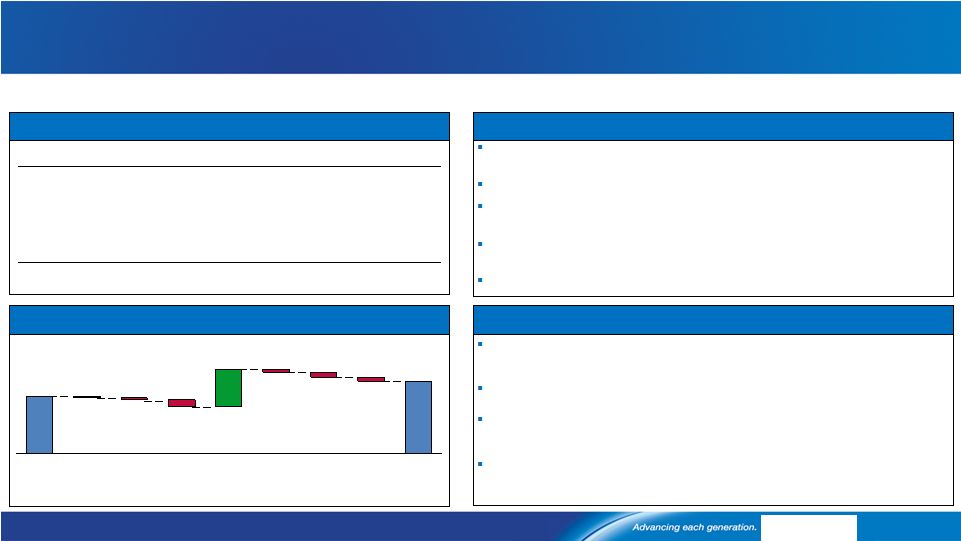
 $5.3B $1.3B 3 Year Target $4.7B $4.0B 2015 $2.5B $7.2B New Target $4.1B to $4.2B $1.9B to $2.0B $6.0B to $6.2B EPS 2016 Goal: $6.0-6.2B Revenue, 21%-22% EBITDA Margin 2016 EPS Revenue ($B) and EBITDA (%) Overview FX Aero Industry Headwinds Non-Aero Headwinds Firth Rixson
Share Gains (~ -$0.2B) (~ -$0.5B) (~ -$0.2B) (~ -$0.3B) (~ +$0.2B) 2016 2015 $161M $1,110M $949M $1,000M 2016 $1,260M to $1,360M $260M to $360M Productivity Cost Increases Competitive Pricing Share Gain and Market Full Year of RTI (ATEP) (~ +$400M) (~ -$280M) (~ -$100M) (~ +$60M) New Revenue Target of $6.0B to $6.2B New EBITDA Target of 21% to 22% 21.0% - 22.0% EBITDA margin 20.8% EBITDA margin Inorganic Organic ~23% EBITDA margin 1. Does not include impact of announced sale of Remmele Medical Business See appendix for EBITDA reconciliations (~ +$110M) 27 [Alcoa logo] 1 1 |
 Productivity o Operational Improvement o Accelerated Capture of Synergies Markets & Share Gains o Aerospace Market o Oil & Gas, Off-Highway Lower o Exiting Unprofitable Products o Entering New Engine Platforms o Optimizing Available Capacity Cost Increases o Production Ramp-up o Qualification Costs o Labor Costs Competitive Pricing o Legacy Contracts Firth Rixson: Improvement Underway; 2016 EBITDA Margin 14%-16% 2015-2016 EPS Firth Rixson Revenue ($B) and EBITDA ($M,%) Overview Q1 ’16 Actuals: $237M Revenue; 14.3% EBITDA Q1 ’15 Actuals: $232M Revenue; 11.6% EBITDA 2015 Actual $136M $0.9B $1.0 to $1.1B New 2016 Goal $150M to $170M 14.5% EBITDA margin 14.0% - 16.0% EBITDA margin (~ +$55M) (~ -$8M) (~ -$40M) (~ +$20M) Revenue EBITDA 28 [Alcoa logo] |
 1) ATEP
(RTI) pre-acquisition results exclude deal-related costs 2) Does not include impact of announced sale of Remmele Medical Business; Post the sale ATEP EBITDA margin target unchanged; revenue target range reduction dependent on timing (annual sales of $70 million). See appendix for EBITDA
reconciliations $794M
$810M – $830M $135M – $160M 2014 Actual 14.5% EBITDA margin 1Q 2015 Actual 1Q 2016 Actual 2016 Target 14.1% EBITDA margin 1 18.7% EBITDA margin ~17.0% - 19.0% EBITDA margin Pre-Acquisition: EBITDA Margin of ~14% 2014-2016 EPS ATEP Revenue ($M) and EBITDA ($M,%) Overview ATEP Ahead of Integration Plan, Delivering 17-19% EBITDA Margin in 2016 Accelerated Capture of Synergies is 1 year ahead Share Gains Ti Aluminide for engine programs Ti Mill Products for JSF B787 PiBox 3D Printing for Airbus $38M vs. $7.8M gross synergies target achieved to date Revenue EBITDA Revenue EBITDA Post-Acquisition: EBITDA Margin of 17%-19% 29 [Alcoa logo] $38M $203M $28M $198M $115M 2 |
 [Alcoa logo] GRP Shifting to Higher Margin Led by Automotive Growth Source: Alcoa Automotive Marketing See appendix for EBITDA reconciliations GRP Profitability and Auto Growth 133% 162% Aero, Transportation & Industrial Packaging GRP +62% -55% EBITDA/MT Indexed % change Shifting to a Higher Margin Product Mix GRP Growing Auto Revenue 2013 2011 2018P 2016E 2015 52% CAGR +17% GRP Automotive Sheet Revenue $M +2% +3% 0 30 60 100 140 180 2011 2013 2015 1Q'16 $1,300 $956 $634 $229 $117 |
 [Alcoa logo] Productivity Programs Achieved $364M1 of $1,200M Target through Q1’16 31 Alcoa Gross Productivity Program Q12016 Future Arconic Achieved $179M of $650M Target Future New Alcoa Achieved $175M of $550M Target Business Programs Procurement Overhead Business Programs Procurement Overhead $98M $70M $11M $27M $142M $6M 2016 Productivity $ Millions 2016 Productivity $ Millions 1) Productivity: Future Arconic = $179M; Future New Alcoa = $175M; Corporate = $10M
$179M $175M $650M $550M |
 [Alcoa logo] 500 0 10 20 30 40 60 50 0 1,000 3,000 2,500 2,000 1,500 40 100 20 60 80 0 120 400 500 100 0 300 200 New Alcoa: Driving Down Cost Curve in 2016, Meeting 3-Year Targets 32 1Q16 New Alcoa Highlights and 2016 Targets Alumina: 21 Percentile 1Q 2016 Highlights 2016 Targets $/MT Reshaping portfolio: Warrick smelter closed March
24 First full quarter with Wenatchee curtailed Saudi Arabia smelter Q1 record low cost/ton Lowering costs: $107m gross productivity Cash cost per ton declined $145/ton,
10% sequentially
Reshaping Portfolio:
Curtailed 1.2 mmt at Pt. Comfort Saudi Arabia refinery at 80% of capacity First full quarter with Suralco
curtailed Lowering costs: $68m gross productivity Cash cost per ton declined
$15/ton, 7% sequentially
Aluminum: 38 Percentile
$/MT 2Q 2016 Outlook ATOI up $10M from Q1 excluding pricing and currency impacts ATOI up $15M
from Q1 excluding pricing and currency impacts Alumina Aluminum 2010: 30 th Percentile 2015: 23 rd Percentile 2016: 21 st Percentile Production (MMT) 2010: 51 st Percentile Production (MMT) 2016: 38 th Percentile 2015: 43 rd Percentile st th |
 [Alcoa logo] Executing Separation – On Course for Second Half of 2016 33 Separation Approximate Timeline and Path to Completion 4Q 2015 1 st Half 2016 2 nd Half 2016 Launched New
Value-Add Name and Brand and Refreshed Alcoa
Brand Separate
Supplier/Partner Contracts
Form 10 Filing - e.g., – 3-Year Carve-Out and 1-Year Pro-Forma Financials – Form of Separation and Legal Structure – Capital Structure – Allocation of Assets and Liabilities – Governance Structure Form 10 Effectiveness and Final Board Approval Complete Separation of IT Systems and Infrastructure Complete Financing Begin Trading as Two Companies Launched the Separation Program Office Announced the Executive Management Teams Confirmed U.S. Domicile for Both Companies Launched New Business Improvement Programs for 2016 – Value-Add to Deliver $650M – Upstream to Deliver $600M – Above Includes Overhead Reductions Across
Alcoa
($100M 1 in 2016, $225M over two years) 1) $50M of $100M to be realized in 2016 comes from Value-Add, remaining $50M from Upstream. |
 [Alcoa logo] Successfully Launched Two Strong Brands Ahead of Separation 34 Arconic and New Alcoa branding |
 [Alcoa logo] Arconic Geared for Profitable Growth; Significant Aero, Auto Traction Robust Business Improvement Programs to Strengthen Both Portfolios Pulling All Upstream Levers to Improve Profitability 35 On Track to Separate into Two Strong Companies On Track for Completing Separation 2 nd Half of 2016 |
 [Alcoa logo] Matthew Garth Vice President, Investor Relations and FP&A Alcoa 390 Park Avenue New York, NY 10022-4608 Telephone: (212) 836-2674 Email: matthew.garth@alcoa.com www.alcoa.com Additional Information 36 |
 [Alcoa logo] |
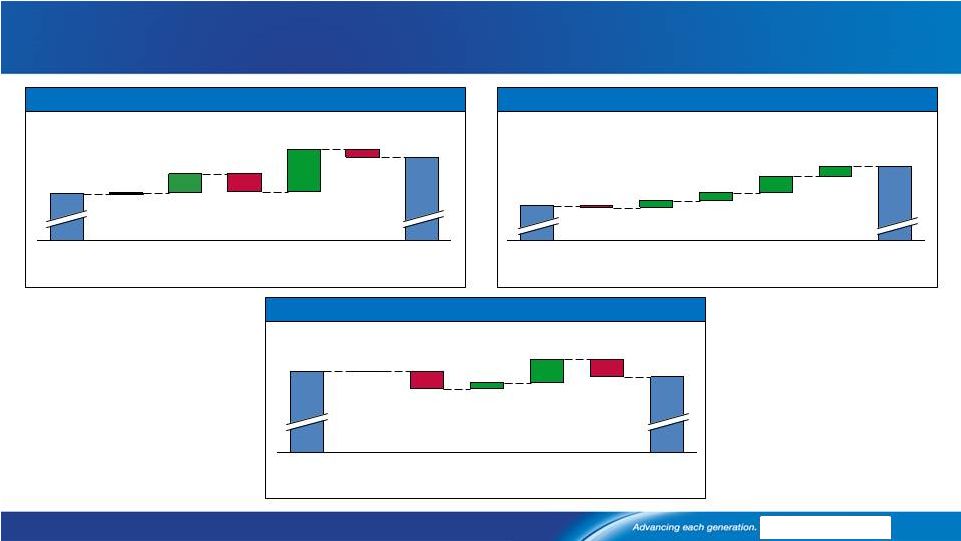 [Alcoa logo] EPS Sequential Quarter Bridge Value Add Segment Bridges – 1Q 2016 GRP Sequential Quarter Bridge EPS = Engineered Products and Solutions GRP = Global Rolled Products
TCS = Transportation and Construction Solutions
4Q15 $123 Price / Mix -$19 Volume $20 Currency $1 1Q16 $162 Cost Increases/ Other -$9 Productivity $46 TCS Sequential Quarter Bridge $4 Price / Mix $1 Volume -$3 Currency 1Q16 $39 Cost Increases/ Other -$3 Productivity $0 4Q15 $40 1Q16 $68 Cost Increases / Other $4 Prod- uctivity $7 4Q15 $52 Price / Mix $3 Volume $3 Currency -$1 38 $ Millions $ Millions $ Millions |
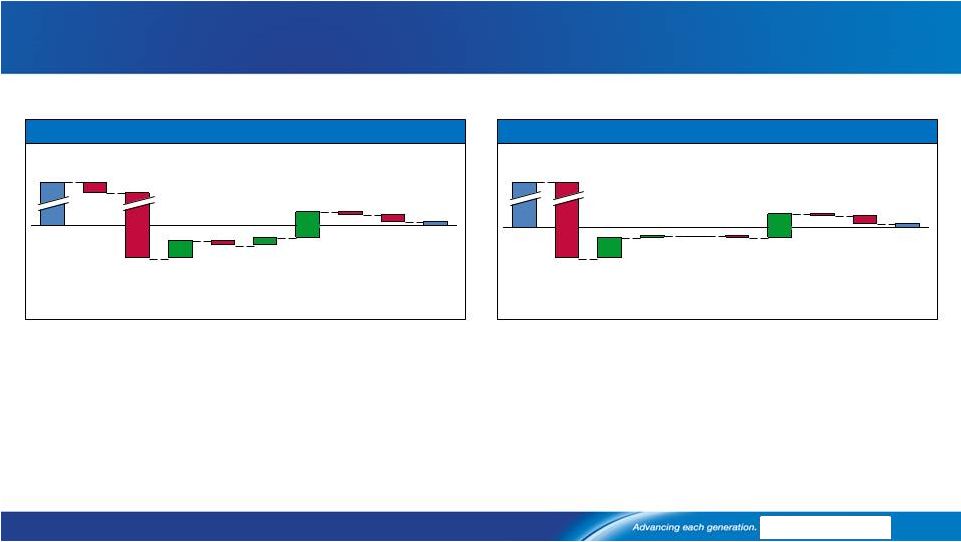 [Alcoa logo] Upstream Segment Bridges – 1Q 2016 Volume -$10 $8 Cost Increases / Other -$13 Energy Currency $34 API -$261 LME -$20 1Q15 $221 -$5 Prod- uctivity $47 Price / Mix $15 1Q16 Alumina Year-over-Year Bridge Primary Metals Year-over-Year Bridge $70 Metal Prices -$288 1Q15 $187 1Q16 $14 Cost Increases / Other -$24 Energy -$8 Prod- uctivity $77 Price / Mix -$5 Volume -$1 Currency $6 API 39 $ Millions $ Millions |
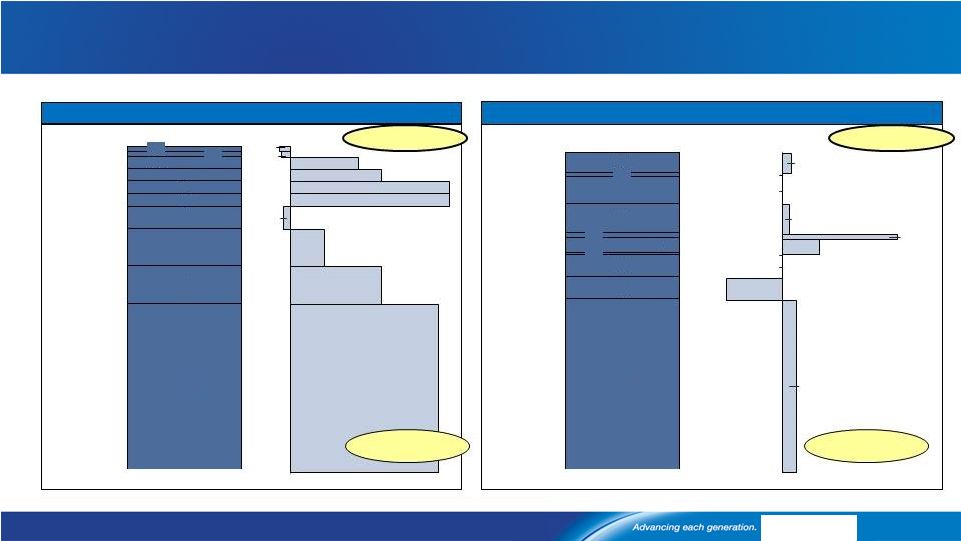
 [Alcoa logo] Revenue Change by Market - 1Q 2016 2% 25% 7% 0% (14%) 0% 27% (10%) 7% (26%) (9%) 8% 10% (4%) (3%) (21%) (16%) 52% (18%) 13% (39%) (29%) 1Q16 Third-Party Revenue Sequential Change Year-Over-Year Change 40 27% 4% 2% 6% 6% 5% 2% 11% 3% 11% 23% Aerospace Automotive Brazing B&C Comm. Transport Industrial Products IGT Packaging Distribution/Other Alumina Primary Metals |
 [Alcoa logo] Composition of Upstream Production Costs Input Cost Inventory flow Pricing convention Annual ATOI Sensitivity Fuel oil 1 – 2 months Prior month $2m per $1/bbl Natural gas N/A N/A N/A Caustic soda 3 - 6 months Spot & semi- annual $6m per $10/DMT Refining Cost Structure Smelting Cost Structure Input Cost Inventory flow Pricing convention Annual ATOI Sensitivity Coke 1 - 2 months Spot, quarterly & semi-annual $5m per $10/MT Pitch 1 - 2 months Spot, quarterly & semi-annual $1m per $10/MT 1 Natural gas information related to Point Comfort will no longer apply as we are curtailing the plant. Australia
is priced on a rolling 16 quarter average
41 Alumina 31% Carbon 13% Power 24% Materials 7% Conversion 25% Fuel Oil 7% Natural gas 13% Caustic 10% Bauxite 26% Conversion 44% 1 |
 [Alcoa logo] Alcoa Upstream Capacity Closed, Sold, and Idled Facility Year kmt Baie Comeau 2008 53 Eastalco 2010 195 Badin 2010 60 Tennessee 2011 215 Rockdale 2011 76 Baie Comeau 2013 105 Fusina 2013 44 Massena East 2013 41 Massena East 2014 84 Point Henry 2014 190 Portovesme 2014 150 Mt. Holly (sale) 2014 115 Pocos 2015 96 Warrick 2016 269 Total 1,693 Closed/sold since December 2007 Facility Year kmt Portland 2008 30 Rockdale 2008 191 Aviles 2012 32 La Coruna 2012 24 Sao Luis 2013 97 Sao Luis 2014 97 Sao Luis 2015 74 Wenatchee 2015 184 Total 729 Smelting Capacity Idled Refining Capacity Facility Year kmt Jamalco (sale) 2014 779 Total 779 Closed/sold since December 2007 Facility Year kmt Point Comfort 2008 340 Suriname 2009 870 Suriname 2015 1,337 Point Comfort 2016 1,508 Total 4,055 Idled 42 |
 [Alcoa logo] Reconciliation of ATOI to Consolidated Net Income (Loss) Attributable to Alcoa (in millions) 1Q15 2Q15 3Q15 4Q15 2015 1Q16 Total segment ATOI $656 $567 $410 $273 $1,906 $291 Unallocated amounts (net of tax): Impact of LIFO 7 36 50 43 136 4 Metal price lag (23) (39) (48) (23) (133) 1 Interest expense (80) (80) (80) (84) (324) (83) Noncontrolling interests (60) (67) (62) 64 (125) 5 Corporate expense (62) (65) (72) (67) (266) (55) Impairment of goodwill – – – (25) (25) – Restructuring and other charges (161) (159) (48) (575) (943) (61) Other (82) (53) (106) (307) (548) (86) Consolidated net income (loss) attributable to Alcoa $195 $140 $44 $(701) $(322) $16 43 |
 [Alcoa logo] Reconciliation of ATOI to Consolidated Net Income (Loss) Attributable to Alcoa (1) – Supplemental View (in millions) 1Q14 2Q14 3Q14 4Q14 2014 1Q15 2Q15 3Q15 4Q15 2015 1Q16 Total segment ATOI (2) $320 $408 $581 $659 $1,968 $656 $567 $410 $273 $1,906 $291 Unallocated amounts (net of tax): Impact of LIFO (7) (8) (18) (21) (54) 7 36 50 43 136 4 Metal price lag (2) 7 11 38 22 78 (23) (39) (48) (23) (133) 1 Interest expense (78) (69) (72) (80) (299) (80) (80) (80) (84) (324) (83) Noncontrolling interests (20) (13) (29) (72) (134) (95) (87) (92) (25) (299) 3 Corporate expense (66) (58) (68) (60) (252) (56) (60) (55) (55) (226) (38) Other (58) (55) (62) (16) (191) (46) (87) (76) (64) (273) (70) Income excluding special items 98 216 370 432 1,116 363 250 109 65 787 108 Special items (3) (276) (78) (221) (273) (848) (168) (110) (65) (766) (1,109) (92) Consolidated net (loss) income attributable to Alcoa $(178) $138 $149 $159 $268 $195 $140 $44 $(701) $(322) $16 44 (1) In the third quarter of 2015, management approved a realignment of Alcoa’s Engineered Products and Solutions segment due to the
expansion of this part of Alcoa’s business portfolio through both organic and
inorganic growth. A portion of this realignment consisted of moving
the Latin American extrusions business from Corporate into a new Transportation and Construction Solutions segment (see the Reconciliation of Transportation and Construction Solutions Adjusted EBITDA for additional
information). Segment information for all prior periods presented was revised to
reflect the new segment structure. (2)
Effective in the second quarter of 2015, management removed the impact of metal price
lag from the results of the Global Rolled Products and Engineered Products
and Solutions (now Engineered Products and Solutions and Transportation and
Construction Solutions –
see footnote 1 above) segments in order to enhance the visibility of the underlying
operating performance of these businesses. Metal price lag describes the timing difference created when the average price of metal sold differs from the average cost of the metal when purchased by the respective segment. The impact of metal price lag is now reported as a separate line item in Alcoa’s reconciliation of total segment ATOI to consolidated net (loss) income attributable to Alcoa.
As a result, this change does not impact the consolidated results of
Alcoa. Segment information for all prior periods presented
was updated to reflect this change.
(3) Special items are defined as restructuring and other charges, discrete tax items, and other special items. See the Reconciliation of
Adjusted Income for additional information. NOTES FOR CORPORATE AMOUNTS:
LIFO and Metal price lag – these items tend to offset each other over time as the same underlying market conditions typically drive both amounts. Noncontrolling interests – primarily represents Alumina Limited’s 40% share of the operating results of the Alcoa World Alumina and Chemicals joint venture, which principally comprises Alcoa’s Alumina segment. Corporate expense – represents general and administrative expenses attributable to Alcoa’s corporate and business support locations, as well as costs associated with Alcoa’s corporate research and development center. Other – includes all other income and expenses not included in the segments, primarily: postretirement benefits and environmental remediation costs
associated with certain closed or divested businesses; various corporate
eliminations of inter-segment transactions; certain corporate foreign currency gains and losses; and the impact of the difference between the income tax rates applicable to the segments
and the consolidated effective tax rate of the Company.
|
 [Alcoa logo] Reconciliation of Adjusted Income (Loss) (in millions, except per-share amounts) Income (Loss) Diluted EPS (3) Quarter ended Quarter ended March 31, December 31, March 31, March 31, December 31, March 31, 2015 2015 2016 2015 2015 2016 Net income (loss) attributable to Alcoa $195 $(701) $16 $0.14 $(0.55) $0.00 Restructuring and other charges 158 507 61 Discrete tax items (1) – 187 2 Other special items (2) 10 72 29 Net income attributable to Alcoa – as adjusted $363 $65 $108 0.28 0.04 0.07 Net income (loss) attributable to Alcoa – as adjusted is a non-GAAP financial measure. Management believes that this measure is meaningful to investors because management reviews the operating results of Alcoa excluding the impacts of restructuring and other charges, discrete tax items, and other special items (collectively, “special items”). There can be no assurances that additional special items will not occur
in future periods. To compensate for this limitation, management believes that it is appropriate to consider both Net income (loss) attributable to Alcoa determined under GAAP as well as Net income attributable to Alcoa – as adjusted. (1) Discrete tax items include the following: • for the quarter ended March 31, 2016, a net charge for a number of small items; and
• for the quarter ended December 31, 2015, a charge for valuation allowances related to certain U.S. and Iceland deferred tax assets ($190) and a
net benefit for a small number of items ($3). (2)
Other special items include the following:
• for the quarter ended March 31, 2016, costs associated with the planned separation of Alcoa ($17), an unfavorable tax impact resulting from the
difference between Alcoa’s consolidated estimated annual effective tax rate and the statutory rates applicable to special items ($8), an unfavorable tax impact related to the interim period treatment of operational losses in certain foreign jurisdictions for which no tax benefit was recognized
($2), and a write-down on inventory related to the permanent closure of the Warrick smelter ($2); • for the quarter ended December 31, 2015, a write-down of inventory related to the permanent closure or temporary curtailment of various facilities in Suriname and the United States ($28), an impairment of goodwill related to the soft alloy extrusion business in Brazil ($25), costs associated with the planned separation of Alcoa ($12), a net unfavorable change in certain mark-to-market energy derivative contracts ($5), and an unfavorable tax impact related to the interim period treatment of operational losses in certain foreign jurisdictions for which no tax benefit was recognized ($2); and • for the quarter ended March 31, 2015, an unfavorable tax impact related to the interim period treatment of operational losses in certain foreign jurisdictions for which no tax benefit was recognized ($35), a favorable tax impact resulting from the difference between Alcoa’s consolidated estimated annual effective tax rate and the statutory rates applicable to special items ($31), costs associated with acquisitions of aerospace
businesses ($7), and a net favorable change in certain mark-to-market energy derivative contracts ($1). (3) The average number of shares applicable to diluted EPS for Net income (loss) attributable to Alcoa common shareholders excludes certain share equivalents as their effect was anti-dilutive. However, certain of these share equivalents may become dilutive in the EPS calculation applicable to Net income attributable to Alcoa common shareholders – as adjusted due to a larger and/or positive numerator. Specifically: • for the quarter ended March 31, 2016, share equivalents associated with outstanding employee stock options and awards were dilutive based on Net income attributable to Alcoa common shareholders – as adjusted, resulting in a diluted average number of shares of • 1,324,558,308; • for the quarter ended December 31, 2015, share equivalents associated with outstanding employee stock options and awards were dilutive based on Net income attributable to Alcoa common shareholders – as adjusted, resulting in a diluted average number of shares of 1,324,378,133; and • for the quarter ended March 30, 2015, share equivalents associated with mandatory convertible preferred were diluted based on Net Income attributable to Alcoa common shareholders – as adjusted, resulting in a diluted average number of shares of 1,315,558,890. Additionally, the subtraction of preferred stock dividends declared from the numerator (see footnote 1 to the Statement of Consolidated Operations) needs to be reversed since the related mandatory convertible preferred stock was dilutive in the EPS calculation for Net income attributable to Alcoa – as adjusted. 45 |
 [Alcoa logo] Reconciliation of Alcoa Adjusted EBITDA ($ in millions) 2005 2006 2007 2008 2009 2010 2011 2012 2013 2014 2015 1Q15 4Q15 1Q16 Net income (loss) attributable to Alcoa $1,233 $2,248 $2,564 $(74) $(1,151) $254 $611 $191 $(2,285) $268 $(322) $195 $(701) $16 Add: Net income (loss) attributable to noncontrolling interests 259 436 365 221 61 138 194 (29) 41 (91) 125 60 (64) (5) Cumulative effect of accounting changes 2 – – – – – – – – – – – – – Loss (income) from discontinued operations 50 (22) 250 303 166 8 3 – – – – – – – Provision (benefit) for income taxes 464 853 1,623 342 (574) 148 255 162 428 320 445 226 44 30 Other (income) expenses, net (478) (236) (1,920) (59) (161) 5 (87) (341) (25) 47 2 (12) 29 34 Interest expense 339 384 401 407 470 494 524 490 453 473 498 122 129 127 Restructuring and other charges 266 507 268 939 237 207 281 172 782 1,168 1,195 177 735 93 Impairment of goodwill – – – – – – – – 1,731 – 25 – 25 – Provision for depreciation, depletion, and amortization 1,227 1,252 1,244 1,234 1,311 1,450 1,479 1,460 1,421 1,371 1,280 321 322 308 Adjusted EBITDA $3,362 $5,422 $4,795 $3,313 $359 $2,704 $3,260 $2,105 $2,546 $3,556 $3,248 $1,089 $519 $603 Sales $24,149 $28,950 $29,280 $26,901 $18,439 $21,013 $24,951 $23,700 $23,032 $23,906 $22,534 $5,819 $5,245 $4,947 Adjusted EBITDA Margin 13.9% 18.7% 16.4% 12.3% 1.9% 12.9% 13.1% 8.9% 11.1% 14.9% 14.4% 18.7% 9.9% 12.2% Alcoa’s definition of Adjusted EBITDA (Earnings before interest, taxes, depreciation, and amortization) is net margin plus an add-back for depreciation, depletion, and amortization. Net margin is equivalent to Sales minus the following items: Cost of goods sold; Selling, general administrative, and other expenses; Research and development expenses; and Provision for depreciation, depletion, and amortization. Adjusted EBITDA is a non- GAAP financial measure. Management believes that this measure is meaningful to investors because Adjusted EBITDA provides additional information with respect to Alcoa’s operating performance and the Company’s ability to meet its financial obligations. The Adjusted EBITDA presented may not be comparable to similarly titled measures of other
companies. 46 |
 [Alcoa logo] Reconciliation of Alumina Adjusted EBITDA ($ in millions, except per metric ton amounts) 2005 2006 2007 2008 2009 2010 2011 2012 2013 2014 2015 1Q15 4Q15 1Q16 After-tax operating income (ATOI) $682 $1,050 $956 $727 $112 $301 $607 $90 $259 $370 $746 $221 $98 $8 Add: Depreciation, depletion, and amortization 172 192 267 268 292 406 444 455 426 387 296 80 68 63 Equity loss (income) – 2 (1) (7) (8) (10) (25) (5) 4 29 41 7 14 14 Income taxes 246 428 340 277 (22) 60 179 (27) 66 153 300 92 36 5 Other (8) (6) 2 (26) (92) (5) (44) (8) (6) (28) 1 – 2 – Adjusted EBITDA $1,092 $1,666 $1,564 $1,239 $282 $752 $1,161 $505 $749 $911 $1,384 $400 $218 $90 Production (thousand metric tons) (kmt) 14,598 15,128 15,084 15,256 14,265 15,922 16,486 16,342 16,618 16,606 15,720 3,933 3,856 3,330 Adjusted EBITDA / Production ($ per metric ton) $75 $110 $104 $81 $20 $47 $70 $31 $45 $55 $88 $102 $57 $27 Alcoa’s definition of Adjusted EBITDA (Earnings before interest, taxes, depreciation, and amortization) is net margin plus an add-back for depreciation, depletion, and amortization. Net margin is equivalent to Sales minus the following items: Cost of goods sold; Selling, general administrative, and other expenses; Research and development expenses; and Provision for depreciation, depletion, and amortization. The Other line in the table above includes gains/losses on asset sales and other non-operating items. Adjusted EBITDA is a non-GAAP financial measure.
Management believes that this measure is meaningful to investors because Adjusted EBITDA provides additional information with respect to Alcoa’s operating performance and the Company’s ability to meet its financial obligations. The Adjusted EBITDA presented may not be comparable to similarly titled measures of other companies. 47 |
 [Alcoa logo] Reconciliation of Primary Metals Adjusted EBITDA ($ in millions, except per metric ton amounts) 2005 2006 2007 2008 2009 2010 2011 2012 2013 2014 2015 1Q15 4Q15 1Q16 After-tax operating income (ATOI) $822 $1,760 $1,445 $931 $(612) $488 $481 $309 $(20) $594 $155 $187 $(40) $14 Add: Depreciation, depletion, and amortization 368 395 410 503 560 571 556 532 526 494 429 109 105 102 Equity loss (income) 12 (82) (57) (2) 26 (1) 7 27 51 34 12 3 (3) (4) Income taxes 307 726 542 172 (365) 96 92 106 (74) 203 (28) 57 (42) (16) Other (96) (13) (27) (32) (176) (7) 2 (422) (8) (6) (2) (1) 1 (1) Adjusted EBITDA $1,413 $2,786 $2,313 $1,572 $(567) $1,147 $1,138 $552 $475 $1,319 $566 $355 $21 $95 Production (thousand metric tons) (kmt) 3,554 3,552 3,693 4,007 3,564 3,586 3,775 3,742 3,550 3,125 2,811 711 699 655 Adjusted EBITDA / Production ($ per metric ton) $398 $784 $626 $392 $(159) $320 $301 $148 $134 $422 $201 $499 $30 $145 Alcoa’s definition of Adjusted EBITDA (Earnings before interest, taxes, depreciation, and amortization) is net margin plus an add-back for depreciation, depletion, and amortization. Net margin is equivalent to Sales minus the following items: Cost of goods sold; Selling, general administrative, and other expenses; Research and development expenses; and Provision for depreciation, depletion, and amortization. The Other line in the table above includes gains/losses on asset sales and other non-operating items. Adjusted EBITDA is a non-GAAP financial measure.
Management believes that this measure is meaningful to investors because Adjusted EBITDA provides additional information with respect to Alcoa’s operating performance and the Company’s ability to meet its financial
obligations. The Adjusted EBITDA presented may not be comparable to similarly titled measures of other companies. 48 |
 [Alcoa logo] Reconciliation of Upstream(1) Adjusted EBITDA (in millions) 2008 2009 2010 2011 2012 2013 2014 2015 1Q15 4Q15 1Q16 After-tax operating income (ATOI) $1,658 $(500) $789 $1,088 $399 $239 $964 $901 $408 $58 $22 Add: Depreciation, depletion, and amortization 771 852 977 1,000 987 952 881 725 189 173 165 Equity (income) loss (9) 18 (11) (18) 22 55 63 53 10 11 10 Income taxes 449 (387) 156 271 79 (8) 356 272 149 (6) (11) Other (58) (268) (12) (42) (430) (14) (34) (1) (1) 3 (1) Adjusted EBITDA $2,811 $(285) $1,899 $2,299 $1,057 $1,224 $2,230 $1,950 $755 $239 $185 Alcoa’s definition of Adjusted EBITDA (Earnings before interest, taxes, depreciation, and amortization) is net margin plus an add-back for depreciation, depletion, and amortization. Net margin is equivalent to Sales minus the following items: Cost of goods sold; Selling, general administrative, and other expenses; Research and development expenses; and Provision for depreciation, depletion, and amortization. The Other line in the table above includes gains/losses on asset sales and other non-operating items. Adjusted EBITDA is a non-GAAP financial measure.
Management believes that this measure is meaningful to investors because Adjusted EBITDA provides additional information with respect to Alcoa’s operating performance and the Company’s ability to meet its financial
obligations. The Adjusted EBITDA presented may not be comparable to similarly titled measures of other companies. 49 (1) Upstream is composed of the Alumina and Primary Metals segments. |
 [Alcoa logo] Reconciliation of Global Rolled Products Adjusted EBITDA ($ in millions, except per metric ton amounts) 2005 2006 2007 2008 2009 2010 2011 2012 2013 2014 2015 1Q15 4Q15 1Q16 After-tax operating income (ATOI) $278 $233 $178 $(3) $(49) $220 $266 $358 $292 $245 $244 $54 $52 $68 Add: Depreciation, depletion, and amortization 220 223 227 216 227 238 237 229 226 235 227 56 59 56 Equity loss – 2 – – – – 3 6 13 27 32 9 8 11 Income taxes 121 58 92 35 48 92 104 167 123 89 109 36 20 34 Other 1 20 1 6 (2) 1 1 (2) – (1) (1) – – (1) Adjusted EBITDA $620 $536 $498 $254 $224 $551 $611 $758 $654 $595 $611 $155 $139 $168 Total shipments (thousand metric tons) (kmt) 2,250 2,376 2,482 2,361 1,888 1,755 1,866 1,943 1,989 2,056 1,836 447 446 449 Adjusted EBITDA / Total shipments ($ per metric ton) $276 $226 $201 $108 $119 $314 $327 $390 $329 $289 $333 $347 $312 $374 Alcoa’s definition of Adjusted EBITDA (Earnings before interest, taxes, depreciation, and amortization) is net margin plus an add-back for depreciation, depletion, and amortization. Net margin is equivalent to Sales minus the following items: Cost of goods sold; Selling, general administrative, and other expenses; Research and development expenses; and Provision for depreciation, depletion, and amortization. The Other line in the table above includes gains/losses on asset sales and other non-operating items. Adjusted EBITDA is a non-GAAP financial measure.
Management believes that this measure is meaningful to investors because Adjusted EBITDA provides additional information with respect to Alcoa’s operating performance and the Company’s ability to meet its financial
obligations. The Adjusted EBITDA presented may not be comparable to similarly titled measures of other companies. 50 |
 [Alcoa logo] Reconciliation of Engineered Products and Solutions Adjusted EBITDA ($ in millions) 2005 2006 2007 2008 2009 2010 2011 2012 2013 2014 2015 1Q15 4Q15 1Q16 After-tax operating income (ATOI) $183 $237 $351 $465 $321 $355 $436 $484 $569 $579 $595 $156 $123 $162 Add: Depreciation, depletion, and amortization 114 111 114 118 118 114 120 122 124 137 233 51 67 65 Income taxes 86 128 186 225 159 182 224 248 286 298 282 76 54 78 Other (12) 2 2 2 2 – – – – – – (1) – – Adjusted EBITDA $371 $478 $653 $810 $600 $651 $780 $854 $979 $1,014 $1,110 $282 $244 $305 Third-party sales $2,966 $3,406 $3,821 $4,215 $3,355 $3,225 $3,716 $3,863 $4,054 $4,217 $5,342 $1,257 $1,409 $1,449 Adjusted EBITDA Margin 12.5% 14.0% 17.1% 19.2% 17.9% 20.2% 21.0% 22.1% 24.1% 24.0% 20.8% 22.4% 17.3% 21.0% Alcoa’s definition of Adjusted EBITDA (Earnings before interest, taxes, depreciation, and amortization) is net margin plus an
add-back for depreciation, depletion, and amortization. Net margin is
equivalent to Sales minus the following items: Cost of goods sold;
Selling, general administrative, and other expenses; Research and development expenses; and Provision for depreciation, depletion, and amortization. The Other line in the table above includes gains/losses on asset sales and other non-operating
items. Adjusted EBITDA is a non-GAAP financial measure.
Management believes that this measure is meaningful to investors because Adjusted EBITDA provides additional information with respect to Alcoa’s operating performance and the Company’s
ability to meet its financial obligations. The Adjusted EBITDA presented may not
be comparable to similarly titled measures of other companies.
51 |
 [Alcoa logo] Reconciliation of Transportation and Construction Solutions Adjusted EBITDA ($ in millions) 2005 2006 2007 2008 2009 2010 2011 2012 2013 2014 2015 1Q15 4Q15 1Q16 After-tax operating income (ATOI) $94 $129 $94 $82 $5 $73 $109 $126 $167 $180 $166 $38 $40 $39 Add: Depreciation, depletion, and amortization 50 45 55 53 65 48 45 42 42 42 43 10 11 11 Equity loss (income) – 6 – – (2) (2) (1) – – – – – – – Income taxes 30 27 7 – (21) 18 38 49 67 69 63 14 14 14 Other 1 (4) (10) – – – (1) (9) (2) – (1) 1 – – Adjusted EBITDA $175 $203 $146 $135 $47 $137 $190 $208 $274 $291 $271 $63 $65 $64 Third-party sales $1,954 $2,204 $2,249 $2,270 $1,537 $1,656 $1,936 $1,914 $1,951 $2,021 $1,882 $471 $444 $429 Adjusted EBITDA Margin 9.0% 9.2% 6.5% 5.9% 3.1% 8.3% 9.8% 10.9% 14.0% 14.4% 14.4% 13.4% 14.6% 14.9% Alcoa’s definition of Adjusted EBITDA (Earnings before interest, taxes, depreciation, and amortization) is net margin plus an
add-back for depreciation, depletion, and amortization. Net margin is
equivalent to Sales minus the following items: Cost of goods sold;
Selling, general administrative, and other expenses; Research and development expenses; and Provision for depreciation, depletion, and amortization. The Other line in the table above includes gains/losses on asset sales and other non-operating
items. Adjusted EBITDA is a non-GAAP financial measure.
Management believes that this measure is meaningful to investors because Adjusted EBITDA provides additional information with respect to Alcoa’s operating performance and the Company’s
ability to meet its financial obligations. The Adjusted EBITDA presented may not
be comparable to similarly titled measures of other companies.
52 |
 [Alcoa logo] Reconciliation of Value Add (1) Adjusted EBITDA ($ in millions) 2008 2009 2010 2011 2012 2013 2014 2015 1Q15 4Q15 1Q16 After-tax operating income (ATOI) $544 $277 $648 $811 $968 $1,028 $1,004 $1,005 $248 $215 $269 Add: Depreciation, depletion, and amortization 387 410 400 402 393 392 414 503 117 137 132 Equity (income) loss – (2) (2) 2 6 13 27 32 9 8 11 Income taxes 260 186 292 366 464 476 456 454 126 88 126 Other 8 – 1 – (11) (2) (1) (2) – – (1) Adjusted EBITDA $1,199 $871 $1,339 $1,581 $1,820 $1,907 $1,900 $1,992 $500 $448 $537 Third-party sales $15,451 $10,961 $11,158 $13,294 $13,155 $13,111 $13,589 $13,462 $3,349 $3,275 $3,275 Adjusted EBITDA Margin 7.8% 7.9% 12.0% 11.9% 13.8% 14.5% 14.0% 14.8% 14.9% 13.7% 16.4% Alcoa’s definition of Adjusted EBITDA (Earnings before interest, taxes, depreciation, and amortization) is net margin plus an
add-back for depreciation, depletion, and amortization. Net margin is
equivalent to Sales minus the following items: Cost of goods sold;
Selling, general administrative, and other expenses; Research and development expenses; and Provision for depreciation, depletion, and amortization. The Other line in the table above includes gains/losses on asset sales and other non-operating
items. Adjusted EBITDA is a non-GAAP financial measure.
Management believes that this measure is meaningful to investors because Adjusted EBITDA provides additional information with respect to Alcoa’s operating performance and the Company’s
ability to meet its financial obligations. The Adjusted EBITDA presented may not
be comparable to similarly titled measures of other companies.
53 (1) Value Add is composed of the Global Rolled Products, Engineered Products and Solutions, and Transportation and Construction Solutions
segments. |
 [Alcoa logo] Reconciliation of Free Cash Flow (in millions) Year ended Quarter ended December 31, 2010 December 31, 2011 December 31, 2012 December 31, 2013 December 31, 2014 December 31, 2015 March 31, 2015 December 31, 2015 March 31, 2016 Cash from operations $2,261 $2,193 $1,497 $1,578 $1,674 $1,582 $(175) $865 $(430) Capital expenditures (1,015) (1,287) (1,261) (1,193) (1,219) (1,180) (247) (398) (251) Free cash flow $1,246 $906 $236 $385 $455 $402 $(422) $467 $(681) Free Cash Flow is a non-GAAP financial measure. Management believes that this measure is meaningful to investors because management
reviews cash flows generated from operations after taking into consideration
capital expenditures due to the fact that these expenditures are considered necessary to
maintain and expand Alcoa’s asset base and are expected to generate future cash flows from operations. It is important to note that Free Cash Flow does not represent the residual cash flow available for discretionary expenditures since other non-discretionary
expenditures, such as mandatory debt service requirements, are not deducted from the measure. 54 |
 [Alcoa logo] Days Working Capital Days Working Capital = Working Capital divided by (Sales/number of days in the quarter).
(1) The deferred purchase price receivable relates to an arrangement to sell certain customer receivables to several financial institutions on a
recurring basis. Alcoa is adding back this receivable for the purposes of the Days Working Capital calculation. (2) The Working Capital for each period presented represents an average quarter Working Capital, which reflects the capital invested during a given quarter. As such, the components
of Working Capital for each period presented represent the average of the
ending balances in each of the three months during the respective quarter.
55 ($ in millions) Quarter ended 31-Mar-12 30-Jun-12 30-Sep-12 31-Dec-12 31-Mar-13 30-Jun-13 30-Sep-13 31-Dec-13 Receivables from customers, less allowances $1,709 $1,650 $1,600 $1,573 $1,704 $1,483 $1,427 $1,383 Add: Deferred purchase price receivable (1) 85 144 104 53 50 223 347 339 Receivables from customers, less allowances, as adjusted 1,794 1,794 1,704 1,626 1,754 1,706 1,774 1,722 Add: Inventories 3,079 3,097 3,051 2,894 2,961 2,949 2,932 2,783 Less: Accounts payable, trade 2,660 2,594 2,496 2,587 2,656 2,820 2,746 2,816 Working Capital (2) $2,213 $2,297 $2,259 $1,933 $2,059 $1,835 $1,960 $1,689 Sales $6,006 $5,963 $5,833 $5,898 $5,833 $5,849 $5,765 $5,585 Days Working Capital 34 35 36 30 32 29 31 28 |
 [Alcoa logo] Days Working Capital Days Working Capital = Working Capital divided by (Sales/number of days in the quarter).
(1) The deferred purchase price receivable relates to an arrangement to sell certain customer receivables to several financial institutions on a
recurring basis. Alcoa is adding back this receivable for the purposes of the Days Working Capital calculation. (2) The Working Capital for each period presented represents an average quarter Working Capital, which reflects the capital invested
during a given quarter. As such, the components of Working Capital for each
period presented represent the average of the ending balances in each of
the three months during the respective quarter. (3)
In the quarters ended September 30, 2015, December 31, 2015, and March 31, 2016
Working Capital and Sales include $405 and $147, respectively, $606 and $207, respectively, and $640 and $217, respectively, related to two acquisitions, TITAL (March 2015), and RTI International Metals (July 2015). Excluding these amounts, Days Working Capital was 35, 33 and 37 for the quarters ended
September 30, 2015, December 31, 2015, and March 31, 2016, respectively.
56 ($ in millions) Quarter ended 31-Mar-14 30-Jun-14 30-Sep-14 31-Dec-14 31-Mar-15 30-Jun-15 30-Sep-15 (3) 31-Dec-15 (3) 31-Mar-16 (3) Receivables from customers, less allowances $1,391 $1,401 $1,526 $1,513 $1,487 $1,548 $1,489 $1,428 $1,462 Add: Deferred purchase price receivable (1) 238 371 438 395 389 421 382 324 238 Receivables from customers, less allowances, as adjusted 1,629 1,772 1,964 1,908 1,876 1,969 1,871 1,752 1,700 Add: Inventories 2,974 3,201 3,194 3,064 3,189 3,230 3,443 3,523 3,516 Less: Accounts payable, trade 2,813 2,880 3,016 3,021 2,936 2,978 2,871 2,842 2,654 Working Capital (2) $1,790 $2,093 $2,142 $1,951 $2,129 $2,221 $2,443 $2,433 $2,562 Sales $5,454 $5,836 $6,239 $6,377 $5,819 $5,897 $5,573 $5,245 $4,947 Days Working Capital 30 33 32 28 33 34 40 43 47 |
 [Alcoa logo] Reconciliation of Net Debt Net debt is a non-GAAP financial measure. Management believes that this measure is meaningful to investors because management assesses
Alcoa’s leverage position after factoring in available cash that
could be used to repay outstanding debt. (in millions)
December 31, March 31, 2011 2012 2013 2014 2015 2016 Short-term borrowings $62 $53 $57 $54 $38 $40 Commercial paper 224 – – – – – Long-term debt due within one year 445 465 655 29 21 772 Long-term debt, less amount due within one year 8,542 8,226 7,534 8,704 8,993 8,257 Total debt (1) 9,273 8,744 8,246 8,787 9,052 9,069 Less: Cash and cash equivalents 1,939 1,861 1,437 1,877 1,919 1,384 Net debt $7,334 $6,883 $6,809 $6,910 $7,133 $7,685 57 (1) Debt amounts for 2011-2015 have been updated to reflect the adoption of FASB guidance (effective January 1, 2016) requiring presentation of
debt issuance costs as a reduction of debt rather than as a noncurrent
asset. |
 [Alcoa logo] Reconciliation of Debt-to-Adjusted EBITDA Ratio ($ in millions) 2011 2012 2013 2014 2015 1Q16* Net income (loss) attributable to Alcoa $611 $191 $(2,285) $268 $(322) $(501) Add: Net income (loss) attributable to noncontrolling interests 194 (29) 41 (91) 125 60 Loss from discontinued operations 3 – – – – – Provision for income taxes 255 162 428 320 445 249 Other expenses (income), net (87) (341) (25) 47 2 48 Interest expense 524 490 453 473 498 503 Restructuring and other charges 281 172 782 1,168 1,195 1,111 Impairment of goodwill – – 1,731 – 25 25 Provision for depreciation, depletion, and amortization 1,479 1,460 1,421 1,371 1,280 1,267 Adjusted EBITDA $3,260 $2,105 $2,546 $3,556 $3,248 $2,762 Total Debt (1) $9,273 $8,744 $8,246 $8,787 $9,052 $9,069 Debt-to-Adjusted EBITDA Ratio 2.84 4.16 3.24 2.47 2.79 3.28 Alcoa’s definition of Adjusted EBITDA (Earnings before interest, taxes, depreciation, and amortization) is net margin plus an add-back for depreciation, depletion, and amortization. Net margin is equivalent to Sales minus the following items: Cost of goods sold; Selling, general administrative, and other expenses; Research and development expenses; and Provision for depreciation, depletion, and amortization. Adjusted EBITDA is a non- GAAP financial measure. Management believes that this measure is meaningful to investors because Adjusted EBITDA provides additional
information with respect to Alcoa’s operating performance and the Company’s ability to meet its financial obligations. The Adjusted EBITDA presented may not be comparable to similarly titled measures of other
companies. 58
•The calculation of Adjusted EBITDA for the quarter ended March 31, 2016 is based
on the trailing twelve months. (1)
Debt amounts for 2011-2015 have been updated to reflect the adoption of FASB
guidance (effective January 1, 2016) requiring presentation of debt issuance costs as a reduction of debt rather than as a noncurrent asset. |
 [Alcoa logo] Reconciliation of RTI International Metals Adjusted EBITDA* ($ in millions) 2014 1Q15 Net income $31 $5 Add: Net loss attributable to discontinued operations - – Provision (benefit) for income taxes 10 (1) Interest expense 31 8 Interest income - - Other (income) expense, net (2) - Merger-related expenses – 5 Depreciation and amortization 45 11 Adjusted EBITDA $115 $28 Net sales $794 $198 Adjusted EBITDA Margin 14.5% 14.1% 59 * The calculation of Adjusted EBITDA for RTI International Metals (RTI) (now Alcoa Titanium and Engineered Products) is based on Alcoa’s
definition of Adjusted EBITDA (see below) and does not purport to be the
manner in which RTI’s former management would have calculated RTI’s Adjusted EBITDA. Additionally, this calculation of Adjusted EBITDA is not intended to suggest that RTI’s former management used Adjusted EBITDA as a measure of RTI’s profitability. The amounts used in
these calculations were obtained from RTI’s Annual Report on Form
10-K for the year ended December 31, 2014 and Quarterly Report on Form 10-Q for the three months ended March 31, 2015 filed with the U.S. Securities and Exchange Commission on February 26, 2015 and April 30, 2015, respectively. Alcoa’s definition of Adjusted EBITDA (Earnings before interest, taxes, depreciation, and amortization) is net margin plus an add-back
for depreciation, depletion, and amortization. Net margin is
equivalent to Sales minus the following items: Cost of goods sold; Selling, general administrative, and other expenses; Research and development expenses; and Provision for depreciation, depletion, and amortization. Adjusted EBITDA is a non-GAAP financial measure. Management believes
that this measure is meaningful to investors because Adjusted EBITDA
provides additional information with respect to Alcoa’s operating performance and the Company’s ability to meet its financial obligations. The Adjusted EBITDA presented may not be comparable to similarly titled measures of other companies.
|