Attached files
| file | filename |
|---|---|
| EX-32 - Kaspien Holdings Inc. | c84591_ex32.htm |
| EX-23 - Kaspien Holdings Inc. | c84591_ex23.htm |
| EX-21 - Kaspien Holdings Inc. | c84591_ex21.htm |
| EX-31.1 - Kaspien Holdings Inc. | c84591_ex31-1.htm |
| EX-31.2 - Kaspien Holdings Inc. | c84591_ex31-2.htm |
UNITED STATES
SECURITIES AND EXCHANGE COMMISSION
WASHINGTON, D.C. 20549
FORM 10-K
| x | ANNUAL REPORT PURSUANT TO SECTION 13
OR 15(d) OF THE SECURITIES EXCHANGE ACT OF 1934 |
FOR THE FISCAL YEAR ENDED JANUARY 30, 2016
OR
TRANSITION REPORT PURSUANT TO SECTION 13 OR 15(d) OF THE SECURITIES EXCHANGE ACT
FOR THE TRANSITION PERIOD FROM ..........TO ..........
COMMISSION FILE NUMBER: 0-14818
TRANS WORLD ENTERTAINMENT CORPORATION
(Exact name of registrant as specified in its charter)
| New York | 14-1541629 | |
| (State or other jurisdiction of incorporation or organization) | (I.R.S. Employer Identification Number) |
38 Corporate Circle
Albany, New York 12203
(Address of principal executive offices, including zip code)
(518) 452-1242
(Registrant’s telephone number, including area code)
Securities registered pursuant to Section 12(b) of the Act:
| Title of each class | Name of each exchange on which registered | |||
| Common shares, $0.01 par value per share | NASDAQ Stock Market (Common Shares) |
Securities registered pursuant to Section 12(g) of the Act: None
Indicate by check mark if the registrant is
a well-known seasoned issuer, as defined in the Rule 405 of the Securities Act.
Yes o No x
Indicate
by check mark if the registrant is not required to file reports pursuant to Section 13 or Section 15(d) of the Act.
Yes o No x
Indicate by a check mark whether the Registrant (1) has filed all reports required to be filed by Sections 13 or 15(d) of the Securities Exchange Act of 1934 during the preceding 12 months (or for shorter period that the Registrant was required to file such reports), and (2) has been subject to such filing requirements for the past 90 days. Yes x No o
Indicate by check mark whether the registrant has submitted electronically and posted on its corporate Website, if any, every Interactive Data File required to be submitted and posted pursuant to Rule 405 of Regulation S-T (§232.405 of this chapter)
during the preceding 12 months (or for such shorter period that the registrant was required to submit and post such files). Yes x No o
Indicate by check mark if disclosure of delinquent filers pursuant to Item 405 of Regulation S-K is not contained herein, and will not be contained, to the best of the Registrant’s Knowledge, in definitive proxy or information statements incorporated by reference in Part III of this Form 10-K or an amendment to this Form 10-K. x
Indicate by checkmark whether the registrant is a large accelerated filer, an accelerated filer, a non-accelerated filer or a smaller reporting company (as defined in Rule 12b-2 of the Act).
| Large accelerated filer o | Accelerated filer x | Non-accelerated filer o | Small reporting company o |
| Indicate by check mark whether the registrant is a shell company (as defined in Rule 12b-2 of the Act). | Yes o | No x |
As of August 1, 2015, 31,128,387 shares of the Registrant’s Common Stock were issued and outstanding. The aggregate market value of the voting stock held by non-affiliates of the Registrant, based upon the closing sale price of the Registrant’s Common Stock on August 1, 2015 as reported on the Global tier of The NASDAQ Stock Market, Inc. was $58,415,869. Shares of Common Stock held by the Company’s controlling shareholder, who controlled approximately 47.2% of the outstanding Common Stock, have been excluded for purposes of this computation. Because of such shareholder’s control, shares owned by other officers, directors and 5% shareholders have not been excluded from the computation. As of March 31, 2016, there were 30,557,411 shares of Common Stock issued and outstanding.
| Documents of Which Portions Are Incorporated by Reference |
Parts of the Form 10-K into Which Portion of Documents are Incorporated | |
| Proxy Statement for Trans World Entertainment Corporation’s July 6, 2016 Annual Meeting of Shareholders to be filed on or about May 27, 2016 |
III | |
| Consolidated Financial Statements | II | |
| Report of Independent Registered Public Accounting Firm on Effectiveness of Internal Control over Financial Reporting |
II |
| 2 |
PART I
Cautionary Statement for Purposes of the “Safe Harbor” Provisions of the Private Securities Litigation Reform Act of 1995
This document includes forward-looking statements within the meaning of the Private Securities Litigation Reform Act of 1995. These statements relate to analyses and other information that are based on forecasts of future results and estimates of amounts not yet determinable. These statements also relate to the Trans World Entertainment Corporation’s (“the Company’s”) future prospects, developments and business strategies. The statements contained in this document that are not statements of historical fact may include forward-looking statements that involve a number of risks and uncertainties.
We have used the words “anticipate”, “believe”, “could”, “estimate”, “expect”, “intend”, “may”, “plan”, “predict”, “project”, and similar terms and phrases, including references to assumptions, in this document to identify forward-looking statements. These forward-looking statements are made based on management’s expectations and beliefs concerning future events and are subject to uncertainties and factors relating to our operations and business environment, all of which are difficult to predict and many of which are beyond the Company’s control, that could cause actual results to differ materially from those matters expressed in or implied by these forward-looking statements. The following factors are among those that may cause actual results to differ materially from the Company’s forward-looking statements.
• new product introductions (“hit releases”); • accelerated declines in compact disc (“CD”) and home video industry sales; • highly competitive nature of the retail entertainment business; • new technology, including digital distribution; • competitive pricing; • current economic conditions and changes in mall traffic; • dependence on key employees, the ability to hire new employees and pay competitive wages; • the Company’s level of debt and related restrictions and limitations; • future cash flows; • availability of real estate; • vendor terms; • interest rate fluctuations; • adverse publicity; • product liability claims • changes in laws and regulations and • breach of data security. |
The reader should keep in mind that any forward-looking statement made by us in this document, or elsewhere, pertains only as of the date on which we make it. New risks and uncertainties come up from time-to-time and it’s impossible for us to predict these events or how they may affect us. In light of these risks and uncertainties, you should keep in mind that any forward-looking statements made in this report or elsewhere might not occur.
In addition, the preparation of financial statements in accordance with accounting principles generally accepted in the United States (“GAAP”) requires us to make estimates and assumptions. These estimates and assumptions affect:
| • | the reported amounts and timing of revenue and expenses, | |
| • | the reported amounts and classification of assets and liabilities, and | |
| • | the disclosure of contingent assets and liabilities. |
Actual results may vary from our estimates and assumptions. These estimates and assumptions are based on historical results, assumptions that we make, as well as assumptions by third parties.
| 3 |
Item 1. BUSINESS
Company Background
Trans World Entertainment Corporation, which, together with its consolidated subsidiaries, is referred to herein as “the Company”, “we”, “us” and “our”, was incorporated in New York in 1972. We own 100% of the outstanding common stock of Record Town, Inc., through which our principal operations are conducted. The Company operates retail stores and two e-commerce sites and is one of the largest specialty retailers of entertainment products, including trend, video, music, electronics, and related products in the United States.
Stores and Store Concepts
As of January 30, 2016, the Company operated 299 stores totaling approximately 1.7 million square feet in the United States, the District of Columbia and the U.S. Virgin Islands.
Mall Stores
As of January 30, 2016, the Company operated 267 mall-based stores, predominantly under the f.y.e. (“For Your Entertainment”) brand, including:
f.y.e. stores. The Company operated 258 traditional mall-based stores. f.y.e. stores average about 5,300 square feet and carry a full complement of entertainment products, including trend, video, music, electronics, and related products.
During Fiscal 2015, the company opened 6 new and remodeled 4 existing f.y.e. stores under a new format which expands the merchandise selection and enhances the presentation of the trend and electronics categories while maintaining a strong presence in the media categories.
Video only stores. The Company operated 9 video only stores, predominately under the Suncoast Motion Pictures brand. These stores specialize in the sale of video and related product. They average about 2,500 square feet.
Freestanding Stores
As of January 30, 2016, the Company operated 32 freestanding stores predominantly under the f.y.e. brand. They carry a full complement of entertainment products, including trend, video, music, electronics, and related products and are located in freestanding, strip center and downtown locations. The freestanding stores average approximately 10,700 square feet.
E-Commerce Sites
The Company operates two retail web sites including www.fye.com and www.secondspin.com. FYE.com is our flagship site and carries a full complement of entertainment products, including trend, video, music, electronics and related products. SecondSpin.com is a leading seller of used CDs, DVDs, Blu-Ray and video games online and carries one of the largest catalogs of used media available online.
| 4 |
Merchandise Categories
Net sales by merchandise category as a percentage of total net sales for fiscal 2015, 2014 and 2013 were as follows:
| 2015 | 2014 | 2013 | ||||||||||
| Video | 39.5 | % | 43.9 | % | 45.1 | % | ||||||
| Music | 25.1 | 27.0 | 28.8 | |||||||||
| Trend | 22.2 | 15.2 | 12.3 | |||||||||
| Electronics | 10.8 | 9.6 | 9.2 | |||||||||
| Video games | 2.4 | 4.3 | 4.6 | |||||||||
| Total | 100.0 | % | 100.0 | % | 100.0 | % | ||||||
Financial information about industry segments required by this item is included in the Company’s Consolidated Financial Statements, which are incorporated herein by reference.
Business Environment
Based primarily on statistical information obtained from Warner Brothers Home Entertainment and Nielsen Sound Scan (“SoundScan”); physical video and music represent an approximately $9 billion industry nationwide in 2015. Video and music accounted for approximately 65% of the Company’s net sales in fiscal 2015 versus 71% of sales in fiscal 2014.
According to statistics obtained from Warner Brothers Home Entertainment, overall video industry physical retail sales in 2015 were $6.1 billion compared to $6.9 billion in 2014, a decrease of 11%. Industry DVD retail sales decreased 15% in 2015 compared to 2014, while Blu-ray sales decreased 3%.
According to statistical information from SoundScan, the total number of music albums sold, including CD and digital albums, decreased 11% to approximately 273 million units in 2015. Excluding digital albums, in fiscal 2015, album sales decreased 13% from fiscal 2014 to approximately 163 million units.
Competition
Physical media sales have suffered from the shift of content to digital distribution, streaming and online retailers (e.g., Amazon) that offer entertainment products at discounted prices and collectively have gained a larger share of the market. As a result of such competition, the number of specialty and independent retailers has decreased dramatically due to their reliance on sales of physical product. The Company has diversified its products and taken other measures to position itself competitively within its industry. The Company believes it effectively competes in the following ways:
| ▪ | Diversified product mix: the company is expanding the range of product offerings in our non-media businesses. As a result, the non media categories contribution to total sales increased to 33% as compared to 25% in Fiscal 2014. | |
| ▪ | Customer service: the Company offers personalized customer service in its stores guided by a commitment to approach every customer with gratitude, humility and respect; | |
| ▪ | Location and convenience: a strength of the Company is its convenient store locations that are often the exclusive retailer in regional shopping centers offering a full complement of entertainment products; | |
| ▪ | Selection and assortment: the Company maintains a high in-stock position in a large assortment of products; | |
| ▪ | Marketing: the Company utilizes in-store visual displays, live events and a digital marketing strategy that employs email blasts and social networking. |
| 5 |
Seasonality
The Company’s business is seasonal, with its fourth fiscal quarter constituting the Company’s peak selling period. In fiscal 2015, the fourth quarter accounted for approximately 36% of annual net sales and all of its net income. In anticipation of increased sales activity in the fourth quarter, the Company purchases additional inventory and hires seasonal associates to supplement its core store sales and distribution center staffs. If, for any reason, the Company’s net sales were below seasonal norms during the fourth quarter, the Company’s operating results could be adversely affected. Quarterly sales can also be affected by the timing of new product releases, new store openings or closings and the performance of existing stores.
Advertising
The Company makes use of visual displays including in-store signage and external banners. The Company employs a marketing strategy including email blasts and social networking. Certain vendors from whom the Company purchases merchandise offer advertising allowances, of varying duration and amount, to promote their merchandise.
Suppliers and Purchasing
The Company purchases inventory from approximately 400 suppliers. In fiscal 2015, 52% of purchases were made from ten suppliers including Bio Domes Headgear, Funko, LLC; Buena Vista Home Video, Paramount Video, Sony Music Entertainment, Twentieth Century Fox Home Entertainment, Universal Music Group Distribution, Universal Studios Home Entertainment, Warner/ Elektra/Atlantic Corp Group and Warner Home Video. The Company does not have material long-term purchase contracts; rather, it purchases products from its suppliers on an order-by-order basis. Historically, the Company has not experienced difficulty in obtaining satisfactory sources of supply and management believes that it will continue to have access to adequate sources of supply.
Trade Customs and Practices
Under current trade practices with large suppliers, retailers of music and video products are generally entitled to return unsold merchandise they have purchased in exchange for other merchandise carried by the suppliers. The largest music suppliers charge a related merchandise return penalty or return handling fee. Most manufacturers and distributors of video products do not charge a return penalty or handling fee. Under current trade practices with large suppliers, retailers of trend, electronics, video games and related products may receive markdown support from suppliers to help clear discontinued or slow turning merchandise. Merchandise return policies and other trade practices have not changed significantly in recent years. The Company generally adapts its purchasing policies to changes in the policies of its largest suppliers.
Employees
As of January 30, 2016, the Company employed approximately 2,900 people, of whom approximately 1,100 were employed on a full-time basis. Others were employed on a part-time basis. The Company hires seasonal sales and distribution center employees during its fourth quarter peak selling season to ensure continued levels of personalized customer service and in-stock position. Assistant store managers, store managers, district managers and regional managers are eligible to receive incentive compensation based on the sales and/or profitability of stores for which they are responsible. Sales support managers are generally eligible to receive incentive compensation based on achieving Company performance targets. None of the Company’s employees are covered by collective bargaining agreements and management believes that the Company enjoys favorable relations with its employees.
Trademarks
The trademarks, f.y.e. for your entertainment, Suncoast Motion Pictures and Saturday Matinee are registered with the U.S. Patent and Trademark Office and are owned by the Company. We believe that our rights to these trademarks are adequately
| 6 |
protected. We hold no material patents, licenses, franchises or concessions; however, our established trademarks and trade names are essential to maintaining our competitive position in the entertainment retail industry.
Information Systems
The Company utilizes primarily IBM AS400 technology to run its management information systems, including its merchandising, distribution and financial systems. Management believes its systems contribute to customer service and operational efficiency, as well as provide the ability to monitor critical performance indicators versus plans and historical results.
Available Information
The Company’s headquarters are located at 38 Corporate Circle, Albany, New York 12203, and its telephone number is (518) 452-1242. The Company’s corporate website address is www.twec.com. The Company makes available, free of charge, its Exchange Act Reports (Forms 10-K, 10-Q, 8-K and any amendments thereto) on its web site as soon as practical after the reports are filed with the Securities and Exchange Commission (“SEC”). The public may read and copy any materials the Company files with the SEC at the SEC’s Public Reference Room at 100 F Street, N.E., Washington, D.C. 20549. Information on the operation of the Public Reference Room can be obtained by calling the SEC at 1-800-SEC-0330. The SEC maintains an Internet site that contains reports, proxy and information statements, and other information regarding issuers that file electronically with the SEC. This information can be obtained from the site http://www.sec.gov. The Company’s Common Stock, $0.01 par value, is listed on the NASDAQ National Market under the trading symbol “TWMC”. The Company’s fiscal year end is the Saturday closest to January 31. The fiscal 2015 (“fiscal 2015”) year ended on January 30, 2016; fiscal 2014 (“fiscal 2014”) year ended on January 31, 2015; and fiscal 2013 (“fiscal 2013”) year ended on February 1, 2014. All fiscal periods presented were 52 weeks.
Item 1A. RISK FACTORS
The following is a discussion of certain factors, which could affect the financial results of the Company.
The Company’s results of operations are affected by the availability of new products.
The Company’s business is affected by the release of “hit” music and video titles, which can create fluctuations in sales. It is not possible to determine the timing of these fluctuations or the future availability of hit titles. The Company is dependent upon the major music and movie producers to continue to produce hit products. To the extent that new hit releases are not available, or not available at prices attractive to consumers, or, if manufacturers fail to introduce or delay the introduction of new products, the Company’s results of operations may be adversely affected.
The Company’s results of operations are affected by the continued declines in the video and music industries.
The video and music retailing industries are mature industries and continue to experience declines. Physical video and music represent our largest product categories in terms of sales and have been impacted by new distribution channels, including digital distribution, streaming and internet fulfillment. As a result, the Company has had negative comparable store sales for all periods presented.
If we cannot successfully diversify our product mix and implement our business strategy our growth and profitability could be adversely impacted.
Our future results will depend, among other things, on our success in implementing our business strategy. There can be no assurance that we will be successful in implementing our business strategy or that the strategy will be successful in sustaining acceptable levels of sales growth and profitability.
The Company’s results of operations may suffer if the Company does not accurately predict consumer acceptance of new product, distribution technologies or adapt to a shift to multichannel experience.
The entertainment industry is characterized by changing technology, evolving format standards, and new and enhanced
| 7 |
product introductions. These characteristics require the Company to respond quickly to technological changes and understand the impact of these changes on customers’ preferences. If the Company is unable to participate in new product or distribution technologies, its results of operations may suffer. Specifically, CD and DVD formats have experienced a continuous decline as digital forms of music and video content have become more prevalent. If the Company does not timely adapt to these changing technologies or sufficiently focus on the other categories, operating results could significantly suffer.
In addition, multichannel retailing is rapidly evolving with the increasing use of computers, tablets, mobile phones and other devices to shop in stores and online and the increased use of social media as a means of interacting with our customers and enhancing their shopping experiences. If we are unable to adapt to the growth of multichannel retailing, and keep pace with the changing expectations of our customers and new developments by our competitors, customer experience could be negatively affected, resulting in a loss of customer confidence and satisfaction, and lost sales, which could adversely affect our reputation and results of operations.
Increased competition from existing retailers, including internet retailers, could adversely affect the Company’s results of operations.
The Company competes with a wide variety of entertainment retailers, including deep-discount retailers, mass merchandisers, consumer electronics outlets, internet retailers and independent operators, some of whom have greater financial and other resources than the Company and frequently sell their product at discounted prices or with added value.
In addition, the Company’s success depends on our ability to positively differentiate ourselves from other retailers. The retail business is highly competitive. In the past, the Company has been able to compete successfully by differentiating our customer shopping experience, by creating an attractive value proposition through a careful combination of price, merchandise assortment, convenience, customer service and marketing efforts. Customer perceptions regarding our stores, our in-stock position and deep assortment of product are also factors in our ability to compete. No single competitive factor is dominant, and actions by our competitors on any of these factors could have an adverse effect on our sales, gross profit and expenses. If we fail to continue to positively differentiate ourselves from our competitors, our results of operations could be adversely affected.
The ability to attract customers to our stores depends heavily on the success of the shopping malls in which many of our stores are located; any decrease in consumer traffic in those malls could adversely affect the Company’s results of operations.
In order to generate customer traffic we depend heavily on locating many of our stores in prominent locations within successful shopping malls. Sales at these stores are derived from the volume of traffic in those malls. Our stores benefit from the ability of a mall’s other tenants to generate consumer traffic in the vicinity of our stores and the continuing popularity of malls as shopping destinations. Our sales volume and mall traffic generally may be adversely affected by, among other things, economic downturns in a particular area, competition from ecommerce retailers, non-mall retailers and other malls, increases in gasoline prices, fluctuations in exchange rates in border or tourism-oriented locations and the closing or decline in popularity of other stores in the malls in which we are located. An uncertain economic outlook could curtail new shopping mall development, decrease shopping mall traffic, reduce the number of hours that shopping mall operators keep their shopping malls open or force them to cease operations entirely. A reduction in mall traffic as a result of these or any other factors could have a material adverse effect on our business, results of operations and financial condition.
The Company’s business is influenced by general economic conditions.
The Company’s performance is subject to general economic conditions and their impact on levels of discretionary consumer spending. General economic conditions impacting discretionary consumer spending include, among others, wages and employment, consumer debt, reductions in net worth, residential real estate and mortgage markets, taxation, fuel and energy prices, interest rates, consumer confidence and other macroeconomic factors.
Consumer purchases of discretionary items, such as our merchandise, generally decline during recessionary periods and other periods where disposable income is adversely affected. A downturn in the economy affects specialty retailers
| 8 |
disproportionately, as consumers may prioritize reductions in discretionary spending, which could have a direct impact on purchases of our merchandise and adversely impact our results of operations. In addition, reduced consumer spending may drive us and our competitors to offer additional products at promotional prices, which would have a negative impact on gross profit.
Disruption of global capital and credit markets may have a material adverse effect on the Company’s liquidity and capital resources.
Distress in the financial markets has in the past and can in the future result in extreme volatility in security prices, diminished liquidity and credit availability. There can be no assurance that our liquidity will not be affected by changes in the financial markets and the global economy or that our capital resources will at all times be sufficient to satisfy our liquidity needs.
Historically, we have experienced declines and we may continue to experience fluctuation in our level of sales, results from operations and operating cash flow.
A variety of factors has historically affected, and will continue to affect, our comparable stores sales results and profit margins. These factors include general regional and national economic conditions; competition; actions taken by our competitors; consumer trends and preferences; new product introductions and changes in our product mix; timing and effectiveness of promotional events and weather. The Company’s comparable store sales may decline further than they did in fiscal 2015. Also, they may vary from quarter to quarter as our business is highly seasonal in nature. Our highest sales and operating income historically occur during the fourth fiscal quarter, which is due in part to the holiday selling season. The fourth quarter generated approximately 36% of our net sales for fiscal 2015. Any decrease in our fourth quarter sales, whether due to a slow holiday selling season, unseasonable weather conditions, economic conditions or otherwise, could have a material adverse effect on our business, financial condition and operating results for the entire fiscal year. There is no assurance that we will achieve positive levels of sales and earnings growth, and any decline in our future growth or performance could have a material adverse effect on our business and results of operations.
Failure to open new stores or renew existing leases in profitable stores may limit our earnings.
Historically, the Company’s growth has come from adding stores. The Company opens new stores if it finds desirable locations and is able to negotiate suitable lease terms for profitability. A lack of new store growth may impact the Company’s ability to increase sales and earnings. During 2015, the Company opened 6 new stores and remodeled 4 under a new format and closed 19 stores with expiring leases. Likewise, the Company regularly renews leases at existing locations if those stores are profitable. Failure to renew these leases may impact the Company’s earnings. See Item 2: Properties, for timing of lease expirations.
A change in one or more of the Company’s vendors’ policies or the Company’s relationship with those vendors could adversely affect the Company’s results of operations.
The Company is dependent on its vendors to supply merchandise in a timely and efficient manner. If a vendor fails to deliver on its commitments, whether due to financial difficulties or other reasons, the Company could experience merchandise shortages that could lead to lost sales.
The majority of the Company’s purchases come from ten major suppliers. As is standard in its industry, the Company does not maintain long-term contracts with its suppliers but instead makes purchases on an order-by-order basis. If the Company fails to maintain customary trade terms or enjoy positive vendor relations, it could have an adverse effect on the Company’s results of operations.
If the Company’s vendors fail to provide marketing and merchandising support at historical levels, the Company’s results of operations could be adversely affected.
The manufacturers of entertainment products have typically provided retailers with significant marketing and merchandising support for their products. As part of this support, the Company receives cooperative advertising and other allowances from these vendors. These allowances enable the Company to actively promote and merchandise the products it sells at its stores and on its websites. If the Company’s vendors fail to provide this support at historical levels, the Company’s results of operations could be negatively impacted.
| 9 |
Parties with whom the Company does business may be subject to insolvency risks or may otherwise become unable or unwilling to perform their obligations to the Company.
The Company is a party to contracts, transactions and business relationships with various third parties, including vendors, suppliers, service providers and lenders, pursuant to which such third parties have performance, payment and other obligations to the Company. In some cases, the Company depends upon such third parties to provide essential products, services or other benefits, including with respect to store and distribution center locations, merchandise, advertising, software development and support, logistics, other agreements for goods and services in order to operate the Company’s business in the ordinary course, extensions of credit, credit card accounts and related receivables, and other vital matters. Economic, industry and market conditions could result in increased risks to the Company associated with the potential financial distress or insolvency of such third parties. If any of these third parties were to become subject to bankruptcy, receivership or similar proceedings, the rights and benefits of the Company in relation to its contracts, transactions and business relationships with such third parties could be terminated, modified in a manner adverse to the Company, or otherwise impaired. The Company cannot make any assurances that it would be able to arrange for alternate or replacement contracts, transactions or business relationships on terms as favorable as the Company’s existing contracts, transactions or business relationships, if at all. Any inability on the part of the Company to do so could negatively affect the Company’s cash flows, financial condition and results of operations.
Breach of data security could harm our business and standing with our customers.
The protection of our customer, employee and business data is critical to us. Our business, like that of most retailers, involves the receipt, storage and transmission of customers’ personal information, consumer preferences and payment card information, as well as confidential information about our employees, our suppliers and our Company. We rely on commercially available systems, software, tools and monitoring to provide security for processing, transmission and storage of all such data, including confidential information. Despite the security measures we have in place, our facilities and systems, and those of our third-party service providers, may be vulnerable to security breaches, acts of vandalism, computer viruses, misplaced or lost data, programming or human errors, or other similar events. Unauthorized parties may attempt to gain access to our systems or information through fraud or other means, including deceiving our employees or third party service providers. The methods used to obtain unauthorized access, disable or degrade service, or sabotage systems are also constantly changing and evolving, and may be difficult to anticipate or detect. We have implemented and regularly review and update our control systems, processes and procedures to protect against unauthorized access to or use of secured data and to prevent data loss. However, the ever-evolving threats mean we must continually evaluate and adapt our systems and processes, and there is no guarantee that they will be adequate to safeguard against all data security breaches or misuses of data. Any security breach involving the misappropriation, loss or other unauthorized disclosure of customer payment card or personal information or employee personal or confidential information, whether by us or our vendors, could damage our reputation, expose us to risk of litigation and liability, disrupt our operations, harm our business and have an adverse impact upon our net sales and profitability. As the regulatory environment related to information security, data collection and use, and privacy becomes increasingly rigorous, with new and changing requirements applicable to our business, compliance with those requirements could also result in additional costs. Further, if we are unable to comply with the security standards established by banks and the credit card industry, we may be subject to fines, restrictions and expulsion from card acceptance programs, which could adversely affect our retail operations.
Our hardware and software systems are vulnerable to damage, theft or intrusion that could harm our business.
Our success, in particular our ability to successfully manage inventory levels and process customer transactions, largely depends upon the efficient operation of our computer hardware and software systems. We use management information systems to track inventory at the store level and aggregate daily sales information, communicate customer information and process purchasing card transactions, process shipments of goods and report financial information..
Any failure of our computer hardware or software systems that causes an interruption in our operations or a decrease in inventory tracking could result in reduced net sales and profitability. Additionally, if any data intrusion, security breach, misappropriation or theft were to occur, we could incur significant costs in responding to such event, including responding to any resulting claims, litigation or investigations, which could harm our operating results.
| 10 |
Loss of key personnel or the inability to attract, train and retain qualified employees could adversely affect the Company’s results of operations.
The Company believes that its future prospects depend, to a significant extent, on the services of its executive officers. Our future success will also depend on our ability to attract and retain qualified key personnel. The loss of the services of certain of the Company’s executive officers and other key management personnel could adversely affect the Company’s results of operations.
In addition to our executive officers, the Company’s business is dependent on our ability to attract, train and retain a large number of qualified team members. Many of those team members are employed in entry-level or part-time positions with historically high turnover rates. Our ability to meet our labor needs while controlling our costs is subject to external factors such as unemployment levels, health care costs and changing demographics. If we are unable to attract and retain adequate numbers of qualified team members, our operations, customer service levels and support functions could suffer. Those factors, together with increased wage and benefit costs, could adversely affect our results of operations.
Our Chairman owns approximately 47.2% of the outstanding Common Stock. Therefore, he has significant influence and control over the outcome of any vote of the Company’s Shareholders.
Robert J. Higgins, Chairman of the Board of the Company, owns approximately 47.2% of the outstanding Common Stock of the Company, as of March 31, 2016, and there are no limitations on his acquiring shares in the future. Accordingly, Mr. Higgins has significant influence over the election of our directors, the appointment of new management and the approval of actions requiring shareholder approval, such as adopting amendments to our articles of incorporation and approving mergers or sales of all or substantially all of our assets. Such concentration of ownership and substantial voting influence may have the effect of delaying or preventing a change of control, even if a change of control is in the best interest of all shareholders. There may be instances in which the interest of Mr. Higgins may conflict or be perceived as being in conflict with the interest of a holder of our securities or the interest of the Company. Mr. Higgins ownership excludes 1.3 million shares owned by certain family members of Mr. Higgins who do not share his residence. Mr. Higgins disclaims beneficial ownership with respect to those shares.
Failure to comply with legal and regulatory requirements could adversely affect the Company’s results of operations.
The Company’s business is subject to a wide array of laws and regulations. Significant legislative changes that impact our relationship with our workforce (none of which is represented by unions) could increase our expenses and adversely affect our operations. Examples of possible legislative changes impacting our relationship with our workforce include changes to an employer’s obligation to recognize collective bargaining units, the process by which collective bargaining units are negotiated or imposed, minimum wage requirements, and health care mandates.
Our policies, procedures and internal controls are designed to comply with all applicable laws and regulations, including those imposed by the Securities and Exchange Commission and the NASDAQ Global Market, as well as applicable employment laws. Additional legal and regulatory requirements increase the complexity of the regulatory environment in which we operate and the related cost of compliance. Failure to comply with such laws and regulations may result in damage to our reputation, financial condition and market price of our stock.
We could be materially and adversely affected if our distribution center is disrupted.
We operate a distribution center in Albany, New York. We ship approximately 77% of our merchandise inventory through our distribution center. If our distribution center is destroyed or disrupted for any reason, including weather, fire, labor, or other issues we could incur significantly higher costs and longer lead times associated with distributing our products to our stores during the time it takes to reopen or replace the center.
We maintain business interruption insurance to protect us from the costs relating to matters such as a shutdown, but our insurance may not be sufficient, or the insurance proceeds may not be timely paid to us, in the event of a shutdown.
| 11 |
The Company’s stock price has experienced and could continue to experience volatility and could decline, resulting in a substantial loss on your investment.
Our stock price has experienced, and could continue to experience in the future, substantial volatility as a result of many factors, including global economic conditions, broad market fluctuations and public perception of the prospects for music and the home video industry. Changes in our comparable store net sales could also affect the price of our Common Stock. Failure to meet market expectations, particularly with respect to comparable store sales, net revenues, operating margins and earnings per share, would likely result in a decline in the market price of our stock.
In addition, an active trading market for our Common Stock may not be sustained, which could affect the ability of our stockholders to sell their shares and could depress the market price of their shares. The stock market in general and the market for video and music industry related stocks in particular, has been highly volatile. For example, the closing price of our Common Stock at quarter ends has fluctuated between $3.13 and $4.00 from February 1, 2015 to March 31, 2016. Investors in our Common Stock may experience a decrease in the value of their stock, including decreases unrelated to our operating performance or prospects.
The future volume of trading may not provide investors with the liquidity they might desire.
As of March 31, 2016, our four largest shareholders owned over 85% of our outstanding shares of common stock, and our common stock has a low average daily trading volume relative to many other stocks whose shares are also quoted on the NASDAQ Global Market. We can give no assurance that our trading volume will increase, or that the future volume of trading will provide investors with the liquidity they might desire.
The declaration of dividend payments or the repurchase of our common stock pursuant to our share repurchase program may not continue.
Our dividend policy may be affected by, among other items, business conditions, changes in our business strategy, our views on potential future capital requirements, the terms of our debt instruments, legal risks, changes in federal income tax law and challenges to our business model. Our dividend policy may change from time to time and we may or may not continue to declare discretionary dividend payments. Additionally, although we have a share repurchase program authorized by our Board of Directors, we are not obligated to make any purchases under the program and we may discontinue it at any time.
The failure to maintain a minimum closing share price of $1.00 per share of our Common Stock could result in the delisting of our shares on the NASDAQ Global Market, which would harm the market price of the Company’s Common Stock.
In order to retain our listing on the NASDAQ Global Market we are required by NASDAQ to maintain a minimum bid price of $1.00 per share. Our stock price is currently above $1.00 and has been since October 6, 2009. However, in the event that our stock did close below the minimum bid price of $1.00 per share for any 30 consecutive business days, we would regain compliance if our Common Stock closed at or above $1.00 per share for 10 consecutive days during the 180 days immediately following failure to maintain the minimum bid price. If we are unable to do so, our stock could be delisted from the NASDAQ Global Market, transferred to a listing on the NASDAQ Capital Market, or delisted from the NASDAQ markets altogether. The failure to maintain our listing on the NASDAQ Global Market could harm the liquidity of the Company’s Common Stock and could have an adverse effect on the market price of our Common Stock.
Item 1B. UNRESOLVED SEC COMMENTS
None.
Item 2. PROPERTIES
Retail Stores
As of January 30, 2016, the Company operated 299 stores, of which 298 stores are under operating leases, some of which have renewal options. The Company owns 1 store. The majority of the leases provide for the payment of fixed monthly rent and expenses for maintenance, property taxes and insurance, while others provide for the payment of monthly rent based on a percentage of sales. Certain leases provide for additional rent based on store sales in excess of specified levels. The following table lists the leases due to expire in each of the fiscal years shown as of the fiscal year-end, assuming any renewal options are not exercised:
| 12 |
| Year | No. of Leases | Year | No. of Leases | |||
| 2016 | 122 | 2020 | 7 | |||
| 2017 | 83 | 2021 | 14 | |||
| 2018 | 29 | 2022 and beyond | 18 | |||
| 2019 | 25 |
As leases expire, the Company will evaluate the decision to exercise renewal rights or obtain new leases for the same or similar locations based on store profitability.
Corporate Offices and Distribution Center Facility
On December 4, 2015, the Company amended and restated the lease for its corporate office space in Albany, NY with Robert J. Higgins, its Chairman and largest shareholder. The lease commenced January 1, 2016 and expires December 31, 2020. Upon commencement of the amended and restated lease, annual payments were reduced by approximately $1.0 million from the original lease. The reduction in payments will be reflected in the Condensed Consolidated Statements of Operations as a reduction of interest expense partially offset by an increase to Cost of Sales and SG&A Expenses. The office portion of the facility is 39,800 square feet and the distribution center portion is 141,500 square feet.
The Company believes that it has adequate distribution facilities to meet the Company’s planned business needs. Shipments from the distribution facility to the Company’s stores provide approximately 77% of all merchandise shipment requirements to stores. Stores are serviced by common carriers chosen on the basis of geography and rate considerations. The balance of the stores’ merchandise requirements is satisfied through direct shipments from vendors.
Item 3. LEGAL PROCEEDINGS
The Company is subject to various legal proceedings and claims that have arisen in the ordinary course of its business and have not been finally adjudicated. Although there can be no assurance as to the ultimate disposition of these matters, it is management’s opinion, based upon the information available at this time, that the expected outcome of these matters, individually or in the aggregate, will not have a material adverse effect on the results of operations and financial condition of the Company.
Item 4. Mine Safety Disclosures
None.
| 13 |
PART II
Item 5. MARKET FOR THE REGISTRANT’S COMMON EQUITY, RELATED STOCKHOLDER MATTERS AND ISSUER PURCHASES OF EQUITY SECURITIES
Market Information: The Company’s Common Stock trades on the NASDAQ Global Market under the symbol “TWMC.” As of March 31, 2016, there were 325 shareholders of record. The following table sets forth high and low last reported sale prices for each fiscal quarter during the period from February 2, 2014 through March 31, 2016.
| Closing Sales Prices | ||||
| High | Low | |||
| 2014 | ||||
| 1st Quarter | $4.54 | $3.63 | ||
| 2nd Quarter | $4.04 | $3.16 | ||
| 3rd Quarter | $3.97 | $3.27 | ||
| 4th Quarter | $3.47 | $3.13 | ||
| 2015 | ||||
| 1st Quarter | $4.00 | $3.42 | ||
| 2nd Quarter | $3.88 | $3.51 | ||
| 3rd Quarter | $3.94 | $3.50 | ||
| 4th Quarter | $3.88 | $3.13 | ||
| 2016 | ||||
| 1st Quarter (through March 31, 2016) | $3.94 | $3.28 | ||
On March 31, 2016, the last reported sale price on the Common Stock on the NASDAQ National Market was $3.64.
Dividend Policy: We did not pay cash dividends in fiscal 2015. In the first quarter of fiscal 2014, the Company declared and paid a special cash dividend of $0.50 per common share. The declaration and payment of any dividends is at the sole discretion of the board of directors and is not guaranteed. The Company’s amended credit facility contains certain restrictions related to the payment of cash dividends, including limiting the amount of dividends to $5.0 million annually and not allowing borrowings under the amended facility for the six months before or six months after the dividend payment.
| 14 |
Five-Year Performance Graph
The following line graph reflects a comparison of the cumulative total return of the Company’s Common Stock from January 31, 2011 through January 30, 2016 with the NASDAQ US Benchmark TR Index and with ICB: 5300 Retail (Supersector) index. Because none of the Company’s leading competitors has been an independent publicly traded company over the period, the Company has elected to compare shareholder returns with the published index of retail companies compiled by NASDAQ. All values assume a $100 investment on January 31, 2010, and that all dividends were reinvested.
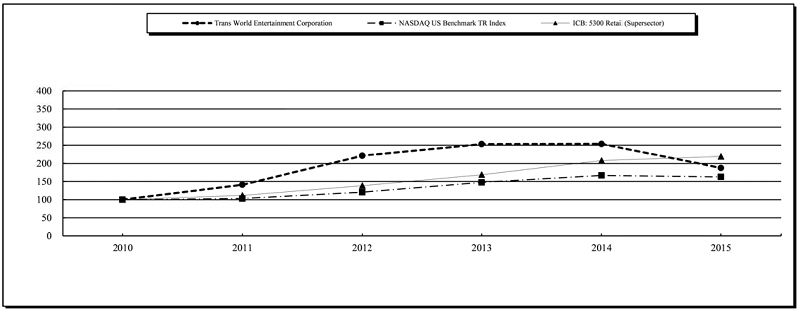 |
| 2010 | 2011 | 2012 | 2013 | 2014 | 2015 | |||||||
| Trans World Entertainment Corporation | 100 | 141 | 221 | 253 | 254 | 187 | ||||||
| NASDAQ US Benchmark TR Index | 100 | 103 | 121 | 148 | 167 | 163 | ||||||
| ICB: 5300 Retail (Supersector) | 100 | 112 | 138 | 169 | 208 | 219 |
Issuer Purchases of Equity Securities During the Quarter Ended January 31, 2016
The Board of Directors authorized a $22 million share repurchase program in August 2013. The timing of share repurchases under the repurchase program depends upon marketplace conditions and other factors, and the program remains subject to the discretion of the Board of Directors.
Below is a summary of share repurchase activity for the 3 months period ended January 30, 2016:
| Period | Total Number of Shares Purchased as Part of Publicly Announced Plans or Programs | Average Price Paid Per Share | Approximate Dollar Value of Shares that May Yet be Purchased Under the Plans or Programs | |||||||||
| November 1- November 28, 2015 | 16,900 | $ | 3.85 | $ | 15,215,044 | |||||||
| November 29- January 2, 2016 | 65,466 | $ | 3.61 | $ | 14,978,711 | |||||||
| January 3- January 30, 2016 | 39,591 | $ | 3.40 | $ | 14,844,102 | |||||||
| Total | 121,957 | $ | 3.58 | |||||||||
| 15 |
Item 6. SELECTED CONSOLIDATED FINANCIAL DATA
The following table sets forth selected Statements of Income and Balance Sheet data for the five fiscal years ended January 30, 2016 and is derived from the Company’s audited Consolidated Financial Statements. The fiscal year ended February 2, 2013 consisted of 53 weeks while all the other fiscal years of the Company presented consisted of 52 weeks. This information should be read in conjunction with the Company’s audited Consolidated Financial Statements and related notes and other financial information included herein, including Item 7, “Management’s Discussion and Analysis of Financial Condition and Results of Operations”.
| Fiscal Year Ended | ||||||||||||||||||||
| January 30, | January 31, | February 1, | February 2, | January 28, | ||||||||||||||||
| 2016 | 2015 | 2014 | 2013 | 2012 | ||||||||||||||||
| (in thousands, except per share data) | ||||||||||||||||||||
| STATEMENT OF INCOME DATA: | ||||||||||||||||||||
| Net sales | $ | 334,661 | $ | 358,490 | $ | 393,659 | $ | 458,544 | $ | 542,589 | ||||||||||
| Cost of sales | 204,089 | 222,572 | 245,755 | 286,422 | 344,435 | |||||||||||||||
| Gross profit | 130,572 | 135,918 | 147,904 | 172,122 | 198,154 | |||||||||||||||
| Selling, general and administrative expenses | 126,002 | 132,143 | 137,529 | 158,572 | 192,743 | |||||||||||||||
| Gain on sale of asset | — | — | — | (22,750 | ) | — | ||||||||||||||
| Income from operations | 4,570 | 3,775 | 10,375 | 36,300 | 5,411 | |||||||||||||||
| Interest expense | 1,860 | 1,951 | 2,010 | 2,384 | 3,429 | |||||||||||||||
| Other income | (160 | ) | (70 | ) | (80 | ) | (66 | ) | (240 | ) | ||||||||||
| Income before income taxes | 2,870 | 1,894 | 8,445 | 33,982 | 2,222 | |||||||||||||||
| Income tax expense | 181 | 116 | 168 | 248 | 150 | |||||||||||||||
| Net income | $ | 2,689 | $ | 1,778 | $ | 8,277 | $ | 33,734 | $ | 2,072 | ||||||||||
| Basic earnings per share | $ | 0.09 | $ | 0.06 | $ | 0.25 | $ | 1.07 | $ | 0.07 | ||||||||||
| Weighted average number of shares outstanding - basic | 31,167 | 31,744 | 32,584 | 31,577 | 31,520 | |||||||||||||||
| Diluted earnings per share | $ | 0.09 | $ | 0.06 | $ | 0.25 | $ | 1.06 | $ | 0.06 | ||||||||||
| Weighted average number of shares – diluted | 31,323 | 31,897 | 32,862 | 31,878 | 32,036 | |||||||||||||||
| Cash dividend paid per share | — | $ | 0.50 | — | $ | 0.47 | — | |||||||||||||
| Fiscal Year Ended | ||||||||||||||||||||
| January 30, | January 31, | February 1, | February 2, | January 28, | ||||||||||||||||
| 2016 | 2015 | 2014 | 2013 | 2012 | ||||||||||||||||
| (in thousands, except store count data) | ||||||||||||||||||||
| BALANCE SHEET DATA (at the end of the period): | ||||||||||||||||||||
| Total assets | $ | 271,605 | $ | 280,009 | $ | 311,591 | $ | 314,414 | $ | 312,294 | ||||||||||
| Current portion of long-term debt and capital lease obligations | — | 938 | 1,066 | 936 | 1,503 | |||||||||||||||
| Long-term obligations | — | — | 938 | 2,004 | 4,009 | |||||||||||||||
| Shareholders’ equity | $ | 175,268 | $ | 171,740 | $ | 190,970 | $ | 179,934 | $ | 161,020 | ||||||||||
| OPERATING DATA: | ||||||||||||||||||||
| Store count (open at end of period): | ||||||||||||||||||||
| Mall stores | 267 | 270 | 293 | 304 | 324 | |||||||||||||||
| Freestanding stores | 32 | 40 | 46 | 54 | 66 | |||||||||||||||
| Total stores | 299 | 310 | 339 | 358 | 390 | |||||||||||||||
| Comparable store sales decreases(1) | (1 | %) | (1 | %) | (5 | %) | (1 | %) | (2 | %) | ||||||||||
| Total square footage in operation (Year end) | 1,730 | 1,799 | 2,030 | 2,209 | 2,562 | |||||||||||||||
| Total square footage in operation (Average) | 1,793 | 1,940 | 2,134 | 2,362 | 2,913 | |||||||||||||||
| 1. | A store is included in comparable store sales calculations at the beginning of its thirteenth full month of operation. Stores relocated, expanded or downsized are excluded from comparable store sales if the change in square footage is greater than 20% until the thirteenth full month following relocation, expansion or downsizing. Closed stores that were open for at least thirteen months are included in comparable store sales through the month immediately preceding the month of closing. |
| 16 |
Item 7. MANAGEMENT’S DISCUSSION AND ANALYSIS OF FINANCIAL CONDITION AND RESULTS OF OPERATIONS
Overview
Management’s Discussion and Analysis of Financial Condition and Results of Operations provide information that the Company’s management believes necessary to achieve an understanding of its financial condition and results of operations. To the extent that such analysis contains statements which are not of a historical nature, such statements are forward-looking statements, which involve risks and uncertainties. These risks include, but are not limited to, changes in the competitive environment for the Company’s merchandise, including the entry or exit of non-traditional retailers of the Company’s merchandise to or from its markets; releases by the music, video, and video game industries of an increased or decreased number of “hit releases”; general economic factors in markets where the Company’s merchandise is sold; and other factors discussed in the Company’s filings with the Securities and Exchange Commission. The following discussion and analysis of the Company’s financial condition and results of operations should be read in conjunction with “Item 6: Selected Consolidated Financial Data” and the Consolidated Financial Statements and related notes included elsewhere in this report.
As of January 30, 2016, the Company operated 299 stores totaling approximately 1.7 million square feet in the United States, the District of Columbia and the U.S. Virgin Islands. In fiscal 2015, the Company’s net sales decreased as compared to fiscal 2014 as a result of lower average store count and reported a 0.7% decrease in comparable store sales.
The U.S. entertainment retailing industry is a mature industry and continues to experience declines. Physical Video and Music represent our primary product categories in terms of sales and both categories have been impacted by new distribution channels, including digital distribution and internet fulfillment. As a result, the Company has had negative comparable store sales for the past five years. To mitigate or lessen the impact these changes have had, the Company has focused on the following areas in an effort to improve its business:
Evolve the f.y.e. Brand Customer Experience.
The Company is evolving the f.y.e. brand experience by improving its merchandise assortment and presentation as it continues its strategy towards becoming the most compelling entertainment and pop culture centric engagement in the marketplace. In addition, the Company offers personalized customer service in its stores guided by a commitment to approach every customer with gratitude, humility and respect.
Store Portfolio Evaluation
The Company’s real estate strategy is to maintain our core group of profitable locations, while evaluating opportunities for new locations in new and existing malls. During Fiscal 2015, the company opened 6 new and remodeled 4 existing f.y.e. stores under a new format which expands the merchandise selection and enhances the presentation of the trend and electronics categories while maintaining a strong presence in the media categories.
During fiscal 2015 and fiscal 2014, the Company closed 19 and 40 stores, respectively. The Company closes stores when minimum operating thresholds are not achieved or upon lease expiration when either renewal is not available or management determines that renewal is not in the Company’s best interest. The Company has signed short-term lease agreements for desirable locations, which enables us to negotiate rents that are responsive to the then-current sales environment. We will continue to close stores that do not meet our profitability goals, a process which could result in asset impairments and store closure costs. Continued reduction in the number of stores would lower total sales.
The Company believes that there is near-term opportunity for improving the productivity of existing stores. The environment in which our stores operate is intensely competitive and includes Internet-based retailers and mass merchants. We believe a specialty retailer that can differentiate itself by offering a distinctive assortment and customer experience, and
| 17 |
that can operate efficiently, will be better positioned to maintain or grow market share. Therefore, we remain dedicated to enhancing our merchandise assortment through introducing additional product lines, improving the operational efficiency of our stores and offering our customers a rewarding shopping experience guided by an approach to engage every customer with gratitude, humility and respect.
Expanding Customer Base
To strengthen customer loyalty, the Company offers its customers the option of signing up for a Backstage Pass card which provides an additional 10% discount off of everyday selling prices on nearly all products in addition to other value added benefits members receive through the program in exchange for a membership fee. The Company also co-sponsors events in many of its stores to provide various segments of its customers an opportunity to experience entertainment and shop for unique and exclusive products based on their particular interests.
Key Performance Indicators
Management monitors a number of key performance indicators to evaluate its performance, including:
Net Sales and Comparable Store Net Sales: The Company measures the rate of comparable store net sales change. A store is included in comparable store net sales calculations at the beginning of its thirteenth full month of operation. Stores relocated, expanded or downsized are excluded from comparable store sales if the change in square footage is greater than 20% until the thirteenth full month following relocation, expansion or downsizing. Closed stores that were open for at least thirteen months are included in comparable store sales through the month immediately preceding the month of closing. The Company further analyzes net sales by store format and by product category.
Cost of Sales and Gross Profit: Gross profit is calculated based on the cost of product in relation to its retail selling value. Changes in gross profit are impacted primarily by net sales levels, mix of products sold, vendor discounts and allowances, shrinkage, obsolescence and distribution costs. Distribution expenses include those costs associated with receiving, inspecting and warehousing merchandise and costs associated with product returns to vendors.
Selling, General and Administrative (“SG&A”) Expenses: Included in SG&A expenses are payroll and related costs, occupancy charges, general operating and overhead expenses and depreciation charges (excluding those related to distribution operations, as discussed in Note 2 of Notes to the Consolidated Financial Statements in this report). SG&A expenses also include fixed assets write-offs associated with store closures, if any, and miscellaneous income and expense items, other than interest. The Company recorded miscellaneous income items for fiscal 2015, 2014, and 2013 in the amount of $8.3 million, $6.1 million, and $6.1 million, respectively. Included in fiscal 2015 miscellaneous income items was a one-time reimbursement of expenses incurred in prior years, related to a legal settlement of $1.4 million.
Balance Sheet and Ratios: The Company views cash, net inventory investment (merchandise inventory less accounts payable) and working capital (current assets less current liabilities) as key indicators of its financial position. See Liquidity and Capital Resources for further discussion of these items.
| 18 |
Fiscal Year Ended January 30, 2016 (“fiscal 2015”)
Compared to fiscal Year Ended January 31, 2015 (“fiscal 2014”)
Net Sales. The following table sets forth a year-over-year comparison of the Company’s total net sales:
| 2015 vs. 2014 | ||||||||||||||||
| ($ in thousands) | 2015 | 2014 | $ | % | ||||||||||||
| Net Sales | $ | 334,661 | $ | 358,490 | ($ | 23,829 | ) | (6.6%) | ||||||||
The 6.6% net sales decline from the prior year is due to a 6.1% decline in average stores in operation and a 0.7% decline in comparable store net sales. Stores closed in fiscal 2015 and fiscal 2014 recorded sales of $17.6 million and $45.2 million. Total product units sold for fiscal 2015 decreased 5.7% and the average retail price for units sold decreased 1.7%.
Net sales by merchandise category for fiscal 2015 and fiscal 2014 were as follows:
| ($ in thousands) | 2015 Net Sales | % Total | 2014 Net Sales | % Total | Total $ Net Sales Change | Total % Net Sales Change | Comparable Store % Net Sales Change | |||||||||||||||||||||
| Video | $ | 132,191 | 39.5 | % | $ | 157,378 | 43.9 | % | $ | (25,187 | ) | (16.0 | %) | (11.2 | %) | |||||||||||||
| Music | 84,000 | 25.1 | % | 96,792 | 27.0 | % | (12,792 | ) | (13.2 | %) | (7.5 | %) | ||||||||||||||||
| Trend | 74,295 | 22.2 | % | 54,490 | 15.2 | % | 19,805 | 36.3 | % | 40.2 | % | |||||||||||||||||
| Electronics | 36,143 | 10.8 | % | 34,415 | 9.6 | % | 1,728 | 5.0 | % | 12.8 | % | |||||||||||||||||
| Video games | 8,032 | 2.4 | % | 15,415 | 4.3 | % | (7,383 | ) | (47.9 | %) | (37.7 | %) | ||||||||||||||||
| Total | $ | 334,661 | 100.0 | % | $ | 358,490 | 100.0 | % | (23,829 | ) | (6.6 | %) | (0.7 | %) | ||||||||||||||
Video
The Company’s stores offer a wide range of new and used DVDs and Blu-rays in a majority of its stores. Total net sales for in the video category declined 11.2% on a comparable store sales basis in fiscal 2015. Video sales were negatively impacted industry wide declines in physical video due to non physical options.
According to Warner Home Video, total video sales in the United States declined 11% during the period corresponding with the Company’s fiscal 2015.
Music
The Company’s stores offer a wide range of new and used CDs, music DVDs and vinyl across most music genres, including new releases from current artists as well as an extensive catalog of music from past periods and artists. Total net sales in the music category declined 7.5% on a comparable store sale basis in fiscal 2015. The Company has offset declines in CD sales by adding vinyl to its stores.
According to SoundScan, total CD unit sales in the United States declined 11.9% during the period corresponding with the Company’s fiscal 2015.
| 19 |
Trend
The Company’s stores offer a selection of trend products that relate to theatrical releases, music, and gaming. The trend category increased 40.2% on a comparable store sales basis in fiscal 2015. Trend represented 22.2% of the Company’s total net sales in fiscal 2015 versus 15.2% in fiscal 2014. The Company continues to take advantage of opportunities to strengthen its selection and shift product mix to growing categories of entertainment-related merchandise. The Company grew sales by strengthening its assortment and improving the product presentation and value proposition.
Electronics
The Company’s stores offer a selection of complementary portable electronics and accessories to support our entertainment products. The electronics category increased 12.8% on a comparable store sales basis. Electronics represented 10.8% of the Company’s total net sales in fiscal 2015 versus 9.6% in fiscal 2014.
Video games
Comparable net sales in the games category decreased 37.7%. The Company continues to shift its inventory investment and space allocation away from games to higher margin growth categories.
Gross Profit. The following table sets forth a year-over-year comparison of the Company’s Gross Profit:
| ($ in thousands) | 2015 vs. 2014 | |||||||||||||||
| 2015 | 2014 | $ | % | |||||||||||||
| Gross Profit | $ | 130,572 | $ | 135,918 | ($ | 5,346 | ) | (3.9 | %) | |||||||
| As a percentage of net sales | 39.0 | % | 37.9 | % | ||||||||||||
The decline in gross profit was due to lower sales partially offset by a 110 basis point increase in Gross Profit as a percentage of sales. Gross Profit as a percentage of sales increased due to increases in a majority of its merchandise categories and the contribution shift to the higher margin trend category.
Selling, General and Administrative Expenses.
The following table sets forth a year-over-year comparison of the Company’s SG&A expenses:
| ($ in thousands) | 2015 vs. 2014 | |||||||||||||||
| 2015 | 2014 | $ | % | |||||||||||||
| Selling, general and administrative expenses | $ | 126,002 | $ | 132,143 | ($ | 6,141 | ) | (4.7 | %) | |||||||
| As a percentage of net sales | 37.7 | % | 36.9 | % | ||||||||||||
The $6.1 million decrease in SG&A expenses is primarily due to fewer stores in operation and a one-time reimbursement of expenses incurred in prior years related to a legal settlement of $1.4 million. SG&A as a percentage of net sales increased 80 basis points from 36.9% in 2014 to 37.7% in 2015 due to higher annual incentives.
Interest Expense. Interest expense in fiscal 2015 was $1.9 million, compared to $2.0 million in fiscal 2014.
Other Income. Other income, which is primarily made up of interest income, was $160,000 in fiscal 2015 compared to $70,000 in fiscal 2014.
| 20 |
Income Tax Expense. The following table sets forth a year-over-year comparison of the Company’s income tax expense:
| ($ in thousands) | 2015 vs. 2014 | |||||||||||
| 2015 | 2014 | $ | ||||||||||
| Income tax expense | $ | 181 | $ | 116 | $ | 65 | ||||||
| Effective tax rate | 6.3 | % | 6.1 | % | ||||||||
The fiscal 2015 and 2014 income tax expense includes state taxes, adjustments to the reserve for uncertain tax positions and the accrual of interest. See Note 4 in the Notes to Consolidated Financial Statements for further detail.
Net Income. The following table sets forth a year-over-year comparison of the Company’s net income:
| ($ in thousands) | 2015 vs. 2014 | |||||||||||
| 2015 | 2014 | $ | ||||||||||
| Net income | $ | 2,689 | $ | 1,778 | $ | 1,712 | ||||||
| Net income as a percentage of net sales | 0.8 | % | 0.5 | % | ||||||||
Net income for fiscal 2015 increased by $0.9 million to $2.7 million, as compared to $1.8 million for fiscal 2014 primarily due to a one-time reimbursement of expenses incurred in prior years related to a legal settlement of $1.4 million and increases in gross margin as a percentage of sales, partially offset by the impact of the decrease in sales and increase in SG&A expenses as a percentage of sales.
| 21 |
Fiscal Year Ended January 31, 2015 (“fiscal 2014”)
Compared to fiscal Year Ended February 1, 2014 (“fiscal 2013”)
Net Sales. The following table sets forth a year-over-year comparison of the Company’s total net sales:
| 2014 vs. 2013 | ||||||||||||||||
| ($ in thousands) | 2014 | 2013 | $ | % | ||||||||||||
| Net Sales | $ | 358,490 | $ | 393,659 | ($ | 35,169 | ) | (8.9 | %) | |||||||
The 8.9% net sales decline from the prior year is due to a 7.6% decline in average stores in operation and a 1.0% decline in comparable store net sales. Stores closed in fiscal 2013 and fiscal 2014 recorded sales of $72.1 million in fiscal 2013. Total product units sold in fiscal 2014 decreased 6.6% and the average retail price for units sold decreased 3.0%.
Net sales by merchandise category for fiscal 2014 and fiscal 2013 were as follows:
| 2014 | % | 2013 | % | Total % Net Sales | Comparable Store % Net | |||||||||||||||||||
| ($ in thousands) | Net Sales | Total | Net Sales | Total | Change | Sales Change | ||||||||||||||||||
| Video | $ | 157,378 | 43.9 | % | $ | 177,540 | 45.1 | % | (11.3 | %) | (3.0 | %) | ||||||||||||
| Music | 96,792 | 27.0 | 113,374 | 28.8 | (14.7 | ) | (7.8 | ) | ||||||||||||||||
| Trend | 54,490 | 15.2 | 48,420 | 12.3 | 12.4 | 20.2 | ||||||||||||||||||
| Electronics | 34,415 | 9.6 | 36,217 | 9.2 | (5.0 | ) | 2.2 | |||||||||||||||||
| Video games | 15,415 | 4.3 | 18,108 | 4.6 | (14.9 | ) | (4.3 | ) | ||||||||||||||||
| Total | $ | 358,490 | 100.0 | % | $ | 393,659 | 100.0 | % | (8.9 | %) | (1.0 | %) | ||||||||||||
Video
Company’s stores offer a wide range of new and used DVDs and Blu-rays in a majority of its stores. Total net sales for fiscal 2014 in the video category decreased 11.3% due to the lower average store count, and a 3.0% decrease in comparable store sales. Video sales were negatively impacted by weaker new releases resulting from the decline in box office sales during the year.
According to Warner Home Video, total video sales in the United States declined 9.9% during the period corresponding with the Company’s fiscal 2014.
Music
The Company’s stores offer a wide range of new and used CDs, music DVDs and vinyl across most music genres, including new releases from current artists as well as an extensive catalog of music from past periods and artists. Total net sales in the music category declined 7.8% on a comparable store sale basis in fiscal 2014. The Company has offset declines in CD sales by adding vinyl to many of its stores.
According to SoundScan, total CD unit sales in the United States declined 14.1% during the period corresponding with the Company’s fiscal 2014.
Trend
The Company’s stores offer a selection of trend products that relate to theatrical releases, music, and gaming. The trend category increased 20.2% on a comparable store sales basis. Trend represented 15.2% of the Company’s total net sales in fiscal 2014 versus 12.3% in fiscal 2013. The Company continues to take advantage of opportunities to strengthen its selection and shift product mix to growing categories of entertainment-related merchandise.
| 22 |
Electronics
The Company’s stores offer a selection of complementary portable electronics and accessories to support our entertainment products. Total net sales in the electronics category increased 2.2% on a comparable store sales basis. Electronics represented 9.6% of the Company’s total net sales in fiscal 2014 versus 9.2% in fiscal 2013.
Video games
Comparable net sales in the games category decreased 4.3%.
Gross Profit. The following table sets forth a year-over-year comparison of the Company’s Gross Profit:
| ($ in thousands) | 2014 vs. 2013 | |||||||||||||||
| 2014 | 2013 | $ | % | |||||||||||||
| Gross Profit | $ | 135,918 | $ | 147,904 | ($ | 11,986 | ) | (8.1 | %) | |||||||
| As a percentage of net sales | 37.9 | % | 37.6 | % | ||||||||||||
The decline in gross profit was due to lower sales.
Selling, General and Administrative Expenses.
The following table sets forth a year-over-year comparison of the Company’s SG&A expenses:
| ($ in thousands) | 2014 vs. 2013 | |||||||||||||||
| 2014 | 2013 | $ | % | |||||||||||||
| Selling, general and administrative expenses | $ | 132,143 | $ | 137,529 | ($ | 5,386 | ) | (3.9 | %) | |||||||
| As a percentage of net sales | 36.9 | % | 34.9 | % | ||||||||||||
The $5.4 million decrease in SG&A expenses is due to a $9 million reduction in store expenses arising from the Company operating an average of 7.1% fewer stores and lower operating expenses in the ongoing stores. SG&A as a percentage of net sales increased 200 basis points from 34.9% in 2013 to 36.9% in 2014 primarily due to expenses associated with the appointment of a new CEO, a legal settlement, higher workers’ compensation and higher per-square-foot occupancy costs.
Interest Expense. Interest expense in fiscal 2014 was $2.0 million, the same level as fiscal 2013.
Other Income. Other income, which includes interest income, was $70,000 in fiscal 2014 compared to $80,000 in fiscal 2013.
| 23 |
Income Tax Expense. The following table sets forth a year-over-year comparison of the Company’s income tax expense:
| ($ in thousands) | 2014 vs. 2013 | |||||||||||
| 2014 | 2013 | $ | ||||||||||
| Income tax expense | $ | 116 | $ | 168 | ($ | 52 | ) | |||||
| Effective tax rate | 6.1 | % | 2.0 | % | ||||||||
The Fiscal 2014 and 2013 income tax expense includes state taxes, adjustments to the reserve for uncertain tax positions and the accrual of interest. See Note 4 in the Notes to Consolidated Financial Statements for further detail.
Net Income. The following table sets forth a year-over-year comparison of the Company’s net income:
| ($ in thousands) | 2014 vs. 2013 | |||||||||||
| 2014 | 2013 | $ | ||||||||||
| Net income | $ | 1,778 | $ | 8,277 | ($ | 6,499 | ) | |||||
| Net income as a percentage of net sales | 0.5 | % | 2.1 | % | ||||||||
Net income for fiscal 2014 decreased by $6.5 million to $1.8 million, as compared to $8.3 million for fiscal 2013 primarily due to lower sales partially offset by a higher gross margin rate and a decrease in SG&A expenses.
| 24 |
LIQUIDITY AND CAPITAL RESOURCES
Liquidity and Cash Flows: The Company’s primary sources of working capital are cash provided by operations and borrowing capacity under its revolving credit facility. The Company’s cash flows fluctuate from quarter to quarter due to various items, including seasonality of sales and earnings, merchandise inventory purchases and returns, the related terms on the purchases, stock purchases and capital expenditures. Management believes it will have adequate resources to fund its cash needs for the foreseeable future, including its capital spending, its seasonal increase in merchandise inventory and other operating cash requirements and commitments.
Management anticipates any cash requirements due to a shortfall in cash from operations will be funded by the Company’s revolving credit facility, discussed hereafter. Cash flows from investing activities are expected to be comprised primarily of capital expenditures during fiscal 2016. Cash flows from financing activities are expected to be comprised primarily of purchases of company shares under the share repurchase plan. The Company does not expect any material changes in the mix (between equity and debt) or the relative cost of capital resources.
The following table sets forth a three-year summary of key components of cash flow and working capital:
| ($ in thousands) | 2015 | 2014 | 2015 vs. 2014 | 2013 | 2014 vs. 2013 | |||||||||||||||
| Operating Cash Flows | $ | 7,963 | $ | 16,808 | $ | (8,845 | ) | $ | 7,308 | $ | 9,500 | |||||||||
| Investing Cash Flows | (20,185 | ) | (8,774 | ) | (11,411 | ) | (7,828 | ) | (946 | ) | ||||||||||
| Financing Cash Flows | (2,004 | ) | (20,499 | ) | 18,495 | (1,460 | ) | (19,039 | ) | |||||||||||
| Capital Expenditures | (20,700 | ) | (8,774 | ) | (11,926 | ) | (7,828 | ) | (946 | ) | ||||||||||
| End of Period Balances: | ||||||||||||||||||||
| Cash and Cash Equivalents | 104,311 | 118,537 | (14,226 | ) | 131,002 | (12,465 | ) | |||||||||||||
| Merchandise Inventory | 120,046 | 126,377 | (6,331 | ) | 150,167 | (23,790 | ) | |||||||||||||
| Merchandise Inventory Per Square Foot | 69.4 | 70.3 | 74.0 | |||||||||||||||||
| Working Capital | 161,142 | 173,444 | (12,302 | ) | 194,311 | (20,867 | ) | |||||||||||||
| Inventory turns | 1.6 | 1.5 | 1.6 | |||||||||||||||||
During fiscal 2015, cash flow from operations was $8.0 million primarily due to net income of $2.7 million, net of $5.2 million of depreciation. During fiscal 2014, cash flow from operations was $16.8 million primarily due to a reduction of inventory of $23.8 million and income from operations of $3.8 million partially offset by a $14.1 million reduction in accounts payable.
The Company monitors various statistics to measure its management of inventory, including inventory turnover (annual cost of sales divided by average merchandise inventory balances), inventory investment per square foot (merchandise inventory divided by total store square footage) and inventory leverage (accounts payable divided by merchandise inventory). Inventory turnover measures the Company’s ability to sell merchandise and how many times it is replaced in a year. This ratio is important in determining the need for markdowns and planning future inventory levels and assessing customer response to our merchandise. Inventory turnover in fiscal 2015 was 1.6 as compared to 1.5 at the end of fiscal 2014. Inventory investment per square foot measures the productivity of the inventory. It is important in determining if the Company has the appropriate level of inventory to meet customer demands while controlling its investment in inventory. Inventory investment per square foot was $69.4 per square foot at the end of fiscal 2015 as compared to $70.3 per square
| 25 |
foot at the end of fiscal 2014. Accounts payable leverage measures the percentage of inventory being funded by the Company’s product vendors. The percentage is important in determining the Company’s ability to fund its business. Accounts payable leverage on inventory was 43.2% as of January 30, 2016 compared with 50.3% as of January 31, 2015.
Cash used by investing activities was $20.2 million in fiscal 2015, compared to cash flows used by investing activities of $8.8 million in fiscal 2014. During fiscal 2015 and fiscal 2014, cash used by investing activities consisted primarily of capital expenditures. The Company’s capital expenditures consisted primarily of the expenditures for new and remodeled stores, a new point-of-sales system, store improvements and investments in information technology.
The Company has historically financed its capital expenditures through borrowings under its credit facility, select financing arrangements and cash flow from operations. The Company anticipates capital spending of approximately $17 million in fiscal 2016 as the Company continues to invest in strategic initiatives.
Cash used in financing activities was $2.0 million in fiscal 2015, compared to $20.5 million in fiscal 2014. In fiscal 2015, the primary uses of cash were stock repurchases of $1.1 million and payments on capital leases of $0.9 million. In fiscal 2014, the primary uses of cash were payment of a special dividend of $16.0 million and stock repurchases of $3.5 million.
The Company has a $75 million credit facility (“Credit Facility”). The principal amount of all outstanding loans under the Credit Facility together with any accrued but unpaid interest, are due and payable in May 2017, unless otherwise paid earlier pursuant to the terms of the Credit Facility. Payments of amounts due under the Credit Facility are secured by the assets of the Company.
The Credit Facility includes customary provisions, including affirmative and negative covenants, which include representations, warranties and restrictions on additional indebtedness and acquisitions. The Credit Facility also includes customary events of default, including, among other things, material adverse effect, bankruptcy, and certain changes of control. The Credit Facility also contains other terms and conditions, including limitations on the payment of dividends and covenants around the number of store closings. As of January 30, 2016, the Company was compliant with all covenants.
Interest under the Credit Facility will accrue, at the election of the Company, at a Base Rate or LIBO Rate, plus, in each case, an Applicable Margin, which is determined by reference to the level of availability, with the Applicable Margin for LIBO Rate loans ranging from 2.25% to 2.75% and the Applicable Margin for Prime Rate loans ranging from 0.75% to 1.25%. In addition, a commitment fee ranging from 0.375% to 0.50% is also payable on unused commitments.
The availability under the Credit Facility is subject to limitations based on sufficient inventory levels.
As of January 30, 2016 and January 31, 2015, the Company did not have any borrowings under the Credit Facility. During fiscal 2015 and fiscal 2014, the Company did not have any borrowings under the Credit Facility. As of January 30, 2016 and January 31, 2015, the Company had no outstanding letters of credit. The Company had $39 million and $41 million available for borrowing as of January 30, 2016 and January 31, 2015, respectively.
Off-Balance Sheet Arrangements. The Company has no off-balance sheet arrangements as defined by Item 303 (a) (4) of Regulation S-K.
| 26 |
Contractual Obligations and Commitments. The following table summarizes the Company’s contractual obligations as of January 30, 2016, and the effect that such obligations are expected to have on liquidity and cash flows in future periods.
| Contractual Obligation | 2016 | 2017- 2018 | 2019 - 2020 | 2021 and Beyond | Total | |||||||||||||||
| $ in thousands | ||||||||||||||||||||
| Operating lease and maintenance agreement obligations | 17,776 | 18,792 | 8,891 | 5,318 | 50,777 | |||||||||||||||
| Other long-term liabilities (1) | 2,569 | 64 | 49 | 206 | 2,888 | |||||||||||||||
| Pension benefits (2) | 1,147 | 2,280 | 2,402 | 6,065 | 11,894 | |||||||||||||||
| Total | $ | 21,492 | $ | 21,136 | $ | 11,342 | $ | 11,589 | $ | 65,559 | ||||||||||
| (1) | Included in other long-term liabilities in the Consolidated Balance Sheet as of January 30, 2016 is the long-term portion of deferred rent of $1.4 million which are not reflected in the table above as these amounts do not represent contractual obligations. Also included in other long-term liabilities is the long-term portion of the straight line rent liability of $1.5 million, which is included in operating lease obligations in the table above. |
| Other long-term liabilities in the table above are the estimated asset retirement obligations associated with the fixed assets and leasehold improvements at the Company’s store locations that arise under the terms of operating leases. | |
| (2) | In addition to the scheduled pension benefit payments, the Company offers a 401(k) Savings Plan to eligible employees (see also Note 6 of Notes to Consolidated Financial Statements in this report). Total expense related to the Company’s matching contribution was approximately $424,000, $437,000 and $331,000 in fiscal 2015, fiscal 2014 and fiscal 2013 respectively. |
Related Party Transactions.
The Company leases its 181,300 square foot distribution center/office facility in Albany, New York from Robert J. Higgins, its Chairman and largest shareholder. The original distribution center/office facility was occupied in 1985.
On December 4, 2015, the Company amended and restated the lease. The lease commenced January 1, 2016 and expires December 31, 2020.
Under the three original capital leases, dated April 1, 1985, November 1, 1989 and September 1, 1998, the Company paid Mr. Higgins an annual rent of $2.1 million, $2.3 million and $2.3 million in fiscal 2015, fiscal 2014 and fiscal 2013, respectively. Under the new lease dated December 4, 2015, and accounted for as an operating lease, the Company paid Mr. Higgins $103,000 in fiscal 2015. Under the terms of the lease agreements the Company is responsible for property taxes and other operating costs with respect to the premises.
The Company leased one of its retail stores from Mr. Higgins under an operating lease. The lease expired and was not renewed as of January 31, 2015. The Company did not have any obligations under the lease in fiscal 2015. Annual rental payments under this lease were $40,000 in both fiscal 2014 and fiscal 2013. Under the terms of the lease, the Company paid property taxes, maintenance and a contingent rent if a specified sales level was achieved. No contingent rent was paid in fiscal 2014 and fiscal 2013. Total additional charges for the store were approximately $2,400 and $3,800 in fiscal 2014 and fiscal 2013 respectively.
| 27 |
CRITICAL ACCOUNTING POLICIES
The preparation of financial statements and related disclosures in conformity with accounting principles generally accepted in the United States requires that management apply accounting policies and make estimates and assumptions that affect results of operations and the reported amounts of assets and liabilities in the financial statements. Management continually evaluates its estimates and judgments including those related to merchandise inventory and return costs and income taxes. Management bases its estimates and judgments on historical experience and other factors that are believed to be reasonable under the circumstances. Actual results may differ from these estimates under different assumptions or conditions. Note 1 of the Notes to Consolidated Financial Statements in this report includes a summary of the significant accounting policies and methods used by the Company in the preparation of its consolidated financial statements. Management believes that of the Company’s significant accounting policies, the following may involve a higher degree of judgment or complexity:
Merchandise Inventory and Return Costs: Merchandise inventory is stated at the lower of cost or market under the average cost method. The average cost method attaches a cost to each item and is a blended average of the original purchase price and those of subsequent purchases or other cost adjustments throughout the life cycle of that item.
Inventory valuation requires significant judgment and estimates, including obsolescence, shrink and any adjustments to market value; if market value is lower than cost. Inherent in the entertainment products industry is the risk of obsolete inventory. Typically, newer releases generate a higher product demand. Some vendors offer credits to reduce the cost of products that are selling more slowly, thus allowing for a reduction in the selling price and reducing the possibility for items to become obsolete. The Company records obsolescence and any adjustments to market value (if lower than cost) based on current and anticipated demand, customer preferences, and market conditions. The provision for inventory shrink is estimated as a percentage of sales for the period from the last date a physical inventory was performed to the end of the fiscal year. Such estimates are based on historical results and trends and the shrink results from the last physical inventory. Physical inventories are taken at least annually for all stores and the distribution center throughout the year and inventory records are adjusted accordingly.
Shrink expense, including obsolescence was $4.7 million, $5.0 million and $5.2 million, in fiscal 2015, fiscal 2014 and fiscal 2013, respectively. As a rate to net sales, this equaled 1.4%, 1.4% and 1.3%, respectively. Presently, a 0.1% change in the rate of shrink provision would equal approximately $0.2 million in additional charge or benefit to cost of sales, based on fiscal 2015 net sales since the last physical inventories.
The Company is generally entitled to return merchandise purchased from major music and video vendors for credit against other purchases from these vendors. Certain vendors reduce the credit with a per unit merchandise return charge which varies depending on the type of merchandise being returned. Certain other vendors charge a handling fee based on units returned. The Company records merchandise return charges in cost of sales. The Company incurred merchandise return charges in its fiscal 2015, fiscal 2014 and fiscal 2013 of $0.5 million, $0.7 million and $0.9 million, respectively.
Income Taxes: Income taxes are accounted for under the asset and liability method. Deferred tax assets and liabilities are recognized for the future tax consequences attributable to differences between the financial statement carrying amounts of existing assets and liabilities and their respective tax bases and tax operating loss carryforwards. Deferred tax assets and liabilities are measured using enacted tax rates expected to apply to taxable income in the years in which those temporary differences are expected to be recovered or settled. The effect on deferred tax assets and liabilities of a change in tax rates is recognized in the results of operations in the period that includes the enactment date.
Accounting for income taxes requires management to make estimates and judgments regarding interpretation of various taxing jurisdictions, laws and regulations as well as the ultimate realization of deferred tax assets. These estimates and judgments include the generation of future taxable income, viable tax planning strategies and support of tax filings. In assessing the value of deferred tax assets, management considers whether it is more likely than not that some portion or all of the deferred tax assets will not be realized. The ultimate realization of deferred tax assets is dependent upon the generation of future taxable income. Management considers the scheduled reversal of taxable temporary differences, projected future
| 28 |
taxable income and tax planning strategies in making this assessment. Based on the available objective evidence, management concluded that a full valuation allowance should be recorded against its net deferred tax assets as of January 30, 2016. During fiscal 2016 and in future years, the Company will continue to record a valuation allowance against recorded net deferred tax assets at a level deemed appropriate by management.
Recently Issued Accounting Pronouncements.
In 2014, the FASB issued Accounting Standard Update (“ASU”) No. 2014-09, Revenue from Contracts with Customers, which requires an entity to recognize the amount of revenue to which it expects to be entitled for the transfer of promised goods or services to customers. The ASU will replace most existing revenue recognition guidance in U.S. GAAP when it becomes effective. The new standard is effective for the Company on January 28, 2017. Early application is not permitted. The standard permits the use of either the retrospective or cumulative effect transition method. The Company is evaluating the effect that ASU 2014-09 will have on its consolidated financial statements and related disclosures. The Company has not yet selected a transition method nor has it determined the effect of the standard on its ongoing financial reporting.
In August 2014, the FASB issued ASU No. 2014-15, Disclosures of Uncertainties about an Entity’s Ability to Continue as a Going Concern, which requires the Company to assess their ability to continue as a going concern by incorporating and expanding upon certain principles that are currently in U.S. auditing standards. Specifically, the amendments (1) provide a definition of the term substantial doubt, (2) require an evaluation every reporting period including interim periods, (3) provide principles for considering the mitigating effect of Company’s plans, (4) require certain disclosures when substantial doubt is alleviated as a result of consideration of management’s plans, (5) require an express statement and other disclosures when substantial doubt is not alleviated, and (6) require an assessment for a period of one year after the date that the financial statements are issued (or available to be issued). The new standard is effective for reporting periods beginning after December 15, 2016. Early application is permitted. The Company does not expect the adoption of this update to have a significant effect on our financial statements.
In July 2015, the FASB issued ASU No. 2015-11, Simplifying the Measurement of Inventory. The amendments, which apply to inventory that is measured using any method other than the last-in, first-out (LIFO) or retail inventory method, require that entities measure inventory at the lower of cost or net realizable value. ASU 2015-11 is effective for fiscal years, and interim periods within those years, beginning after December 15, 2016 and should be applied on a prospective basis. We are currently assessing the potential impact of adopting this ASU, but do not, at this time, anticipate a material impact to our consolidated results of operations, financial positions or cash flows.
In February 2016, the FASB issued ASU No. 2016-02, Leases, which will replace most existing lease accounting guidance in U.S. GAAP. The core principle of the ASU is that an entity should recognize the rights and obligations resulting from leases as assets and liabilities. ASU 2016-02 requires qualitative and specific quantitative disclosures to supplement the amounts recorded in the financial statements so that users can understand more about the nature of an entity’s leasing activities, including significant judgments and changes in judgments. ASU 2016-02 will be effective for the Company beginning in fiscal 2019, and requires the modified retrospective method of adoption. Early adoption is permitted. The Company is in the process of determining the method and timing of adoption and assessing the impact of ASU 2016-02 on its consolidated financial statements.
Item 7A. QUANTITATIVE AND QUALITATIVE DISCLOSURES ABOUT MARKET RISK
The Company does not hold any financial instruments that expose it to significant market risk and does not engage in hedging activities. To the extent the Company borrows under its revolving credit facility, the Company is subject to risk resulting from interest rate fluctuations since interest on the Company’s borrowings under its credit facility can be variable. If interest rates on the Company’s revolving credit facility were to increase by 25 basis points, and to the extent borrowings were outstanding, for every $1,000,000 outstanding on the facility, income before income taxes would be reduced by $2,500
| 29 |
per year. Information about the fair value of financial instruments is included in Note 1 of Notes to the Consolidated Financial Statements in this report.
Item 8. FINANCIAL STATEMENTS AND SUPPLEMENTARY DATA
The index to the Company’s Consolidated Financial Statements is included in Item 15, and the Consolidated Financial Statements follow the signature page to this report and are incorporated herein by reference.
The quarterly results of operations are included herein in Note 9 of Notes to the Consolidated Financial Statements in this report.
Item 9. CHANGES IN AND DISAGREEMENTS WITH ACCOUNTANTS ON ACCOUNTING AND FINANCIAL DISCLOSURE
None.
Item 9A. CONTROLS AND PROCEDURES
Conclusion Regarding the Effectiveness of Disclosure Controls and Procedures: Under the supervision and with the participation of our management, including our principal executive officer and principal financial officer, we conducted an evaluation of the effectiveness of our disclosure controls and procedures, as such term is defined under Rule 13a-15(e) promulgated under the Securities Exchange Act of 1934, as amended (the “Exchange Act”). Based on this evaluation, our principal executive officer and our principal financial officer concluded that the Company’s disclosure controls and procedures were designed to provide reasonable assurance of achieving their objectives and as of the end of the period covered by this annual report, our disclosure controls and procedures were effective, in that they provide reasonable assurance that information required to be disclosed by us in the reports we file or submit, under the Exchange Act, is recorded, processed, summarized, as appropriate, to allow timely decisions regarding required disclosure and reported within the time period specified in the Securities and Exchange Commission’s rules and forms and that such information is accumulated and communicated to management including the principal executive officer and principal financial officer.
Management’s Report on Internal Control Over Financial Reporting: Management is responsible for establishing and maintaining adequate internal control over financial reporting (as defined in Rule 13a-15(f) and 15d – 15(f) under the Exchange Act, as amended). Under the supervision and with the participation of the Company’s management, including our principal executive officer and principal financial officer, we conducted an evaluation of the effectiveness of our internal control over financial reporting based on the framework set forth by the Committee of Sponsoring Organizations of the Treadway Commission (“COSO”) in Internal Control-Integrated Framework (2013). Based on our evaluation under the framework in Internal Control- Integrated Framework (2013), our management concluded that our internal control over financial reporting was effective as of January 30, 2016.
The Company’s independent registered public accounting firm, KPMG LLP, has issued an audit report on the Company’s effectiveness of internal control over financial reporting as of January 30, 2016, which is included on page F-3 in Item 8 of this report and incorporated herein by reference.
Changes in Controls and Procedures: No change in our internal control over financial reporting occurred during the quarterly period ended January 30, 2016 that has materially affected, or is reasonably likely to materially affect, our internal control over financial reporting.
Item 9B. Other Information
No events have occurred which would require disclosure under this Item.
| 30 |
PART III
Item 10. DIRECTORS, EXECUTIVE OFFICERS AND CORPORATE GOVERNANCE
Information required by this item is incorporated by reference from the information to be included in the Proxy Statement to be filed pursuant to Regulation 14A with the SEC, which Proxy Statement is incorporated by reference.
Code of Ethics
We have adopted the Trans World Entertainment Corporation Code of Ethics that applies to all officers, directors, employees and consultants of the Company. The Code of Ethics is intended to comply with Item 406 of Regulation S-K of the Securities Exchange Act of 1934 and with applicable rules of The NASDAQ Stock Market, Inc. Our Code of Ethics is posted on our Internet website under the “Corporate” page. Our Internet website address is www.twec.com. To the extent required by the rules of the SEC and NASDAQ, we will disclose amendments and waivers relating to our Code of Ethics in the same place on our website.
Item 11. EXECUTIVE COMPENSATION
Information required by this item is incorporated by reference from the information to be included in the Proxy Statement to be filed pursuant to Regulation 14A with the SEC, which Proxy Statement is incorporated by reference.
Item 12. SECURITY OWNERSHIP OF CERTAIN BENEFICIAL OWNERS AND MANAGEMENT AND RELATED SHAREHOLDER MATTERS
Information required by this item is incorporated by reference from the information to be included in the Proxy Statement to be filed pursuant to Regulation 14A with the SEC, which Proxy Statement is incorporated by reference.
Information on Trans World Entertainment Common Stock authorized for issuance under equity compensation plans is contained in our Proxy Statement for our 2015 Annual Meeting of Shareholders under the caption “Report of the Compensation Committee” and is incorporated herein by reference. See Note 6 of Notes to the Consolidated Financial Statements in this Annual Report on Form 10-K for a description of the Company’s employee stock award plans.
The following table contains information about the Company’s Common Stock that may be issued upon the exercise of options, warrants and rights under all of the Company’s equity compensation plans as of January 30, 2016:
| Plan Category | Number of Shares to be Issued upon Exercise of Outstanding Options, Warrants and Rights(1) | Weighted Average Exercise Price of Outstanding Options, Warrants and Rights(1) | Number of Shares Remaining Available for Future Issuance Under Equity Compensation Plans (Excluding Outstanding Options, Warrants and Rights) | |||||||||
| Equity Compensation Plan Approved by Shareholders | 2,322,999 | $4.04 | 2,113,726 | |||||||||
| Equity Compensation Plans and Agreements not Approved by Shareholders | — | — | — | |||||||||
(1) Includes 211,174 deferred shares under which shares may be issued for no consideration.
| 31 |
Item 13. CERTAIN RELATIONSHIPS AND RELATED TRANSACTIONS, AND DIRECTOR INDEPENDENCE
Information required by this item is incorporated by reference from the information to be included in the Proxy Statement to be filed pursuant to Regulation 14A with the SEC, which Proxy Statement is incorporated by reference.
Item 14. PRINCIPAL ACCOUNTANT FEES AND SERVICES
Information required by this item is incorporated by reference from the information to be included in the Proxy Statement to be filed pursuant to Regulation 14A with the SEC, which Proxy Statement is incorporated by reference.
| 32 |
PART IV
Item 15. EXHIBITS AND FINANCIAL STATEMENT SCHEDULES
15(a) (1) Financial Statements
The Consolidated Financial Statements and Notes are listed in the Index to Consolidated Financial Statements on page F-1 of this report.
15(a) (2) Financial Statement Schedules
Consolidated Financial Statement Schedules not filed herein have been omitted as they are not applicable or the required information or equivalent information has been included in the Consolidated Financial Statements or the notes thereto.
15(a) (3) Exhibits
Exhibits are as set forth in the “Index to Exhibits” which follows the Notes to the Consolidated Financial Statements and immediately precedes the exhibits filed.
| 33 |
SIGNATURES
Pursuant to the requirements of Section 13 or 15(d) of the Securities Exchange Act of 1934, the registrant has duly caused this report to be signed on its behalf by the undersigned, thereunto duly authorized.
| TRANS WORLD ENTERTAINMENT CORPORATION | ||||
| Date: April 14, 2016 | By: /s/ Michael Feurer | |||
| Michael Feurer Chief Executive Officer |
||||
Pursuant to the requirements of the Securities Exchange Act of 1934, this report has been signed below by the following persons on behalf of the registrant and in the capacities and on the dates indicated.
| Name | Title | Date |
| /s/ Michael Feurer | Chief Executive Officer and Director | April 14, 2016 |
| (Michael Feurer) | (Principal Executive Officer) | |
| /s/ John Anderson | ||
| (John Anderson) | Chief Financial Officer (Principal Financial and Chief Accounting Officer) |
April 14, 2016 |
| /s/ Robert J. Higgins | ||
| (Robert J. Higgins) | Chairman of the Board | April 14, 2016 |
| /s/ Martin Hanaka | ||
| (Martin Hanaka) | Director | April 14, 2016 |
| /s/ Dr. Joseph Morone | ||
| (Dr. Joseph G. Morone) | Director | April 14, 2016 |
| /s/Robert Marks | ||
| (Robert Marks) | Director | April 14, 2016 |
| /s/ Michael Nahl | ||
| (Michael Nahl) | Director | April 14, 2016 |
| /s/ Michael B. Solow | ||
| (Michael B. Solow) | Director | April 14, 2016 |
| 34 |
TRANS WORLD ENTERTAINMENT CORPORATION
INDEX TO CONSOLIDATED FINANCIAL STATEMENTS
| F-1 |
Report of Independent Registered Public Accounting Firm
The Board of Directors and Shareholders
Trans World Entertainment Corporation:
We have audited the accompanying consolidated balance sheets of Trans World Entertainment Corporation and subsidiaries (the “Company”) as of January 30, 2016 and January 31, 2015, and the related consolidated statements of income, comprehensive income (loss), shareholders’ equity, and cash flows for each of the fiscal years in the three-year period ended January 30, 2016. These consolidated financial statements are the responsibility of the Company’s management. Our responsibility is to express an opinion on these consolidated financial statements based on our audits.
We conducted our audits in accordance with the standards of the Public Company Accounting Oversight Board (United States). Those standards require that we plan and perform the audit to obtain reasonable assurance about whether the financial statements are free of material misstatement. An audit includes examining, on a test basis, evidence supporting the amounts and disclosures in the financial statements. An audit also includes assessing the accounting principles used and significant estimates made by management, as well as evaluating the overall financial statement presentation. We believe that our audits provide a reasonable basis for our opinion.
In our opinion, the consolidated financial statements referred to above present fairly, in all material respects, the financial position of Trans World Entertainment Corporation and subsidiaries as of January 30, 2016 and January 31, 2015, and the results of their operations and their cash flows for each of the fiscal years in the three-year period ended January 30, 2016, in conformity with U.S. generally accepted accounting principles.
We also have audited, in accordance with the standards of the Public Company Accounting Oversight Board (United States), the Company’s internal control over financial reporting as of January 30, 2016, based on criteria established in Internal Control – Integrated Framework (2013) issued by the Committee of Sponsoring Organizations of the Treadway Commission (COSO), and our report dated April 14, 2016 expressed an unqualified opinion on the effectiveness of the Company’s internal control over financial reporting.
/s/ KPMG LLP
Albany, New York
April 14, 2016
| F-2 |
Report of Independent Registered Public Accounting Firm
The Board of Directors and Shareholders
Trans World Entertainment Corporation:
We have audited Trans World Entertainment Corporation’s (the Company) internal control over financial reporting as of January 30, 2016, based on criteria established in Internal Control—Integrated Framework (2013) issued by the Committee of Sponsoring Organizations of the Treadway Commission (COSO). The Company’s management is responsible for maintaining effective internal control over financial reporting and for its assessment of the effectiveness of internal control over financial reporting, included in the accompanying Management’s Report on Internal Control Over Financial Reporting. Our responsibility is to express an opinion on the Company’s internal control over financial reporting based on our audit.
We conducted our audit in accordance with the standards of the Public Company Accounting Oversight Board (United States). Those standards require that we plan and perform the audit to obtain reasonable assurance about whether effective internal control over financial reporting was maintained in all material respects. Our audit included obtaining an understanding of internal control over financial reporting, assessing the risk that a material weakness exists, and testing and evaluating the design and operating effectiveness of internal control based on the assessed risk. Our audit also included performing such other procedures as we considered necessary in the circumstances. We believe that our audit provides a reasonable basis for our opinion.
A company’s internal control over financial reporting is a process designed to provide reasonable assurance regarding the reliability of financial reporting and the preparation of financial statements for external purposes in accordance with generally accepted accounting principles. A company’s internal control over financial reporting includes those policies and procedures that (1) pertain to the maintenance of records that, in reasonable detail, accurately and fairly reflect the transactions and dispositions of the assets of the company; (2) provide reasonable assurance that transactions are recorded as necessary to permit preparation of financial statements in accordance with generally accepted accounting principles, and that receipts and expenditures of the company are being made only in accordance with authorizations of management and directors of the company; and (3) provide reasonable assurance regarding prevention or timely detection of unauthorized acquisition, use, or disposition of the company’s assets that could have a material effect on the financial statements.
Because of its inherent limitations, internal control over financial reporting may not prevent or detect misstatements. Also, projections of any evaluation of effectiveness to future periods are subject to the risk that controls may become inadequate because of changes in conditions, or that the degree of compliance with the policies or procedures may deteriorate.
In our opinion, Trans World Entertainment Corporation maintained, in all material respects, effective internal control over financial reporting as of January 30, 2016, based on criteria established in Internal Control—Integrated Framework (2013) issued by COSO.
We also have audited, in accordance with the standards of the Public Company Accounting Oversight Board (United States), the consolidated balance sheets of Trans World Entertainment Corporation and subsidiaries as of January 30, 2016 and January 31, 2015, and the related consolidated statements of income, comprehensive income (loss), shareholders’ equity, and cash flows for each of the fiscal years in the three-year period ended January 30, 2016, and our report dated April 14, 2016 expressed an unqualified opinion on those consolidated financial statements.
/s/ KPMG LLP
Albany, New York
April 14, 2016
| F-3 |
TRANS WORLD ENTERTAINMENT CORPORATION AND SUBSIDIARIES
CONSOLIDATED BALANCE SHEETS
($ in thousands, except per share and share amounts)
| January 30, | January 31, | |||||||
| 2016 | 2015 | |||||||
| ASSETS | ||||||||
| CURRENT ASSETS | ||||||||
| Cash and cash equivalents | $ | 104,311 | $ | 118,537 | ||||
| Accounts receivable | 4,597 | 3,545 | ||||||
| Merchandise inventory | 120,046 | 126,377 | ||||||
| Prepaid expenses and other | 2,033 | 6,699 | ||||||
| Total current assets | 230,987 | 255,158 | ||||||
| Fixed Assets, net | 30,666 | 15,769 | ||||||
| Other Assets | 9,952 | 9,082 | ||||||
| TOTAL ASSETS | $ | 271,605 | $ | 280,009 | ||||
| LIABILITIES | ||||||||
| CURRENT LIABILITIES | ||||||||
| Accounts payable | $ | 51,888 | $ | 63,527 | ||||
| Accrued expenses and other current liabilities | 8,974 | 7,397 | ||||||
| Deferred revenue | 8,983 | 9,852 | ||||||
| Current portion of capital lease obligations | — | 938 | ||||||
| Total current liabilities | 69,845 | 81,714 | ||||||
| Other Long-term liabilities | 26,492 | 26,555 | ||||||
| TOTAL LIABILITIES | 96,337 | 108,269 | ||||||
| SHAREHOLDERS’ EQUITY | ||||||||
| Preferred stock ($0.01 par value; 5,000,000 shares authorized; none issued) | — | — | ||||||
| Common stock ($0.01 par value; 200,000,000 shares authorized; 58,395,668 shares and 58,337,668 shares issued, respectively) | 584 | 583 | ||||||
| Additional paid-in capital | 316,040 | 315,486 | ||||||
| Treasury stock at cost (27,411,133 and 27,094,423 shares, respectively ) | (227,497 | ) | (226,412 | ) | ||||
| Accumulated other comprehensive loss | (812 | ) | (2,181 | ) | ||||
| Retained earnings | 86,953 | 84,264 | ||||||
| TOTAL SHAREHOLDERS’ EQUITY | 175,268 | 171,740 | ||||||
| TOTAL LIABILITIES AND SHAREHOLDERS’ EQUITY | $ | 271,605 | $ | 280,009 | ||||
See Accompanying Notes to Consolidated Financial Statements.
| F-4 |
TRANS WORLD ENTERTAINMENT CORPORATION AND SUBSIDIARIES
CONSOLIDATED STATEMENTS OF INCOME
(in thousands, except per share amounts)
| Fiscal Year Ended | ||||||||||||
| January 30, | January 31, | February 1, | ||||||||||
| 2016 | 2015 | 2014 | ||||||||||
| Net sales | $ | 334,661 | $ | 358,490 | $ | 393,659 | ||||||
| Cost of sales | 204,089 | 222,572 | 245,755 | |||||||||
| Gross profit | 130,572 | 135,918 | 147,904 | |||||||||
| Selling, general and administrative expenses | 126,002 | 132,143 | 137,529 | |||||||||
| Income from operations | 4,570 | 3,775 | 10,375 | |||||||||
| Interest expense | 1,860 | 1,951 | 2,010 | |||||||||
| Other income | (160 | ) | (70 | ) | (80 | ) | ||||||
| Income before income taxes | 2,870 | 1,894 | 8,445 | |||||||||
| Income tax expense | 181 | 116 | 168 | |||||||||
| Net Income | $ | 2,689 | $ | 1,778 | $ | 8,277 | ||||||
| BASIC AND DILUTED INCOME PER SHARE: | ||||||||||||
| Basic income per share | $ | 0.09 | $ | 0.06 | $ | 0.25 | ||||||
| Weighted average number of common shares outstanding – basic | 31,167 | 31,744 | 32,584 | |||||||||
| Diluted income per share | $ | 0.09 | $ | 0.06 | $ | 0.25 | ||||||
| Weighted average number of common shares outstanding – diluted | 31,323 | 31,897 | 32,862 | |||||||||
| Cash dividend paid per share | — | $ | 0.50 | — | ||||||||
See Accompanying Notes to Consolidated Financial Statements.
| F-5 |
TRANS WORLD ENTERTAINMENT CORPORATION AND SUBSIDIARIES
CONSOLIDATED STATEMENTS OF COMPREHENSIVE INCOME (LOSS)
(amounts in thousands)
| Fiscal Year Ended | ||||||||||||
| January 30, | January 31, | February 1, | ||||||||||
| 2016 | 2015 | 2014 | ||||||||||
| Net income | $ | 2,689 | $ | 1,778 | $ | 8,277 | ||||||
| Pension income (loss) adjustment | 1,369 | (2,062 | ) | 2,655 | ||||||||
| Comprehensive income (loss) | $ | 4,058 | ($ | 284 | ) | $ | 10,932 | |||||
See Accompanying Notes to Consolidated Financial Statements.
| F-6 |
TRANS WORLD ENTERTAINMENT CORPORATION AND SUBSIDIARIES
CONSOLIDATED STATEMENTS OF SHAREHOLDERS’ EQUITY
(amounts in thousands)
| Accumulated | ||||||||||||||||||||||||||||||||
| Other | ||||||||||||||||||||||||||||||||
| Additional | Treasury | Comprehensive | ||||||||||||||||||||||||||||||
| Common | Common | Paid-in | Treasury | Stock | Income | Retained | Shareholders’ | |||||||||||||||||||||||||
| Shares | Stock | Capital | Shares | At Cost | (Loss) | Earnings | Equity | |||||||||||||||||||||||||
| Balance as of February 2, 2013 | 56,728 | $ | 567 | $ | 309,451 | (25,103 | ) | ($ | 217,555 | ) | ($ | 2,774 | ) | $ | 90,245 | $ | 179,934 | |||||||||||||||
| Net Income | — | — | — | — | — | — | 8,277 | 8,277 | ||||||||||||||||||||||||
| Pension income adjustment | — | — | — | — | — | 2,655 | — | 2,655 | ||||||||||||||||||||||||
| Stock compensation | — | — | 255 | — | — | — | — | 255 | ||||||||||||||||||||||||
| Exercise of equity grants | 1,477 | 15 | 4,854 | — | — | — | — | 4,869 | ||||||||||||||||||||||||
| Purchase of treasury stock | — | — | — | (1,006 | ) | (5,393 | ) | — | — | (5,393 | ) | |||||||||||||||||||||
| Issuance of stock to Directors | 94 | 1 | 372 | — | — | — | — | 373 | ||||||||||||||||||||||||
| Balance as of February 1, 2014 | 58,299 | $ | 583 | $ | 314,932 | (26,109 | ) | ($ | 222,948 | ) | ($ | 119 | ) | $ | 98,522 | $ | 190,970 | |||||||||||||||
| Net Income | — | — | — | — | — | — | 1,778 | 1,778 | ||||||||||||||||||||||||
| Pension income adjustment | — | — | — | — | — | (2,062 | ) | — | (2,062 | ) | ||||||||||||||||||||||
| Stock compensation | — | — | 429 | — | — | — | — | 429 | ||||||||||||||||||||||||
| Exercise of equity grants | 39 | — | 67 | — | — | — | — | 67 | ||||||||||||||||||||||||
| Purchase of treasury stock | — | — | — | (985 | ) | (3,464 | ) | — | — | (3,464 | ) | |||||||||||||||||||||
| Cash Dividends Paid | — | — | — | — | — | — | (16,036 | ) | (16,036 | ) | ||||||||||||||||||||||
| Amortization of unearned compensation – restricted stock | — | — | 58 | — | — | — | — | 58 | ||||||||||||||||||||||||
| Balance as of January 31, 2015 | 58,338 | $ | 583 | $ | 315,486 | (27,094 | ) | ($ | 226,412 | ) | ($ | 2,181 | ) | $ | 84,264 | $ | 171,740 | |||||||||||||||
| Net Income | — | — | — | — | — | — | 2,689 | 2,689 | ||||||||||||||||||||||||
| Pension income adjustment | — | — | — | — | — | 1,369 | — | 1,369 | ||||||||||||||||||||||||
| Stock compensation | — | — | 424 | — | — | — | — | 424 | ||||||||||||||||||||||||
| Exercise of equity grants | 8 | — | 19 | — | — | — | — | 19 | ||||||||||||||||||||||||
| Purchase of treasury stock | — | — | — | (317 | ) | (1,085 | ) | — | — | (1,085 | ) | |||||||||||||||||||||
| Vested restricted shares | 50 | 1 | (69 | ) | — | — | — | — | (68 | ) | ||||||||||||||||||||||
| Amortization of unearned compensation – restricted stock | — | — | 180 | — | — | — | — | 180 | ||||||||||||||||||||||||
| Balance as of January 30, 2016 | 58,396 | $ | 584 | $ | 316,040 | (27,411 | ) | ($ | 227,497 | ) | ($ | 812 | ) | $ | 86,953 | $ | 175,268 | |||||||||||||||
See Accompanying Notes to Consolidated Financial Statements.
| F-7 |
TRANS WORLD ENTERTAINMENT CORPORATION AND SUBSIDIARIES
CONSOLIDATED STATEMENTS OF CASH FLOWS
($ in thousands)
| Fiscal Year Ended | ||||||||||||
| January 30, | January 31, | February 1, | ||||||||||
| 2016 | 2015 | 2014 | ||||||||||
| OPERATING ACTIVITIES: | ||||||||||||
| Net income | $ | 2,689 | $ | 1,778 | $ | 8,277 | ||||||
| Adjustments to reconcile net income to net cash provided by operating activities: | ||||||||||||
| Depreciation of fixed assets | 5,191 | 4,388 | 4,304 | |||||||||
| Amortization of lease valuations, net | 23 | 136 | 138 | |||||||||
| Long term incentive compensation | 538 | 487 | 255 | |||||||||
| Loss on disposal of fixed assets | 613 | 210 | 162 | |||||||||
| Gain on sale of asset | (250 | ) | — | — | ||||||||
| Increase (decrease) in cash surrender value | 356 | (488 | ) | (1,081 | ) | |||||||
| Changes in operating assets and liabilities: | ||||||||||||
| Accounts receivable | (3 | ) | (861 | ) | (53 | ) | ||||||
| Merchandise inventory | 6,331 | 23,790 | 5,262 | |||||||||
| Prepaid expenses and other | 4,666 | 415 | (380 | ) | ||||||||
| Other assets | (2,561 | ) | 301 | 319 | ||||||||
| Accounts payable | (11,639 | ) | (14,098 | ) | (1,439 | ) | ||||||
| Accrued expenses, deferred revenue and other current liabilities | 707 | (716 | ) | (10,288 | ) | |||||||
| Other long-term liabilities | 1,302 | 1,466 | 1,832 | |||||||||
| Net cash provided by operating activities | 7,963 | 16,808 | 7,308 | |||||||||
| INVESTING ACTIVITIES: | ||||||||||||
| Purchases of fixed assets | (20,700 | ) | (8,774 | ) | (7,828 | ) | ||||||
| Proceeds from sale of assets | 1,567 | — | — | |||||||||
| Purchases of short term investments | (1,052 | ) | — | — | ||||||||
| Net cash used in investing activities | (20,185 | ) | (8,774 | ) | (7,828 | ) | ||||||
| FINANCING ACTIVITIES: | ||||||||||||
| Cash dividends paid | — | (16,036 | ) | — | ||||||||
| Exercise of long term equity awards | 19 | 67 | 4,869 | |||||||||
| Payments of capital lease obligations | (938 | ) | (1,066 | ) | (936 | ) | ||||||
| Purchase of treasury stock | (1,085 | ) | (3,464 | ) | (5,393 | ) | ||||||
| Net cash used in financing activities | (2,004 | ) | (20,499 | ) | (1,460 | ) | ||||||
| Net decrease in cash and cash equivalents | (14,226 | ) | (12,465 | ) | (1,980 | ) | ||||||
| Cash and cash equivalents, beginning of year | 118,537 | 131,002 | 132,982 | |||||||||
| Cash and cash equivalents, end of year | $ | 104,311 | $ | 118,537 | $ | 131,002 | ||||||
| Supplemental disclosures and non-cash investing and financing activities: | ||||||||||||
| Interest paid | $ | 1,861 | $ | 1,953 | $ | 2,015 | ||||||
| Issuance of deferred / restricted shares under deferred / restricted stock plans agreements | 69 | 58 | 373 | |||||||||
See Accompanying Notes to Consolidated Financial Statements.
| F-8 |
TRANS WORLD ENTERTAINMENT CORPORATION AND SUBSIDIARIES
NOTES TO CONSOLIDATED FINANCIAL STATEMENTS
Note 1. Nature of Operations and Summary of Significant Accounting Policies
Nature of Operations: Trans World Entertainment Corporation and subsidiaries (“the Company”) is one of the largest specialty retailers of entertainment products, including trend, video, music, electronics and related products in the United States. The Company operates a chain of retail entertainment stores and e-commerce sites, www.fye.com and www.secondspin.com in a single industry segment. As of January 30, 2016, the Company operated 299 stores totaling approximately 1.7 million square feet in the United States, the District of Columbia and the U.S. Virgin Islands. The Company’s business is seasonal in nature, with the peak selling period being the holiday season which falls in the Company’s fourth fiscal quarter.
Liquidity: The Company’s primary sources of working capital are cash provided by operations and borrowing capacity under its revolving credit facility. The Company’s cash flows fluctuate from quarter to quarter due to various items, including seasonality of sales and earnings, merchandise inventory purchases and returns, the related terms on the purchases and capital expenditures. Management believes it will have adequate resources to fund its cash needs for the foreseeable future, including its capital spending, its seasonal increase in merchandise inventory and other operating cash requirements and commitments.
Management anticipates any cash requirements due to a shortfall in cash from operations will be funded by the Company’s revolving credit facility, discussed hereafter.
Basis of Presentation: The consolidated financial statements consist of Trans World Entertainment Corporation, its wholly-owned subsidiary, Record Town, Inc. (“Record Town”), and Record Town’s subsidiaries, all of which are wholly-owned. All significant intercompany accounts and transactions have been eliminated. The preparation of financial statements in conformity with accounting principles generally accepted in the United States of America requires management to make estimates and assumptions, including those related to merchandise inventory and return costs, valuation of long-lived assets, income taxes, and accounting for gift card liability, that affect the reported amounts of assets and liabilities and disclosure of contingent assets and liabilities at the date of the financial statements, and the reported amounts of revenues and expenses during the reporting period. Actual results could differ from those estimates.
Items Affecting Comparability: The Company’s fiscal year is a 52 or 53-week period ending the Saturday nearest to January 31. Fiscal 2015, 2014, and 2013 ended January 30, 2016, January 31, 2015, and February 1, 2014, respectively. Fiscal 2015, fiscal 2014, and fiscal 2013 had 52 weeks.
Concentration of Business Risks: The Company purchases inventory from approximately 400 suppliers. In fiscal 2015, 52% of purchases were made from ten suppliers including Bio Domes Headgear, Funko, LLC, Buena Vista Home Video, Paramount Video, Sony Music Entertainment, Twentieth Century Fox Home Entertainment, Universal Music Group Distribution, Universal Studios Home Entertainment, Warner/Elektra/Atlantic Corp Group and Warner Home Video. The Company does not have material long-term purchase contracts; rather, it purchases products from its suppliers on an order-by-order basis. Historically, the Company has not experienced difficulty in obtaining satisfactory sources of supply and management believes that it will continue to have access to adequate sources of supply.
Cash and Cash Equivalents: The Company considers all highly liquid investments purchased with an original maturity of three months or less to be cash equivalents.
| F-9 |
Concentration of Credit Risks: The Company maintains centralized cash management and investment programs whereby excess cash balances are invested in short-term money market funds. The Company’s investments consist of short-term investment grade securities consistent with its investment guidelines. These guidelines include the provision that sufficient liquidity will be maintained to meet anticipated cash flow needs. The Company maintains these investments, all of which are classified as cash equivalents due to their short term nature, with Wells Fargo Securities, LLC. The Company limits the amount of credit exposure with any one financial institution and believes that no significant concentration of credit risk exists with respect to cash investments.
Accounts Receivable: Accounts Receivable are comprised of receivables and other individually insignificant amounts. There are no provisions for uncollectible amounts from retail sales of merchandise inventory since payment is received at the time of sale.
Merchandise Inventory and Return Costs: Merchandise inventory is stated at the lower of cost or market under the average cost method. Inventory valuation requires significant judgment and estimates, including obsolescence, shrink and any adjustments to market value, if market value is lower than cost. The Company records obsolescence and any adjustments to market value (if lower than cost) based on current and anticipated demand, customer preferences and market conditions. The provision for inventory shrink is estimated as a percentage of store sales for the period from the last date a physical inventory was performed to the end of the fiscal year. Such estimates are based on historical results and trends, and the shrink results from the last physical inventory. Physical inventories are taken at least annually for all stores and the distribution center throughout the year, and inventory records are adjusted accordingly.
The Company is generally entitled to return merchandise purchased from major music vendors for credit against other purchases from these vendors. Certain vendors reduce the credit with a merchandise return charge which varies depending on the type of merchandise being returned. Certain other vendors charge a handling fee based on units returned. The Company records all merchandise return charges in cost of sales.
Fixed Assets and Depreciation: Fixed assets are recorded at cost and depreciated or amortized over the estimated useful life of the asset using the straight-line method. The estimated useful lives are as follows:
| Leasehold improvements | Lesser of estimated useful life of the asset or the lease term |
| Fixtures and equipment | 3-7 years |
| Building | 27 years |
Major improvements and betterments to existing facilities and equipment are capitalized. Expenditures for maintenance and repairs are expensed as incurred.
Impairment of Long-Lived Assets: Long-lived assets are reviewed for impairment whenever events or changes in circumstances indicate that the carrying amount of an asset may not be recoverable. Recoverability of assets to be held and used is measured by a comparison of the carrying amount of an asset to undiscounted future net cash flows expected to be generated by the asset over its remaining useful life. If the carrying amount of an asset exceeds its estimated future cash flows, an impairment charge is recognized by the amount by which the carrying amount of the assets exceeds the fair value of the assets. Fair value is generally measured based on discounted estimated future cash flows. Assets to be disposed of would be separately presented in the Consolidated Balance Sheets and reported at the lower of the carrying amount or fair value less disposition costs. For the purpose of the asset impairment test, the Company has two asset groupings – corporate and store level assets.
The Company did not recognize an impairment expense during fiscal 2015, 2014 and 2013. Losses for store closings in the ordinary course of business represent the write down of the net book value of abandoned fixtures and leasehold improvements. The loss on disposal of fixed assets related to store closings was $0.6 million, $0.2 million and $0.2 million in fiscal 2015, 2014 and 2013, respectively, and is included in selling, general and administrative (“SG&A”)
| F-10 |
expenses in the Consolidated Statements of Income and loss on disposal of fixed assets in the Consolidated Statements of Cash Flows. Store closings usually occur at the expiration of the lease, at which time leasehold improvements, which constitute a majority of the abandoned assets, are fully depreciated.
Conditional Asset Retirement Obligations: The Company records the fair value of an asset retirement obligation (“ARO”) as a liability in the period in which it incurs a legal obligation associated with the retirement of tangible long-lived assets that result from the acquisition, construction, development, and/or normal use of the asset. The Company also records a corresponding asset that is depreciated over the life of the asset. Subsequent to its initial measurement, the ARO is adjusted at the end of each period to reflect the passage of time and changes in the estimated future cash flows underlying the obligation.
Commitments and Contingencies: The Company is subject to legal proceedings and claims that have arisen in the ordinary course of its business and have not been finally adjudicated. Although there can be no assurance as to the ultimate disposition of these matters, it is management’s opinion, based upon the information available at this time, that the expected outcome of these matters, individually or in the aggregate, will not have a material adverse effect on the results of operations and financial condition of the Company.
Revenue Recognition: The Company’s revenue is primarily from retail sales of merchandise inventory. Revenue is recognized at the point-of-sale. Internet sales are recognized as revenue upon shipment. Shipping and handling fee income from the Company’s Internet operations is recognized as net sales. Loyalty card revenue is amortized over the life of the membership period or upon cancelation of the membership. Net sales are recorded net of estimated amounts for sales returns and other allowances. The Company records shipping and handling costs in cost of sales. Net sales are recorded net of applicable sales taxes.
Cost of Sales: In addition to the cost of product, the Company includes in cost of sales those costs associated with purchasing, receiving, shipping, inspecting and warehousing product. Also included are costs associated with the return of product to vendors. Cost of sales further includes the cost of inventory shrink losses and obsolescence and the benefit of vendor allowances and discounts.
Selling, General and Administrative (“SG&A”) Expenses: Included in SG&A expenses are payroll and related costs, store operating costs, occupancy charges, professional and service fees, general operating and overhead expenses and depreciation charges (excluding those related to distribution operations, as discussed in Note 2 of Notes to the Consolidated Financial Statements in this Annual Report on Form 10-K). Selling, general and administrative expenses also include fixed asset write offs associated with store closures, if any, and miscellaneous income and expense items, other than interest. The Company recorded miscellaneous income items for fiscal 2015, 2014, and 2013 in the amount of $8.3 million, $6.1 million, and $6.1 million, respectively. Included in fiscal 2015 miscellaneous income items was a one-time reimbursement of expenses incurred in prior years, related to a legal settlement of $1.4 million.
Advertising Costs and Vendor Allowances: The Company often receives allowances from its vendors to fund in-store displays, print and radio advertising, and other promotional events. Vendor advertising allowances which exceed specific, incremental and identifiable costs incurred in relation to the advertising and promotions offered by the Company to its vendors are classified as a reduction in the purchase price of merchandise inventory. Accordingly, advertising and sales promotion costs are charged to operations, offset by direct vendor reimbursements, as incurred. Total advertising expense, excluding vendor allowances, was $2.9 million, $3.4 million, and $4.2 million in fiscal 2015, 2014, and 2013, respectively. In the aggregate, vendor allowances supporting the Company’s advertising and promotion included as a reduction of SG&A expenses, as reimbursements of such costs were $2.9 million, $3.4 million, and $4.2 million in fiscal 2015, 2014, and 2013, respectively.
| F-11 |
Lease Accounting: The Company’s calculation of straight-line rent expense includes the impact of escalating rents for the lease period and includes any period during which the Company is not obligated to pay rent while the store is being constructed (“rent holiday”). The Company accounts for step rent provisions, escalation clauses and other lease concessions by recognizing these amounts on a straight line basis over the initial lease term. The Company capitalizes leasehold improvements funded by tenant improvement allowances, depreciating them over the term of the related leases. The tenant improvement allowances are recorded as deferred rent within other long-term liabilities in the Consolidated Balance Sheet and are amortized as a reduction in rent expense over the life of the related leases.
Store Closing Costs: Management periodically considers the closing of underperforming stores. In the event of a store closing, reserves are established at the time a liability is incurred for the present value of any remaining lease obligations, net of estimated sublease income, and other exit costs. Store closings are not considered discontinued operations and as such, closings do not represent a significant change on the Company’s operations and financial results.
Income Taxes: Income taxes are accounted for under the asset and liability method. Deferred tax assets and liabilities are recognized for the future tax consequences attributable to differences between the financial statement carrying amounts of existing assets and liabilities and their respective tax bases and operating loss and tax credit carryforwards. Deferred tax assets and liabilities are measured using enacted tax rates expected to apply to taxable income in the years in which those temporary differences are expected to be recovered or settled. The effect on deferred tax assets and liabilities of a change in tax rates is recognized in income in the period that includes the enactment date. Deferred tax assets are subject to valuation allowances based upon management’s estimates of realizability.
The Company recognizes the effect of income tax positions only if those positions are more likely than not of being sustained. Recognized income tax positions are measured at the largest amount that is greater than 50% likely of being realized. Changes in recognition or measurement are reflected in the period in which the change in judgment occurs. It is the Company’s practice to recognize interest and penalties related to income tax matters in income tax expense (benefit) in the consolidated statements of income.
Stock-Based Compensation: Stock-based compensation represents the cost related to stock-based awards granted to employees and directors. The Company measures stock-based compensation cost at grant date, based on the estimated fair value of the award, and recognizes the cost as expense on a straight-line basis (net of estimated forfeitures) over the option’s requisite service period. The Company recognizes compensation expense based on estimated grant date fair value using the Black-Scholes option-pricing model. Tax benefits, if any, resulting from tax deductions in excess of the compensation cost recognized for those options are to be classified and reported as both an operating cash outflow and financing cash inflow.
Comprehensive Income (Loss): Comprehensive income (loss) consists of net income and pension income (loss) adjustment.
Income Per Share: Basic income per share is calculated by dividing net income by the weighted average common shares outstanding for the period. Diluted income per share is calculated by dividing net income by the sum of the weighted average shares outstanding and additional common shares that would have been outstanding if the dilutive potential common shares had been issued for the Company’s common stock awards from the Company’s stock award plans.
The following is a reconciliation of the basic weighted average number of shares outstanding to the diluted weighted average number of shares outstanding:
| F-12 |
| Fiscal Year | ||||||||||||
| 2015 | 2014 | 2013 | ||||||||||
| (in thousands) | ||||||||||||
| Weighted average common shares outstanding – basic | 31,167 | 31,744 | 32,584 | |||||||||
| Dilutive effect of outstanding stock awards | 156 | 153 | 278 | |||||||||
| Weighted average common shares outstanding – diluted | 31,323 | 31,897 | 32,862 | |||||||||
| Antidilutive stock awards | 1,744 | 2,062 | 2,450 | |||||||||
Fair Value of Financial Instruments: The carrying amounts reported in the Consolidated Balance Sheets for cash and cash equivalents, accounts receivable, accounts payable and other current liabilities approximate fair value because of the immediate or short-term maturity of these financial instruments. The carrying value of life insurance policies included in other assets approximates fair value based on estimates received from insurance companies.
Segment Information: The Company has one reportable segment.
Note 2. Fixed Assets
Fixed assets consist of the following:
| January 30, | January 31, | |||||||
| 2016 | 2015 | |||||||
| ($ in thousands) | ||||||||
| Buildings and improvements | $ | 11,838 | $ | 11,838 | ||||
| Fixtures and equipment | 113,660 | 117,523 | ||||||
| Leasehold improvements | 42,794 | 36,417 | ||||||
| Total fixed assets | 168,292 | 165,778 | ||||||
| Allowances for depreciation and amortization | (137,626 | ) | (150,009 | ) | ||||
| Fixed assets, net | $ | 30,666 | $ | 15,769 | ||||
Depreciation of fixed assets is included in the Consolidated Statements of Income as follows:
| Fiscal Year | ||||||||||||
| 2015 | 2014 | 2013 | ||||||||||
| ($ in thousands) | ||||||||||||
| Cost of sales | $ | 523 | $ | 483 | $ | 474 | ||||||
| Selling, general and administrative expenses | 4,668 | 3,905 | 3,830 | |||||||||
| Total | $ | 5,191 | $ | 4,388 | $ | 4,304 | ||||||
Depreciation expense related to the Company’s distribution center facility and related equipment is included in cost of sales. All other depreciation and amortization of fixed assets is included in SG&A expenses.
| F-13 |
Note 3. Debt
Credit Facility
The Company has entered into a $75 million credit facility (“Credit Facility”). The principal amount of all outstanding loans under the Credit Facility together with any accrued but unpaid interest, are due and payable in May 2017, unless otherwise paid earlier pursuant to the terms of the Credit Facility. Payments of amounts due under the Credit Facility are secured by the assets of the Company.
The Credit Facility includes customary provisions, including affirmative and negative covenants, which include representations, warranties and restrictions on additional indebtedness and acquisitions. The Credit Facility also includes customary events of default, including, among other things, material adverse effect, bankruptcy, and certain changes of control. The Credit Facility also contains other terms and conditions, including limitations on the payment of dividends and covenants around the number of store closings. The Company is compliant with all covenants.
Interest under the Credit Facility will accrue, at the election of the Company, at a Base Rate or LIBO Rate, plus, in each case, an Applicable Margin, which is determined by reference to the level of availability, with the Applicable Margin for LIBO Rate loans ranging from 2.25% to 2.75% and the Applicable Margin for Prime Rate loans ranging from 0.75% to 1.25%. In addition, a commitment fee ranging from 0.375% to 0.50% is also payable on unused commitments.
The availability under the Credit Facility is subject to limitations based on sufficient inventory levels.
During fiscal 2015 and fiscal 2014, the Company did not have any borrowings under the Credit Facility. As of January 30, 2016 and January 31, 2015, the Company had no outstanding letter of credit obligations. The Company had $39 million and $41 million available for borrowing as of January 30, 2016 and January 31, 2015, respectively.
Note 4. Income Taxes
Income tax expense consists of the following:
| Fiscal Year | ||||||||||||
| 2015 | 2014 | 2013 | ||||||||||
| ($ in thousands) | ||||||||||||
| Federal – current | $ | 0 | ($ | 46 | ) | ($ | 10 | ) | ||||
| State – current | 181 | 162 | 178 | |||||||||
| Deferred | — | — | — | |||||||||
| Income tax expense | $ | 181 | $ | 116 | $ | 168 | ||||||
A reconciliation of the Company’s effective income tax rate with the federal statutory rate is as follows:
| Fiscal Year | ||||||||||||
| 2015 | 2014 | 2013 | ||||||||||
| Federal statutory rate | 35.0 | % | 35.0 | % | 35.0 | % | ||||||
| State income taxes, net of federal tax effect | 4.1 | % | 5.6 | % | 1.4 | % | ||||||
| Change in valuation allowance | (39.0 | %) | (25.8 | %) | (30.9 | %) | ||||||
| Cash surrender value – insurance/ benefit programs | 5.3 | % | (7.6 | %) | (4.2 | %) | ||||||
| Other | .9 | % | (1.1 | %) | 0.7 | % | ||||||
| Effective income tax rate | 6.3 | % | 6.1 | % | 2.0 | % | ||||||
| F-14 |
The Other category is comprised of various items, including the impacts of non-deductible meals, dues, penalties, amortization and graduated tax brackets.
Significant components of the Company’s deferred tax assets are as follows:
| January 30, | January 31, | |||||||
| 2016 | 2015 | |||||||
| ($ in thousands) | ||||||||
| DEFERRED TAX ASSETS | ||||||||
| Accrued expenses | $ | 393 | $ | 675 | ||||
| Inventory | 311 | 287 | ||||||
| Retirement and compensation related accruals | 9,393 | 7,966 | ||||||
| Fixed assets | 5,830 | 8,352 | ||||||
| Federal and state net operating loss and credit carryforwards | 74,516 | 75,964 | ||||||
| Real estate leases, including deferred rent | 2,724 | 2,268 | ||||||
| Losses on investments | 1,226 | 1,228 | ||||||
| Goodwill | 0 | 223 | ||||||
| Other | 916 | 982 | ||||||
| Gross deferred tax assets before valuation allowance | 95,309 | 97,945 | ||||||
| Less: valuation allowance | (95,309 | ) | (97,945 | ) | ||||
| Total deferred tax assets | $ | — | $ | — | ||||
| DEFERRED TAX LIABILITIES | — | — | ||||||
| NET DEFERRED TAX ASSET | $ | — | $ | — | ||||
The Company has a net operating loss carryforward of $158.2 million for federal income tax purposes and approximately $236 million for state income tax purposes as of the end of Fiscal 2016 that expire at various times through 2035 and are subject to certain limitations and statutory expiration periods. The state net operating loss carryforwards are subject to various business apportionment factors and multiple jurisdictional requirements when utilized. The Company has federal tax credit carryforwards of $1.2 million, of which $0.5 million will expire in 2026, with the remainder available indefinitely. The Company has state tax credit carryforwards of $1.0 million, of which $0.2 million will expire in 2027.
In assessing the realizability of deferred tax assets, management considers whether it is more likely than not that some portion or all of the deferred tax assets will not be realized. The ultimate realization of deferred tax assets is dependent upon the generation of future taxable income. Management considers the scheduled reversal of taxable temporary differences, projected future taxable income and tax planning strategies in making this assessment. Based on the available objective evidence, management concluded that a full valuation allowance should be recorded against its deferred tax assets. As of January 30, 2016, the valuation allowance decreased to $95.3 million from $97.9 million at January 31, 2015. The reduction in the Company’s deferred tax assets was caused primarily by changes in certain deductible temporary differences to offset income before income taxes earned in Fiscal 2015. Management will continue to assess the valuation allowance against the gross deferred assets.
During Fiscal 2015, Fiscal 2014 and Fiscal 2013 the Company paid income taxes, net of refunds, of approximately $0, $0 and $0.1 million, respectively.
A reconciliation of the beginning and ending amounts of unrecognized tax benefits for the respective years is provided below. Amounts presented excluded interest and penalties, where applicable, on unrecognized tax benefits:
| F-15 |
| Fiscal | ||||||||||||
| 2015 | 2014 | 2013 | ||||||||||
| ($ in thousands) | ||||||||||||
| Unrecognized tax benefits at beginning of the year | $ | 1,930 | $ | 2,018 | $ | 2,078 | ||||||
| Increases in tax positions from prior years | — | — | — | |||||||||
| Decreases in tax positions from prior years | — | — | — | |||||||||
| Increases in tax positions for current year | — | — | — | |||||||||
| Settlements | — | — | — | |||||||||
| Lapse of applicable statute of limitations | 0 | (88 | ) | (60 | ) | |||||||
| Unrecognized tax benefits at end of the year | $ | 1,930 | $ | 1,930 | $ | 2,018 | ||||||
As of January 30, 2016, the Company had $1.9 million of gross unrecognized tax benefits, $1.5 million of which would affect the Company’s tax rate if recognized. While it is reasonably possible that the amount of unrecognized tax benefits will increase or decrease within the next twelve months, the Company does not expect the change to have a significant impact on its results of operations or financial position.
The Company is subject to U.S. federal income tax as well as income tax of multiple state jurisdictions. The Company has substantially concluded all federal income tax matters and all material state and local income tax matters through Fiscal 2011.
The Company’s practice is to recognize interest and penalties associated with its unrecognized tax benefits as a component of income tax expense in the Company’s Consolidated Statements of Income. During Fiscal 2016, the Company accrued a provision for interest of $(0.2) million. As of January 30, 2016, the liability for uncertain tax positions reflected in the Company’s Consolidated Balance Sheets was $2.8 million, including accrued interest and penalties of $1.9 million.
Note 5. Leases
At January 30, 2016, the Company leased 298 stores under operating leases, many of which contain renewal options, for periods ranging from one to ten years. Most leases also provide for payment of operating expenses and real estate taxes. Some also provide for contingent rent based on percentage of sales over a certain sales volume. In addition, as more fully discussed in Note 9 in the Notes to Consolidated Financial Statements, the Company leases its Albany, NY distribution center and administrative offices under an operating lease from its Chairman and largest shareholder.
Net rental expense was as follows:
| Fiscal Year | ||||||||||||
| 2015 | 2014 | 2013 | ||||||||||
| ($ in thousands) | ||||||||||||
| Minimum rentals | $ | 30,311 | $ | 32,732 | $ | 34,719 | ||||||
| Contingent rentals | 13 | 11 | 31 | |||||||||
| $ | 30,324 | $ | 32,743 | $ | 34,750 | |||||||
Future minimum rental payments required under all leases that have initial or remaining non-cancelable lease terms at January 30, 2016 are as follows:
| F-16 |
| Operating | |||||
| ($ in thousands) | Leases | ||||
| 2016 | 17,776 | ||||
| 2017 | 10,785 | ||||
| 2018 | 8,007 | ||||
| 2019 | 4,908 | ||||
| 2020 | 3,983 | ||||
| Thereafter | 5,318 | ||||
| Total minimum payments required | $ | 50,777 | |||
In addition to the obligations in the table above, a number of the Company’s stores have leases which have rent payments based on the store’s sales volume in lieu of fixed minimum rent payments. During fiscal 2015, minimum rent payments based on a store’s sales volume were $0.9 million.
Note 6. Benefit Plans
401(k) Savings Plan
The Company offers a 401(k) Savings Plan to eligible employees meeting certain age and service requirements. This plan permits participants to contribute up to 80% of their salary, including bonuses, up to the maximum allowable by IRS regulations. Participants are immediately vested in their voluntary contributions plus actual earnings thereon. Participant vesting of the Company’s matching and profit sharing contribution is based on the years of service completed by the participant. Participants are fully vested upon the completion of four years of service. All participant forfeitures of non-vested benefits are used to reduce the Company’s contributions or fees in future years. Total expense related to the Company’s matching contribution was approximately $424,000, $437,000 and $331,000 in fiscal 2015, 2014 and 2013, respectively.
Stock Award Plans
The Company has outstanding awards under two employee stock award plans, the 2005 Long Term Incentive and Share Award Plan (the “Old Plan”); and the Amended and Restated 2005 Long Term Incentive and Share Award Plan (the “New Plan”). Additionally, the Company had a stock award plan for non-employee directors (the “1990 Plan”). The Company no longer issues stock options under the Old Plan.
Equity awards authorized for issuance under the New Plan total 3.0 million. As of January 30, 2016, of the awards authorized for issuance under the Old Plan, New Plan and 1990 Plan, 2.3 million were granted and are outstanding, 1.3 million of which were vested and exercisable. Shares available for future grants of options and other share based awards under the New Plan at January 30, 2016 and January 31, 2015 were 2.1 million and 2.5 million, respectively.
Total stock-based compensation expense recognized in the Consolidated Statements of Income for fiscal 2015, fiscal 2014 and fiscal 2013 was $0.4 million, $0.5 million and $0.3 million. During the fiscal 2015, fiscal 2014 and fiscal 2013 the related total deferred tax benefit was $0. As of January 30, 2016, there was $0.7 million of unrecognized compensation cost related to stock option awards that is expected to be recognized as expense over a weighted average period of 1.6 years.
| F-17 |
The fair values of the options granted have been estimated at the date of grant using the Black - Scholes option pricing model with the following assumptions:
| Stock Option Plan | ||||||
| 2015 | 2014 | 2013 | ||||
| Dividend yield | 0% | 0% | 0% | |||
| Expected stock price volatility | 39.7-50.2% | 47.0-66.8% | 67.6%-75.2% | |||
| Risk-free interest rate | 1.32%-1.94% | 1.45%-2.18% | 0.85%-2.1% | |||
| Expected award life ( in years) | 4.92-5.71 | 4.92-5.71 | 4.92-6.98 | |||
| Weighted average fair value per share of awards granted during the year | $1.49 | $1.65 | $2.99 | |||
The following table summarizes information about stock option awards outstanding under the Old Plan, New Plan and 1990 Plan as of January 30, 2016:
| Outstanding | Exercisable | |||||||||||||||||||||||||||
| Weighted | Weighted | |||||||||||||||||||||||||||
| Average | Average | Aggregate | Average | Aggregate | ||||||||||||||||||||||||
| Exercise | Remaining | Exercise | Intrinsic | Exercise | Intrinsic | |||||||||||||||||||||||
| Price Range | Shares | Life | Price | Value | Shares | Price | Value | |||||||||||||||||||||
| $0.00-$2.66 | 372,000 | 4.9 | $ | 2.12 | $ | 431,400 | 320,000 | $ | 2.10 | $ | 378,060 | |||||||||||||||||
| 2.67-5.33 | 1,572,525 | 5.4 | 4.33 | — | 828,775 | 4.80 | — | |||||||||||||||||||||
| 5.33-8.00 | 167,300 | 1.2 | 5.51 | — | 167,300 | 5.51 | — | |||||||||||||||||||||
| Total | 2,111,825 | 5.0 | $ | 4.04 | $ | 431,400 | 1,316,075 | $ | 4.23 | $ | 378,060 | |||||||||||||||||
The aggregate intrinsic value in the preceding table represents the total pretax intrinsic value based on the Company’s closing stock price of $3.28 as of January 30, 2016, which would have been received by the award holders had all award holders under the Old Plan, New Plan and 1990 Plan exercised their awards as of that date.
| F-18 |
The following table summarizes stock option activity under the Stock Award Plans:
| Employee and Director Stock Award Plans | ||||||||||||||||||||
| Number of Shares Subject To Option | Stock Award Exercise Price Range Per Share | Weighted Average Exercise Price | Other Share Awards (1) | Weighted Average Grant Date Value | ||||||||||||||||
| Balance February 2, 2013 | 4,663,909 | $0.98-$14.32 | $ | 6.45 | 93,037 | $ | 6.04 | |||||||||||||
| Granted | 285,000 | 3.48-4.87 | 4.74 | 11,620 | 4.30 | |||||||||||||||
| Exercised | (1,477,450 | ) | 0.98-3.50 | 3.29 | (93,716 | ) | 5.42 | |||||||||||||
| Forfeited | (305,000 | ) | 1.67-4.87 | 3.08 | — | 0.00 | ||||||||||||||
| Canceled | (259,269 | ) | 3.50-14.32 | 8.45 | — | 0.00 | ||||||||||||||
| Balance February 1, 2014 | 2,907,190 | $1.73-$14.32 | $ | 8.07 | 10,941 | $ | 9.50 | |||||||||||||
| Granted | 492,500 | 3.36-3.50 | 3.44 | 226,459 | 3.47 | |||||||||||||||
| Exercised | (39,000 | ) | 1.73 | 1.73 | — | 0.00 | ||||||||||||||
| Forfeited | (136,250 | ) | 1.73-4.87 | 3.64 | — | 0.00 | ||||||||||||||
| Canceled | (752,590 | ) | 1.73-14.32 | 10.31 | — | 0.00 | ||||||||||||||
| Balance January 31, 2015 | 2,471,850 | $1.73-$14.32 | $ | 6.81 | 237,400 | $ | 3.75 | |||||||||||||
| Granted | 380,000 | 3.40-3.88 | 3.72 | 23,774 | 3.59 | |||||||||||||||
| Exercised | (8,000 | ) | 1.73-2.53 | 2.33 | (50,000 | ) | 0.00 | |||||||||||||
| Forfeited | (18,500 | ) | 1.73-4.87 | 3.62 | — | 0.00 | ||||||||||||||
| Canceled | (713,525 | ) | 1.73-14.32 | 13.28 | — | 0.10 | ||||||||||||||
| Balance January 30, 2016 | 2,111,825 | $1.73-$6.41 | $ | 4.04 | 211,174 | $ | 3.79 | |||||||||||||
| (1) | Other Share Awards include deferred shares granted to executives and Directors. |
During fiscal 2015, 2014 and 2013, the Company recognized expenses of approximately $50,000, $80,000, and $50,000, respectively, for deferred shares issued to non-employee directors.
| ($ in thousands) | Stock Option Exercises | |||||||||||
| 2015 | 2014 | 2013 | ||||||||||
| Cash received for exercise price | $ | 19 | $ | 67 | $ | 4,869 | ||||||
| Intrinsic value | 12 | 86 | 701 | |||||||||
Defined Benefit Plans
The Company maintains a non-qualified Supplemental Executive Retirement Plan (“SERP”) for certain Executive Officers of the Company. The SERP, which is unfunded, provides eligible executives defined pension benefits that supplement benefits under other retirement arrangements. The annual benefit amount is based on salary and bonus at the time of retirement and number of years of service.
Prior to June 1, 2003, the Company had provided the Board of Directors with a noncontributory, unfunded retirement plan (“Director Retirement Plan”) that paid retired directors an annual retirement benefit.
For fiscal 2015, fiscal 2014 and fiscal 2013, net periodic benefit cost recognized under both plans totaled approximately $1.0 million, $1.3 million, and $1.5 million, respectively. The accrued pension liability for both plans was approximately $19.0 million and $19.5 million at January 30, 2016 and January 31, 2015, respectively, and is
| F-19 |
recorded within other long term liabilities. The accumulated benefit obligation for both plans was approximately $19.0 million and $19.5 million as of January 30, 2016 and January 31, 2015, respectively.
The following is a summary of the Company’s defined benefit pension plans as of the most recent actuarial calculations:
Obligation and Funded Status:
($ in thousands)
| January 30, 2016 | January 31, 2015 | |||||||
| Change in Projected Benefit Obligation: | ||||||||
| Benefit obligation at beginning of year | $ | 19,550 | $ | 16,287 | ||||
| Service cost | 66 | 90 | ||||||
| Interest cost | 583 | 638 | ||||||
| Actuarial loss (gain) | (1,061 | ) | 199 | |||||
| Benefits paid | (112 | ) | (121 | ) | ||||
| Projected Benefit obligation at end of year | $ | 19,026 | 19,550 | |||||
| Fair value of plan assets at end of year | $ | — | $ | — | ||||
| Funded status | ($ | 19,026 | ) | ($ | 19,550 | ) | ||
| Unrecognized prior service cost | 237 | 580 | ||||||
| Unrecognized net actuarial (gain) loss | (525 | ) | 502 | |||||
| Accrued benefit cost | ($ | 19,314 | ) | ($ | 18,468 | ) | ||
Amounts recognized in the Consolidated Balance Sheets consist of:
($ in thousands)
| January 30, | January 31, | |||||||
| 2016 | 2015 | |||||||
| Current liability | ($ | 1,147 | ) | ($ | 207 | ) | ||
| Long term liability | (17,879 | ) | (19,343 | ) | ||||
| Add: Accumulated other comprehensive loss (income) | (288 | ) | 1,082 | |||||
| Net amount recognized | ($ | 19,314 | ) | ($ | 18,468 | ) | ||
Components of Net Periodic Benefit Cost and Other Amounts Recognized in Other Comprehensive (Income) Loss:
($ in thousands)
| Fiscal Year | ||||||||||||
| 2015 | 2014 | 2013 | ||||||||||
| Net Periodic Benefit Cost: | ||||||||||||
| Service cost | $ | 66 | $ | 55 | $ | 110 | ||||||
| Interest cost | 583 | 689 | 656 | |||||||||
| Amortization of prior service cost | 342 | 721 | 342 | |||||||||
| Amortization of net gain | (34 | ) | (143 | ) | (448 | ) | ||||||
| Net periodic benefit cost | $ | 957 | $ | 1,322 | $ | 1,485 | ||||||
| F-20 |
Other Changes in Benefit Obligations Recognized in Other Comprehensive (Income) Loss:
| 2015 | 2014 | |||||||
| Net prior service cost recognized as a component of net periodic benefit cost | $ | (342 | ) | $ | (721 | ) | ||
| Net actuarial gain recognized as a component of net periodic benefit cost | 34 | 143 | ||||||
| Net actuarial losses / (gains) arising during the period | (1,061 | ) | 2,640 | |||||
| (1,369 | ) | 2,062 | ||||||
| Income tax effect | — | — | ||||||
| Total recognized in other comprehensive (income) loss | ($ | 1,369 | ) | $ | 2,062 | |||
| Total recognized in net periodic benefit cost and other comprehensive loss (income) | ($ | 412 | ) | $ | 3,384 | |||
The pre-tax components of accumulated other comprehensive loss, which have not yet been recognized as components of net periodic benefit cost as of January 30, 2016, January 31, 2015, and February 1, 2014 and the tax effect are summarized below.
| January 30, | January 31, | February 1, | ||||||||||
| ($ in thousands) | 2016 | 2015 | 2014 | |||||||||
| Net unrecognized actuarial loss (gain) | ($ | 525 | ) | $ | 502 | ($ | 2,280 | ) | ||||
| Net unrecognized prior service cost | 237 | 580 | 1,300 | |||||||||
| Accumulated other comprehensive (income) loss | ($ | 288 | ) | 1,082 | (980 | ) | ||||||
| Tax expense | 1,100 | 1,099 | 1,099 | |||||||||
| Accumulated other comprehensive loss | $ | 812 | $ | 2,181 | $ | 119 | ||||||
In fiscal 2015, approximately $220,000 of net unrecognized prior service cost and approximately $14,000 of the net unrecognized actuarial gain, recorded as components of accumulated other comprehensive loss at January 30, 2016, will be recognized as components of net periodic benefit cost.
Assumptions:
| Fiscal Year | ||||||||||||
| 2015 | 2014 | |||||||||||
| Weighted-average assumptions used to determine benefit obligation: | ||||||||||||
| Discount rate | 3.63% | 3.00% | ||||||||||
| Salary increase rate | 3.00% | 3.00% | ||||||||||
| Measurement date | Jan 30, 2016 | Jan 31, 2015 | ||||||||||
| Fiscal Year | ||||||||||||
| 2015 | 2014 | 2013 | ||||||||||
| Weighted-average assumptions used to determine net periodic benefit cost: | ||||||||||||
| Discount rate | 3.00% | 4.25% | 3.75% | |||||||||
| Salary increase rate | 3.00% | 4.00% | 4.00% | |||||||||
The discount rate is based on the rates implicit in high-quality fixed-income investments currently available as of the measurement date. The Citigroup Pension Discount Curve (CPDC) rates are intended to represent the spot rates implied by the high quality corporate bond market in the U.S. The projected benefit payments attributed to the projected benefit obligation have been discounted using the CPDC mid-year rates and the discount rate is the single constant rate that produces the same total present value.
| F-21 |
The following benefit payments, which reflect expected future service, as appropriate, are expected to be paid:
| Year | Pension Benefits | ||||
| ($ in thousands) | |||||
| 2016 | 1,147 | ||||
| 2017 | 1,079 | ||||
| 2018 | 1,201 | ||||
| 2019 | 1,201 | ||||
| 2020 | 1,201 | ||||
| 2021 – 2024 | 6,065 | ||||
Accumulated Other Comprehensive Income (Loss)
| ($ in thousands) | Pension and Other Benefit | |||
| January 31, 2015 | ($ | 2,181 | ) | |
| Other comprehensive income before reclassifications | 1,369 | |||
| January 30, 2016 | ($ | 812 | ) | |
Note 7. Shareholders’ Equity
During fiscal 2015, the Company repurchased 298,225 shares of common stock for an aggregate purchase price of $1.1 million. Since the inception of the program, the Company has repurchased 1,872,043 shares of common stock at an average price of $3.82 per share. As of January 30, 2016, the Company has approximately $14.8 million available for purchase under their repurchase program.
The Company classified the repurchased shares as treasury stock on the Company’s consolidated balance sheet.
No cash dividends were paid in fiscal 2015 or 2013. In the first quarter of fiscal 2014, the Company declared and paid a special cash dividend of $0.50 per common share. The Company’s Credit Facility contains certain restrictions related to the payment of cash dividends, including limiting the amount of dividends to $5.0 million annually. On March 5, 2014, Wells Fargo Bank, National Association (the “Administrative Agent”) and certain other parties to the amended credit facility agreed to consent to the special cash dividend.
Note 8. Related Party Transactions
The Company leases its 181,300 square foot distribution center/office facility in Albany, New York from Robert J. Higgins, its Chairman and largest shareholder. The original distribution center/office facility was occupied in 1985.
On December 4, 2015, the Company amended and restated the lease. The lease commenced January 1, 2016 and expires December 31, 2020.
Under the three original capital leases, dated April 1, 1985, November 1, 1989 and September 1, 1998, the Company paid Mr. Higgins an annual rent of $2.1 million, $2.3 million and $2.3 million in fiscal 2015, fiscal 2014 and fiscal 2013, respectively. Under the new lease dated December 4, 2015, and accounted for as an operating lease, the Company paid Mr. Higgins $103 thousand in fiscal 2015. Under the terms of the lease agreements, the Company is responsible for property taxes and other operating costs with respect to the premises.
| F-22 |
The Company leased one of its retail stores from Mr. Higgins as an operating lease. The lease expired and was not renewed as of January 31, 2015. The Company did not have any obligation under the lease in fiscal 2015.
Annual rental payments under this lease were $40,000, and $40,000 in fiscal 2014 and 2013. Under the terms of the lease, the Company paid property taxes, maintenance and a contingent rent if a specified sales level was achieved. No contingent rent was paid in fiscal 2014 and fiscal 2013. Total additional charges for the store were approximately $2,400 and $3,800 in fiscal 2014 and fiscal 2013 respectively.
Note 9. Quarterly Financial Information (Unaudited)
| Fiscal 2015 Quarter Ended | ||||||||||||||||||||
| Fiscal 2015 | January 30, 2016 | October 31, 2015 | August 1, 2015 | May 2, 2015 | ||||||||||||||||
| ($ in thousands, except for per share amounts) | ||||||||||||||||||||
| Net sales | $ | 334,661 | $ | 121,321 | $ | 67,925 | $ | 67,451 | $ | 77,963 | ||||||||||
| Gross profit | 130,572 | 45,931 | 26,680 | 27,158 | 30,803 | |||||||||||||||
| Net income (loss) | $ | 2,689 | $ | 9,868 | $ | (4,328 | ) | ($ | 3,045 | ) | $ | 194 | ||||||||
| Basic income (loss) per share | $ | 0.09 | $ | 0.32 | ($ | 0.14 | ) | ($ | 0.10 | ) | $ | 0.01 | ||||||||
| Diluted income (loss) per share | $ | 0.09 | $ | 0.32 | ($ | 0.14 | ) | ($ | 0.10 | ) | $ | 0.01 | ||||||||
| Fiscal 2014 Quarter Ended | ||||||||||||||||||||
| Fiscal 2014 | January 31, 2015 | November 1, 2014 | August 2, 2014 | May 3, 2014 | ||||||||||||||||
| ($ in thousands, except for per share amounts) | ||||||||||||||||||||
| Net sales | $ | 358,490 | $ | 126,910 | $ | 72,456 | $ | 71,908 | $ | 87,216 | ||||||||||
| Gross profit | 135,918 | 46,560 | 28,534 | 28,047 | 32,777 | |||||||||||||||
| Net income (loss) | $ | 1,778 | $ | 11,737 | ($ | 4,476 | ) | ($ | 5,097 | ) | ($ | 386 | ) | |||||||
| Basic income (loss) per share | $ | 0.06 | $ | 0.37 | ($ | 0.14 | ) | ($ | 0.16 | ) | ($ | 0.01 | ) | |||||||
| Diluted income (loss) per share | $ | 0.06 | $ | 0.37 | ($ | 0.14 | ) | ($ | 0.16 | ) | ($ | 0.01 | ) | |||||||
| F-23 |
Index to Exhibits
Document Number and Description
Exhibit No.
| 3.1 | Restated Certificate of Incorporation -- incorporated herein by reference to Exhibit 3.1 to the Company’s Annual Report on Form 10-K for the year ended January 29, 1994. Commission File No. 0-14818. |
| 3.2 | Certificate of Amendment to the Certificate of Incorporation -- incorporated herein by reference to Exhibit 3.1 to the Company’s Quarterly Report on Form 10-Q for the fiscal quarter ended October 29, 1994. Commission File No. 0-14818. |
| 3.3 | Certificate of Amendment to the Certificate of Incorporation -- incorporated herein by reference to Exhibit 3.4 to the Company’s Annual Report on Form 10-K for the year ended January 31, 1998. Commission File No. 0-14818. |
| 3.4 | Amended By-Laws -- incorporated herein by reference to Exhibit 3.4 to the Company’s Annual Report on Form 10-K for the year ended January 29, 2000. Commission File No. 0-14818. |
| 3.5 | Form of Certificate of Amendment to the Certificate of Incorporation—incorporated herein by reference to Exhibit 3.5 to the Company’s Registration Statement on Form S-4, No. 333-75231. |
| 3.6 | Form of Certificate of Amendment to the Certificate of Incorporation—incorporated herein by reference to Exhibit 3.6 to the Company’s Registration Statement on Form S-4, No. 333-75231. |
| 3.7 | Certificate of Amendment to the Certificate of Incorporation—incorporated herein by reference to Exhibit 4.2 to the Company’s Current Report on Form 8-K filed August 15, 2000. Commission File No. 0-14818. |
| 3.8 | Certificate of Amendment to the Certificate of Incorporation - incorporated herein by reference to Exhibit 2 to the Company’s Current Report on Form 8-A filed August 15, 2000. Commission File No. 0-14818. |
| 4.4 | Amended and Restated Credit Agreement between Trans World Entertainment Corporation and Bank of America N.A. – incorporated by reference to Exhibit 4.1 to the Company’s Current Report on Form 8-K filed April 15, 2010. Commission File No. 0-14818. |
| 4.5 | First Amendment to Credit Agreement between Trans World Entertainment Corporation and Wells Fargo; National Association dated May 4, 2012– incorporated by reference to Exhibit 4.1 to the Company’s Current Report on Form 8-K filed May 7, 2012. Commission File No. 0-14818. |
| 4.6 | Consent dated November 27, 2012, pursuant to Amended and Restated Credit Agreement, dated as of April 15, 2010 by and between Trans World Entertainment Corporation and Wells Fargo Bank, National Association - incorporated by reference to Exhibit 10.1 to the Company’s Current Report on Form 8-K filed November 27, 2012. Commission File No. 0-14818. |
| 4.7 | Consent dated March 5, 2014, pursuant to Amended and Restated Credit Agreement, dated as of April 15, 2010 by and between Trans World Entertainment Corporation and Wells Fargo Bank, National Association - incorporated by reference to Exhibit 10.1 to the Company’s Current Report on Form 8-K filed March 7, 2014. Commission File No. 0-14818. |
| 10.1 | Amended and Restated Lease, dated December 4, 2015, between Robert J. Higgins, as Landlord, and Record Town, Inc. and Trans World Entertainment Corporation, as Tenant -- incorporated herein by reference to |
| Exhibit 10.3 Company’s Quarterly Report on Form 10-Q for the fiscal quarter ended October 31, 1998. Commission File No. 0-14818. |
| 10.5 | Trans World Music Corporation 1990 Stock Option Plan for Non-Employee Directors, as amended and restated -- incorporated herein by reference to Annex A to Trans World’s Definitive Proxy Statement on Form 14A filed as of May 19, 2000. Commission File No. 0-14818. |
| 10.6 | Form of Indemnification Agreement dated May 1, 1995 between the Company and its officers and directors incorporated herein by reference to Exhibit 10.2 to the Company’s Quarterly Report on Form 10-Q for the fiscal quarter ended April 29, 1995. Commission File No. 0-14818. |
| 10.7 | Trans World Entertainment Corporation Supplemental Executive Retirement Plan, as amended -- incorporated herein by reference to Exhibit 10.1 to the Company’s Form 8-K filed on July 16, 2012. Commission File No. 0-14818. |
| 10.8 | Trans World Entertainment Corporation 2005 Long Term Incentive and Share Award Plan incorporated herein by reference to Appendix A to Trans World Entertainment Corporation’s Definitive Proxy Statement on Form 14A filed as of May 11, 2005. Commission File No. 0-14818. |
| 10.9 | Trans World Entertainment Corporation Bonus Plan -- incorporated herein by reference to Appendix A to Trans World Entertainment Corporation’s Definitive Proxy Statement on Form 14A filed as of May 30, 2014. Commission File No. 0-14818. |
| 10.10 | Trans World Entertainment Corporation Amended and Restated 2005 Long Term Incentive and Share Award Plan incorporated herein by reference to Appendix A to Trans World Entertainment Corporation’s Definitive Proxy Statement on Form 14A filed as of May 30, 2014. Commission File No. 0-14818. |
| 10.11 | Employment Agreement, dated as of August 27, 2014 between the Company and Michael Feurer, Incorporated herein by reference to Exhibit 10.1 to the Company’s Form 8-K filed on September 3, 2014. Commission File No. 0-14818 |
| * 21 | Significant Subsidiaries of the Registrant. |
| * 23 | Consent of KPMG LLP. |
| *31.1 | Certification of Chief Executive Officer dated April 14, 2016, relating to the Registrant’s Annual Report on Form 10-K for the year ended January 30, 2016, pursuant to Rule 13a-14(a) or Rule 15a-14(a). |
| *31.2 | Certification of Chief Financial Officer dated April 14, 2016, relating to the Registrant’s Annual Report on Form 10-K for the year ended January 30, 2016, pursuant to Rule 13a-14(a) or Rule 15a-14(a). |
| *32 | Certification of Chief Executive Officer and Chief Financial Officer of Registrant, dated April 14, 2016, pursuant to 18 U.S.C. Section 1350, as adopted Pursuant to Section 906 of the Sarbanes-Oxley Act of 2002 relating to the Registrant’s Annual Report on Form 10-K for the year ended January 30, 2016. |
| *101.INS | XBRL Instance Document |
| *101.SCH | XBRL Taxonomy Extension Schema |
| *101.CAL | XBRL Taxonomy Extension Calculation Linkbase |
| *101.DEF | XBRL Taxonomy Extension Definition Linkbase |
| *101.LAB | XBRL Taxonomy Extension Label Linkbase |
| *101.PRE | XBRL Taxonomy Extension Presentation Linkbase |
* Filed herewith